Goodlow, TX
Goodlow Map
Goodlow Overview
244
TOTAL POPULATION
123
MALE POPULATION
121
FEMALE POPULATION
101.65
MALES / 100 FEMALES
98.37
FEMALES / 100 MALES
53.2
MEDIAN AGE
3.4
AVG FAMILY SIZE
3.0
AVG HOUSEHOLD SIZE
$22,007
PER CAPITA INCOME
$69,028
AVG FAMILY INCOME
$64,688
AVG HOUSEHOLD INCOME
64.0%
WAGE / INCOME GAP [ % ]
36.0¢/ $1
WAGE / INCOME GAP [ $ ]
$8,483
FAMILY INCOME DEFICIT
0.40
INEQUALITY / GINI INDEX
80
LABOR FORCE [ PEOPLE ]
43.0%
PERCENT IN LABOR FORCE
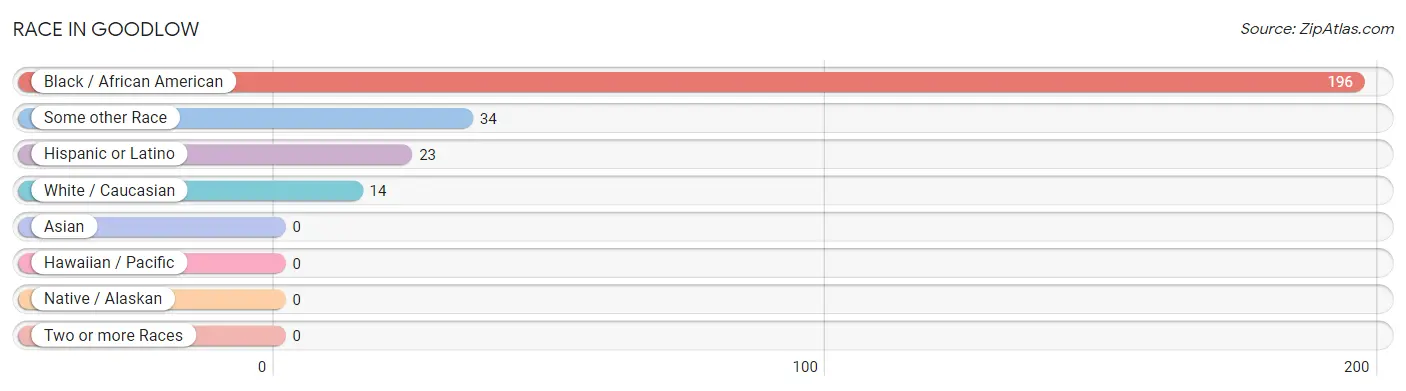
Race in Goodlow
The most populous races in Goodlow are Black / African American (196 | 80.3%), Some other Race (34 | 13.9%), and Hispanic or Latino (23 | 9.4%).
| Race | # Population | % Population |
| Asian | 0 | 0.0% |
| Black / African American | 196 | 80.3% |
| Hawaiian / Pacific | 0 | 0.0% |
| Hispanic or Latino | 23 | 9.4% |
| Native / Alaskan | 0 | 0.0% |
| White / Caucasian | 14 | 5.7% |
| Two or more Races | 0 | 0.0% |
| Some other Race | 34 | 13.9% |
| Total | 244 | 100.0% |
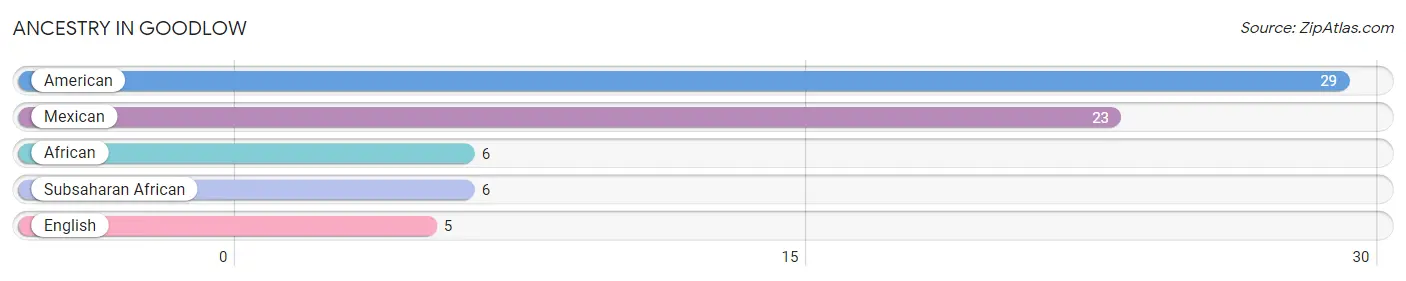
Ancestry in Goodlow
The most populous ancestries reported in Goodlow are American (29 | 11.9%), Mexican (23 | 9.4%), African (6 | 2.5%), Subsaharan African (6 | 2.5%), and English (5 | 2.1%), together accounting for 28.3% of all Goodlow residents.
| Ancestry | # Population | % Population |
| African | 6 | 2.5% |
| American | 29 | 11.9% |
| English | 5 | 2.1% |
| Mexican | 23 | 9.4% |
| Subsaharan African | 6 | 2.5% | View All 5 Rows |
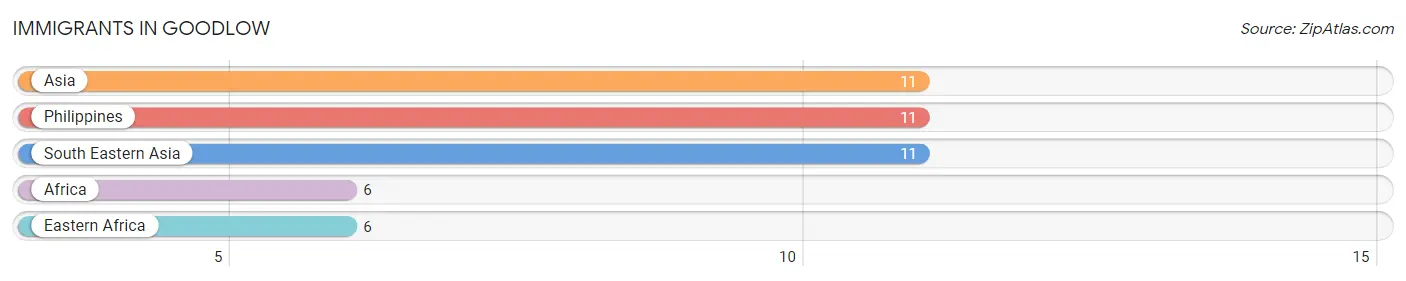
Immigrants in Goodlow
The most numerous immigrant groups reported in Goodlow came from Asia (11 | 4.5%), Philippines (11 | 4.5%), South Eastern Asia (11 | 4.5%), Africa (6 | 2.5%), and Eastern Africa (6 | 2.5%), together accounting for 18.5% of all Goodlow residents.
| Immigration Origin | # Population | % Population |
| Africa | 6 | 2.5% |
| Asia | 11 | 4.5% |
| Eastern Africa | 6 | 2.5% |
| Philippines | 11 | 4.5% |
| South Eastern Asia | 11 | 4.5% | View All 5 Rows |
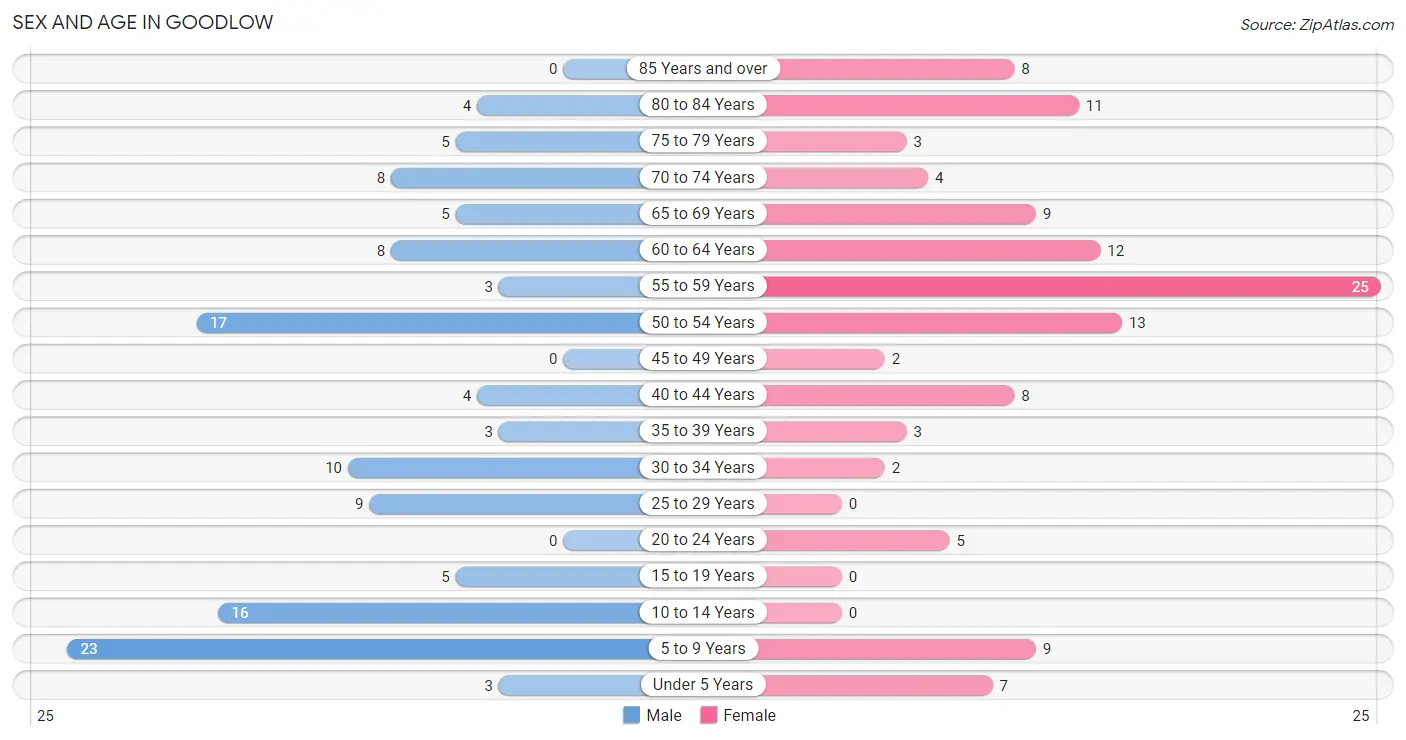
Sex and Age in Goodlow
Sex and Age in Goodlow
The most populous age groups in Goodlow are 5 to 9 Years (23 | 18.7%) for men and 55 to 59 Years (25 | 20.7%) for women.
| Age Bracket | Male | Female |
| Under 5 Years | 3 (2.4%) | 7 (5.8%) |
| 5 to 9 Years | 23 (18.7%) | 9 (7.4%) |
| 10 to 14 Years | 16 (13.0%) | 0 (0.0%) |
| 15 to 19 Years | 5 (4.1%) | 0 (0.0%) |
| 20 to 24 Years | 0 (0.0%) | 5 (4.1%) |
| 25 to 29 Years | 9 (7.3%) | 0 (0.0%) |
| 30 to 34 Years | 10 (8.1%) | 2 (1.7%) |
| 35 to 39 Years | 3 (2.4%) | 3 (2.5%) |
| 40 to 44 Years | 4 (3.3%) | 8 (6.6%) |
| 45 to 49 Years | 0 (0.0%) | 2 (1.7%) |
| 50 to 54 Years | 17 (13.8%) | 13 (10.7%) |
| 55 to 59 Years | 3 (2.4%) | 25 (20.7%) |
| 60 to 64 Years | 8 (6.5%) | 12 (9.9%) |
| 65 to 69 Years | 5 (4.1%) | 9 (7.4%) |
| 70 to 74 Years | 8 (6.5%) | 4 (3.3%) |
| 75 to 79 Years | 5 (4.1%) | 3 (2.5%) |
| 80 to 84 Years | 4 (3.3%) | 11 (9.1%) |
| 85 Years and over | 0 (0.0%) | 8 (6.6%) |
| Total | 123 (100.0%) | 121 (100.0%) |
Families and Households in Goodlow
Median Family Size in Goodlow
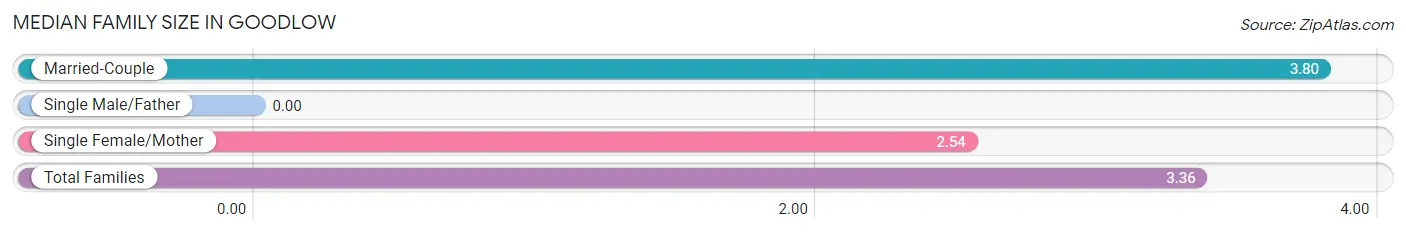
| Family Type | # Families | Family Size |
| Married-Couple | 45 (65.2%) | 3.80 |
| Single Male/Father | 0 (0.0%) | - |
| Single Female/Mother | 24 (34.8%) | 2.54 |
| Total Families | 69 (100.0%) | 3.36 |
Median Household Size in Goodlow
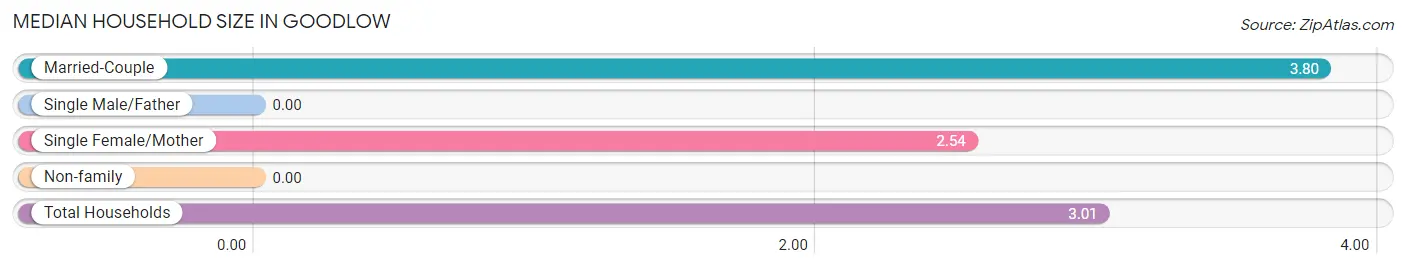
| Household Type | # Households | Household Size |
| Married-Couple | 45 (55.6%) | 3.80 |
| Single Male/Father | 0 (0.0%) | - |
| Single Female/Mother | 24 (29.6%) | 2.54 |
| Non-family | 12 (14.8%) | - |
| Total Households | 81 (100.0%) | 3.01 |
Household Size by Marriage Status in Goodlow
Out of a total of 81 households in Goodlow, 69 (85.2%) are family households, while 12 (14.8%) are nonfamily households. The most numerous type of family households are 2-person households, comprising 37, and the most common type of nonfamily households are 1-person households, comprising 12.
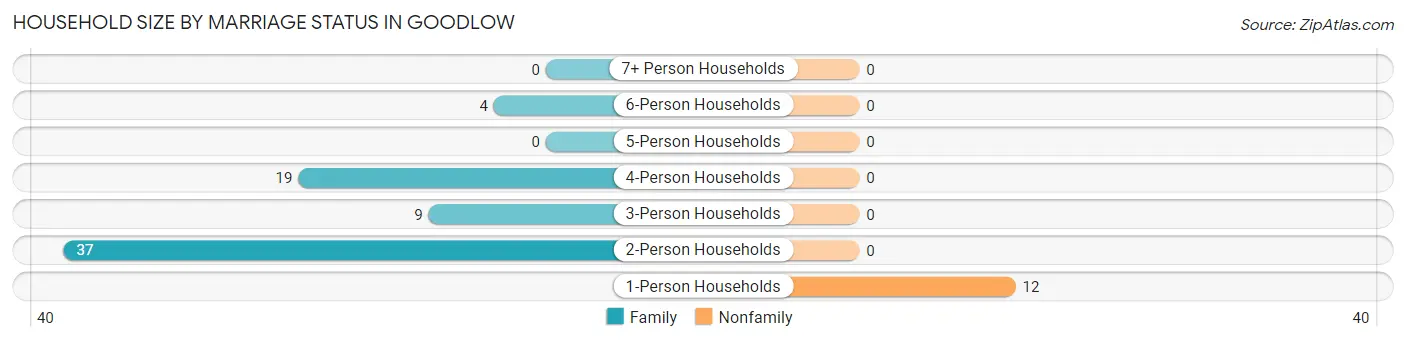
| Household Size | Family Households | Nonfamily Households |
| 1-Person Households | - | 12 (14.8%) |
| 2-Person Households | 37 (45.7%) | 0 (0.0%) |
| 3-Person Households | 9 (11.1%) | 0 (0.0%) |
| 4-Person Households | 19 (23.5%) | 0 (0.0%) |
| 5-Person Households | 0 (0.0%) | 0 (0.0%) |
| 6-Person Households | 4 (4.9%) | 0 (0.0%) |
| 7+ Person Households | 0 (0.0%) | 0 (0.0%) |
| Total | 69 (85.2%) | 12 (14.8%) |
Female Fertility in Goodlow
Fertility by Age in Goodlow
Average fertility rate in Goodlow is 161.0 births per 1,000 women. Women in the age bracket of 20 to 34 years have the highest fertility rate with 714.0 births per 1,000 women. Women in the age bracket of 20 to 34 years acount for 100.0% of all women with births.
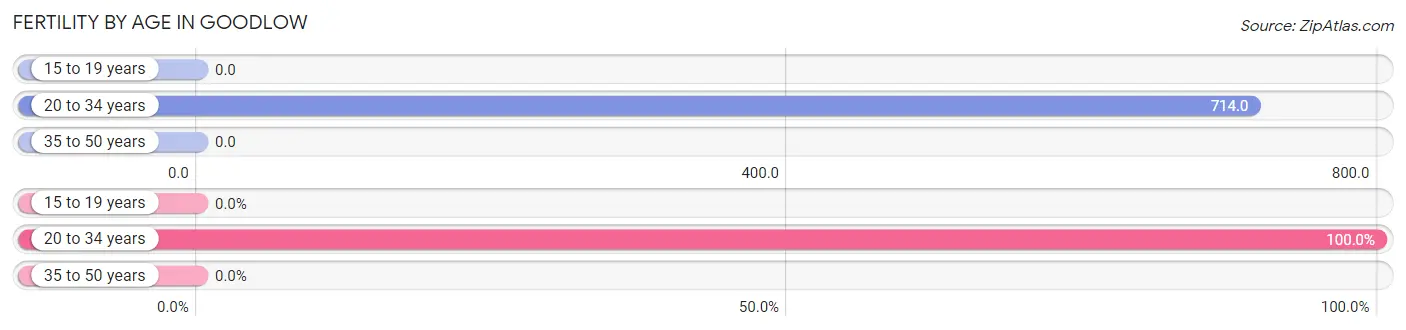
| Age Bracket | Women with Births | Births / 1,000 Women |
| 15 to 19 years | 0 (0.0%) | 0.0 |
| 20 to 34 years | 5 (100.0%) | 714.0 |
| 35 to 50 years | 0 (0.0%) | 0.0 |
| Total | 5 (100.0%) | 161.0 |
Fertility by Age by Marriage Status in Goodlow
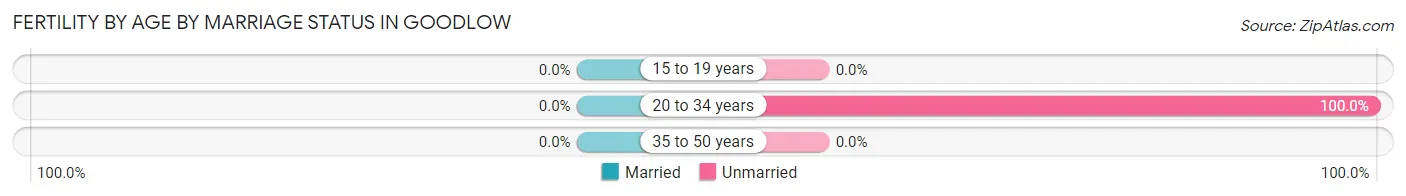
| Age Bracket | Married | Unmarried |
| 15 to 19 years | 0 (0.0%) | 0 (0.0%) |
| 20 to 34 years | 0 (0.0%) | 5 (100.0%) |
| 35 to 50 years | 0 (0.0%) | 0 (0.0%) |
| Total | 0 (0.0%) | 5 (100.0%) |
Fertility by Education in Goodlow
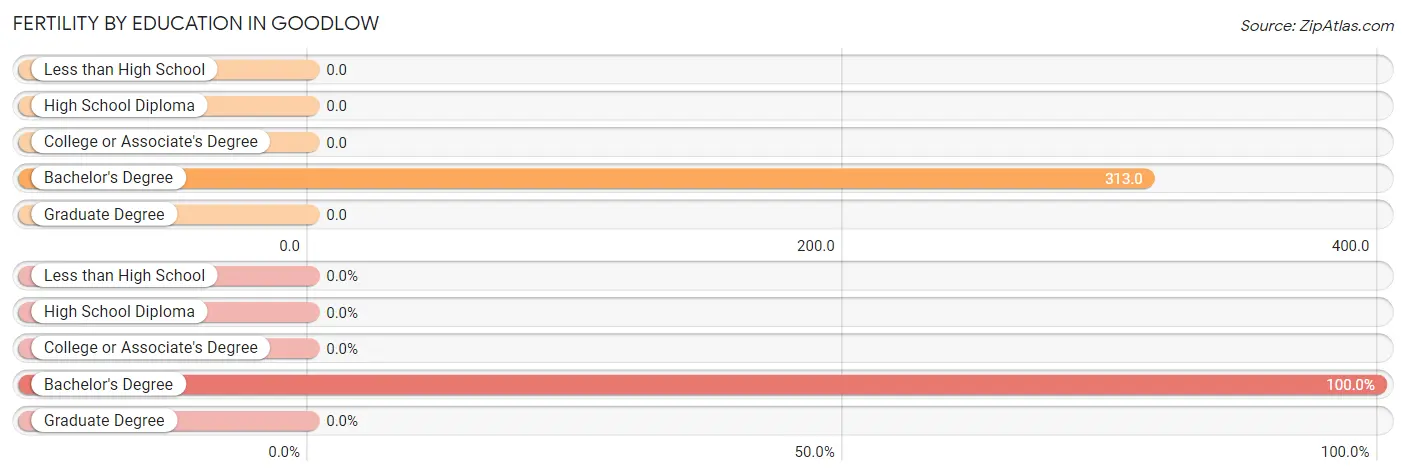
| Educational Attainment | Women with Births | Births / 1,000 Women |
| Less than High School | 0 (0.0%) | 0.0 |
| High School Diploma | 0 (0.0%) | 0.0 |
| College or Associate's Degree | 0 (0.0%) | 0.0 |
| Bachelor's Degree | 5 (100.0%) | 313.0 |
| Graduate Degree | 0 (0.0%) | 0.0 |
| Total | 5 (100.0%) | 161.0 |
Fertility by Education by Marriage Status in Goodlow
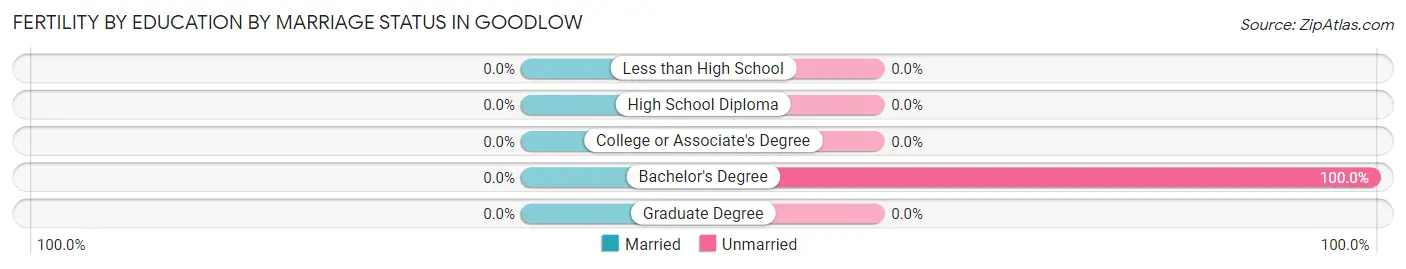
| Educational Attainment | Married | Unmarried |
| Less than High School | 0 (0.0%) | 0 (0.0%) |
| High School Diploma | 0 (0.0%) | 0 (0.0%) |
| College or Associate's Degree | 0 (0.0%) | 0 (0.0%) |
| Bachelor's Degree | 0 (0.0%) | 5 (100.0%) |
| Graduate Degree | 0 (0.0%) | 0 (0.0%) |
| Total | 0 (0.0%) | 5 (100.0%) |
Income in Goodlow
Income Overview in Goodlow
Per Capita Income in Goodlow is $22,007, while median incomes of families and households are $69,028 and $64,688 respectively.
| Characteristic | Number | Measure |
| Per Capita Income | 244 | $22,007 |
| Median Family Income | 69 | $69,028 |
| Mean Family Income | 69 | $68,236 |
| Median Household Income | 81 | $64,688 |
| Mean Household Income | 81 | $60,174 |
| Income Deficit | 69 | $8,483 |
| Wage / Income Gap (%) | 244 | 63.98% |
| Wage / Income Gap ($) | 244 | 36.02¢ per $1 |
| Gini / Inequality Index | 244 | 0.40 |
Earnings by Sex in Goodlow
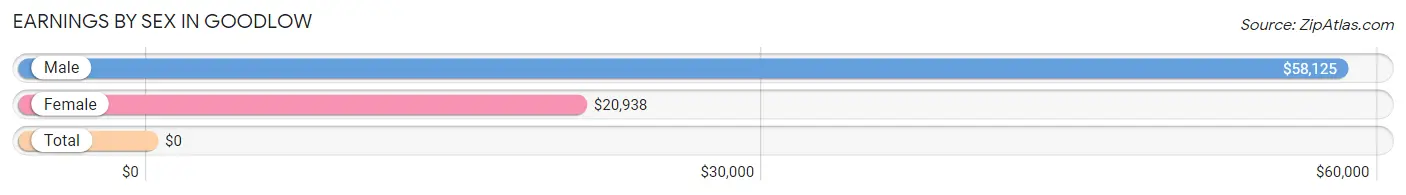
| Sex | Number | Average Earnings |
| Male | 38 (47.5%) | $58,125 |
| Female | 42 (52.5%) | $20,938 |
| Total | 80 (100.0%) | $0 |
Earnings by Sex by Income Bracket in Goodlow
The most common earnings brackets in Goodlow are $75,000 to $99,999 for men (11 | 28.9%) and $45,000 to $49,999 for women (11 | 26.2%).
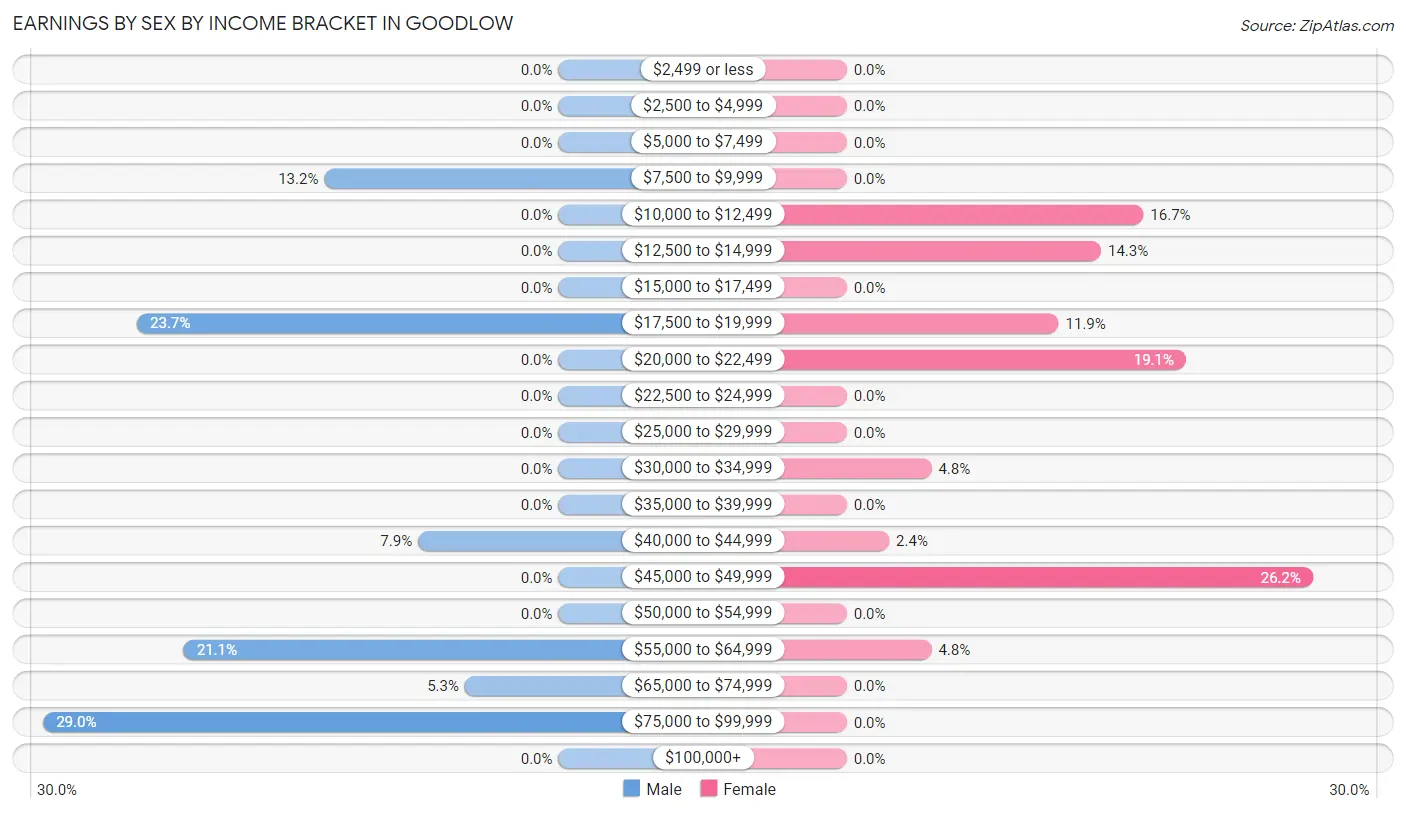
| Income | Male | Female |
| $2,499 or less | 0 (0.0%) | 0 (0.0%) |
| $2,500 to $4,999 | 0 (0.0%) | 0 (0.0%) |
| $5,000 to $7,499 | 0 (0.0%) | 0 (0.0%) |
| $7,500 to $9,999 | 5 (13.2%) | 0 (0.0%) |
| $10,000 to $12,499 | 0 (0.0%) | 7 (16.7%) |
| $12,500 to $14,999 | 0 (0.0%) | 6 (14.3%) |
| $15,000 to $17,499 | 0 (0.0%) | 0 (0.0%) |
| $17,500 to $19,999 | 9 (23.7%) | 5 (11.9%) |
| $20,000 to $22,499 | 0 (0.0%) | 8 (19.1%) |
| $22,500 to $24,999 | 0 (0.0%) | 0 (0.0%) |
| $25,000 to $29,999 | 0 (0.0%) | 0 (0.0%) |
| $30,000 to $34,999 | 0 (0.0%) | 2 (4.8%) |
| $35,000 to $39,999 | 0 (0.0%) | 0 (0.0%) |
| $40,000 to $44,999 | 3 (7.9%) | 1 (2.4%) |
| $45,000 to $49,999 | 0 (0.0%) | 11 (26.2%) |
| $50,000 to $54,999 | 0 (0.0%) | 0 (0.0%) |
| $55,000 to $64,999 | 8 (21.0%) | 2 (4.8%) |
| $65,000 to $74,999 | 2 (5.3%) | 0 (0.0%) |
| $75,000 to $99,999 | 11 (28.9%) | 0 (0.0%) |
| $100,000+ | 0 (0.0%) | 0 (0.0%) |
| Total | 38 (100.0%) | 42 (100.0%) |
Earnings by Sex by Educational Attainment in Goodlow
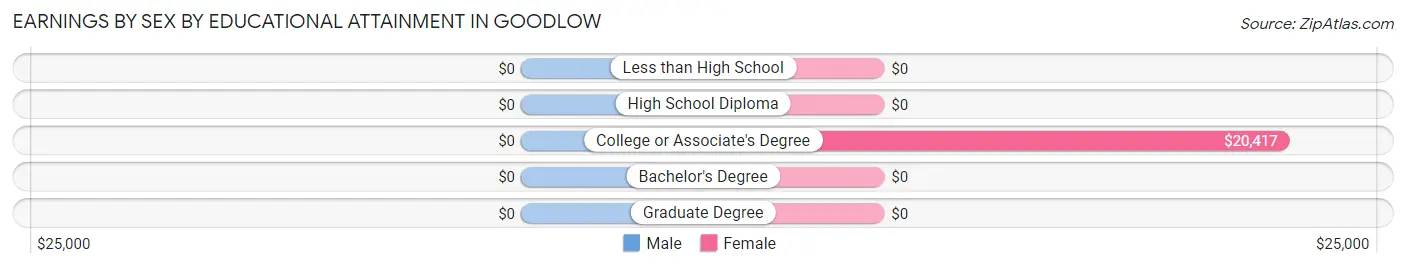
| Educational Attainment | Male Income | Female Income |
| Less than High School | - | - |
| High School Diploma | - | - |
| College or Associate's Degree | - | - |
| Bachelor's Degree | - | - |
| Graduate Degree | - | - |
| Total | $58,125 | $0 |
Family Income in Goodlow
Family Income Brackets in Goodlow
According to the Goodlow family income data, there are 19 families falling into the $75,000 to $99,999 income range, which is the most common income bracket and makes up 27.5% of all families.
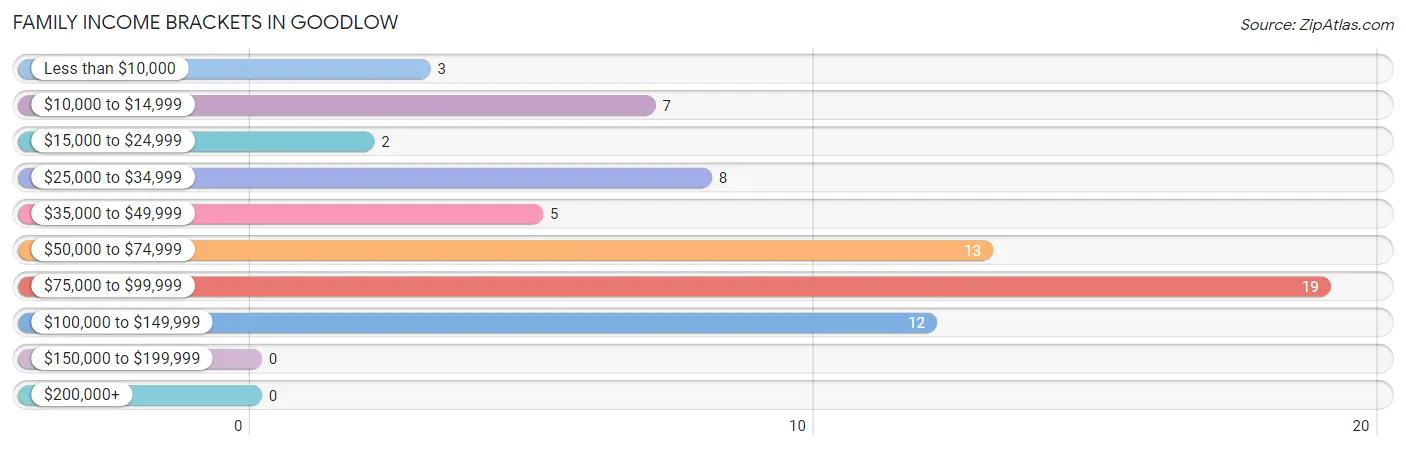
| Income Bracket | # Families | % Families |
| Less than $10,000 | 3 | 4.3% |
| $10,000 to $14,999 | 7 | 10.1% |
| $15,000 to $24,999 | 2 | 2.9% |
| $25,000 to $34,999 | 8 | 11.6% |
| $35,000 to $49,999 | 5 | 7.2% |
| $50,000 to $74,999 | 13 | 18.8% |
| $75,000 to $99,999 | 19 | 27.5% |
| $100,000 to $149,999 | 12 | 17.4% |
| $150,000 to $199,999 | 0 | 0.0% |
| $200,000+ | 0 | 0.0% |
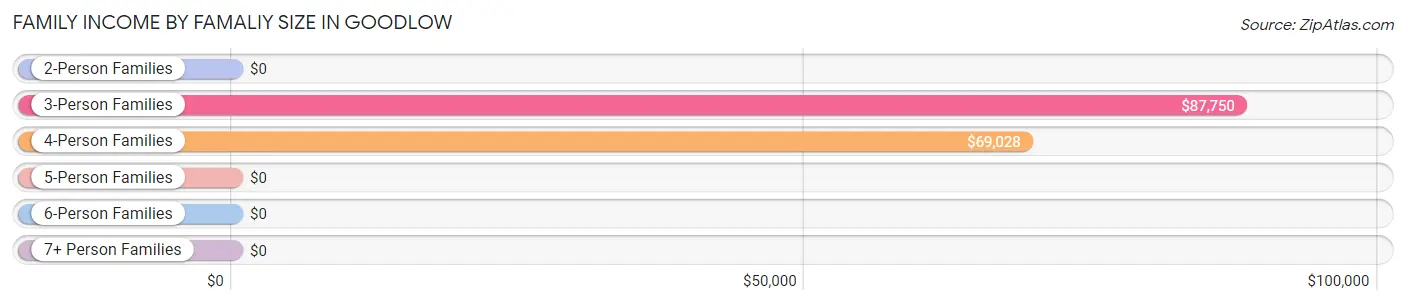
Family Income by Famaliy Size in Goodlow
3-person families (9 | 13.0%) account for the highest median family income in Goodlow with $87,750 per family, while 3-person families (9 | 13.0%) have the highest median income of $29,250 per family member.
| Income Bracket | # Families | Median Income |
| 2-Person Families | 37 (53.6%) | $0 |
| 3-Person Families | 9 (13.0%) | $87,750 |
| 4-Person Families | 19 (27.5%) | $69,028 |
| 5-Person Families | 0 (0.0%) | $0 |
| 6-Person Families | 4 (5.8%) | $0 |
| 7+ Person Families | 0 (0.0%) | $0 |
| Total | 69 (100.0%) | $69,028 |
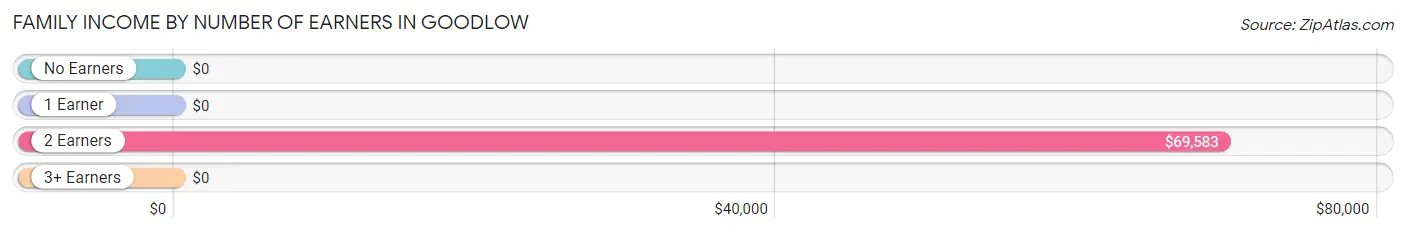
Family Income by Number of Earners in Goodlow
| Number of Earners | # Families | Median Income |
| No Earners | 23 (33.3%) | $0 |
| 1 Earner | 26 (37.7%) | $0 |
| 2 Earners | 15 (21.7%) | $69,583 |
| 3+ Earners | 5 (7.2%) | $0 |
| Total | 69 (100.0%) | $69,028 |
Household Income in Goodlow
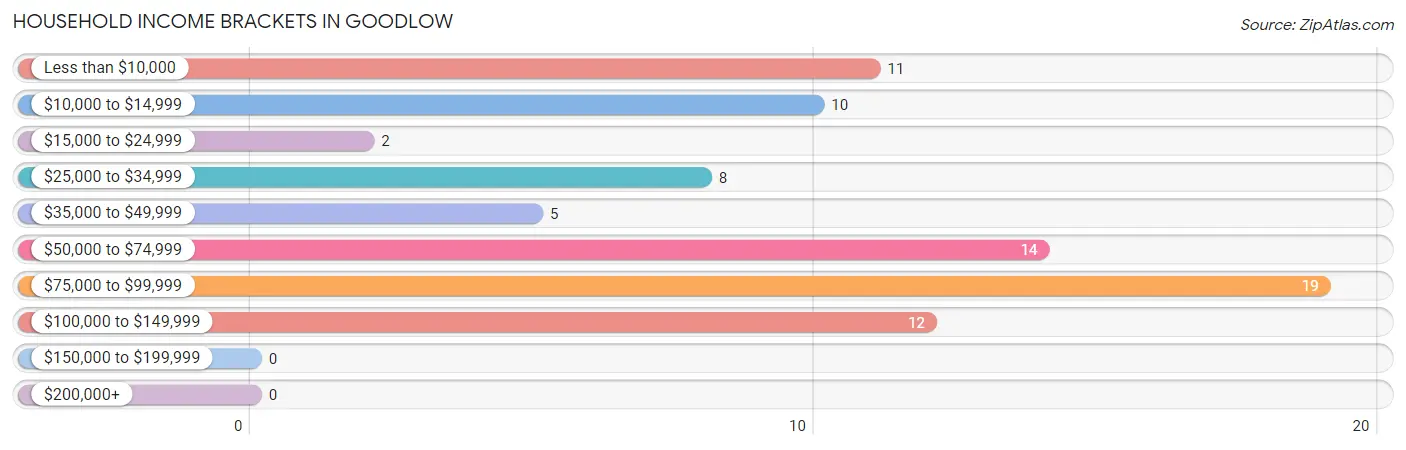
Household Income Brackets in Goodlow
With 19 households falling in the category, the $75,000 to $99,999 income range is the most frequent in Goodlow, accounting for 23.5% of all households.
| Income Bracket | # Households | % Households |
| Less than $10,000 | 11 | 13.6% |
| $10,000 to $14,999 | 10 | 12.3% |
| $15,000 to $24,999 | 2 | 2.5% |
| $25,000 to $34,999 | 8 | 9.9% |
| $35,000 to $49,999 | 5 | 6.2% |
| $50,000 to $74,999 | 14 | 17.3% |
| $75,000 to $99,999 | 19 | 23.5% |
| $100,000 to $149,999 | 12 | 14.8% |
| $150,000 to $199,999 | 0 | 0.0% |
| $200,000+ | 0 | 0.0% |
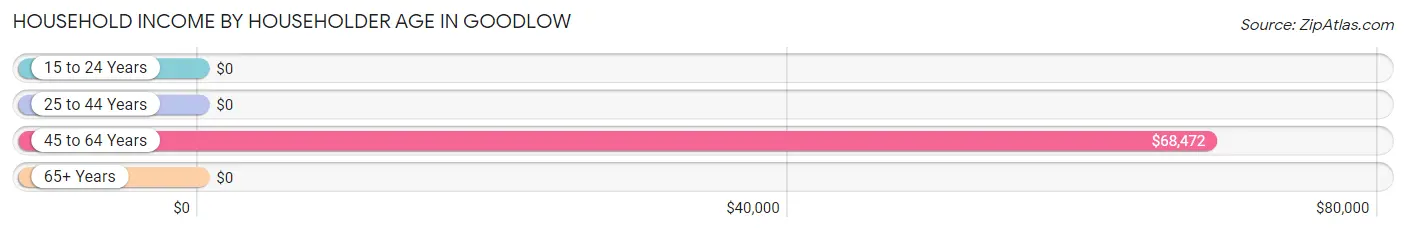
Household Income by Householder Age in Goodlow
The median household income in Goodlow is $64,688, with the highest median household income of $68,472 found in the 45 to 64 years age bracket for the primary householder. A total of 29 households (35.8%) fall into this category.
| Income Bracket | # Households | Median Income |
| 15 to 24 Years | 0 (0.0%) | $0 |
| 25 to 44 Years | 9 (11.1%) | $0 |
| 45 to 64 Years | 29 (35.8%) | $68,472 |
| 65+ Years | 43 (53.1%) | $0 |
| Total | 81 (100.0%) | $64,688 |
Poverty in Goodlow
Income Below Poverty by Sex and Age in Goodlow
With 13.0% poverty level for males and 25.6% for females among the residents of Goodlow, under 5 year old males and 6 to 11 year old females are the most vulnerable to poverty, with 2 males (66.7%) and 6 females (66.7%) in their respective age groups living below the poverty level.
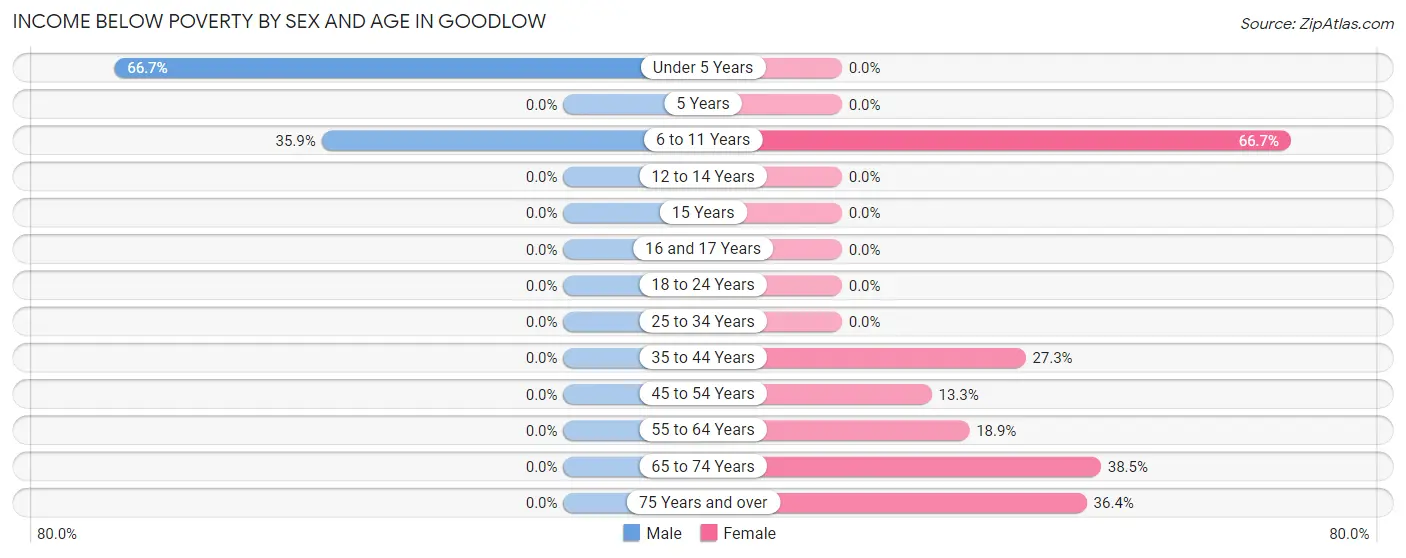
| Age Bracket | Male | Female |
| Under 5 Years | 2 (66.7%) | 0 (0.0%) |
| 5 Years | 0 (0.0%) | 0 (0.0%) |
| 6 to 11 Years | 14 (35.9%) | 6 (66.7%) |
| 12 to 14 Years | 0 (0.0%) | 0 (0.0%) |
| 15 Years | 0 (0.0%) | 0 (0.0%) |
| 16 and 17 Years | 0 (0.0%) | 0 (0.0%) |
| 18 to 24 Years | 0 (0.0%) | 0 (0.0%) |
| 25 to 34 Years | 0 (0.0%) | 0 (0.0%) |
| 35 to 44 Years | 0 (0.0%) | 3 (27.3%) |
| 45 to 54 Years | 0 (0.0%) | 2 (13.3%) |
| 55 to 64 Years | 0 (0.0%) | 7 (18.9%) |
| 65 to 74 Years | 0 (0.0%) | 5 (38.5%) |
| 75 Years and over | 0 (0.0%) | 8 (36.4%) |
| Total | 16 (13.0%) | 31 (25.6%) |
Income Above Poverty by Sex and Age in Goodlow
According to the poverty statistics in Goodlow, males aged 18 to 24 years and females aged under 5 years are the age groups that are most secure financially, with 100.0% of males and 100.0% of females in these age groups living above the poverty line.
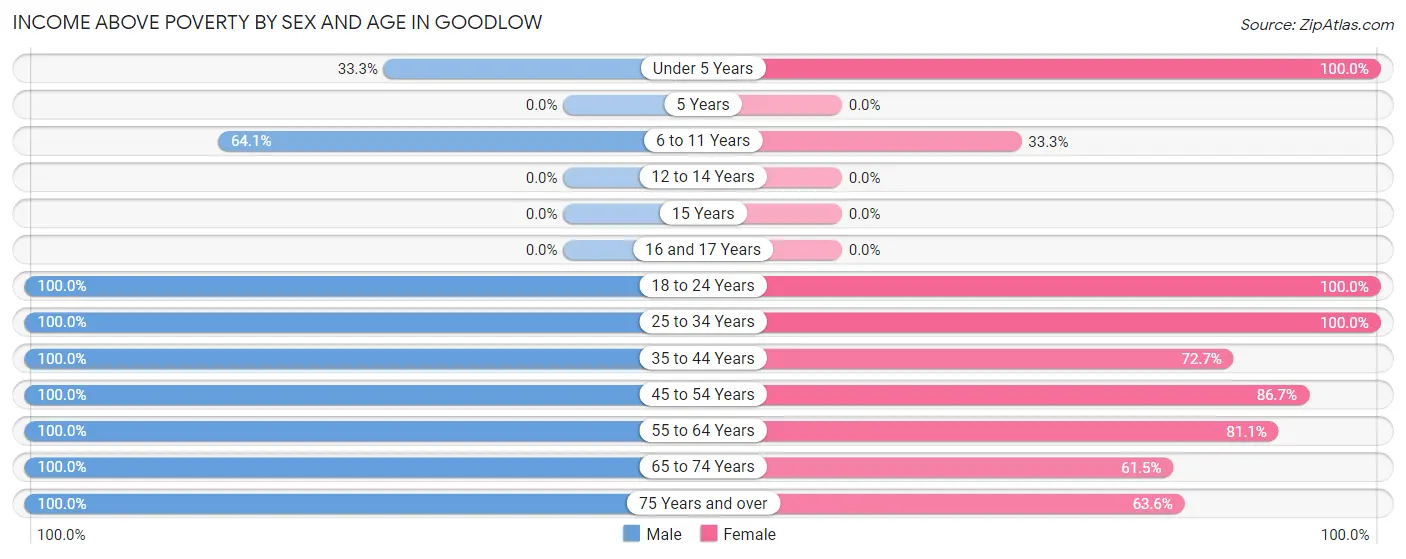
| Age Bracket | Male | Female |
| Under 5 Years | 1 (33.3%) | 7 (100.0%) |
| 5 Years | 0 (0.0%) | 0 (0.0%) |
| 6 to 11 Years | 25 (64.1%) | 3 (33.3%) |
| 12 to 14 Years | 0 (0.0%) | 0 (0.0%) |
| 15 Years | 0 (0.0%) | 0 (0.0%) |
| 16 and 17 Years | 0 (0.0%) | 0 (0.0%) |
| 18 to 24 Years | 5 (100.0%) | 5 (100.0%) |
| 25 to 34 Years | 19 (100.0%) | 2 (100.0%) |
| 35 to 44 Years | 7 (100.0%) | 8 (72.7%) |
| 45 to 54 Years | 17 (100.0%) | 13 (86.7%) |
| 55 to 64 Years | 11 (100.0%) | 30 (81.1%) |
| 65 to 74 Years | 13 (100.0%) | 8 (61.5%) |
| 75 Years and over | 9 (100.0%) | 14 (63.6%) |
| Total | 107 (87.0%) | 90 (74.4%) |
Income Below Poverty Among Married-Couple Families in Goodlow
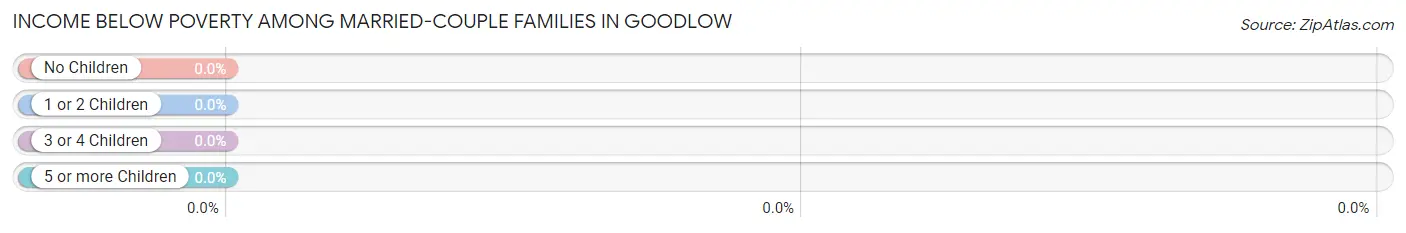
| Children | Above Poverty | Below Poverty |
| No Children | 31 (100.0%) | 0 (0.0%) |
| 1 or 2 Children | 10 (100.0%) | 0 (0.0%) |
| 3 or 4 Children | 4 (100.0%) | 0 (0.0%) |
| 5 or more Children | 0 (0.0%) | 0 (0.0%) |
| Total | 45 (100.0%) | 0 (0.0%) |
Income Below Poverty Among Single-Parent Households in Goodlow
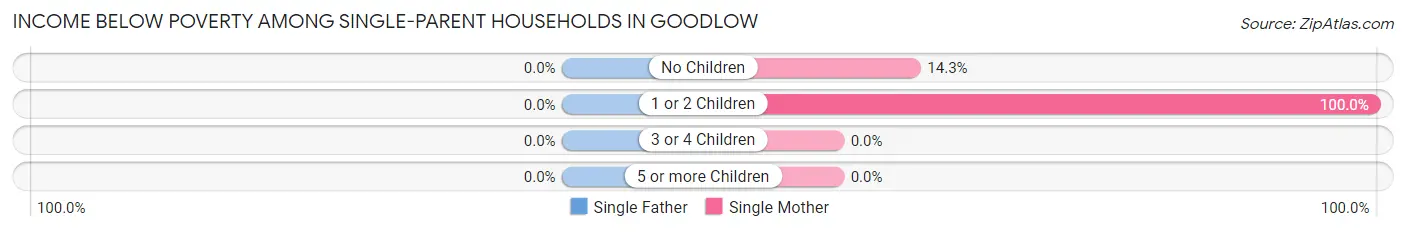
| Children | Single Father | Single Mother |
| No Children | 0 (0.0%) | 2 (14.3%) |
| 1 or 2 Children | 0 (0.0%) | 10 (100.0%) |
| 3 or 4 Children | 0 (0.0%) | 0 (0.0%) |
| 5 or more Children | 0 (0.0%) | 0 (0.0%) |
| Total | 0 (0.0%) | 12 (50.0%) |
Income Below Poverty Among Married-Couple vs Single-Parent Households in Goodlow
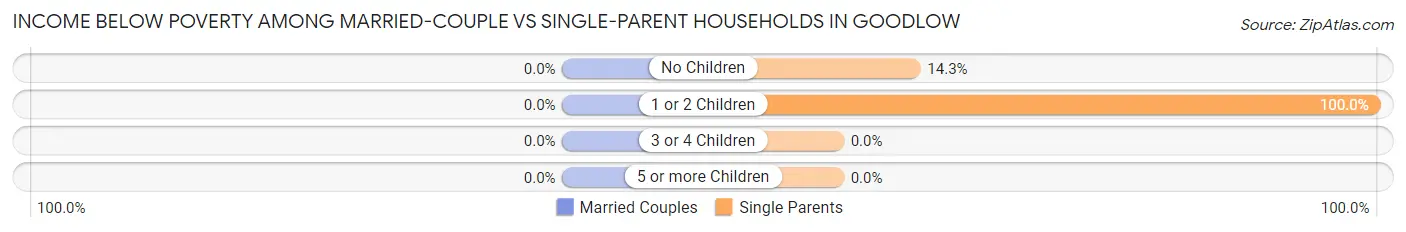
| Children | Married-Couple Families | Single-Parent Households |
| No Children | 0 (0.0%) | 2 (14.3%) |
| 1 or 2 Children | 0 (0.0%) | 10 (100.0%) |
| 3 or 4 Children | 0 (0.0%) | 0 (0.0%) |
| 5 or more Children | 0 (0.0%) | 0 (0.0%) |
| Total | 0 (0.0%) | 12 (50.0%) |
Employment Characteristics in Goodlow
Employment by Class of Employer in Goodlow
Among the 72 employed individuals in Goodlow, private company employees (67 | 93.1%), and self-employed (not incorporated) (5 | 6.9%) make up the most common classes of employment.
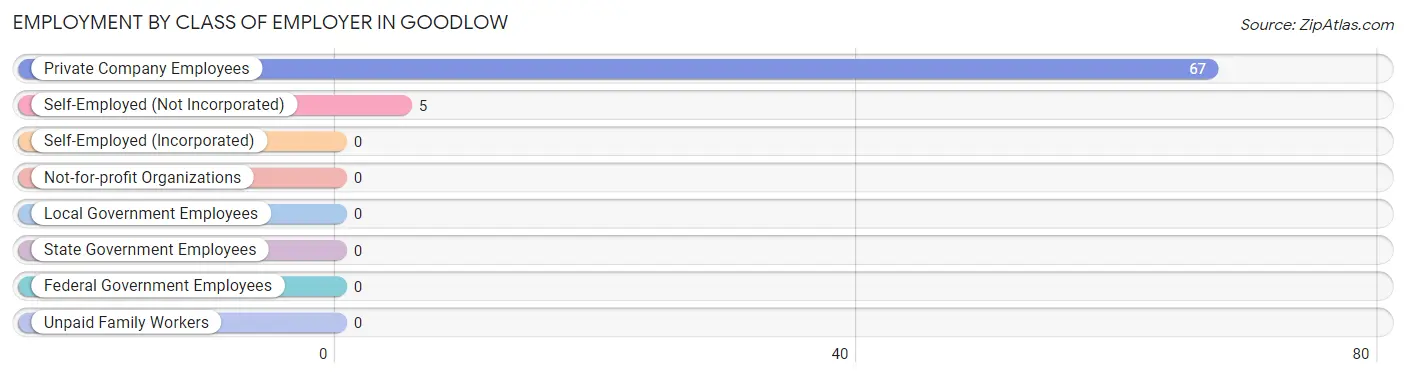
| Employer Class | # Employees | % Employees |
| Private Company Employees | 67 | 93.1% |
| Self-Employed (Incorporated) | 0 | 0.0% |
| Self-Employed (Not Incorporated) | 5 | 6.9% |
| Not-for-profit Organizations | 0 | 0.0% |
| Local Government Employees | 0 | 0.0% |
| State Government Employees | 0 | 0.0% |
| Federal Government Employees | 0 | 0.0% |
| Unpaid Family Workers | 0 | 0.0% |
| Total | 72 | 100.0% |
Employment Status by Age in Goodlow
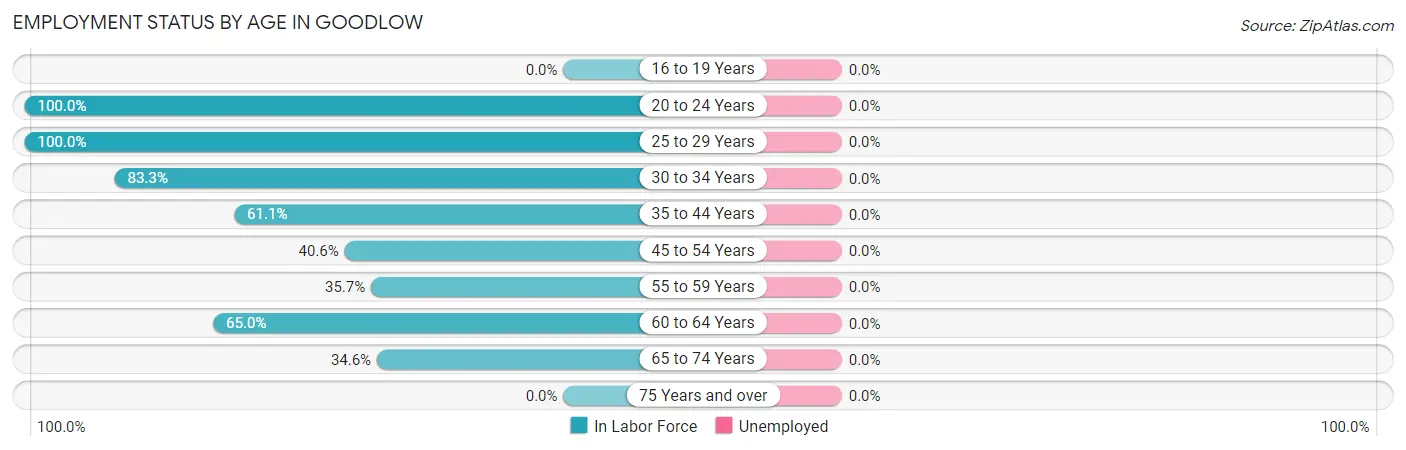
| Age Bracket | In Labor Force | Unemployed |
| 16 to 19 Years | 0 (0.0%) | 0 (0.0%) |
| 20 to 24 Years | 5 (100.0%) | 0 (0.0%) |
| 25 to 29 Years | 9 (100.0%) | 0 (0.0%) |
| 30 to 34 Years | 10 (83.3%) | 0 (0.0%) |
| 35 to 44 Years | 11 (61.1%) | 0 (0.0%) |
| 45 to 54 Years | 13 (40.6%) | 0 (0.0%) |
| 55 to 59 Years | 10 (35.7%) | 0 (0.0%) |
| 60 to 64 Years | 13 (65.0%) | 0 (0.0%) |
| 65 to 74 Years | 9 (34.6%) | 0 (0.0%) |
| 75 Years and over | 0 (0.0%) | 0 (0.0%) |
| Total | 80 (43.0%) | 0 (0.0%) |
Employment Status by Educational Attainment in Goodlow
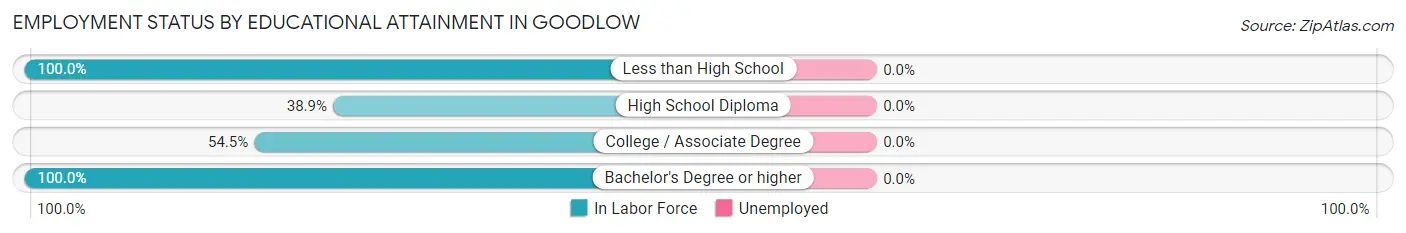
| Educational Attainment | In Labor Force | Unemployed |
| Less than High School | 7 (100.0%) | 0 (0.0%) |
| High School Diploma | 21 (38.9%) | 0 (0.0%) |
| College / Associate Degree | 24 (54.5%) | 0 (0.0%) |
| Bachelor's Degree or higher | 14 (100.0%) | 0 (0.0%) |
| Total | 66 (55.5%) | 0 (0.0%) |
Employment Occupations by Sex in Goodlow
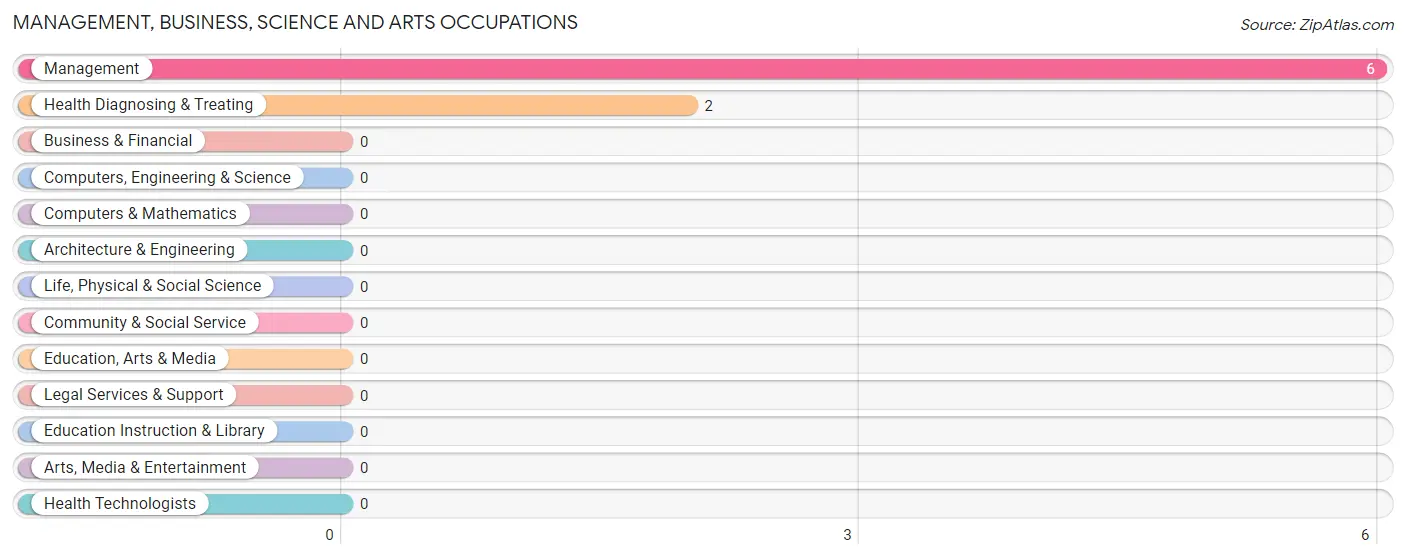
Management, Business, Science and Arts Occupations
The most common Management, Business, Science and Arts occupations in Goodlow are Management (6 | 7.5%), and Health Diagnosing & Treating (2 | 2.5%).
Management, Business, Science and Arts Occupations by Sex
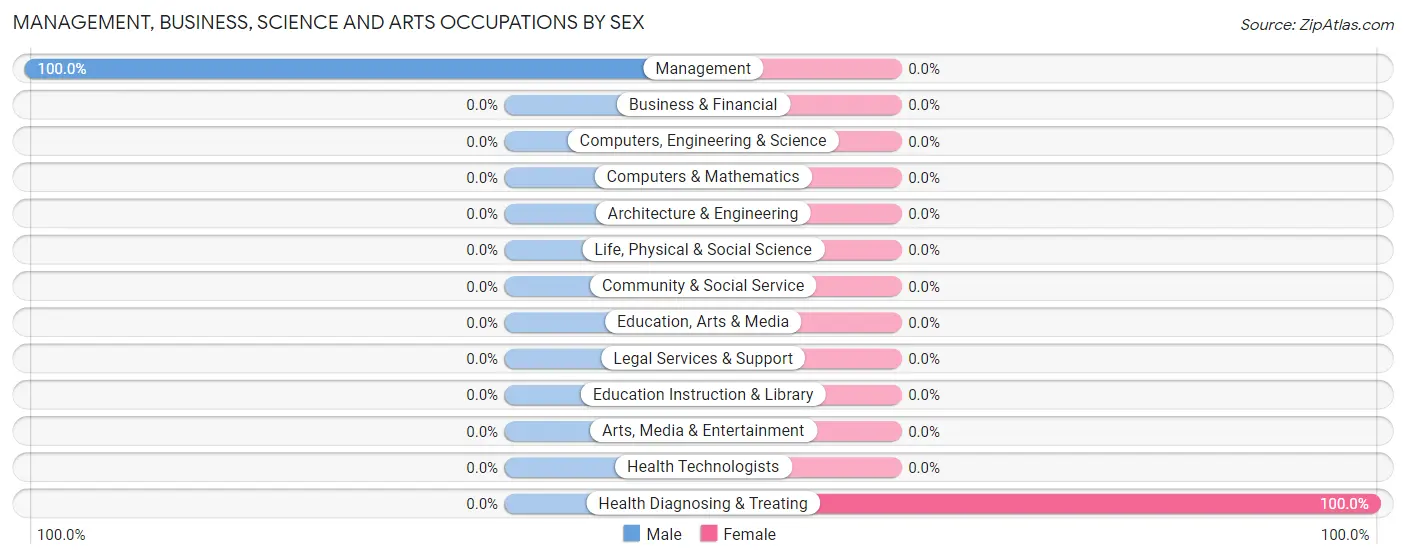
| Occupation | Male | Female |
| Management | 6 (100.0%) | 0 (0.0%) |
| Business & Financial | 0 (0.0%) | 0 (0.0%) |
| Computers, Engineering & Science | 0 (0.0%) | 0 (0.0%) |
| Computers & Mathematics | 0 (0.0%) | 0 (0.0%) |
| Architecture & Engineering | 0 (0.0%) | 0 (0.0%) |
| Life, Physical & Social Science | 0 (0.0%) | 0 (0.0%) |
| Community & Social Service | 0 (0.0%) | 0 (0.0%) |
| Education, Arts & Media | 0 (0.0%) | 0 (0.0%) |
| Legal Services & Support | 0 (0.0%) | 0 (0.0%) |
| Education Instruction & Library | 0 (0.0%) | 0 (0.0%) |
| Arts, Media & Entertainment | 0 (0.0%) | 0 (0.0%) |
| Health Diagnosing & Treating | 0 (0.0%) | 2 (100.0%) |
| Health Technologists | 0 (0.0%) | 0 (0.0%) |
| Total (Category) | 6 (75.0%) | 2 (25.0%) |
| Total (Overall) | 38 (47.5%) | 42 (52.5%) |
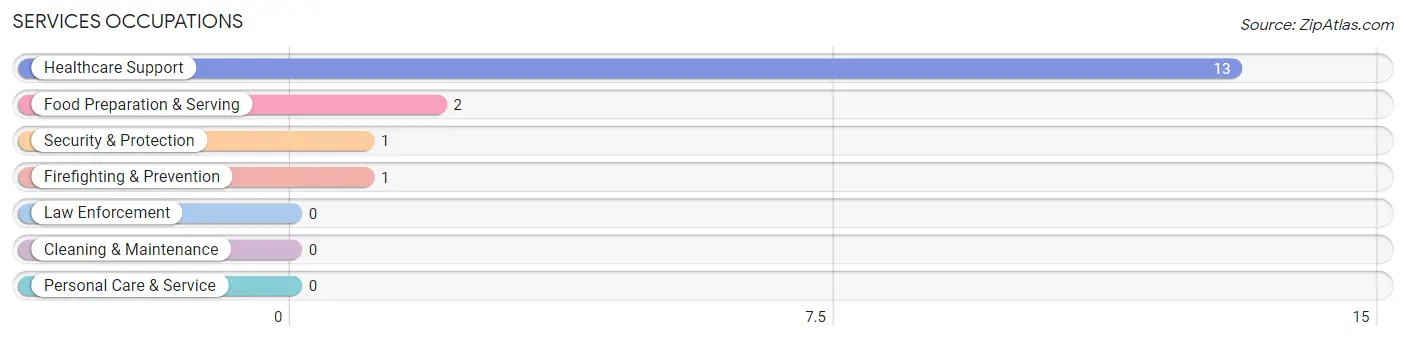
Services Occupations
The most common Services occupations in Goodlow are Healthcare Support (13 | 16.3%), Food Preparation & Serving (2 | 2.5%), Security & Protection (1 | 1.3%), and Firefighting & Prevention (1 | 1.3%).
Services Occupations by Sex
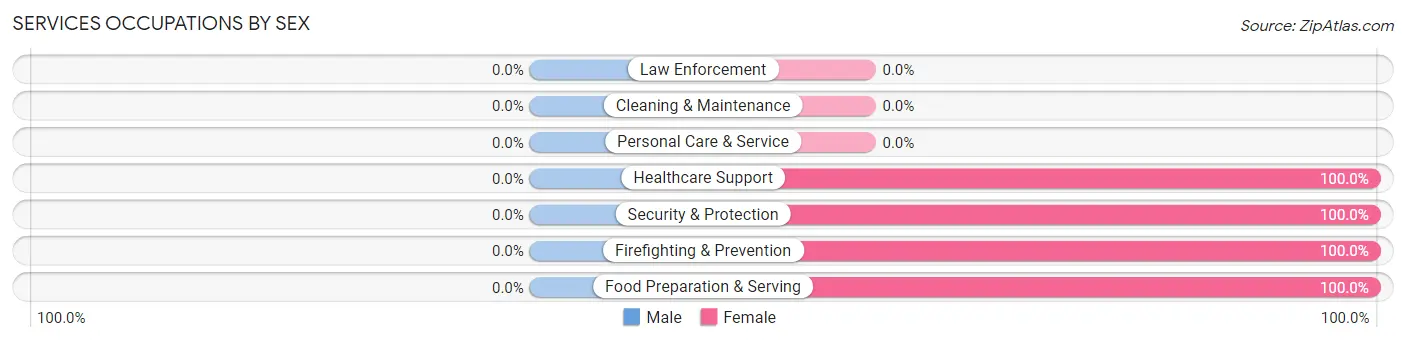
| Occupation | Male | Female |
| Healthcare Support | 0 (0.0%) | 13 (100.0%) |
| Security & Protection | 0 (0.0%) | 1 (100.0%) |
| Firefighting & Prevention | 0 (0.0%) | 1 (100.0%) |
| Law Enforcement | 0 (0.0%) | 0 (0.0%) |
| Food Preparation & Serving | 0 (0.0%) | 2 (100.0%) |
| Cleaning & Maintenance | 0 (0.0%) | 0 (0.0%) |
| Personal Care & Service | 0 (0.0%) | 0 (0.0%) |
| Total (Category) | 0 (0.0%) | 16 (100.0%) |
| Total (Overall) | 38 (47.5%) | 42 (52.5%) |
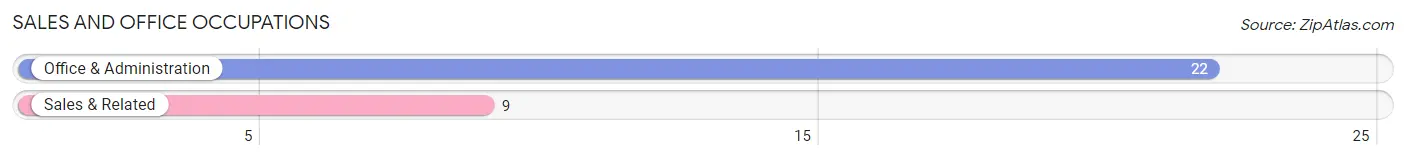
Sales and Office Occupations
The most common Sales and Office occupations in Goodlow are Office & Administration (22 | 27.5%), and Sales & Related (9 | 11.3%).
Sales and Office Occupations by Sex
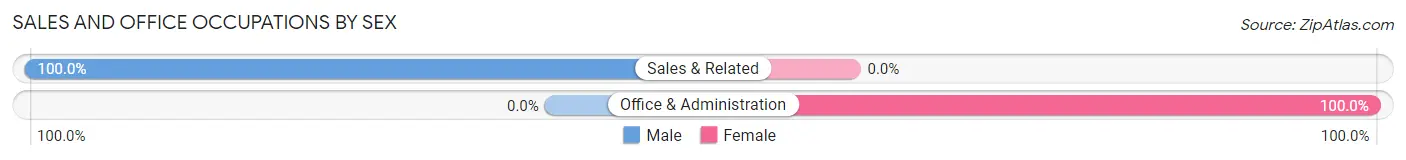
| Occupation | Male | Female |
| Sales & Related | 9 (100.0%) | 0 (0.0%) |
| Office & Administration | 0 (0.0%) | 22 (100.0%) |
| Total (Category) | 9 (29.0%) | 22 (71.0%) |
| Total (Overall) | 38 (47.5%) | 42 (52.5%) |
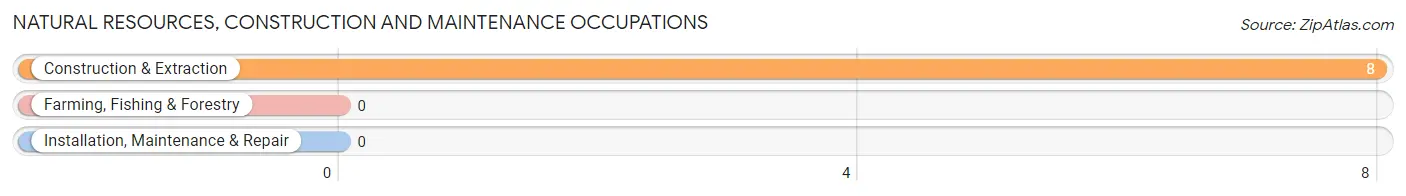
Natural Resources, Construction and Maintenance Occupations
The most common Natural Resources, Construction and Maintenance occupations in Goodlow are , and Construction & Extraction (8 | 10.0%).
Natural Resources, Construction and Maintenance Occupations by Sex
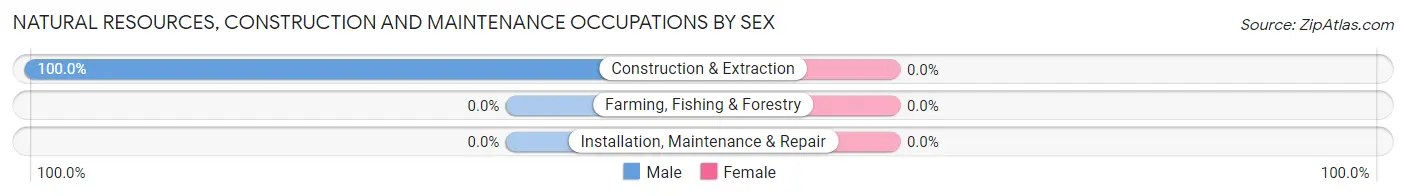
| Occupation | Male | Female |
| Farming, Fishing & Forestry | 0 (0.0%) | 0 (0.0%) |
| Construction & Extraction | 8 (100.0%) | 0 (0.0%) |
| Installation, Maintenance & Repair | 0 (0.0%) | 0 (0.0%) |
| Total (Category) | 8 (100.0%) | 0 (0.0%) |
| Total (Overall) | 38 (47.5%) | 42 (52.5%) |
Production, Transportation and Moving Occupations
The most common Production, Transportation and Moving occupations in Goodlow are Production (8 | 10.0%), Transportation (7 | 8.7%), and Material Moving (2 | 2.5%).
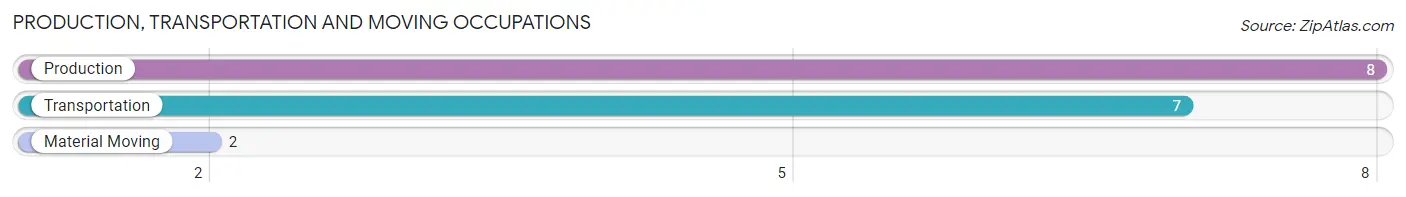
Production, Transportation and Moving Occupations by Sex
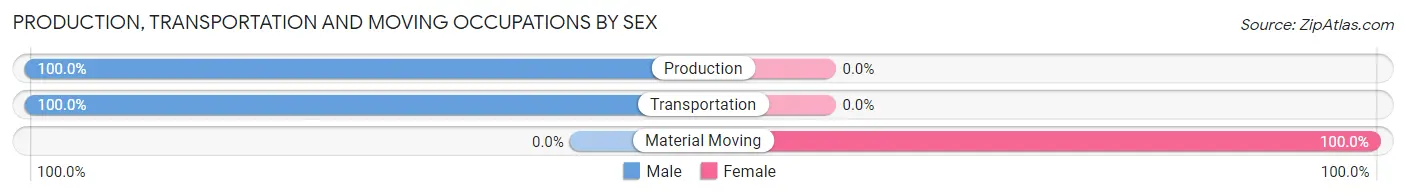
| Occupation | Male | Female |
| Production | 8 (100.0%) | 0 (0.0%) |
| Transportation | 7 (100.0%) | 0 (0.0%) |
| Material Moving | 0 (0.0%) | 2 (100.0%) |
| Total (Category) | 15 (88.2%) | 2 (11.8%) |
| Total (Overall) | 38 (47.5%) | 42 (52.5%) |
Employment Industries by Sex in Goodlow
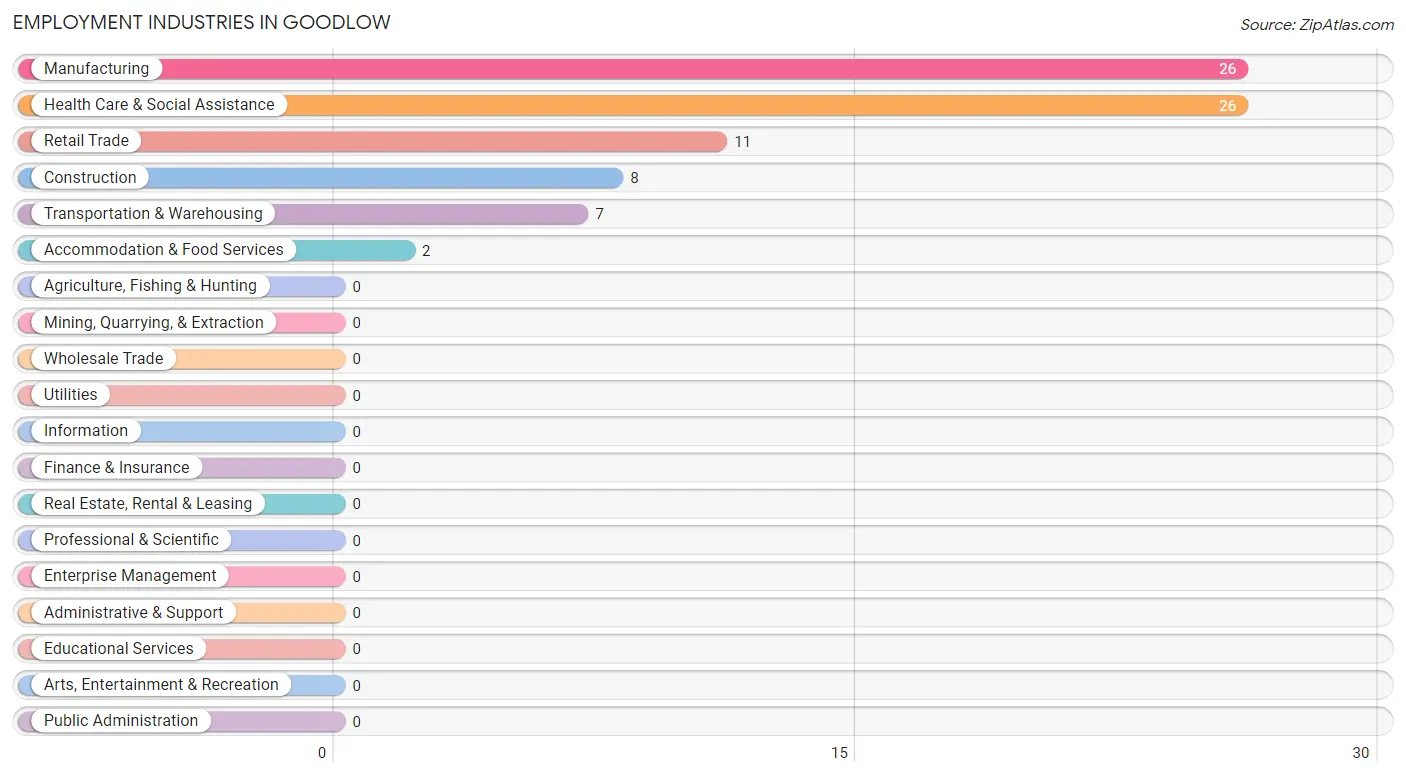
Employment Industries in Goodlow
The major employment industries in Goodlow include Manufacturing (26 | 32.5%), Health Care & Social Assistance (26 | 32.5%), Retail Trade (11 | 13.8%), Construction (8 | 10.0%), and Transportation & Warehousing (7 | 8.7%).
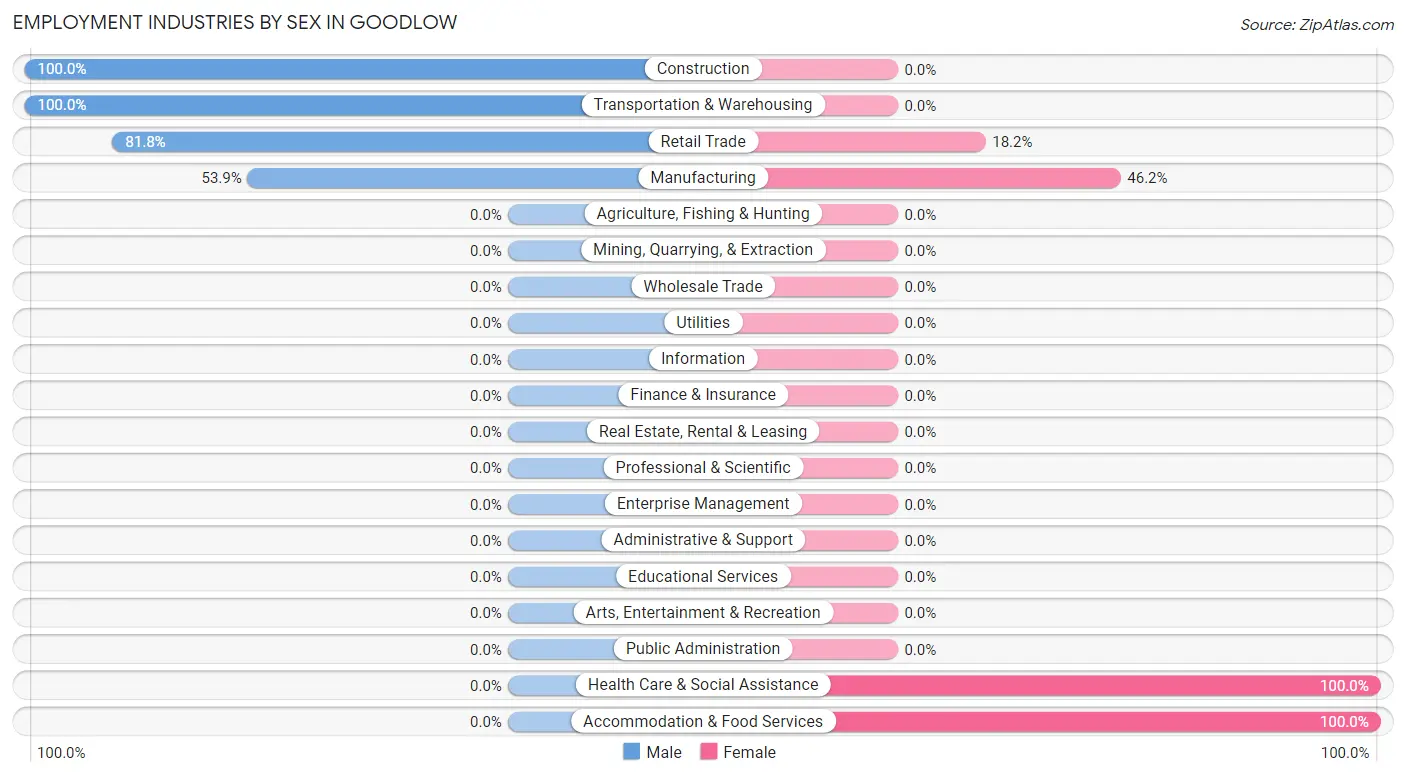
Employment Industries by Sex in Goodlow
The Goodlow industries that see more men than women are Construction (100.0%), Transportation & Warehousing (100.0%), and Retail Trade (81.8%), whereas the industries that tend to have a higher number of women are Health Care & Social Assistance (100.0%), Accommodation & Food Services (100.0%), and Manufacturing (46.2%).
| Industry | Male | Female |
| Agriculture, Fishing & Hunting | 0 (0.0%) | 0 (0.0%) |
| Mining, Quarrying, & Extraction | 0 (0.0%) | 0 (0.0%) |
| Construction | 8 (100.0%) | 0 (0.0%) |
| Manufacturing | 14 (53.8%) | 12 (46.2%) |
| Wholesale Trade | 0 (0.0%) | 0 (0.0%) |
| Retail Trade | 9 (81.8%) | 2 (18.2%) |
| Transportation & Warehousing | 7 (100.0%) | 0 (0.0%) |
| Utilities | 0 (0.0%) | 0 (0.0%) |
| Information | 0 (0.0%) | 0 (0.0%) |
| Finance & Insurance | 0 (0.0%) | 0 (0.0%) |
| Real Estate, Rental & Leasing | 0 (0.0%) | 0 (0.0%) |
| Professional & Scientific | 0 (0.0%) | 0 (0.0%) |
| Enterprise Management | 0 (0.0%) | 0 (0.0%) |
| Administrative & Support | 0 (0.0%) | 0 (0.0%) |
| Educational Services | 0 (0.0%) | 0 (0.0%) |
| Health Care & Social Assistance | 0 (0.0%) | 26 (100.0%) |
| Arts, Entertainment & Recreation | 0 (0.0%) | 0 (0.0%) |
| Accommodation & Food Services | 0 (0.0%) | 2 (100.0%) |
| Public Administration | 0 (0.0%) | 0 (0.0%) |
| Total | 38 (47.5%) | 42 (52.5%) |
Education in Goodlow
School Enrollment in Goodlow
The most common levels of schooling among the 59 students in Goodlow are elementary school (26 | 44.1%), middle school (16 | 27.1%), and college / undergraduate (16 | 27.1%).
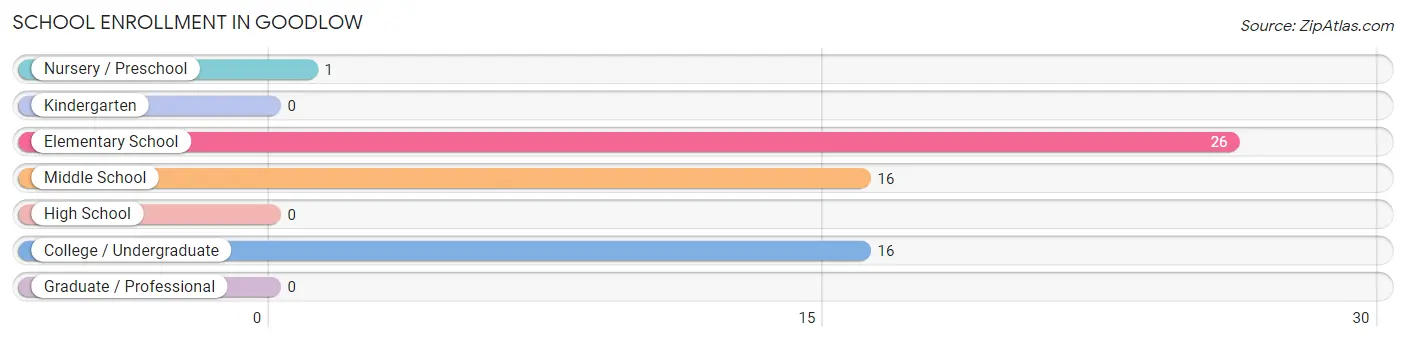
| School Level | # Students | % Students |
| Nursery / Preschool | 1 | 1.7% |
| Kindergarten | 0 | 0.0% |
| Elementary School | 26 | 44.1% |
| Middle School | 16 | 27.1% |
| High School | 0 | 0.0% |
| College / Undergraduate | 16 | 27.1% |
| Graduate / Professional | 0 | 0.0% |
| Total | 59 | 100.0% |
School Enrollment by Age by Funding Source in Goodlow
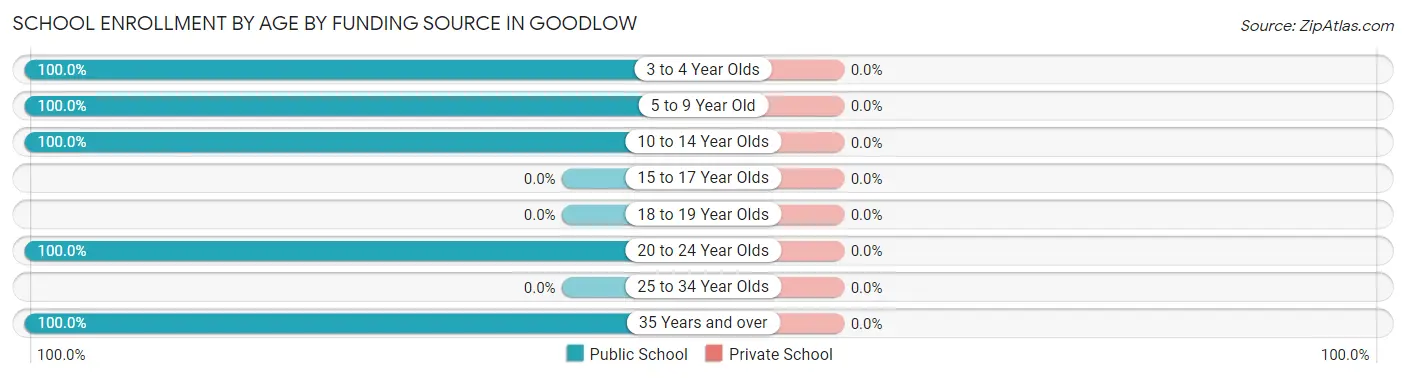
| Age Bracket | Public School | Private School |
| 3 to 4 Year Olds | 1 (100.0%) | 0 (0.0%) |
| 5 to 9 Year Old | 26 (100.0%) | 0 (0.0%) |
| 10 to 14 Year Olds | 16 (100.0%) | 0 (0.0%) |
| 15 to 17 Year Olds | 0 (0.0%) | 0 (0.0%) |
| 18 to 19 Year Olds | 0 (0.0%) | 0 (0.0%) |
| 20 to 24 Year Olds | 5 (100.0%) | 0 (0.0%) |
| 25 to 34 Year Olds | 0 (0.0%) | 0 (0.0%) |
| 35 Years and over | 11 (100.0%) | 0 (0.0%) |
| Total | 59 (100.0%) | 0 (0.0%) |
Educational Attainment by Field of Study in Goodlow
Bio, nature & agricultural (11 | 50.0%), business (4 | 18.2%), computers & mathematics (3 | 13.6%), science & technology (3 | 13.6%), and social sciences (1 | 4.5%) are the most common fields of study among 22 individuals in Goodlow who have obtained a bachelor's degree or higher.
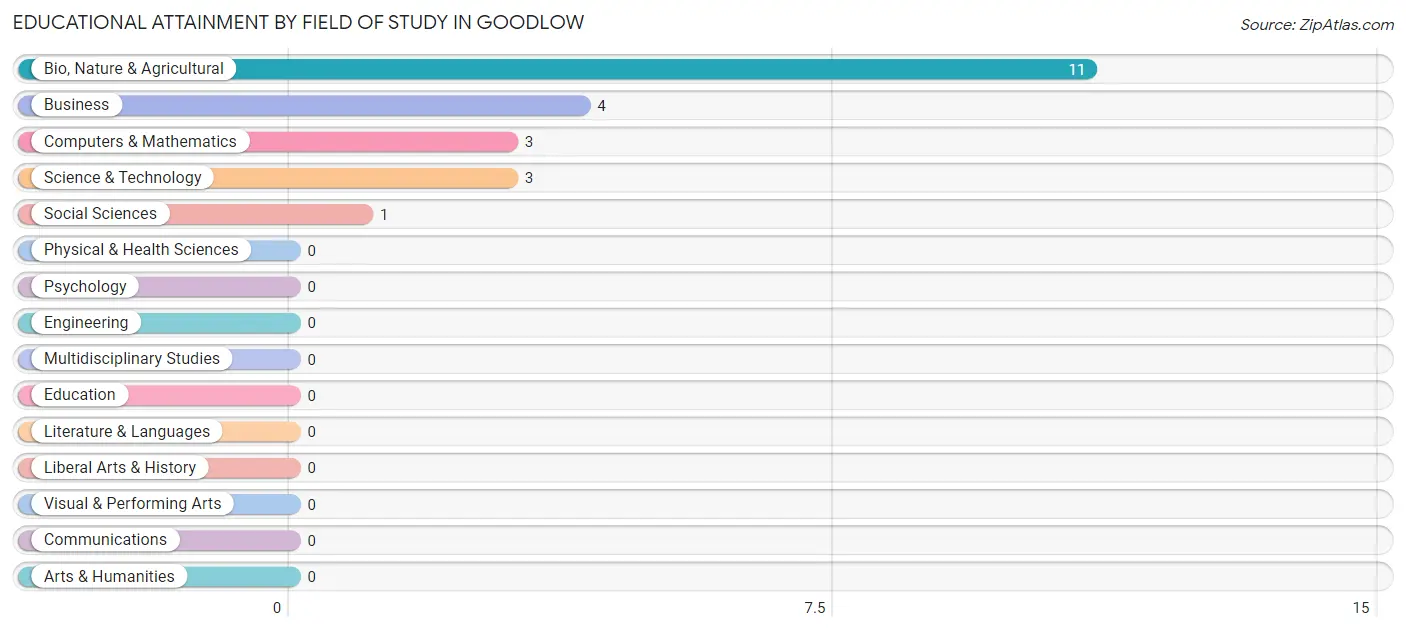
| Field of Study | # Graduates | % Graduates |
| Computers & Mathematics | 3 | 13.6% |
| Bio, Nature & Agricultural | 11 | 50.0% |
| Physical & Health Sciences | 0 | 0.0% |
| Psychology | 0 | 0.0% |
| Social Sciences | 1 | 4.5% |
| Engineering | 0 | 0.0% |
| Multidisciplinary Studies | 0 | 0.0% |
| Science & Technology | 3 | 13.6% |
| Business | 4 | 18.2% |
| Education | 0 | 0.0% |
| Literature & Languages | 0 | 0.0% |
| Liberal Arts & History | 0 | 0.0% |
| Visual & Performing Arts | 0 | 0.0% |
| Communications | 0 | 0.0% |
| Arts & Humanities | 0 | 0.0% |
| Total | 22 | 100.0% |
Transportation & Commute in Goodlow
Vehicle Availability by Sex in Goodlow
The most prevalent vehicle ownership categories in Goodlow are males with 1 vehicle (13, accounting for 43.3%) and females with 1 vehicle (14, making up 30.9%).
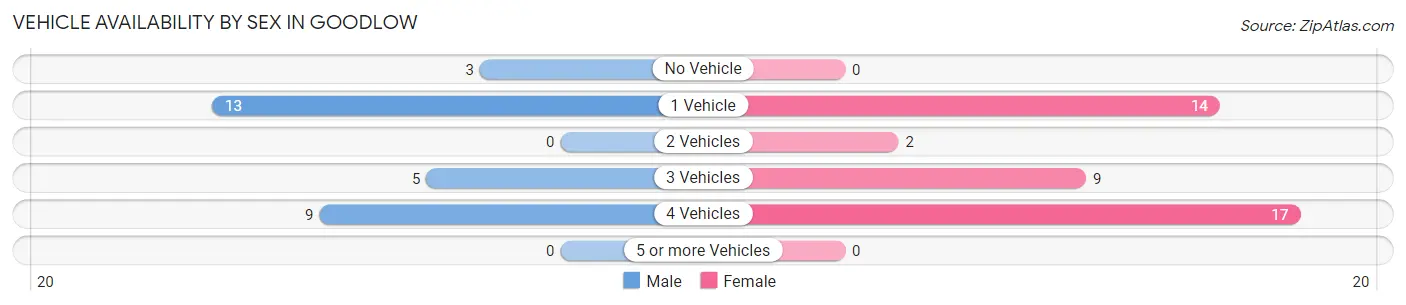
| Vehicles Available | Male | Female |
| No Vehicle | 3 (10.0%) | 0 (0.0%) |
| 1 Vehicle | 13 (43.3%) | 14 (33.3%) |
| 2 Vehicles | 0 (0.0%) | 2 (4.8%) |
| 3 Vehicles | 5 (16.7%) | 9 (21.4%) |
| 4 Vehicles | 9 (30.0%) | 17 (40.5%) |
| 5 or more Vehicles | 0 (0.0%) | 0 (0.0%) |
| Total | 30 (100.0%) | 42 (100.0%) |
Commute Time in Goodlow
The most frequently occuring commute durations in Goodlow are 30 to 34 minutes (24 commuters, 33.3%), 60 to 89 minutes (15 commuters, 20.8%), and less than 5 minutes (8 commuters, 11.1%).
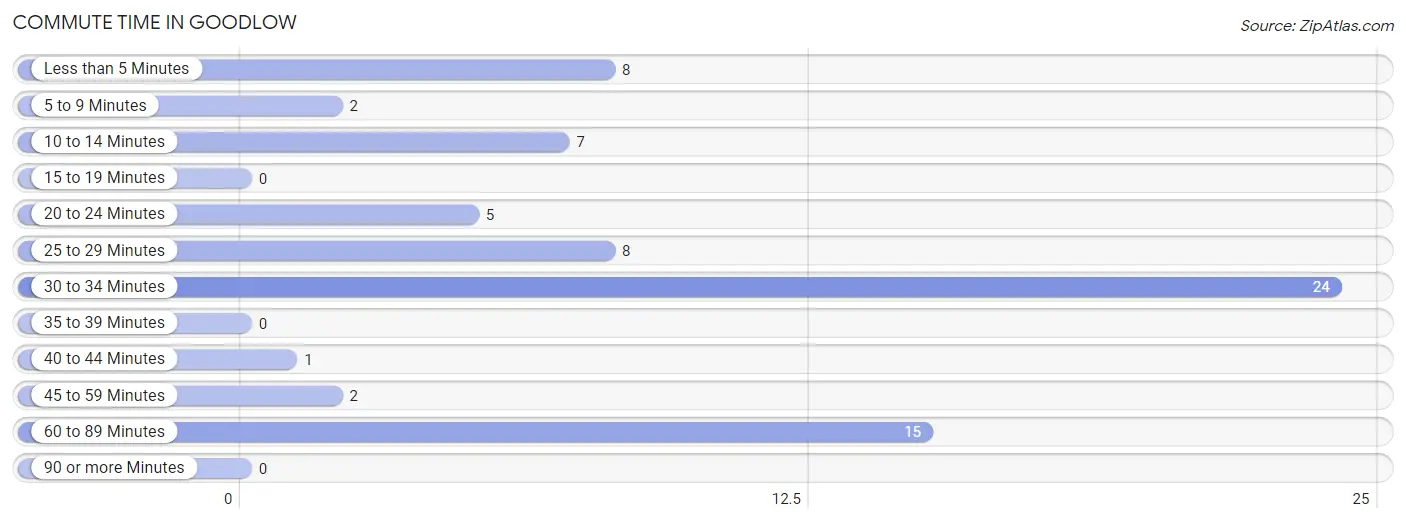
| Commute Time | # Commuters | % Commuters |
| Less than 5 Minutes | 8 | 11.1% |
| 5 to 9 Minutes | 2 | 2.8% |
| 10 to 14 Minutes | 7 | 9.7% |
| 15 to 19 Minutes | 0 | 0.0% |
| 20 to 24 Minutes | 5 | 6.9% |
| 25 to 29 Minutes | 8 | 11.1% |
| 30 to 34 Minutes | 24 | 33.3% |
| 35 to 39 Minutes | 0 | 0.0% |
| 40 to 44 Minutes | 1 | 1.4% |
| 45 to 59 Minutes | 2 | 2.8% |
| 60 to 89 Minutes | 15 | 20.8% |
| 90 or more Minutes | 0 | 0.0% |
Commute Time by Sex in Goodlow
The most common commute times in Goodlow are 60 to 89 minutes (15 commuters, 50.0%) for males and 30 to 34 minutes (24 commuters, 57.1%) for females.
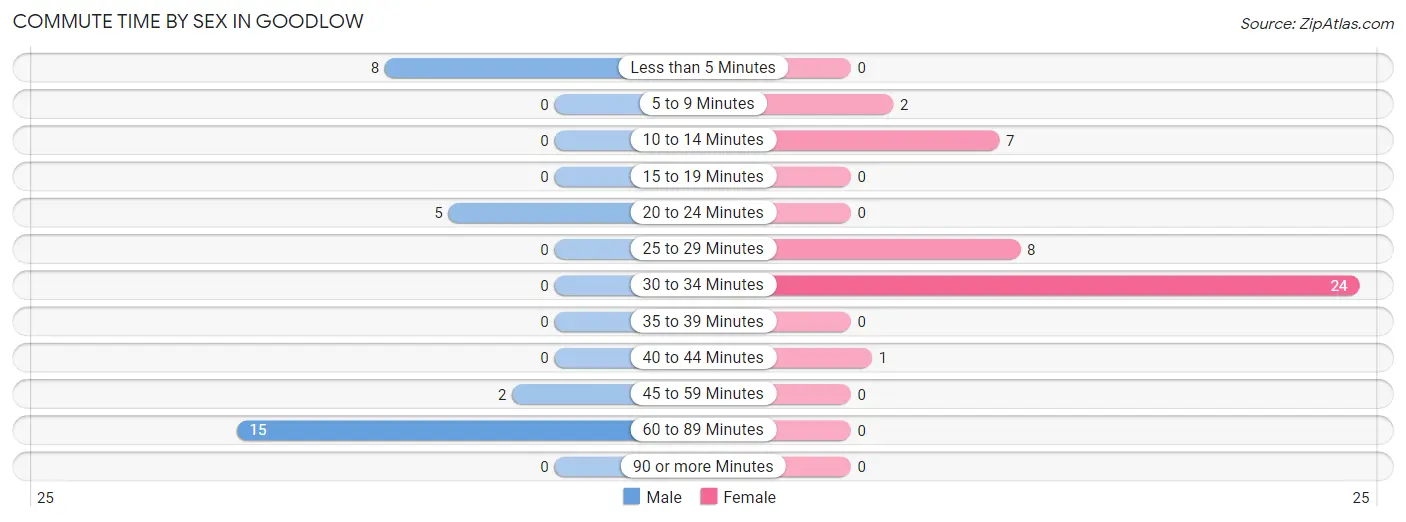
| Commute Time | Male | Female |
| Less than 5 Minutes | 8 (26.7%) | 0 (0.0%) |
| 5 to 9 Minutes | 0 (0.0%) | 2 (4.8%) |
| 10 to 14 Minutes | 0 (0.0%) | 7 (16.7%) |
| 15 to 19 Minutes | 0 (0.0%) | 0 (0.0%) |
| 20 to 24 Minutes | 5 (16.7%) | 0 (0.0%) |
| 25 to 29 Minutes | 0 (0.0%) | 8 (19.1%) |
| 30 to 34 Minutes | 0 (0.0%) | 24 (57.1%) |
| 35 to 39 Minutes | 0 (0.0%) | 0 (0.0%) |
| 40 to 44 Minutes | 0 (0.0%) | 1 (2.4%) |
| 45 to 59 Minutes | 2 (6.7%) | 0 (0.0%) |
| 60 to 89 Minutes | 15 (50.0%) | 0 (0.0%) |
| 90 or more Minutes | 0 (0.0%) | 0 (0.0%) |
Time of Departure to Work by Sex in Goodlow
The most frequent times of departure to work in Goodlow are 6:00 AM to 6:29 AM (17, 56.7%) for males and 6:30 AM to 6:59 AM (16, 38.1%) for females.
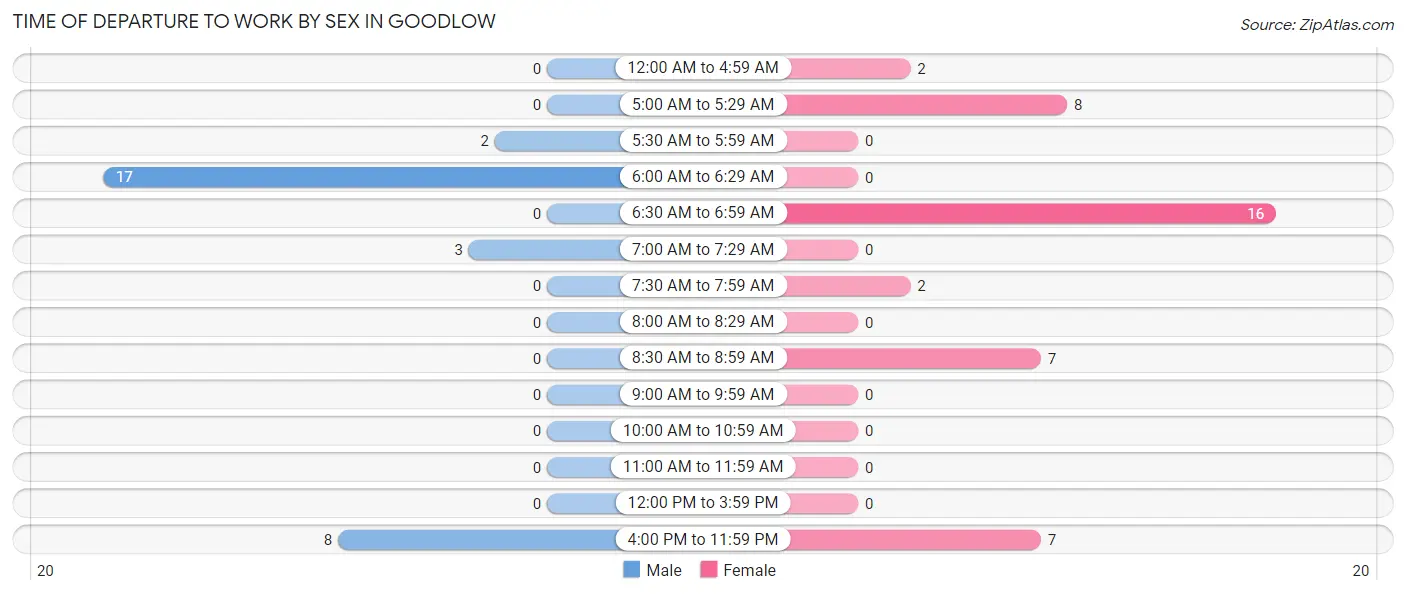
| Time of Departure | Male | Female |
| 12:00 AM to 4:59 AM | 0 (0.0%) | 2 (4.8%) |
| 5:00 AM to 5:29 AM | 0 (0.0%) | 8 (19.1%) |
| 5:30 AM to 5:59 AM | 2 (6.7%) | 0 (0.0%) |
| 6:00 AM to 6:29 AM | 17 (56.7%) | 0 (0.0%) |
| 6:30 AM to 6:59 AM | 0 (0.0%) | 16 (38.1%) |
| 7:00 AM to 7:29 AM | 3 (10.0%) | 0 (0.0%) |
| 7:30 AM to 7:59 AM | 0 (0.0%) | 2 (4.8%) |
| 8:00 AM to 8:29 AM | 0 (0.0%) | 0 (0.0%) |
| 8:30 AM to 8:59 AM | 0 (0.0%) | 7 (16.7%) |
| 9:00 AM to 9:59 AM | 0 (0.0%) | 0 (0.0%) |
| 10:00 AM to 10:59 AM | 0 (0.0%) | 0 (0.0%) |
| 11:00 AM to 11:59 AM | 0 (0.0%) | 0 (0.0%) |
| 12:00 PM to 3:59 PM | 0 (0.0%) | 0 (0.0%) |
| 4:00 PM to 11:59 PM | 8 (26.7%) | 7 (16.7%) |
| Total | 30 (100.0%) | 42 (100.0%) |
Housing Occupancy in Goodlow
Occupancy by Ownership in Goodlow
Of the total 81 dwellings in Goodlow, owner-occupied units account for 74 (91.4%), while renter-occupied units make up 7 (8.6%).
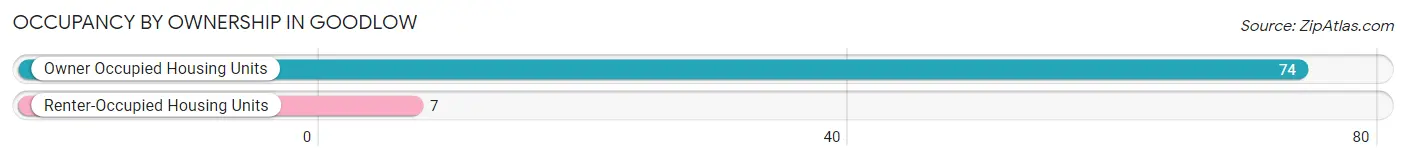
| Occupancy | # Housing Units | % Housing Units |
| Owner Occupied Housing Units | 74 | 91.4% |
| Renter-Occupied Housing Units | 7 | 8.6% |
| Total Occupied Housing Units | 81 | 100.0% |
Occupancy by Household Size in Goodlow
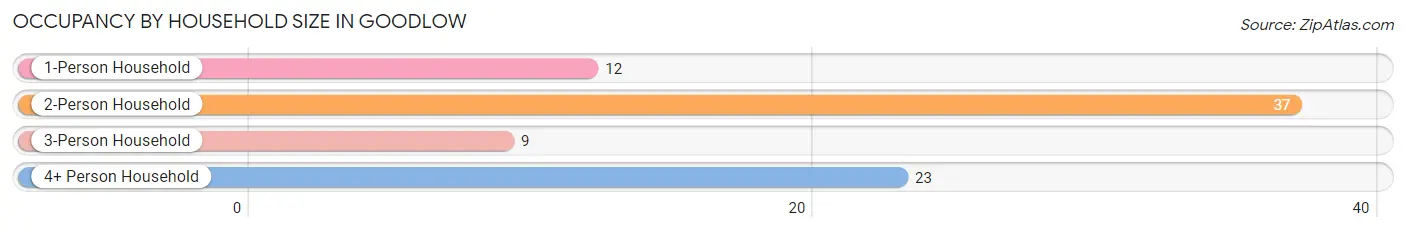
| Household Size | # Housing Units | % Housing Units |
| 1-Person Household | 12 | 14.8% |
| 2-Person Household | 37 | 45.7% |
| 3-Person Household | 9 | 11.1% |
| 4+ Person Household | 23 | 28.4% |
| Total Housing Units | 81 | 100.0% |
Occupancy by Ownership by Household Size in Goodlow
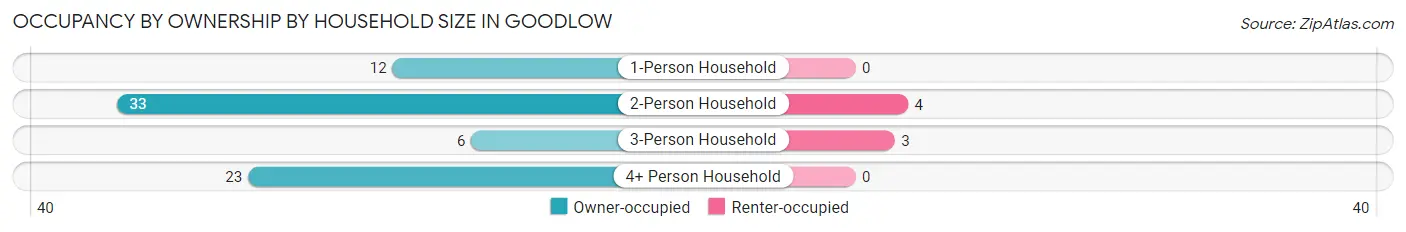
| Household Size | Owner-occupied | Renter-occupied |
| 1-Person Household | 12 (100.0%) | 0 (0.0%) |
| 2-Person Household | 33 (89.2%) | 4 (10.8%) |
| 3-Person Household | 6 (66.7%) | 3 (33.3%) |
| 4+ Person Household | 23 (100.0%) | 0 (0.0%) |
| Total Housing Units | 74 (91.4%) | 7 (8.6%) |
Occupancy by Educational Attainment in Goodlow
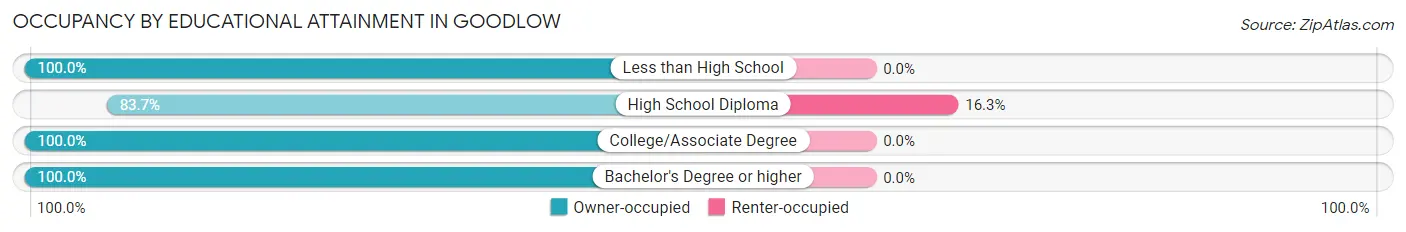
| Household Size | Owner-occupied | Renter-occupied |
| Less than High School | 20 (100.0%) | 0 (0.0%) |
| High School Diploma | 36 (83.7%) | 7 (16.3%) |
| College/Associate Degree | 10 (100.0%) | 0 (0.0%) |
| Bachelor's Degree or higher | 8 (100.0%) | 0 (0.0%) |
Occupancy by Age of Householder in Goodlow
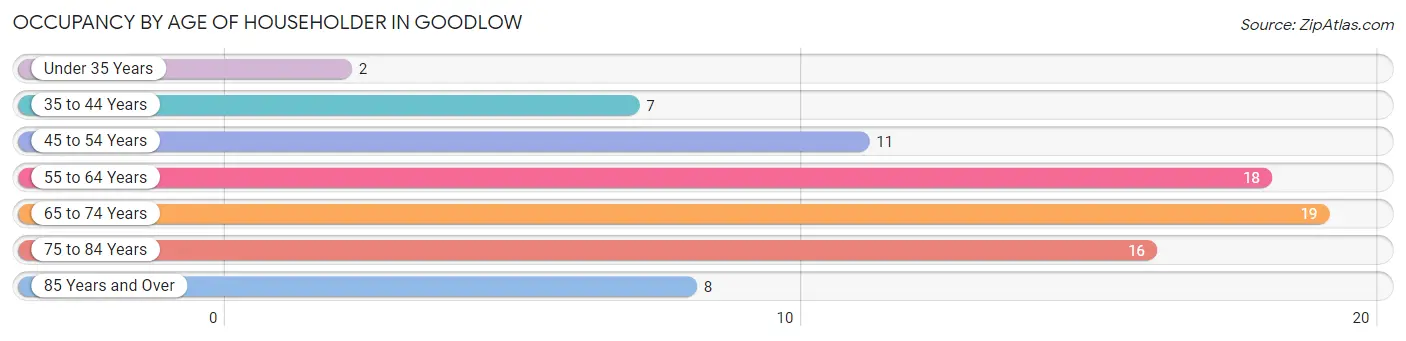
| Age Bracket | # Households | % Households |
| Under 35 Years | 2 | 2.5% |
| 35 to 44 Years | 7 | 8.6% |
| 45 to 54 Years | 11 | 13.6% |
| 55 to 64 Years | 18 | 22.2% |
| 65 to 74 Years | 19 | 23.5% |
| 75 to 84 Years | 16 | 19.8% |
| 85 Years and Over | 8 | 9.9% |
| Total | 81 | 100.0% |
Housing Finances in Goodlow
Median Income by Occupancy in Goodlow
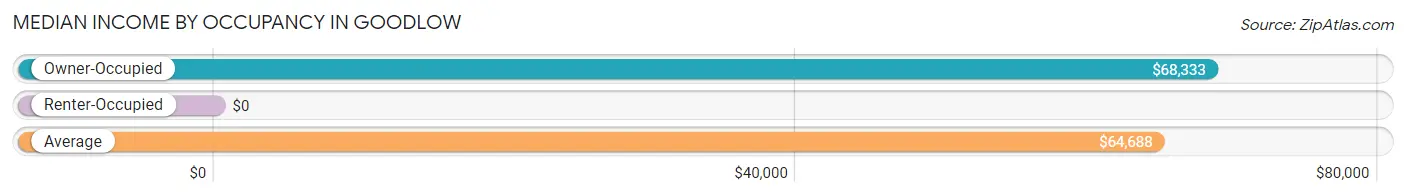
| Occupancy Type | # Households | Median Income |
| Owner-Occupied | 74 (91.4%) | $68,333 |
| Renter-Occupied | 7 (8.6%) | $0 |
| Average | 81 (100.0%) | $64,688 |
Occupancy by Householder Income Bracket in Goodlow
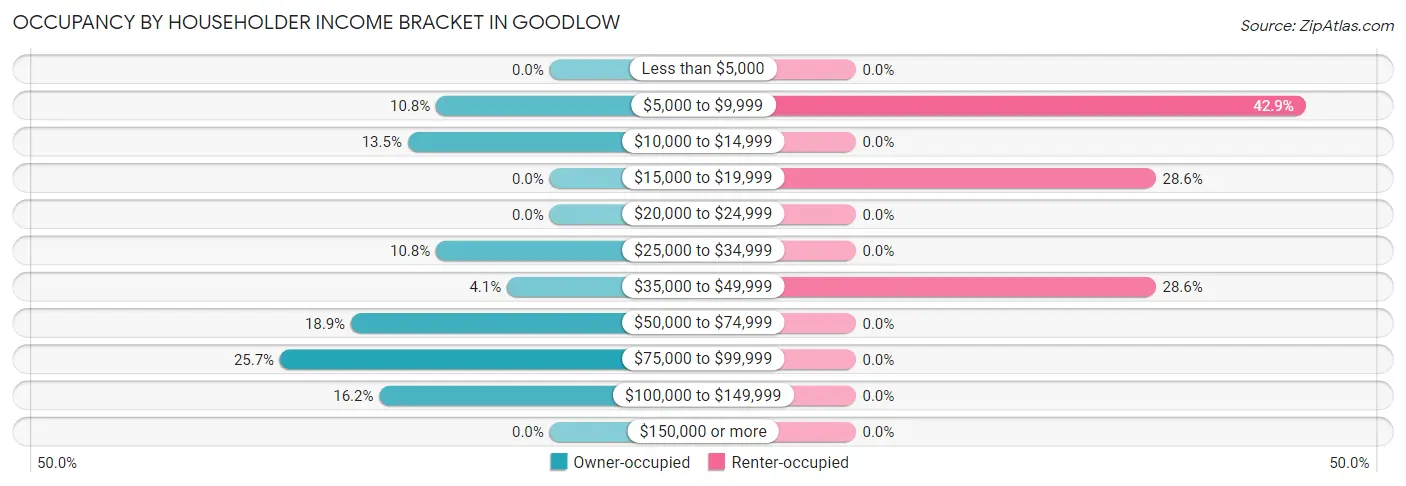
| Income Bracket | Owner-occupied | Renter-occupied |
| Less than $5,000 | 0 (0.0%) | 0 (0.0%) |
| $5,000 to $9,999 | 8 (10.8%) | 3 (42.9%) |
| $10,000 to $14,999 | 10 (13.5%) | 0 (0.0%) |
| $15,000 to $19,999 | 0 (0.0%) | 2 (28.6%) |
| $20,000 to $24,999 | 0 (0.0%) | 0 (0.0%) |
| $25,000 to $34,999 | 8 (10.8%) | 0 (0.0%) |
| $35,000 to $49,999 | 3 (4.1%) | 2 (28.6%) |
| $50,000 to $74,999 | 14 (18.9%) | 0 (0.0%) |
| $75,000 to $99,999 | 19 (25.7%) | 0 (0.0%) |
| $100,000 to $149,999 | 12 (16.2%) | 0 (0.0%) |
| $150,000 or more | 0 (0.0%) | 0 (0.0%) |
| Total | 74 (100.0%) | 7 (100.0%) |
Monthly Housing Cost Tiers in Goodlow
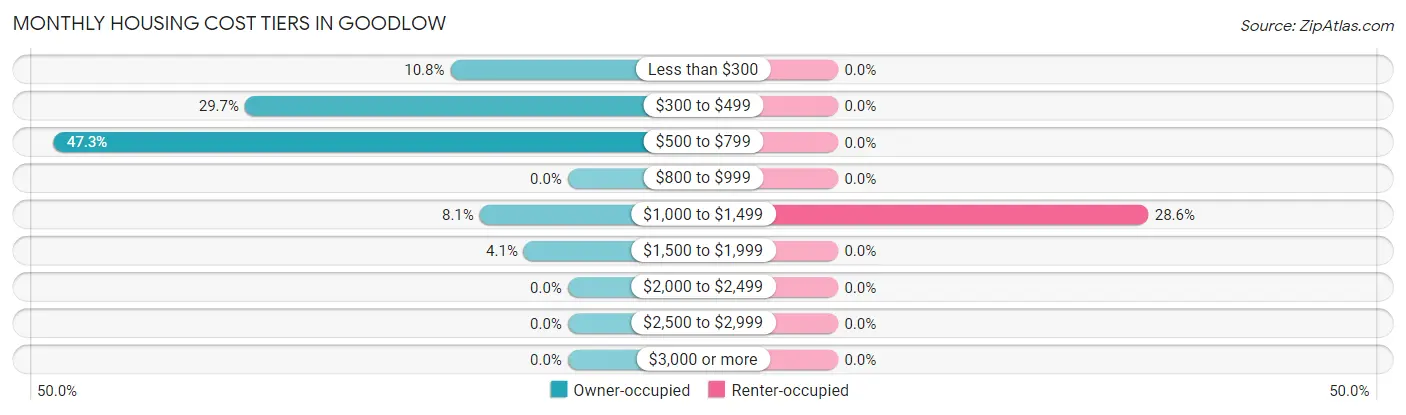
| Monthly Cost | Owner-occupied | Renter-occupied |
| Less than $300 | 8 (10.8%) | 0 (0.0%) |
| $300 to $499 | 22 (29.7%) | 0 (0.0%) |
| $500 to $799 | 35 (47.3%) | 0 (0.0%) |
| $800 to $999 | 0 (0.0%) | 0 (0.0%) |
| $1,000 to $1,499 | 6 (8.1%) | 2 (28.6%) |
| $1,500 to $1,999 | 3 (4.1%) | 0 (0.0%) |
| $2,000 to $2,499 | 0 (0.0%) | 0 (0.0%) |
| $2,500 to $2,999 | 0 (0.0%) | 0 (0.0%) |
| $3,000 or more | 0 (0.0%) | 0 (0.0%) |
| Total | 74 (100.0%) | 7 (100.0%) |
Physical Housing Characteristics in Goodlow
Housing Structures in Goodlow
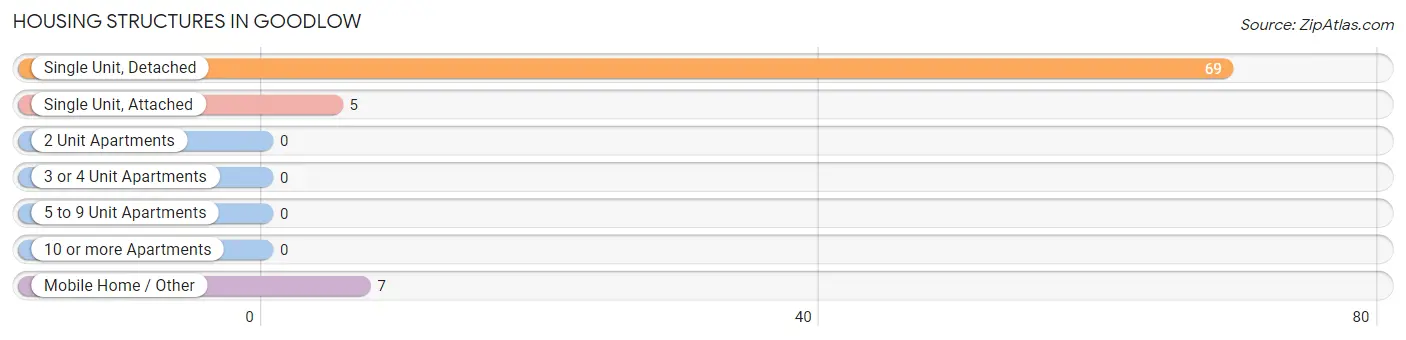
| Structure Type | # Housing Units | % Housing Units |
| Single Unit, Detached | 69 | 85.2% |
| Single Unit, Attached | 5 | 6.2% |
| 2 Unit Apartments | 0 | 0.0% |
| 3 or 4 Unit Apartments | 0 | 0.0% |
| 5 to 9 Unit Apartments | 0 | 0.0% |
| 10 or more Apartments | 0 | 0.0% |
| Mobile Home / Other | 7 | 8.6% |
| Total | 81 | 100.0% |
Housing Structures by Occupancy in Goodlow
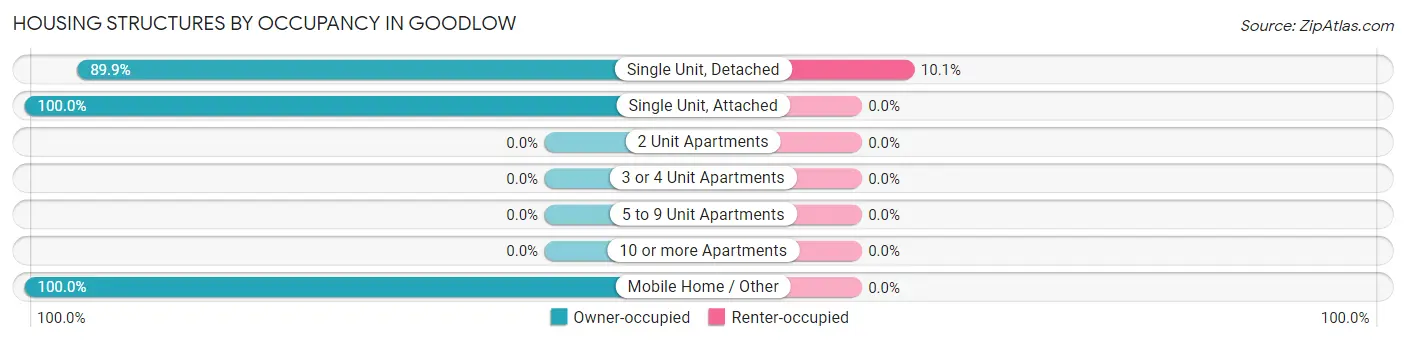
| Structure Type | Owner-occupied | Renter-occupied |
| Single Unit, Detached | 62 (89.9%) | 7 (10.1%) |
| Single Unit, Attached | 5 (100.0%) | 0 (0.0%) |
| 2 Unit Apartments | 0 (0.0%) | 0 (0.0%) |
| 3 or 4 Unit Apartments | 0 (0.0%) | 0 (0.0%) |
| 5 to 9 Unit Apartments | 0 (0.0%) | 0 (0.0%) |
| 10 or more Apartments | 0 (0.0%) | 0 (0.0%) |
| Mobile Home / Other | 7 (100.0%) | 0 (0.0%) |
| Total | 74 (91.4%) | 7 (8.6%) |
Housing Structures by Number of Rooms in Goodlow
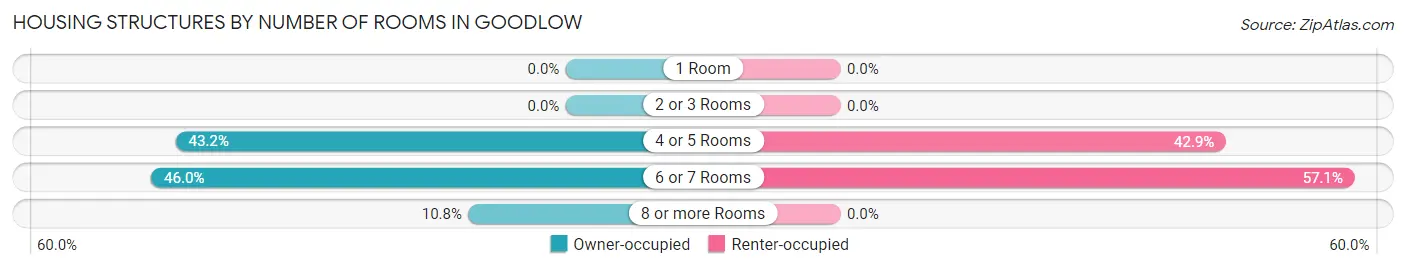
| Number of Rooms | Owner-occupied | Renter-occupied |
| 1 Room | 0 (0.0%) | 0 (0.0%) |
| 2 or 3 Rooms | 0 (0.0%) | 0 (0.0%) |
| 4 or 5 Rooms | 32 (43.2%) | 3 (42.9%) |
| 6 or 7 Rooms | 34 (46.0%) | 4 (57.1%) |
| 8 or more Rooms | 8 (10.8%) | 0 (0.0%) |
| Total | 74 (100.0%) | 7 (100.0%) |
Housing Structure by Heating Type in Goodlow
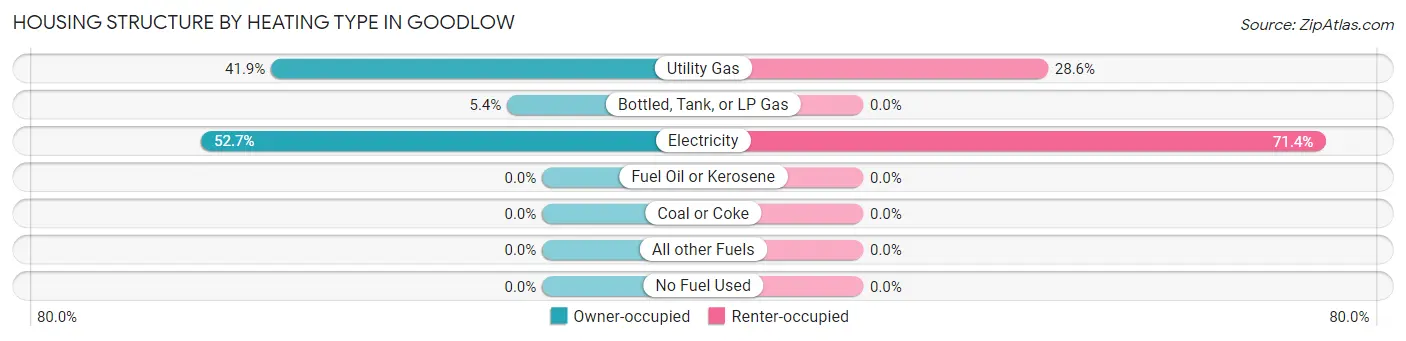
| Heating Type | Owner-occupied | Renter-occupied |
| Utility Gas | 31 (41.9%) | 2 (28.6%) |
| Bottled, Tank, or LP Gas | 4 (5.4%) | 0 (0.0%) |
| Electricity | 39 (52.7%) | 5 (71.4%) |
| Fuel Oil or Kerosene | 0 (0.0%) | 0 (0.0%) |
| Coal or Coke | 0 (0.0%) | 0 (0.0%) |
| All other Fuels | 0 (0.0%) | 0 (0.0%) |
| No Fuel Used | 0 (0.0%) | 0 (0.0%) |
| Total | 74 (100.0%) | 7 (100.0%) |
Household Vehicle Usage in Goodlow
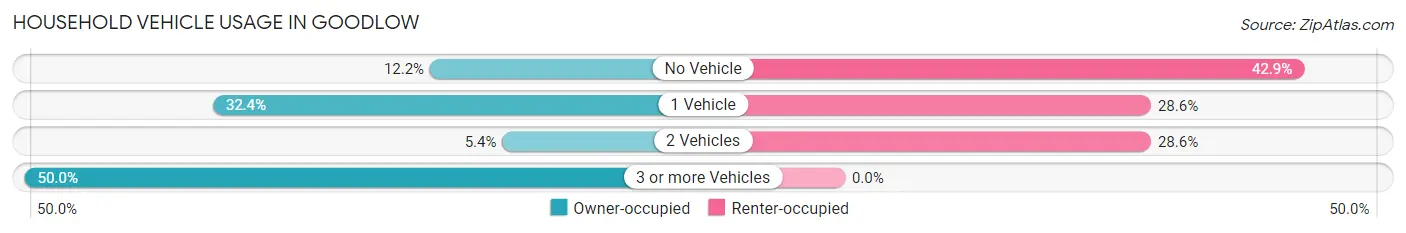
| Vehicles per Household | Owner-occupied | Renter-occupied |
| No Vehicle | 9 (12.2%) | 3 (42.9%) |
| 1 Vehicle | 24 (32.4%) | 2 (28.6%) |
| 2 Vehicles | 4 (5.4%) | 2 (28.6%) |
| 3 or more Vehicles | 37 (50.0%) | 0 (0.0%) |
| Total | 74 (100.0%) | 7 (100.0%) |
Real Estate & Mortgages in Goodlow
Real Estate and Mortgage Overview in Goodlow
| Characteristic | Without Mortgage | With Mortgage |
| Housing Units | 69 | 5 |
| Median Property Value | $67,300 | $0 |
| Median Household Income | $67,639 | $0 |
| Monthly Housing Costs | $525 | $0 |
| Real Estate Taxes | $823 | $0 |
Property Value by Mortgage Status in Goodlow
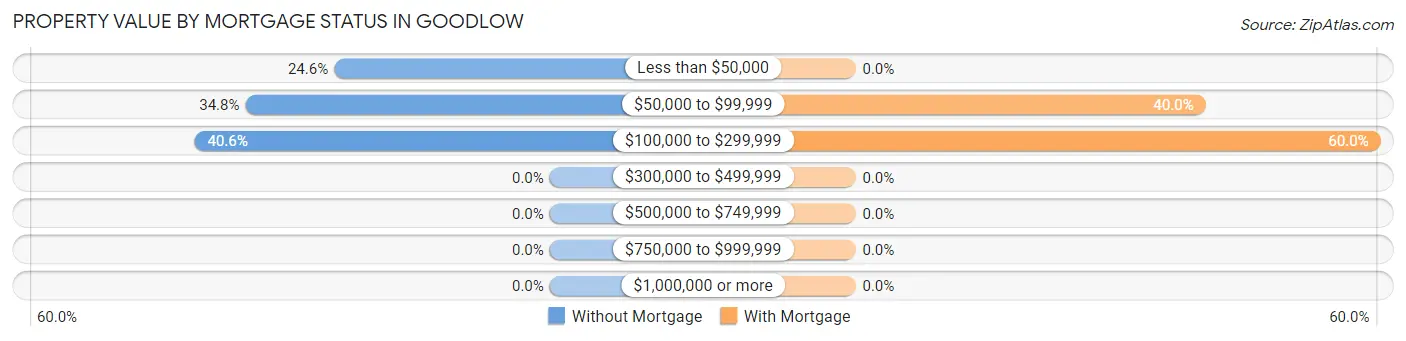
| Property Value | Without Mortgage | With Mortgage |
| Less than $50,000 | 17 (24.6%) | 0 (0.0%) |
| $50,000 to $99,999 | 24 (34.8%) | 2 (40.0%) |
| $100,000 to $299,999 | 28 (40.6%) | 3 (60.0%) |
| $300,000 to $499,999 | 0 (0.0%) | 0 (0.0%) |
| $500,000 to $749,999 | 0 (0.0%) | 0 (0.0%) |
| $750,000 to $999,999 | 0 (0.0%) | 0 (0.0%) |
| $1,000,000 or more | 0 (0.0%) | 0 (0.0%) |
| Total | 69 (100.0%) | 5 (100.0%) |
Household Income by Mortgage Status in Goodlow
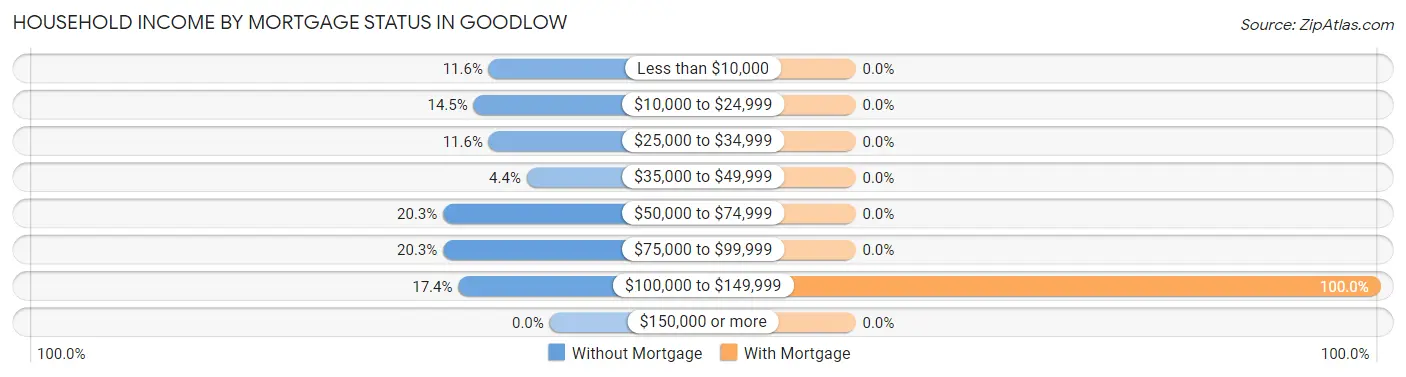
| Household Income | Without Mortgage | With Mortgage |
| Less than $10,000 | 8 (11.6%) | 0 (0.0%) |
| $10,000 to $24,999 | 10 (14.5%) | 0 (0.0%) |
| $25,000 to $34,999 | 8 (11.6%) | 0 (0.0%) |
| $35,000 to $49,999 | 3 (4.3%) | 0 (0.0%) |
| $50,000 to $74,999 | 14 (20.3%) | 0 (0.0%) |
| $75,000 to $99,999 | 14 (20.3%) | 0 (0.0%) |
| $100,000 to $149,999 | 12 (17.4%) | 5 (100.0%) |
| $150,000 or more | 0 (0.0%) | 0 (0.0%) |
| Total | 69 (100.0%) | 5 (100.0%) |
Property Value to Household Income Ratio in Goodlow
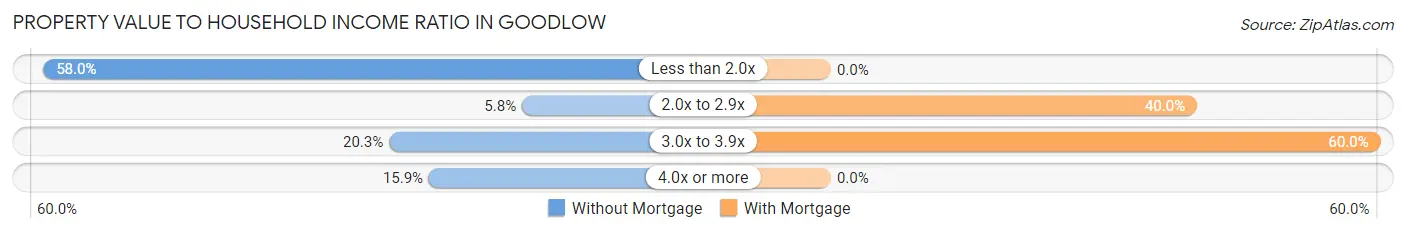
| Value-to-Income Ratio | Without Mortgage | With Mortgage |
| Less than 2.0x | 40 (58.0%) | 0 (0.0%) |
| 2.0x to 2.9x | 4 (5.8%) | 2 (40.0%) |
| 3.0x to 3.9x | 14 (20.3%) | 3 (60.0%) |
| 4.0x or more | 11 (15.9%) | 0 (0.0%) |
| Total | 69 (100.0%) | 5 (100.0%) |
Real Estate Taxes by Mortgage Status in Goodlow
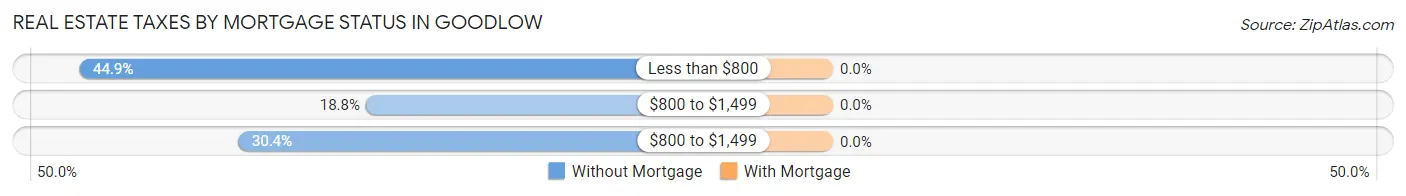
| Property Taxes | Without Mortgage | With Mortgage |
| Less than $800 | 31 (44.9%) | 0 (0.0%) |
| $800 to $1,499 | 13 (18.8%) | 0 (0.0%) |
| $800 to $1,499 | 21 (30.4%) | 0 (0.0%) |
| Total | 69 (100.0%) | 5 (100.0%) |
Health & Disability in Goodlow
Health Insurance Coverage by Age in Goodlow
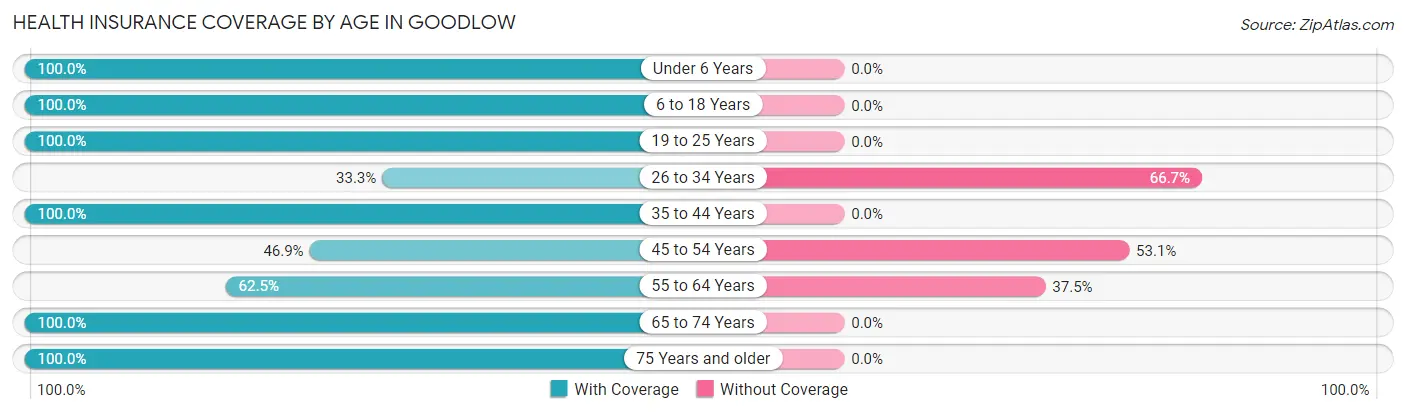
| Age Bracket | With Coverage | Without Coverage |
| Under 6 Years | 10 (100.0%) | 0 (0.0%) |
| 6 to 18 Years | 53 (100.0%) | 0 (0.0%) |
| 19 to 25 Years | 14 (100.0%) | 0 (0.0%) |
| 26 to 34 Years | 4 (33.3%) | 8 (66.7%) |
| 35 to 44 Years | 18 (100.0%) | 0 (0.0%) |
| 45 to 54 Years | 15 (46.9%) | 17 (53.1%) |
| 55 to 64 Years | 30 (62.5%) | 18 (37.5%) |
| 65 to 74 Years | 26 (100.0%) | 0 (0.0%) |
| 75 Years and older | 31 (100.0%) | 0 (0.0%) |
| Total | 201 (82.4%) | 43 (17.6%) |
Health Insurance Coverage by Citizenship Status in Goodlow
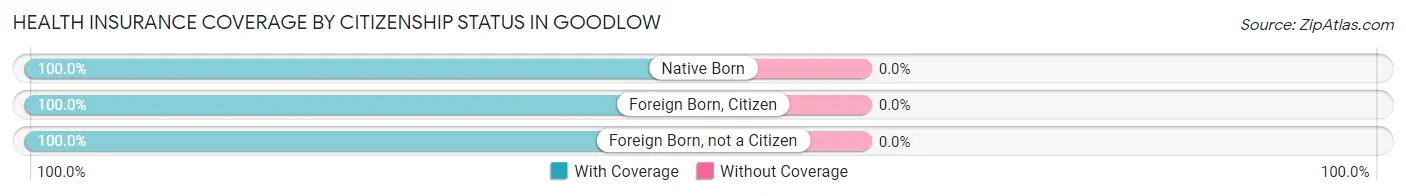
| Citizenship Status | With Coverage | Without Coverage |
| Native Born | 10 (100.0%) | 0 (0.0%) |
| Foreign Born, Citizen | 53 (100.0%) | 0 (0.0%) |
| Foreign Born, not a Citizen | 14 (100.0%) | 0 (0.0%) |
Health Insurance Coverage by Household Income in Goodlow
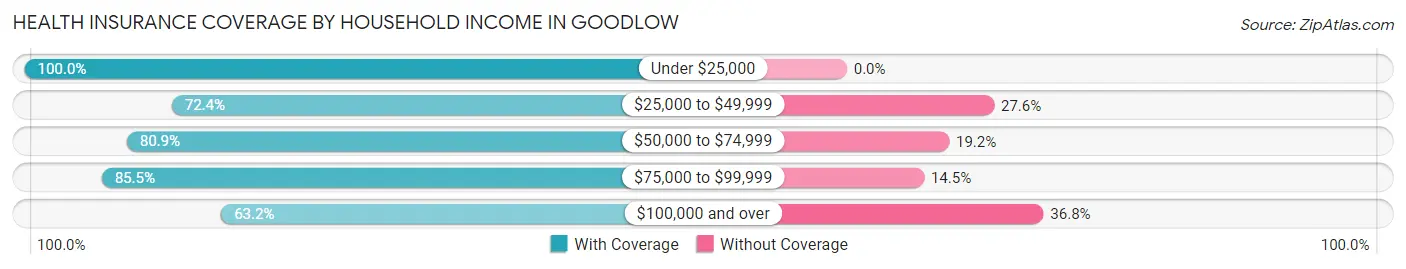
| Household Income | With Coverage | Without Coverage |
| Under $25,000 | 47 (100.0%) | 0 (0.0%) |
| $25,000 to $49,999 | 21 (72.4%) | 8 (27.6%) |
| $50,000 to $74,999 | 38 (80.8%) | 9 (19.2%) |
| $75,000 to $99,999 | 71 (85.5%) | 12 (14.5%) |
| $100,000 and over | 24 (63.2%) | 14 (36.8%) |
Public vs Private Health Insurance Coverage by Age in Goodlow
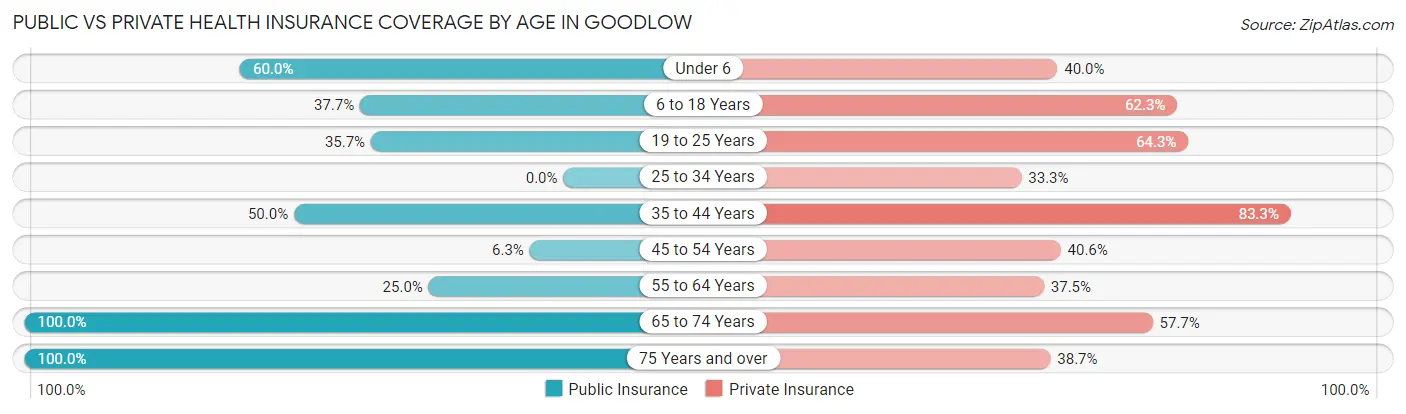
| Age Bracket | Public Insurance | Private Insurance |
| Under 6 | 6 (60.0%) | 4 (40.0%) |
| 6 to 18 Years | 20 (37.7%) | 33 (62.3%) |
| 19 to 25 Years | 5 (35.7%) | 9 (64.3%) |
| 25 to 34 Years | 0 (0.0%) | 4 (33.3%) |
| 35 to 44 Years | 9 (50.0%) | 15 (83.3%) |
| 45 to 54 Years | 2 (6.2%) | 13 (40.6%) |
| 55 to 64 Years | 12 (25.0%) | 18 (37.5%) |
| 65 to 74 Years | 26 (100.0%) | 15 (57.7%) |
| 75 Years and over | 31 (100.0%) | 12 (38.7%) |
| Total | 111 (45.5%) | 123 (50.4%) |
Disability Status by Sex by Age in Goodlow
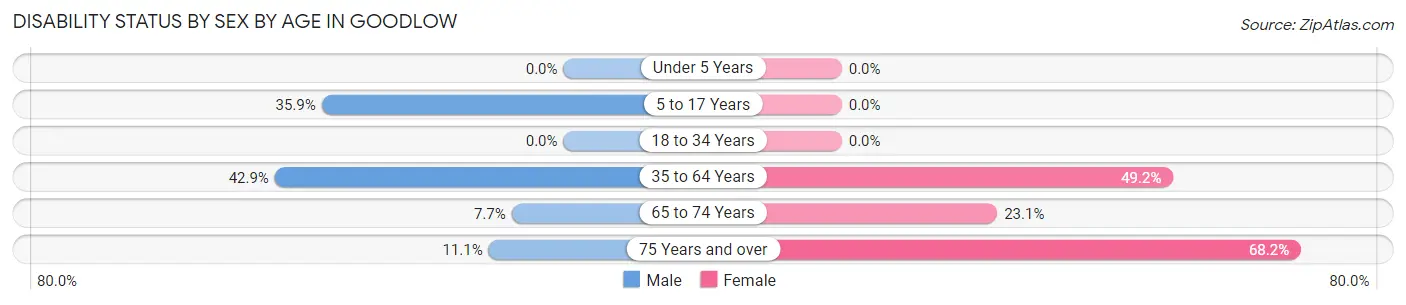
| Age Bracket | Male | Female |
| Under 5 Years | 0 (0.0%) | 0 (0.0%) |
| 5 to 17 Years | 14 (35.9%) | 0 (0.0%) |
| 18 to 34 Years | 0 (0.0%) | 0 (0.0%) |
| 35 to 64 Years | 15 (42.9%) | 31 (49.2%) |
| 65 to 74 Years | 1 (7.7%) | 3 (23.1%) |
| 75 Years and over | 1 (11.1%) | 15 (68.2%) |
Disability Class by Sex by Age in Goodlow
Disability Class: Hearing Difficulty
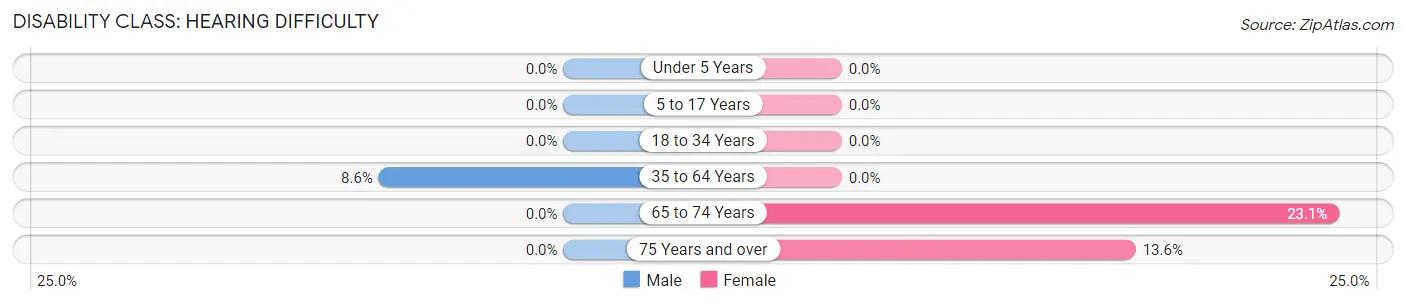
| Age Bracket | Male | Female |
| Under 5 Years | 0 (0.0%) | 0 (0.0%) |
| 5 to 17 Years | 0 (0.0%) | 0 (0.0%) |
| 18 to 34 Years | 0 (0.0%) | 0 (0.0%) |
| 35 to 64 Years | 3 (8.6%) | 0 (0.0%) |
| 65 to 74 Years | 0 (0.0%) | 3 (23.1%) |
| 75 Years and over | 0 (0.0%) | 3 (13.6%) |
Disability Class: Vision Difficulty
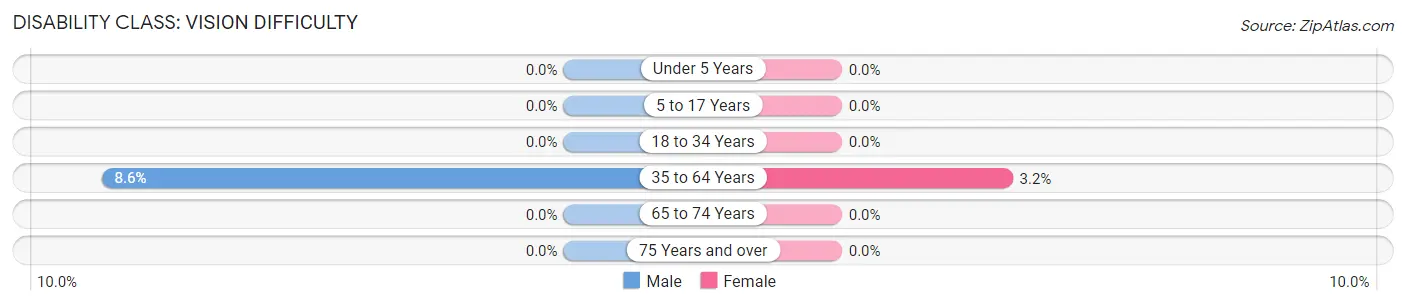
| Age Bracket | Male | Female |
| Under 5 Years | 0 (0.0%) | 0 (0.0%) |
| 5 to 17 Years | 0 (0.0%) | 0 (0.0%) |
| 18 to 34 Years | 0 (0.0%) | 0 (0.0%) |
| 35 to 64 Years | 3 (8.6%) | 2 (3.2%) |
| 65 to 74 Years | 0 (0.0%) | 0 (0.0%) |
| 75 Years and over | 0 (0.0%) | 0 (0.0%) |
Disability Class: Cognitive Difficulty
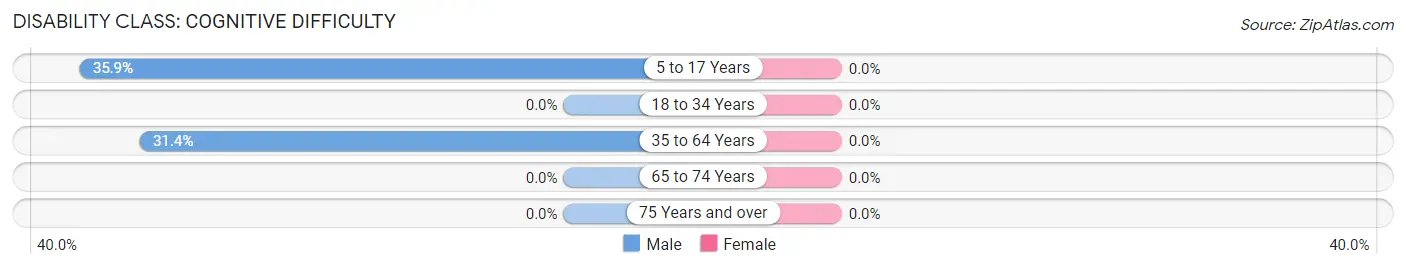
| Age Bracket | Male | Female |
| 5 to 17 Years | 14 (35.9%) | 0 (0.0%) |
| 18 to 34 Years | 0 (0.0%) | 0 (0.0%) |
| 35 to 64 Years | 11 (31.4%) | 0 (0.0%) |
| 65 to 74 Years | 0 (0.0%) | 0 (0.0%) |
| 75 Years and over | 0 (0.0%) | 0 (0.0%) |
Disability Class: Ambulatory Difficulty
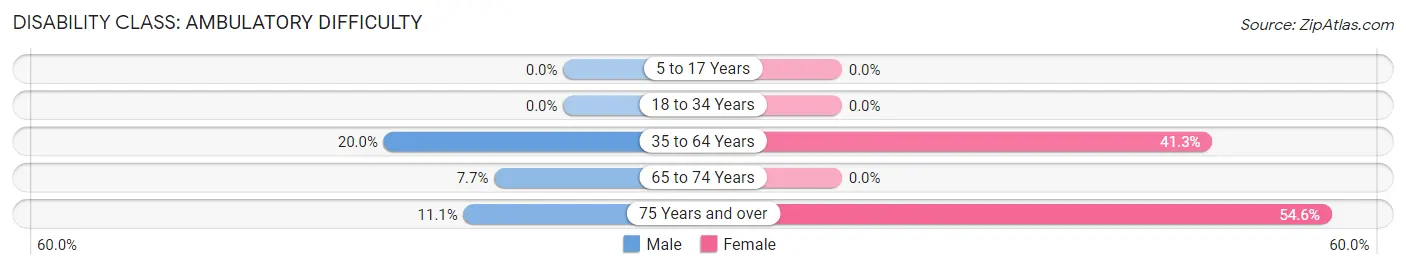
| Age Bracket | Male | Female |
| 5 to 17 Years | 0 (0.0%) | 0 (0.0%) |
| 18 to 34 Years | 0 (0.0%) | 0 (0.0%) |
| 35 to 64 Years | 7 (20.0%) | 26 (41.3%) |
| 65 to 74 Years | 1 (7.7%) | 0 (0.0%) |
| 75 Years and over | 1 (11.1%) | 12 (54.5%) |
Disability Class: Self-Care Difficulty
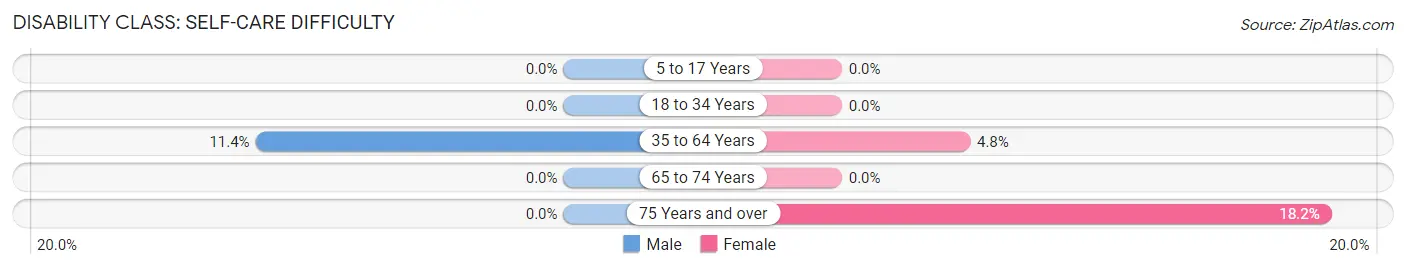
| Age Bracket | Male | Female |
| 5 to 17 Years | 0 (0.0%) | 0 (0.0%) |
| 18 to 34 Years | 0 (0.0%) | 0 (0.0%) |
| 35 to 64 Years | 4 (11.4%) | 3 (4.8%) |
| 65 to 74 Years | 0 (0.0%) | 0 (0.0%) |
| 75 Years and over | 0 (0.0%) | 4 (18.2%) |
Technology Access in Goodlow
Computing Device Access in Goodlow
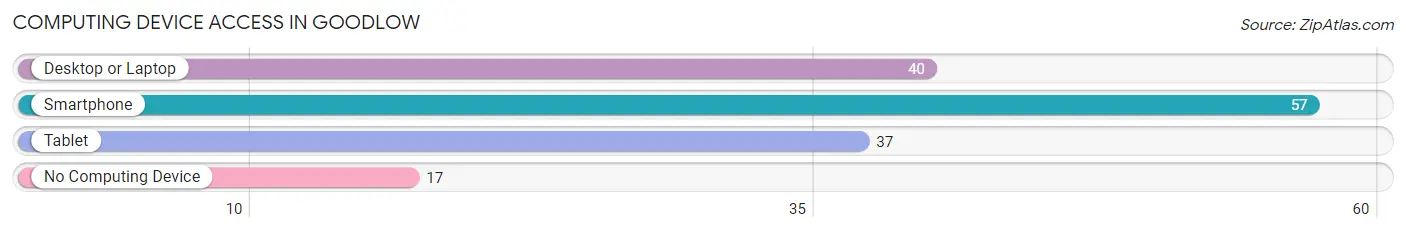
| Device Type | # Households | % Households |
| Desktop or Laptop | 40 | 49.4% |
| Smartphone | 57 | 70.4% |
| Tablet | 37 | 45.7% |
| No Computing Device | 17 | 21.0% |
| Total | 81 | 100.0% |
Internet Access in Goodlow
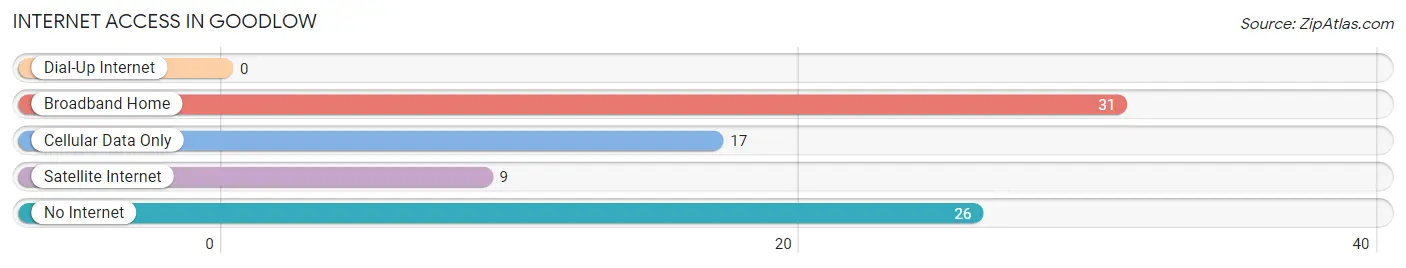
| Internet Type | # Households | % Households |
| Dial-Up Internet | 0 | 0.0% |
| Broadband Home | 31 | 38.3% |
| Cellular Data Only | 17 | 21.0% |
| Satellite Internet | 9 | 11.1% |
| No Internet | 26 | 32.1% |
| Total | 81 | 100.0% |
Goodlow Summary
Goodlow is a small town located in the state of Texas, in the United States. It is situated in the southeastern part of the state, in the county of Brazoria. The town has a population of just over 500 people, and is located about 30 miles south of Houston.
Goodlow was founded in 1891 by a group of settlers from the nearby town of Angleton. The town was named after the Goodlow family, who were among the first settlers. The town was originally a farming community, and the main crops grown were cotton, corn, and hay. The town also had a small sawmill, which provided lumber for the local area.
The town of Goodlow has a rich history and culture. The town was home to a number of prominent figures in the early days of Texas, including the first mayor of Angleton, William Goodlow. The town also has a number of historic buildings, including the Goodlow House, which was built in 1891 and is now a museum.
The geography of Goodlow is mostly flat, with some rolling hills in the area. The town is located in the coastal plains region of Texas, and is surrounded by a number of small towns and cities. The nearest major city is Houston, which is located about 30 miles to the north.
The economy of Goodlow is largely based on agriculture. The town is home to a number of farms, which produce a variety of crops, including cotton, corn, and hay. The town also has a number of small businesses, including a few restaurants and stores.
The demographics of Goodlow are largely made up of white Americans, with a small percentage of African Americans and Hispanics. The median household income in the town is around $30,000, and the median age is around 40 years old.
Goodlow is a small town with a rich history and culture. The town is home to a number of historic buildings, and is surrounded by a number of small towns and cities. The economy of the town is largely based on agriculture, and the demographics are largely made up of white Americans. The town is a great place to visit, and is a great place to call home.
Common Questions
What is the Total Population of Goodlow?
Total Population of Goodlow is 244.
What is the Total Male Population of Goodlow?
Total Male Population of Goodlow is 123.
What is the Total Female Population of Goodlow?
Total Female Population of Goodlow is 121.
What is the Ratio of Males per 100 Females in Goodlow?
There are 101.65 Males per 100 Females in Goodlow.
What is the Ratio of Females per 100 Males in Goodlow?
There are 98.37 Females per 100 Males in Goodlow.
What is the Median Population Age in Goodlow?
Median Population Age in Goodlow is 53.2 Years.
What is the Average Family Size in Goodlow
Average Family Size in Goodlow is 3.4 People.
What is the Average Household Size in Goodlow
Average Household Size in Goodlow is 3.0 People.
What is Per Capita Income in Goodlow?
Per Capita income in Goodlow is $22,007.
What is the Median Family Income in Goodlow?
Median Family Income in Goodlow is $69,028.
What is the Median Household income in Goodlow?
Median Household Income in Goodlow is $64,688.
What is Income or Wage Gap in Goodlow?
Income or Wage Gap in Goodlow is 64.0%.
Women in Goodlow earn 36.0 cents for every dollar earned by a man.
What is Family Income Deficit in Goodlow?
Family Income Deficit in Goodlow is $8,483.
Families that are below poverty line in Goodlow earn $8,483 less on average than the poverty threshold level.
What is Inequality or Gini Index in Goodlow?
Inequality or Gini Index in Goodlow is 0.40.
How Large is the Labor Force in Goodlow?
There are 80 People in the Labor Forcein in Goodlow.
What is the Percentage of People in the Labor Force in Goodlow?
43.0% of People are in the Labor Force in Goodlow.