Sonterra, TX
Sonterra Map
Sonterra Overview
8,082
TOTAL POPULATION
3,718
MALE POPULATION
4,364
FEMALE POPULATION
85.20
MALES / 100 FEMALES
117.37
FEMALES / 100 MALES
29.3
MEDIAN AGE
3.5
AVG FAMILY SIZE
3.0
AVG HOUSEHOLD SIZE
$31,475
PER CAPITA INCOME
$91,957
AVG FAMILY INCOME
$83,952
AVG HOUSEHOLD INCOME
23.4%
WAGE / INCOME GAP [ % ]
76.6¢/ $1
WAGE / INCOME GAP [ $ ]
$8,565
FAMILY INCOME DEFICIT
0.31
INEQUALITY / GINI INDEX
4,827
LABOR FORCE [ PEOPLE ]
79.9%
PERCENT IN LABOR FORCE
5.5%
UNEMPLOYMENT RATE
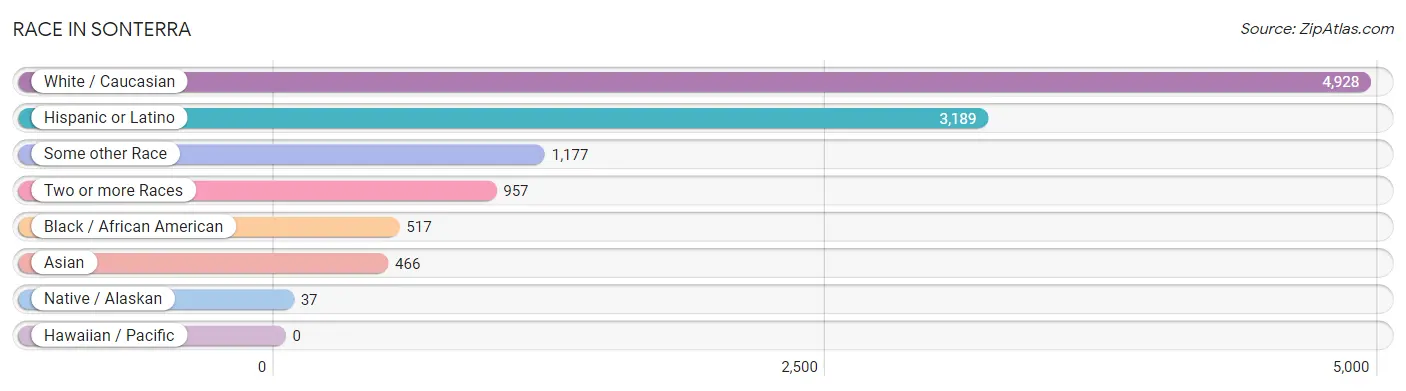
Race in Sonterra
The most populous races in Sonterra are White / Caucasian (4,928 | 61.0%), Hispanic or Latino (3,189 | 39.5%), and Some other Race (1,177 | 14.6%).
| Race | # Population | % Population |
| Asian | 466 | 5.8% |
| Black / African American | 517 | 6.4% |
| Hawaiian / Pacific | 0 | 0.0% |
| Hispanic or Latino | 3,189 | 39.5% |
| Native / Alaskan | 37 | 0.5% |
| White / Caucasian | 4,928 | 61.0% |
| Two or more Races | 957 | 11.8% |
| Some other Race | 1,177 | 14.6% |
| Total | 8,082 | 100.0% |
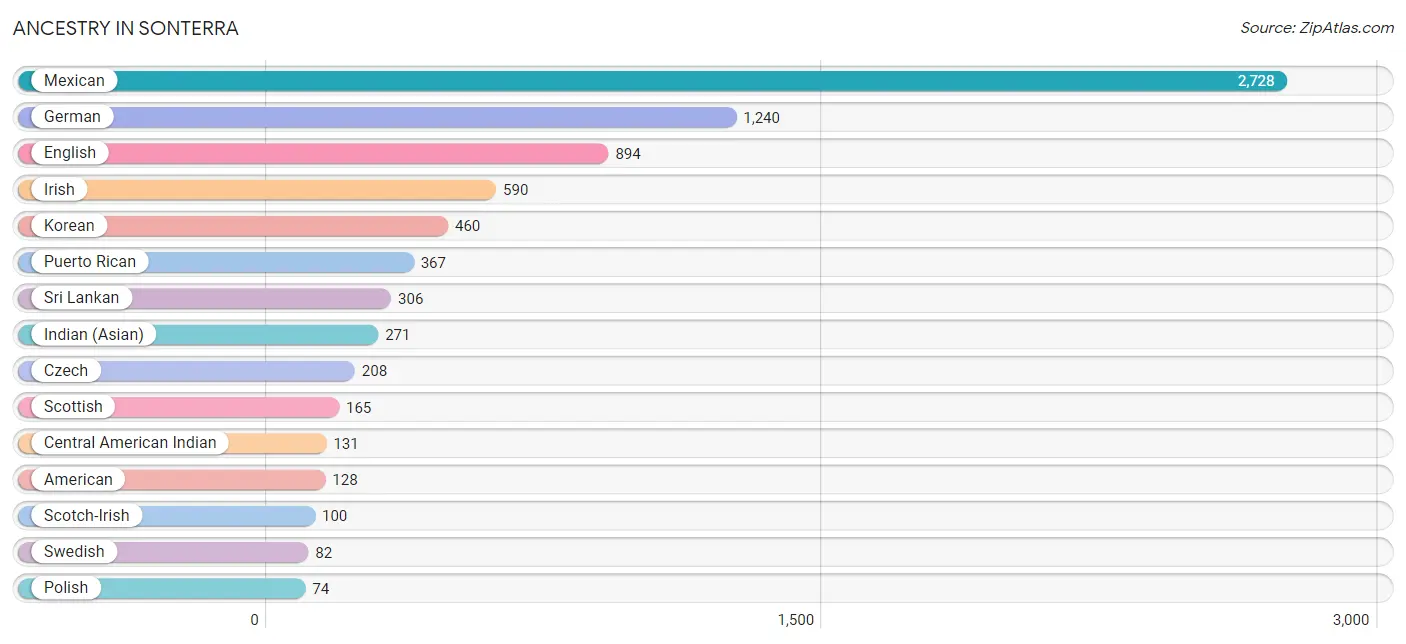
Ancestry in Sonterra
The most populous ancestries reported in Sonterra are Mexican (2,728 | 33.8%), German (1,240 | 15.3%), English (894 | 11.1%), Irish (590 | 7.3%), and Korean (460 | 5.7%), together accounting for 73.1% of all Sonterra residents.
| Ancestry | # Population | % Population |
| American | 128 | 1.6% |
| Apache | 32 | 0.4% |
| British | 31 | 0.4% |
| Canadian | 17 | 0.2% |
| Central American | 49 | 0.6% |
| Central American Indian | 131 | 1.6% |
| Cherokee | 47 | 0.6% |
| Choctaw | 13 | 0.2% |
| Colombian | 24 | 0.3% |
| Czech | 208 | 2.6% |
| English | 894 | 11.1% |
| European | 46 | 0.6% |
| French | 51 | 0.6% |
| French Canadian | 3 | 0.0% |
| German | 1,240 | 15.3% |
| Guatemalan | 49 | 0.6% |
| Hungarian | 41 | 0.5% |
| Indian (Asian) | 271 | 3.4% |
| Irish | 590 | 7.3% |
| Italian | 26 | 0.3% |
| Korean | 460 | 5.7% |
| Malaysian | 6 | 0.1% |
| Mexican | 2,728 | 33.8% |
| Nigerian | 52 | 0.6% |
| Norwegian | 33 | 0.4% |
| Polish | 74 | 0.9% |
| Portuguese | 13 | 0.2% |
| Puerto Rican | 367 | 4.5% |
| Russian | 12 | 0.2% |
| Scotch-Irish | 100 | 1.2% |
| Scottish | 165 | 2.0% |
| Slavic | 19 | 0.2% |
| South American | 24 | 0.3% |
| Sri Lankan | 306 | 3.8% |
| Subsaharan African | 52 | 0.6% |
| Swedish | 82 | 1.0% |
| Swiss | 28 | 0.4% |
| Trinidadian and Tobagonian | 18 | 0.2% |
| Welsh | 16 | 0.2% | View All 39 Rows |
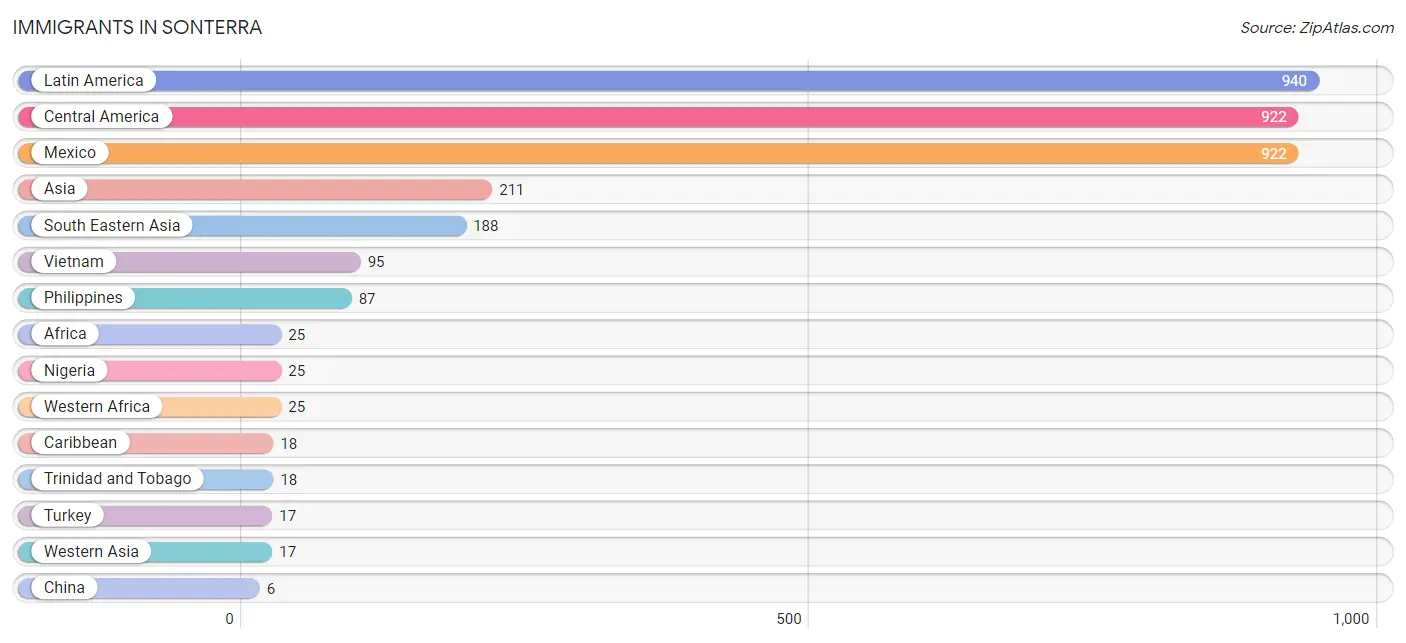
Immigrants in Sonterra
The most numerous immigrant groups reported in Sonterra came from Latin America (940 | 11.6%), Central America (922 | 11.4%), Mexico (922 | 11.4%), Asia (211 | 2.6%), and South Eastern Asia (188 | 2.3%), together accounting for 39.4% of all Sonterra residents.
| Immigration Origin | # Population | % Population |
| Africa | 25 | 0.3% |
| Asia | 211 | 2.6% |
| Canada | 3 | 0.0% |
| Caribbean | 18 | 0.2% |
| Central America | 922 | 11.4% |
| China | 6 | 0.1% |
| Eastern Asia | 6 | 0.1% |
| Laos | 6 | 0.1% |
| Latin America | 940 | 11.6% |
| Mexico | 922 | 11.4% |
| Nigeria | 25 | 0.3% |
| Philippines | 87 | 1.1% |
| South Eastern Asia | 188 | 2.3% |
| Taiwan | 6 | 0.1% |
| Trinidad and Tobago | 18 | 0.2% |
| Turkey | 17 | 0.2% |
| Vietnam | 95 | 1.2% |
| Western Africa | 25 | 0.3% |
| Western Asia | 17 | 0.2% | View All 19 Rows |
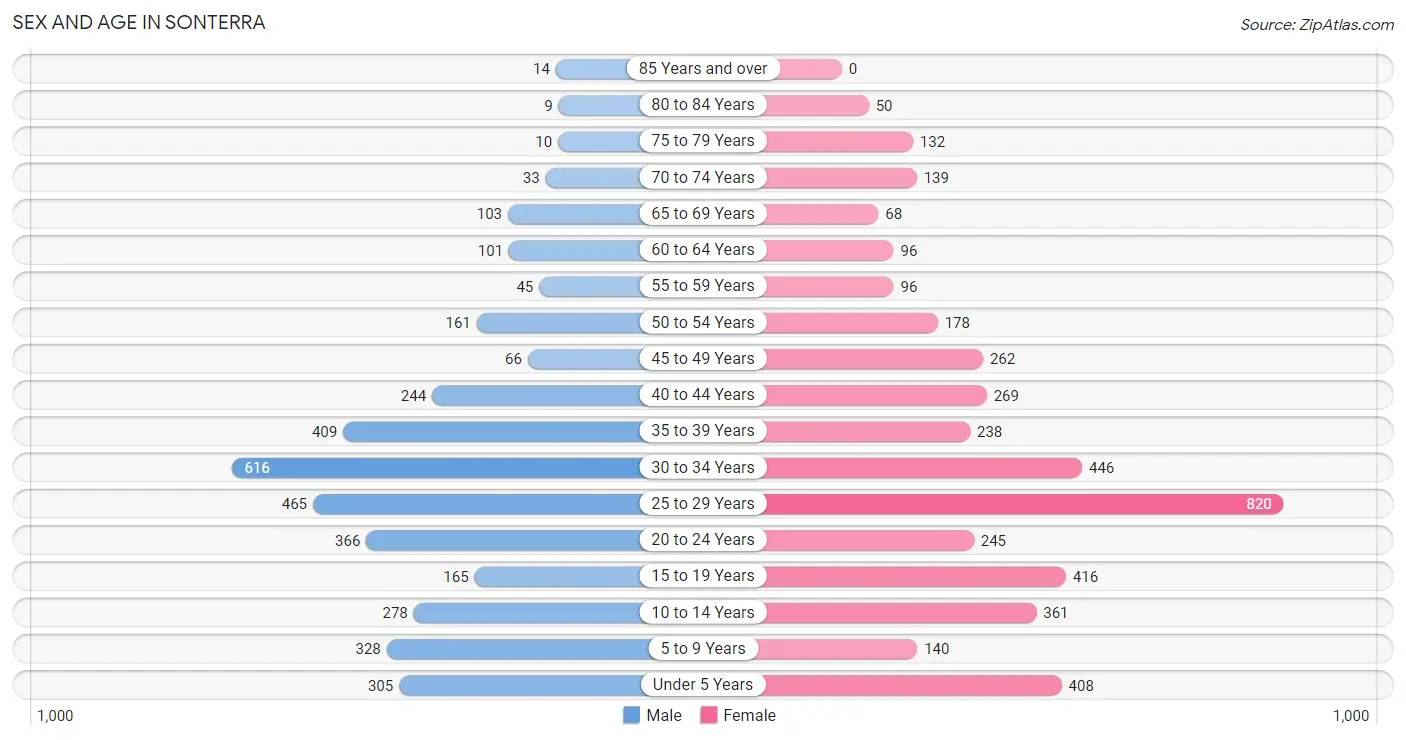
Sex and Age in Sonterra
Sex and Age in Sonterra
The most populous age groups in Sonterra are 30 to 34 Years (616 | 16.6%) for men and 25 to 29 Years (820 | 18.8%) for women.
| Age Bracket | Male | Female |
| Under 5 Years | 305 (8.2%) | 408 (9.3%) |
| 5 to 9 Years | 328 (8.8%) | 140 (3.2%) |
| 10 to 14 Years | 278 (7.5%) | 361 (8.3%) |
| 15 to 19 Years | 165 (4.4%) | 416 (9.5%) |
| 20 to 24 Years | 366 (9.8%) | 245 (5.6%) |
| 25 to 29 Years | 465 (12.5%) | 820 (18.8%) |
| 30 to 34 Years | 616 (16.6%) | 446 (10.2%) |
| 35 to 39 Years | 409 (11.0%) | 238 (5.4%) |
| 40 to 44 Years | 244 (6.6%) | 269 (6.2%) |
| 45 to 49 Years | 66 (1.8%) | 262 (6.0%) |
| 50 to 54 Years | 161 (4.3%) | 178 (4.1%) |
| 55 to 59 Years | 45 (1.2%) | 96 (2.2%) |
| 60 to 64 Years | 101 (2.7%) | 96 (2.2%) |
| 65 to 69 Years | 103 (2.8%) | 68 (1.6%) |
| 70 to 74 Years | 33 (0.9%) | 139 (3.2%) |
| 75 to 79 Years | 10 (0.3%) | 132 (3.0%) |
| 80 to 84 Years | 9 (0.2%) | 50 (1.1%) |
| 85 Years and over | 14 (0.4%) | 0 (0.0%) |
| Total | 3,718 (100.0%) | 4,364 (100.0%) |
Families and Households in Sonterra
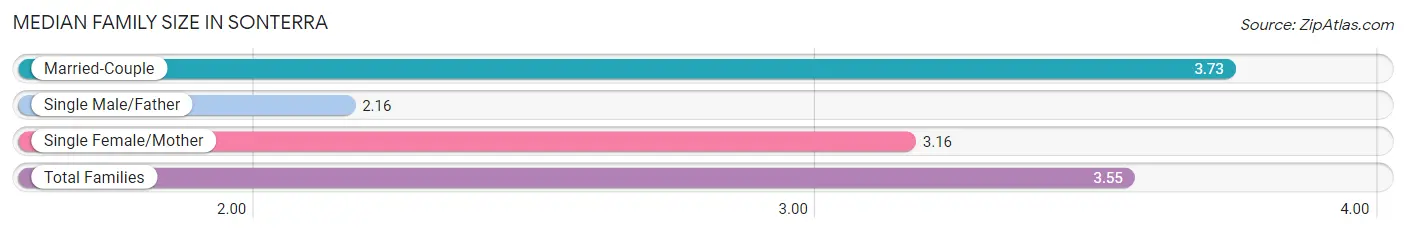
Median Family Size in Sonterra
The median family size in Sonterra is 3.55 persons per family, with married-couple families (1,312 | 69.6%) accounting for the largest median family size of 3.73 persons per family. On the other hand, single male/father families (19 | 1.0%) represent the smallest median family size with 2.16 persons per family.
| Family Type | # Families | Family Size |
| Married-Couple | 1,312 (69.6%) | 3.73 |
| Single Male/Father | 19 (1.0%) | 2.16 |
| Single Female/Mother | 553 (29.3%) | 3.16 |
| Total Families | 1,884 (100.0%) | 3.55 |
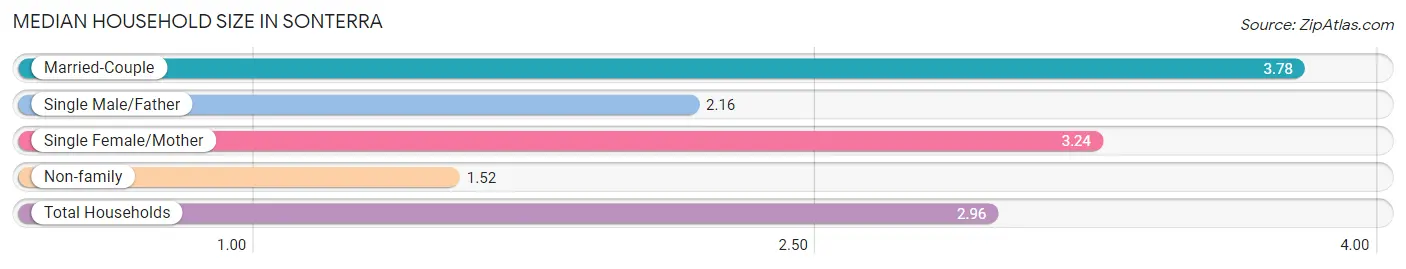
Median Household Size in Sonterra
The median household size in Sonterra is 2.96 persons per household, with married-couple households (1,312 | 48.0%) accounting for the largest median household size of 3.78 persons per household. non-family households (848 | 31.0%) represent the smallest median household size with 1.52 persons per household.
| Household Type | # Households | Household Size |
| Married-Couple | 1,312 (48.0%) | 3.78 |
| Single Male/Father | 19 (0.7%) | 2.16 |
| Single Female/Mother | 553 (20.2%) | 3.24 |
| Non-family | 848 (31.0%) | 1.52 |
| Total Households | 2,732 (100.0%) | 2.96 |
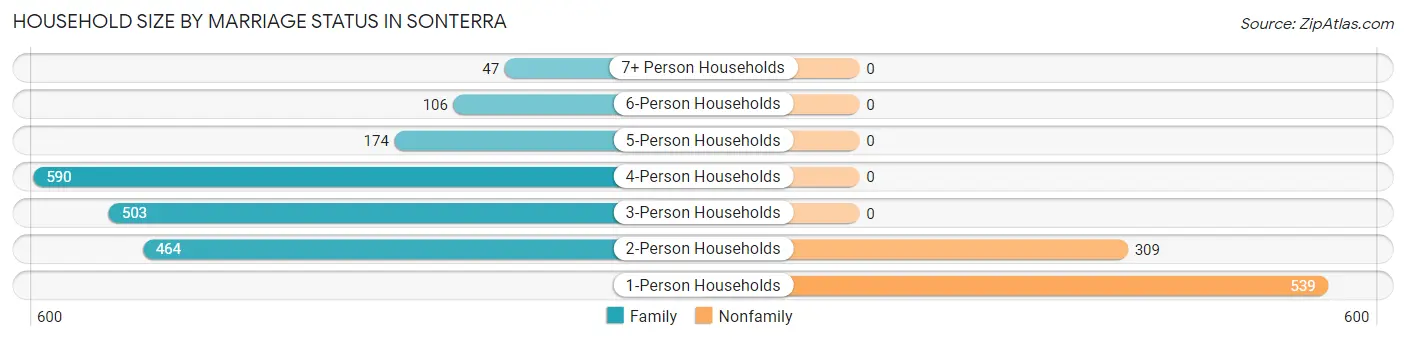
Household Size by Marriage Status in Sonterra
Out of a total of 2,732 households in Sonterra, 1,884 (69.0%) are family households, while 848 (31.0%) are nonfamily households. The most numerous type of family households are 4-person households, comprising 590, and the most common type of nonfamily households are 1-person households, comprising 539.
| Household Size | Family Households | Nonfamily Households |
| 1-Person Households | - | 539 (19.7%) |
| 2-Person Households | 464 (17.0%) | 309 (11.3%) |
| 3-Person Households | 503 (18.4%) | 0 (0.0%) |
| 4-Person Households | 590 (21.6%) | 0 (0.0%) |
| 5-Person Households | 174 (6.4%) | 0 (0.0%) |
| 6-Person Households | 106 (3.9%) | 0 (0.0%) |
| 7+ Person Households | 47 (1.7%) | 0 (0.0%) |
| Total | 1,884 (69.0%) | 848 (31.0%) |
Female Fertility in Sonterra
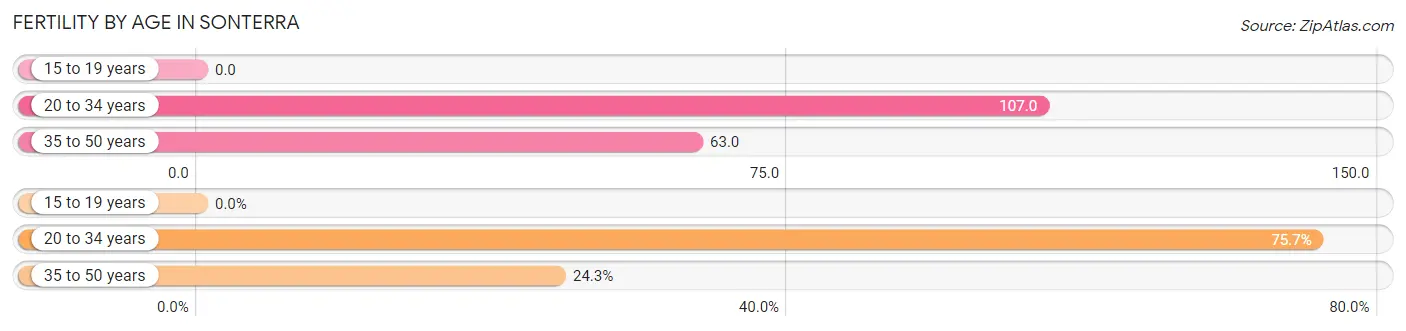
Fertility by Age in Sonterra
Average fertility rate in Sonterra is 78.0 births per 1,000 women. Women in the age bracket of 20 to 34 years have the highest fertility rate with 107.0 births per 1,000 women. Women in the age bracket of 20 to 34 years acount for 75.7% of all women with births.
| Age Bracket | Women with Births | Births / 1,000 Women |
| 15 to 19 years | 0 (0.0%) | 0.0 |
| 20 to 34 years | 162 (75.7%) | 107.0 |
| 35 to 50 years | 52 (24.3%) | 63.0 |
| Total | 214 (100.0%) | 78.0 |
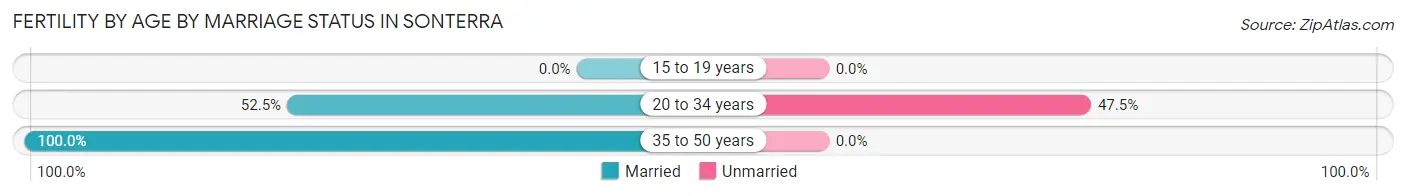
Fertility by Age by Marriage Status in Sonterra
64.0% of women with births (214) in Sonterra are married. The highest percentage of unmarried women with births falls into 20 to 34 years age bracket with 47.5% of them unmarried at the time of birth, while the lowest percentage of unmarried women with births belong to 35 to 50 years age bracket with 0.0% of them unmarried.
| Age Bracket | Married | Unmarried |
| 15 to 19 years | 0 (0.0%) | 0 (0.0%) |
| 20 to 34 years | 85 (52.5%) | 77 (47.5%) |
| 35 to 50 years | 52 (100.0%) | 0 (0.0%) |
| Total | 137 (64.0%) | 77 (36.0%) |
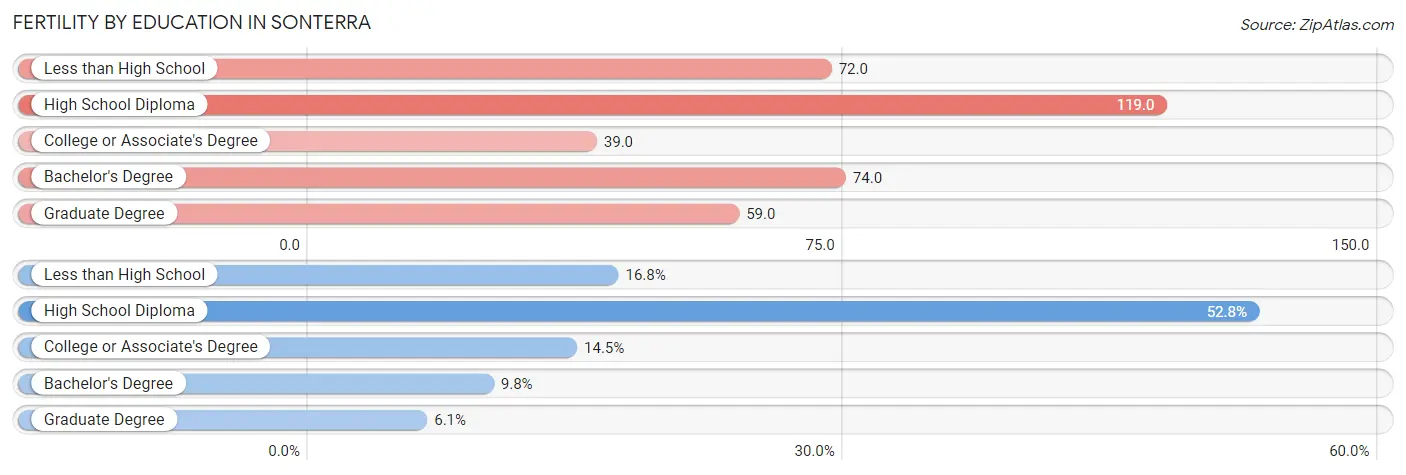
Fertility by Education in Sonterra
Average fertility rate in Sonterra is 78.0 births per 1,000 women. Women with the education attainment of high school diploma have the highest fertility rate of 119.0 births per 1,000 women, while women with the education attainment of college or associate's degree have the lowest fertility at 39.0 births per 1,000 women. Women with the education attainment of high school diploma represent 52.8% of all women with births.
| Educational Attainment | Women with Births | Births / 1,000 Women |
| Less than High School | 36 (16.8%) | 72.0 |
| High School Diploma | 113 (52.8%) | 119.0 |
| College or Associate's Degree | 31 (14.5%) | 39.0 |
| Bachelor's Degree | 21 (9.8%) | 74.0 |
| Graduate Degree | 13 (6.1%) | 59.0 |
| Total | 214 (100.0%) | 78.0 |
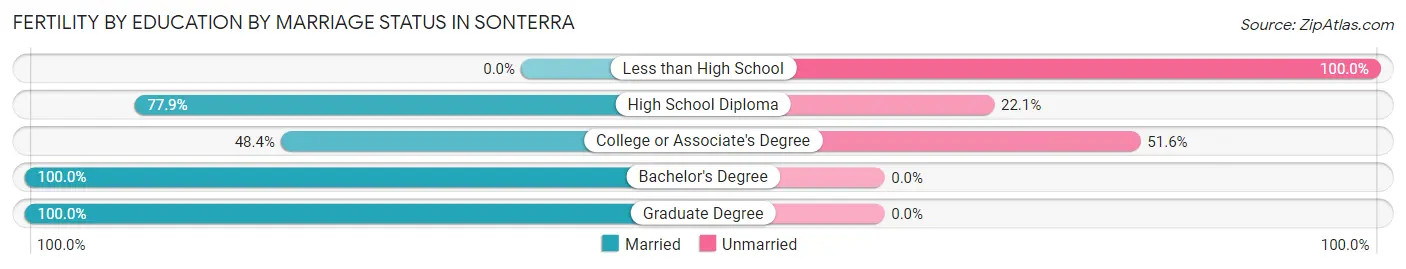
Fertility by Education by Marriage Status in Sonterra
36.0% of women with births in Sonterra are unmarried. Women with the educational attainment of bachelor's degree are most likely to be married with 100.0% of them married at childbirth, while women with the educational attainment of less than high school are least likely to be married with 100.0% of them unmarried at childbirth.
| Educational Attainment | Married | Unmarried |
| Less than High School | 0 (0.0%) | 36 (100.0%) |
| High School Diploma | 88 (77.9%) | 25 (22.1%) |
| College or Associate's Degree | 15 (48.4%) | 16 (51.6%) |
| Bachelor's Degree | 21 (100.0%) | 0 (0.0%) |
| Graduate Degree | 13 (100.0%) | 0 (0.0%) |
| Total | 137 (64.0%) | 77 (36.0%) |
Income in Sonterra
Income Overview in Sonterra
Per Capita Income in Sonterra is $31,475, while median incomes of families and households are $91,957 and $83,952 respectively.
| Characteristic | Number | Measure |
| Per Capita Income | 8,082 | $31,475 |
| Median Family Income | 1,884 | $91,957 |
| Mean Family Income | 1,884 | $90,107 |
| Median Household Income | 2,732 | $83,952 |
| Mean Household Income | 2,732 | $87,829 |
| Income Deficit | 1,884 | $8,565 |
| Wage / Income Gap (%) | 8,082 | 23.43% |
| Wage / Income Gap ($) | 8,082 | 76.57¢ per $1 |
| Gini / Inequality Index | 8,082 | 0.31 |
Earnings by Sex in Sonterra
Average Earnings in Sonterra are $40,333, $49,600 for men and $37,981 for women, a difference of 23.4%.
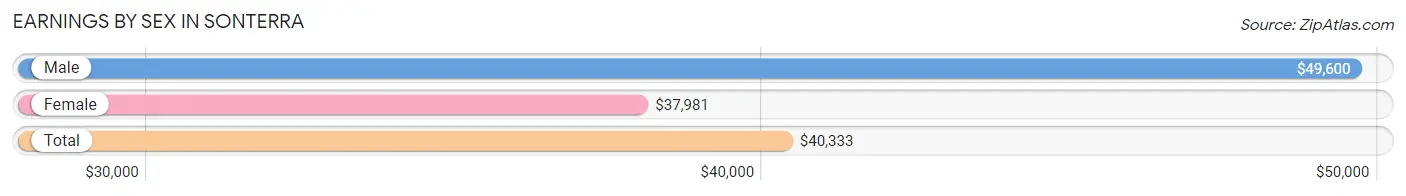
| Sex | Number | Average Earnings |
| Male | 2,414 (49.3%) | $49,600 |
| Female | 2,484 (50.7%) | $37,981 |
| Total | 4,898 (100.0%) | $40,333 |
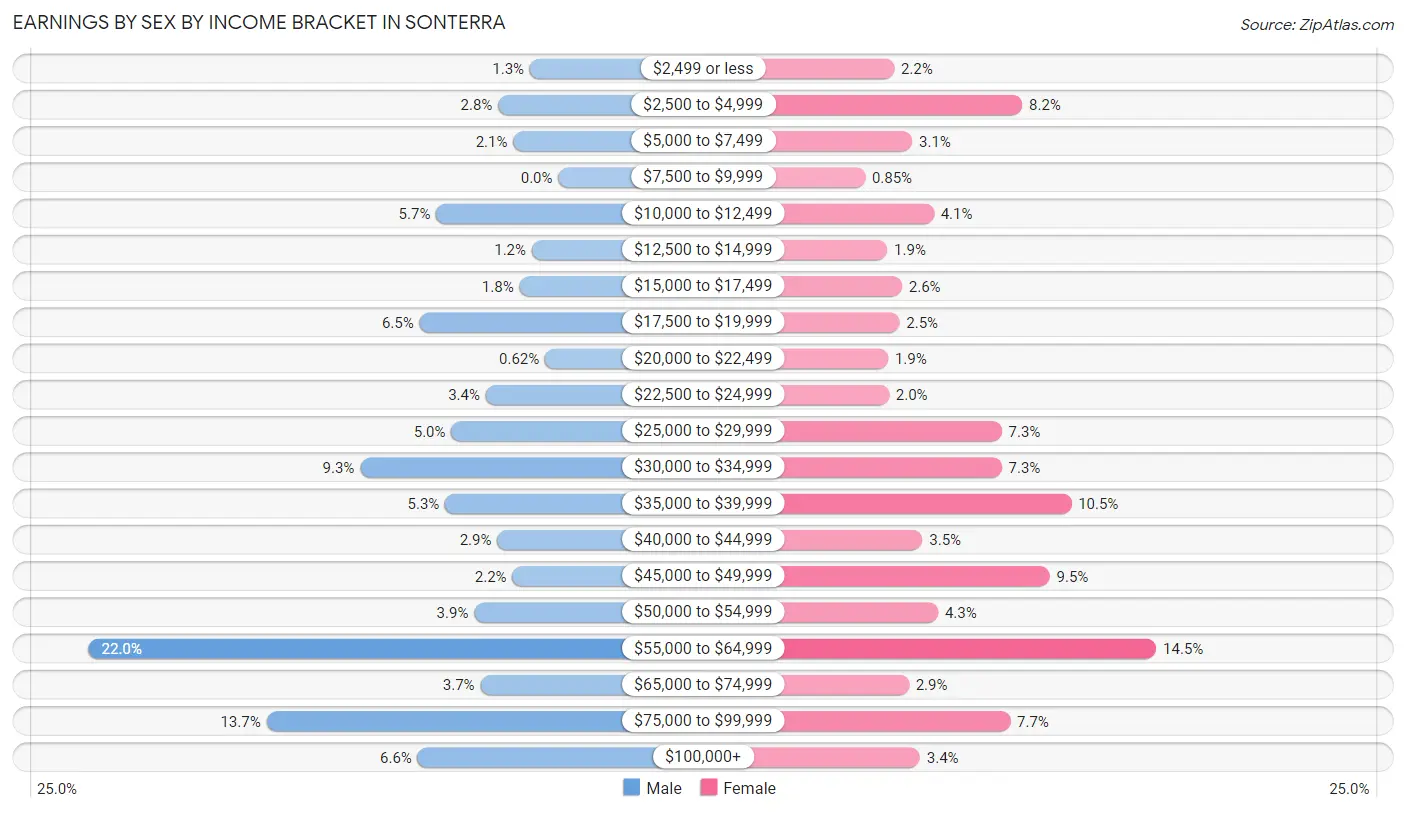
Earnings by Sex by Income Bracket in Sonterra
The most common earnings brackets in Sonterra are $55,000 to $64,999 for men (531 | 22.0%) and $55,000 to $64,999 for women (360 | 14.5%).
| Income | Male | Female |
| $2,499 or less | 32 (1.3%) | 55 (2.2%) |
| $2,500 to $4,999 | 68 (2.8%) | 204 (8.2%) |
| $5,000 to $7,499 | 51 (2.1%) | 76 (3.1%) |
| $7,500 to $9,999 | 0 (0.0%) | 21 (0.9%) |
| $10,000 to $12,499 | 138 (5.7%) | 101 (4.1%) |
| $12,500 to $14,999 | 30 (1.2%) | 47 (1.9%) |
| $15,000 to $17,499 | 44 (1.8%) | 64 (2.6%) |
| $17,500 to $19,999 | 157 (6.5%) | 61 (2.5%) |
| $20,000 to $22,499 | 15 (0.6%) | 48 (1.9%) |
| $22,500 to $24,999 | 82 (3.4%) | 49 (2.0%) |
| $25,000 to $29,999 | 121 (5.0%) | 180 (7.2%) |
| $30,000 to $34,999 | 224 (9.3%) | 180 (7.2%) |
| $35,000 to $39,999 | 128 (5.3%) | 261 (10.5%) |
| $40,000 to $44,999 | 69 (2.9%) | 88 (3.5%) |
| $45,000 to $49,999 | 52 (2.1%) | 236 (9.5%) |
| $50,000 to $54,999 | 95 (3.9%) | 106 (4.3%) |
| $55,000 to $64,999 | 531 (22.0%) | 360 (14.5%) |
| $65,000 to $74,999 | 88 (3.6%) | 72 (2.9%) |
| $75,000 to $99,999 | 330 (13.7%) | 190 (7.6%) |
| $100,000+ | 159 (6.6%) | 85 (3.4%) |
| Total | 2,414 (100.0%) | 2,484 (100.0%) |
Earnings by Sex by Educational Attainment in Sonterra
Average earnings in Sonterra are $55,684 for men and $45,311 for women, a difference of 18.6%. Men with an educational attainment of college or associate's degree enjoy the highest average annual earnings of $63,545, while those with high school diploma education earn the least with $38,086. Women with an educational attainment of graduate degree earn the most with the average annual earnings of $59,886, while those with high school diploma education have the smallest earnings of $37,917.
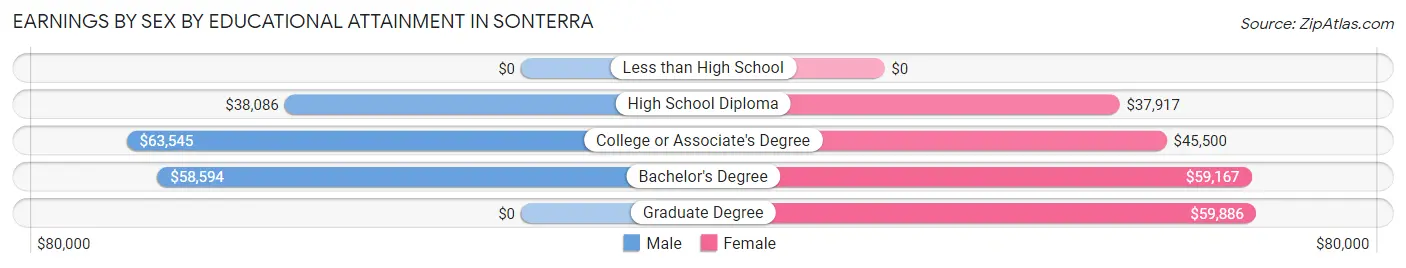
| Educational Attainment | Male Income | Female Income |
| Less than High School | - | - |
| High School Diploma | $38,086 | $37,917 |
| College or Associate's Degree | $63,545 | $45,500 |
| Bachelor's Degree | $58,594 | $59,167 |
| Graduate Degree | - | - |
| Total | $55,684 | $45,311 |
Family Income in Sonterra
Family Income Brackets in Sonterra
According to the Sonterra family income data, there are 654 families falling into the $100,000 to $149,999 income range, which is the most common income bracket and makes up 34.7% of all families. Conversely, the $200,000+ income bracket is the least frequent group with only 13 families (0.7%) belonging to this category.
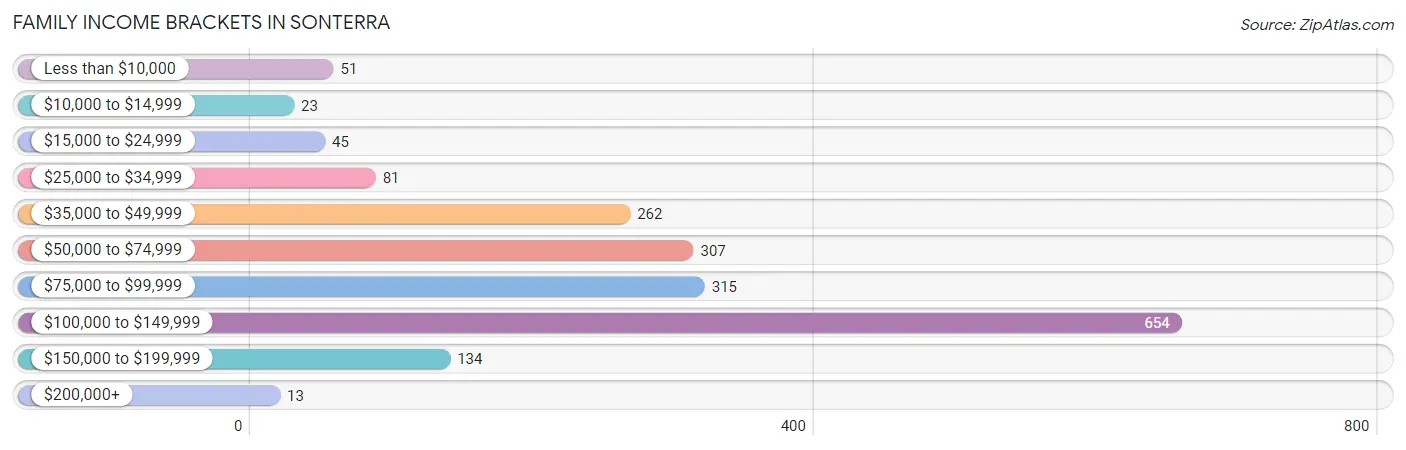
| Income Bracket | # Families | % Families |
| Less than $10,000 | 51 | 2.7% |
| $10,000 to $14,999 | 23 | 1.2% |
| $15,000 to $24,999 | 45 | 2.4% |
| $25,000 to $34,999 | 81 | 4.3% |
| $35,000 to $49,999 | 262 | 13.9% |
| $50,000 to $74,999 | 307 | 16.3% |
| $75,000 to $99,999 | 315 | 16.7% |
| $100,000 to $149,999 | 654 | 34.7% |
| $150,000 to $199,999 | 134 | 7.1% |
| $200,000+ | 13 | 0.7% |
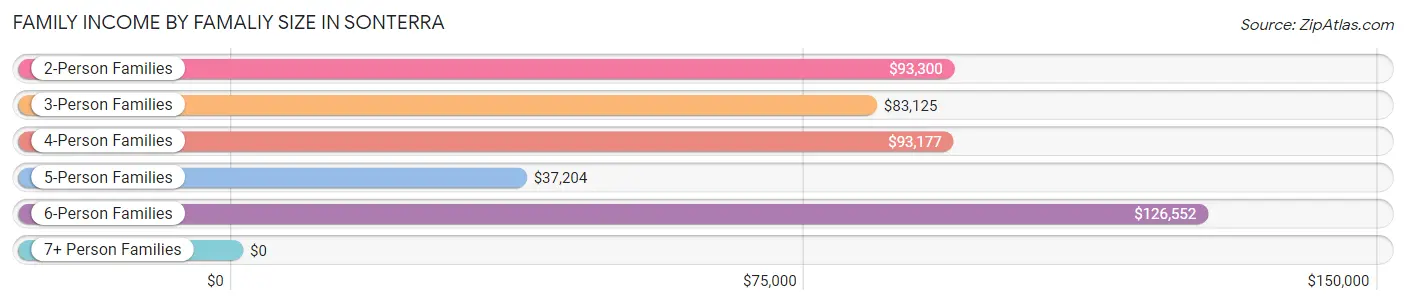
Family Income by Famaliy Size in Sonterra
6-person families (106 | 5.6%) account for the highest median family income in Sonterra with $126,552 per family, while 2-person families (464 | 24.6%) have the highest median income of $46,650 per family member.
| Income Bracket | # Families | Median Income |
| 2-Person Families | 464 (24.6%) | $93,300 |
| 3-Person Families | 528 (28.0%) | $83,125 |
| 4-Person Families | 630 (33.4%) | $93,177 |
| 5-Person Families | 109 (5.8%) | $37,204 |
| 6-Person Families | 106 (5.6%) | $126,552 |
| 7+ Person Families | 47 (2.5%) | $0 |
| Total | 1,884 (100.0%) | $91,957 |
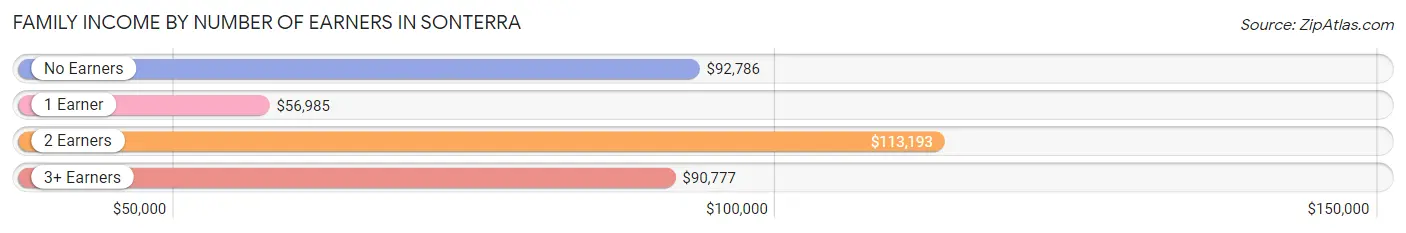
Family Income by Number of Earners in Sonterra
The median family income in Sonterra is $91,957, with families comprising 2 earners (1,016) having the highest median family income of $113,193, while families with 1 earner (480) have the lowest median family income of $56,985, accounting for 53.9% and 25.5% of families, respectively.
| Number of Earners | # Families | Median Income |
| No Earners | 85 (4.5%) | $92,786 |
| 1 Earner | 480 (25.5%) | $56,985 |
| 2 Earners | 1,016 (53.9%) | $113,193 |
| 3+ Earners | 303 (16.1%) | $90,777 |
| Total | 1,884 (100.0%) | $91,957 |
Household Income in Sonterra
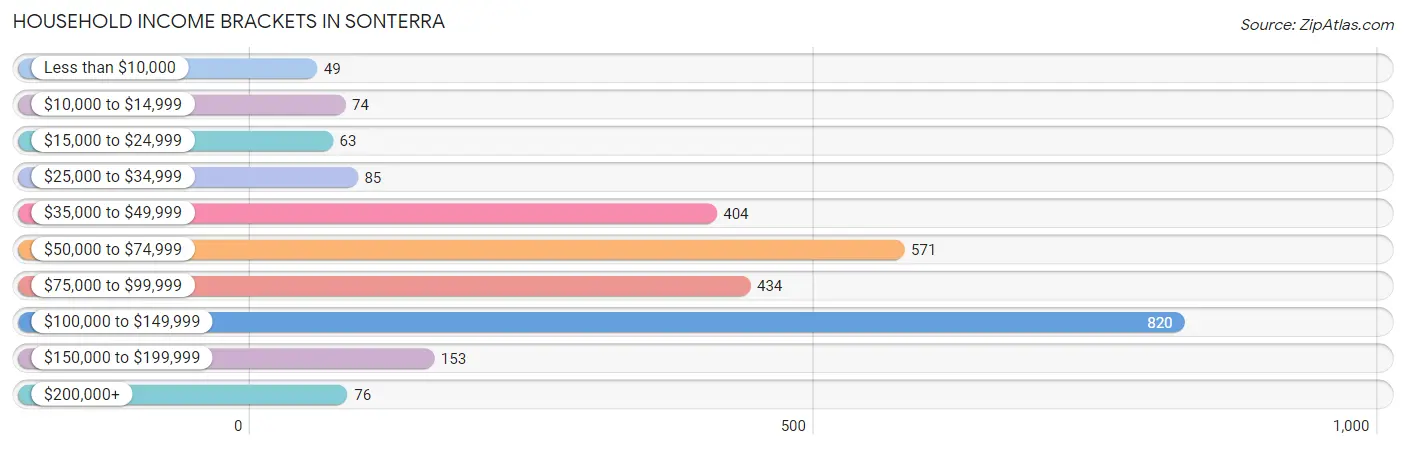
Household Income Brackets in Sonterra
With 820 households falling in the category, the $100,000 to $149,999 income range is the most frequent in Sonterra, accounting for 30.0% of all households. In contrast, only 49 households (1.8%) fall into the less than $10,000 income bracket, making it the least populous group.
| Income Bracket | # Households | % Households |
| Less than $10,000 | 49 | 1.8% |
| $10,000 to $14,999 | 74 | 2.7% |
| $15,000 to $24,999 | 63 | 2.3% |
| $25,000 to $34,999 | 85 | 3.1% |
| $35,000 to $49,999 | 404 | 14.8% |
| $50,000 to $74,999 | 571 | 20.9% |
| $75,000 to $99,999 | 434 | 15.9% |
| $100,000 to $149,999 | 820 | 30.0% |
| $150,000 to $199,999 | 153 | 5.6% |
| $200,000+ | 76 | 2.8% |
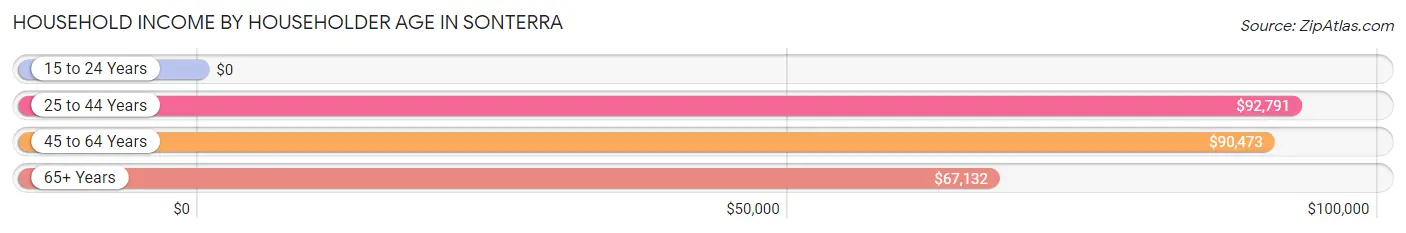
Household Income by Householder Age in Sonterra
The median household income in Sonterra is $83,952, with the highest median household income of $92,791 found in the 25 to 44 years age bracket for the primary householder. A total of 1,652 households (60.5%) fall into this category. Meanwhile, the 15 to 24 years age bracket for the primary householder has the lowest median household income of $0, with 79 households (2.9%) in this group.
| Income Bracket | # Households | Median Income |
| 15 to 24 Years | 79 (2.9%) | $0 |
| 25 to 44 Years | 1,652 (60.5%) | $92,791 |
| 45 to 64 Years | 612 (22.4%) | $90,473 |
| 65+ Years | 389 (14.2%) | $67,132 |
| Total | 2,732 (100.0%) | $83,952 |
Poverty in Sonterra
Income Below Poverty by Sex and Age in Sonterra
With 10.3% poverty level for males and 10.8% for females among the residents of Sonterra, 15 year old males and 55 to 64 year old females are the most vulnerable to poverty, with 16 males (45.7%) and 44 females (22.9%) in their respective age groups living below the poverty level.
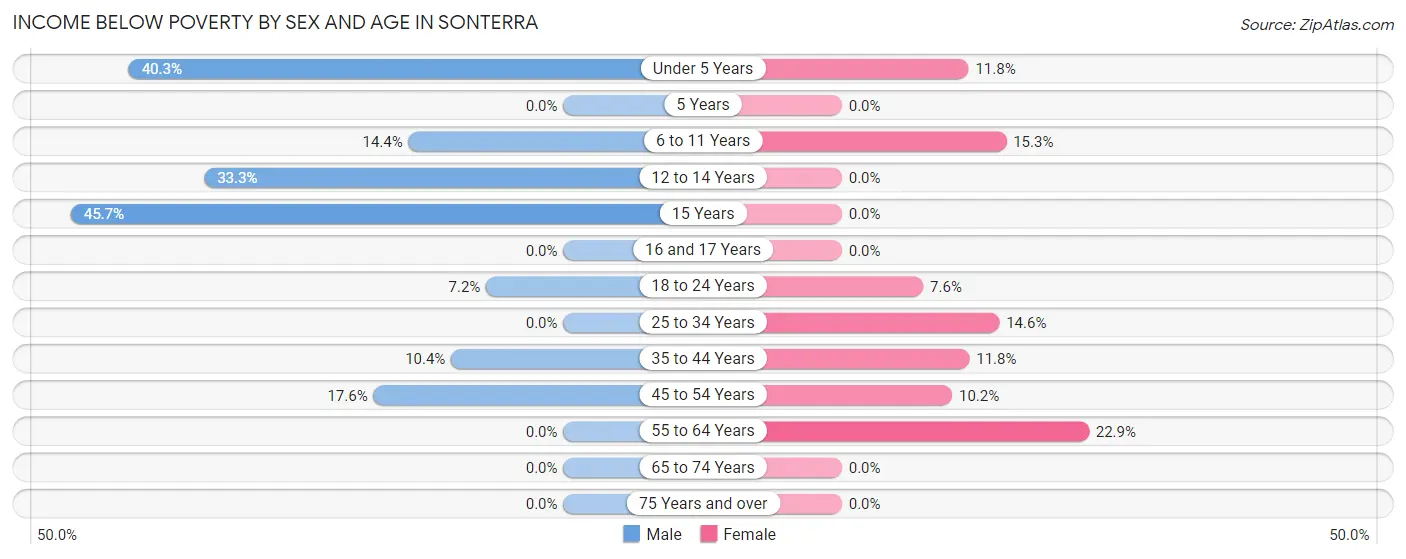
| Age Bracket | Male | Female |
| Under 5 Years | 123 (40.3%) | 48 (11.8%) |
| 5 Years | 0 (0.0%) | 0 (0.0%) |
| 6 to 11 Years | 55 (14.4%) | 65 (15.3%) |
| 12 to 14 Years | 55 (33.3%) | 0 (0.0%) |
| 15 Years | 16 (45.7%) | 0 (0.0%) |
| 16 and 17 Years | 0 (0.0%) | 0 (0.0%) |
| 18 to 24 Years | 27 (7.2%) | 25 (7.5%) |
| 25 to 34 Years | 0 (0.0%) | 185 (14.6%) |
| 35 to 44 Years | 68 (10.4%) | 60 (11.8%) |
| 45 to 54 Years | 40 (17.6%) | 45 (10.2%) |
| 55 to 64 Years | 0 (0.0%) | 44 (22.9%) |
| 65 to 74 Years | 0 (0.0%) | 0 (0.0%) |
| 75 Years and over | 0 (0.0%) | 0 (0.0%) |
| Total | 384 (10.3%) | 472 (10.8%) |
Income Above Poverty by Sex and Age in Sonterra
According to the poverty statistics in Sonterra, males aged 5 years and females aged 5 years are the age groups that are most secure financially, with 100.0% of males and 100.0% of females in these age groups living above the poverty line.
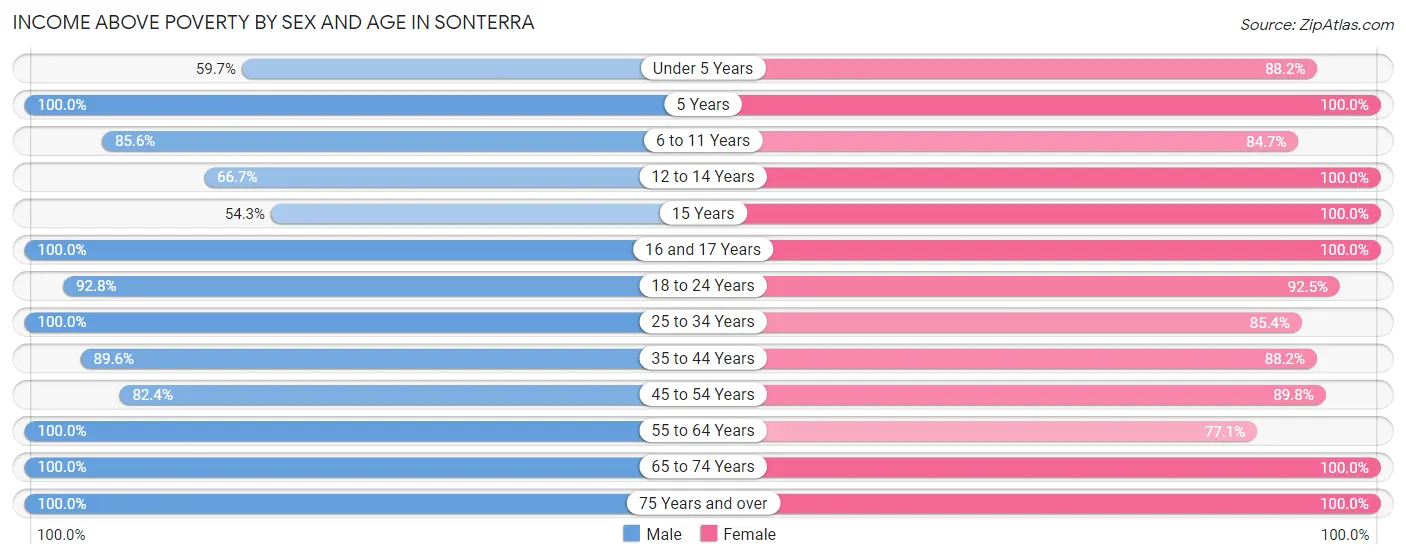
| Age Bracket | Male | Female |
| Under 5 Years | 182 (59.7%) | 360 (88.2%) |
| 5 Years | 58 (100.0%) | 9 (100.0%) |
| 6 to 11 Years | 328 (85.6%) | 361 (84.7%) |
| 12 to 14 Years | 110 (66.7%) | 66 (100.0%) |
| 15 Years | 19 (54.3%) | 186 (100.0%) |
| 16 and 17 Years | 119 (100.0%) | 144 (100.0%) |
| 18 to 24 Years | 350 (92.8%) | 306 (92.4%) |
| 25 to 34 Years | 1,081 (100.0%) | 1,081 (85.4%) |
| 35 to 44 Years | 585 (89.6%) | 447 (88.2%) |
| 45 to 54 Years | 187 (82.4%) | 395 (89.8%) |
| 55 to 64 Years | 146 (100.0%) | 148 (77.1%) |
| 65 to 74 Years | 136 (100.0%) | 207 (100.0%) |
| 75 Years and over | 33 (100.0%) | 182 (100.0%) |
| Total | 3,334 (89.7%) | 3,892 (89.2%) |
Income Below Poverty Among Married-Couple Families in Sonterra
The poverty statistics for married-couple families in Sonterra show that 6.6% or 86 of the total 1,312 families live below the poverty line. Families with 3 or 4 children have the highest poverty rate of 13.4%, comprising of 21 families. On the other hand, families with no children have the lowest poverty rate of 0.0%, which includes 0 families.
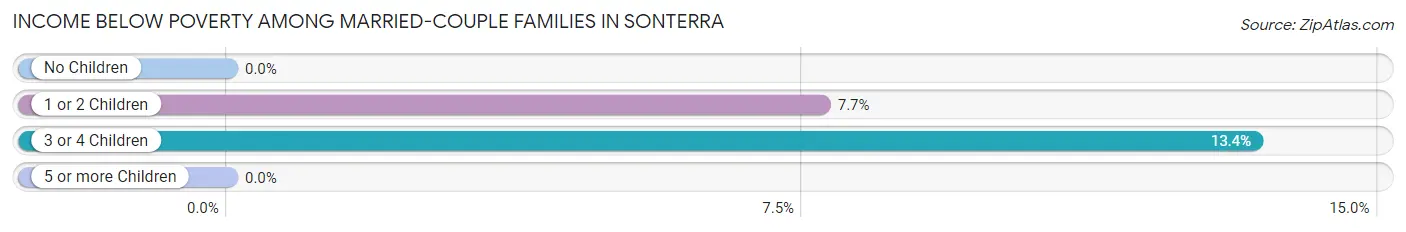
| Children | Above Poverty | Below Poverty |
| No Children | 315 (100.0%) | 0 (0.0%) |
| 1 or 2 Children | 775 (92.3%) | 65 (7.7%) |
| 3 or 4 Children | 136 (86.6%) | 21 (13.4%) |
| 5 or more Children | 0 (0.0%) | 0 (0.0%) |
| Total | 1,226 (93.4%) | 86 (6.6%) |
Income Below Poverty Among Single-Parent Households in Sonterra
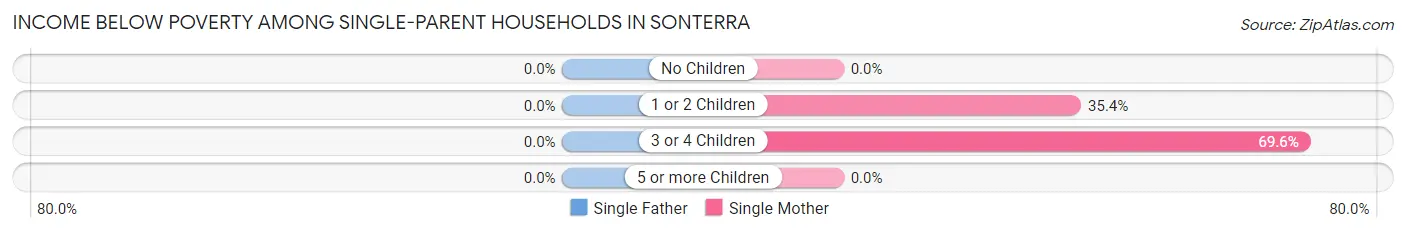
| Children | Single Father | Single Mother |
| No Children | 0 (0.0%) | 0 (0.0%) |
| 1 or 2 Children | 0 (0.0%) | 98 (35.4%) |
| 3 or 4 Children | 0 (0.0%) | 16 (69.6%) |
| 5 or more Children | 0 (0.0%) | 0 (0.0%) |
| Total | 0 (0.0%) | 114 (20.6%) |
Income Below Poverty Among Married-Couple vs Single-Parent Households in Sonterra
The poverty data for Sonterra shows that 86 of the married-couple family households (6.6%) and 114 of the single-parent households (19.9%) are living below the poverty level. Within the married-couple family households, those with 3 or 4 children have the highest poverty rate, with 21 households (13.4%) falling below the poverty line. Among the single-parent households, those with 3 or 4 children have the highest poverty rate, with 16 household (69.6%) living below poverty.
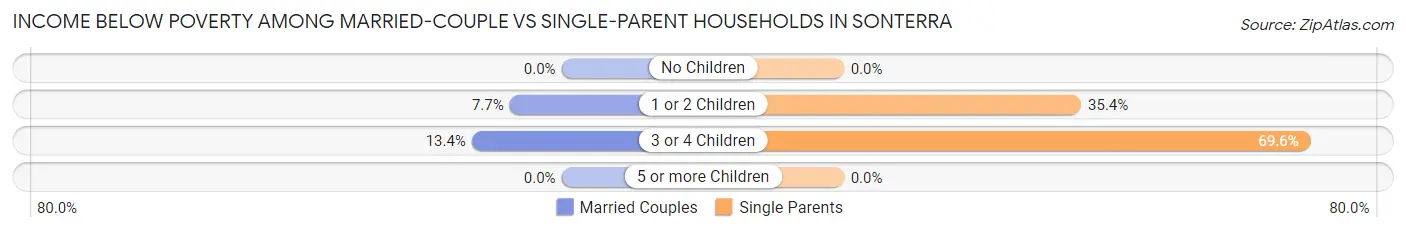
| Children | Married-Couple Families | Single-Parent Households |
| No Children | 0 (0.0%) | 0 (0.0%) |
| 1 or 2 Children | 65 (7.7%) | 98 (35.4%) |
| 3 or 4 Children | 21 (13.4%) | 16 (69.6%) |
| 5 or more Children | 0 (0.0%) | 0 (0.0%) |
| Total | 86 (6.6%) | 114 (19.9%) |
Employment Characteristics in Sonterra
Employment by Class of Employer in Sonterra
Among the 4,509 employed individuals in Sonterra, private company employees (3,381 | 75.0%), local government employees (312 | 6.9%), and not-for-profit organizations (256 | 5.7%) make up the most common classes of employment.
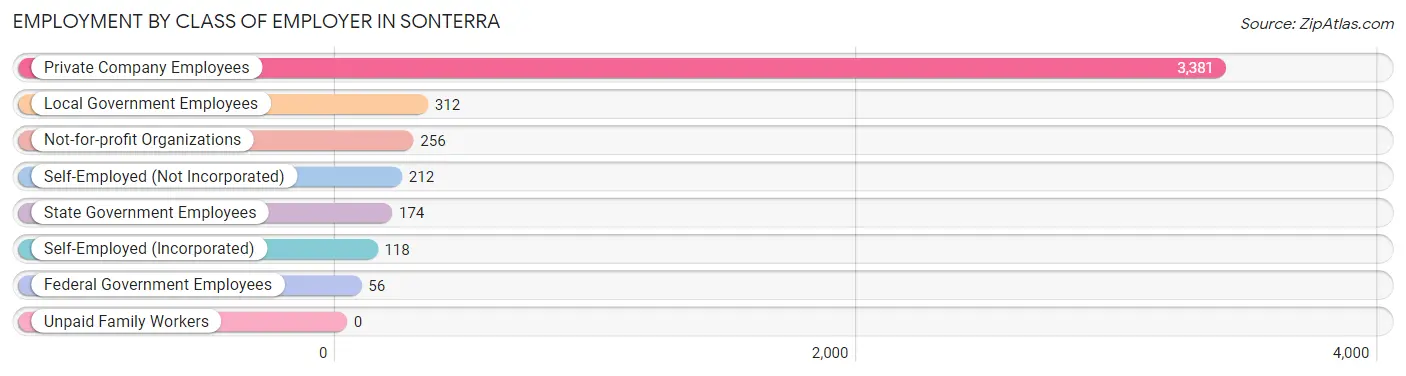
| Employer Class | # Employees | % Employees |
| Private Company Employees | 3,381 | 75.0% |
| Self-Employed (Incorporated) | 118 | 2.6% |
| Self-Employed (Not Incorporated) | 212 | 4.7% |
| Not-for-profit Organizations | 256 | 5.7% |
| Local Government Employees | 312 | 6.9% |
| State Government Employees | 174 | 3.9% |
| Federal Government Employees | 56 | 1.2% |
| Unpaid Family Workers | 0 | 0.0% |
| Total | 4,509 | 100.0% |
Employment Status by Age in Sonterra
According to the labor force statistics for Sonterra, out of the total population over 16 years of age (6,041), 79.9% or 4,827 individuals are in the labor force, with 5.5% or 265 of them unemployed. The age group with the highest labor force participation rate is 20 to 24 years, with 90.3% or 552 individuals in the labor force. Within the labor force, the 16 to 19 years age range has the highest percentage of unemployed individuals, with 43.0% or 86 of them being unemployed.
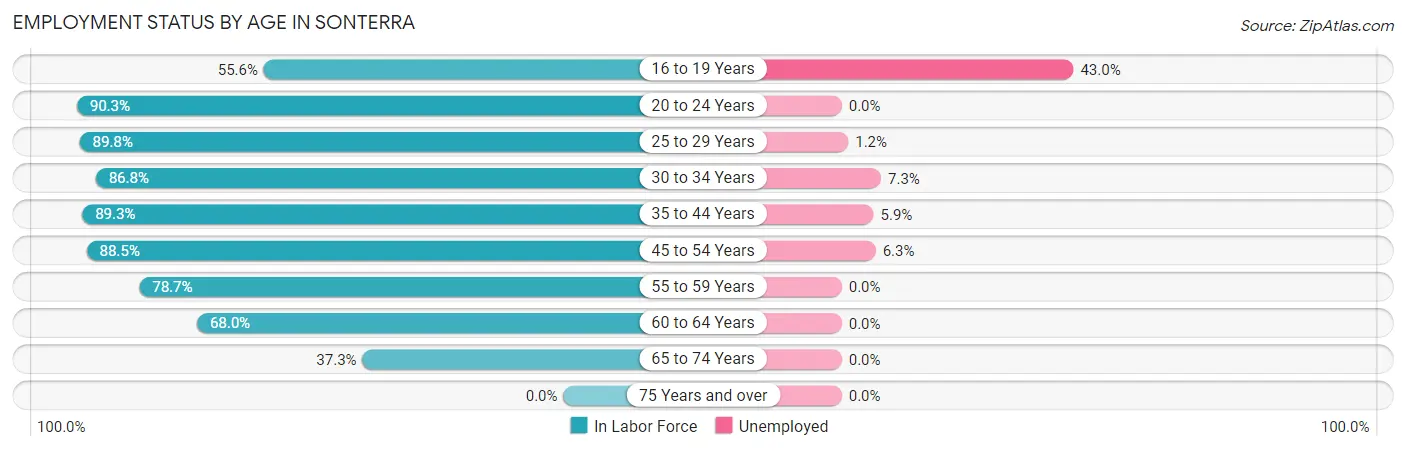
| Age Bracket | In Labor Force | Unemployed |
| 16 to 19 Years | 200 (55.6%) | 86 (43.0%) |
| 20 to 24 Years | 552 (90.3%) | 0 (0.0%) |
| 25 to 29 Years | 1,154 (89.8%) | 14 (1.2%) |
| 30 to 34 Years | 922 (86.8%) | 67 (7.3%) |
| 35 to 44 Years | 1,036 (89.3%) | 61 (5.9%) |
| 45 to 54 Years | 590 (88.5%) | 37 (6.3%) |
| 55 to 59 Years | 111 (78.7%) | 0 (0.0%) |
| 60 to 64 Years | 134 (68.0%) | 0 (0.0%) |
| 65 to 74 Years | 128 (37.3%) | 0 (0.0%) |
| 75 Years and over | 0 (0.0%) | 0 (0.0%) |
| Total | 4,827 (79.9%) | 265 (5.5%) |
Employment Status by Educational Attainment in Sonterra
According to labor force statistics for Sonterra, 87.5% of individuals (3,948) out of the total population between 25 and 64 years of age (4,512) are in the labor force, with 4.6% or 182 of them being unemployed. The group with the highest labor force participation rate are those with the educational attainment of bachelor's degree or higher, with 96.4% or 821 individuals in the labor force. Within the labor force, individuals with bachelor's degree or higher education have the highest percentage of unemployment, with 5.8% or 48 of them being unemployed.
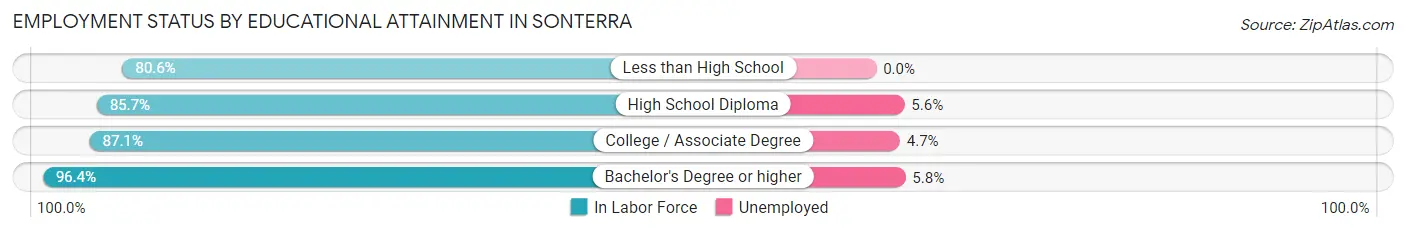
| Educational Attainment | In Labor Force | Unemployed |
| Less than High School | 537 (80.6%) | 0 (0.0%) |
| High School Diploma | 1,149 (85.7%) | 75 (5.6%) |
| College / Associate Degree | 1,440 (87.1%) | 78 (4.7%) |
| Bachelor's Degree or higher | 821 (96.4%) | 49 (5.8%) |
| Total | 3,948 (87.5%) | 208 (4.6%) |
Employment Occupations by Sex in Sonterra
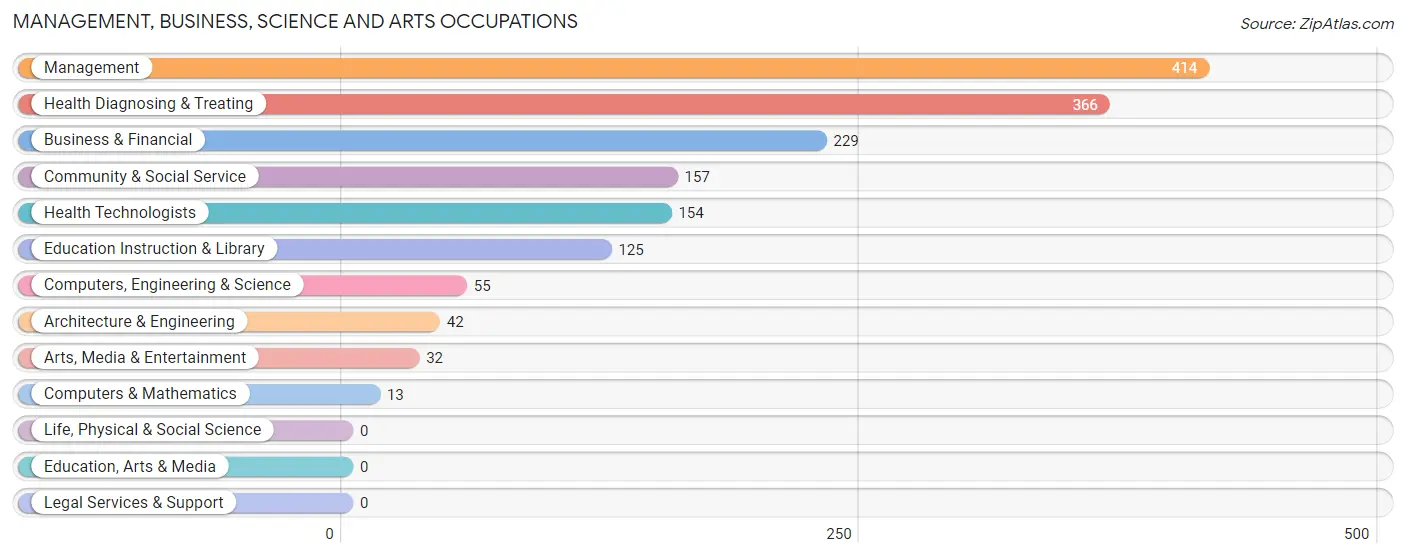
Management, Business, Science and Arts Occupations
The most common Management, Business, Science and Arts occupations in Sonterra are Management (414 | 9.1%), Health Diagnosing & Treating (366 | 8.1%), Business & Financial (229 | 5.1%), Community & Social Service (157 | 3.5%), and Health Technologists (154 | 3.4%).
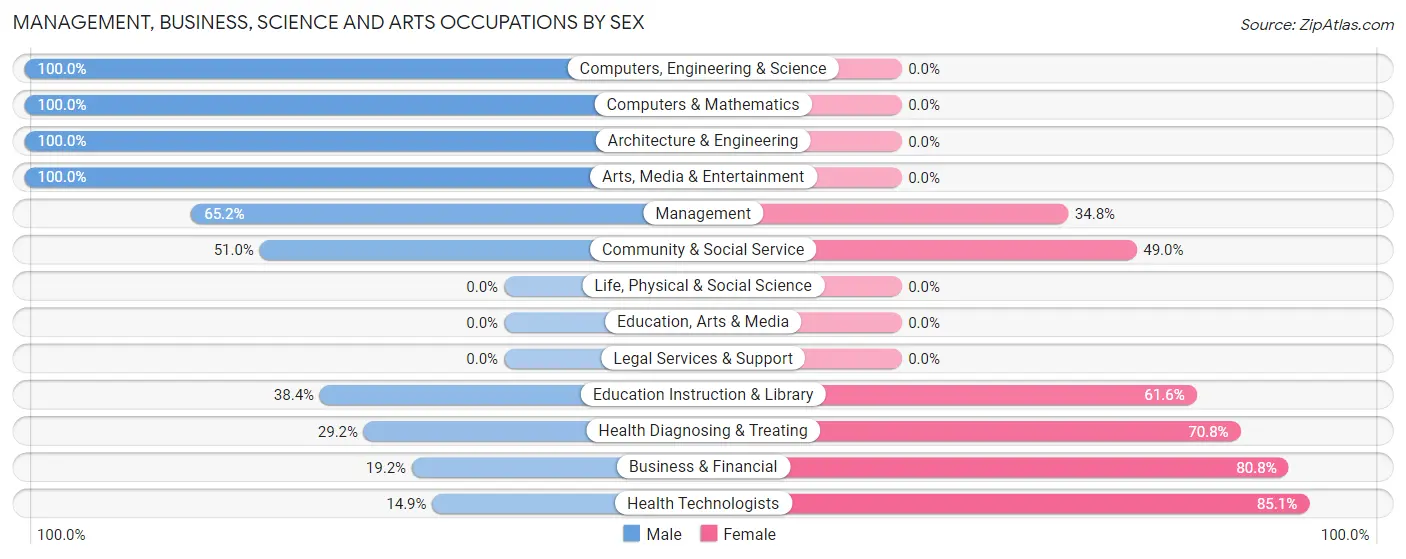
Management, Business, Science and Arts Occupations by Sex
Within the Management, Business, Science and Arts occupations in Sonterra, the most male-oriented occupations are Computers, Engineering & Science (100.0%), Computers & Mathematics (100.0%), and Architecture & Engineering (100.0%), while the most female-oriented occupations are Health Technologists (85.1%), Business & Financial (80.8%), and Health Diagnosing & Treating (70.8%).
| Occupation | Male | Female |
| Management | 270 (65.2%) | 144 (34.8%) |
| Business & Financial | 44 (19.2%) | 185 (80.8%) |
| Computers, Engineering & Science | 55 (100.0%) | 0 (0.0%) |
| Computers & Mathematics | 13 (100.0%) | 0 (0.0%) |
| Architecture & Engineering | 42 (100.0%) | 0 (0.0%) |
| Life, Physical & Social Science | 0 (0.0%) | 0 (0.0%) |
| Community & Social Service | 80 (51.0%) | 77 (49.0%) |
| Education, Arts & Media | 0 (0.0%) | 0 (0.0%) |
| Legal Services & Support | 0 (0.0%) | 0 (0.0%) |
| Education Instruction & Library | 48 (38.4%) | 77 (61.6%) |
| Arts, Media & Entertainment | 32 (100.0%) | 0 (0.0%) |
| Health Diagnosing & Treating | 107 (29.2%) | 259 (70.8%) |
| Health Technologists | 23 (14.9%) | 131 (85.1%) |
| Total (Category) | 556 (45.5%) | 665 (54.5%) |
| Total (Overall) | 2,286 (50.5%) | 2,238 (49.5%) |
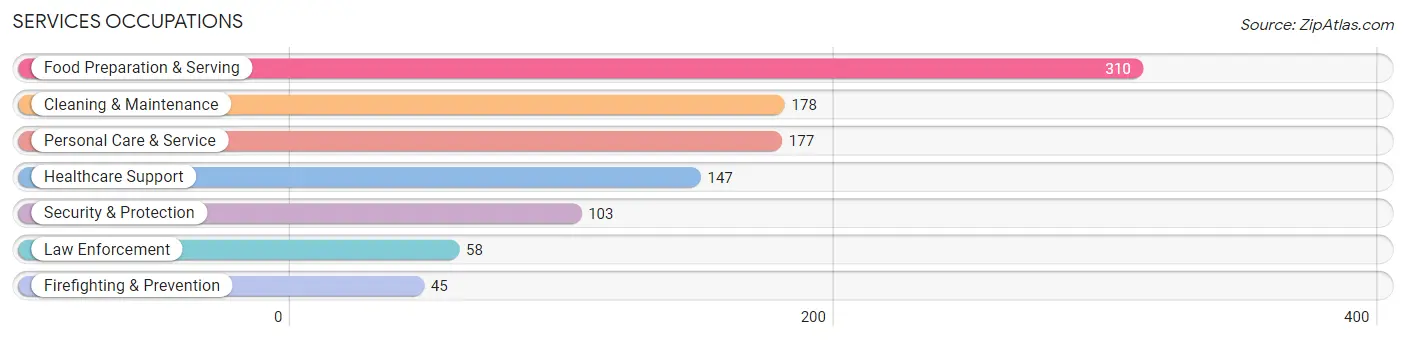
Services Occupations
The most common Services occupations in Sonterra are Food Preparation & Serving (310 | 6.9%), Cleaning & Maintenance (178 | 3.9%), Personal Care & Service (177 | 3.9%), Healthcare Support (147 | 3.3%), and Security & Protection (103 | 2.3%).
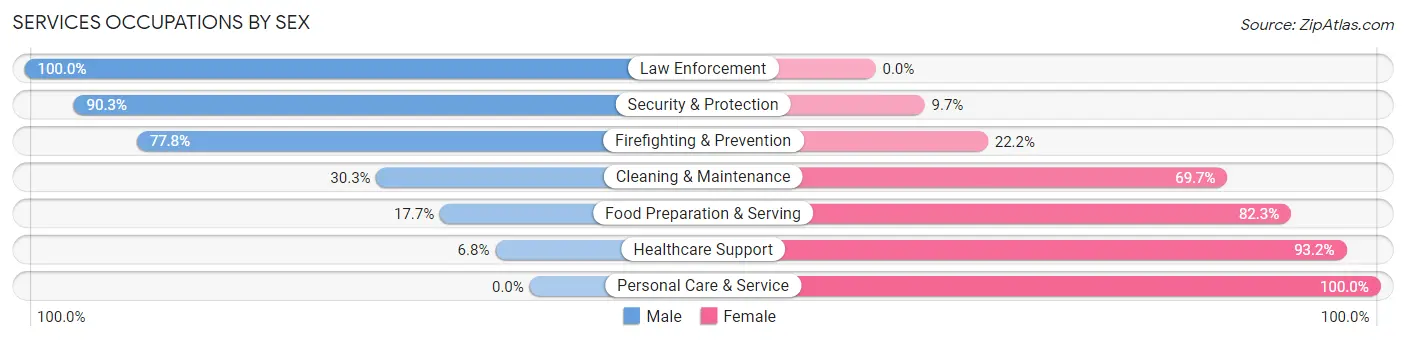
Services Occupations by Sex
Within the Services occupations in Sonterra, the most male-oriented occupations are Law Enforcement (100.0%), Security & Protection (90.3%), and Firefighting & Prevention (77.8%), while the most female-oriented occupations are Personal Care & Service (100.0%), Healthcare Support (93.2%), and Food Preparation & Serving (82.3%).
| Occupation | Male | Female |
| Healthcare Support | 10 (6.8%) | 137 (93.2%) |
| Security & Protection | 93 (90.3%) | 10 (9.7%) |
| Firefighting & Prevention | 35 (77.8%) | 10 (22.2%) |
| Law Enforcement | 58 (100.0%) | 0 (0.0%) |
| Food Preparation & Serving | 55 (17.7%) | 255 (82.3%) |
| Cleaning & Maintenance | 54 (30.3%) | 124 (69.7%) |
| Personal Care & Service | 0 (0.0%) | 177 (100.0%) |
| Total (Category) | 212 (23.2%) | 703 (76.8%) |
| Total (Overall) | 2,286 (50.5%) | 2,238 (49.5%) |
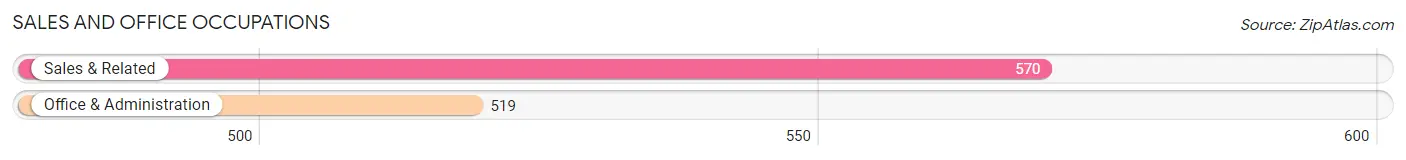
Sales and Office Occupations
The most common Sales and Office occupations in Sonterra are Sales & Related (570 | 12.6%), and Office & Administration (519 | 11.5%).
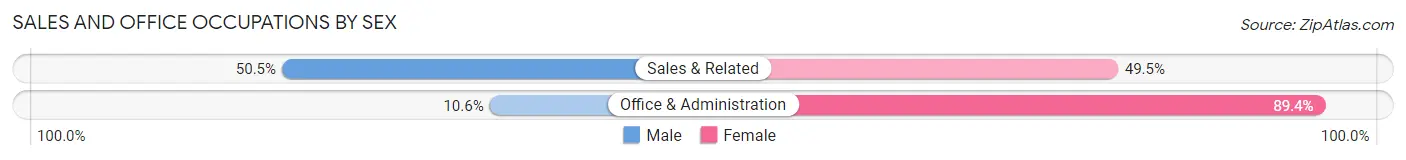
Sales and Office Occupations by Sex
| Occupation | Male | Female |
| Sales & Related | 288 (50.5%) | 282 (49.5%) |
| Office & Administration | 55 (10.6%) | 464 (89.4%) |
| Total (Category) | 343 (31.5%) | 746 (68.5%) |
| Total (Overall) | 2,286 (50.5%) | 2,238 (49.5%) |
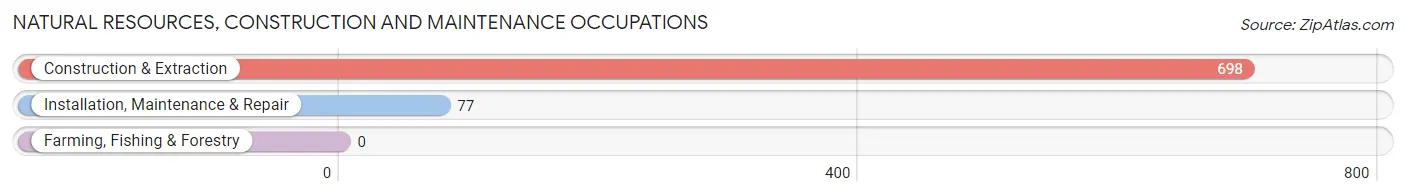
Natural Resources, Construction and Maintenance Occupations
The most common Natural Resources, Construction and Maintenance occupations in Sonterra are Construction & Extraction (698 | 15.4%), and Installation, Maintenance & Repair (77 | 1.7%).
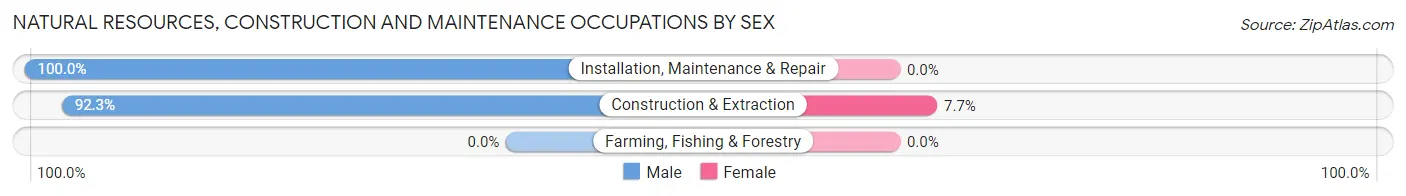
Natural Resources, Construction and Maintenance Occupations by Sex
| Occupation | Male | Female |
| Farming, Fishing & Forestry | 0 (0.0%) | 0 (0.0%) |
| Construction & Extraction | 644 (92.3%) | 54 (7.7%) |
| Installation, Maintenance & Repair | 77 (100.0%) | 0 (0.0%) |
| Total (Category) | 721 (93.0%) | 54 (7.0%) |
| Total (Overall) | 2,286 (50.5%) | 2,238 (49.5%) |
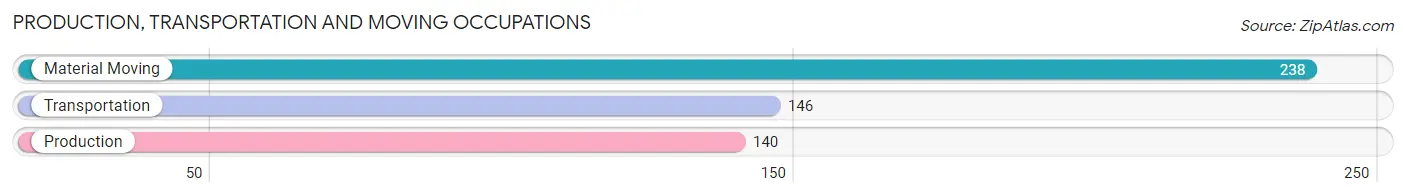
Production, Transportation and Moving Occupations
The most common Production, Transportation and Moving occupations in Sonterra are Material Moving (238 | 5.3%), Transportation (146 | 3.2%), and Production (140 | 3.1%).
Production, Transportation and Moving Occupations by Sex
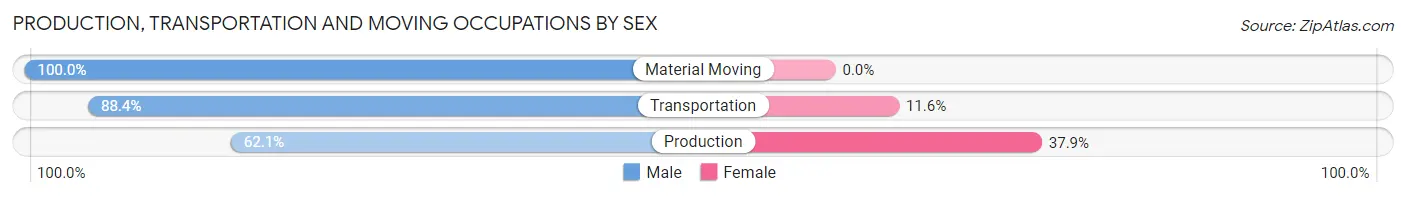
| Occupation | Male | Female |
| Production | 87 (62.1%) | 53 (37.9%) |
| Transportation | 129 (88.4%) | 17 (11.6%) |
| Material Moving | 238 (100.0%) | 0 (0.0%) |
| Total (Category) | 454 (86.6%) | 70 (13.4%) |
| Total (Overall) | 2,286 (50.5%) | 2,238 (49.5%) |
Employment Industries by Sex in Sonterra
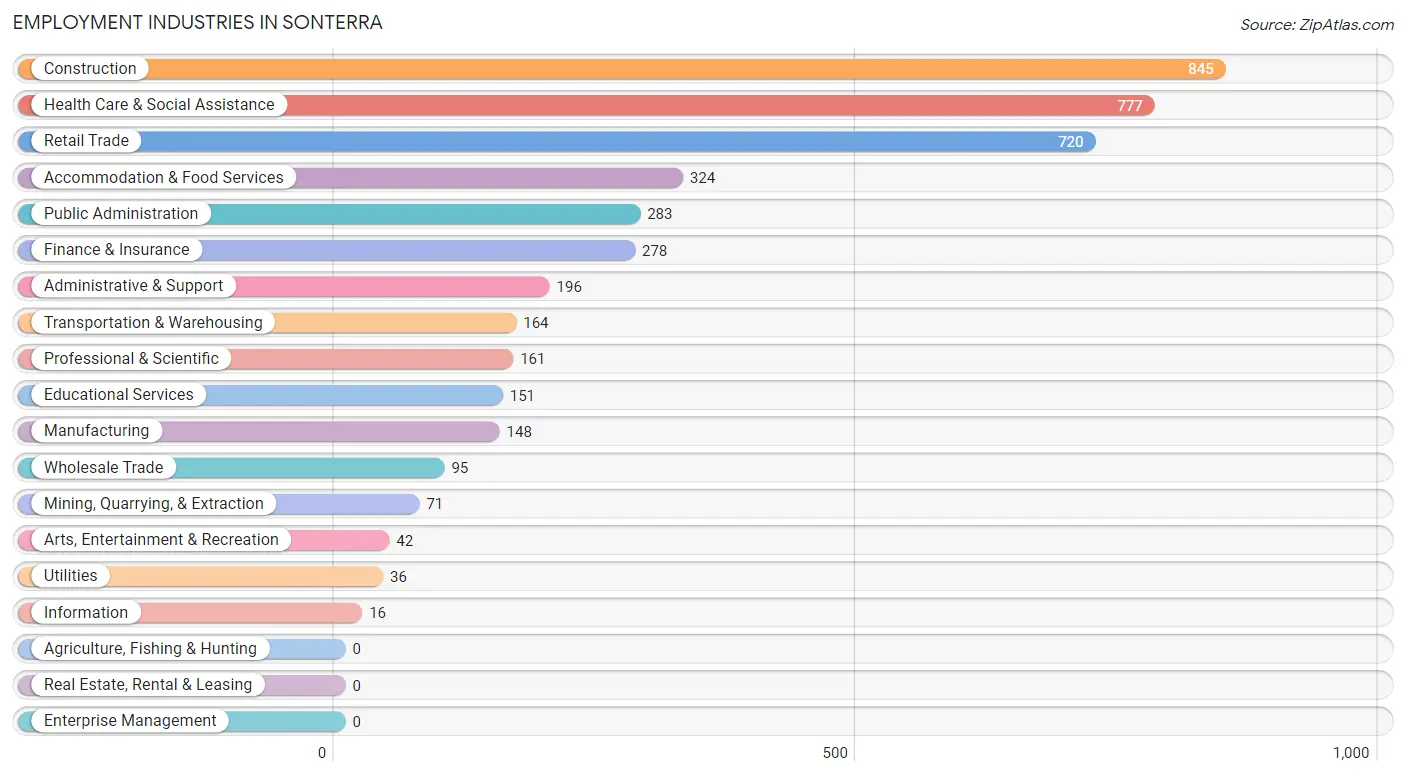
Employment Industries in Sonterra
The major employment industries in Sonterra include Construction (845 | 18.7%), Health Care & Social Assistance (777 | 17.2%), Retail Trade (720 | 15.9%), Accommodation & Food Services (324 | 7.2%), and Public Administration (283 | 6.3%).
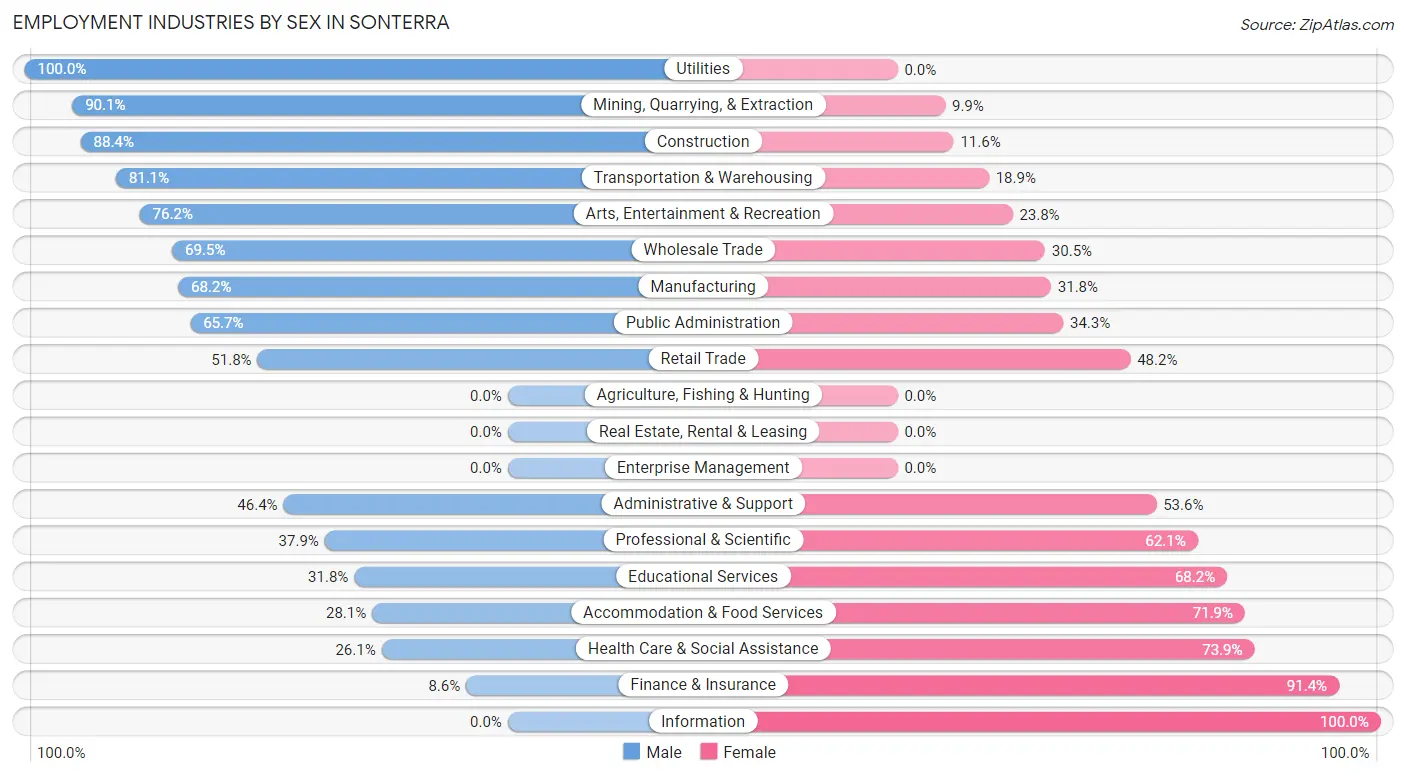
Employment Industries by Sex in Sonterra
The Sonterra industries that see more men than women are Utilities (100.0%), Mining, Quarrying, & Extraction (90.1%), and Construction (88.4%), whereas the industries that tend to have a higher number of women are Information (100.0%), Finance & Insurance (91.4%), and Health Care & Social Assistance (73.9%).
| Industry | Male | Female |
| Agriculture, Fishing & Hunting | 0 (0.0%) | 0 (0.0%) |
| Mining, Quarrying, & Extraction | 64 (90.1%) | 7 (9.9%) |
| Construction | 747 (88.4%) | 98 (11.6%) |
| Manufacturing | 101 (68.2%) | 47 (31.8%) |
| Wholesale Trade | 66 (69.5%) | 29 (30.5%) |
| Retail Trade | 373 (51.8%) | 347 (48.2%) |
| Transportation & Warehousing | 133 (81.1%) | 31 (18.9%) |
| Utilities | 36 (100.0%) | 0 (0.0%) |
| Information | 0 (0.0%) | 16 (100.0%) |
| Finance & Insurance | 24 (8.6%) | 254 (91.4%) |
| Real Estate, Rental & Leasing | 0 (0.0%) | 0 (0.0%) |
| Professional & Scientific | 61 (37.9%) | 100 (62.1%) |
| Enterprise Management | 0 (0.0%) | 0 (0.0%) |
| Administrative & Support | 91 (46.4%) | 105 (53.6%) |
| Educational Services | 48 (31.8%) | 103 (68.2%) |
| Health Care & Social Assistance | 203 (26.1%) | 574 (73.9%) |
| Arts, Entertainment & Recreation | 32 (76.2%) | 10 (23.8%) |
| Accommodation & Food Services | 91 (28.1%) | 233 (71.9%) |
| Public Administration | 186 (65.7%) | 97 (34.3%) |
| Total | 2,286 (50.5%) | 2,238 (49.5%) |
Education in Sonterra
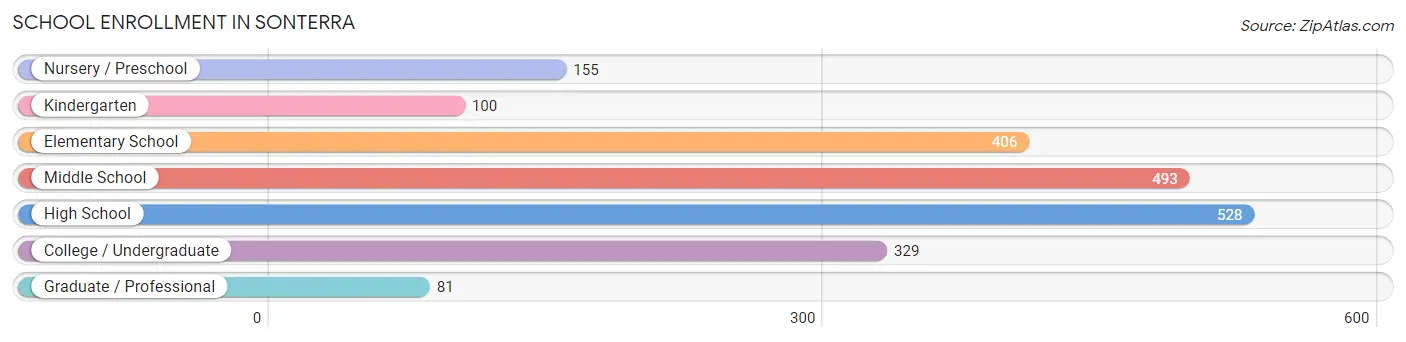
School Enrollment in Sonterra
The most common levels of schooling among the 2,092 students in Sonterra are high school (528 | 25.2%), middle school (493 | 23.6%), and elementary school (406 | 19.4%).
| School Level | # Students | % Students |
| Nursery / Preschool | 155 | 7.4% |
| Kindergarten | 100 | 4.8% |
| Elementary School | 406 | 19.4% |
| Middle School | 493 | 23.6% |
| High School | 528 | 25.2% |
| College / Undergraduate | 329 | 15.7% |
| Graduate / Professional | 81 | 3.9% |
| Total | 2,092 | 100.0% |
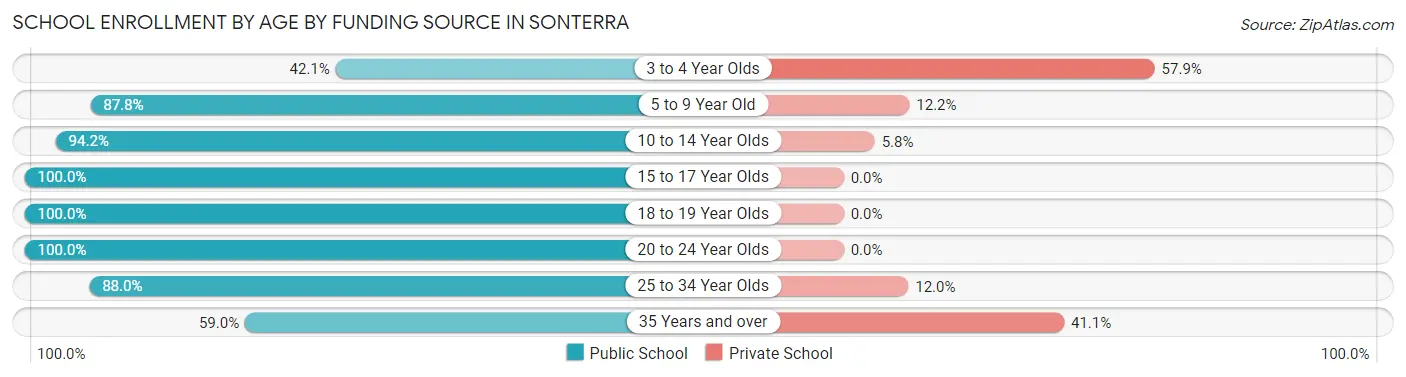
School Enrollment by Age by Funding Source in Sonterra
Out of a total of 2,092 students who are enrolled in schools in Sonterra, 236 (11.3%) attend a private institution, while the remaining 1,856 (88.7%) are enrolled in public schools. The age group of 3 to 4 year olds has the highest likelihood of being enrolled in private schools, with 95 (57.9% in the age bracket) enrolled. Conversely, the age group of 15 to 17 year olds has the lowest likelihood of being enrolled in a private school, with 484 (100.0% in the age bracket) attending a public institution.
| Age Bracket | Public School | Private School |
| 3 to 4 Year Olds | 69 (42.1%) | 95 (57.9%) |
| 5 to 9 Year Old | 337 (87.8%) | 47 (12.2%) |
| 10 to 14 Year Olds | 521 (94.2%) | 32 (5.8%) |
| 15 to 17 Year Olds | 484 (100.0%) | 0 (0.0%) |
| 18 to 19 Year Olds | 97 (100.0%) | 0 (0.0%) |
| 20 to 24 Year Olds | 124 (100.0%) | 0 (0.0%) |
| 25 to 34 Year Olds | 168 (88.0%) | 23 (12.0%) |
| 35 Years and over | 56 (59.0%) | 39 (41.0%) |
| Total | 1,856 (88.7%) | 236 (11.3%) |
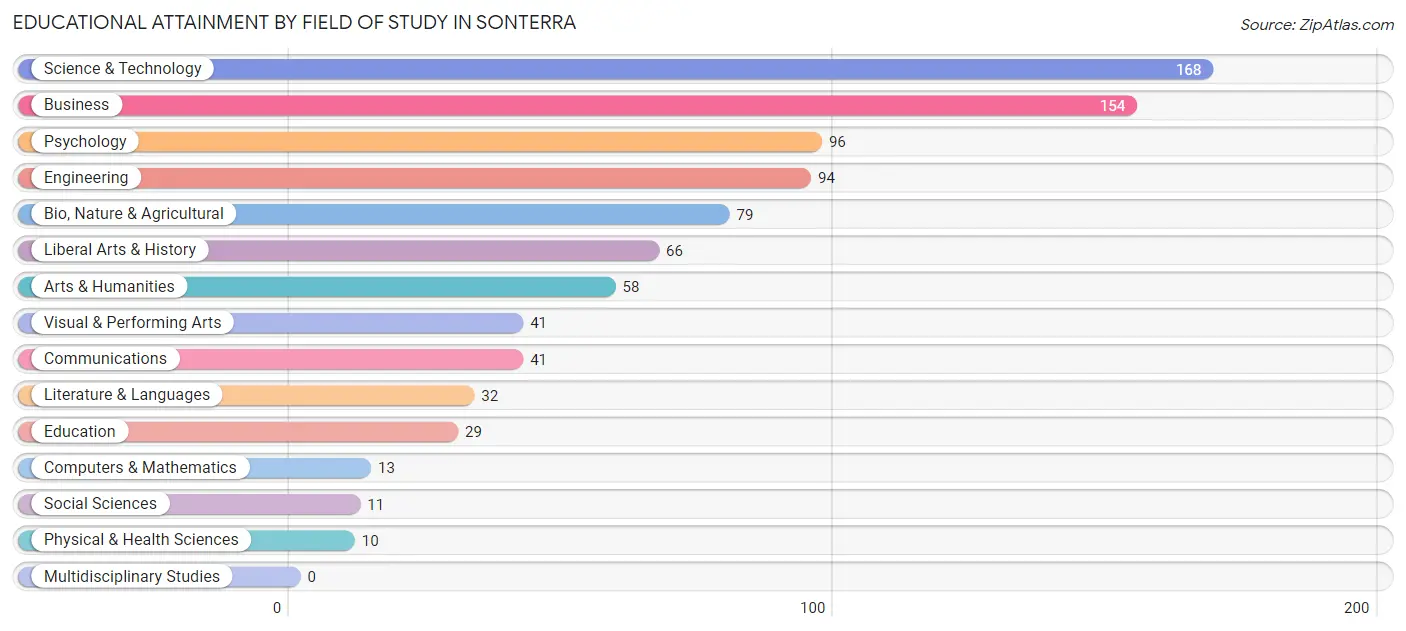
Educational Attainment by Field of Study in Sonterra
Science & technology (168 | 18.8%), business (154 | 17.3%), psychology (96 | 10.8%), engineering (94 | 10.5%), and bio, nature & agricultural (79 | 8.9%) are the most common fields of study among 892 individuals in Sonterra who have obtained a bachelor's degree or higher.
| Field of Study | # Graduates | % Graduates |
| Computers & Mathematics | 13 | 1.5% |
| Bio, Nature & Agricultural | 79 | 8.9% |
| Physical & Health Sciences | 10 | 1.1% |
| Psychology | 96 | 10.8% |
| Social Sciences | 11 | 1.2% |
| Engineering | 94 | 10.5% |
| Multidisciplinary Studies | 0 | 0.0% |
| Science & Technology | 168 | 18.8% |
| Business | 154 | 17.3% |
| Education | 29 | 3.3% |
| Literature & Languages | 32 | 3.6% |
| Liberal Arts & History | 66 | 7.4% |
| Visual & Performing Arts | 41 | 4.6% |
| Communications | 41 | 4.6% |
| Arts & Humanities | 58 | 6.5% |
| Total | 892 | 100.0% |
Transportation & Commute in Sonterra
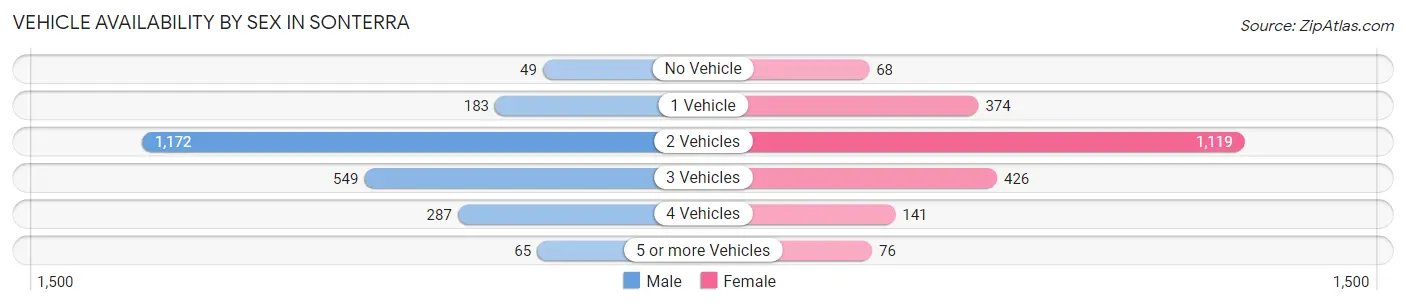
Vehicle Availability by Sex in Sonterra
The most prevalent vehicle ownership categories in Sonterra are males with 2 vehicles (1,172, accounting for 50.8%) and females with 2 vehicles (1,119, making up 53.2%).
| Vehicles Available | Male | Female |
| No Vehicle | 49 (2.1%) | 68 (3.1%) |
| 1 Vehicle | 183 (7.9%) | 374 (17.0%) |
| 2 Vehicles | 1,172 (50.8%) | 1,119 (50.8%) |
| 3 Vehicles | 549 (23.8%) | 426 (19.3%) |
| 4 Vehicles | 287 (12.4%) | 141 (6.4%) |
| 5 or more Vehicles | 65 (2.8%) | 76 (3.5%) |
| Total | 2,305 (100.0%) | 2,204 (100.0%) |
Commute Time in Sonterra
The most frequently occuring commute durations in Sonterra are 20 to 24 minutes (776 commuters, 18.8%), 30 to 34 minutes (697 commuters, 16.9%), and 40 to 44 minutes (567 commuters, 13.8%).
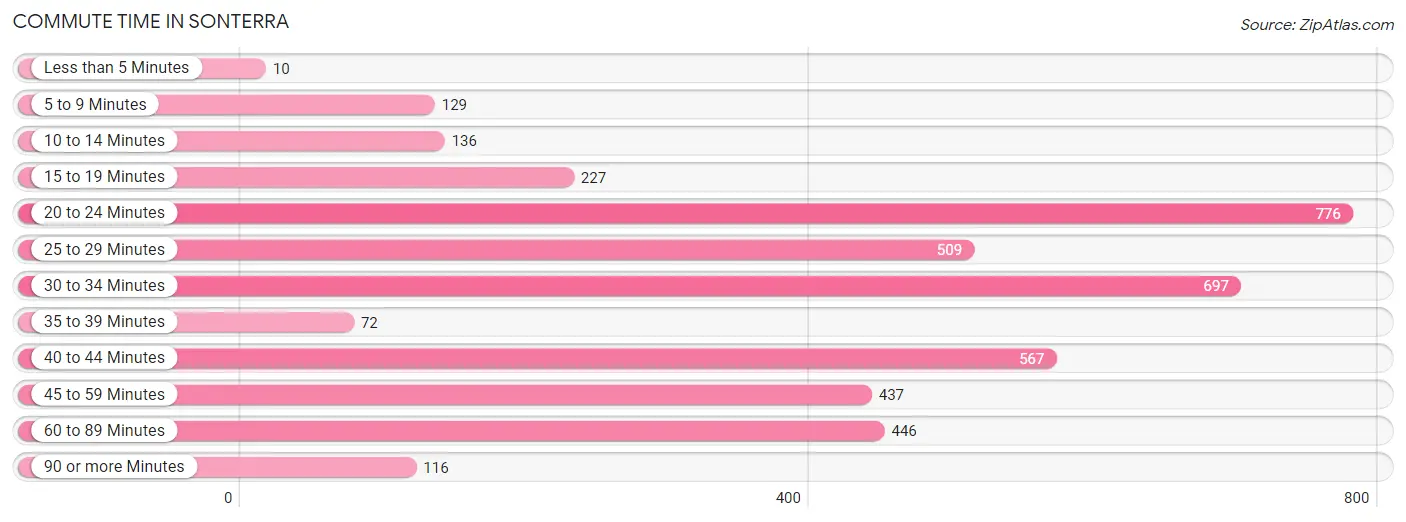
| Commute Time | # Commuters | % Commuters |
| Less than 5 Minutes | 10 | 0.2% |
| 5 to 9 Minutes | 129 | 3.1% |
| 10 to 14 Minutes | 136 | 3.3% |
| 15 to 19 Minutes | 227 | 5.5% |
| 20 to 24 Minutes | 776 | 18.8% |
| 25 to 29 Minutes | 509 | 12.3% |
| 30 to 34 Minutes | 697 | 16.9% |
| 35 to 39 Minutes | 72 | 1.8% |
| 40 to 44 Minutes | 567 | 13.8% |
| 45 to 59 Minutes | 437 | 10.6% |
| 60 to 89 Minutes | 446 | 10.8% |
| 90 or more Minutes | 116 | 2.8% |
Commute Time by Sex in Sonterra
The most common commute times in Sonterra are 40 to 44 minutes (514 commuters, 23.8%) for males and 20 to 24 minutes (626 commuters, 31.9%) for females.
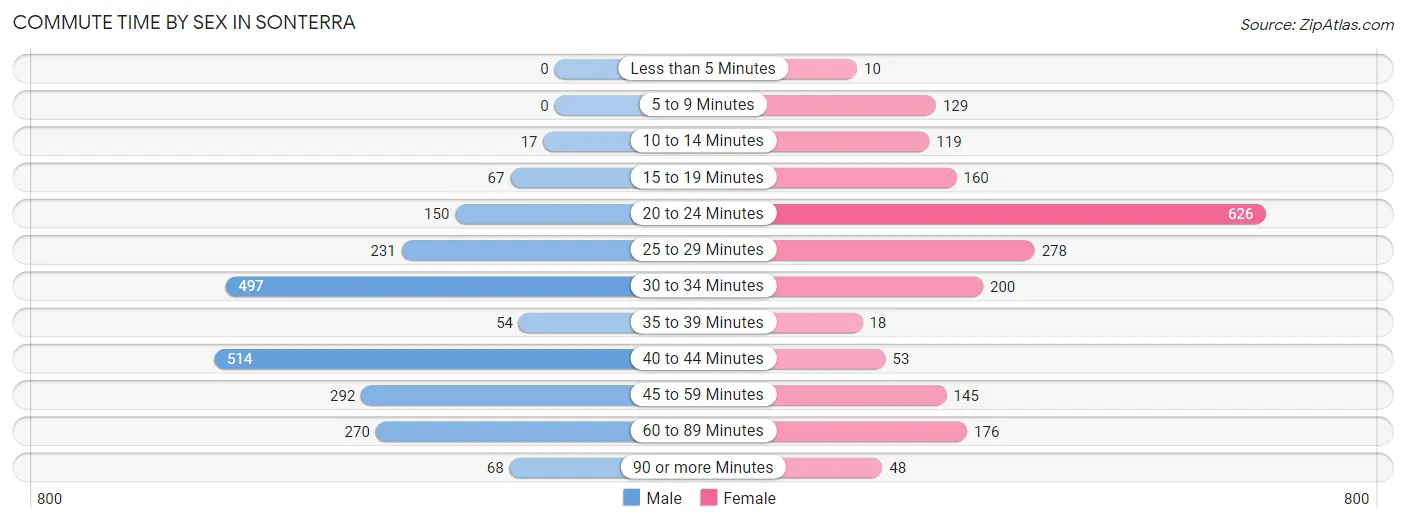
| Commute Time | Male | Female |
| Less than 5 Minutes | 0 (0.0%) | 10 (0.5%) |
| 5 to 9 Minutes | 0 (0.0%) | 129 (6.6%) |
| 10 to 14 Minutes | 17 (0.8%) | 119 (6.1%) |
| 15 to 19 Minutes | 67 (3.1%) | 160 (8.2%) |
| 20 to 24 Minutes | 150 (6.9%) | 626 (31.9%) |
| 25 to 29 Minutes | 231 (10.7%) | 278 (14.2%) |
| 30 to 34 Minutes | 497 (23.0%) | 200 (10.2%) |
| 35 to 39 Minutes | 54 (2.5%) | 18 (0.9%) |
| 40 to 44 Minutes | 514 (23.8%) | 53 (2.7%) |
| 45 to 59 Minutes | 292 (13.5%) | 145 (7.4%) |
| 60 to 89 Minutes | 270 (12.5%) | 176 (9.0%) |
| 90 or more Minutes | 68 (3.2%) | 48 (2.5%) |
Time of Departure to Work by Sex in Sonterra
The most frequent times of departure to work in Sonterra are 7:30 AM to 7:59 AM (455, 21.1%) for males and 9:00 AM to 9:59 AM (476, 24.3%) for females.
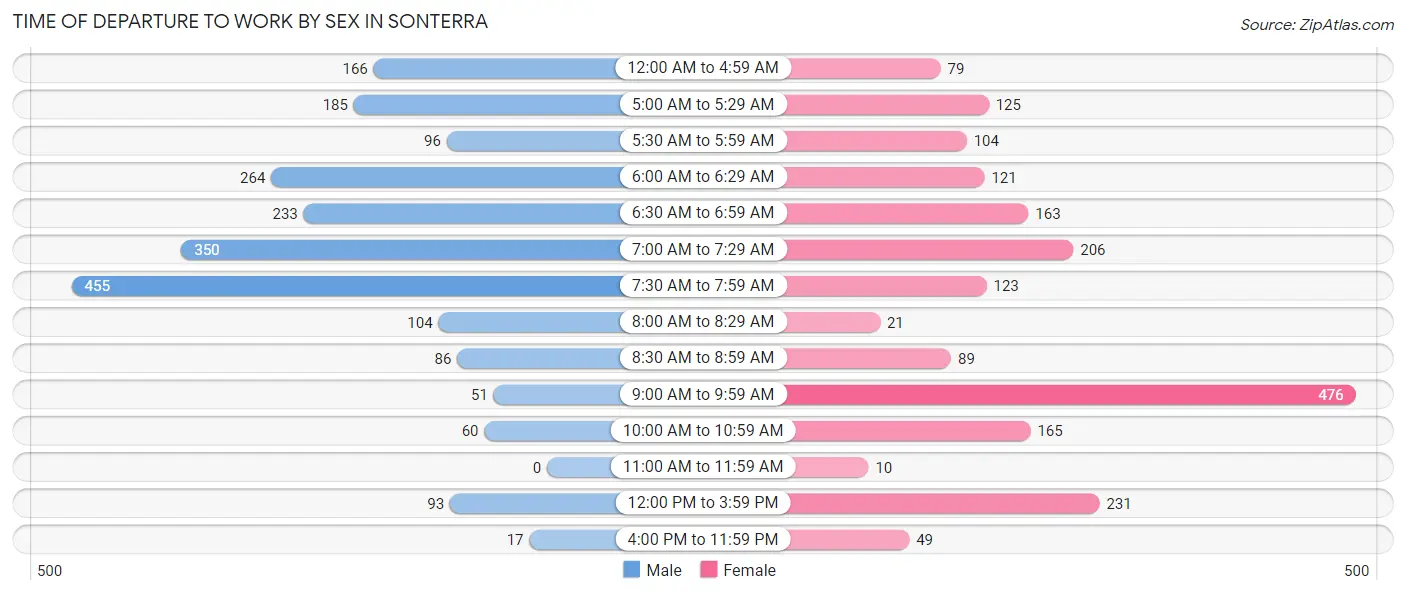
| Time of Departure | Male | Female |
| 12:00 AM to 4:59 AM | 166 (7.7%) | 79 (4.0%) |
| 5:00 AM to 5:29 AM | 185 (8.6%) | 125 (6.4%) |
| 5:30 AM to 5:59 AM | 96 (4.4%) | 104 (5.3%) |
| 6:00 AM to 6:29 AM | 264 (12.2%) | 121 (6.2%) |
| 6:30 AM to 6:59 AM | 233 (10.8%) | 163 (8.3%) |
| 7:00 AM to 7:29 AM | 350 (16.2%) | 206 (10.5%) |
| 7:30 AM to 7:59 AM | 455 (21.1%) | 123 (6.3%) |
| 8:00 AM to 8:29 AM | 104 (4.8%) | 21 (1.1%) |
| 8:30 AM to 8:59 AM | 86 (4.0%) | 89 (4.5%) |
| 9:00 AM to 9:59 AM | 51 (2.4%) | 476 (24.3%) |
| 10:00 AM to 10:59 AM | 60 (2.8%) | 165 (8.4%) |
| 11:00 AM to 11:59 AM | 0 (0.0%) | 10 (0.5%) |
| 12:00 PM to 3:59 PM | 93 (4.3%) | 231 (11.8%) |
| 4:00 PM to 11:59 PM | 17 (0.8%) | 49 (2.5%) |
| Total | 2,160 (100.0%) | 1,962 (100.0%) |
Housing Occupancy in Sonterra
Occupancy by Ownership in Sonterra
Of the total 2,732 dwellings in Sonterra, owner-occupied units account for 2,194 (80.3%), while renter-occupied units make up 538 (19.7%).
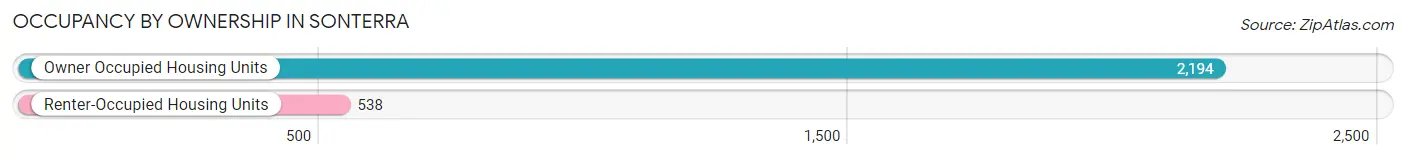
| Occupancy | # Housing Units | % Housing Units |
| Owner Occupied Housing Units | 2,194 | 80.3% |
| Renter-Occupied Housing Units | 538 | 19.7% |
| Total Occupied Housing Units | 2,732 | 100.0% |
Occupancy by Household Size in Sonterra
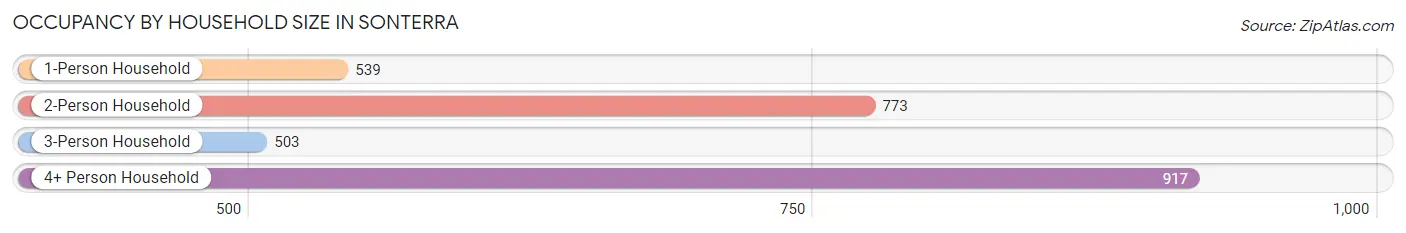
| Household Size | # Housing Units | % Housing Units |
| 1-Person Household | 539 | 19.7% |
| 2-Person Household | 773 | 28.3% |
| 3-Person Household | 503 | 18.4% |
| 4+ Person Household | 917 | 33.6% |
| Total Housing Units | 2,732 | 100.0% |
Occupancy by Ownership by Household Size in Sonterra
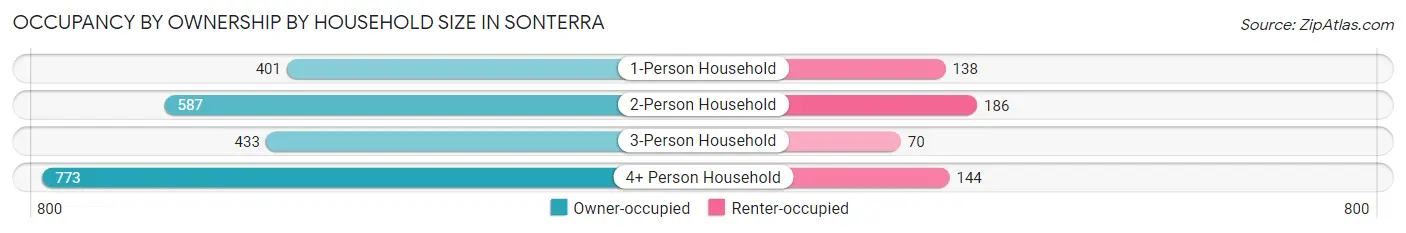
| Household Size | Owner-occupied | Renter-occupied |
| 1-Person Household | 401 (74.4%) | 138 (25.6%) |
| 2-Person Household | 587 (75.9%) | 186 (24.1%) |
| 3-Person Household | 433 (86.1%) | 70 (13.9%) |
| 4+ Person Household | 773 (84.3%) | 144 (15.7%) |
| Total Housing Units | 2,194 (80.3%) | 538 (19.7%) |
Occupancy by Educational Attainment in Sonterra
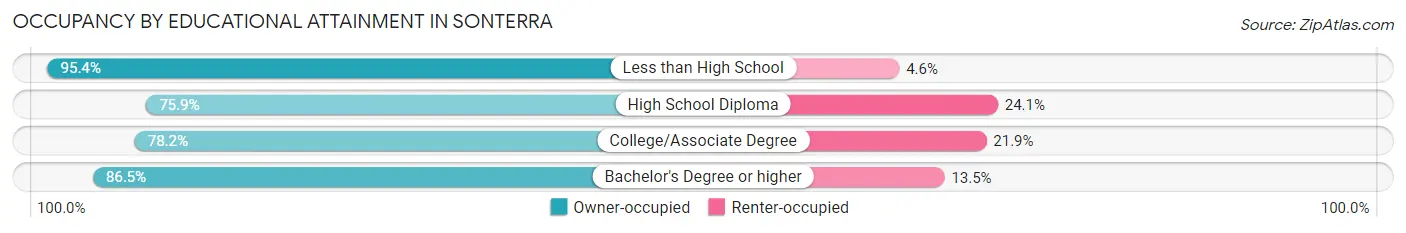
| Household Size | Owner-occupied | Renter-occupied |
| Less than High School | 167 (95.4%) | 8 (4.6%) |
| High School Diploma | 579 (75.9%) | 184 (24.1%) |
| College/Associate Degree | 969 (78.1%) | 271 (21.8%) |
| Bachelor's Degree or higher | 479 (86.5%) | 75 (13.5%) |
Occupancy by Age of Householder in Sonterra
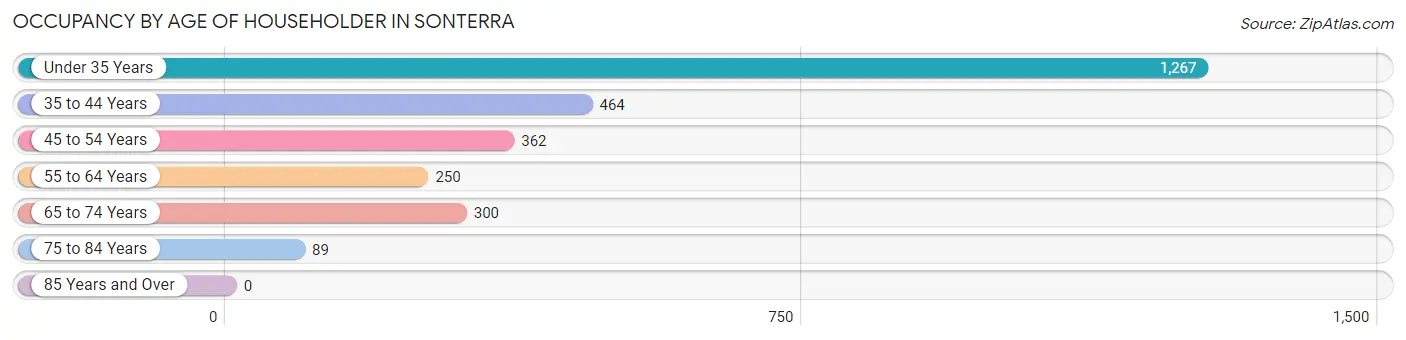
| Age Bracket | # Households | % Households |
| Under 35 Years | 1,267 | 46.4% |
| 35 to 44 Years | 464 | 17.0% |
| 45 to 54 Years | 362 | 13.3% |
| 55 to 64 Years | 250 | 9.1% |
| 65 to 74 Years | 300 | 11.0% |
| 75 to 84 Years | 89 | 3.3% |
| 85 Years and Over | 0 | 0.0% |
| Total | 2,732 | 100.0% |
Housing Finances in Sonterra
Median Income by Occupancy in Sonterra
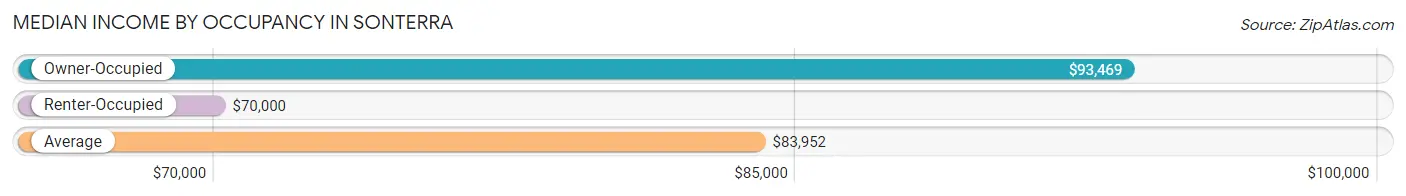
| Occupancy Type | # Households | Median Income |
| Owner-Occupied | 2,194 (80.3%) | $93,469 |
| Renter-Occupied | 538 (19.7%) | $70,000 |
| Average | 2,732 (100.0%) | $83,952 |
Occupancy by Householder Income Bracket in Sonterra
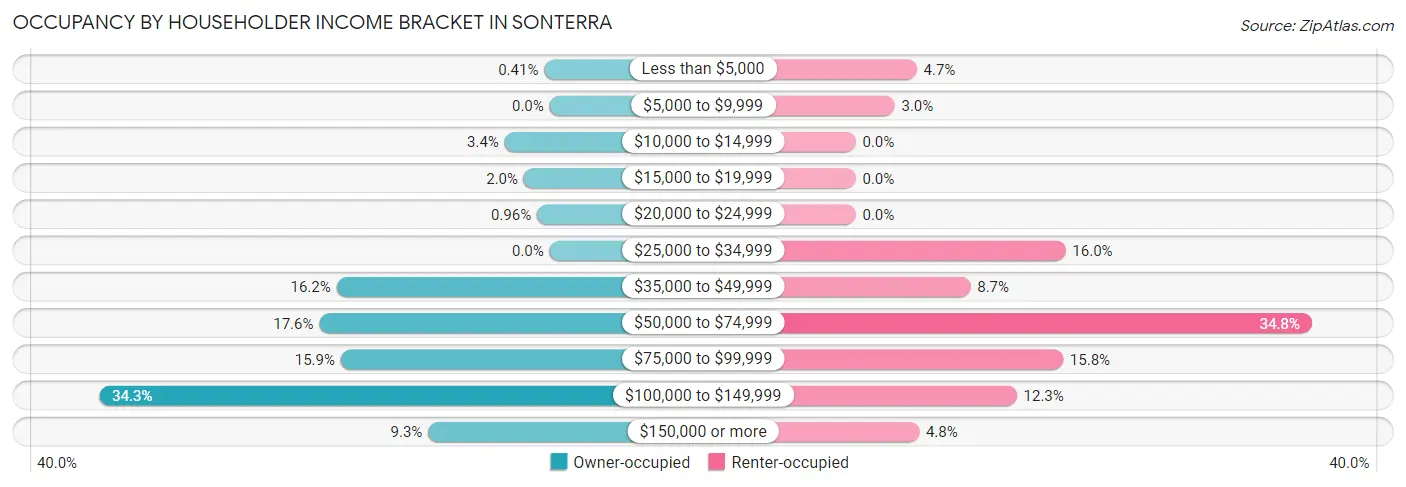
| Income Bracket | Owner-occupied | Renter-occupied |
| Less than $5,000 | 9 (0.4%) | 25 (4.6%) |
| $5,000 to $9,999 | 0 (0.0%) | 16 (3.0%) |
| $10,000 to $14,999 | 75 (3.4%) | 0 (0.0%) |
| $15,000 to $19,999 | 43 (2.0%) | 0 (0.0%) |
| $20,000 to $24,999 | 21 (1.0%) | 0 (0.0%) |
| $25,000 to $34,999 | 0 (0.0%) | 86 (16.0%) |
| $35,000 to $49,999 | 356 (16.2%) | 47 (8.7%) |
| $50,000 to $74,999 | 385 (17.5%) | 187 (34.8%) |
| $75,000 to $99,999 | 349 (15.9%) | 85 (15.8%) |
| $100,000 to $149,999 | 753 (34.3%) | 66 (12.3%) |
| $150,000 or more | 203 (9.2%) | 26 (4.8%) |
| Total | 2,194 (100.0%) | 538 (100.0%) |
Monthly Housing Cost Tiers in Sonterra
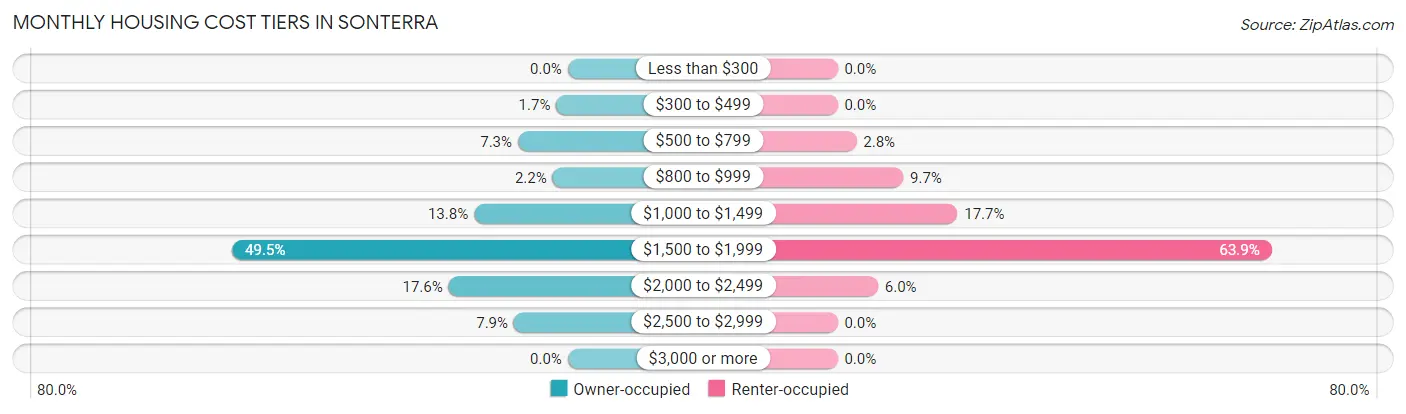
| Monthly Cost | Owner-occupied | Renter-occupied |
| Less than $300 | 0 (0.0%) | 0 (0.0%) |
| $300 to $499 | 37 (1.7%) | 0 (0.0%) |
| $500 to $799 | 161 (7.3%) | 15 (2.8%) |
| $800 to $999 | 49 (2.2%) | 52 (9.7%) |
| $1,000 to $1,499 | 303 (13.8%) | 95 (17.7%) |
| $1,500 to $1,999 | 1,085 (49.4%) | 344 (63.9%) |
| $2,000 to $2,499 | 385 (17.5%) | 32 (5.9%) |
| $2,500 to $2,999 | 174 (7.9%) | 0 (0.0%) |
| $3,000 or more | 0 (0.0%) | 0 (0.0%) |
| Total | 2,194 (100.0%) | 538 (100.0%) |
Physical Housing Characteristics in Sonterra
Housing Structures in Sonterra
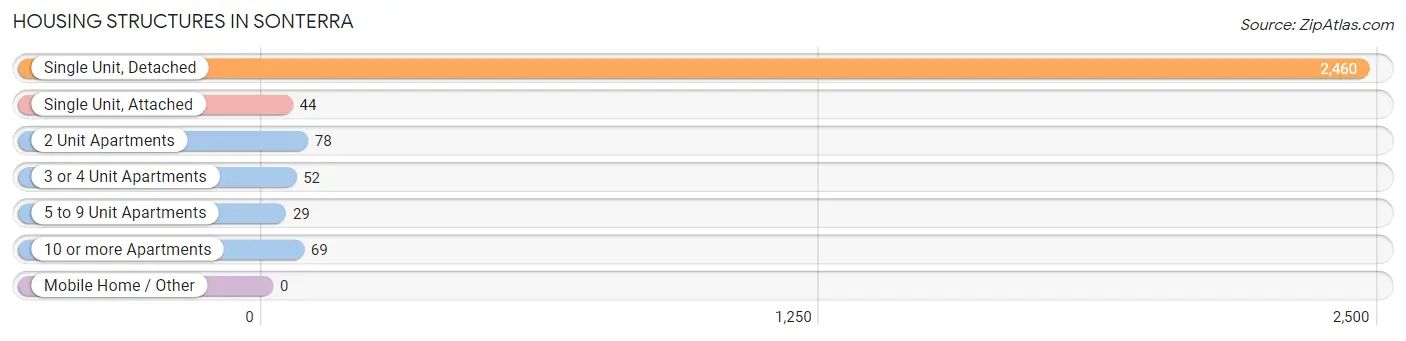
| Structure Type | # Housing Units | % Housing Units |
| Single Unit, Detached | 2,460 | 90.0% |
| Single Unit, Attached | 44 | 1.6% |
| 2 Unit Apartments | 78 | 2.9% |
| 3 or 4 Unit Apartments | 52 | 1.9% |
| 5 to 9 Unit Apartments | 29 | 1.1% |
| 10 or more Apartments | 69 | 2.5% |
| Mobile Home / Other | 0 | 0.0% |
| Total | 2,732 | 100.0% |
Housing Structures by Occupancy in Sonterra
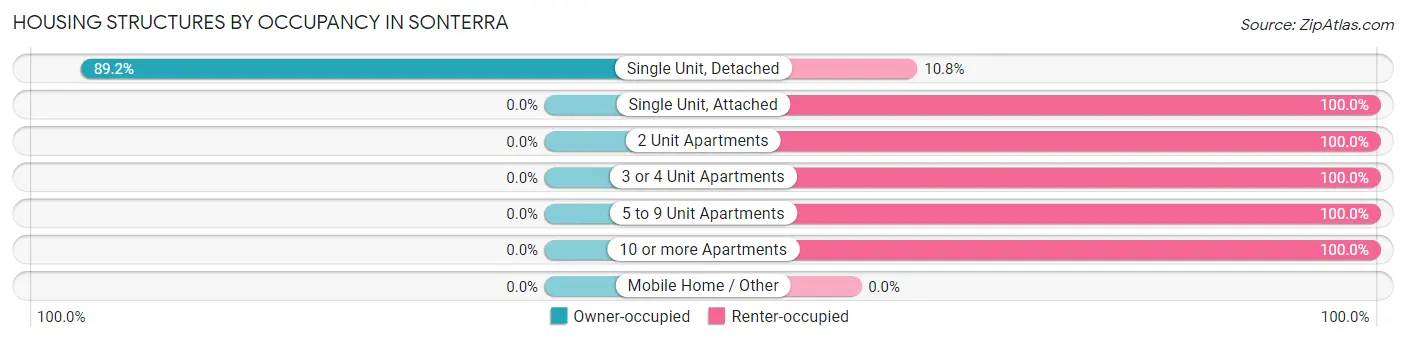
| Structure Type | Owner-occupied | Renter-occupied |
| Single Unit, Detached | 2,194 (89.2%) | 266 (10.8%) |
| Single Unit, Attached | 0 (0.0%) | 44 (100.0%) |
| 2 Unit Apartments | 0 (0.0%) | 78 (100.0%) |
| 3 or 4 Unit Apartments | 0 (0.0%) | 52 (100.0%) |
| 5 to 9 Unit Apartments | 0 (0.0%) | 29 (100.0%) |
| 10 or more Apartments | 0 (0.0%) | 69 (100.0%) |
| Mobile Home / Other | 0 (0.0%) | 0 (0.0%) |
| Total | 2,194 (80.3%) | 538 (19.7%) |
Housing Structures by Number of Rooms in Sonterra
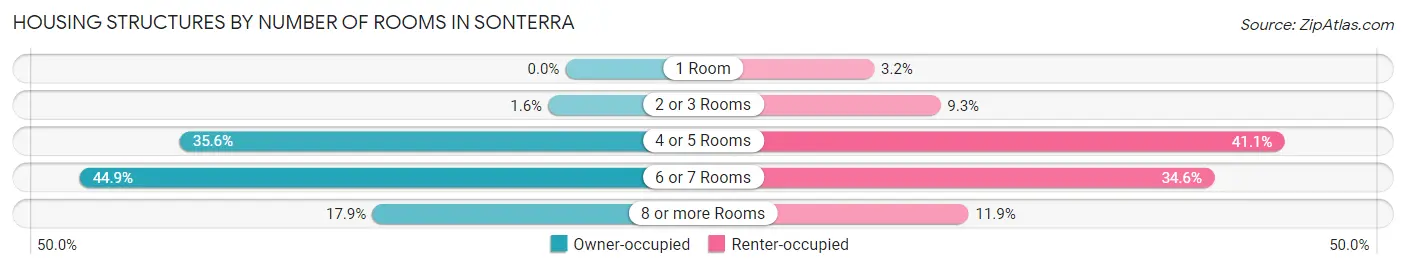
| Number of Rooms | Owner-occupied | Renter-occupied |
| 1 Room | 0 (0.0%) | 17 (3.2%) |
| 2 or 3 Rooms | 35 (1.6%) | 50 (9.3%) |
| 4 or 5 Rooms | 782 (35.6%) | 221 (41.1%) |
| 6 or 7 Rooms | 985 (44.9%) | 186 (34.6%) |
| 8 or more Rooms | 392 (17.9%) | 64 (11.9%) |
| Total | 2,194 (100.0%) | 538 (100.0%) |
Housing Structure by Heating Type in Sonterra
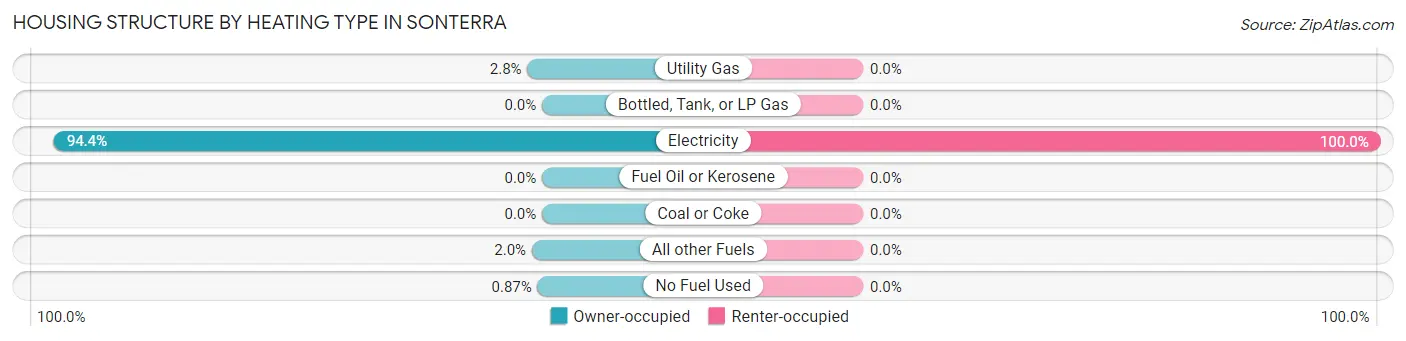
| Heating Type | Owner-occupied | Renter-occupied |
| Utility Gas | 62 (2.8%) | 0 (0.0%) |
| Bottled, Tank, or LP Gas | 0 (0.0%) | 0 (0.0%) |
| Electricity | 2,070 (94.4%) | 538 (100.0%) |
| Fuel Oil or Kerosene | 0 (0.0%) | 0 (0.0%) |
| Coal or Coke | 0 (0.0%) | 0 (0.0%) |
| All other Fuels | 43 (2.0%) | 0 (0.0%) |
| No Fuel Used | 19 (0.9%) | 0 (0.0%) |
| Total | 2,194 (100.0%) | 538 (100.0%) |
Household Vehicle Usage in Sonterra
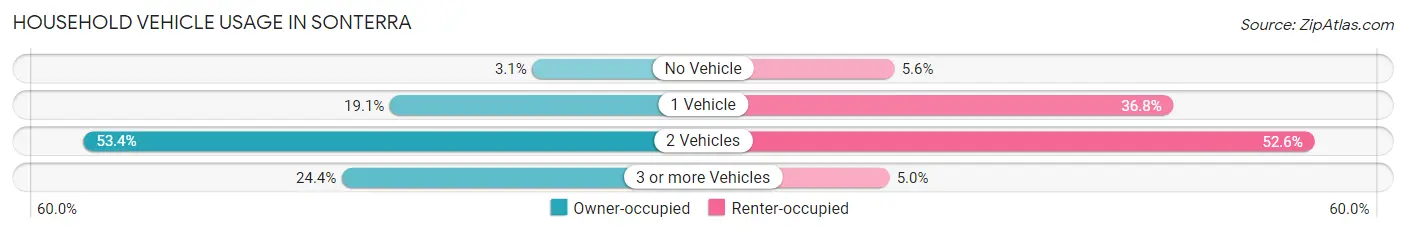
| Vehicles per Household | Owner-occupied | Renter-occupied |
| No Vehicle | 68 (3.1%) | 30 (5.6%) |
| 1 Vehicle | 418 (19.1%) | 198 (36.8%) |
| 2 Vehicles | 1,172 (53.4%) | 283 (52.6%) |
| 3 or more Vehicles | 536 (24.4%) | 27 (5.0%) |
| Total | 2,194 (100.0%) | 538 (100.0%) |
Real Estate & Mortgages in Sonterra
Real Estate and Mortgage Overview in Sonterra
| Characteristic | Without Mortgage | With Mortgage |
| Housing Units | 233 | 1,961 |
| Median Property Value | $267,300 | $235,800 |
| Median Household Income | $90,980 | $191 |
| Monthly Housing Costs | $648 | $0 |
| Real Estate Taxes | $4,288 | $100 |
Property Value by Mortgage Status in Sonterra
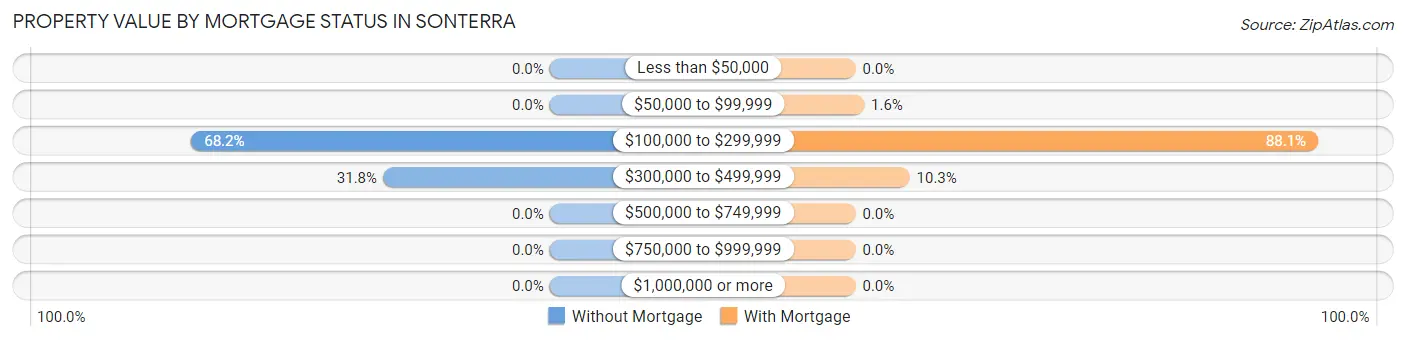
| Property Value | Without Mortgage | With Mortgage |
| Less than $50,000 | 0 (0.0%) | 0 (0.0%) |
| $50,000 to $99,999 | 0 (0.0%) | 32 (1.6%) |
| $100,000 to $299,999 | 159 (68.2%) | 1,727 (88.1%) |
| $300,000 to $499,999 | 74 (31.8%) | 202 (10.3%) |
| $500,000 to $749,999 | 0 (0.0%) | 0 (0.0%) |
| $750,000 to $999,999 | 0 (0.0%) | 0 (0.0%) |
| $1,000,000 or more | 0 (0.0%) | 0 (0.0%) |
| Total | 233 (100.0%) | 1,961 (100.0%) |
Household Income by Mortgage Status in Sonterra
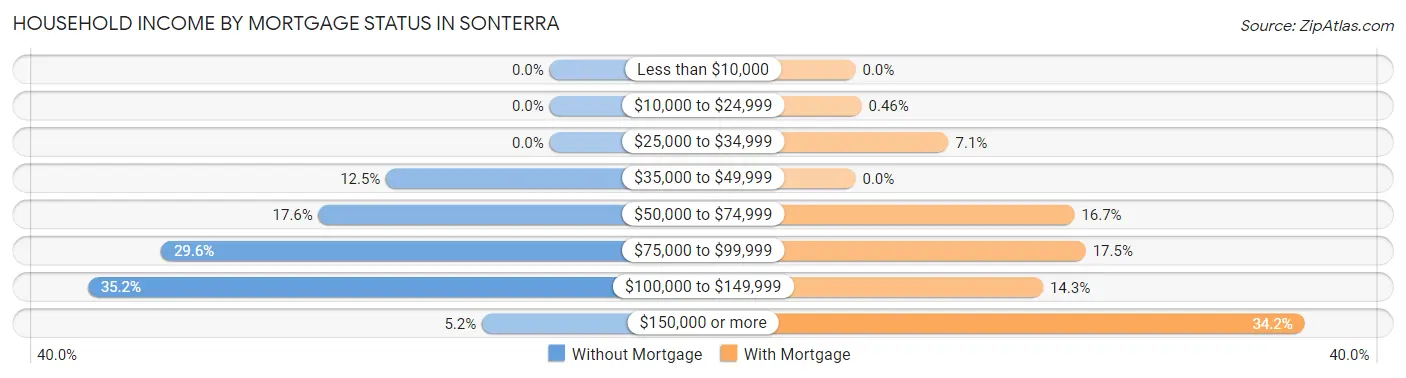
| Household Income | Without Mortgage | With Mortgage |
| Less than $10,000 | 0 (0.0%) | 0 (0.0%) |
| $10,000 to $24,999 | 0 (0.0%) | 9 (0.5%) |
| $25,000 to $34,999 | 0 (0.0%) | 139 (7.1%) |
| $35,000 to $49,999 | 29 (12.4%) | 0 (0.0%) |
| $50,000 to $74,999 | 41 (17.6%) | 327 (16.7%) |
| $75,000 to $99,999 | 69 (29.6%) | 344 (17.5%) |
| $100,000 to $149,999 | 82 (35.2%) | 280 (14.3%) |
| $150,000 or more | 12 (5.1%) | 671 (34.2%) |
| Total | 233 (100.0%) | 1,961 (100.0%) |
Property Value to Household Income Ratio in Sonterra
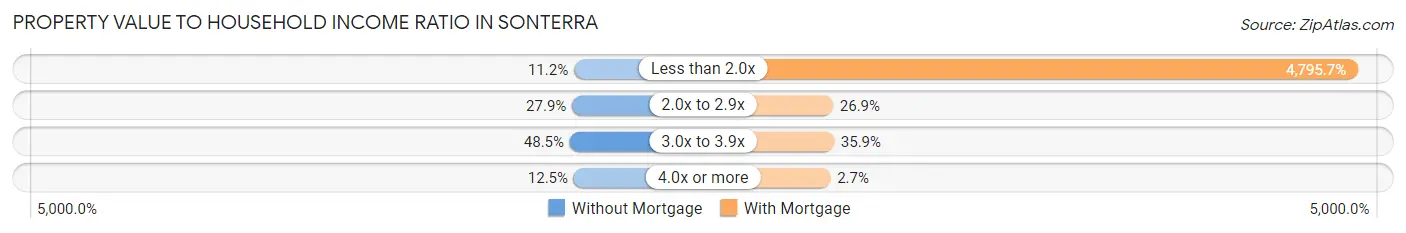
| Value-to-Income Ratio | Without Mortgage | With Mortgage |
| Less than 2.0x | 26 (11.2%) | 94,043 (4,795.7%) |
| 2.0x to 2.9x | 65 (27.9%) | 528 (26.9%) |
| 3.0x to 3.9x | 113 (48.5%) | 704 (35.9%) |
| 4.0x or more | 29 (12.4%) | 53 (2.7%) |
| Total | 233 (100.0%) | 1,961 (100.0%) |
Real Estate Taxes by Mortgage Status in Sonterra
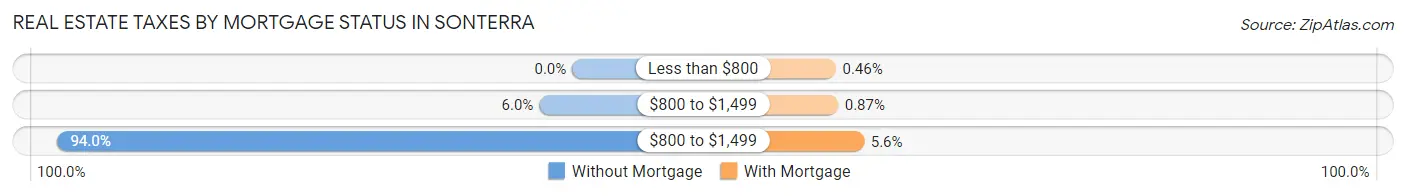
| Property Taxes | Without Mortgage | With Mortgage |
| Less than $800 | 0 (0.0%) | 9 (0.5%) |
| $800 to $1,499 | 14 (6.0%) | 17 (0.9%) |
| $800 to $1,499 | 219 (94.0%) | 110 (5.6%) |
| Total | 233 (100.0%) | 1,961 (100.0%) |
Health & Disability in Sonterra
Health Insurance Coverage by Age in Sonterra
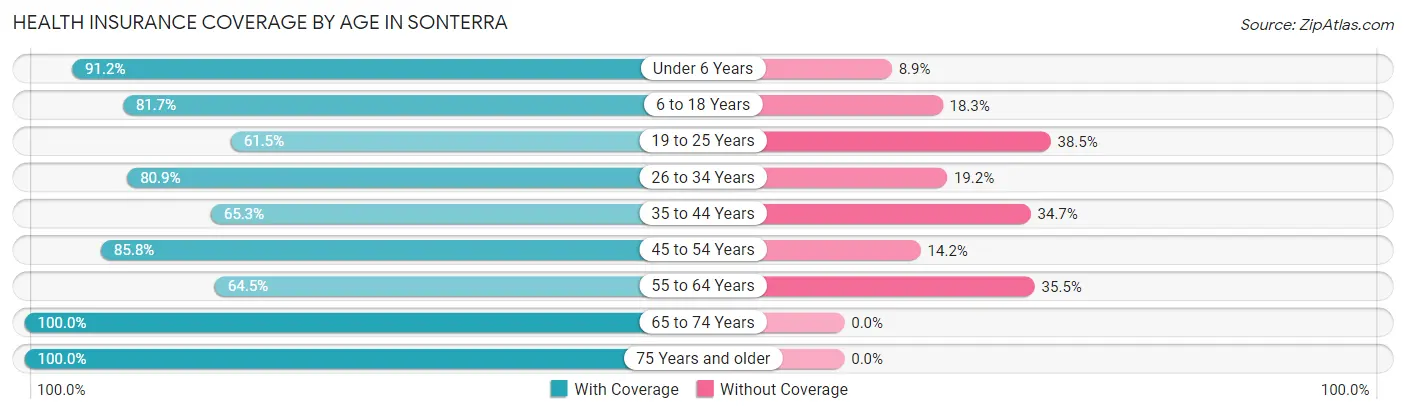
| Age Bracket | With Coverage | Without Coverage |
| Under 6 Years | 711 (91.1%) | 69 (8.8%) |
| 6 to 18 Years | 1,315 (81.7%) | 295 (18.3%) |
| 19 to 25 Years | 456 (61.5%) | 285 (38.5%) |
| 26 to 34 Years | 1,786 (80.8%) | 423 (19.2%) |
| 35 to 44 Years | 744 (65.3%) | 396 (34.7%) |
| 45 to 54 Years | 572 (85.8%) | 95 (14.2%) |
| 55 to 64 Years | 218 (64.5%) | 120 (35.5%) |
| 65 to 74 Years | 343 (100.0%) | 0 (0.0%) |
| 75 Years and older | 215 (100.0%) | 0 (0.0%) |
| Total | 6,360 (79.1%) | 1,683 (20.9%) |
Health Insurance Coverage by Citizenship Status in Sonterra
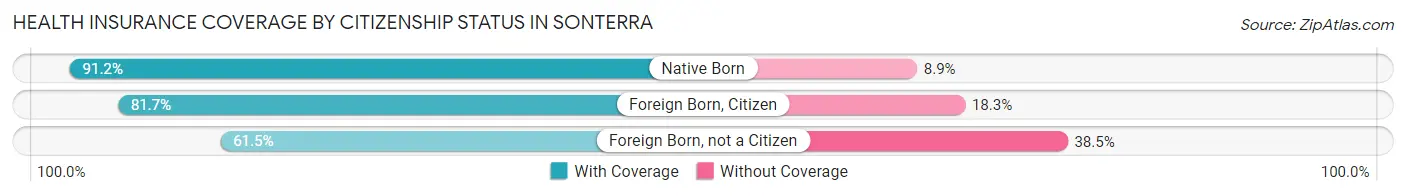
| Citizenship Status | With Coverage | Without Coverage |
| Native Born | 711 (91.1%) | 69 (8.8%) |
| Foreign Born, Citizen | 1,315 (81.7%) | 295 (18.3%) |
| Foreign Born, not a Citizen | 456 (61.5%) | 285 (38.5%) |
Health Insurance Coverage by Household Income in Sonterra
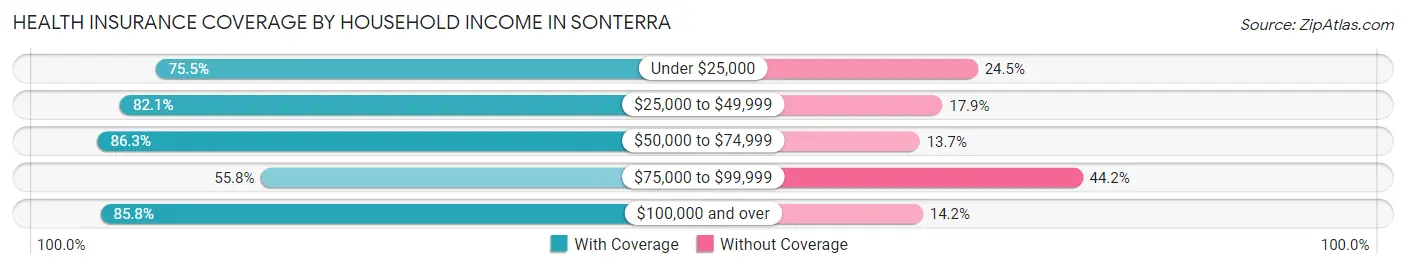
| Household Income | With Coverage | Without Coverage |
| Under $25,000 | 320 (75.5%) | 104 (24.5%) |
| $25,000 to $49,999 | 1,244 (82.1%) | 271 (17.9%) |
| $50,000 to $74,999 | 1,061 (86.3%) | 168 (13.7%) |
| $75,000 to $99,999 | 832 (55.8%) | 658 (44.2%) |
| $100,000 and over | 2,903 (85.8%) | 482 (14.2%) |
Public vs Private Health Insurance Coverage by Age in Sonterra
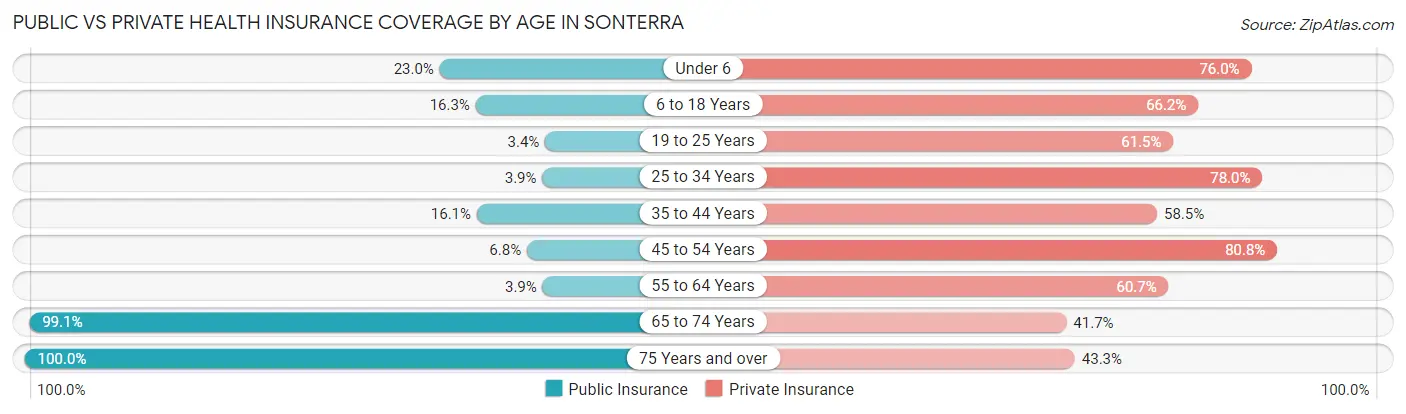
| Age Bracket | Public Insurance | Private Insurance |
| Under 6 | 179 (23.0%) | 593 (76.0%) |
| 6 to 18 Years | 262 (16.3%) | 1,065 (66.1%) |
| 19 to 25 Years | 25 (3.4%) | 456 (61.5%) |
| 25 to 34 Years | 86 (3.9%) | 1,724 (78.0%) |
| 35 to 44 Years | 183 (16.1%) | 667 (58.5%) |
| 45 to 54 Years | 45 (6.8%) | 539 (80.8%) |
| 55 to 64 Years | 13 (3.8%) | 205 (60.7%) |
| 65 to 74 Years | 340 (99.1%) | 143 (41.7%) |
| 75 Years and over | 215 (100.0%) | 93 (43.3%) |
| Total | 1,348 (16.8%) | 5,485 (68.2%) |
Disability Status by Sex by Age in Sonterra
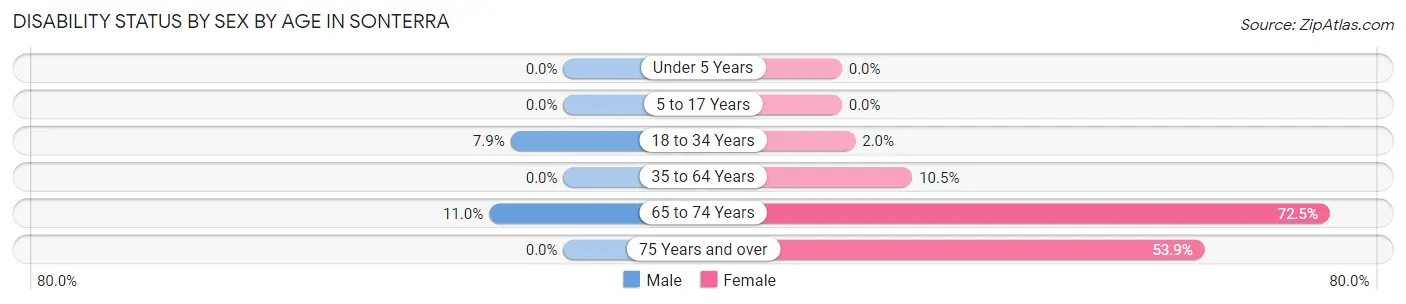
| Age Bracket | Male | Female |
| Under 5 Years | 0 (0.0%) | 0 (0.0%) |
| 5 to 17 Years | 0 (0.0%) | 0 (0.0%) |
| 18 to 34 Years | 113 (7.9%) | 32 (2.0%) |
| 35 to 64 Years | 0 (0.0%) | 117 (10.5%) |
| 65 to 74 Years | 15 (11.0%) | 150 (72.5%) |
| 75 Years and over | 0 (0.0%) | 98 (53.8%) |
Disability Class by Sex by Age in Sonterra
Disability Class: Hearing Difficulty
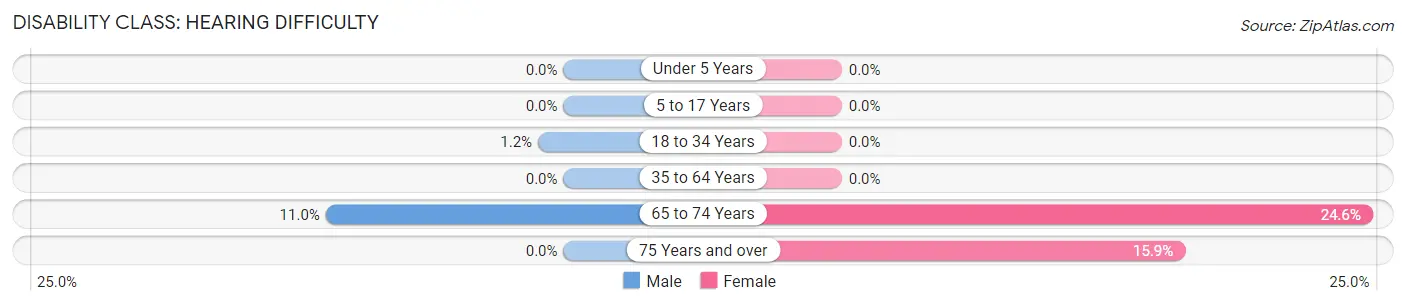
| Age Bracket | Male | Female |
| Under 5 Years | 0 (0.0%) | 0 (0.0%) |
| 5 to 17 Years | 0 (0.0%) | 0 (0.0%) |
| 18 to 34 Years | 17 (1.2%) | 0 (0.0%) |
| 35 to 64 Years | 0 (0.0%) | 0 (0.0%) |
| 65 to 74 Years | 15 (11.0%) | 51 (24.6%) |
| 75 Years and over | 0 (0.0%) | 29 (15.9%) |
Disability Class: Vision Difficulty
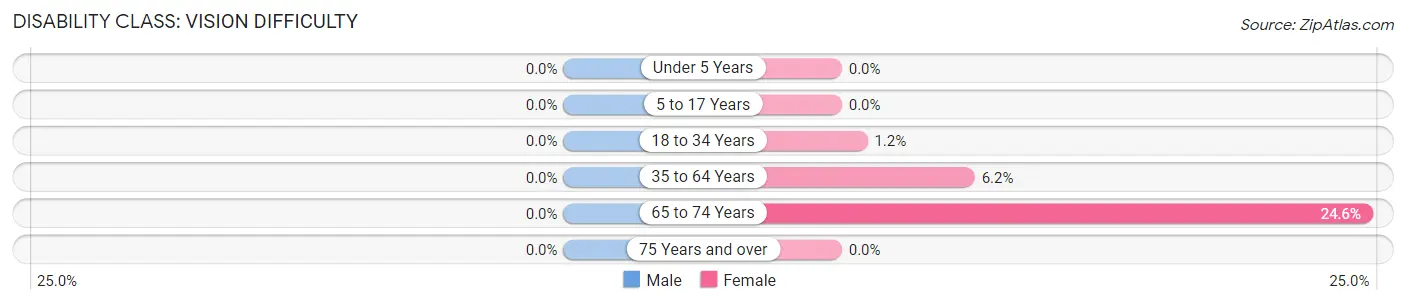
| Age Bracket | Male | Female |
| Under 5 Years | 0 (0.0%) | 0 (0.0%) |
| 5 to 17 Years | 0 (0.0%) | 0 (0.0%) |
| 18 to 34 Years | 0 (0.0%) | 19 (1.2%) |
| 35 to 64 Years | 0 (0.0%) | 69 (6.2%) |
| 65 to 74 Years | 0 (0.0%) | 51 (24.6%) |
| 75 Years and over | 0 (0.0%) | 0 (0.0%) |
Disability Class: Cognitive Difficulty
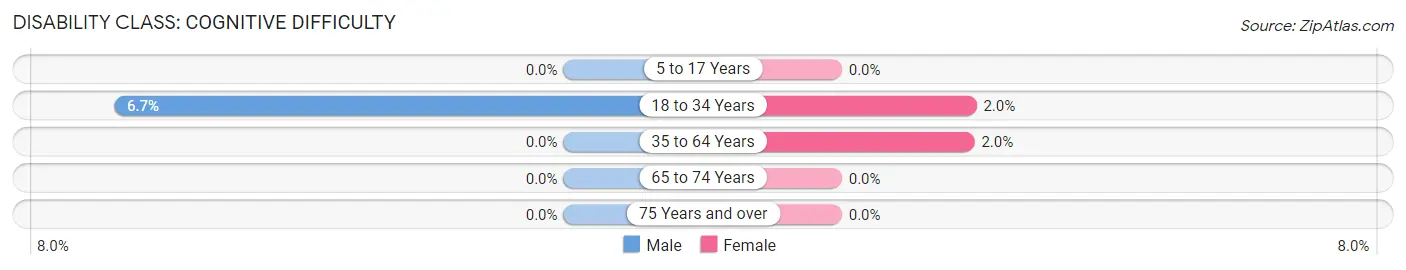
| Age Bracket | Male | Female |
| 5 to 17 Years | 0 (0.0%) | 0 (0.0%) |
| 18 to 34 Years | 96 (6.7%) | 32 (2.0%) |
| 35 to 64 Years | 0 (0.0%) | 22 (2.0%) |
| 65 to 74 Years | 0 (0.0%) | 0 (0.0%) |
| 75 Years and over | 0 (0.0%) | 0 (0.0%) |
Disability Class: Ambulatory Difficulty
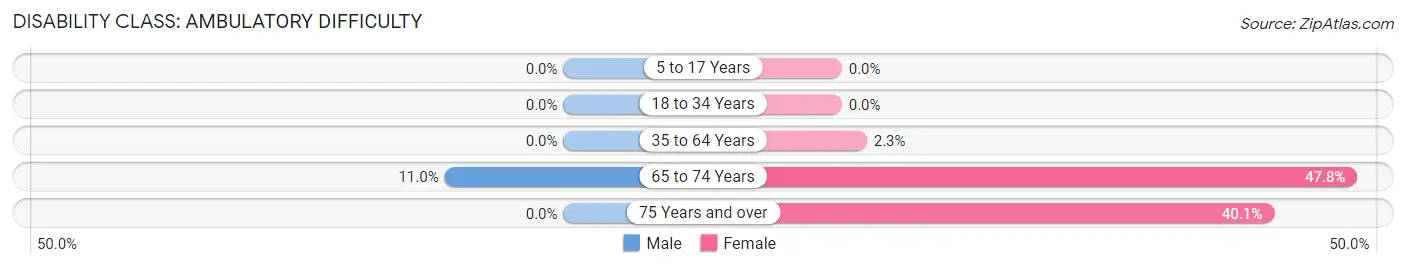
| Age Bracket | Male | Female |
| 5 to 17 Years | 0 (0.0%) | 0 (0.0%) |
| 18 to 34 Years | 0 (0.0%) | 0 (0.0%) |
| 35 to 64 Years | 0 (0.0%) | 26 (2.3%) |
| 65 to 74 Years | 15 (11.0%) | 99 (47.8%) |
| 75 Years and over | 0 (0.0%) | 73 (40.1%) |
Disability Class: Self-Care Difficulty
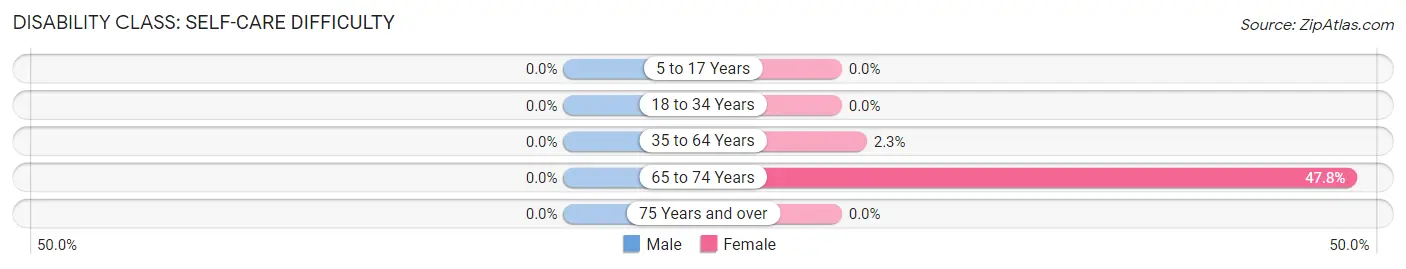
| Age Bracket | Male | Female |
| 5 to 17 Years | 0 (0.0%) | 0 (0.0%) |
| 18 to 34 Years | 0 (0.0%) | 0 (0.0%) |
| 35 to 64 Years | 0 (0.0%) | 26 (2.3%) |
| 65 to 74 Years | 0 (0.0%) | 99 (47.8%) |
| 75 Years and over | 0 (0.0%) | 0 (0.0%) |
Technology Access in Sonterra
Computing Device Access in Sonterra
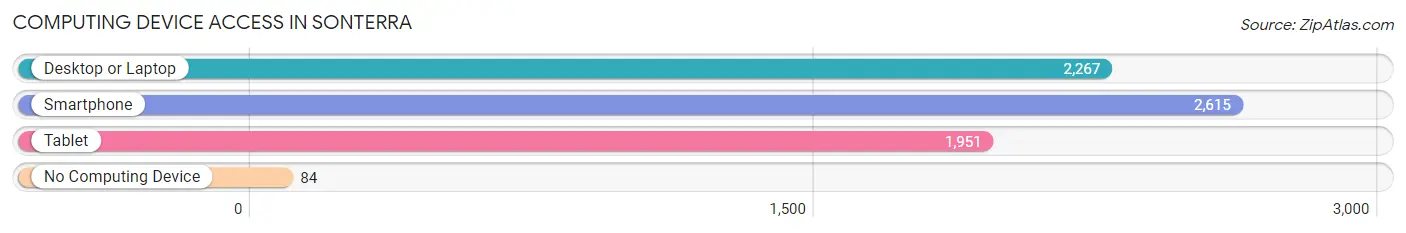
| Device Type | # Households | % Households |
| Desktop or Laptop | 2,267 | 83.0% |
| Smartphone | 2,615 | 95.7% |
| Tablet | 1,951 | 71.4% |
| No Computing Device | 84 | 3.1% |
| Total | 2,732 | 100.0% |
Internet Access in Sonterra
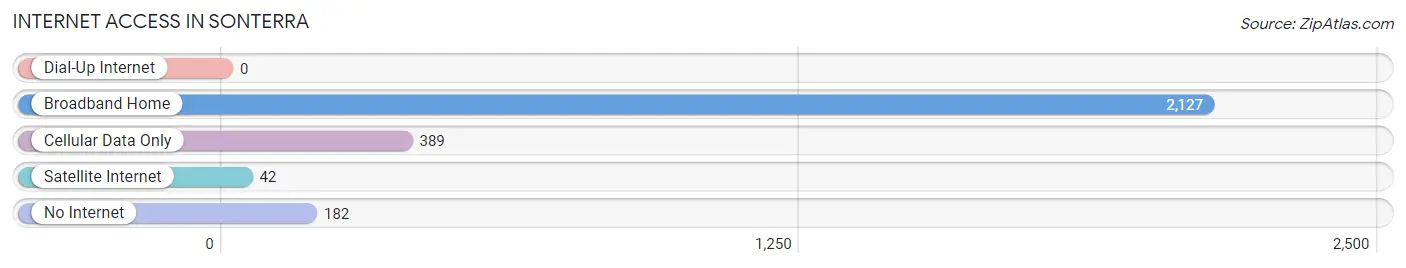
| Internet Type | # Households | % Households |
| Dial-Up Internet | 0 | 0.0% |
| Broadband Home | 2,127 | 77.9% |
| Cellular Data Only | 389 | 14.2% |
| Satellite Internet | 42 | 1.5% |
| No Internet | 182 | 6.7% |
| Total | 2,732 | 100.0% |
Sonterra Summary
Sonterra, TX is a small town located in the state of Texas, in the United States. It is situated in the county of Bexar, and is part of the San Antonio metropolitan area. The town has a population of around 1,500 people, and is known for its small-town charm and friendly atmosphere.
History
The area that is now Sonterra was first settled in the late 1800s by German immigrants. The town was originally called “Sonterra”, which is a combination of the Spanish words “son” (sun) and “terra” (earth). The name was chosen to reflect the area’s sunny climate and fertile soil.
In the early 1900s, the town began to grow and develop. The first school was built in 1910, and the first post office was established in 1912. The town was officially incorporated in 1915.
In the 1950s, the town began to experience a period of growth and development. The population increased from around 500 people in 1950 to over 1,000 people in 1960. This growth was largely due to the development of the nearby military base, Lackland Air Force Base.
Geography
Sonterra is located in the south-central part of Texas, in Bexar County. It is situated about 20 miles north of downtown San Antonio. The town is located in a flat, open area, with rolling hills and grassy plains. The climate is generally mild, with hot summers and mild winters.
The town is bordered by the cities of San Antonio, Helotes, and Leon Valley. It is also close to the Medina River, which provides a natural border between Sonterra and the neighboring towns.
Economy
The economy of Sonterra is largely based on agriculture and tourism. The town is home to several farms, which produce a variety of crops, including corn, cotton, and wheat. The town is also home to several wineries, which produce a variety of wines.
The town is also home to several small businesses, including restaurants, shops, and other services. The town is also home to several large employers, including the nearby Lackland Air Force Base.
Demographics
As of the 2010 census, the population of Sonterra was 1,521 people. The racial makeup of the town was 79.3% White, 0.7% African American, 0.2% Native American, 0.2% Asian, 0.1% Pacific Islander, 17.2% from other races, and 2.5% from two or more races. Hispanic or Latino of any race were 33.2% of the population.
The median household income in Sonterra was $41,250, and the median family income was $45,625. The per capita income for the town was $19,945. About 11.2% of families and 13.2% of the population were below the poverty line, including 17.2% of those under age 18 and 8.2% of those age 65 or over.
Conclusion
Sonterra, TX is a small town located in the state of Texas, in the United States. It is situated in the county of Bexar, and is part of the San Antonio metropolitan area. The town has a population of around 1,500 people, and is known for its small-town charm and friendly atmosphere. The town’s economy is largely based on agriculture and tourism, and it is home to several large employers, including the nearby Lackland Air Force Base. The town has a diverse population, with a mix of different racial and ethnic backgrounds. Sonterra is a great place to live, work, and visit, and is a great example of the small-town charm that can be found in Texas.
Common Questions
What is the Total Population of Sonterra?
Total Population of Sonterra is 8,082.
What is the Total Male Population of Sonterra?
Total Male Population of Sonterra is 3,718.
What is the Total Female Population of Sonterra?
Total Female Population of Sonterra is 4,364.
What is the Ratio of Males per 100 Females in Sonterra?
There are 85.20 Males per 100 Females in Sonterra.
What is the Ratio of Females per 100 Males in Sonterra?
There are 117.37 Females per 100 Males in Sonterra.
What is the Median Population Age in Sonterra?
Median Population Age in Sonterra is 29.3 Years.
What is the Average Family Size in Sonterra
Average Family Size in Sonterra is 3.5 People.
What is the Average Household Size in Sonterra
Average Household Size in Sonterra is 3.0 People.
What is Per Capita Income in Sonterra?
Per Capita income in Sonterra is $31,475.
What is the Median Family Income in Sonterra?
Median Family Income in Sonterra is $91,957.
What is the Median Household income in Sonterra?
Median Household Income in Sonterra is $83,952.
What is Income or Wage Gap in Sonterra?
Income or Wage Gap in Sonterra is 23.4%.
Women in Sonterra earn 76.6 cents for every dollar earned by a man.
What is Family Income Deficit in Sonterra?
Family Income Deficit in Sonterra is $8,565.
Families that are below poverty line in Sonterra earn $8,565 less on average than the poverty threshold level.
What is Inequality or Gini Index in Sonterra?
Inequality or Gini Index in Sonterra is 0.31.
How Large is the Labor Force in Sonterra?
There are 4,827 People in the Labor Forcein in Sonterra.
What is the Percentage of People in the Labor Force in Sonterra?
79.9% of People are in the Labor Force in Sonterra.
What is the Unemployment Rate in Sonterra?
Unemployment Rate in Sonterra is 5.5%.