Crane, TX
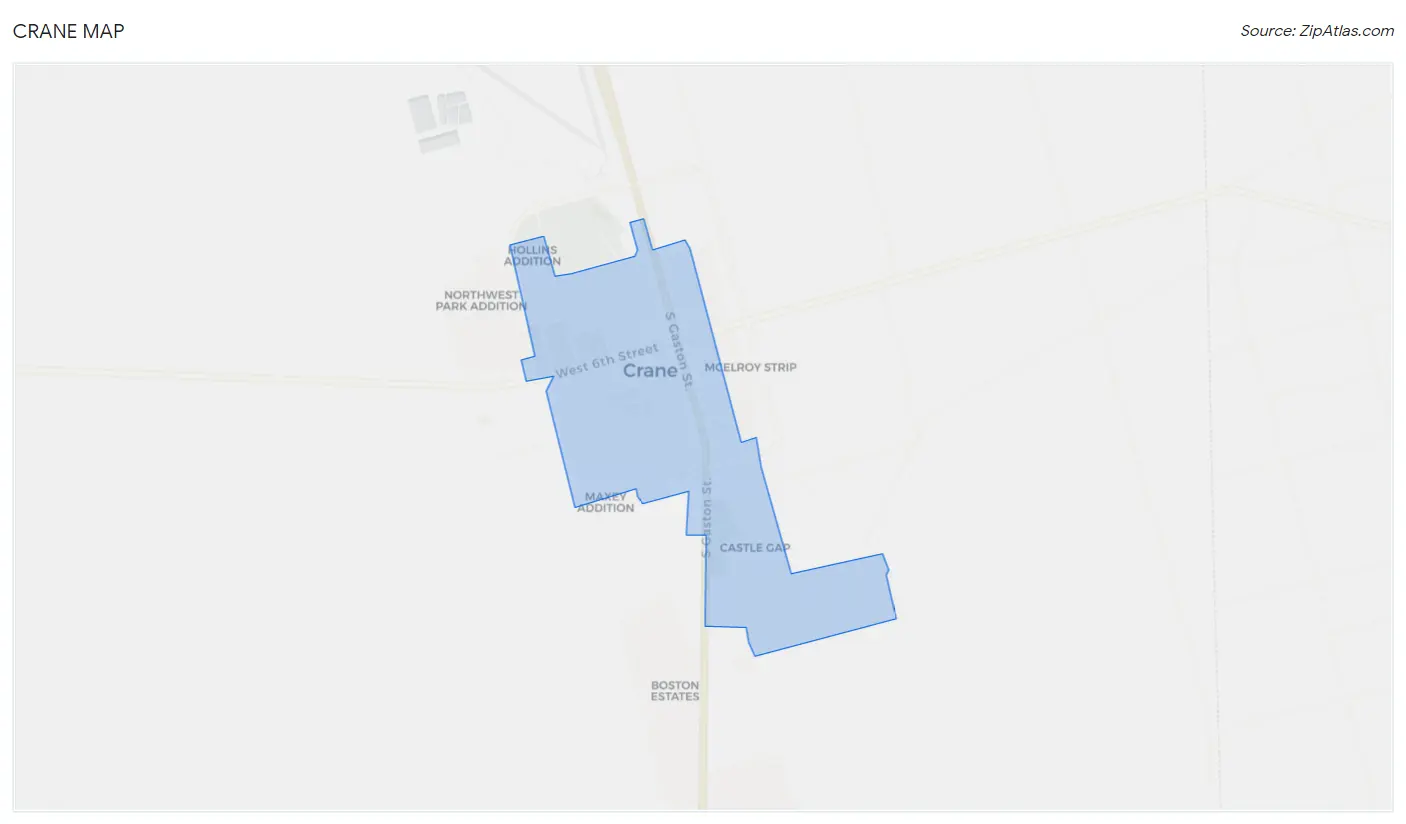
Crane Map
Crane Overview
3,456
TOTAL POPULATION
1,606
MALE POPULATION
1,850
FEMALE POPULATION
86.81
MALES / 100 FEMALES
115.19
FEMALES / 100 MALES
37.8
MEDIAN AGE
3.5
AVG FAMILY SIZE
2.8
AVG HOUSEHOLD SIZE
$33,031
PER CAPITA INCOME
$83,542
AVG FAMILY INCOME
$73,977
AVG HOUSEHOLD INCOME
42.1%
WAGE / INCOME GAP [ % ]
57.9¢/ $1
WAGE / INCOME GAP [ $ ]
0.37
INEQUALITY / GINI INDEX
1,779
LABOR FORCE [ PEOPLE ]
66.5%
PERCENT IN LABOR FORCE
2.1%
UNEMPLOYMENT RATE
Crane Zip Codes
Crane Area Codes
Race in Crane
The most populous races in Crane are Hispanic or Latino (2,279 | 65.9%), Some other Race (1,597 | 46.2%), and White / Caucasian (1,491 | 43.1%).
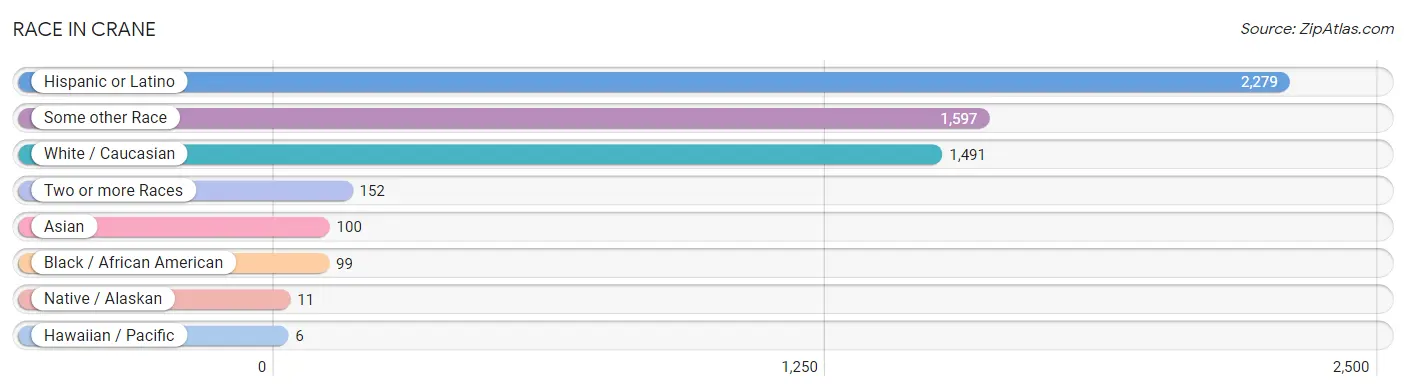
| Race | # Population | % Population |
| Asian | 100 | 2.9% |
| Black / African American | 99 | 2.9% |
| Hawaiian / Pacific | 6 | 0.2% |
| Hispanic or Latino | 2,279 | 65.9% |
| Native / Alaskan | 11 | 0.3% |
| White / Caucasian | 1,491 | 43.1% |
| Two or more Races | 152 | 4.4% |
| Some other Race | 1,597 | 46.2% |
| Total | 3,456 | 100.0% |
Ancestry in Crane
The most populous ancestries reported in Crane are Mexican (2,179 | 63.0%), English (234 | 6.8%), German (171 | 5.0%), Irish (95 | 2.8%), and American (91 | 2.6%), together accounting for 80.1% of all Crane residents.
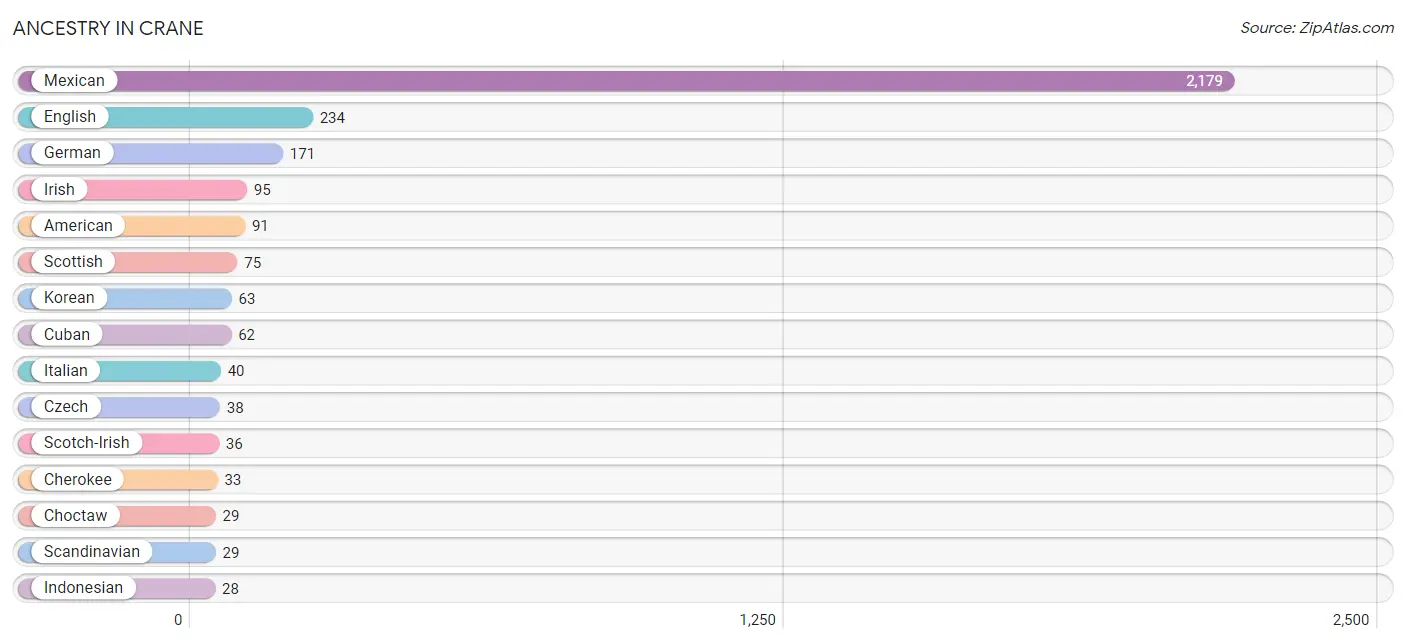
| Ancestry | # Population | % Population |
| Alaska Native | 1 | 0.0% |
| American | 91 | 2.6% |
| Arab | 11 | 0.3% |
| British | 10 | 0.3% |
| Cherokee | 33 | 0.9% |
| Choctaw | 29 | 0.8% |
| Comanche | 26 | 0.7% |
| Cuban | 62 | 1.8% |
| Czech | 38 | 1.1% |
| Danish | 13 | 0.4% |
| Dutch | 24 | 0.7% |
| English | 234 | 6.8% |
| European | 13 | 0.4% |
| French | 2 | 0.1% |
| German | 171 | 5.0% |
| Guamanian / Chamorro | 19 | 0.5% |
| Indonesian | 28 | 0.8% |
| Irish | 95 | 2.8% |
| Italian | 40 | 1.2% |
| Korean | 63 | 1.8% |
| Mexican | 2,179 | 63.0% |
| Moroccan | 11 | 0.3% |
| Pakistani | 4 | 0.1% |
| Puerto Rican | 24 | 0.7% |
| Scandinavian | 29 | 0.8% |
| Scotch-Irish | 36 | 1.0% |
| Scottish | 75 | 2.2% |
| Sri Lankan | 5 | 0.1% | View All 28 Rows |
Immigrants in Crane
The most numerous immigrant groups reported in Crane came from Latin America (620 | 17.9%), Central America (558 | 16.2%), Mexico (553 | 16.0%), Asia (73 | 2.1%), and South Eastern Asia (73 | 2.1%), together accounting for 54.3% of all Crane residents.
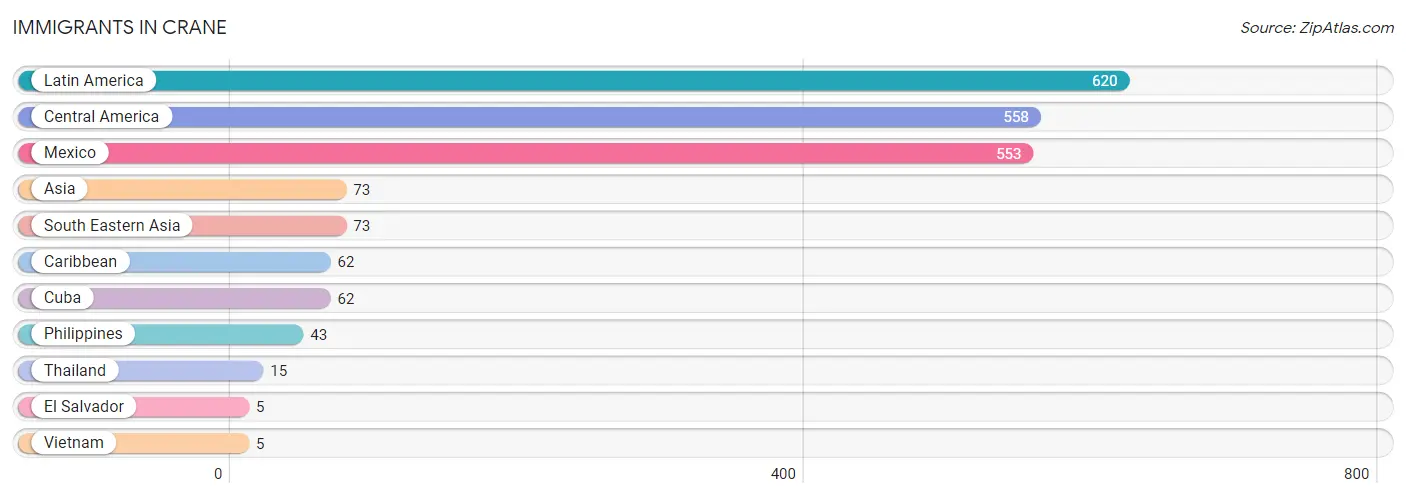
| Immigration Origin | # Population | % Population |
| Asia | 73 | 2.1% |
| Caribbean | 62 | 1.8% |
| Central America | 558 | 16.2% |
| Cuba | 62 | 1.8% |
| El Salvador | 5 | 0.1% |
| Latin America | 620 | 17.9% |
| Mexico | 553 | 16.0% |
| Philippines | 43 | 1.2% |
| South Eastern Asia | 73 | 2.1% |
| Thailand | 15 | 0.4% |
| Vietnam | 5 | 0.1% | View All 11 Rows |
Sex and Age in Crane
Sex and Age in Crane
The most populous age groups in Crane are 20 to 24 Years (227 | 14.1%) for men and Under 5 Years (269 | 14.5%) for women.
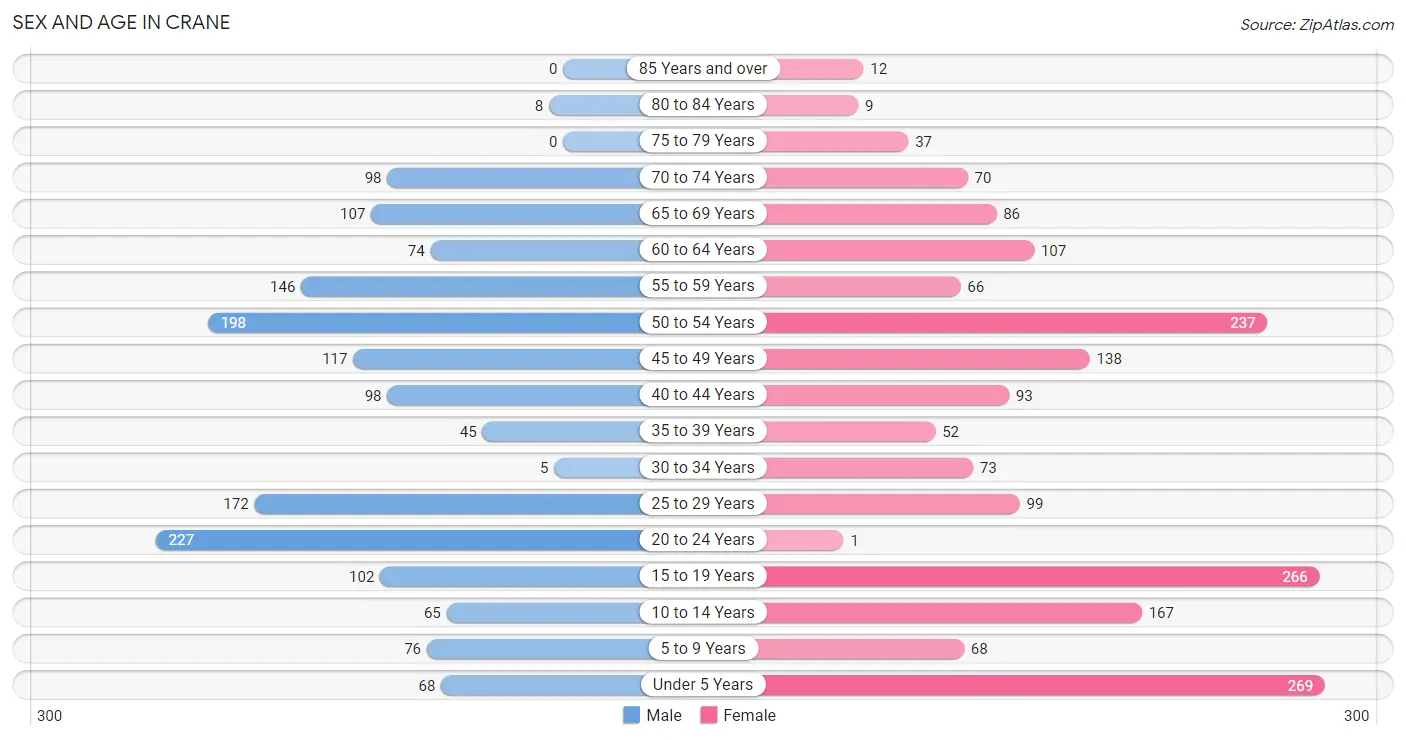
| Age Bracket | Male | Female |
| Under 5 Years | 68 (4.2%) | 269 (14.5%) |
| 5 to 9 Years | 76 (4.7%) | 68 (3.7%) |
| 10 to 14 Years | 65 (4.1%) | 167 (9.0%) |
| 15 to 19 Years | 102 (6.4%) | 266 (14.4%) |
| 20 to 24 Years | 227 (14.1%) | 1 (0.1%) |
| 25 to 29 Years | 172 (10.7%) | 99 (5.3%) |
| 30 to 34 Years | 5 (0.3%) | 73 (4.0%) |
| 35 to 39 Years | 45 (2.8%) | 52 (2.8%) |
| 40 to 44 Years | 98 (6.1%) | 93 (5.0%) |
| 45 to 49 Years | 117 (7.3%) | 138 (7.5%) |
| 50 to 54 Years | 198 (12.3%) | 237 (12.8%) |
| 55 to 59 Years | 146 (9.1%) | 66 (3.6%) |
| 60 to 64 Years | 74 (4.6%) | 107 (5.8%) |
| 65 to 69 Years | 107 (6.7%) | 86 (4.6%) |
| 70 to 74 Years | 98 (6.1%) | 70 (3.8%) |
| 75 to 79 Years | 0 (0.0%) | 37 (2.0%) |
| 80 to 84 Years | 8 (0.5%) | 9 (0.5%) |
| 85 Years and over | 0 (0.0%) | 12 (0.6%) |
| Total | 1,606 (100.0%) | 1,850 (100.0%) |
Families and Households in Crane
Median Family Size in Crane
The median family size in Crane is 3.50 persons per family, with single female/mother families (119 | 13.9%) accounting for the largest median family size of 4.52 persons per family. On the other hand, single male/father families (44 | 5.1%) represent the smallest median family size with 2.11 persons per family.
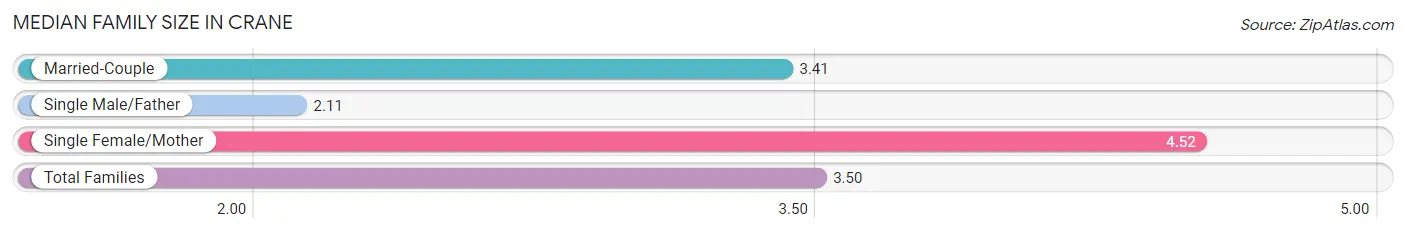
| Family Type | # Families | Family Size |
| Married-Couple | 696 (81.0%) | 3.41 |
| Single Male/Father | 44 (5.1%) | 2.11 |
| Single Female/Mother | 119 (13.9%) | 4.52 |
| Total Families | 859 (100.0%) | 3.50 |
Median Household Size in Crane
The median household size in Crane is 2.84 persons per household, with single female/mother households (119 | 9.9%) accounting for the largest median household size of 4.63 persons per household. non-family households (344 | 28.6%) represent the smallest median household size with 1.16 persons per household.
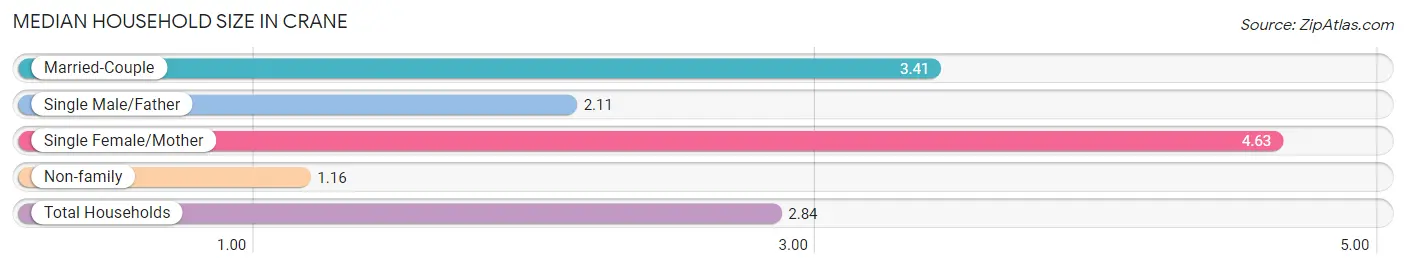
| Household Type | # Households | Household Size |
| Married-Couple | 696 (57.9%) | 3.41 |
| Single Male/Father | 44 (3.7%) | 2.11 |
| Single Female/Mother | 119 (9.9%) | 4.63 |
| Non-family | 344 (28.6%) | 1.16 |
| Total Households | 1,203 (100.0%) | 2.84 |
Household Size by Marriage Status in Crane
Out of a total of 1,203 households in Crane, 859 (71.4%) are family households, while 344 (28.6%) are nonfamily households. The most numerous type of family households are 2-person households, comprising 408, and the most common type of nonfamily households are 1-person households, comprising 285.
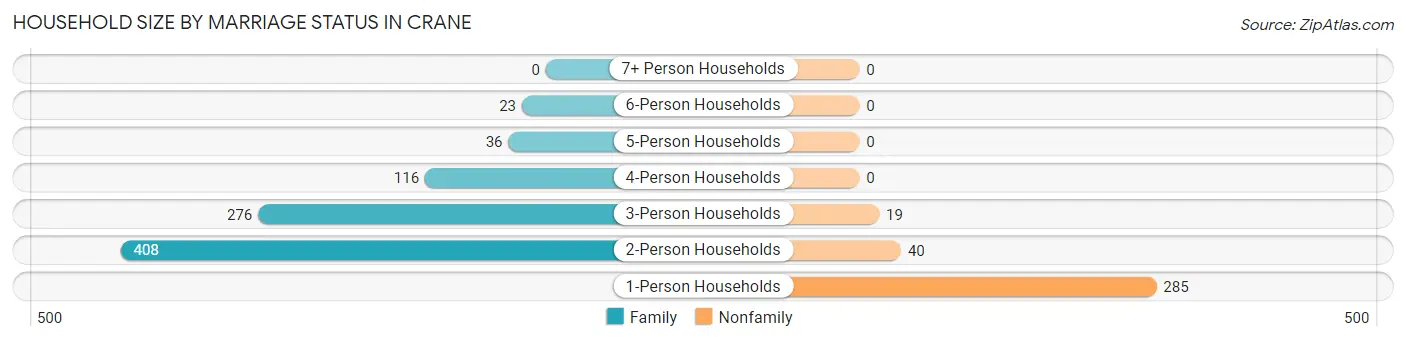
| Household Size | Family Households | Nonfamily Households |
| 1-Person Households | - | 285 (23.7%) |
| 2-Person Households | 408 (33.9%) | 40 (3.3%) |
| 3-Person Households | 276 (22.9%) | 19 (1.6%) |
| 4-Person Households | 116 (9.6%) | 0 (0.0%) |
| 5-Person Households | 36 (3.0%) | 0 (0.0%) |
| 6-Person Households | 23 (1.9%) | 0 (0.0%) |
| 7+ Person Households | 0 (0.0%) | 0 (0.0%) |
| Total | 859 (71.4%) | 344 (28.6%) |
Female Fertility in Crane
Fertility by Age in Crane
Average fertility rate in Crane is 14.0 births per 1,000 women. Women in the age bracket of 35 to 50 years have the highest fertility rate with 32.0 births per 1,000 women. Women in the age bracket of 35 to 50 years acount for 100.0% of all women with births.
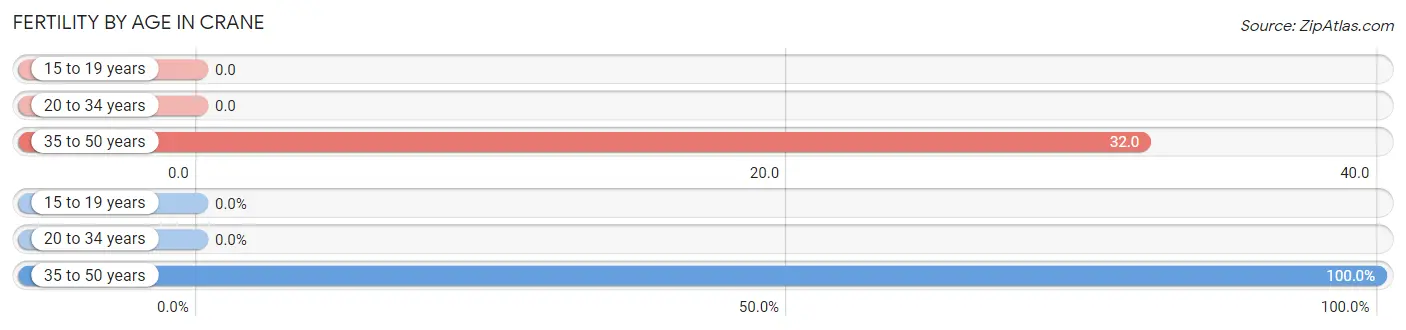
| Age Bracket | Women with Births | Births / 1,000 Women |
| 15 to 19 years | 0 (0.0%) | 0.0 |
| 20 to 34 years | 0 (0.0%) | 0.0 |
| 35 to 50 years | 11 (100.0%) | 32.0 |
| Total | 11 (100.0%) | 14.0 |
Fertility by Age by Marriage Status in Crane
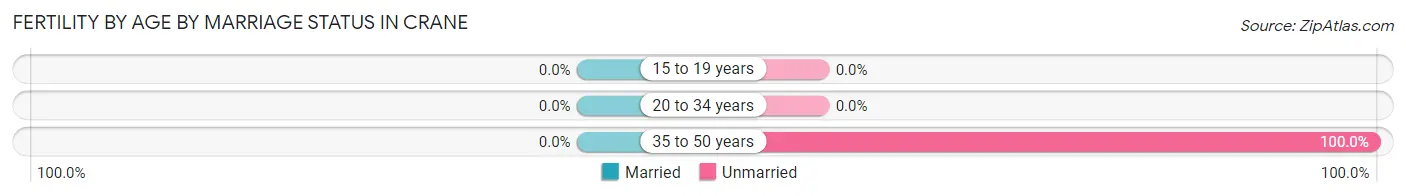
| Age Bracket | Married | Unmarried |
| 15 to 19 years | 0 (0.0%) | 0 (0.0%) |
| 20 to 34 years | 0 (0.0%) | 0 (0.0%) |
| 35 to 50 years | 0 (0.0%) | 11 (100.0%) |
| Total | 0 (0.0%) | 11 (100.0%) |
Fertility by Education in Crane
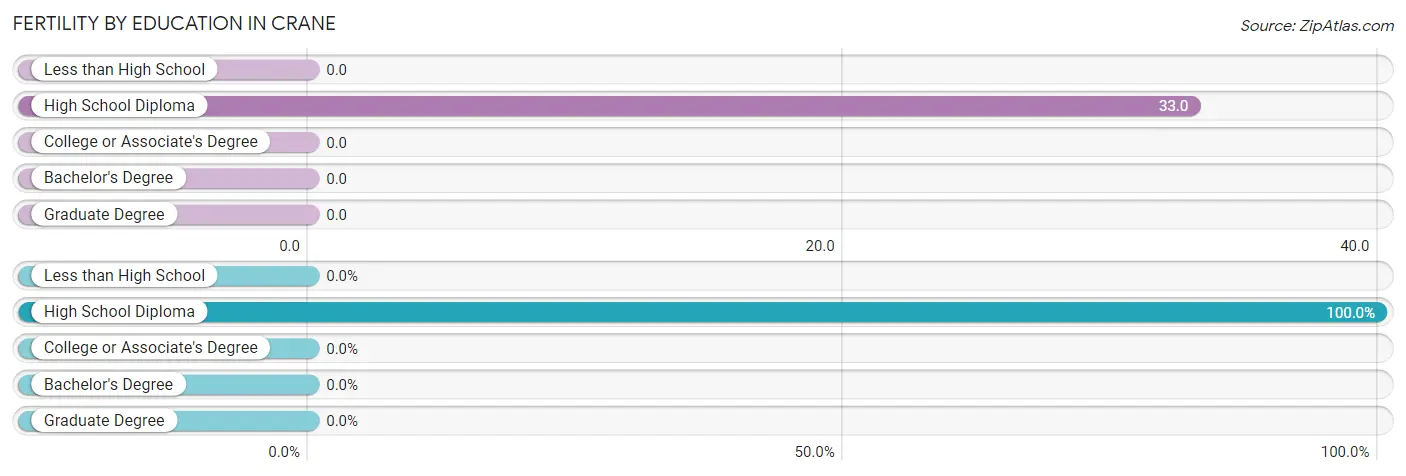
| Educational Attainment | Women with Births | Births / 1,000 Women |
| Less than High School | 0 (0.0%) | 0.0 |
| High School Diploma | 11 (100.0%) | 33.0 |
| College or Associate's Degree | 0 (0.0%) | 0.0 |
| Bachelor's Degree | 0 (0.0%) | 0.0 |
| Graduate Degree | 0 (0.0%) | 0.0 |
| Total | 11 (100.0%) | 14.0 |
Fertility by Education by Marriage Status in Crane
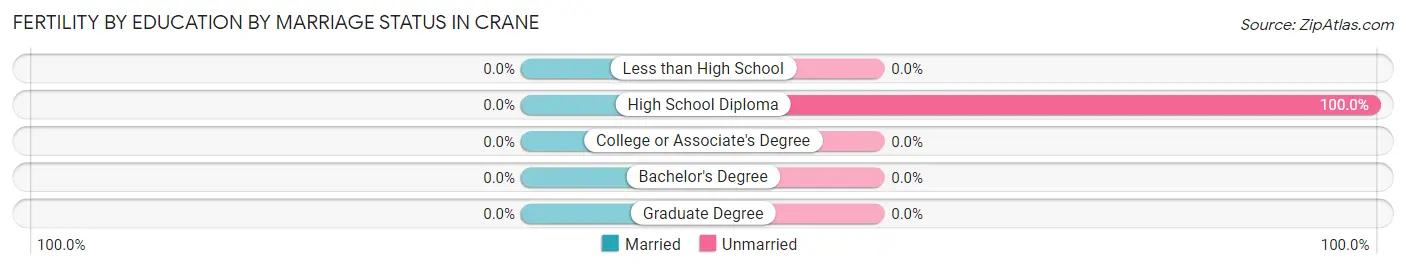
| Educational Attainment | Married | Unmarried |
| Less than High School | 0 (0.0%) | 0 (0.0%) |
| High School Diploma | 0 (0.0%) | 11 (100.0%) |
| College or Associate's Degree | 0 (0.0%) | 0 (0.0%) |
| Bachelor's Degree | 0 (0.0%) | 0 (0.0%) |
| Graduate Degree | 0 (0.0%) | 0 (0.0%) |
| Total | 0 (0.0%) | 11 (100.0%) |
Income in Crane
Income Overview in Crane
Per Capita Income in Crane is $33,031, while median incomes of families and households are $83,542 and $73,977 respectively.
| Characteristic | Number | Measure |
| Per Capita Income | 3,456 | $33,031 |
| Median Family Income | 859 | $83,542 |
| Mean Family Income | 859 | $95,558 |
| Median Household Income | 1,203 | $73,977 |
| Mean Household Income | 1,203 | $87,853 |
| Income Deficit | 859 | $0 |
| Wage / Income Gap (%) | 3,456 | 42.12% |
| Wage / Income Gap ($) | 3,456 | 57.88¢ per $1 |
| Gini / Inequality Index | 3,456 | 0.37 |
Earnings by Sex in Crane
Average Earnings in Crane are $41,776, $50,189 for men and $29,050 for women, a difference of 42.1%.
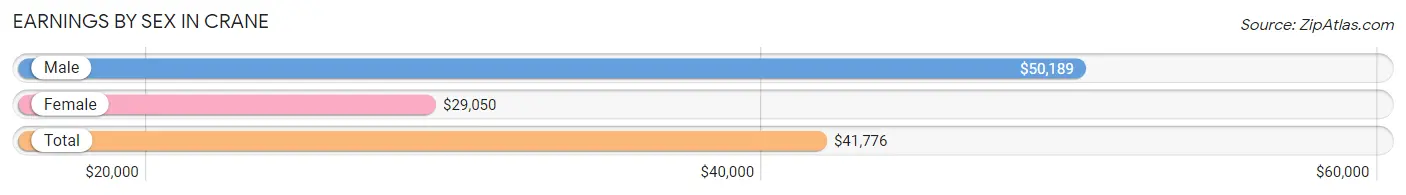
| Sex | Number | Average Earnings |
| Male | 1,178 (61.9%) | $50,189 |
| Female | 725 (38.1%) | $29,050 |
| Total | 1,903 (100.0%) | $41,776 |
Earnings by Sex by Income Bracket in Crane
The most common earnings brackets in Crane are $100,000+ for men (328 | 27.8%) and $2,499 or less for women (111 | 15.3%).
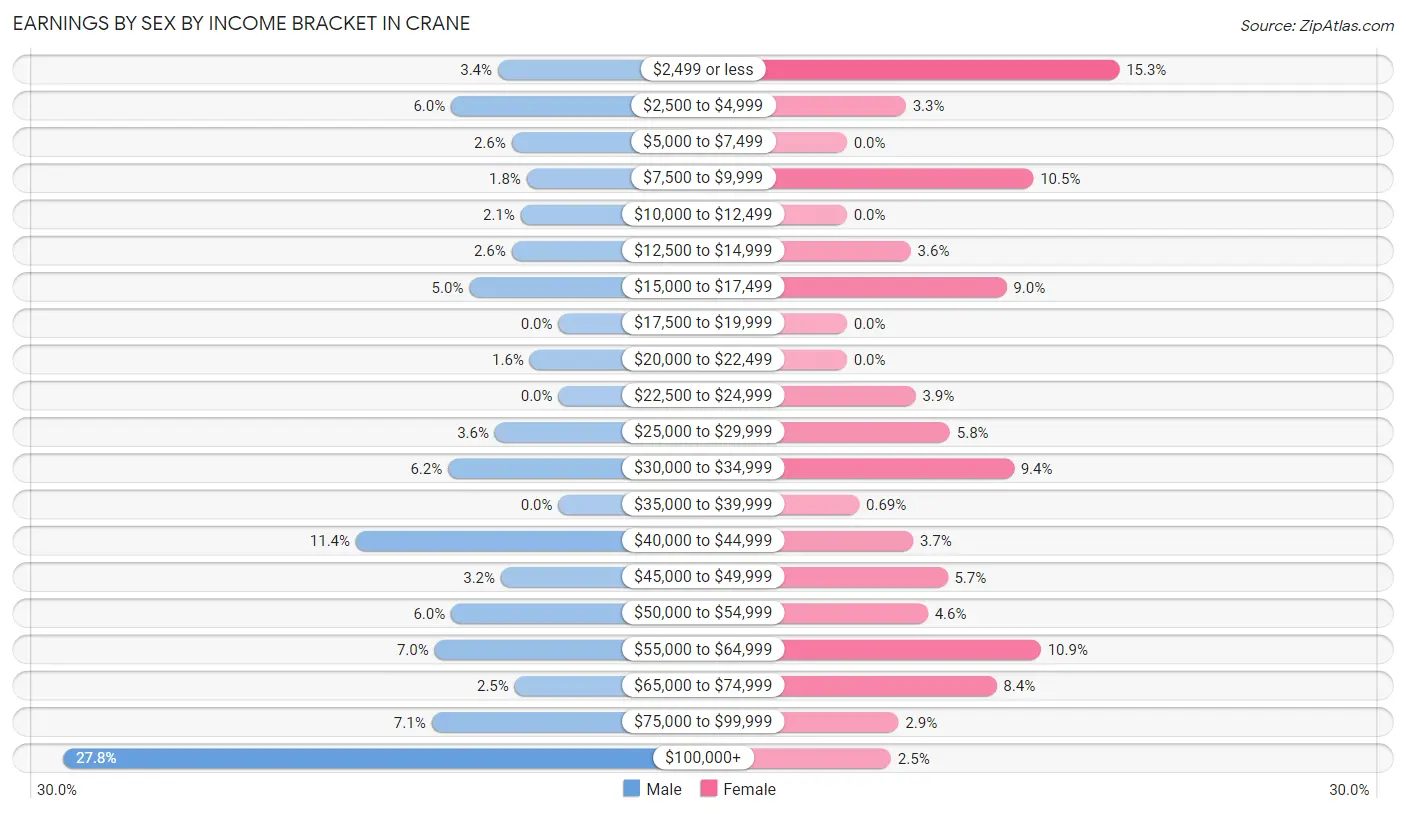
| Income | Male | Female |
| $2,499 or less | 40 (3.4%) | 111 (15.3%) |
| $2,500 to $4,999 | 71 (6.0%) | 24 (3.3%) |
| $5,000 to $7,499 | 31 (2.6%) | 0 (0.0%) |
| $7,500 to $9,999 | 21 (1.8%) | 76 (10.5%) |
| $10,000 to $12,499 | 25 (2.1%) | 0 (0.0%) |
| $12,500 to $14,999 | 31 (2.6%) | 26 (3.6%) |
| $15,000 to $17,499 | 59 (5.0%) | 65 (9.0%) |
| $17,500 to $19,999 | 0 (0.0%) | 0 (0.0%) |
| $20,000 to $22,499 | 19 (1.6%) | 0 (0.0%) |
| $22,500 to $24,999 | 0 (0.0%) | 28 (3.9%) |
| $25,000 to $29,999 | 42 (3.6%) | 42 (5.8%) |
| $30,000 to $34,999 | 73 (6.2%) | 68 (9.4%) |
| $35,000 to $39,999 | 0 (0.0%) | 5 (0.7%) |
| $40,000 to $44,999 | 134 (11.4%) | 27 (3.7%) |
| $45,000 to $49,999 | 38 (3.2%) | 41 (5.7%) |
| $50,000 to $54,999 | 71 (6.0%) | 33 (4.5%) |
| $55,000 to $64,999 | 82 (7.0%) | 79 (10.9%) |
| $65,000 to $74,999 | 29 (2.5%) | 61 (8.4%) |
| $75,000 to $99,999 | 84 (7.1%) | 21 (2.9%) |
| $100,000+ | 328 (27.8%) | 18 (2.5%) |
| Total | 1,178 (100.0%) | 725 (100.0%) |
Earnings by Sex by Educational Attainment in Crane
Average earnings in Crane are $55,000 for men and $33,750 for women, a difference of 38.6%. Men with an educational attainment of high school diploma enjoy the highest average annual earnings of $59,837, while those with less than high school education earn the least with $41,997. Women with an educational attainment of high school diploma earn the most with the average annual earnings of $47,500, while those with less than high school education have the smallest earnings of $2,499.
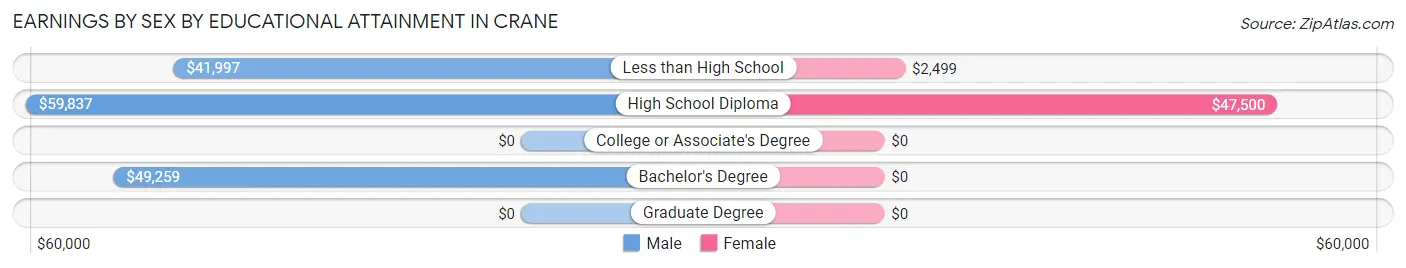
| Educational Attainment | Male Income | Female Income |
| Less than High School | $41,997 | $2,499 |
| High School Diploma | $59,837 | $47,500 |
| College or Associate's Degree | - | - |
| Bachelor's Degree | $49,259 | $0 |
| Graduate Degree | - | - |
| Total | $55,000 | $33,750 |
Family Income in Crane
Family Income Brackets in Crane
According to the Crane family income data, there are 166 families falling into the $100,000 to $149,999 income range, which is the most common income bracket and makes up 19.3% of all families.
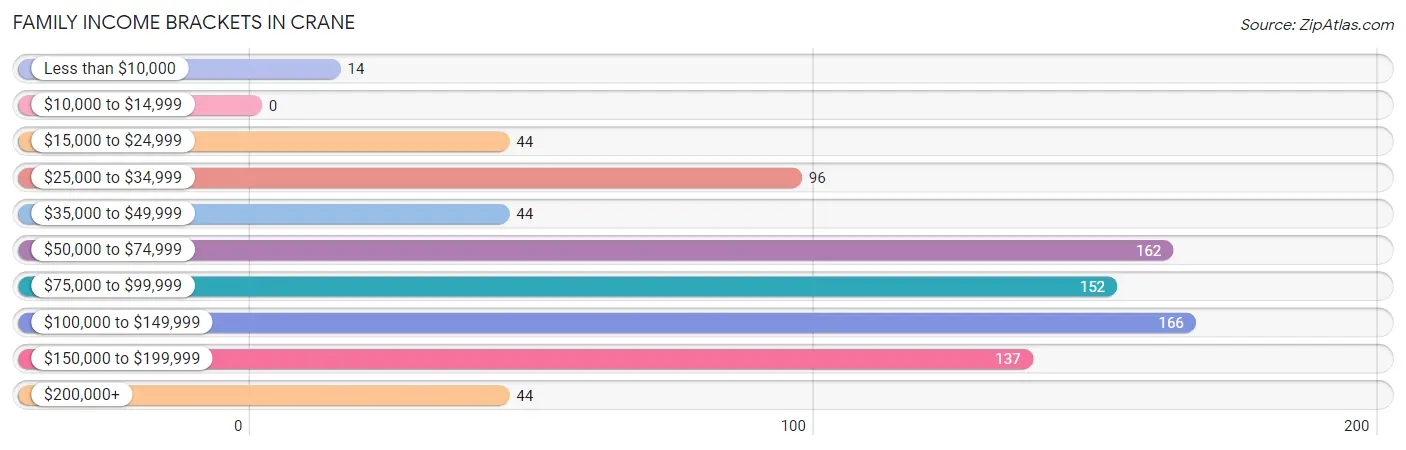
| Income Bracket | # Families | % Families |
| Less than $10,000 | 14 | 1.6% |
| $10,000 to $14,999 | 0 | 0.0% |
| $15,000 to $24,999 | 44 | 5.1% |
| $25,000 to $34,999 | 96 | 11.2% |
| $35,000 to $49,999 | 44 | 5.1% |
| $50,000 to $74,999 | 162 | 18.9% |
| $75,000 to $99,999 | 152 | 17.7% |
| $100,000 to $149,999 | 166 | 19.3% |
| $150,000 to $199,999 | 137 | 15.9% |
| $200,000+ | 44 | 5.1% |
Family Income by Famaliy Size in Crane
3-person families (283 | 33.0%) account for the highest median family income in Crane with $115,586 per family, while 2-person families (408 | 47.5%) have the highest median income of $40,183 per family member.
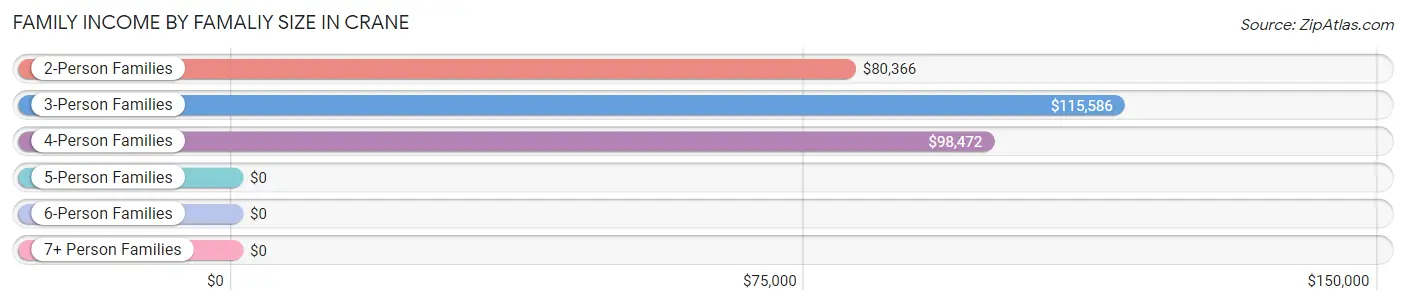
| Income Bracket | # Families | Median Income |
| 2-Person Families | 408 (47.5%) | $80,366 |
| 3-Person Families | 283 (33.0%) | $115,586 |
| 4-Person Families | 109 (12.7%) | $98,472 |
| 5-Person Families | 36 (4.2%) | $0 |
| 6-Person Families | 23 (2.7%) | $0 |
| 7+ Person Families | 0 (0.0%) | $0 |
| Total | 859 (100.0%) | $83,542 |
Family Income by Number of Earners in Crane
The median family income in Crane is $83,542, with families comprising 3+ earners (82) having the highest median family income of $115,547, while families with no earners (77) have the lowest median family income of $19,301, accounting for 9.6% and 9.0% of families, respectively.
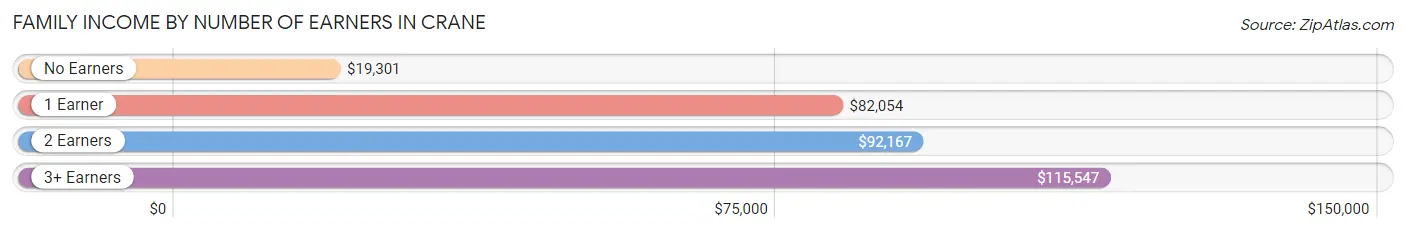
| Number of Earners | # Families | Median Income |
| No Earners | 77 (9.0%) | $19,301 |
| 1 Earner | 300 (34.9%) | $82,054 |
| 2 Earners | 400 (46.6%) | $92,167 |
| 3+ Earners | 82 (9.6%) | $115,547 |
| Total | 859 (100.0%) | $83,542 |
Household Income in Crane
Household Income Brackets in Crane
With 260 households falling in the category, the $50,000 to $74,999 income range is the most frequent in Crane, accounting for 21.6% of all households. In contrast, only 34 households (2.8%) fall into the $10,000 to $14,999 income bracket, making it the least populous group.
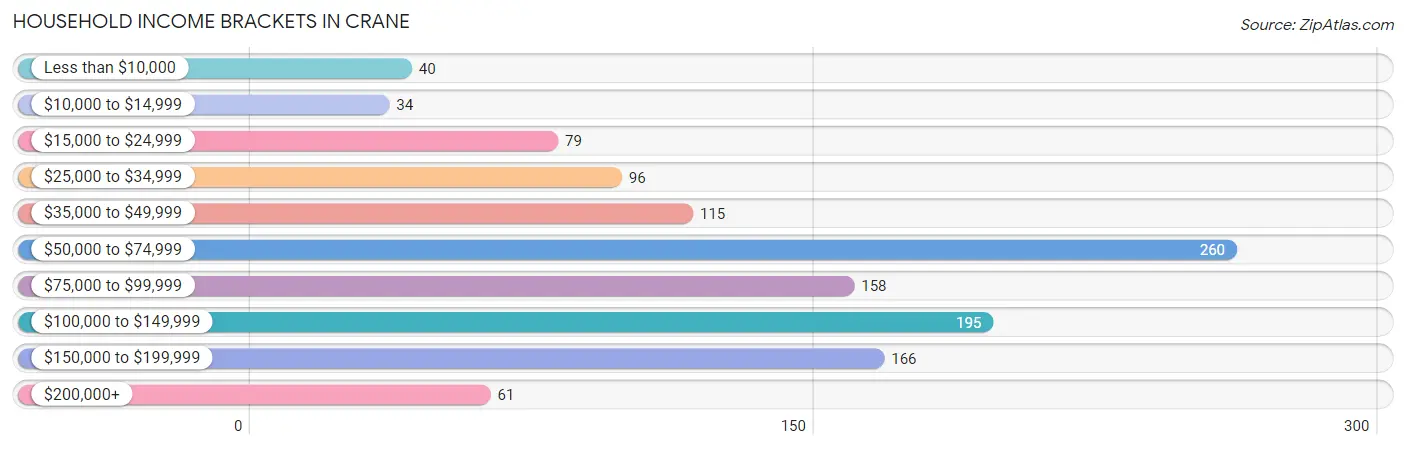
| Income Bracket | # Households | % Households |
| Less than $10,000 | 40 | 3.3% |
| $10,000 to $14,999 | 34 | 2.8% |
| $15,000 to $24,999 | 79 | 6.6% |
| $25,000 to $34,999 | 96 | 8.0% |
| $35,000 to $49,999 | 115 | 9.6% |
| $50,000 to $74,999 | 260 | 21.6% |
| $75,000 to $99,999 | 158 | 13.1% |
| $100,000 to $149,999 | 195 | 16.2% |
| $150,000 to $199,999 | 166 | 13.8% |
| $200,000+ | 61 | 5.1% |
Household Income by Householder Age in Crane
The median household income in Crane is $73,977, with the highest median household income of $81,332 found in the 45 to 64 years age bracket for the primary householder. A total of 539 households (44.8%) fall into this category. Meanwhile, the 15 to 24 years age bracket for the primary householder has the lowest median household income of $0, with 60 households (5.0%) in this group.
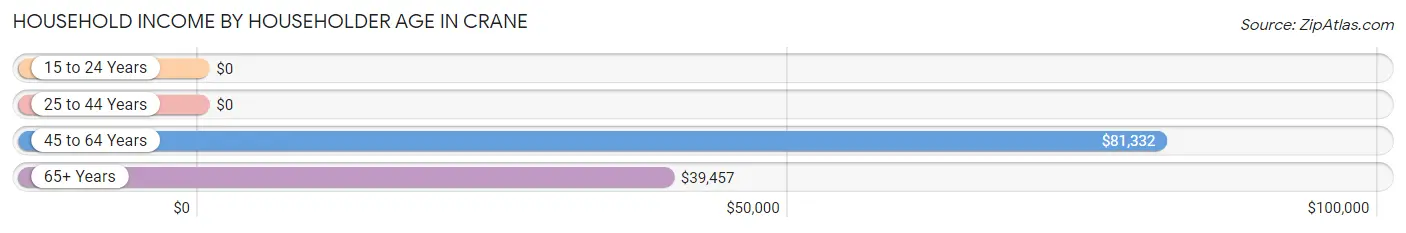
| Income Bracket | # Households | Median Income |
| 15 to 24 Years | 60 (5.0%) | $0 |
| 25 to 44 Years | 340 (28.3%) | $0 |
| 45 to 64 Years | 539 (44.8%) | $81,332 |
| 65+ Years | 264 (22.0%) | $39,457 |
| Total | 1,203 (100.0%) | $73,977 |
Poverty in Crane
Income Below Poverty by Sex and Age in Crane
With 4.0% poverty level for males and 3.2% for females among the residents of Crane, 75 year old and over males and 65 to 74 year old females are the most vulnerable to poverty, with 8 males (100.0%) and 23 females (14.7%) in their respective age groups living below the poverty level.
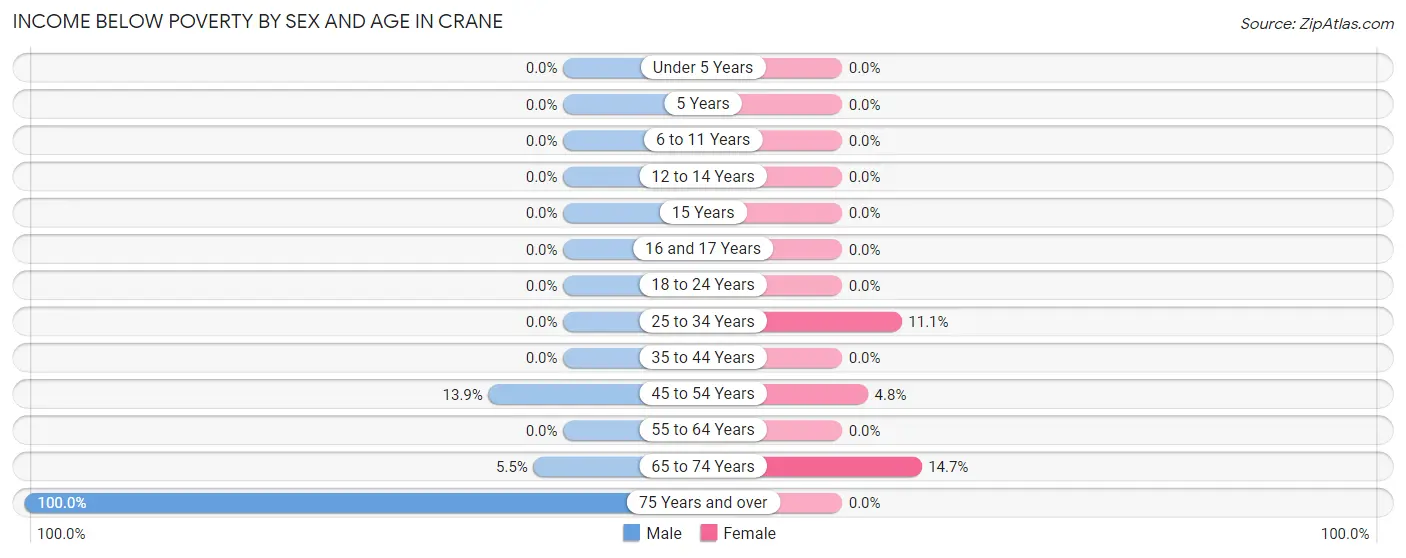
| Age Bracket | Male | Female |
| Under 5 Years | 0 (0.0%) | 0 (0.0%) |
| 5 Years | 0 (0.0%) | 0 (0.0%) |
| 6 to 11 Years | 0 (0.0%) | 0 (0.0%) |
| 12 to 14 Years | 0 (0.0%) | 0 (0.0%) |
| 15 Years | 0 (0.0%) | 0 (0.0%) |
| 16 and 17 Years | 0 (0.0%) | 0 (0.0%) |
| 18 to 24 Years | 0 (0.0%) | 0 (0.0%) |
| 25 to 34 Years | 0 (0.0%) | 19 (11.1%) |
| 35 to 44 Years | 0 (0.0%) | 0 (0.0%) |
| 45 to 54 Years | 43 (13.9%) | 18 (4.8%) |
| 55 to 64 Years | 0 (0.0%) | 0 (0.0%) |
| 65 to 74 Years | 11 (5.5%) | 23 (14.7%) |
| 75 Years and over | 8 (100.0%) | 0 (0.0%) |
| Total | 62 (4.0%) | 60 (3.2%) |
Income Above Poverty by Sex and Age in Crane
According to the poverty statistics in Crane, males aged under 5 years and females aged under 5 years are the age groups that are most secure financially, with 100.0% of males and 100.0% of females in these age groups living above the poverty line.
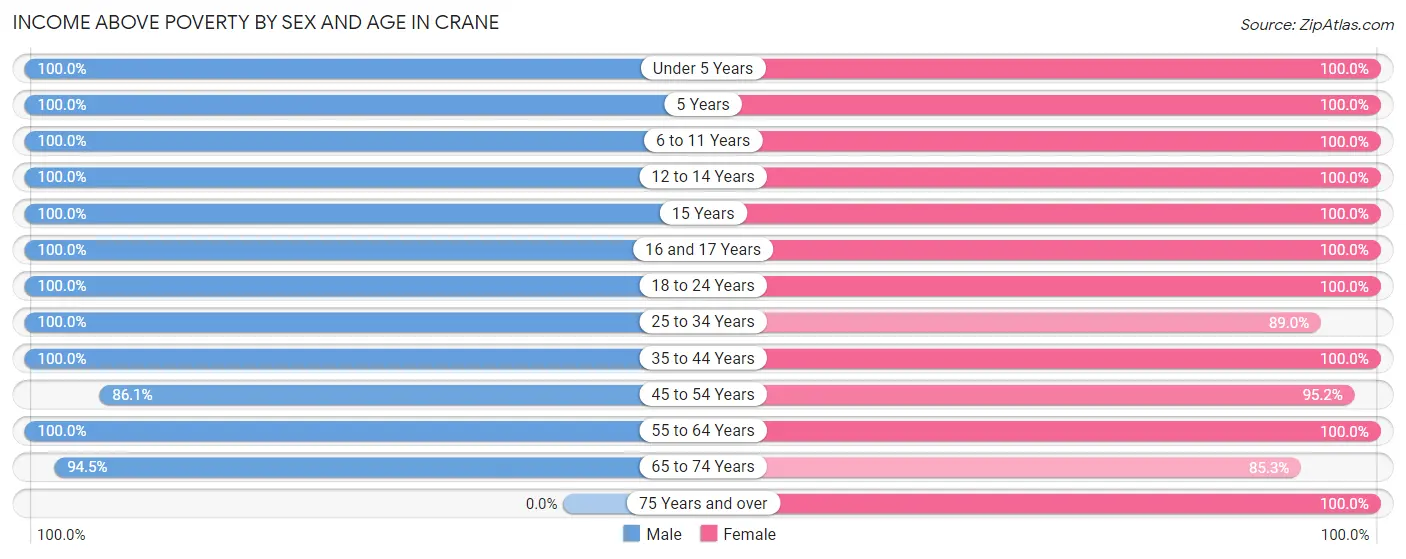
| Age Bracket | Male | Female |
| Under 5 Years | 68 (100.0%) | 269 (100.0%) |
| 5 Years | 31 (100.0%) | 10 (100.0%) |
| 6 to 11 Years | 55 (100.0%) | 87 (100.0%) |
| 12 to 14 Years | 55 (100.0%) | 138 (100.0%) |
| 15 Years | 19 (100.0%) | 49 (100.0%) |
| 16 and 17 Years | 64 (100.0%) | 102 (100.0%) |
| 18 to 24 Years | 244 (100.0%) | 115 (100.0%) |
| 25 to 34 Years | 162 (100.0%) | 153 (88.9%) |
| 35 to 44 Years | 139 (100.0%) | 145 (100.0%) |
| 45 to 54 Years | 267 (86.1%) | 357 (95.2%) |
| 55 to 64 Years | 213 (100.0%) | 173 (100.0%) |
| 65 to 74 Years | 189 (94.5%) | 133 (85.3%) |
| 75 Years and over | 0 (0.0%) | 58 (100.0%) |
| Total | 1,506 (96.1%) | 1,789 (96.8%) |
Income Below Poverty Among Married-Couple Families in Crane
The poverty statistics for married-couple families in Crane show that 2.0% or 14 of the total 696 families live below the poverty line. Families with no children have the highest poverty rate of 3.6%, comprising of 14 families. On the other hand, families with 1 or 2 children have the lowest poverty rate of 0.0%, which includes 0 families.
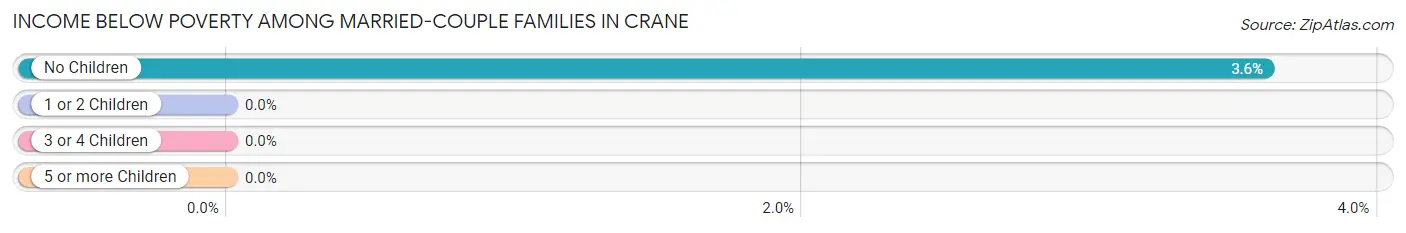
| Children | Above Poverty | Below Poverty |
| No Children | 374 (96.4%) | 14 (3.6%) |
| 1 or 2 Children | 298 (100.0%) | 0 (0.0%) |
| 3 or 4 Children | 10 (100.0%) | 0 (0.0%) |
| 5 or more Children | 0 (0.0%) | 0 (0.0%) |
| Total | 682 (98.0%) | 14 (2.0%) |
Income Below Poverty Among Single-Parent Households in Crane
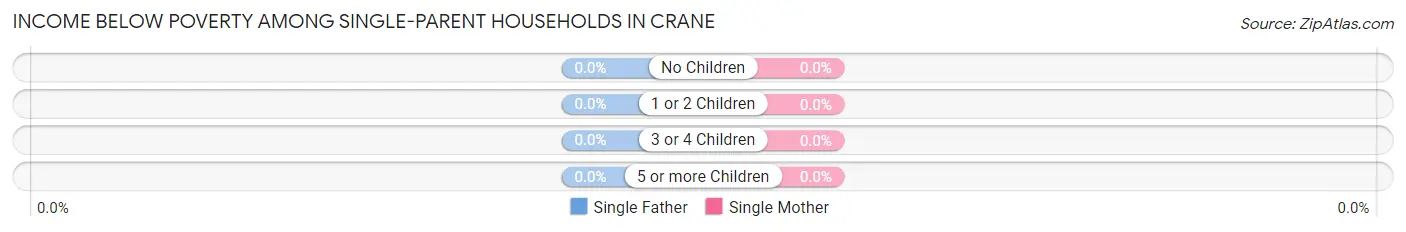
| Children | Single Father | Single Mother |
| No Children | 0 (0.0%) | 0 (0.0%) |
| 1 or 2 Children | 0 (0.0%) | 0 (0.0%) |
| 3 or 4 Children | 0 (0.0%) | 0 (0.0%) |
| 5 or more Children | 0 (0.0%) | 0 (0.0%) |
| Total | 0 (0.0%) | 0 (0.0%) |
Income Below Poverty Among Married-Couple vs Single-Parent Households in Crane
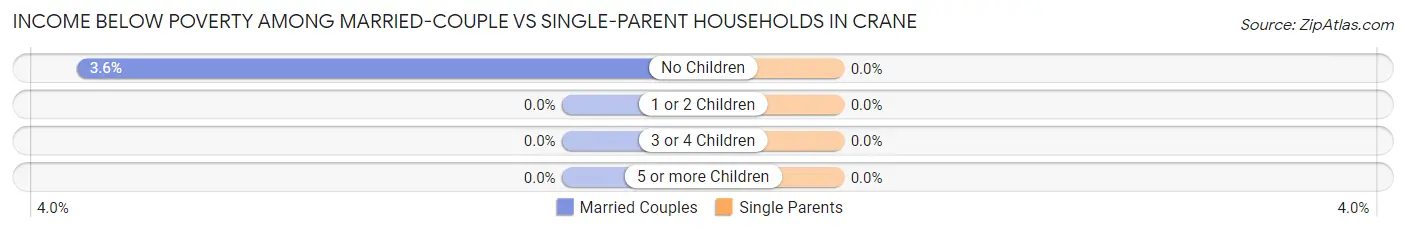
| Children | Married-Couple Families | Single-Parent Households |
| No Children | 14 (3.6%) | 0 (0.0%) |
| 1 or 2 Children | 0 (0.0%) | 0 (0.0%) |
| 3 or 4 Children | 0 (0.0%) | 0 (0.0%) |
| 5 or more Children | 0 (0.0%) | 0 (0.0%) |
| Total | 14 (2.0%) | 0 (0.0%) |
Employment Characteristics in Crane
Employment by Class of Employer in Crane
Among the 1,735 employed individuals in Crane, private company employees (1,075 | 62.0%), local government employees (266 | 15.3%), and self-employed (not incorporated) (106 | 6.1%) make up the most common classes of employment.
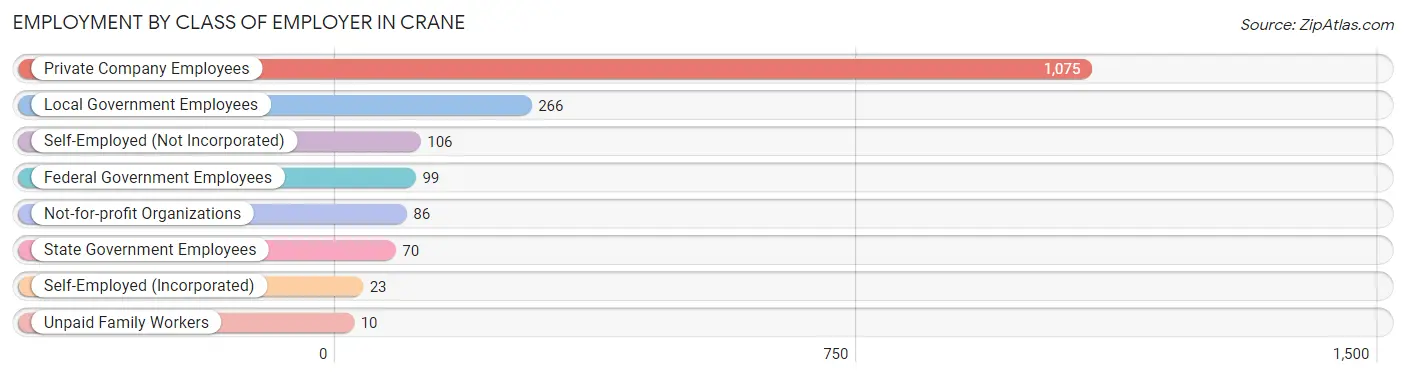
| Employer Class | # Employees | % Employees |
| Private Company Employees | 1,075 | 62.0% |
| Self-Employed (Incorporated) | 23 | 1.3% |
| Self-Employed (Not Incorporated) | 106 | 6.1% |
| Not-for-profit Organizations | 86 | 5.0% |
| Local Government Employees | 266 | 15.3% |
| State Government Employees | 70 | 4.0% |
| Federal Government Employees | 99 | 5.7% |
| Unpaid Family Workers | 10 | 0.6% |
| Total | 1,735 | 100.0% |
Employment Status by Age in Crane
According to the labor force statistics for Crane, out of the total population over 16 years of age (2,675), 66.5% or 1,779 individuals are in the labor force, with 2.1% or 37 of them unemployed. The age group with the highest labor force participation rate is 30 to 34 years, with 93.6% or 73 individuals in the labor force. Within the labor force, the 30 to 34 years age range has the highest percentage of unemployed individuals, with 26.0% or 19 of them being unemployed.
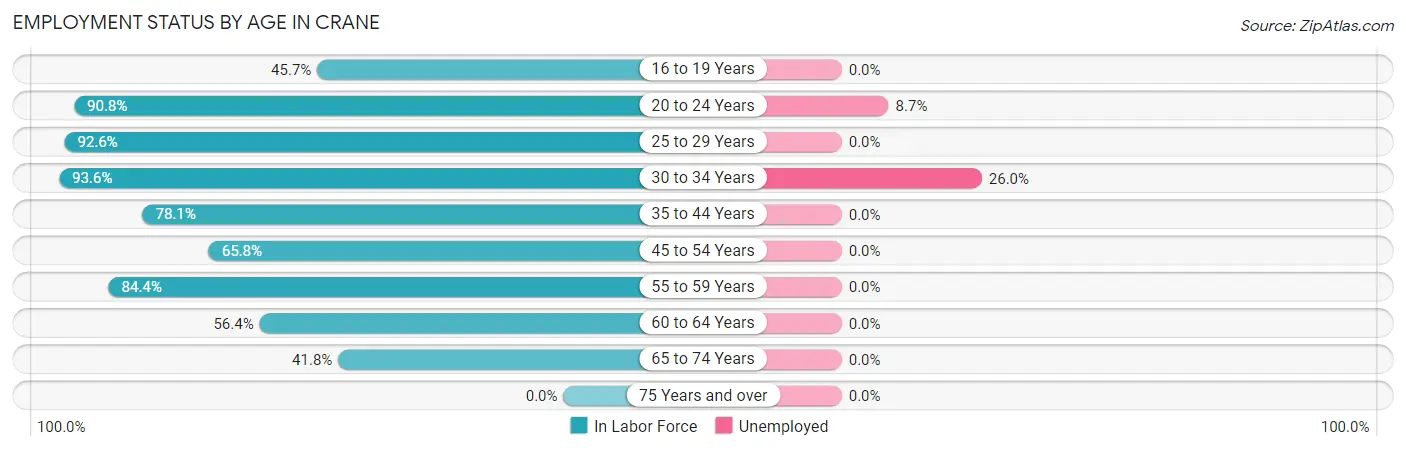
| Age Bracket | In Labor Force | Unemployed |
| 16 to 19 Years | 137 (45.7%) | 0 (0.0%) |
| 20 to 24 Years | 207 (90.8%) | 18 (8.7%) |
| 25 to 29 Years | 251 (92.6%) | 0 (0.0%) |
| 30 to 34 Years | 73 (93.6%) | 19 (26.0%) |
| 35 to 44 Years | 225 (78.1%) | 0 (0.0%) |
| 45 to 54 Years | 454 (65.8%) | 0 (0.0%) |
| 55 to 59 Years | 179 (84.4%) | 0 (0.0%) |
| 60 to 64 Years | 102 (56.4%) | 0 (0.0%) |
| 65 to 74 Years | 151 (41.8%) | 0 (0.0%) |
| 75 Years and over | 0 (0.0%) | 0 (0.0%) |
| Total | 1,779 (66.5%) | 37 (2.1%) |
Employment Status by Educational Attainment in Crane
According to labor force statistics for Crane, 74.7% of individuals (1,285) out of the total population between 25 and 64 years of age (1,720) are in the labor force, with 1.5% or 19 of them being unemployed. The group with the highest labor force participation rate are those with the educational attainment of bachelor's degree or higher, with 95.6% or 329 individuals in the labor force. Within the labor force, individuals with high school diploma education have the highest percentage of unemployment, with 3.6% or 19 of them being unemployed.
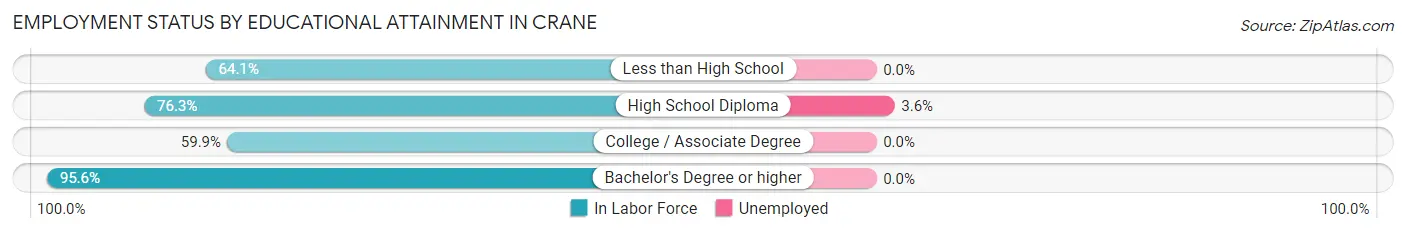
| Educational Attainment | In Labor Force | Unemployed |
| Less than High School | 243 (64.1%) | 0 (0.0%) |
| High School Diploma | 534 (76.3%) | 25 (3.6%) |
| College / Associate Degree | 178 (59.9%) | 0 (0.0%) |
| Bachelor's Degree or higher | 329 (95.6%) | 0 (0.0%) |
| Total | 1,285 (74.7%) | 26 (1.5%) |
Employment Occupations by Sex in Crane
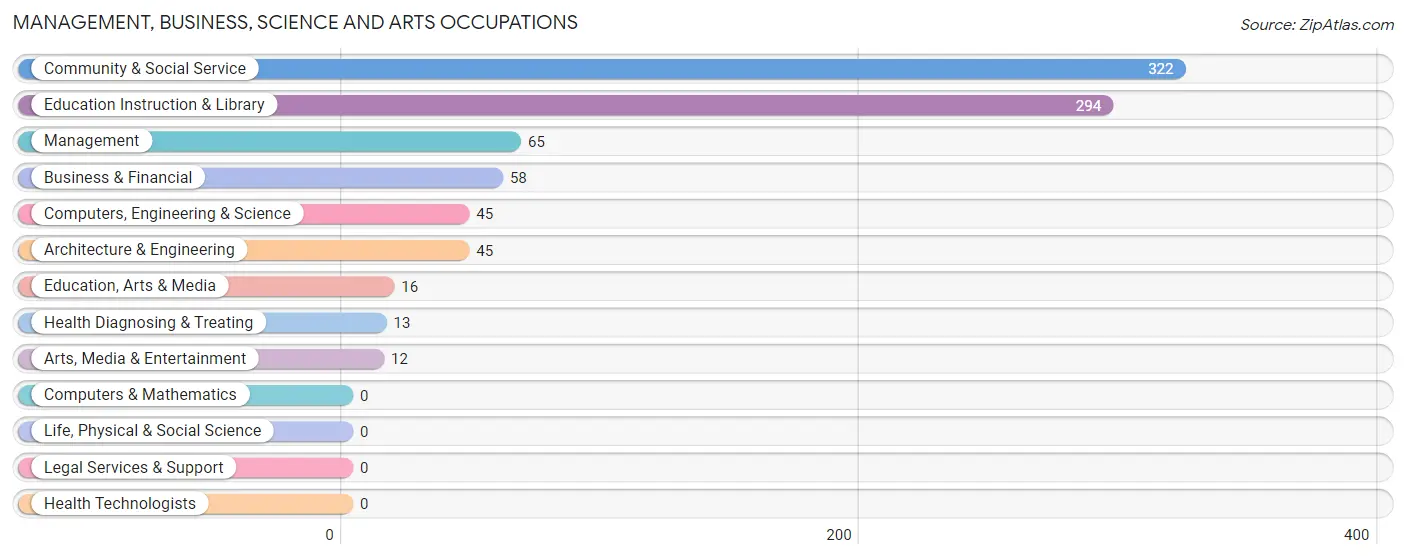
Management, Business, Science and Arts Occupations
The most common Management, Business, Science and Arts occupations in Crane are Community & Social Service (322 | 18.5%), Education Instruction & Library (294 | 16.9%), Management (65 | 3.7%), Business & Financial (58 | 3.3%), and Computers, Engineering & Science (45 | 2.6%).
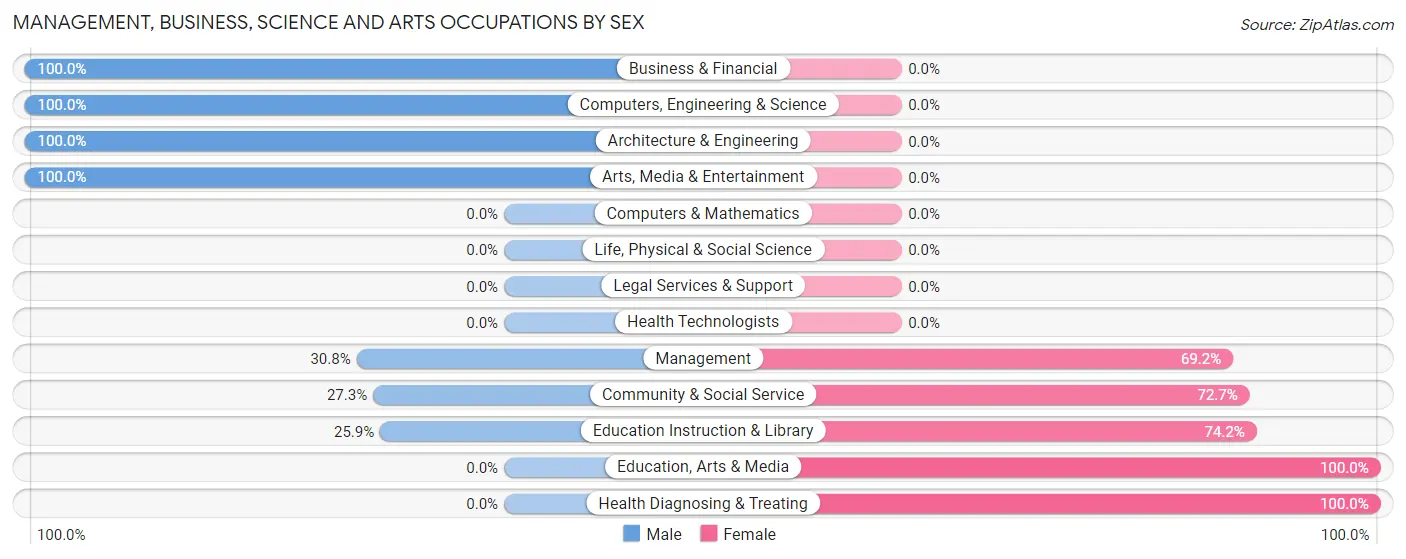
Management, Business, Science and Arts Occupations by Sex
Within the Management, Business, Science and Arts occupations in Crane, the most male-oriented occupations are Business & Financial (100.0%), Computers, Engineering & Science (100.0%), and Architecture & Engineering (100.0%), while the most female-oriented occupations are Education, Arts & Media (100.0%), Health Diagnosing & Treating (100.0%), and Education Instruction & Library (74.2%).
| Occupation | Male | Female |
| Management | 20 (30.8%) | 45 (69.2%) |
| Business & Financial | 58 (100.0%) | 0 (0.0%) |
| Computers, Engineering & Science | 45 (100.0%) | 0 (0.0%) |
| Computers & Mathematics | 0 (0.0%) | 0 (0.0%) |
| Architecture & Engineering | 45 (100.0%) | 0 (0.0%) |
| Life, Physical & Social Science | 0 (0.0%) | 0 (0.0%) |
| Community & Social Service | 88 (27.3%) | 234 (72.7%) |
| Education, Arts & Media | 0 (0.0%) | 16 (100.0%) |
| Legal Services & Support | 0 (0.0%) | 0 (0.0%) |
| Education Instruction & Library | 76 (25.9%) | 218 (74.2%) |
| Arts, Media & Entertainment | 12 (100.0%) | 0 (0.0%) |
| Health Diagnosing & Treating | 0 (0.0%) | 13 (100.0%) |
| Health Technologists | 0 (0.0%) | 0 (0.0%) |
| Total (Category) | 211 (41.9%) | 292 (58.1%) |
| Total (Overall) | 1,079 (61.9%) | 663 (38.1%) |
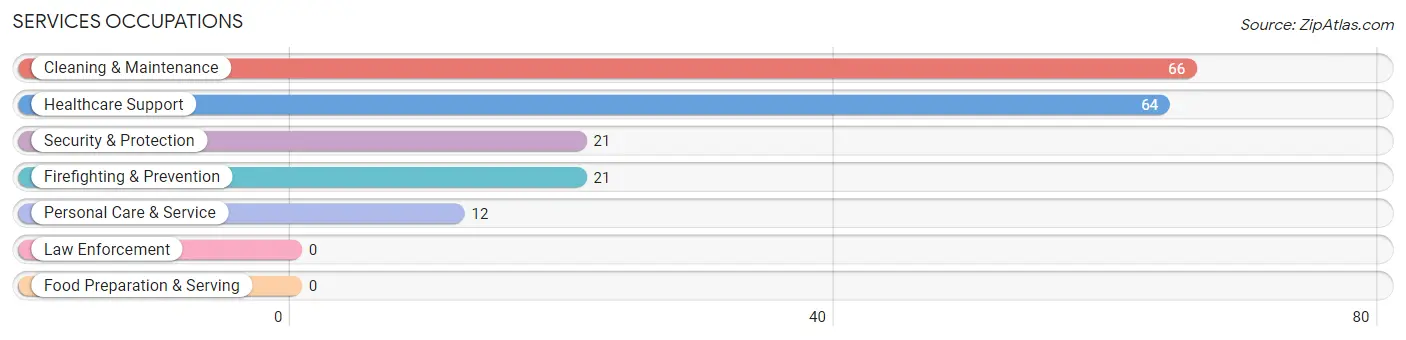
Services Occupations
The most common Services occupations in Crane are Cleaning & Maintenance (66 | 3.8%), Healthcare Support (64 | 3.7%), Security & Protection (21 | 1.2%), Firefighting & Prevention (21 | 1.2%), and Personal Care & Service (12 | 0.7%).
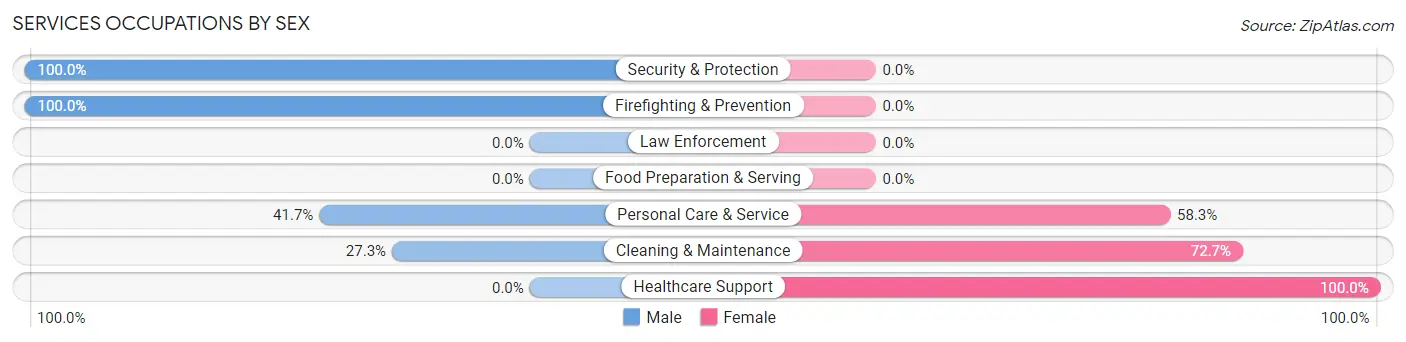
Services Occupations by Sex
Within the Services occupations in Crane, the most male-oriented occupations are Security & Protection (100.0%), Firefighting & Prevention (100.0%), and Personal Care & Service (41.7%), while the most female-oriented occupations are Healthcare Support (100.0%), Cleaning & Maintenance (72.7%), and Personal Care & Service (58.3%).
| Occupation | Male | Female |
| Healthcare Support | 0 (0.0%) | 64 (100.0%) |
| Security & Protection | 21 (100.0%) | 0 (0.0%) |
| Firefighting & Prevention | 21 (100.0%) | 0 (0.0%) |
| Law Enforcement | 0 (0.0%) | 0 (0.0%) |
| Food Preparation & Serving | 0 (0.0%) | 0 (0.0%) |
| Cleaning & Maintenance | 18 (27.3%) | 48 (72.7%) |
| Personal Care & Service | 5 (41.7%) | 7 (58.3%) |
| Total (Category) | 44 (27.0%) | 119 (73.0%) |
| Total (Overall) | 1,079 (61.9%) | 663 (38.1%) |
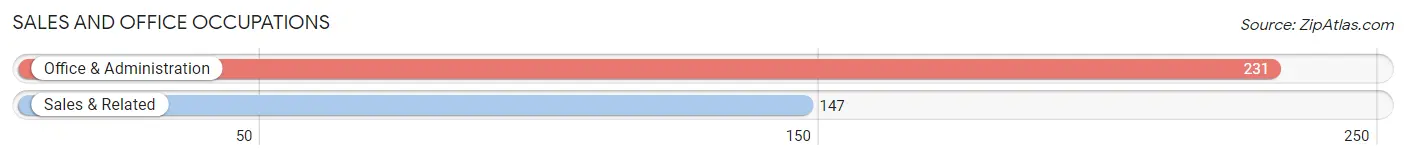
Sales and Office Occupations
The most common Sales and Office occupations in Crane are Office & Administration (231 | 13.3%), and Sales & Related (147 | 8.4%).
Sales and Office Occupations by Sex
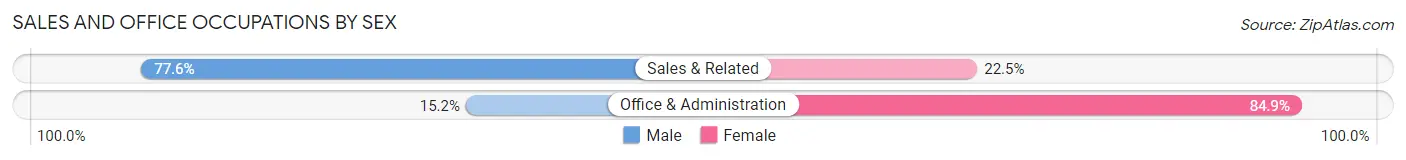
| Occupation | Male | Female |
| Sales & Related | 114 (77.5%) | 33 (22.5%) |
| Office & Administration | 35 (15.1%) | 196 (84.9%) |
| Total (Category) | 149 (39.4%) | 229 (60.6%) |
| Total (Overall) | 1,079 (61.9%) | 663 (38.1%) |
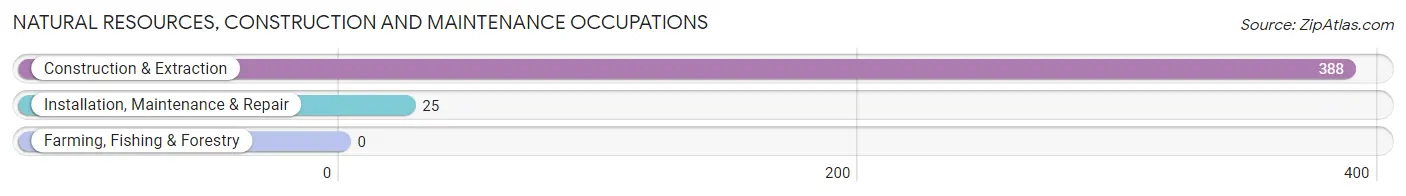
Natural Resources, Construction and Maintenance Occupations
The most common Natural Resources, Construction and Maintenance occupations in Crane are Construction & Extraction (388 | 22.3%), and Installation, Maintenance & Repair (25 | 1.4%).
Natural Resources, Construction and Maintenance Occupations by Sex
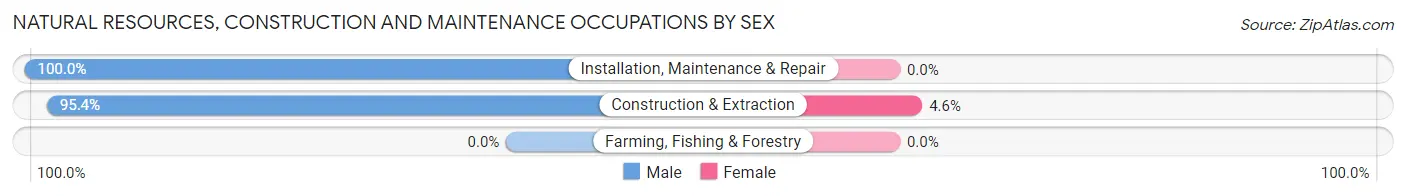
| Occupation | Male | Female |
| Farming, Fishing & Forestry | 0 (0.0%) | 0 (0.0%) |
| Construction & Extraction | 370 (95.4%) | 18 (4.6%) |
| Installation, Maintenance & Repair | 25 (100.0%) | 0 (0.0%) |
| Total (Category) | 395 (95.6%) | 18 (4.4%) |
| Total (Overall) | 1,079 (61.9%) | 663 (38.1%) |
Production, Transportation and Moving Occupations
The most common Production, Transportation and Moving occupations in Crane are Material Moving (143 | 8.2%), Transportation (88 | 5.1%), and Production (54 | 3.1%).
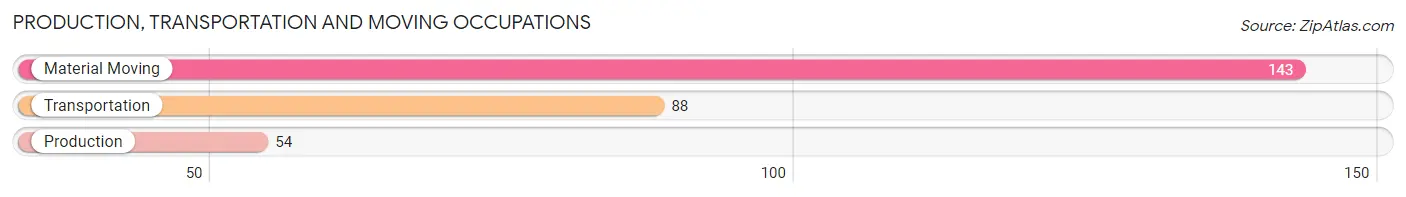
Production, Transportation and Moving Occupations by Sex
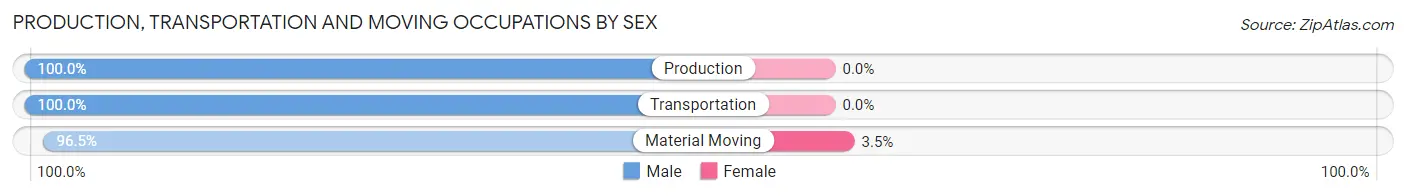
| Occupation | Male | Female |
| Production | 54 (100.0%) | 0 (0.0%) |
| Transportation | 88 (100.0%) | 0 (0.0%) |
| Material Moving | 138 (96.5%) | 5 (3.5%) |
| Total (Category) | 280 (98.3%) | 5 (1.8%) |
| Total (Overall) | 1,079 (61.9%) | 663 (38.1%) |
Employment Industries by Sex in Crane
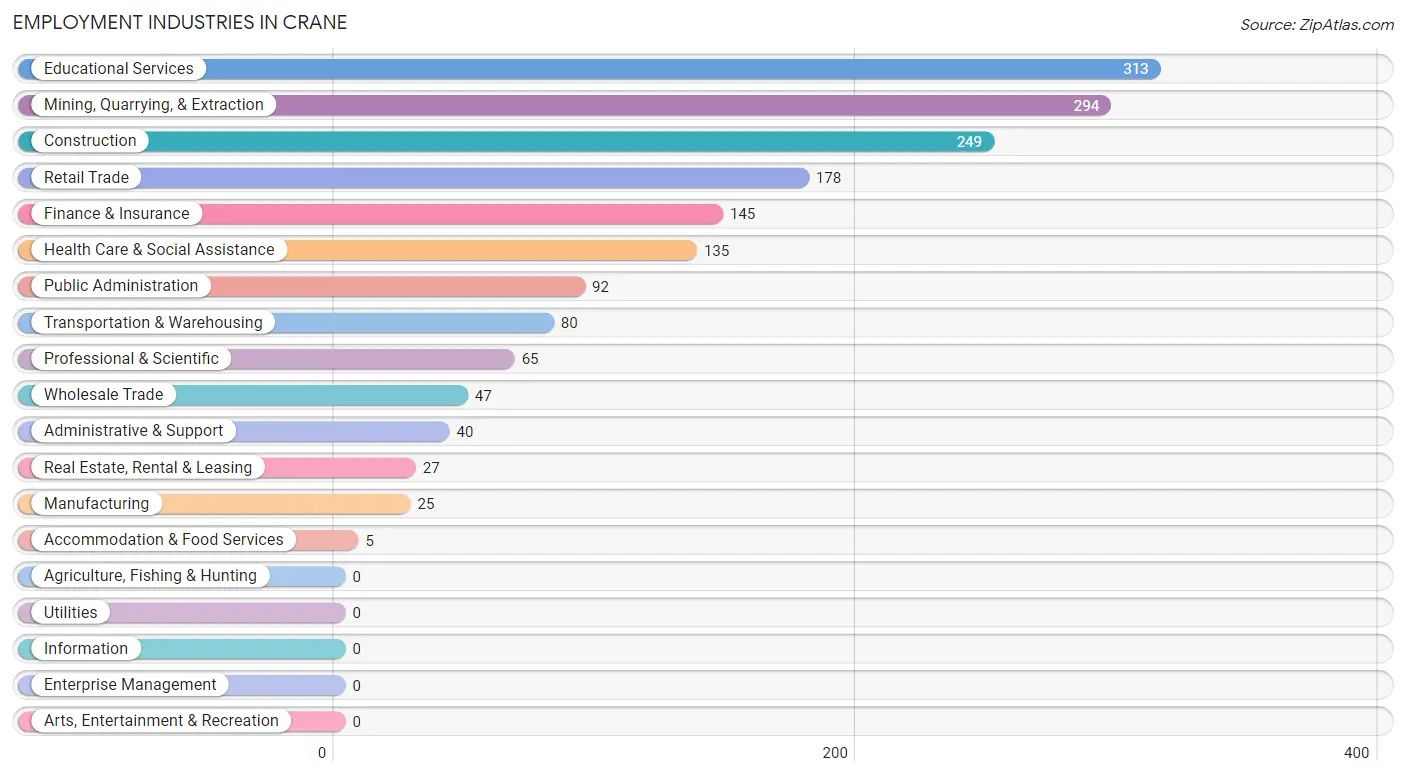
Employment Industries in Crane
The major employment industries in Crane include Educational Services (313 | 18.0%), Mining, Quarrying, & Extraction (294 | 16.9%), Construction (249 | 14.3%), Retail Trade (178 | 10.2%), and Finance & Insurance (145 | 8.3%).
Employment Industries by Sex in Crane
The Crane industries that see more men than women are Manufacturing (100.0%), Wholesale Trade (100.0%), and Real Estate, Rental & Leasing (100.0%), whereas the industries that tend to have a higher number of women are Finance & Insurance (100.0%), Administrative & Support (100.0%), and Health Care & Social Assistance (94.1%).
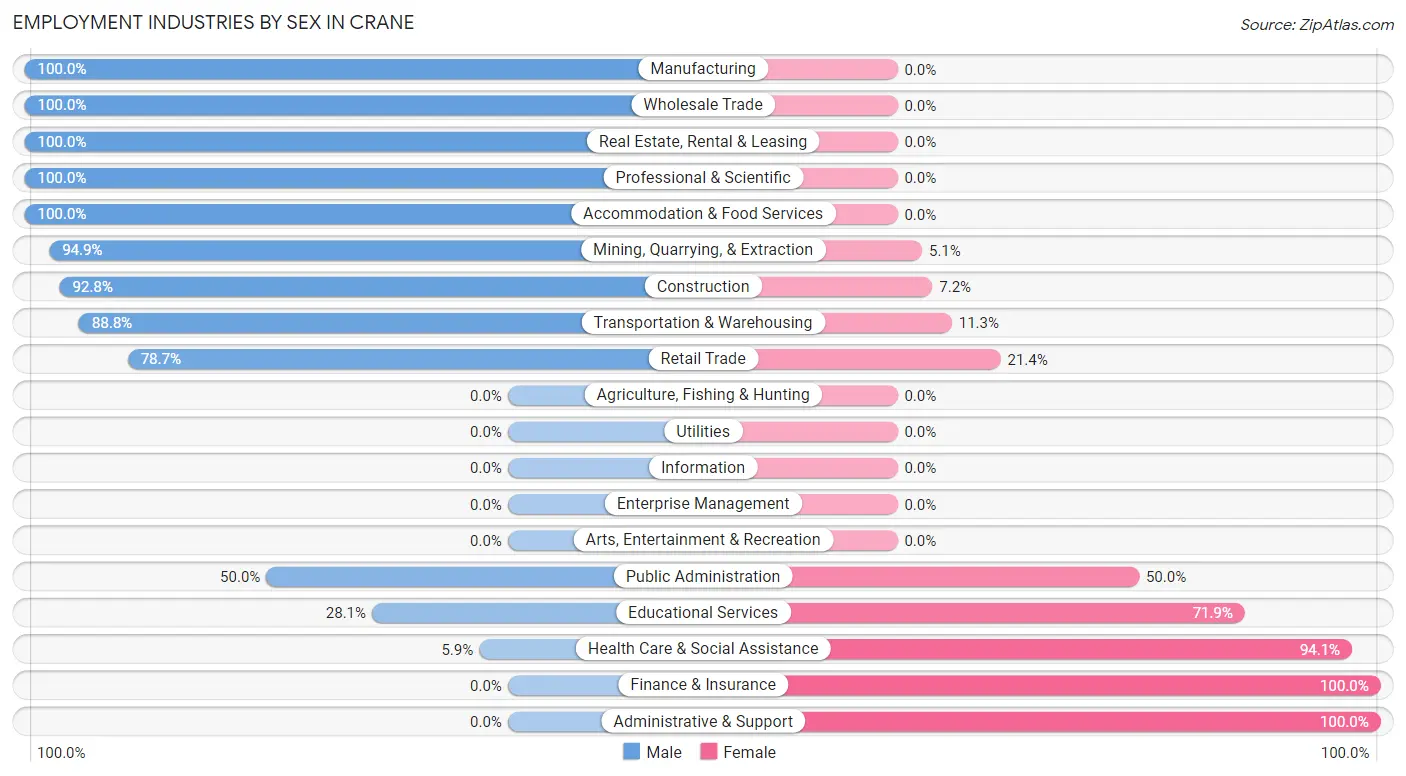
| Industry | Male | Female |
| Agriculture, Fishing & Hunting | 0 (0.0%) | 0 (0.0%) |
| Mining, Quarrying, & Extraction | 279 (94.9%) | 15 (5.1%) |
| Construction | 231 (92.8%) | 18 (7.2%) |
| Manufacturing | 25 (100.0%) | 0 (0.0%) |
| Wholesale Trade | 47 (100.0%) | 0 (0.0%) |
| Retail Trade | 140 (78.6%) | 38 (21.3%) |
| Transportation & Warehousing | 71 (88.7%) | 9 (11.3%) |
| Utilities | 0 (0.0%) | 0 (0.0%) |
| Information | 0 (0.0%) | 0 (0.0%) |
| Finance & Insurance | 0 (0.0%) | 145 (100.0%) |
| Real Estate, Rental & Leasing | 27 (100.0%) | 0 (0.0%) |
| Professional & Scientific | 65 (100.0%) | 0 (0.0%) |
| Enterprise Management | 0 (0.0%) | 0 (0.0%) |
| Administrative & Support | 0 (0.0%) | 40 (100.0%) |
| Educational Services | 88 (28.1%) | 225 (71.9%) |
| Health Care & Social Assistance | 8 (5.9%) | 127 (94.1%) |
| Arts, Entertainment & Recreation | 0 (0.0%) | 0 (0.0%) |
| Accommodation & Food Services | 5 (100.0%) | 0 (0.0%) |
| Public Administration | 46 (50.0%) | 46 (50.0%) |
| Total | 1,079 (61.9%) | 663 (38.1%) |
Education in Crane
School Enrollment in Crane
The most common levels of schooling among the 860 students in Crane are high school (354 | 41.2%), kindergarten (157 | 18.3%), and middle school (147 | 17.1%).
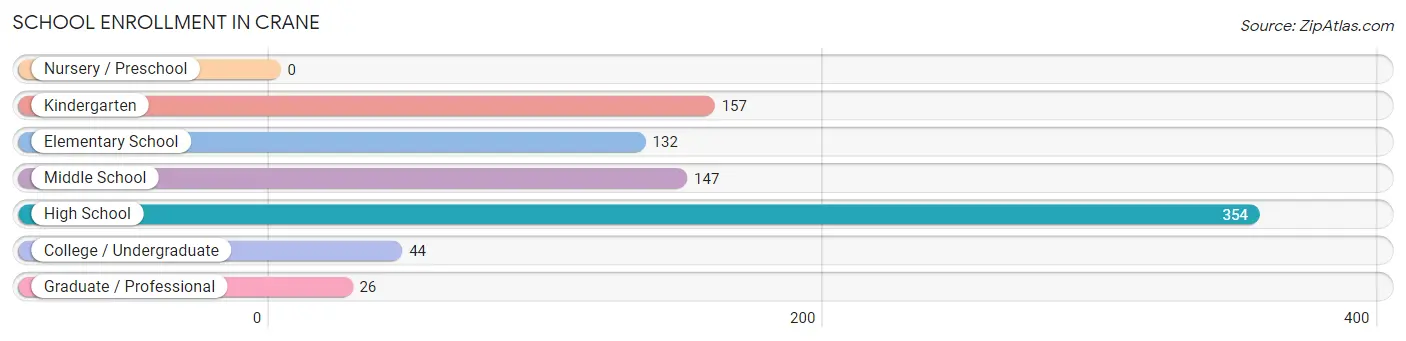
| School Level | # Students | % Students |
| Nursery / Preschool | 0 | 0.0% |
| Kindergarten | 157 | 18.3% |
| Elementary School | 132 | 15.3% |
| Middle School | 147 | 17.1% |
| High School | 354 | 41.2% |
| College / Undergraduate | 44 | 5.1% |
| Graduate / Professional | 26 | 3.0% |
| Total | 860 | 100.0% |
School Enrollment by Age by Funding Source in Crane
Out of a total of 860 students who are enrolled in schools in Crane, 91 (10.6%) attend a private institution, while the remaining 769 (89.4%) are enrolled in public schools. The age group of 35 years and over has the highest likelihood of being enrolled in private schools, with 33 (50.8% in the age bracket) enrolled. Conversely, the age group of 3 to 4 year olds has the lowest likelihood of being enrolled in a private school, with 116 (100.0% in the age bracket) attending a public institution.
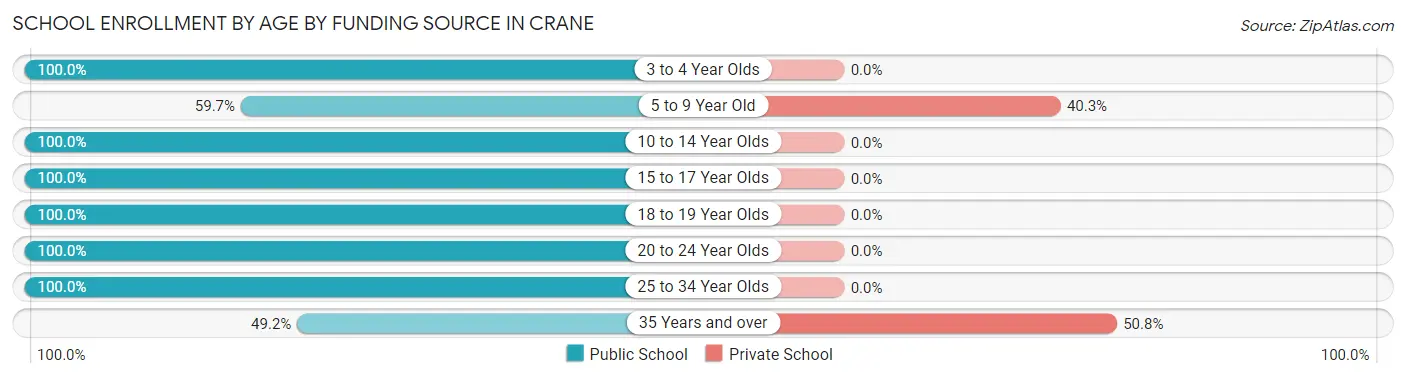
| Age Bracket | Public School | Private School |
| 3 to 4 Year Olds | 116 (100.0%) | 0 (0.0%) |
| 5 to 9 Year Old | 86 (59.7%) | 58 (40.3%) |
| 10 to 14 Year Olds | 232 (100.0%) | 0 (0.0%) |
| 15 to 17 Year Olds | 234 (100.0%) | 0 (0.0%) |
| 18 to 19 Year Olds | 19 (100.0%) | 0 (0.0%) |
| 20 to 24 Year Olds | 18 (100.0%) | 0 (0.0%) |
| 25 to 34 Year Olds | 32 (100.0%) | 0 (0.0%) |
| 35 Years and over | 32 (49.2%) | 33 (50.8%) |
| Total | 769 (89.4%) | 91 (10.6%) |
Educational Attainment by Field of Study in Crane
Education (156 | 35.6%), arts & humanities (66 | 15.1%), science & technology (35 | 8.0%), computers & mathematics (34 | 7.8%), and business (33 | 7.5%) are the most common fields of study among 438 individuals in Crane who have obtained a bachelor's degree or higher.
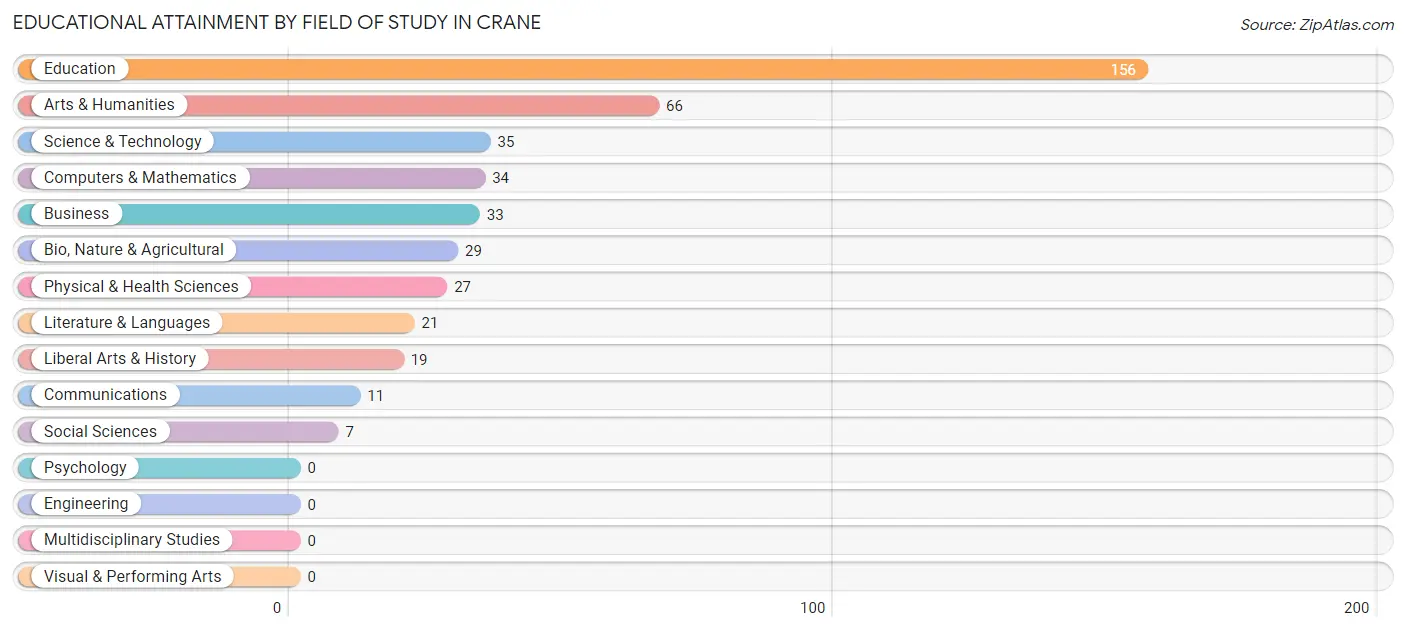
| Field of Study | # Graduates | % Graduates |
| Computers & Mathematics | 34 | 7.8% |
| Bio, Nature & Agricultural | 29 | 6.6% |
| Physical & Health Sciences | 27 | 6.2% |
| Psychology | 0 | 0.0% |
| Social Sciences | 7 | 1.6% |
| Engineering | 0 | 0.0% |
| Multidisciplinary Studies | 0 | 0.0% |
| Science & Technology | 35 | 8.0% |
| Business | 33 | 7.5% |
| Education | 156 | 35.6% |
| Literature & Languages | 21 | 4.8% |
| Liberal Arts & History | 19 | 4.3% |
| Visual & Performing Arts | 0 | 0.0% |
| Communications | 11 | 2.5% |
| Arts & Humanities | 66 | 15.1% |
| Total | 438 | 100.0% |
Transportation & Commute in Crane
Vehicle Availability by Sex in Crane
The most prevalent vehicle ownership categories in Crane are males with 2 vehicles (340, accounting for 31.5%) and females with 2 vehicles (164, making up 51.8%).
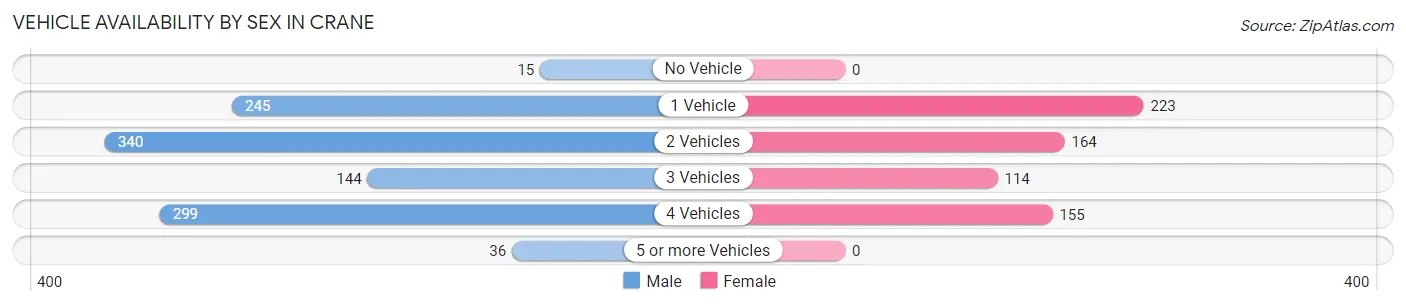
| Vehicles Available | Male | Female |
| No Vehicle | 15 (1.4%) | 0 (0.0%) |
| 1 Vehicle | 245 (22.7%) | 223 (34.0%) |
| 2 Vehicles | 340 (31.5%) | 164 (25.0%) |
| 3 Vehicles | 144 (13.4%) | 114 (17.4%) |
| 4 Vehicles | 299 (27.7%) | 155 (23.6%) |
| 5 or more Vehicles | 36 (3.3%) | 0 (0.0%) |
| Total | 1,079 (100.0%) | 656 (100.0%) |
Commute Time in Crane
The most frequently occuring commute durations in Crane are 5 to 9 minutes (507 commuters, 29.2%), 30 to 34 minutes (197 commuters, 11.4%), and 45 to 59 minutes (195 commuters, 11.2%).
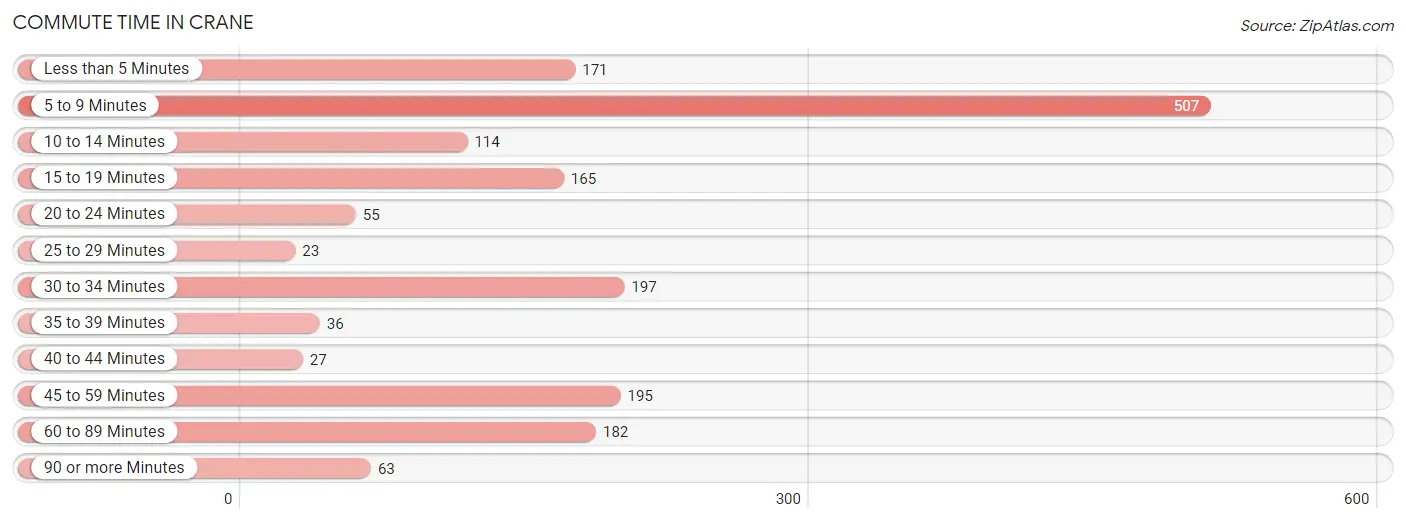
| Commute Time | # Commuters | % Commuters |
| Less than 5 Minutes | 171 | 9.9% |
| 5 to 9 Minutes | 507 | 29.2% |
| 10 to 14 Minutes | 114 | 6.6% |
| 15 to 19 Minutes | 165 | 9.5% |
| 20 to 24 Minutes | 55 | 3.2% |
| 25 to 29 Minutes | 23 | 1.3% |
| 30 to 34 Minutes | 197 | 11.4% |
| 35 to 39 Minutes | 36 | 2.1% |
| 40 to 44 Minutes | 27 | 1.6% |
| 45 to 59 Minutes | 195 | 11.2% |
| 60 to 89 Minutes | 182 | 10.5% |
| 90 or more Minutes | 63 | 3.6% |
Commute Time by Sex in Crane
The most common commute times in Crane are 5 to 9 minutes (244 commuters, 22.6%) for males and 5 to 9 minutes (263 commuters, 40.1%) for females.
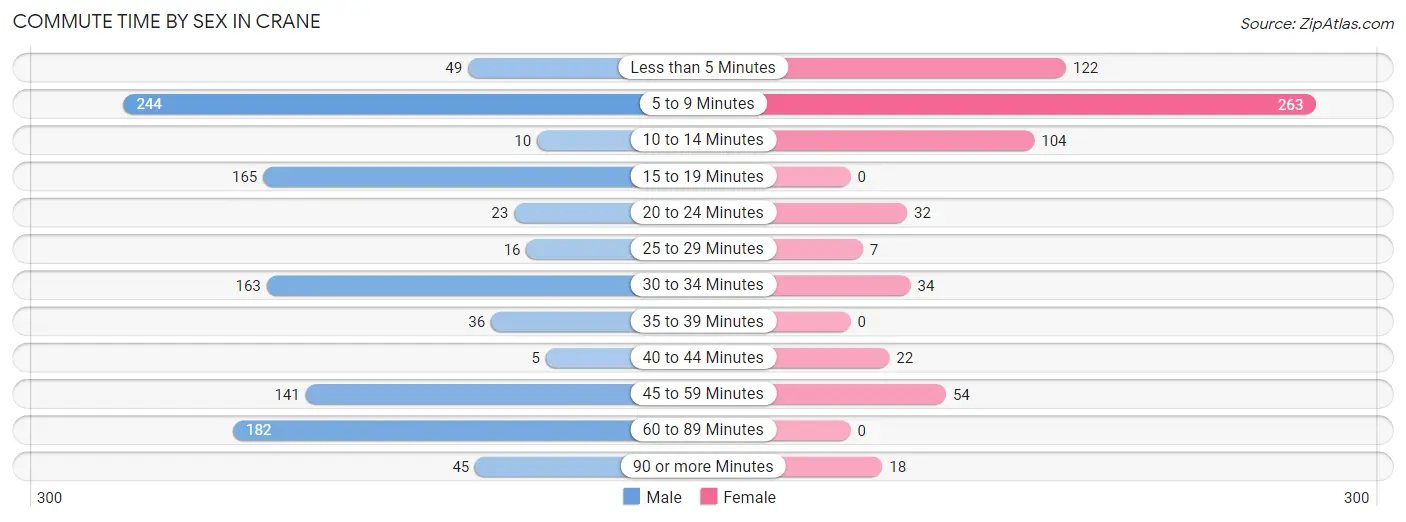
| Commute Time | Male | Female |
| Less than 5 Minutes | 49 (4.5%) | 122 (18.6%) |
| 5 to 9 Minutes | 244 (22.6%) | 263 (40.1%) |
| 10 to 14 Minutes | 10 (0.9%) | 104 (15.9%) |
| 15 to 19 Minutes | 165 (15.3%) | 0 (0.0%) |
| 20 to 24 Minutes | 23 (2.1%) | 32 (4.9%) |
| 25 to 29 Minutes | 16 (1.5%) | 7 (1.1%) |
| 30 to 34 Minutes | 163 (15.1%) | 34 (5.2%) |
| 35 to 39 Minutes | 36 (3.3%) | 0 (0.0%) |
| 40 to 44 Minutes | 5 (0.5%) | 22 (3.4%) |
| 45 to 59 Minutes | 141 (13.1%) | 54 (8.2%) |
| 60 to 89 Minutes | 182 (16.9%) | 0 (0.0%) |
| 90 or more Minutes | 45 (4.2%) | 18 (2.7%) |
Time of Departure to Work by Sex in Crane
The most frequent times of departure to work in Crane are 6:00 AM to 6:29 AM (224, 20.8%) for males and 7:00 AM to 7:29 AM (245, 37.3%) for females.
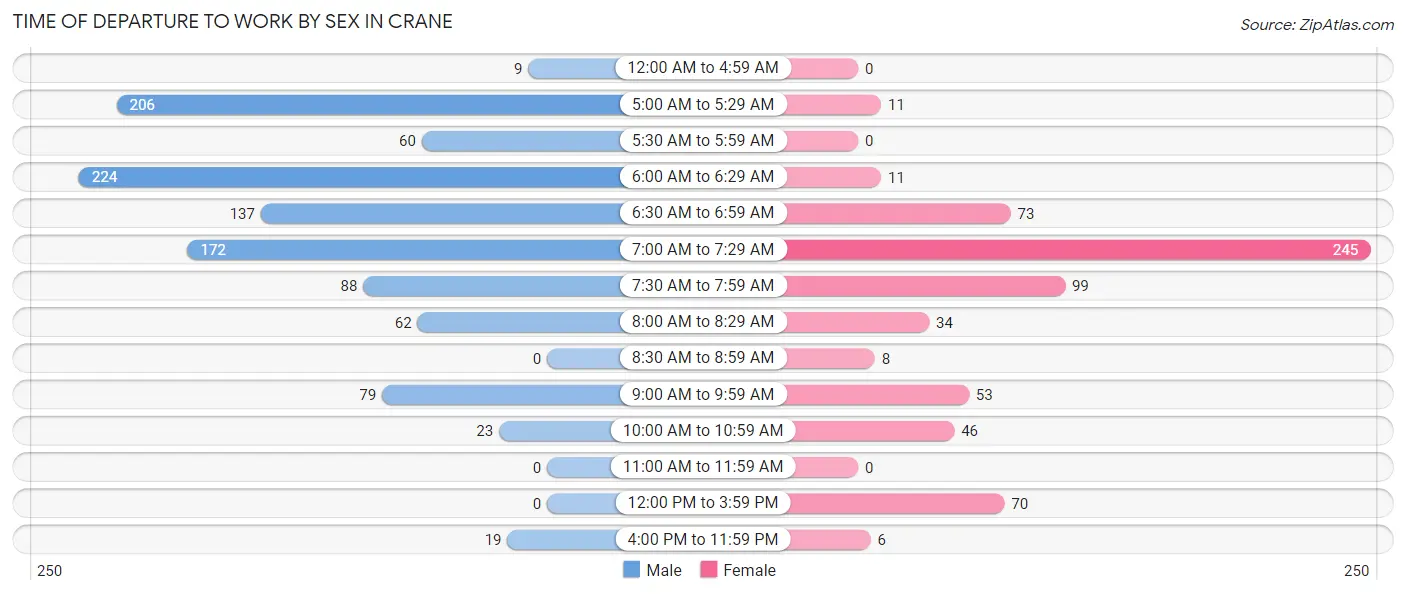
| Time of Departure | Male | Female |
| 12:00 AM to 4:59 AM | 9 (0.8%) | 0 (0.0%) |
| 5:00 AM to 5:29 AM | 206 (19.1%) | 11 (1.7%) |
| 5:30 AM to 5:59 AM | 60 (5.6%) | 0 (0.0%) |
| 6:00 AM to 6:29 AM | 224 (20.8%) | 11 (1.7%) |
| 6:30 AM to 6:59 AM | 137 (12.7%) | 73 (11.1%) |
| 7:00 AM to 7:29 AM | 172 (15.9%) | 245 (37.3%) |
| 7:30 AM to 7:59 AM | 88 (8.2%) | 99 (15.1%) |
| 8:00 AM to 8:29 AM | 62 (5.8%) | 34 (5.2%) |
| 8:30 AM to 8:59 AM | 0 (0.0%) | 8 (1.2%) |
| 9:00 AM to 9:59 AM | 79 (7.3%) | 53 (8.1%) |
| 10:00 AM to 10:59 AM | 23 (2.1%) | 46 (7.0%) |
| 11:00 AM to 11:59 AM | 0 (0.0%) | 0 (0.0%) |
| 12:00 PM to 3:59 PM | 0 (0.0%) | 70 (10.7%) |
| 4:00 PM to 11:59 PM | 19 (1.8%) | 6 (0.9%) |
| Total | 1,079 (100.0%) | 656 (100.0%) |
Housing Occupancy in Crane
Occupancy by Ownership in Crane
Of the total 1,203 dwellings in Crane, owner-occupied units account for 960 (79.8%), while renter-occupied units make up 243 (20.2%).
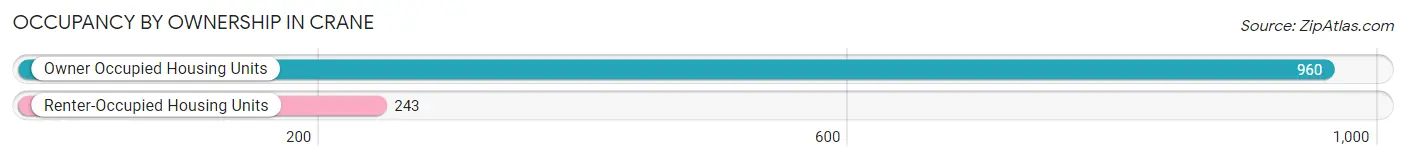
| Occupancy | # Housing Units | % Housing Units |
| Owner Occupied Housing Units | 960 | 79.8% |
| Renter-Occupied Housing Units | 243 | 20.2% |
| Total Occupied Housing Units | 1,203 | 100.0% |
Occupancy by Household Size in Crane
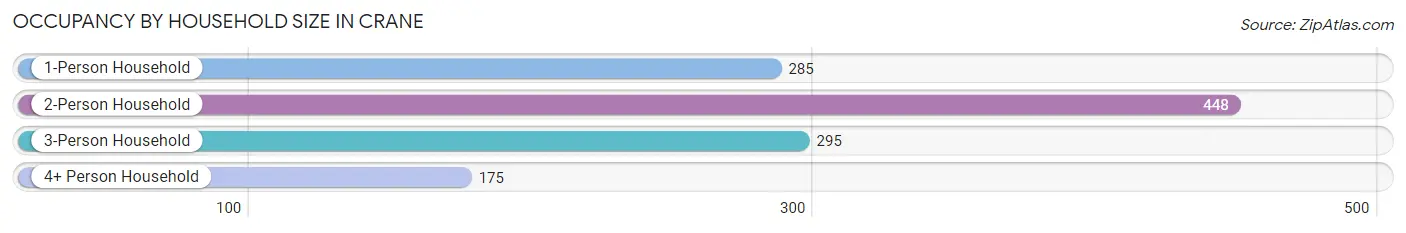
| Household Size | # Housing Units | % Housing Units |
| 1-Person Household | 285 | 23.7% |
| 2-Person Household | 448 | 37.2% |
| 3-Person Household | 295 | 24.5% |
| 4+ Person Household | 175 | 14.5% |
| Total Housing Units | 1,203 | 100.0% |
Occupancy by Ownership by Household Size in Crane
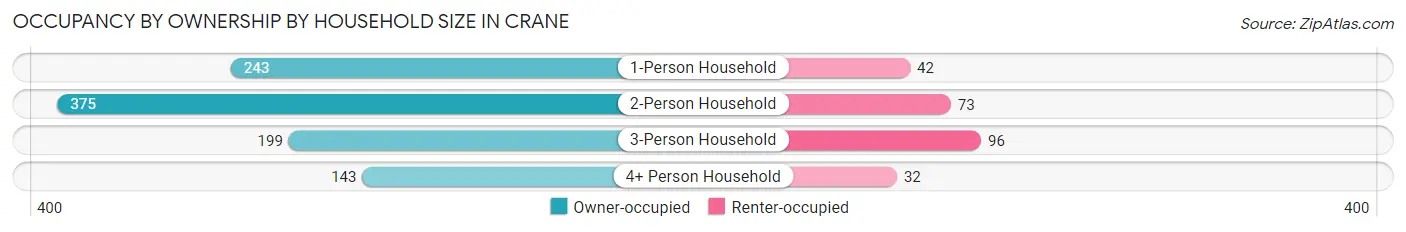
| Household Size | Owner-occupied | Renter-occupied |
| 1-Person Household | 243 (85.3%) | 42 (14.7%) |
| 2-Person Household | 375 (83.7%) | 73 (16.3%) |
| 3-Person Household | 199 (67.5%) | 96 (32.5%) |
| 4+ Person Household | 143 (81.7%) | 32 (18.3%) |
| Total Housing Units | 960 (79.8%) | 243 (20.2%) |
Occupancy by Educational Attainment in Crane
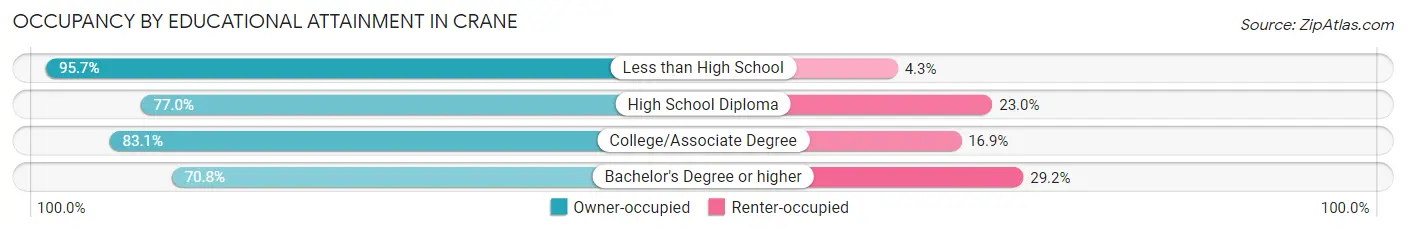
| Household Size | Owner-occupied | Renter-occupied |
| Less than High School | 202 (95.7%) | 9 (4.3%) |
| High School Diploma | 428 (77.0%) | 128 (23.0%) |
| College/Associate Degree | 143 (83.1%) | 29 (16.9%) |
| Bachelor's Degree or higher | 187 (70.8%) | 77 (29.2%) |
Occupancy by Age of Householder in Crane
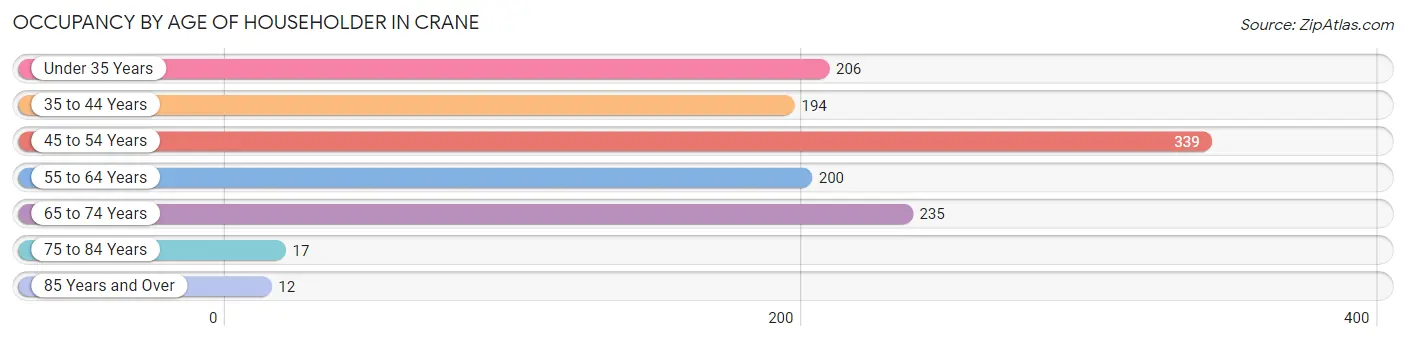
| Age Bracket | # Households | % Households |
| Under 35 Years | 206 | 17.1% |
| 35 to 44 Years | 194 | 16.1% |
| 45 to 54 Years | 339 | 28.2% |
| 55 to 64 Years | 200 | 16.6% |
| 65 to 74 Years | 235 | 19.5% |
| 75 to 84 Years | 17 | 1.4% |
| 85 Years and Over | 12 | 1.0% |
| Total | 1,203 | 100.0% |
Housing Finances in Crane
Median Income by Occupancy in Crane
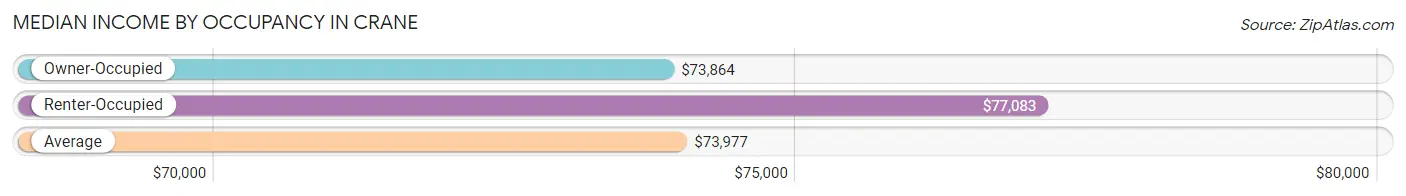
| Occupancy Type | # Households | Median Income |
| Owner-Occupied | 960 (79.8%) | $73,864 |
| Renter-Occupied | 243 (20.2%) | $77,083 |
| Average | 1,203 (100.0%) | $73,977 |
Occupancy by Householder Income Bracket in Crane
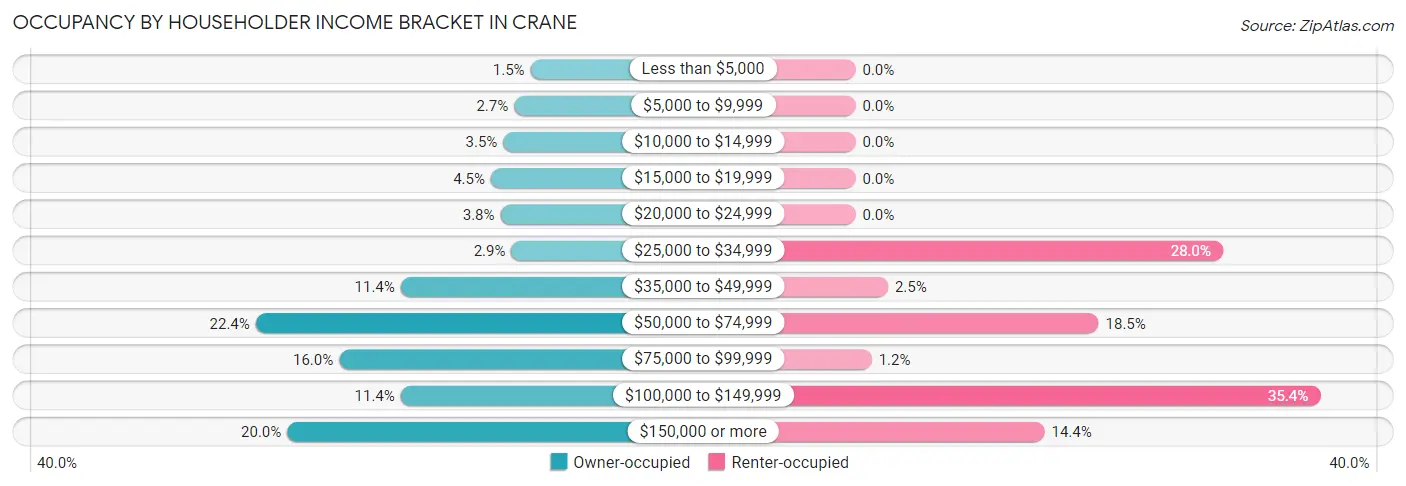
| Income Bracket | Owner-occupied | Renter-occupied |
| Less than $5,000 | 14 (1.5%) | 0 (0.0%) |
| $5,000 to $9,999 | 26 (2.7%) | 0 (0.0%) |
| $10,000 to $14,999 | 34 (3.5%) | 0 (0.0%) |
| $15,000 to $19,999 | 43 (4.5%) | 0 (0.0%) |
| $20,000 to $24,999 | 36 (3.7%) | 0 (0.0%) |
| $25,000 to $34,999 | 28 (2.9%) | 68 (28.0%) |
| $35,000 to $49,999 | 109 (11.4%) | 6 (2.5%) |
| $50,000 to $74,999 | 215 (22.4%) | 45 (18.5%) |
| $75,000 to $99,999 | 154 (16.0%) | 3 (1.2%) |
| $100,000 to $149,999 | 109 (11.4%) | 86 (35.4%) |
| $150,000 or more | 192 (20.0%) | 35 (14.4%) |
| Total | 960 (100.0%) | 243 (100.0%) |
Monthly Housing Cost Tiers in Crane
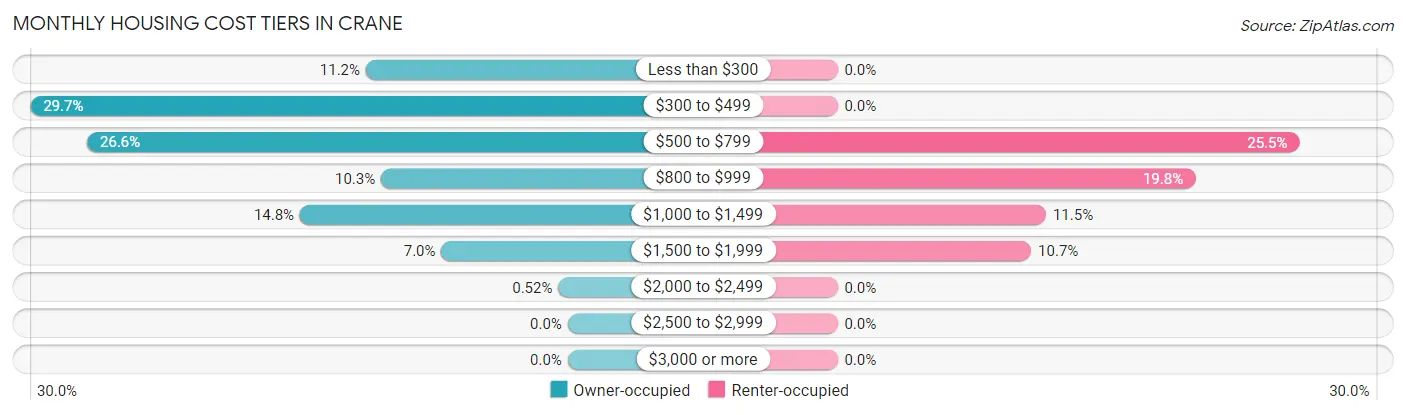
| Monthly Cost | Owner-occupied | Renter-occupied |
| Less than $300 | 107 (11.2%) | 0 (0.0%) |
| $300 to $499 | 285 (29.7%) | 0 (0.0%) |
| $500 to $799 | 255 (26.6%) | 62 (25.5%) |
| $800 to $999 | 99 (10.3%) | 48 (19.8%) |
| $1,000 to $1,499 | 142 (14.8%) | 28 (11.5%) |
| $1,500 to $1,999 | 67 (7.0%) | 26 (10.7%) |
| $2,000 to $2,499 | 5 (0.5%) | 0 (0.0%) |
| $2,500 to $2,999 | 0 (0.0%) | 0 (0.0%) |
| $3,000 or more | 0 (0.0%) | 0 (0.0%) |
| Total | 960 (100.0%) | 243 (100.0%) |
Physical Housing Characteristics in Crane
Housing Structures in Crane
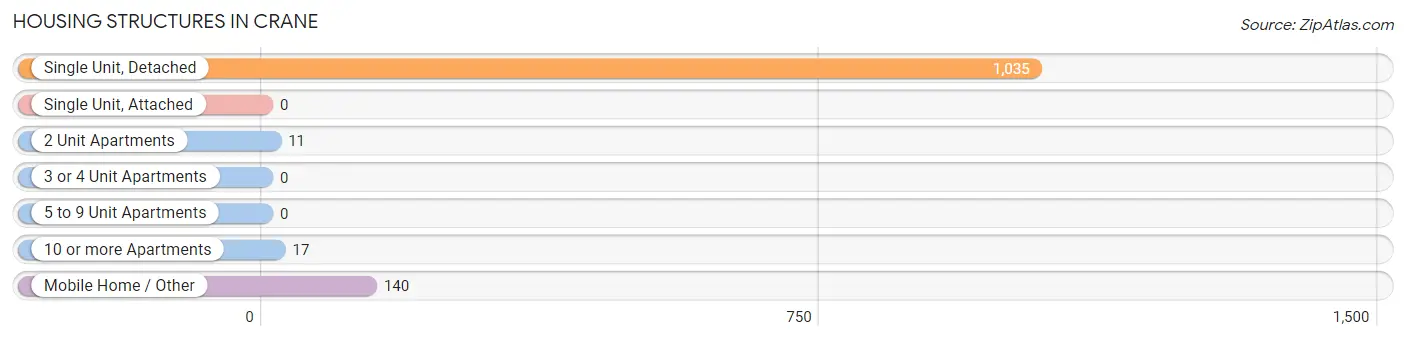
| Structure Type | # Housing Units | % Housing Units |
| Single Unit, Detached | 1,035 | 86.0% |
| Single Unit, Attached | 0 | 0.0% |
| 2 Unit Apartments | 11 | 0.9% |
| 3 or 4 Unit Apartments | 0 | 0.0% |
| 5 to 9 Unit Apartments | 0 | 0.0% |
| 10 or more Apartments | 17 | 1.4% |
| Mobile Home / Other | 140 | 11.6% |
| Total | 1,203 | 100.0% |
Housing Structures by Occupancy in Crane
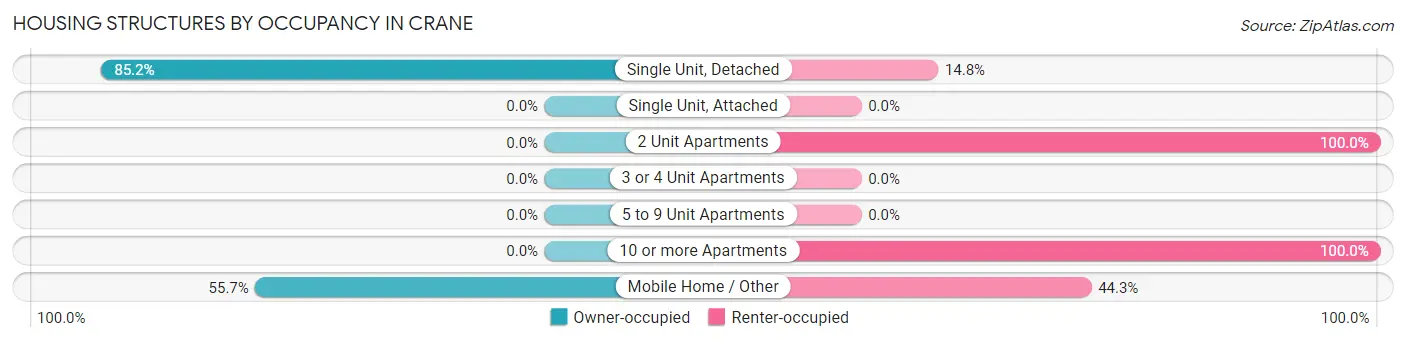
| Structure Type | Owner-occupied | Renter-occupied |
| Single Unit, Detached | 882 (85.2%) | 153 (14.8%) |
| Single Unit, Attached | 0 (0.0%) | 0 (0.0%) |
| 2 Unit Apartments | 0 (0.0%) | 11 (100.0%) |
| 3 or 4 Unit Apartments | 0 (0.0%) | 0 (0.0%) |
| 5 to 9 Unit Apartments | 0 (0.0%) | 0 (0.0%) |
| 10 or more Apartments | 0 (0.0%) | 17 (100.0%) |
| Mobile Home / Other | 78 (55.7%) | 62 (44.3%) |
| Total | 960 (79.8%) | 243 (20.2%) |
Housing Structures by Number of Rooms in Crane
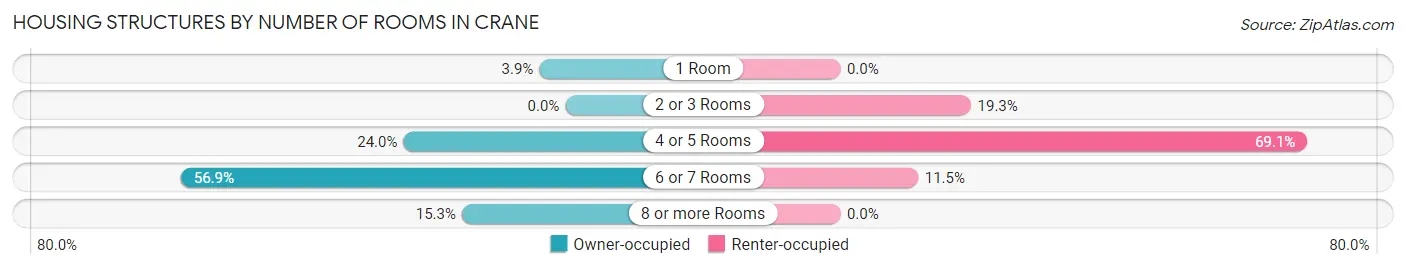
| Number of Rooms | Owner-occupied | Renter-occupied |
| 1 Room | 37 (3.8%) | 0 (0.0%) |
| 2 or 3 Rooms | 0 (0.0%) | 47 (19.3%) |
| 4 or 5 Rooms | 230 (24.0%) | 168 (69.1%) |
| 6 or 7 Rooms | 546 (56.9%) | 28 (11.5%) |
| 8 or more Rooms | 147 (15.3%) | 0 (0.0%) |
| Total | 960 (100.0%) | 243 (100.0%) |
Housing Structure by Heating Type in Crane
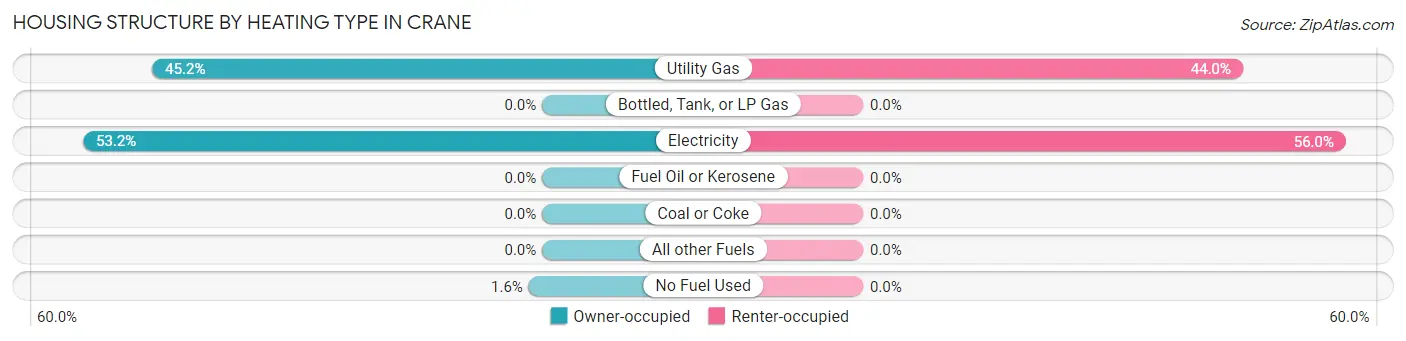
| Heating Type | Owner-occupied | Renter-occupied |
| Utility Gas | 434 (45.2%) | 107 (44.0%) |
| Bottled, Tank, or LP Gas | 0 (0.0%) | 0 (0.0%) |
| Electricity | 511 (53.2%) | 136 (56.0%) |
| Fuel Oil or Kerosene | 0 (0.0%) | 0 (0.0%) |
| Coal or Coke | 0 (0.0%) | 0 (0.0%) |
| All other Fuels | 0 (0.0%) | 0 (0.0%) |
| No Fuel Used | 15 (1.6%) | 0 (0.0%) |
| Total | 960 (100.0%) | 243 (100.0%) |
Household Vehicle Usage in Crane
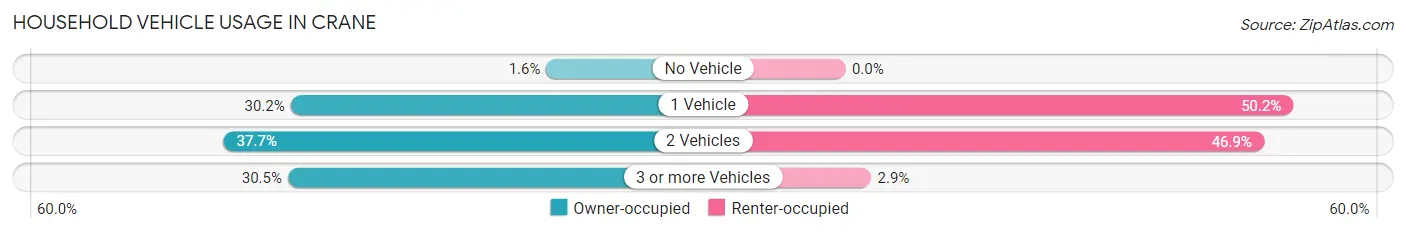
| Vehicles per Household | Owner-occupied | Renter-occupied |
| No Vehicle | 15 (1.6%) | 0 (0.0%) |
| 1 Vehicle | 290 (30.2%) | 122 (50.2%) |
| 2 Vehicles | 362 (37.7%) | 114 (46.9%) |
| 3 or more Vehicles | 293 (30.5%) | 7 (2.9%) |
| Total | 960 (100.0%) | 243 (100.0%) |
Real Estate & Mortgages in Crane
Real Estate and Mortgage Overview in Crane
| Characteristic | Without Mortgage | With Mortgage |
| Housing Units | 663 | 297 |
| Median Property Value | $118,900 | $153,000 |
| Median Household Income | $61,083 | $71 |
| Monthly Housing Costs | $460 | $0 |
| Real Estate Taxes | $1,657 | $5 |
Property Value by Mortgage Status in Crane
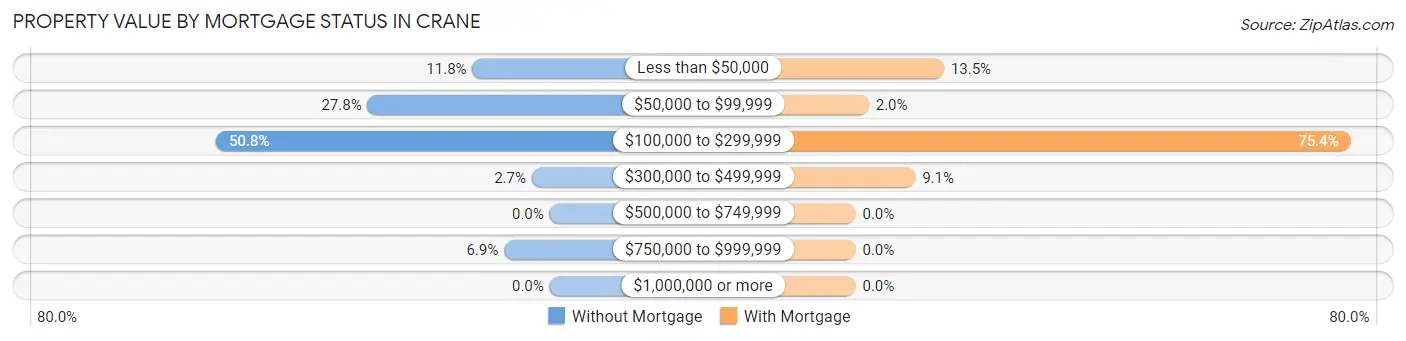
| Property Value | Without Mortgage | With Mortgage |
| Less than $50,000 | 78 (11.8%) | 40 (13.5%) |
| $50,000 to $99,999 | 184 (27.8%) | 6 (2.0%) |
| $100,000 to $299,999 | 337 (50.8%) | 224 (75.4%) |
| $300,000 to $499,999 | 18 (2.7%) | 27 (9.1%) |
| $500,000 to $749,999 | 0 (0.0%) | 0 (0.0%) |
| $750,000 to $999,999 | 46 (6.9%) | 0 (0.0%) |
| $1,000,000 or more | 0 (0.0%) | 0 (0.0%) |
| Total | 663 (100.0%) | 297 (100.0%) |
Household Income by Mortgage Status in Crane
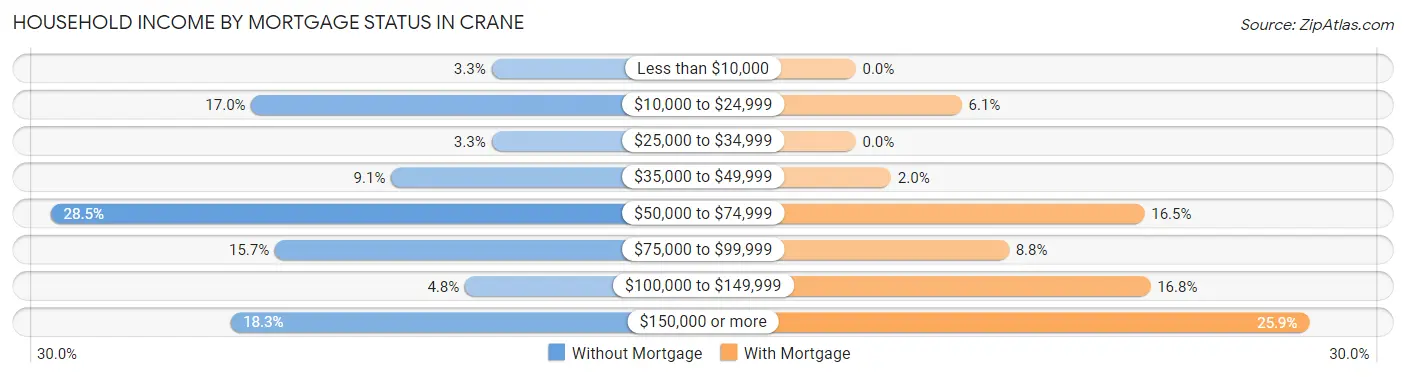
| Household Income | Without Mortgage | With Mortgage |
| Less than $10,000 | 22 (3.3%) | 0 (0.0%) |
| $10,000 to $24,999 | 113 (17.0%) | 18 (6.1%) |
| $25,000 to $34,999 | 22 (3.3%) | 0 (0.0%) |
| $35,000 to $49,999 | 60 (9.0%) | 6 (2.0%) |
| $50,000 to $74,999 | 189 (28.5%) | 49 (16.5%) |
| $75,000 to $99,999 | 104 (15.7%) | 26 (8.7%) |
| $100,000 to $149,999 | 32 (4.8%) | 50 (16.8%) |
| $150,000 or more | 121 (18.2%) | 77 (25.9%) |
| Total | 663 (100.0%) | 297 (100.0%) |
Property Value to Household Income Ratio in Crane
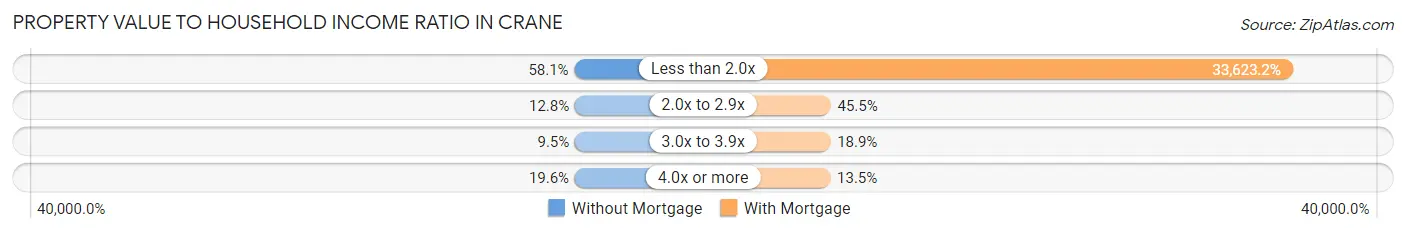
| Value-to-Income Ratio | Without Mortgage | With Mortgage |
| Less than 2.0x | 385 (58.1%) | 99,861 (33,623.2%) |
| 2.0x to 2.9x | 85 (12.8%) | 135 (45.5%) |
| 3.0x to 3.9x | 63 (9.5%) | 56 (18.9%) |
| 4.0x or more | 130 (19.6%) | 40 (13.5%) |
| Total | 663 (100.0%) | 297 (100.0%) |
Real Estate Taxes by Mortgage Status in Crane
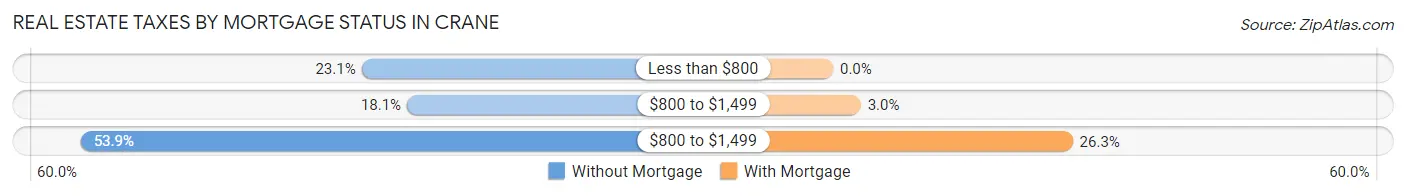
| Property Taxes | Without Mortgage | With Mortgage |
| Less than $800 | 153 (23.1%) | 0 (0.0%) |
| $800 to $1,499 | 120 (18.1%) | 9 (3.0%) |
| $800 to $1,499 | 357 (53.8%) | 78 (26.3%) |
| Total | 663 (100.0%) | 297 (100.0%) |
Health & Disability in Crane
Health Insurance Coverage by Age in Crane
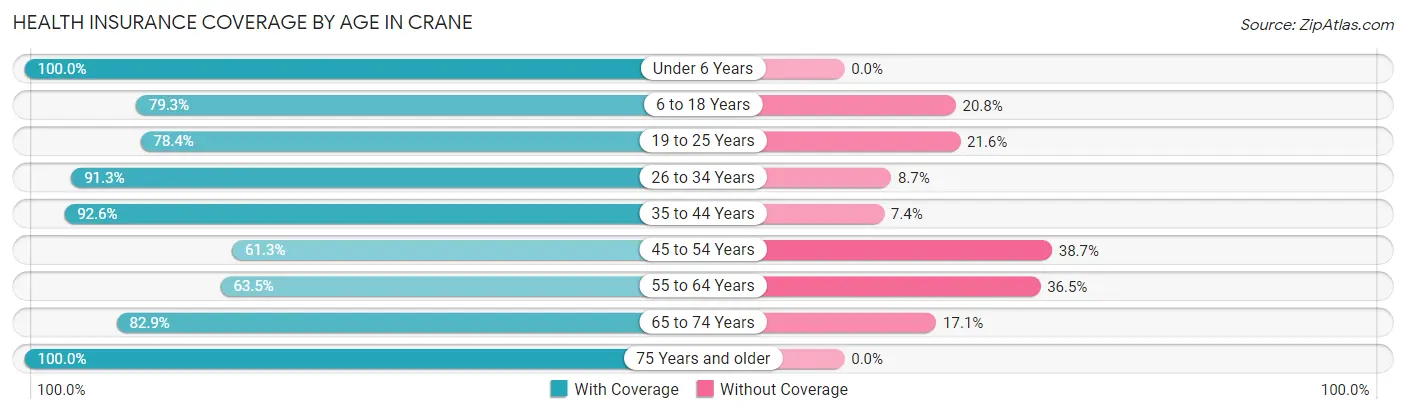
| Age Bracket | With Coverage | Without Coverage |
| Under 6 Years | 378 (100.0%) | 0 (0.0%) |
| 6 to 18 Years | 466 (79.2%) | 122 (20.7%) |
| 19 to 25 Years | 294 (78.4%) | 81 (21.6%) |
| 26 to 34 Years | 273 (91.3%) | 26 (8.7%) |
| 35 to 44 Years | 263 (92.6%) | 21 (7.4%) |
| 45 to 54 Years | 420 (61.3%) | 265 (38.7%) |
| 55 to 64 Years | 245 (63.5%) | 141 (36.5%) |
| 65 to 74 Years | 295 (82.9%) | 61 (17.1%) |
| 75 Years and older | 66 (100.0%) | 0 (0.0%) |
| Total | 2,700 (79.0%) | 717 (21.0%) |
Health Insurance Coverage by Citizenship Status in Crane
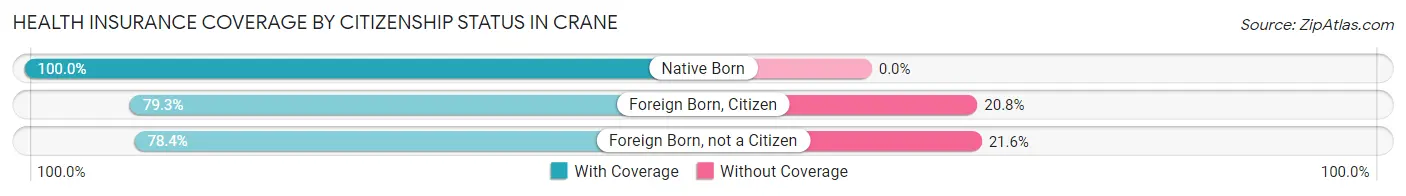
| Citizenship Status | With Coverage | Without Coverage |
| Native Born | 378 (100.0%) | 0 (0.0%) |
| Foreign Born, Citizen | 466 (79.2%) | 122 (20.7%) |
| Foreign Born, not a Citizen | 294 (78.4%) | 81 (21.6%) |
Health Insurance Coverage by Household Income in Crane
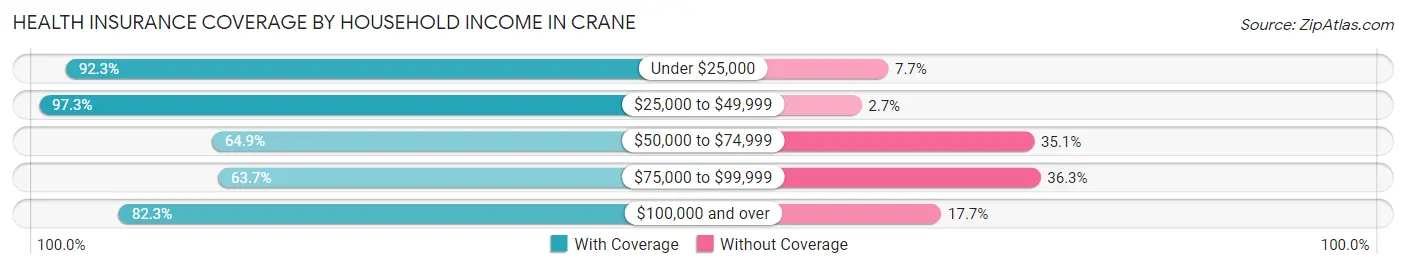
| Household Income | With Coverage | Without Coverage |
| Under $25,000 | 215 (92.3%) | 18 (7.7%) |
| $25,000 to $49,999 | 609 (97.3%) | 17 (2.7%) |
| $50,000 to $74,999 | 542 (64.9%) | 293 (35.1%) |
| $75,000 to $99,999 | 290 (63.7%) | 165 (36.3%) |
| $100,000 and over | 1,044 (82.3%) | 224 (17.7%) |
Public vs Private Health Insurance Coverage by Age in Crane
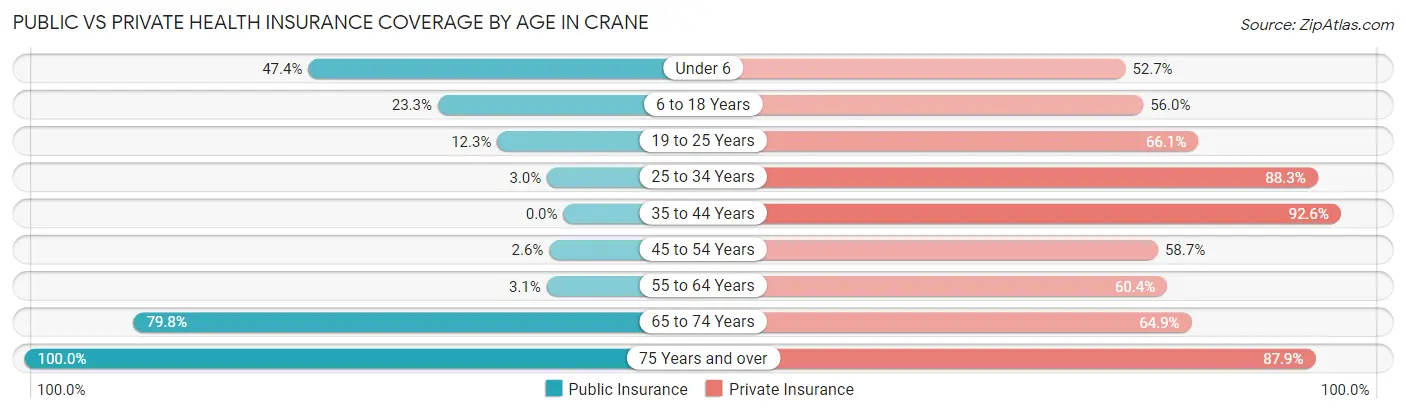
| Age Bracket | Public Insurance | Private Insurance |
| Under 6 | 179 (47.3%) | 199 (52.6%) |
| 6 to 18 Years | 137 (23.3%) | 329 (55.9%) |
| 19 to 25 Years | 46 (12.3%) | 248 (66.1%) |
| 25 to 34 Years | 9 (3.0%) | 264 (88.3%) |
| 35 to 44 Years | 0 (0.0%) | 263 (92.6%) |
| 45 to 54 Years | 18 (2.6%) | 402 (58.7%) |
| 55 to 64 Years | 12 (3.1%) | 233 (60.4%) |
| 65 to 74 Years | 284 (79.8%) | 231 (64.9%) |
| 75 Years and over | 66 (100.0%) | 58 (87.9%) |
| Total | 751 (22.0%) | 2,227 (65.2%) |
Disability Status by Sex by Age in Crane
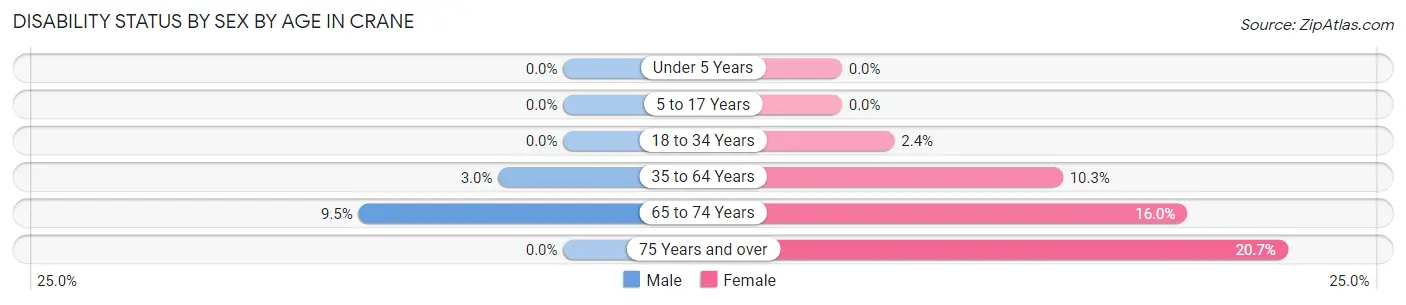
| Age Bracket | Male | Female |
| Under 5 Years | 0 (0.0%) | 0 (0.0%) |
| 5 to 17 Years | 0 (0.0%) | 0 (0.0%) |
| 18 to 34 Years | 0 (0.0%) | 7 (2.4%) |
| 35 to 64 Years | 20 (3.0%) | 71 (10.2%) |
| 65 to 74 Years | 19 (9.5%) | 25 (16.0%) |
| 75 Years and over | 0 (0.0%) | 12 (20.7%) |
Disability Class by Sex by Age in Crane
Disability Class: Hearing Difficulty
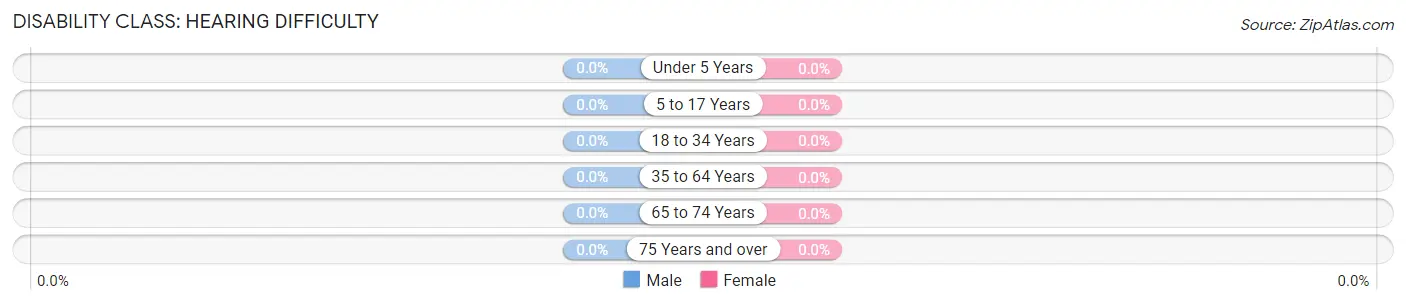
| Age Bracket | Male | Female |
| Under 5 Years | 0 (0.0%) | 0 (0.0%) |
| 5 to 17 Years | 0 (0.0%) | 0 (0.0%) |
| 18 to 34 Years | 0 (0.0%) | 0 (0.0%) |
| 35 to 64 Years | 0 (0.0%) | 0 (0.0%) |
| 65 to 74 Years | 0 (0.0%) | 0 (0.0%) |
| 75 Years and over | 0 (0.0%) | 0 (0.0%) |
Disability Class: Vision Difficulty
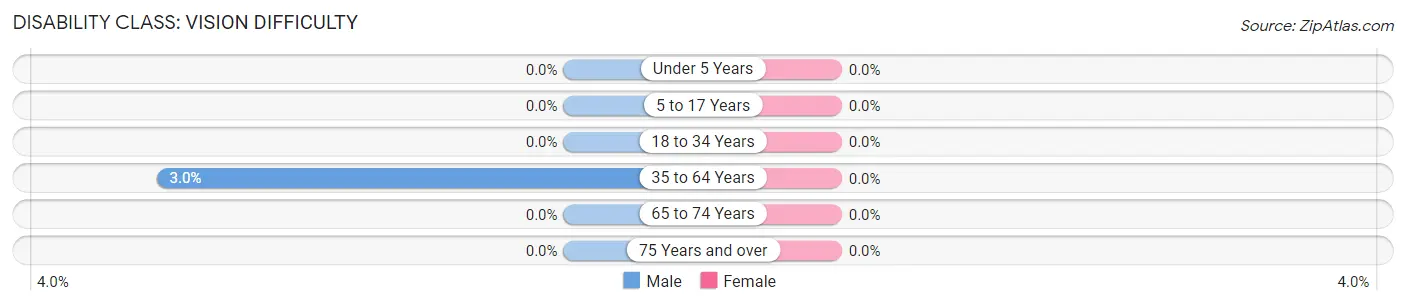
| Age Bracket | Male | Female |
| Under 5 Years | 0 (0.0%) | 0 (0.0%) |
| 5 to 17 Years | 0 (0.0%) | 0 (0.0%) |
| 18 to 34 Years | 0 (0.0%) | 0 (0.0%) |
| 35 to 64 Years | 20 (3.0%) | 0 (0.0%) |
| 65 to 74 Years | 0 (0.0%) | 0 (0.0%) |
| 75 Years and over | 0 (0.0%) | 0 (0.0%) |
Disability Class: Cognitive Difficulty
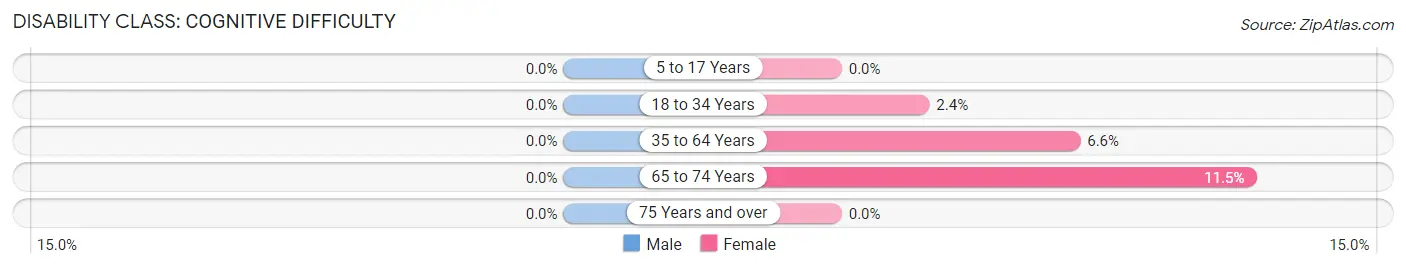
| Age Bracket | Male | Female |
| 5 to 17 Years | 0 (0.0%) | 0 (0.0%) |
| 18 to 34 Years | 0 (0.0%) | 7 (2.4%) |
| 35 to 64 Years | 0 (0.0%) | 46 (6.6%) |
| 65 to 74 Years | 0 (0.0%) | 18 (11.5%) |
| 75 Years and over | 0 (0.0%) | 0 (0.0%) |
Disability Class: Ambulatory Difficulty
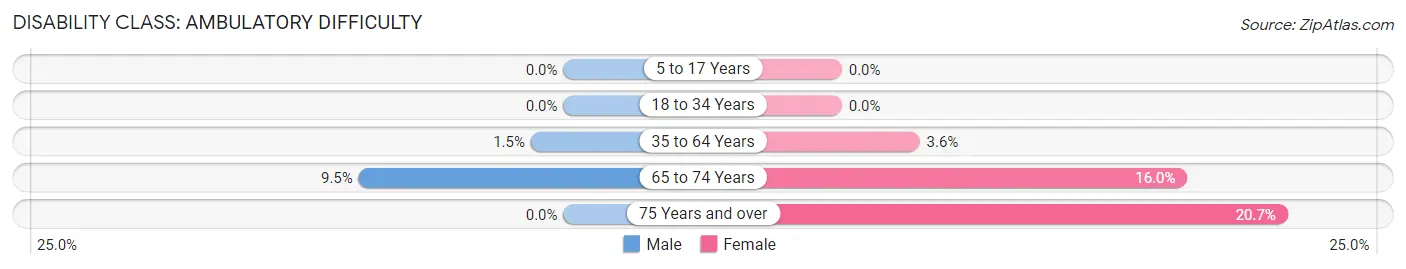
| Age Bracket | Male | Female |
| 5 to 17 Years | 0 (0.0%) | 0 (0.0%) |
| 18 to 34 Years | 0 (0.0%) | 0 (0.0%) |
| 35 to 64 Years | 10 (1.5%) | 25 (3.6%) |
| 65 to 74 Years | 19 (9.5%) | 25 (16.0%) |
| 75 Years and over | 0 (0.0%) | 12 (20.7%) |
Disability Class: Self-Care Difficulty
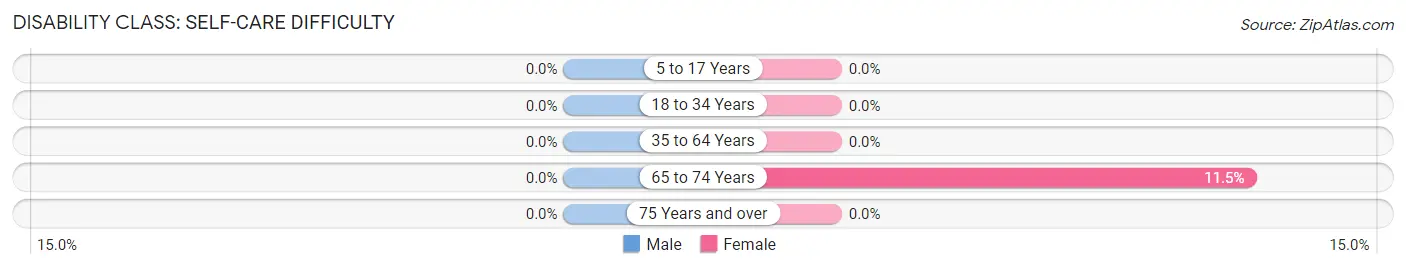
| Age Bracket | Male | Female |
| 5 to 17 Years | 0 (0.0%) | 0 (0.0%) |
| 18 to 34 Years | 0 (0.0%) | 0 (0.0%) |
| 35 to 64 Years | 0 (0.0%) | 0 (0.0%) |
| 65 to 74 Years | 0 (0.0%) | 18 (11.5%) |
| 75 Years and over | 0 (0.0%) | 0 (0.0%) |
Technology Access in Crane
Computing Device Access in Crane
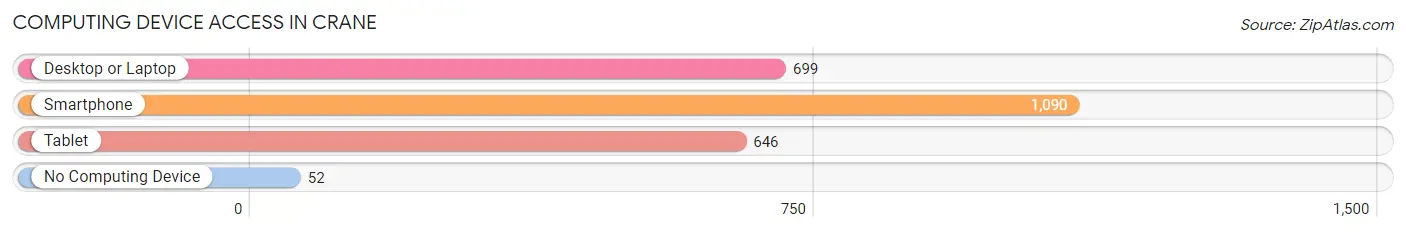
| Device Type | # Households | % Households |
| Desktop or Laptop | 699 | 58.1% |
| Smartphone | 1,090 | 90.6% |
| Tablet | 646 | 53.7% |
| No Computing Device | 52 | 4.3% |
| Total | 1,203 | 100.0% |
Internet Access in Crane
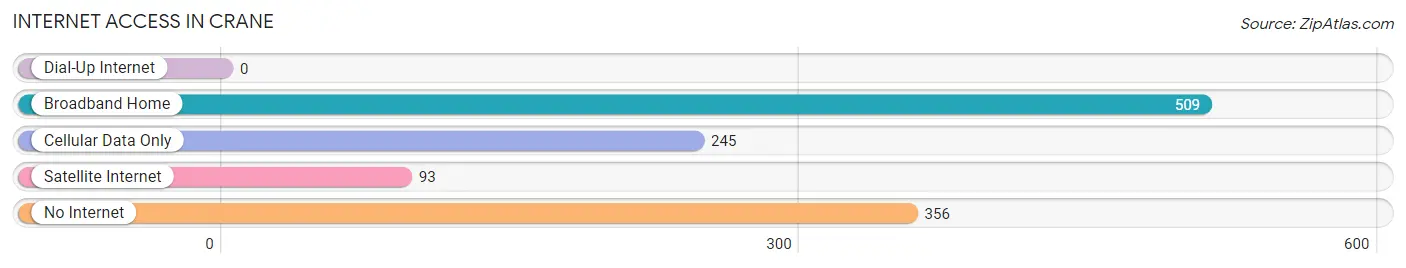
| Internet Type | # Households | % Households |
| Dial-Up Internet | 0 | 0.0% |
| Broadband Home | 509 | 42.3% |
| Cellular Data Only | 245 | 20.4% |
| Satellite Internet | 93 | 7.7% |
| No Internet | 356 | 29.6% |
| Total | 1,203 | 100.0% |
Crane Summary
Crane is a city located in Crane County, Texas, United States. The population was 4,375 at the 2010 census. It is the county seat of Crane County. The city is located in the heart of the Permian Basin oil fields, and is the home of the world's first oil boom.
History
Crane was founded in 1909 by the Crane Oil and Gas Company, which was owned by the Crane family. The company was founded by brothers Charles and William Crane, who had moved to the area from Pennsylvania. The company was the first to drill for oil in the Permian Basin, and the first oil boom in the area began in 1910. The town was named after the company, and the first post office was established in 1911.
The town grew rapidly during the oil boom, and by 1920 the population had reached 1,500. The town was incorporated in 1921, and the first mayor was elected in 1922.
The oil boom ended in the late 1920s, and the population of Crane began to decline. The population dropped to 1,000 by 1930, and to 500 by 1940. The population remained relatively stable until the 1970s, when it began to increase again.
Geography
Crane is located in the Permian Basin region of West Texas, about 90 miles east of Midland. The city is situated at the intersection of U.S. Highway 385 and State Highway 329.
The climate in Crane is semi-arid, with hot summers and mild winters. The average annual temperature is 64°F, and the average annual precipitation is 17.5 inches.
Economy
Crane is the economic center of Crane County, and the city's economy is largely based on oil and gas production. The city is home to several oil and gas companies, including the Crane Oil and Gas Company, which is still owned by the Crane family.
The city is also home to several manufacturing companies, including a steel fabrication plant and a plastics manufacturing plant. The city is also home to several retail stores, restaurants, and other businesses.
Demographics
As of the 2010 census, there were 4,375 people, 1,717 households, and 1,093 families residing in the city. The population density was 1,093.3 people per square mile. The racial makeup of the city was 75.3% White, 0.7% African American, 0.7% Native American, 0.3% Asian, 0.1% Pacific Islander, 20.3% from other races, and 2.6% from two or more races. Hispanic or Latino of any race were 44.2% of the population.
The median income for a household in the city was $31,250, and the median income for a family was $37,500. The per capita income for the city was $15,945. About 20.3% of families and 24.2% of the population were below the poverty line, including 33.3% of those under age 18 and 16.2% of those age 65 or over.
Common Questions
What is the Total Population of Crane?
Total Population of Crane is 3,456.
What is the Total Male Population of Crane?
Total Male Population of Crane is 1,606.
What is the Total Female Population of Crane?
Total Female Population of Crane is 1,850.
What is the Ratio of Males per 100 Females in Crane?
There are 86.81 Males per 100 Females in Crane.
What is the Ratio of Females per 100 Males in Crane?
There are 115.19 Females per 100 Males in Crane.
What is the Median Population Age in Crane?
Median Population Age in Crane is 37.8 Years.
What is the Average Family Size in Crane
Average Family Size in Crane is 3.5 People.
What is the Average Household Size in Crane
Average Household Size in Crane is 2.8 People.
What is Per Capita Income in Crane?
Per Capita income in Crane is $33,031.
What is the Median Family Income in Crane?
Median Family Income in Crane is $83,542.
What is the Median Household income in Crane?
Median Household Income in Crane is $73,977.
What is Income or Wage Gap in Crane?
Income or Wage Gap in Crane is 42.1%.
Women in Crane earn 57.9 cents for every dollar earned by a man.
What is Inequality or Gini Index in Crane?
Inequality or Gini Index in Crane is 0.37.
How Large is the Labor Force in Crane?
There are 1,779 People in the Labor Forcein in Crane.
What is the Percentage of People in the Labor Force in Crane?
66.5% of People are in the Labor Force in Crane.
What is the Unemployment Rate in Crane?
Unemployment Rate in Crane is 2.1%.