Vernon, TX
Vernon Map
Vernon Overview
10,018
TOTAL POPULATION
4,884
MALE POPULATION
5,134
FEMALE POPULATION
95.13
MALES / 100 FEMALES
105.12
FEMALES / 100 MALES
36.7
MEDIAN AGE
3.3
AVG FAMILY SIZE
2.6
AVG HOUSEHOLD SIZE
$23,456
PER CAPITA INCOME
$55,625
AVG FAMILY INCOME
$47,528
AVG HOUSEHOLD INCOME
1.6%
WAGE / INCOME GAP [ % ]
98.4¢/ $1
WAGE / INCOME GAP [ $ ]
0.41
INEQUALITY / GINI INDEX
4,812
LABOR FORCE [ PEOPLE ]
60.2%
PERCENT IN LABOR FORCE
11.3%
UNEMPLOYMENT RATE
Vernon Zip Codes
Vernon Area Codes
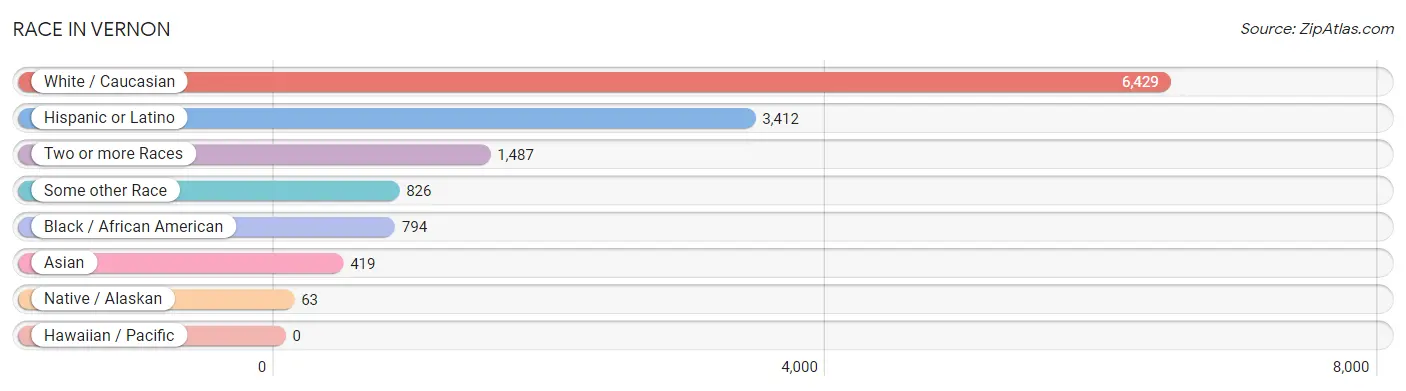
Race in Vernon
The most populous races in Vernon are White / Caucasian (6,429 | 64.2%), Hispanic or Latino (3,412 | 34.1%), and Two or more Races (1,487 | 14.8%).
| Race | # Population | % Population |
| Asian | 419 | 4.2% |
| Black / African American | 794 | 7.9% |
| Hawaiian / Pacific | 0 | 0.0% |
| Hispanic or Latino | 3,412 | 34.1% |
| Native / Alaskan | 63 | 0.6% |
| White / Caucasian | 6,429 | 64.2% |
| Two or more Races | 1,487 | 14.8% |
| Some other Race | 826 | 8.3% |
| Total | 10,018 | 100.0% |
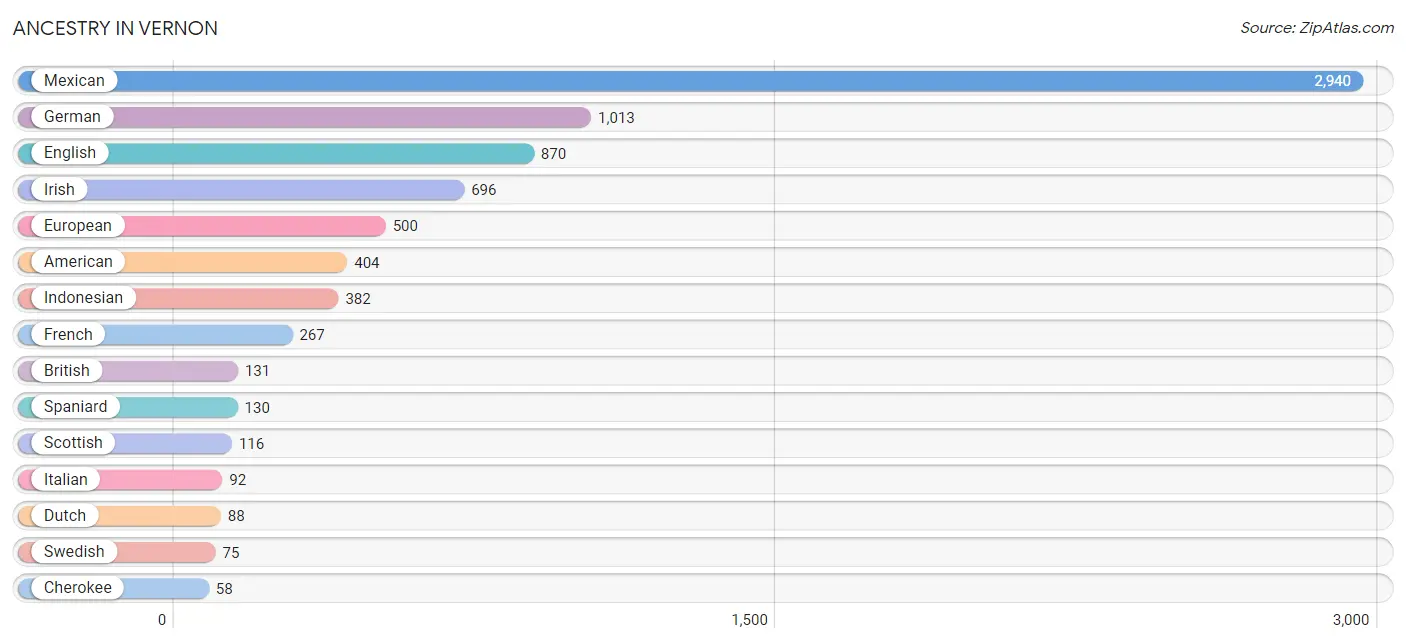
Ancestry in Vernon
The most populous ancestries reported in Vernon are Mexican (2,940 | 29.3%), German (1,013 | 10.1%), English (870 | 8.7%), Irish (696 | 7.0%), and European (500 | 5.0%), together accounting for 60.1% of all Vernon residents.
| Ancestry | # Population | % Population |
| African | 20 | 0.2% |
| American | 404 | 4.0% |
| Apache | 22 | 0.2% |
| Austrian | 4 | 0.0% |
| Blackfeet | 35 | 0.4% |
| British | 131 | 1.3% |
| Central American | 37 | 0.4% |
| Central American Indian | 11 | 0.1% |
| Cherokee | 58 | 0.6% |
| Chickasaw | 4 | 0.0% |
| Chippewa | 1 | 0.0% |
| Choctaw | 51 | 0.5% |
| Comanche | 38 | 0.4% |
| Czech | 19 | 0.2% |
| Dutch | 88 | 0.9% |
| English | 870 | 8.7% |
| European | 500 | 5.0% |
| Filipino | 5 | 0.1% |
| Finnish | 14 | 0.1% |
| French | 267 | 2.7% |
| German | 1,013 | 10.1% |
| Guatemalan | 25 | 0.3% |
| Indian (Asian) | 7 | 0.1% |
| Indonesian | 382 | 3.8% |
| Irish | 696 | 7.0% |
| Italian | 92 | 0.9% |
| Korean | 43 | 0.4% |
| Mexican | 2,940 | 29.3% |
| Mexican American Indian | 31 | 0.3% |
| Nigerian | 7 | 0.1% |
| Polish | 32 | 0.3% |
| Pueblo | 15 | 0.2% |
| Puerto Rican | 22 | 0.2% |
| Russian | 11 | 0.1% |
| Salvadoran | 12 | 0.1% |
| Scandinavian | 36 | 0.4% |
| Scotch-Irish | 7 | 0.1% |
| Scottish | 116 | 1.2% |
| Sioux | 42 | 0.4% |
| Slovak | 43 | 0.4% |
| Spaniard | 130 | 1.3% |
| Spanish | 9 | 0.1% |
| Subsaharan African | 27 | 0.3% |
| Swedish | 75 | 0.7% |
| Swiss | 18 | 0.2% |
| Thai | 3 | 0.0% | View All 46 Rows |
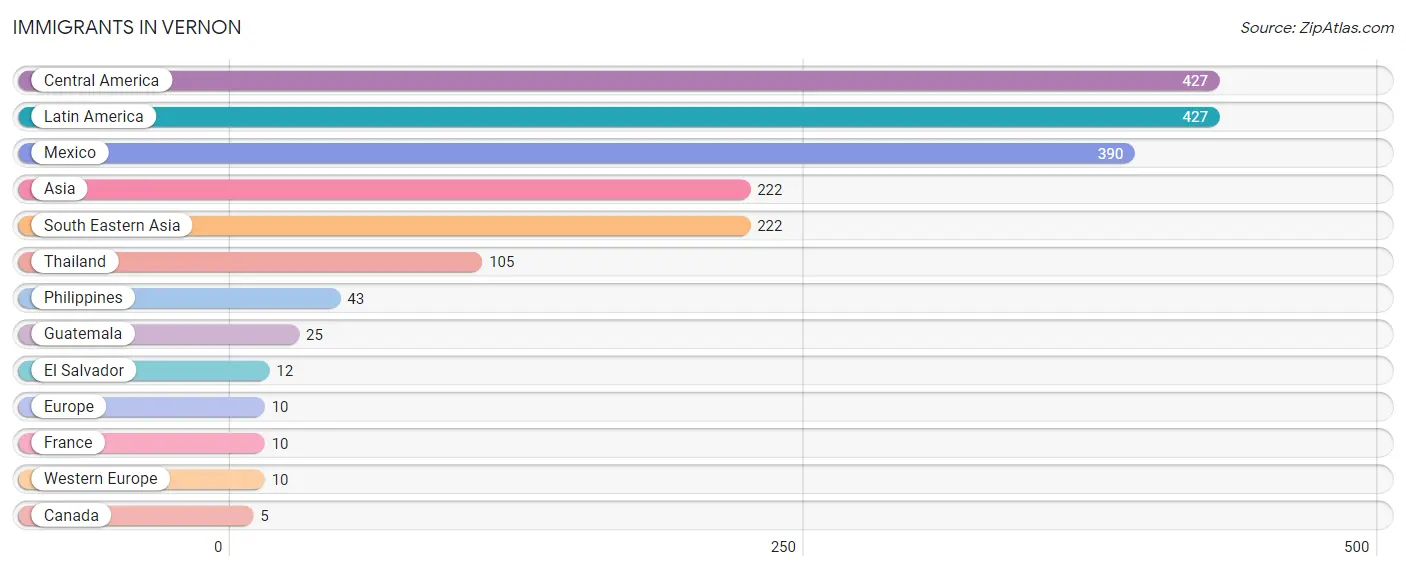
Immigrants in Vernon
The most numerous immigrant groups reported in Vernon came from Central America (427 | 4.3%), Latin America (427 | 4.3%), Mexico (390 | 3.9%), Asia (222 | 2.2%), and South Eastern Asia (222 | 2.2%), together accounting for 16.8% of all Vernon residents.
| Immigration Origin | # Population | % Population |
| Asia | 222 | 2.2% |
| Canada | 5 | 0.1% |
| Central America | 427 | 4.3% |
| El Salvador | 12 | 0.1% |
| Europe | 10 | 0.1% |
| France | 10 | 0.1% |
| Guatemala | 25 | 0.3% |
| Latin America | 427 | 4.3% |
| Mexico | 390 | 3.9% |
| Philippines | 43 | 0.4% |
| South Eastern Asia | 222 | 2.2% |
| Thailand | 105 | 1.1% |
| Western Europe | 10 | 0.1% | View All 13 Rows |
Sex and Age in Vernon
Sex and Age in Vernon
The most populous age groups in Vernon are 15 to 19 Years (515 | 10.5%) for men and 65 to 69 Years (391 | 7.6%) for women.
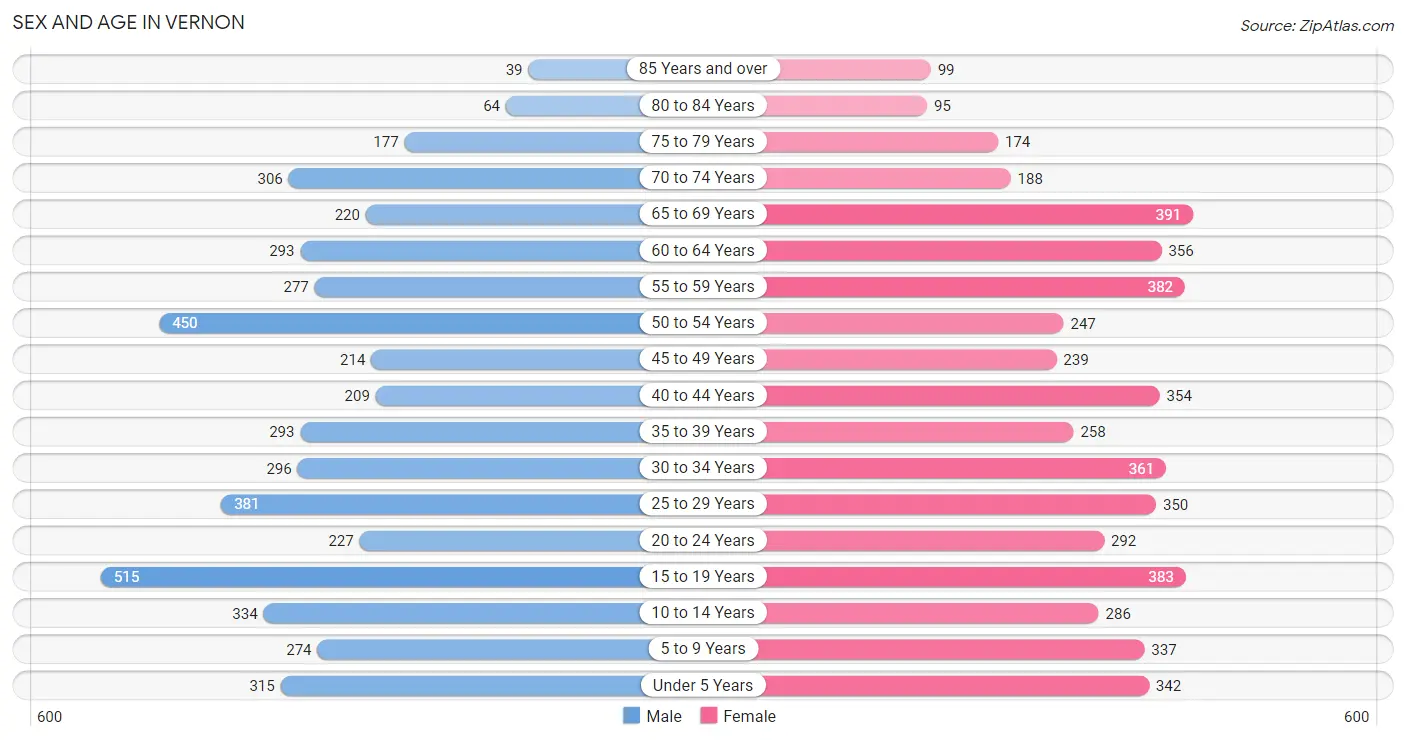
| Age Bracket | Male | Female |
| Under 5 Years | 315 (6.5%) | 342 (6.7%) |
| 5 to 9 Years | 274 (5.6%) | 337 (6.6%) |
| 10 to 14 Years | 334 (6.8%) | 286 (5.6%) |
| 15 to 19 Years | 515 (10.5%) | 383 (7.5%) |
| 20 to 24 Years | 227 (4.6%) | 292 (5.7%) |
| 25 to 29 Years | 381 (7.8%) | 350 (6.8%) |
| 30 to 34 Years | 296 (6.1%) | 361 (7.0%) |
| 35 to 39 Years | 293 (6.0%) | 258 (5.0%) |
| 40 to 44 Years | 209 (4.3%) | 354 (6.9%) |
| 45 to 49 Years | 214 (4.4%) | 239 (4.7%) |
| 50 to 54 Years | 450 (9.2%) | 247 (4.8%) |
| 55 to 59 Years | 277 (5.7%) | 382 (7.4%) |
| 60 to 64 Years | 293 (6.0%) | 356 (6.9%) |
| 65 to 69 Years | 220 (4.5%) | 391 (7.6%) |
| 70 to 74 Years | 306 (6.3%) | 188 (3.7%) |
| 75 to 79 Years | 177 (3.6%) | 174 (3.4%) |
| 80 to 84 Years | 64 (1.3%) | 95 (1.8%) |
| 85 Years and over | 39 (0.8%) | 99 (1.9%) |
| Total | 4,884 (100.0%) | 5,134 (100.0%) |
Families and Households in Vernon
Median Family Size in Vernon
The median family size in Vernon is 3.33 persons per family, with single female/mother families (709 | 31.6%) accounting for the largest median family size of 3.5 persons per family. On the other hand, single male/father families (110 | 4.9%) represent the smallest median family size with 2.99 persons per family.
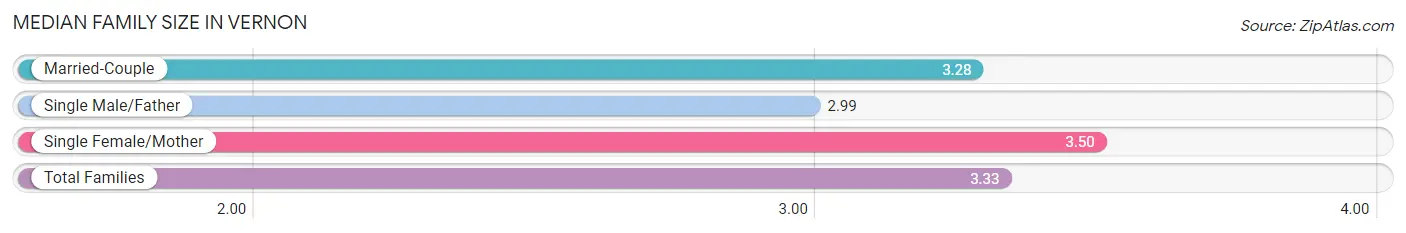
| Family Type | # Families | Family Size |
| Married-Couple | 1,423 (63.5%) | 3.28 |
| Single Male/Father | 110 (4.9%) | 2.99 |
| Single Female/Mother | 709 (31.6%) | 3.50 |
| Total Families | 2,242 (100.0%) | 3.33 |
Median Household Size in Vernon
The median household size in Vernon is 2.58 persons per household, with single female/mother households (709 | 18.9%) accounting for the largest median household size of 4.06 persons per household. non-family households (1,506 | 40.2%) represent the smallest median household size with 1.13 persons per household.
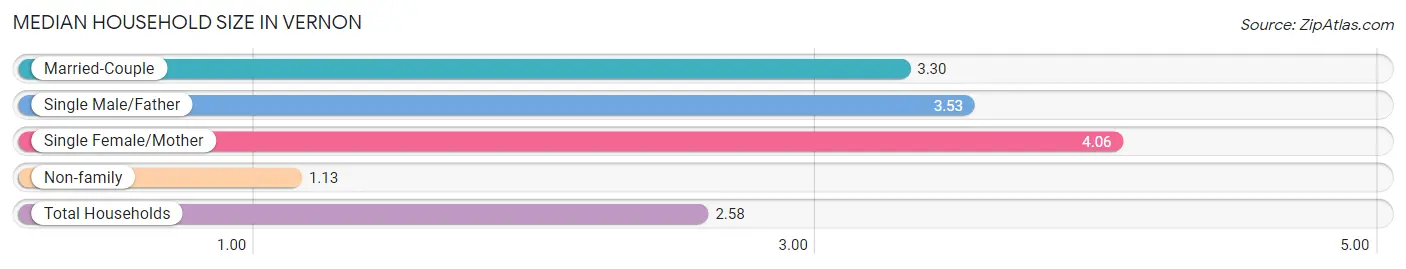
| Household Type | # Households | Household Size |
| Married-Couple | 1,423 (38.0%) | 3.30 |
| Single Male/Father | 110 (2.9%) | 3.53 |
| Single Female/Mother | 709 (18.9%) | 4.06 |
| Non-family | 1,506 (40.2%) | 1.13 |
| Total Households | 3,748 (100.0%) | 2.58 |
Household Size by Marriage Status in Vernon
Out of a total of 3,748 households in Vernon, 2,242 (59.8%) are family households, while 1,506 (40.2%) are nonfamily households. The most numerous type of family households are 2-person households, comprising 944, and the most common type of nonfamily households are 1-person households, comprising 1,370.
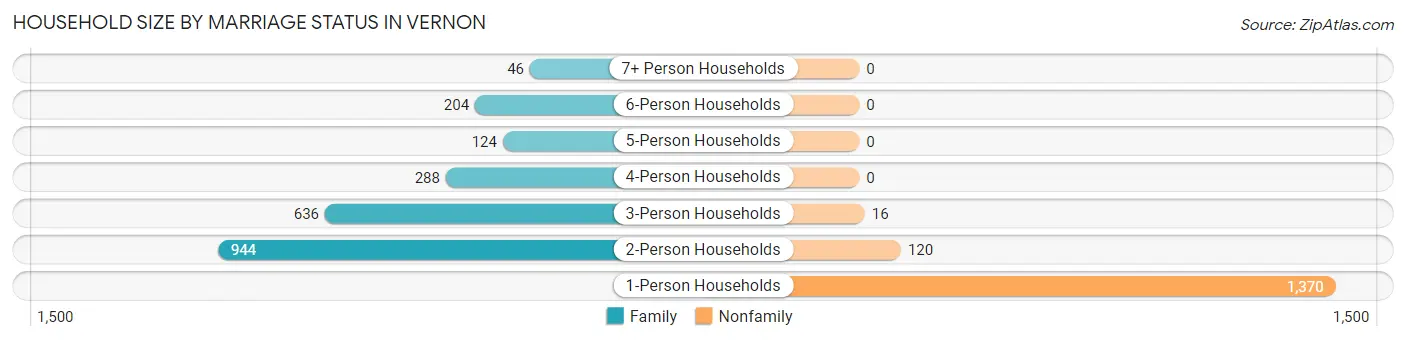
| Household Size | Family Households | Nonfamily Households |
| 1-Person Households | - | 1,370 (36.5%) |
| 2-Person Households | 944 (25.2%) | 120 (3.2%) |
| 3-Person Households | 636 (17.0%) | 16 (0.4%) |
| 4-Person Households | 288 (7.7%) | 0 (0.0%) |
| 5-Person Households | 124 (3.3%) | 0 (0.0%) |
| 6-Person Households | 204 (5.4%) | 0 (0.0%) |
| 7+ Person Households | 46 (1.2%) | 0 (0.0%) |
| Total | 2,242 (59.8%) | 1,506 (40.2%) |
Female Fertility in Vernon
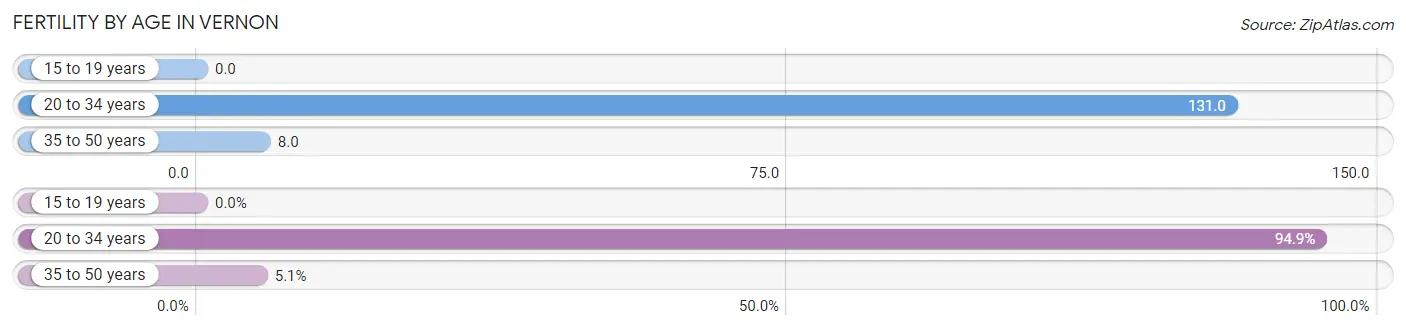
Fertility by Age in Vernon
Average fertility rate in Vernon is 60.0 births per 1,000 women. Women in the age bracket of 20 to 34 years have the highest fertility rate with 131.0 births per 1,000 women. Women in the age bracket of 20 to 34 years acount for 94.9% of all women with births.
| Age Bracket | Women with Births | Births / 1,000 Women |
| 15 to 19 years | 0 (0.0%) | 0.0 |
| 20 to 34 years | 131 (94.9%) | 131.0 |
| 35 to 50 years | 7 (5.1%) | 8.0 |
| Total | 138 (100.0%) | 60.0 |
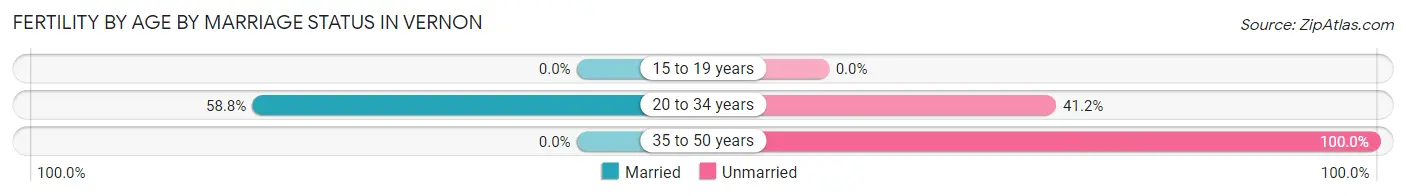
Fertility by Age by Marriage Status in Vernon
55.8% of women with births (138) in Vernon are married. The highest percentage of unmarried women with births falls into 35 to 50 years age bracket with 100.0% of them unmarried at the time of birth, while the lowest percentage of unmarried women with births belong to 20 to 34 years age bracket with 41.2% of them unmarried.
| Age Bracket | Married | Unmarried |
| 15 to 19 years | 0 (0.0%) | 0 (0.0%) |
| 20 to 34 years | 77 (58.8%) | 54 (41.2%) |
| 35 to 50 years | 0 (0.0%) | 7 (100.0%) |
| Total | 77 (55.8%) | 61 (44.2%) |
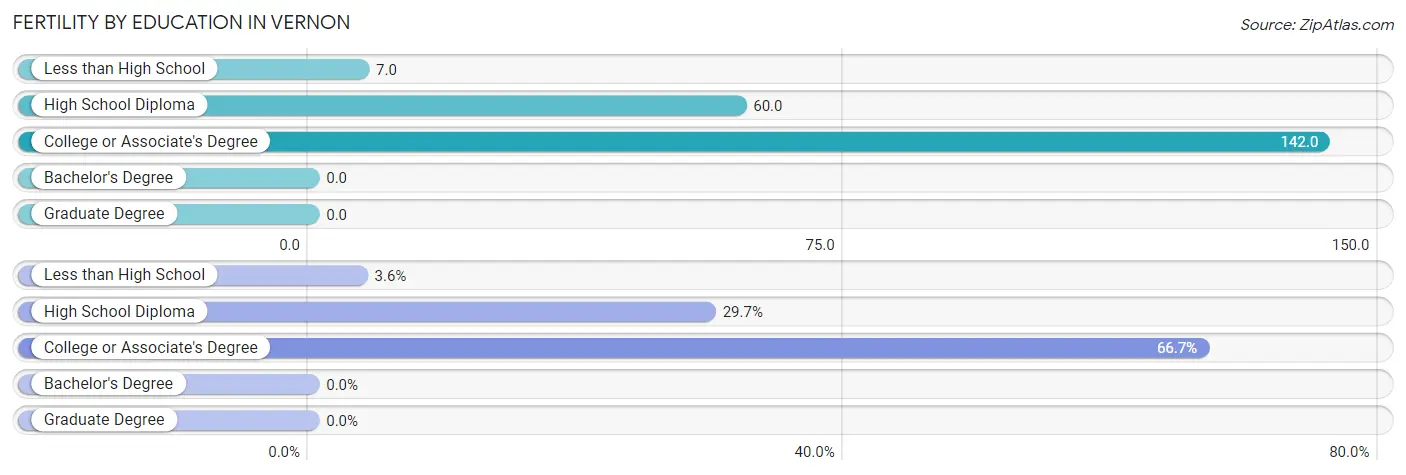
Fertility by Education in Vernon
| Educational Attainment | Women with Births | Births / 1,000 Women |
| Less than High School | 5 (3.6%) | 7.0 |
| High School Diploma | 41 (29.7%) | 60.0 |
| College or Associate's Degree | 92 (66.7%) | 142.0 |
| Bachelor's Degree | 0 (0.0%) | 0.0 |
| Graduate Degree | 0 (0.0%) | 0.0 |
| Total | 138 (100.0%) | 60.0 |
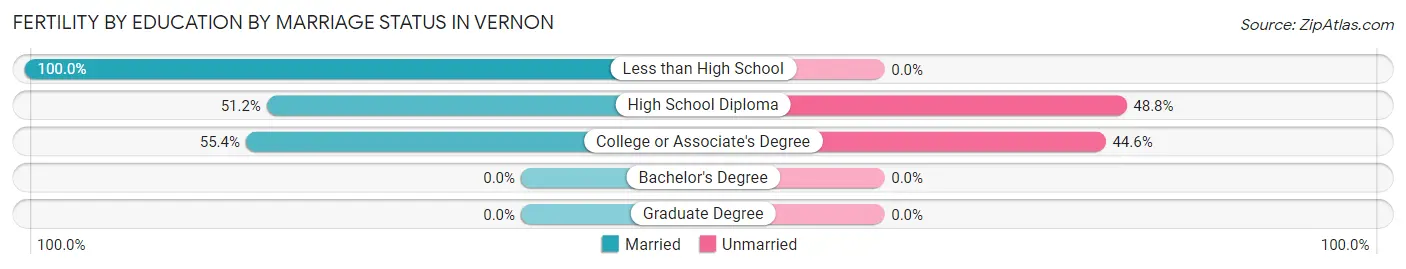
Fertility by Education by Marriage Status in Vernon
44.2% of women with births in Vernon are unmarried. Women with the educational attainment of less than high school are most likely to be married with 100.0% of them married at childbirth, while women with the educational attainment of high school diploma are least likely to be married with 48.8% of them unmarried at childbirth.
| Educational Attainment | Married | Unmarried |
| Less than High School | 5 (100.0%) | 0 (0.0%) |
| High School Diploma | 21 (51.2%) | 20 (48.8%) |
| College or Associate's Degree | 51 (55.4%) | 41 (44.6%) |
| Bachelor's Degree | 0 (0.0%) | 0 (0.0%) |
| Graduate Degree | 0 (0.0%) | 0 (0.0%) |
| Total | 77 (55.8%) | 61 (44.2%) |
Income in Vernon
Income Overview in Vernon
Per Capita Income in Vernon is $23,456, while median incomes of families and households are $55,625 and $47,528 respectively.
| Characteristic | Number | Measure |
| Per Capita Income | 10,018 | $23,456 |
| Median Family Income | 2,242 | $55,625 |
| Mean Family Income | 2,242 | $65,361 |
| Median Household Income | 3,748 | $47,528 |
| Mean Household Income | 3,748 | $58,526 |
| Income Deficit | 2,242 | $0 |
| Wage / Income Gap (%) | 10,018 | 1.63% |
| Wage / Income Gap ($) | 10,018 | 98.37¢ per $1 |
| Gini / Inequality Index | 10,018 | 0.41 |
Earnings by Sex in Vernon
Average Earnings in Vernon are $26,447, $26,193 for men and $26,628 for women, a difference of 1.6%.
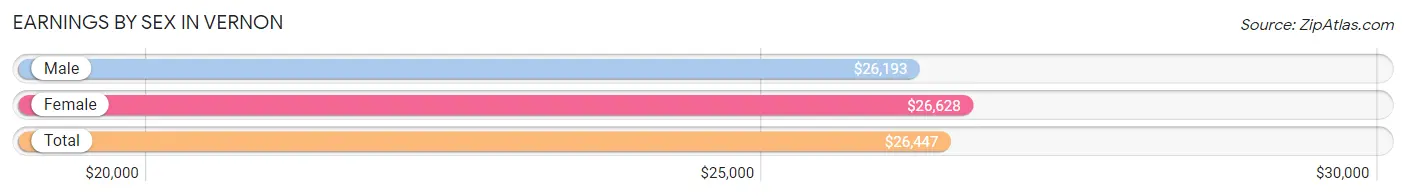
| Sex | Number | Average Earnings |
| Male | 2,466 (50.7%) | $26,193 |
| Female | 2,395 (49.3%) | $26,628 |
| Total | 4,861 (100.0%) | $26,447 |
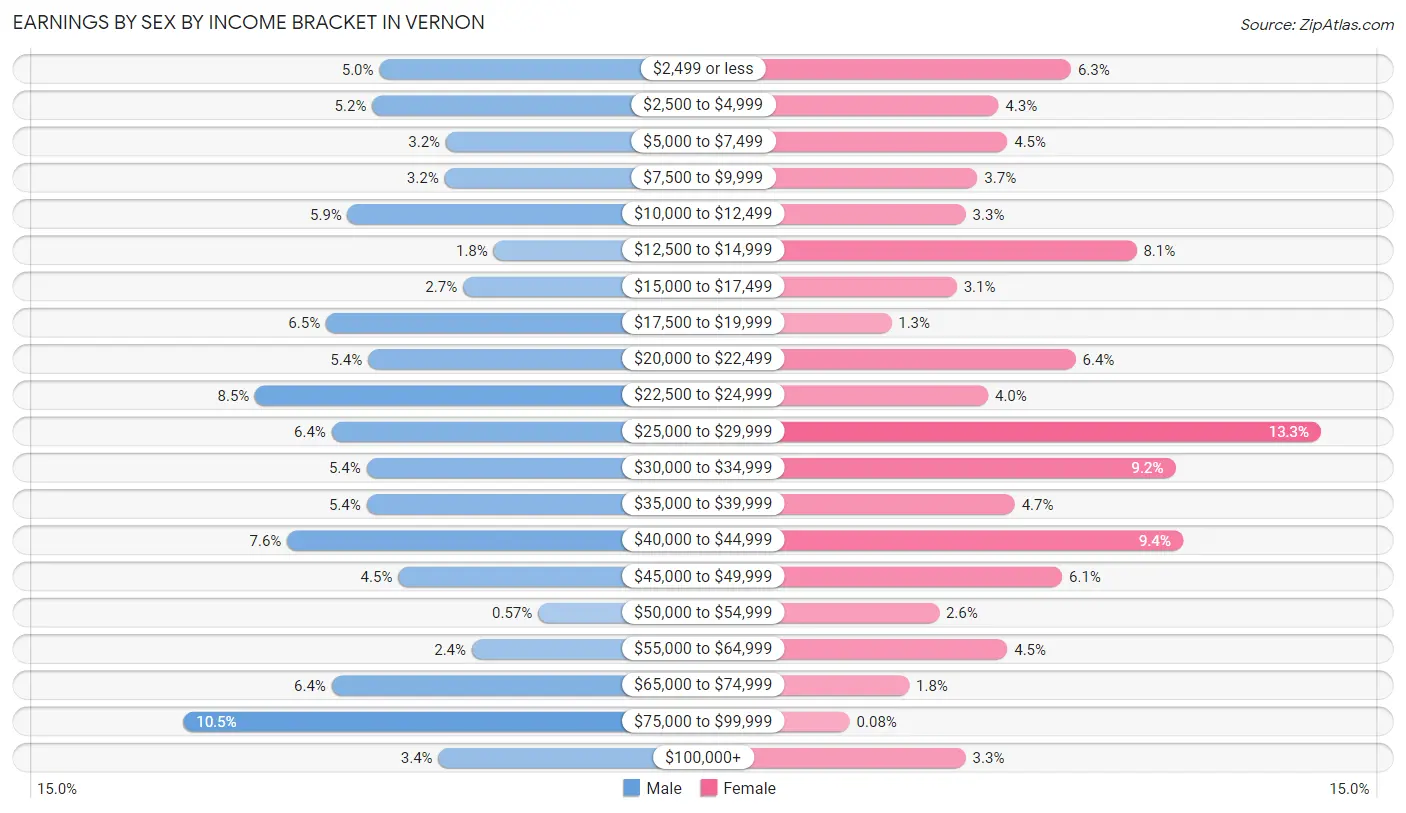
Earnings by Sex by Income Bracket in Vernon
The most common earnings brackets in Vernon are $75,000 to $99,999 for men (260 | 10.5%) and $25,000 to $29,999 for women (319 | 13.3%).
| Income | Male | Female |
| $2,499 or less | 124 (5.0%) | 151 (6.3%) |
| $2,500 to $4,999 | 129 (5.2%) | 102 (4.3%) |
| $5,000 to $7,499 | 78 (3.2%) | 108 (4.5%) |
| $7,500 to $9,999 | 79 (3.2%) | 88 (3.7%) |
| $10,000 to $12,499 | 146 (5.9%) | 80 (3.3%) |
| $12,500 to $14,999 | 45 (1.8%) | 195 (8.1%) |
| $15,000 to $17,499 | 66 (2.7%) | 74 (3.1%) |
| $17,500 to $19,999 | 161 (6.5%) | 30 (1.3%) |
| $20,000 to $22,499 | 132 (5.3%) | 154 (6.4%) |
| $22,500 to $24,999 | 210 (8.5%) | 95 (4.0%) |
| $25,000 to $29,999 | 157 (6.4%) | 319 (13.3%) |
| $30,000 to $34,999 | 133 (5.4%) | 221 (9.2%) |
| $35,000 to $39,999 | 133 (5.4%) | 113 (4.7%) |
| $40,000 to $44,999 | 188 (7.6%) | 226 (9.4%) |
| $45,000 to $49,999 | 111 (4.5%) | 145 (6.0%) |
| $50,000 to $54,999 | 14 (0.6%) | 62 (2.6%) |
| $55,000 to $64,999 | 60 (2.4%) | 108 (4.5%) |
| $65,000 to $74,999 | 157 (6.4%) | 42 (1.8%) |
| $75,000 to $99,999 | 260 (10.5%) | 2 (0.1%) |
| $100,000+ | 83 (3.4%) | 80 (3.3%) |
| Total | 2,466 (100.0%) | 2,395 (100.0%) |
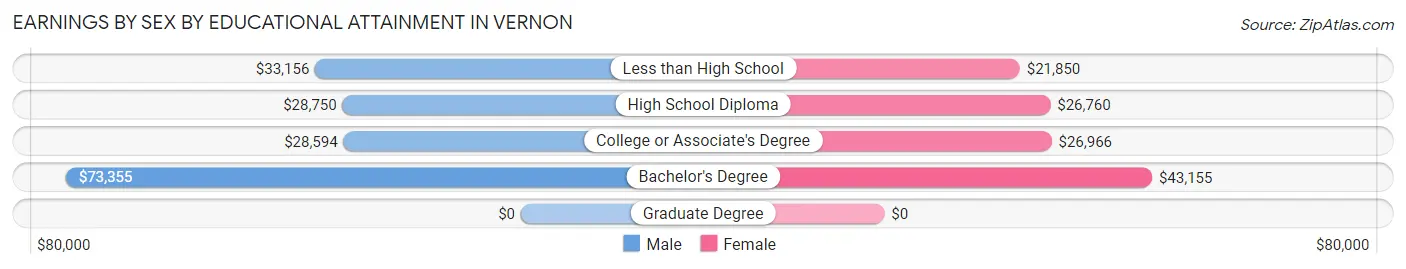
Earnings by Sex by Educational Attainment in Vernon
Average earnings in Vernon are $33,308 for men and $27,683 for women, a difference of 16.9%. Men with an educational attainment of bachelor's degree enjoy the highest average annual earnings of $73,355, while those with college or associate's degree education earn the least with $28,594. Women with an educational attainment of bachelor's degree earn the most with the average annual earnings of $43,155, while those with less than high school education have the smallest earnings of $21,850.
| Educational Attainment | Male Income | Female Income |
| Less than High School | $33,156 | $21,850 |
| High School Diploma | $28,750 | $26,760 |
| College or Associate's Degree | $28,594 | $26,966 |
| Bachelor's Degree | $73,355 | $43,155 |
| Graduate Degree | - | - |
| Total | $33,308 | $27,683 |
Family Income in Vernon
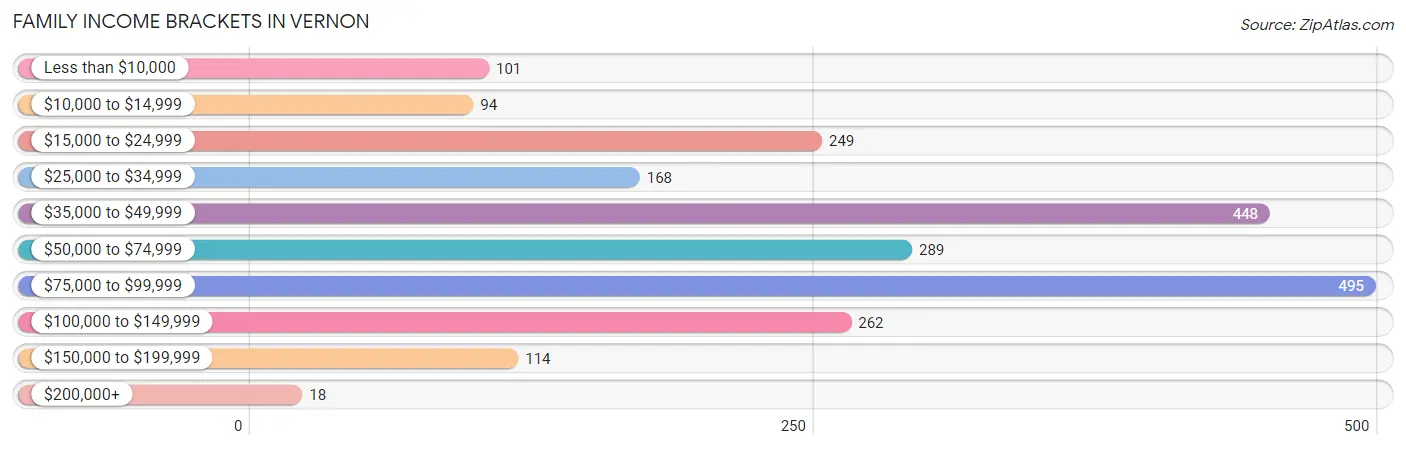
Family Income Brackets in Vernon
According to the Vernon family income data, there are 495 families falling into the $75,000 to $99,999 income range, which is the most common income bracket and makes up 22.1% of all families. Conversely, the $200,000+ income bracket is the least frequent group with only 18 families (0.8%) belonging to this category.
| Income Bracket | # Families | % Families |
| Less than $10,000 | 101 | 4.5% |
| $10,000 to $14,999 | 94 | 4.2% |
| $15,000 to $24,999 | 249 | 11.1% |
| $25,000 to $34,999 | 168 | 7.5% |
| $35,000 to $49,999 | 448 | 20.0% |
| $50,000 to $74,999 | 289 | 12.9% |
| $75,000 to $99,999 | 495 | 22.1% |
| $100,000 to $149,999 | 262 | 11.7% |
| $150,000 to $199,999 | 114 | 5.1% |
| $200,000+ | 18 | 0.8% |
Family Income by Famaliy Size in Vernon
6-person families (85 | 3.8%) account for the highest median family income in Vernon with $88,045 per family, while 2-person families (1,049 | 46.8%) have the highest median income of $27,864 per family member.
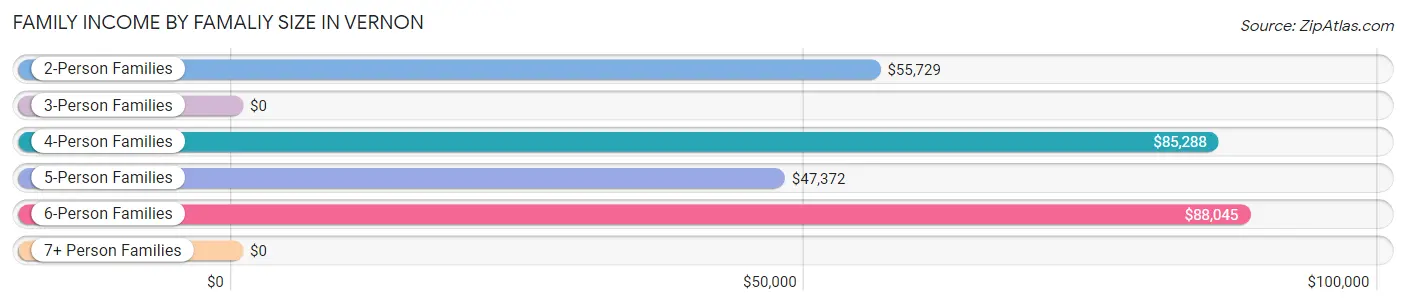
| Income Bracket | # Families | Median Income |
| 2-Person Families | 1,049 (46.8%) | $55,729 |
| 3-Person Families | 586 (26.1%) | $0 |
| 4-Person Families | 263 (11.7%) | $85,288 |
| 5-Person Families | 238 (10.6%) | $47,372 |
| 6-Person Families | 85 (3.8%) | $88,045 |
| 7+ Person Families | 21 (0.9%) | $0 |
| Total | 2,242 (100.0%) | $55,625 |
Family Income by Number of Earners in Vernon
The median family income in Vernon is $55,625, with families comprising 3+ earners (189) having the highest median family income of $88,231, while families with no earners (412) have the lowest median family income of $24,659, accounting for 8.4% and 18.4% of families, respectively.
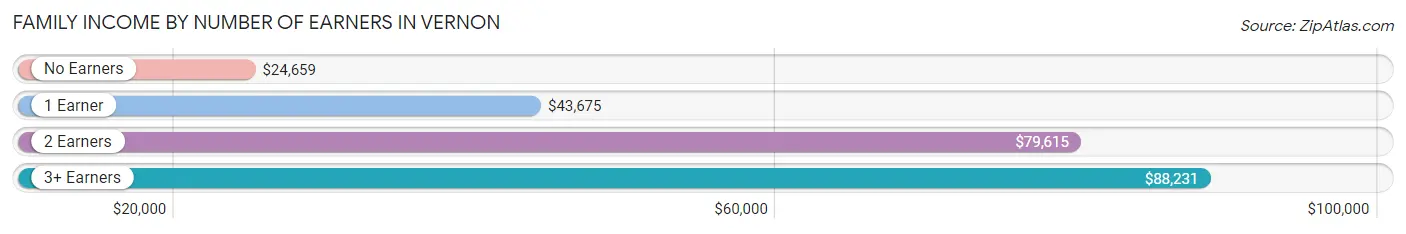
| Number of Earners | # Families | Median Income |
| No Earners | 412 (18.4%) | $24,659 |
| 1 Earner | 783 (34.9%) | $43,675 |
| 2 Earners | 858 (38.3%) | $79,615 |
| 3+ Earners | 189 (8.4%) | $88,231 |
| Total | 2,242 (100.0%) | $55,625 |
Household Income in Vernon
Household Income Brackets in Vernon
With 716 households falling in the category, the $15,000 to $24,999 income range is the most frequent in Vernon, accounting for 19.1% of all households. In contrast, only 67 households (1.8%) fall into the $200,000+ income bracket, making it the least populous group.
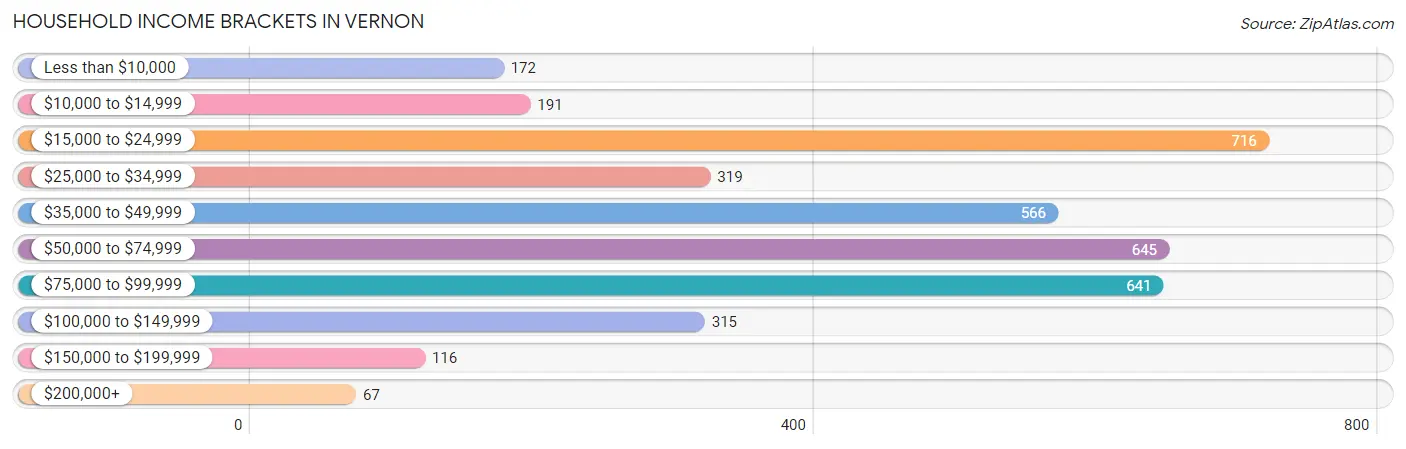
| Income Bracket | # Households | % Households |
| Less than $10,000 | 172 | 4.6% |
| $10,000 to $14,999 | 191 | 5.1% |
| $15,000 to $24,999 | 716 | 19.1% |
| $25,000 to $34,999 | 319 | 8.5% |
| $35,000 to $49,999 | 566 | 15.1% |
| $50,000 to $74,999 | 645 | 17.2% |
| $75,000 to $99,999 | 641 | 17.1% |
| $100,000 to $149,999 | 315 | 8.4% |
| $150,000 to $199,999 | 116 | 3.1% |
| $200,000+ | 67 | 1.8% |
Household Income by Householder Age in Vernon
The median household income in Vernon is $47,528, with the highest median household income of $65,639 found in the 25 to 44 years age bracket for the primary householder. A total of 1,216 households (32.4%) fall into this category. Meanwhile, the 65+ years age bracket for the primary householder has the lowest median household income of $40,813, with 1,127 households (30.1%) in this group.
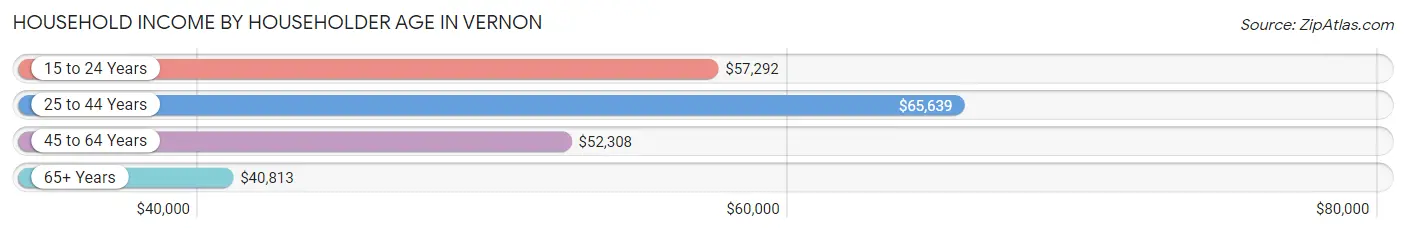
| Income Bracket | # Households | Median Income |
| 15 to 24 Years | 123 (3.3%) | $57,292 |
| 25 to 44 Years | 1,216 (32.4%) | $65,639 |
| 45 to 64 Years | 1,282 (34.2%) | $52,308 |
| 65+ Years | 1,127 (30.1%) | $40,813 |
| Total | 3,748 (100.0%) | $47,528 |
Poverty in Vernon
Income Below Poverty by Sex and Age in Vernon
With 20.8% poverty level for males and 14.3% for females among the residents of Vernon, 16 and 17 year old males and 15 year old females are the most vulnerable to poverty, with 224 males (71.1%) and 34 females (37.4%) in their respective age groups living below the poverty level.
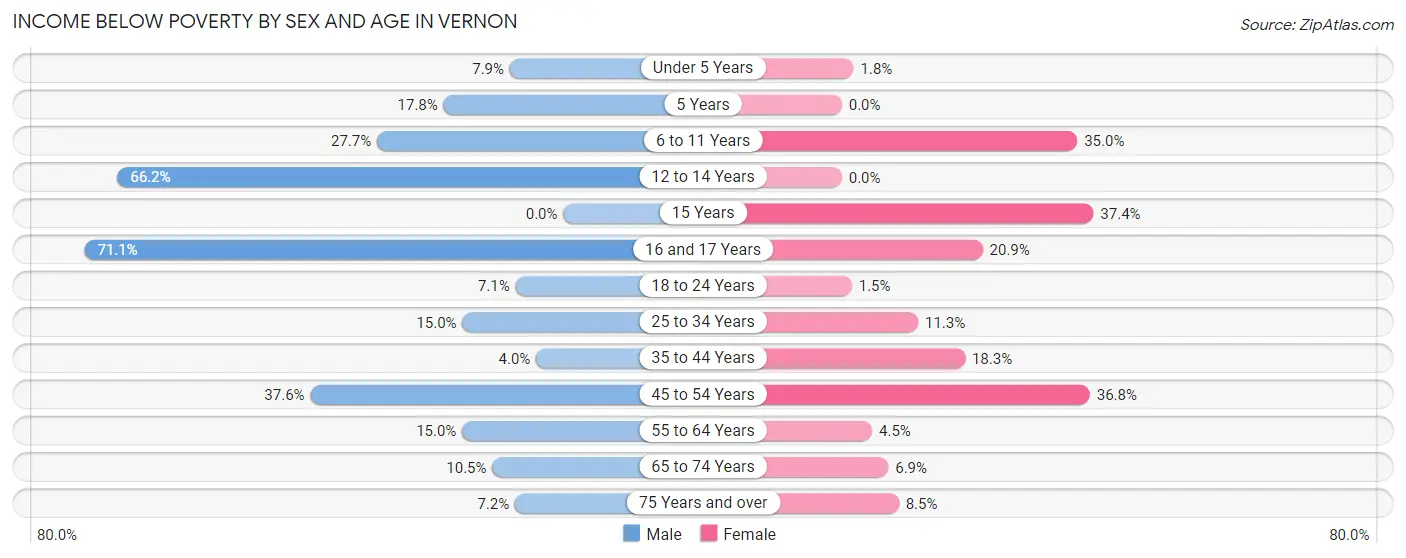
| Age Bracket | Male | Female |
| Under 5 Years | 25 (7.9%) | 6 (1.8%) |
| 5 Years | 16 (17.8%) | 0 (0.0%) |
| 6 to 11 Years | 122 (27.7%) | 172 (35.0%) |
| 12 to 14 Years | 51 (66.2%) | 0 (0.0%) |
| 15 Years | 0 (0.0%) | 34 (37.4%) |
| 16 and 17 Years | 224 (71.1%) | 23 (20.9%) |
| 18 to 24 Years | 22 (7.1%) | 6 (1.5%) |
| 25 to 34 Years | 97 (15.0%) | 80 (11.3%) |
| 35 to 44 Years | 20 (4.0%) | 111 (18.3%) |
| 45 to 54 Years | 240 (37.6%) | 179 (36.8%) |
| 55 to 64 Years | 82 (15.0%) | 33 (4.5%) |
| 65 to 74 Years | 53 (10.5%) | 39 (6.9%) |
| 75 Years and over | 16 (7.2%) | 30 (8.5%) |
| Total | 968 (20.8%) | 713 (14.3%) |
Income Above Poverty by Sex and Age in Vernon
According to the poverty statistics in Vernon, males aged 15 years and females aged 5 years are the age groups that are most secure financially, with 100.0% of males and 100.0% of females in these age groups living above the poverty line.
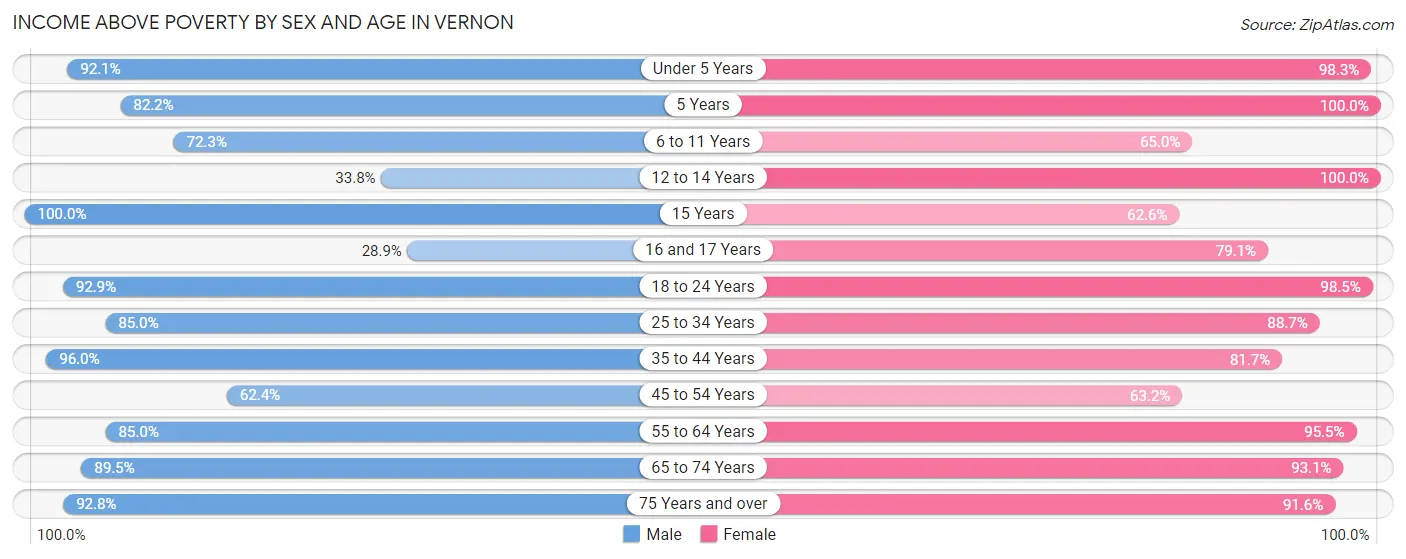
| Age Bracket | Male | Female |
| Under 5 Years | 290 (92.1%) | 336 (98.3%) |
| 5 Years | 74 (82.2%) | 32 (100.0%) |
| 6 to 11 Years | 319 (72.3%) | 320 (65.0%) |
| 12 to 14 Years | 26 (33.8%) | 76 (100.0%) |
| 15 Years | 46 (100.0%) | 57 (62.6%) |
| 16 and 17 Years | 91 (28.9%) | 87 (79.1%) |
| 18 to 24 Years | 288 (92.9%) | 399 (98.5%) |
| 25 to 34 Years | 550 (85.0%) | 627 (88.7%) |
| 35 to 44 Years | 475 (96.0%) | 496 (81.7%) |
| 45 to 54 Years | 399 (62.4%) | 307 (63.2%) |
| 55 to 64 Years | 464 (85.0%) | 700 (95.5%) |
| 65 to 74 Years | 450 (89.5%) | 526 (93.1%) |
| 75 Years and over | 207 (92.8%) | 325 (91.5%) |
| Total | 3,679 (79.2%) | 4,288 (85.7%) |
Income Below Poverty Among Married-Couple Families in Vernon
The poverty statistics for married-couple families in Vernon show that 12.3% or 175 of the total 1,423 families live below the poverty line. Families with 1 or 2 children have the highest poverty rate of 21.9%, comprising of 96 families. On the other hand, families with no children have the lowest poverty rate of 6.0%, which includes 50 families.
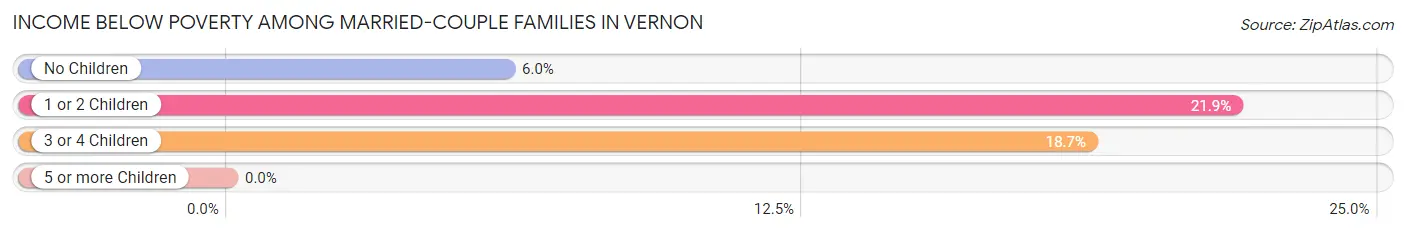
| Children | Above Poverty | Below Poverty |
| No Children | 779 (94.0%) | 50 (6.0%) |
| 1 or 2 Children | 343 (78.1%) | 96 (21.9%) |
| 3 or 4 Children | 126 (81.3%) | 29 (18.7%) |
| 5 or more Children | 0 (0.0%) | 0 (0.0%) |
| Total | 1,248 (87.7%) | 175 (12.3%) |
Income Below Poverty Among Single-Parent Households in Vernon
According to the poverty data in Vernon, 23.6% or 26 single-father households and 24.5% or 174 single-mother households are living below the poverty line. Among single-father households, those with 1 or 2 children have the highest poverty rate, with 26 households (56.5%) experiencing poverty. Likewise, among single-mother households, those with 1 or 2 children have the highest poverty rate, with 113 households (38.3%) falling below the poverty line.
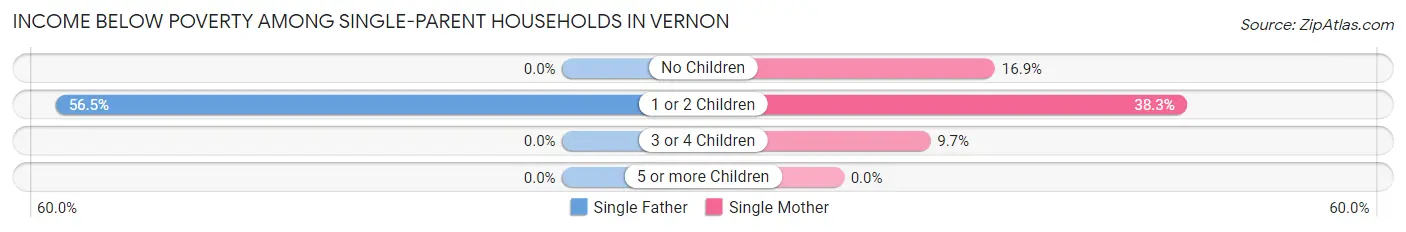
| Children | Single Father | Single Mother |
| No Children | 0 (0.0%) | 49 (16.9%) |
| 1 or 2 Children | 26 (56.5%) | 113 (38.3%) |
| 3 or 4 Children | 0 (0.0%) | 12 (9.7%) |
| 5 or more Children | 0 (0.0%) | 0 (0.0%) |
| Total | 26 (23.6%) | 174 (24.5%) |
Income Below Poverty Among Married-Couple vs Single-Parent Households in Vernon
The poverty data for Vernon shows that 175 of the married-couple family households (12.3%) and 200 of the single-parent households (24.4%) are living below the poverty level. Within the married-couple family households, those with 1 or 2 children have the highest poverty rate, with 96 households (21.9%) falling below the poverty line. Among the single-parent households, those with 1 or 2 children have the highest poverty rate, with 139 household (40.8%) living below poverty.
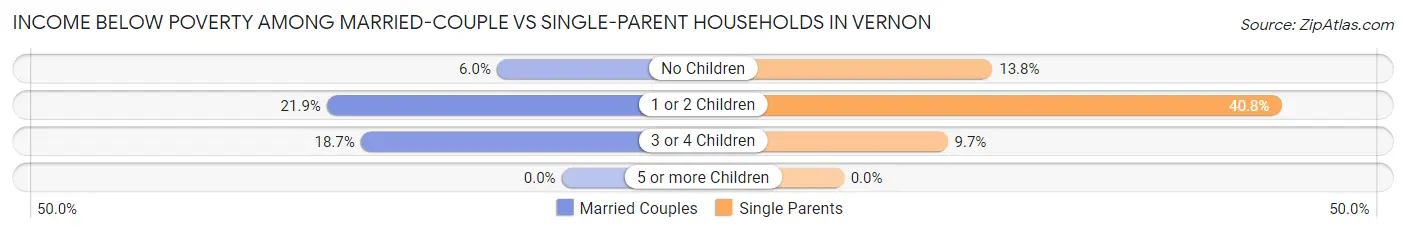
| Children | Married-Couple Families | Single-Parent Households |
| No Children | 50 (6.0%) | 49 (13.8%) |
| 1 or 2 Children | 96 (21.9%) | 139 (40.8%) |
| 3 or 4 Children | 29 (18.7%) | 12 (9.7%) |
| 5 or more Children | 0 (0.0%) | 0 (0.0%) |
| Total | 175 (12.3%) | 200 (24.4%) |
Employment Characteristics in Vernon
Employment by Class of Employer in Vernon
Among the 4,253 employed individuals in Vernon, private company employees (2,884 | 67.8%), state government employees (678 | 15.9%), and local government employees (329 | 7.7%) make up the most common classes of employment.
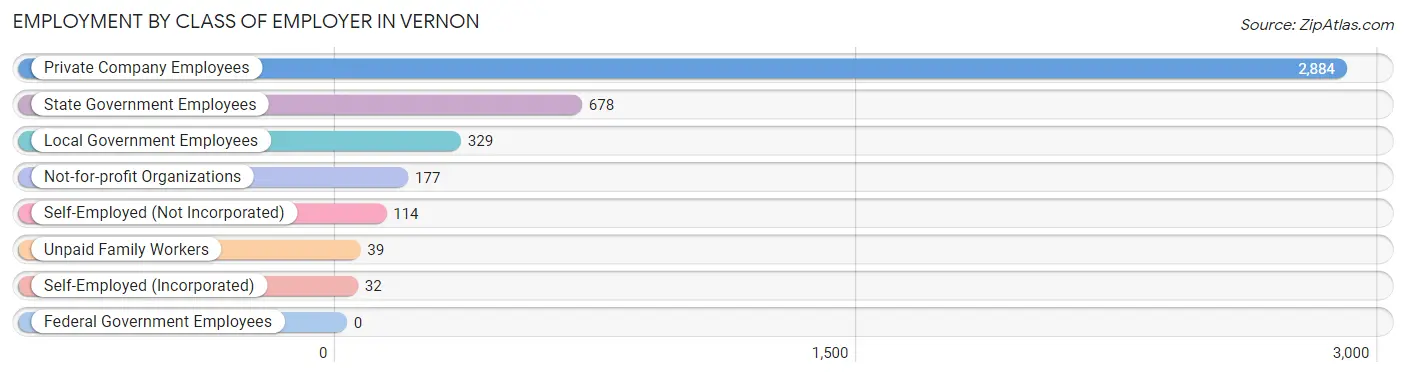
| Employer Class | # Employees | % Employees |
| Private Company Employees | 2,884 | 67.8% |
| Self-Employed (Incorporated) | 32 | 0.7% |
| Self-Employed (Not Incorporated) | 114 | 2.7% |
| Not-for-profit Organizations | 177 | 4.2% |
| Local Government Employees | 329 | 7.7% |
| State Government Employees | 678 | 15.9% |
| Federal Government Employees | 0 | 0.0% |
| Unpaid Family Workers | 39 | 0.9% |
| Total | 4,253 | 100.0% |
Employment Status by Age in Vernon
According to the labor force statistics for Vernon, out of the total population over 16 years of age (7,993), 60.2% or 4,812 individuals are in the labor force, with 11.3% or 544 of them unemployed. The age group with the highest labor force participation rate is 20 to 24 years, with 86.1% or 447 individuals in the labor force. Within the labor force, the 16 to 19 years age range has the highest percentage of unemployed individuals, with 47.2% or 180 of them being unemployed.
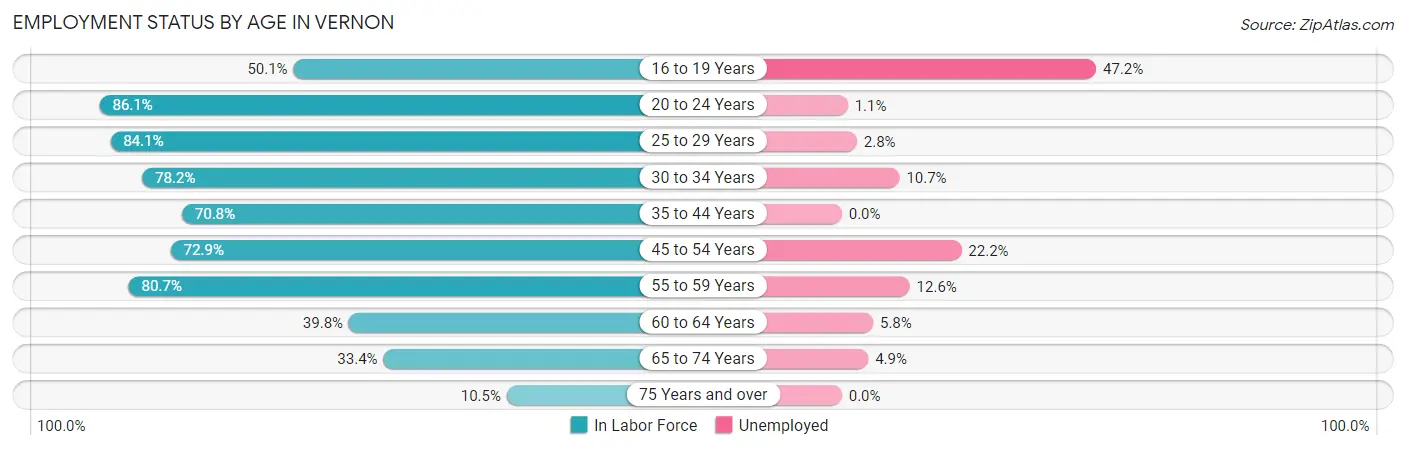
| Age Bracket | In Labor Force | Unemployed |
| 16 to 19 Years | 381 (50.1%) | 180 (47.2%) |
| 20 to 24 Years | 447 (86.1%) | 5 (1.1%) |
| 25 to 29 Years | 615 (84.1%) | 17 (2.8%) |
| 30 to 34 Years | 514 (78.2%) | 55 (10.7%) |
| 35 to 44 Years | 789 (70.8%) | 0 (0.0%) |
| 45 to 54 Years | 838 (72.9%) | 186 (22.2%) |
| 55 to 59 Years | 532 (80.7%) | 67 (12.6%) |
| 60 to 64 Years | 258 (39.8%) | 15 (5.8%) |
| 65 to 74 Years | 369 (33.4%) | 18 (4.9%) |
| 75 Years and over | 68 (10.5%) | 0 (0.0%) |
| Total | 4,812 (60.2%) | 544 (11.3%) |
Employment Status by Educational Attainment in Vernon
According to labor force statistics for Vernon, 71.5% of individuals (3,546) out of the total population between 25 and 64 years of age (4,960) are in the labor force, with 9.6% or 340 of them being unemployed. The group with the highest labor force participation rate are those with the educational attainment of bachelor's degree or higher, with 85.3% or 538 individuals in the labor force. Within the labor force, individuals with high school diploma education have the highest percentage of unemployment, with 17.0% or 249 of them being unemployed.
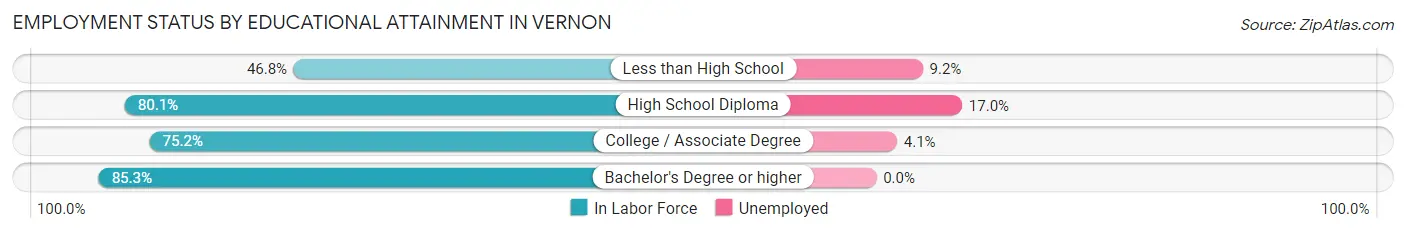
| Educational Attainment | In Labor Force | Unemployed |
| Less than High School | 555 (46.8%) | 109 (9.2%) |
| High School Diploma | 1,462 (80.1%) | 310 (17.0%) |
| College / Associate Degree | 991 (75.2%) | 54 (4.1%) |
| Bachelor's Degree or higher | 538 (85.3%) | 0 (0.0%) |
| Total | 3,546 (71.5%) | 476 (9.6%) |
Employment Occupations by Sex in Vernon
Management, Business, Science and Arts Occupations
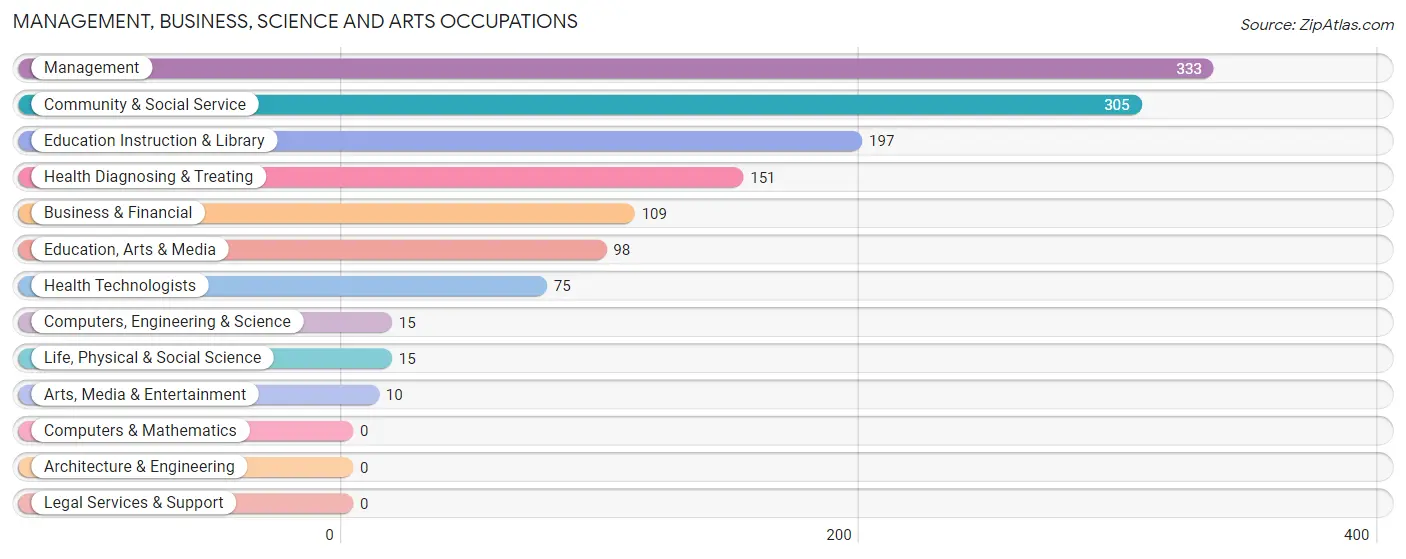
The most common Management, Business, Science and Arts occupations in Vernon are Management (333 | 7.8%), Community & Social Service (305 | 7.1%), Education Instruction & Library (197 | 4.6%), Health Diagnosing & Treating (151 | 3.5%), and Business & Financial (109 | 2.5%).
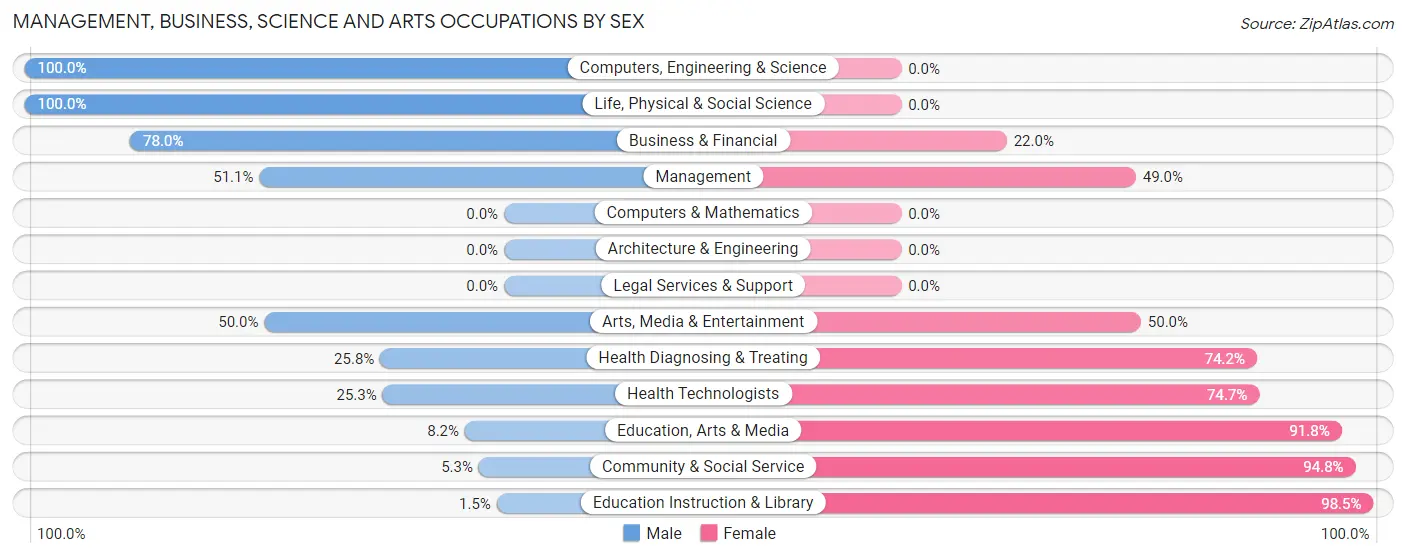
Management, Business, Science and Arts Occupations by Sex
Within the Management, Business, Science and Arts occupations in Vernon, the most male-oriented occupations are Computers, Engineering & Science (100.0%), Life, Physical & Social Science (100.0%), and Business & Financial (78.0%), while the most female-oriented occupations are Education Instruction & Library (98.5%), Community & Social Service (94.8%), and Education, Arts & Media (91.8%).
| Occupation | Male | Female |
| Management | 170 (51.0%) | 163 (48.9%) |
| Business & Financial | 85 (78.0%) | 24 (22.0%) |
| Computers, Engineering & Science | 15 (100.0%) | 0 (0.0%) |
| Computers & Mathematics | 0 (0.0%) | 0 (0.0%) |
| Architecture & Engineering | 0 (0.0%) | 0 (0.0%) |
| Life, Physical & Social Science | 15 (100.0%) | 0 (0.0%) |
| Community & Social Service | 16 (5.2%) | 289 (94.8%) |
| Education, Arts & Media | 8 (8.2%) | 90 (91.8%) |
| Legal Services & Support | 0 (0.0%) | 0 (0.0%) |
| Education Instruction & Library | 3 (1.5%) | 194 (98.5%) |
| Arts, Media & Entertainment | 5 (50.0%) | 5 (50.0%) |
| Health Diagnosing & Treating | 39 (25.8%) | 112 (74.2%) |
| Health Technologists | 19 (25.3%) | 56 (74.7%) |
| Total (Category) | 325 (35.6%) | 588 (64.4%) |
| Total (Overall) | 2,189 (51.3%) | 2,079 (48.7%) |
Services Occupations
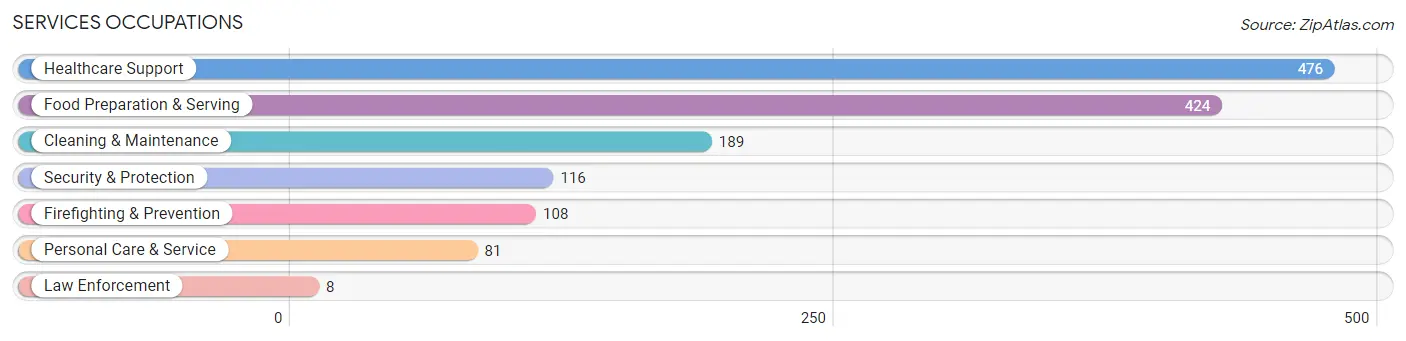
The most common Services occupations in Vernon are Healthcare Support (476 | 11.2%), Food Preparation & Serving (424 | 9.9%), Cleaning & Maintenance (189 | 4.4%), Security & Protection (116 | 2.7%), and Firefighting & Prevention (108 | 2.5%).
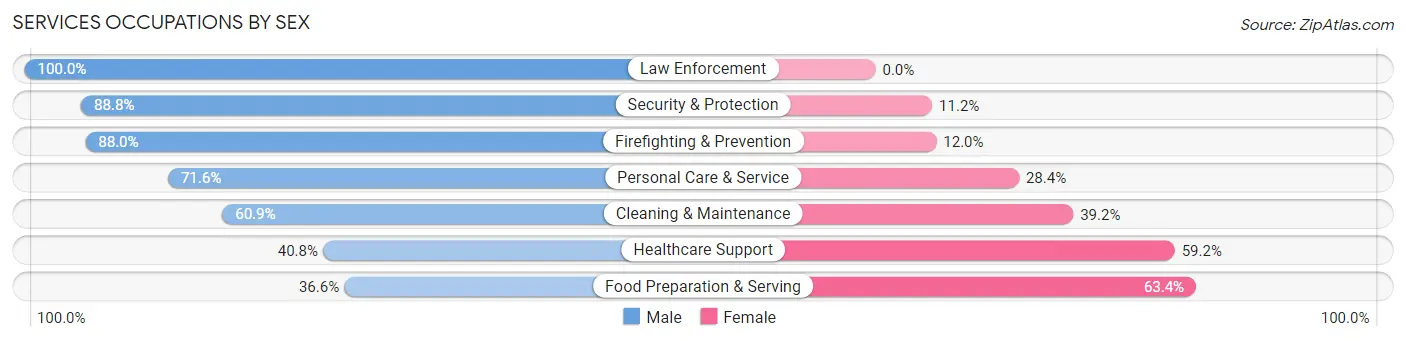
Services Occupations by Sex
Within the Services occupations in Vernon, the most male-oriented occupations are Law Enforcement (100.0%), Security & Protection (88.8%), and Firefighting & Prevention (88.0%), while the most female-oriented occupations are Food Preparation & Serving (63.4%), Healthcare Support (59.2%), and Cleaning & Maintenance (39.2%).
| Occupation | Male | Female |
| Healthcare Support | 194 (40.8%) | 282 (59.2%) |
| Security & Protection | 103 (88.8%) | 13 (11.2%) |
| Firefighting & Prevention | 95 (88.0%) | 13 (12.0%) |
| Law Enforcement | 8 (100.0%) | 0 (0.0%) |
| Food Preparation & Serving | 155 (36.6%) | 269 (63.4%) |
| Cleaning & Maintenance | 115 (60.9%) | 74 (39.2%) |
| Personal Care & Service | 58 (71.6%) | 23 (28.4%) |
| Total (Category) | 625 (48.6%) | 661 (51.4%) |
| Total (Overall) | 2,189 (51.3%) | 2,079 (48.7%) |
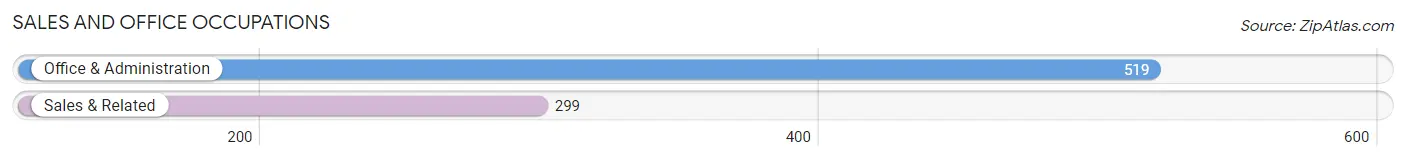
Sales and Office Occupations
The most common Sales and Office occupations in Vernon are Office & Administration (519 | 12.2%), and Sales & Related (299 | 7.0%).
Sales and Office Occupations by Sex
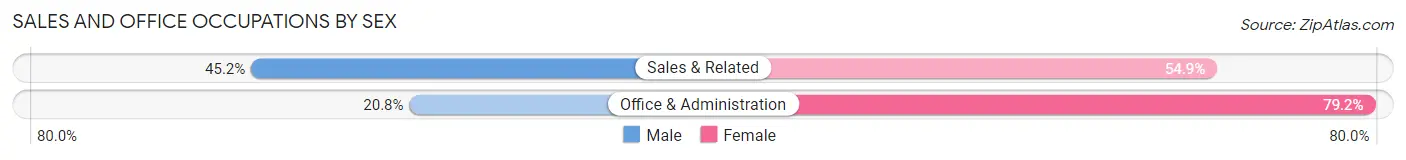
| Occupation | Male | Female |
| Sales & Related | 135 (45.2%) | 164 (54.8%) |
| Office & Administration | 108 (20.8%) | 411 (79.2%) |
| Total (Category) | 243 (29.7%) | 575 (70.3%) |
| Total (Overall) | 2,189 (51.3%) | 2,079 (48.7%) |
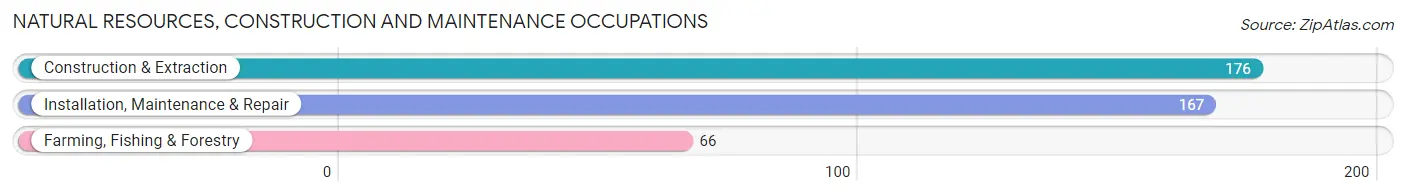
Natural Resources, Construction and Maintenance Occupations
The most common Natural Resources, Construction and Maintenance occupations in Vernon are Construction & Extraction (176 | 4.1%), Installation, Maintenance & Repair (167 | 3.9%), and Farming, Fishing & Forestry (66 | 1.5%).
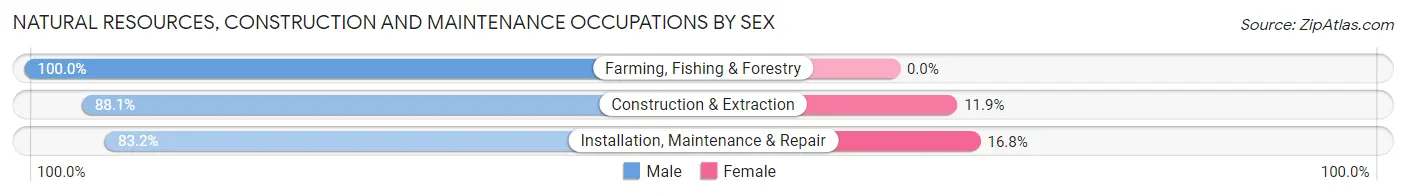
Natural Resources, Construction and Maintenance Occupations by Sex
| Occupation | Male | Female |
| Farming, Fishing & Forestry | 66 (100.0%) | 0 (0.0%) |
| Construction & Extraction | 155 (88.1%) | 21 (11.9%) |
| Installation, Maintenance & Repair | 139 (83.2%) | 28 (16.8%) |
| Total (Category) | 360 (88.0%) | 49 (12.0%) |
| Total (Overall) | 2,189 (51.3%) | 2,079 (48.7%) |
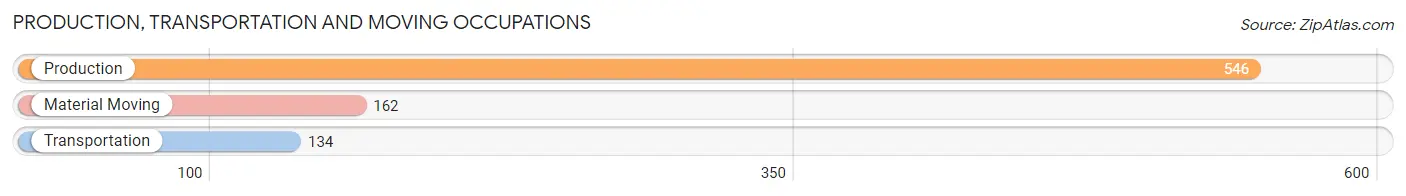
Production, Transportation and Moving Occupations
The most common Production, Transportation and Moving occupations in Vernon are Production (546 | 12.8%), Material Moving (162 | 3.8%), and Transportation (134 | 3.1%).
Production, Transportation and Moving Occupations by Sex
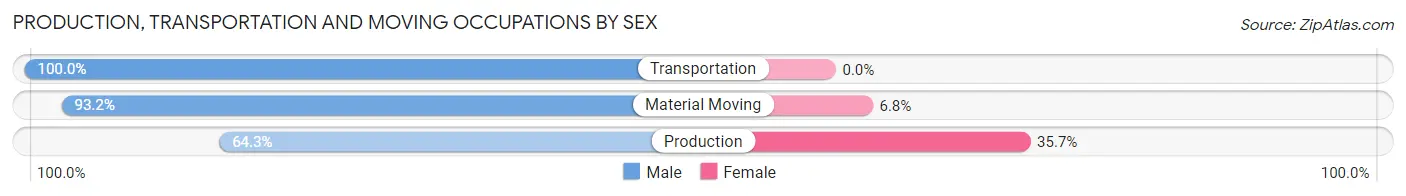
| Occupation | Male | Female |
| Production | 351 (64.3%) | 195 (35.7%) |
| Transportation | 134 (100.0%) | 0 (0.0%) |
| Material Moving | 151 (93.2%) | 11 (6.8%) |
| Total (Category) | 636 (75.5%) | 206 (24.5%) |
| Total (Overall) | 2,189 (51.3%) | 2,079 (48.7%) |
Employment Industries by Sex in Vernon
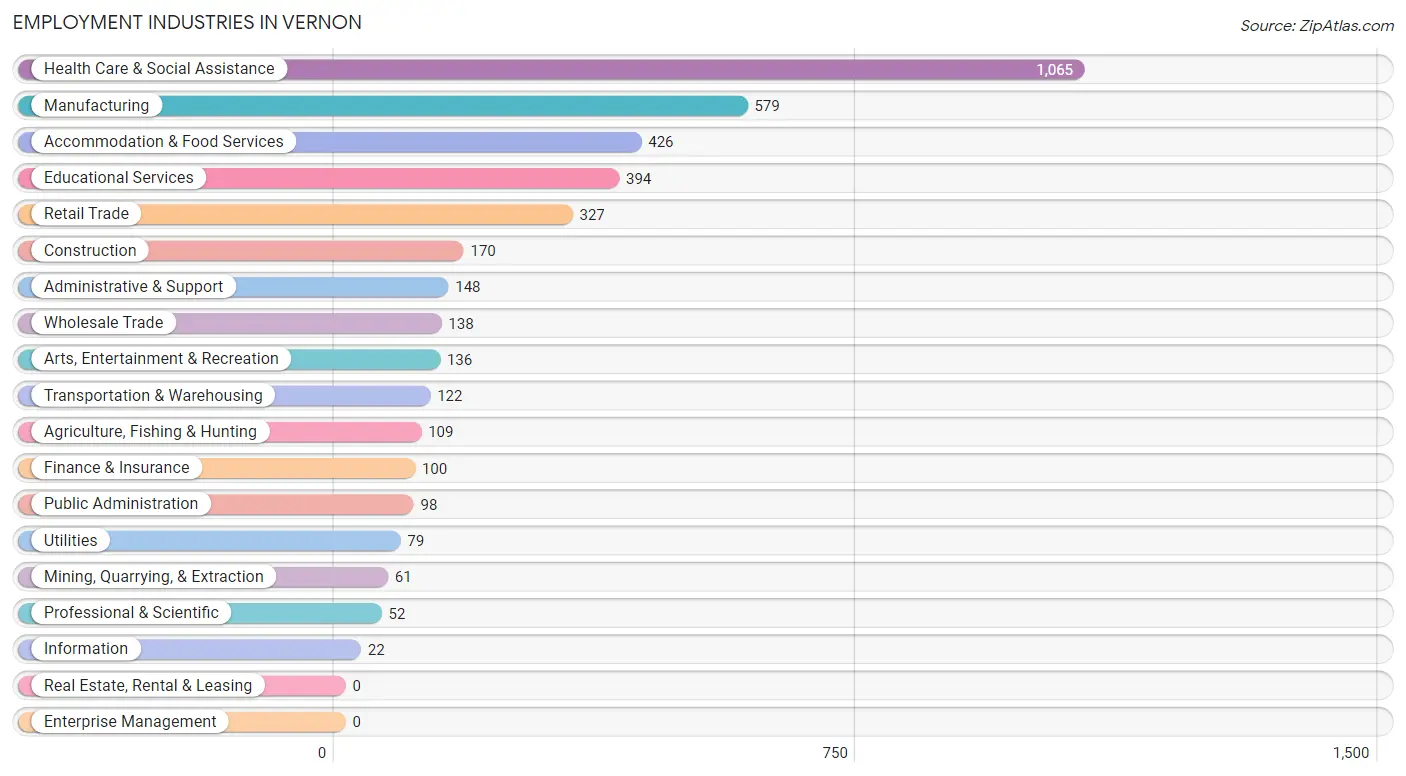
Employment Industries in Vernon
The major employment industries in Vernon include Health Care & Social Assistance (1,065 | 24.9%), Manufacturing (579 | 13.6%), Accommodation & Food Services (426 | 10.0%), Educational Services (394 | 9.2%), and Retail Trade (327 | 7.7%).
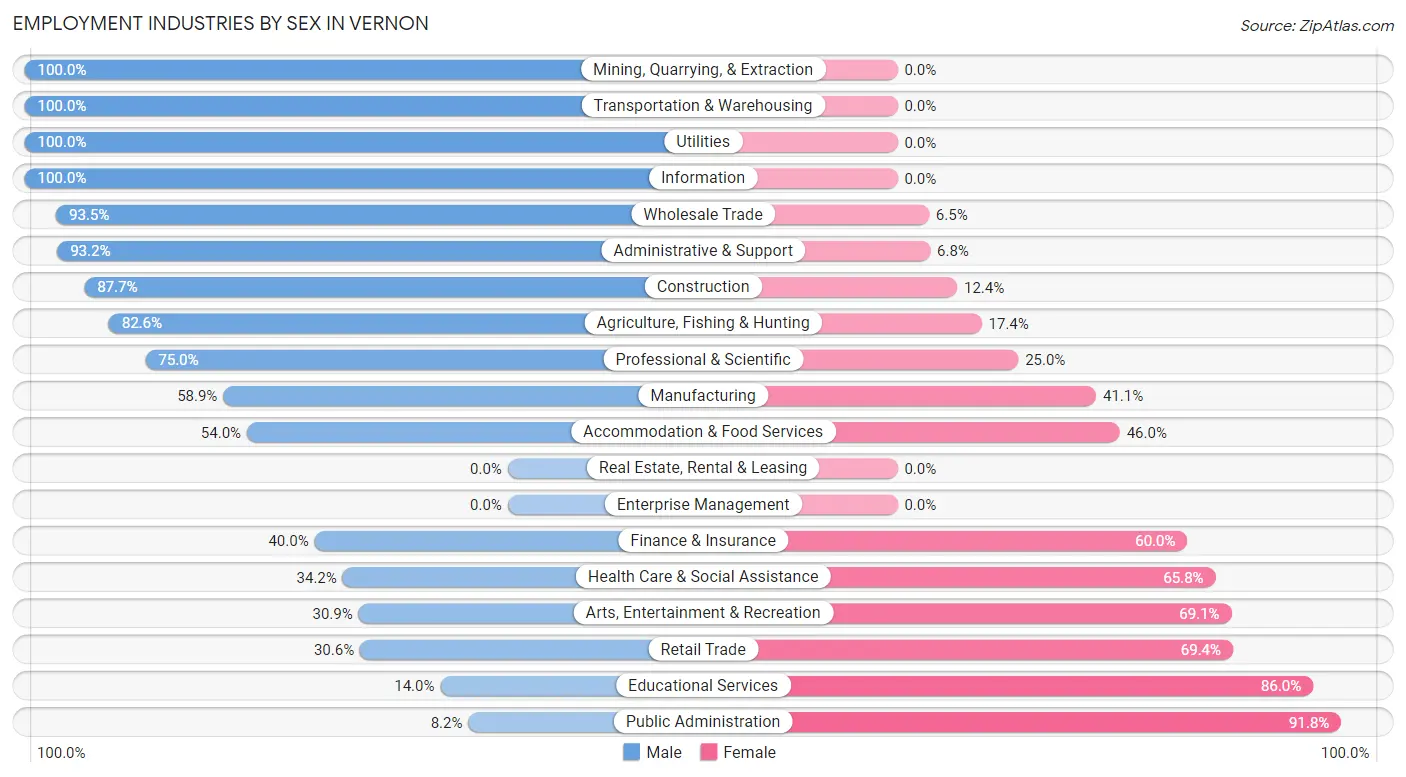
Employment Industries by Sex in Vernon
The Vernon industries that see more men than women are Mining, Quarrying, & Extraction (100.0%), Transportation & Warehousing (100.0%), and Utilities (100.0%), whereas the industries that tend to have a higher number of women are Public Administration (91.8%), Educational Services (86.0%), and Retail Trade (69.4%).
| Industry | Male | Female |
| Agriculture, Fishing & Hunting | 90 (82.6%) | 19 (17.4%) |
| Mining, Quarrying, & Extraction | 61 (100.0%) | 0 (0.0%) |
| Construction | 149 (87.6%) | 21 (12.3%) |
| Manufacturing | 341 (58.9%) | 238 (41.1%) |
| Wholesale Trade | 129 (93.5%) | 9 (6.5%) |
| Retail Trade | 100 (30.6%) | 227 (69.4%) |
| Transportation & Warehousing | 122 (100.0%) | 0 (0.0%) |
| Utilities | 79 (100.0%) | 0 (0.0%) |
| Information | 22 (100.0%) | 0 (0.0%) |
| Finance & Insurance | 40 (40.0%) | 60 (60.0%) |
| Real Estate, Rental & Leasing | 0 (0.0%) | 0 (0.0%) |
| Professional & Scientific | 39 (75.0%) | 13 (25.0%) |
| Enterprise Management | 0 (0.0%) | 0 (0.0%) |
| Administrative & Support | 138 (93.2%) | 10 (6.8%) |
| Educational Services | 55 (14.0%) | 339 (86.0%) |
| Health Care & Social Assistance | 364 (34.2%) | 701 (65.8%) |
| Arts, Entertainment & Recreation | 42 (30.9%) | 94 (69.1%) |
| Accommodation & Food Services | 230 (54.0%) | 196 (46.0%) |
| Public Administration | 8 (8.2%) | 90 (91.8%) |
| Total | 2,189 (51.3%) | 2,079 (48.7%) |
Education in Vernon
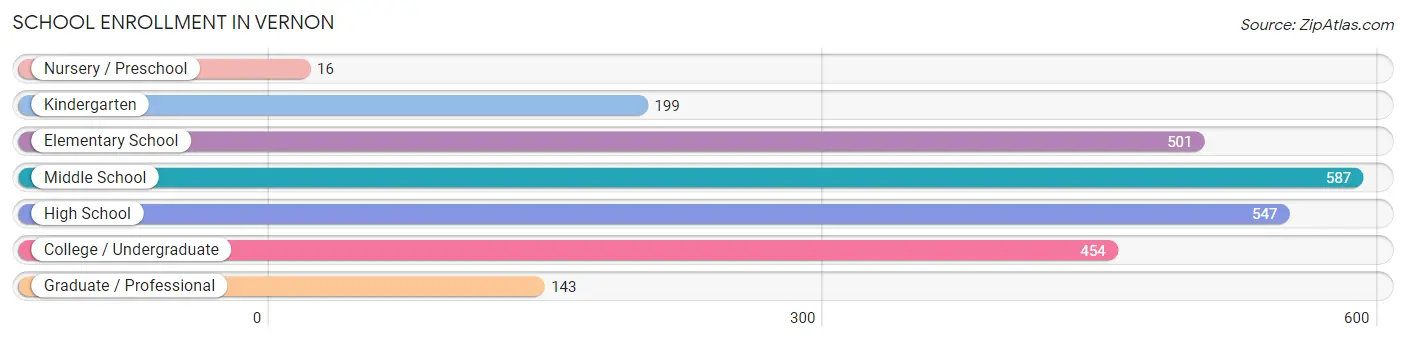
School Enrollment in Vernon
The most common levels of schooling among the 2,447 students in Vernon are middle school (587 | 24.0%), high school (547 | 22.4%), and elementary school (501 | 20.5%).
| School Level | # Students | % Students |
| Nursery / Preschool | 16 | 0.6% |
| Kindergarten | 199 | 8.1% |
| Elementary School | 501 | 20.5% |
| Middle School | 587 | 24.0% |
| High School | 547 | 22.4% |
| College / Undergraduate | 454 | 18.5% |
| Graduate / Professional | 143 | 5.8% |
| Total | 2,447 | 100.0% |
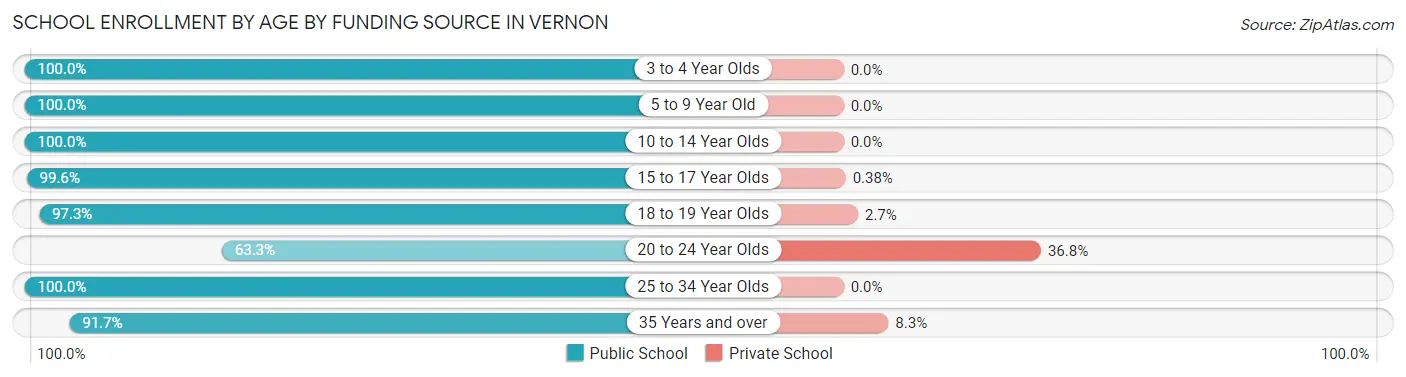
School Enrollment by Age by Funding Source in Vernon
Out of a total of 2,447 students who are enrolled in schools in Vernon, 54 (2.2%) attend a private institution, while the remaining 2,393 (97.8%) are enrolled in public schools. The age group of 20 to 24 year olds has the highest likelihood of being enrolled in private schools, with 43 (36.7% in the age bracket) enrolled. Conversely, the age group of 3 to 4 year olds has the lowest likelihood of being enrolled in a private school, with 87 (100.0% in the age bracket) attending a public institution.
| Age Bracket | Public School | Private School |
| 3 to 4 Year Olds | 87 (100.0%) | 0 (0.0%) |
| 5 to 9 Year Old | 600 (100.0%) | 0 (0.0%) |
| 10 to 14 Year Olds | 596 (100.0%) | 0 (0.0%) |
| 15 to 17 Year Olds | 519 (99.6%) | 2 (0.4%) |
| 18 to 19 Year Olds | 109 (97.3%) | 3 (2.7%) |
| 20 to 24 Year Olds | 74 (63.2%) | 43 (36.7%) |
| 25 to 34 Year Olds | 354 (100.0%) | 0 (0.0%) |
| 35 Years and over | 55 (91.7%) | 5 (8.3%) |
| Total | 2,393 (97.8%) | 54 (2.2%) |
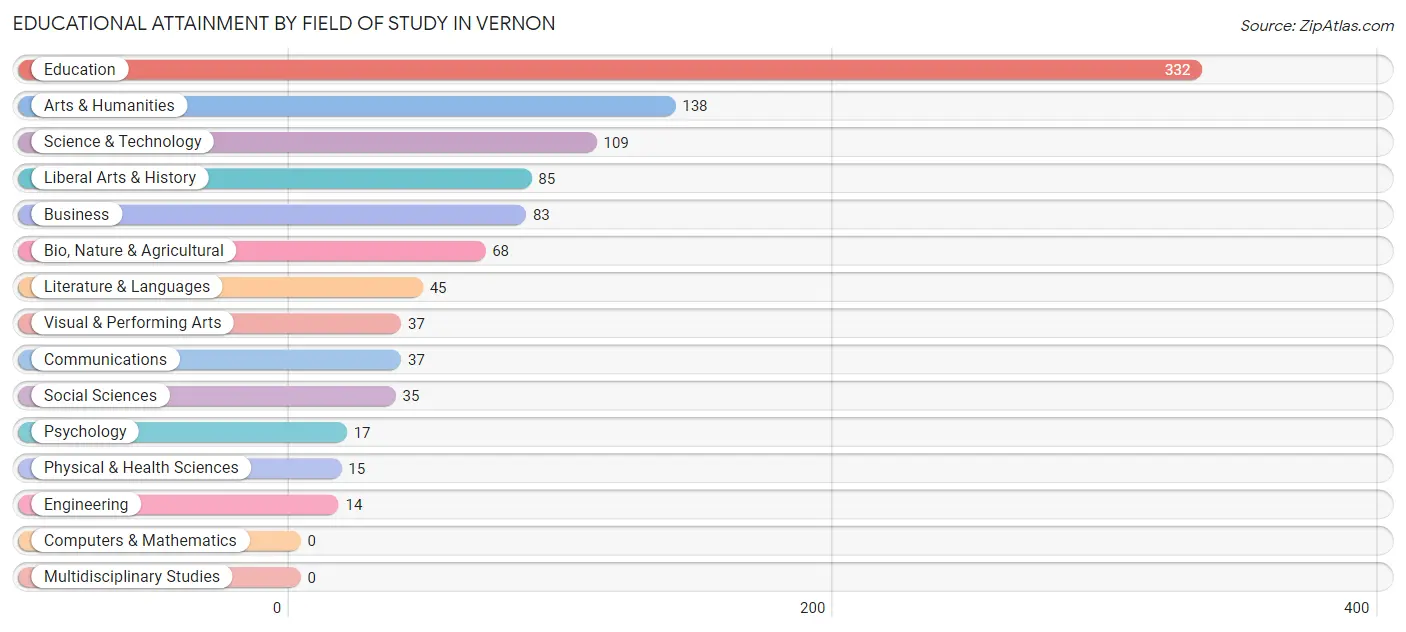
Educational Attainment by Field of Study in Vernon
Education (332 | 32.7%), arts & humanities (138 | 13.6%), science & technology (109 | 10.7%), liberal arts & history (85 | 8.4%), and business (83 | 8.2%) are the most common fields of study among 1,015 individuals in Vernon who have obtained a bachelor's degree or higher.
| Field of Study | # Graduates | % Graduates |
| Computers & Mathematics | 0 | 0.0% |
| Bio, Nature & Agricultural | 68 | 6.7% |
| Physical & Health Sciences | 15 | 1.5% |
| Psychology | 17 | 1.7% |
| Social Sciences | 35 | 3.5% |
| Engineering | 14 | 1.4% |
| Multidisciplinary Studies | 0 | 0.0% |
| Science & Technology | 109 | 10.7% |
| Business | 83 | 8.2% |
| Education | 332 | 32.7% |
| Literature & Languages | 45 | 4.4% |
| Liberal Arts & History | 85 | 8.4% |
| Visual & Performing Arts | 37 | 3.6% |
| Communications | 37 | 3.6% |
| Arts & Humanities | 138 | 13.6% |
| Total | 1,015 | 100.0% |
Transportation & Commute in Vernon
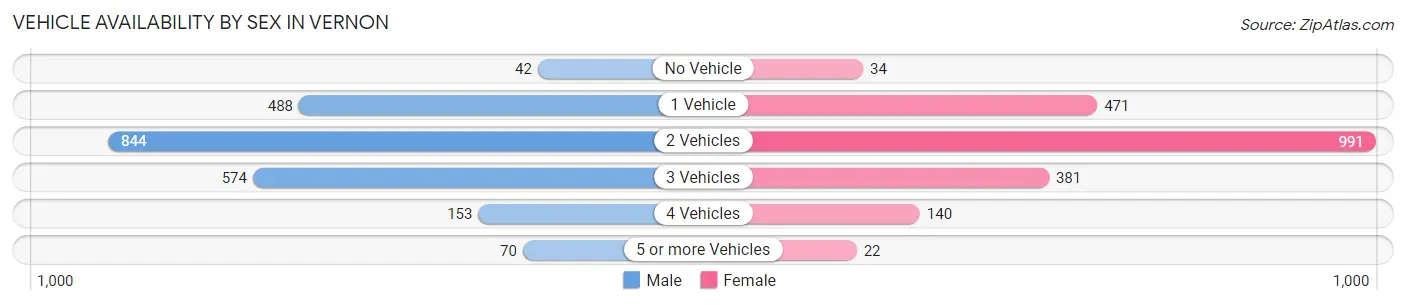
Vehicle Availability by Sex in Vernon
The most prevalent vehicle ownership categories in Vernon are males with 2 vehicles (844, accounting for 38.9%) and females with 2 vehicles (991, making up 41.4%).
| Vehicles Available | Male | Female |
| No Vehicle | 42 (1.9%) | 34 (1.7%) |
| 1 Vehicle | 488 (22.5%) | 471 (23.1%) |
| 2 Vehicles | 844 (38.9%) | 991 (48.6%) |
| 3 Vehicles | 574 (26.4%) | 381 (18.7%) |
| 4 Vehicles | 153 (7.0%) | 140 (6.9%) |
| 5 or more Vehicles | 70 (3.2%) | 22 (1.1%) |
| Total | 2,171 (100.0%) | 2,039 (100.0%) |
Commute Time in Vernon
The most frequently occuring commute durations in Vernon are 5 to 9 minutes (1,763 commuters, 41.9%), 10 to 14 minutes (891 commuters, 21.2%), and 20 to 24 minutes (385 commuters, 9.1%).
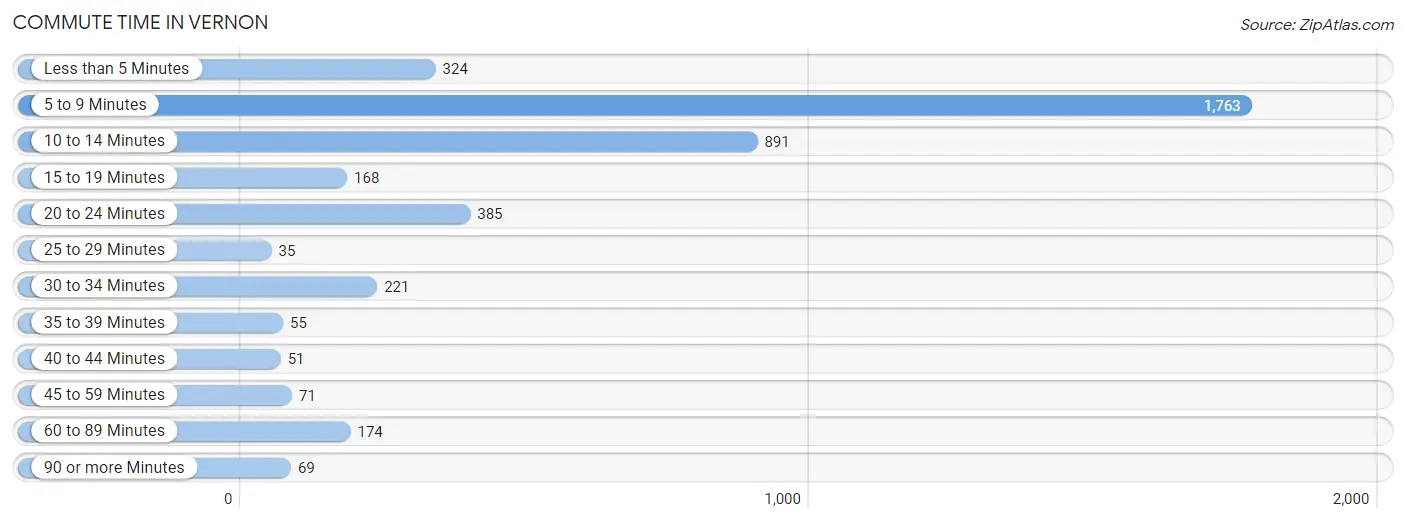
| Commute Time | # Commuters | % Commuters |
| Less than 5 Minutes | 324 | 7.7% |
| 5 to 9 Minutes | 1,763 | 41.9% |
| 10 to 14 Minutes | 891 | 21.2% |
| 15 to 19 Minutes | 168 | 4.0% |
| 20 to 24 Minutes | 385 | 9.1% |
| 25 to 29 Minutes | 35 | 0.8% |
| 30 to 34 Minutes | 221 | 5.2% |
| 35 to 39 Minutes | 55 | 1.3% |
| 40 to 44 Minutes | 51 | 1.2% |
| 45 to 59 Minutes | 71 | 1.7% |
| 60 to 89 Minutes | 174 | 4.1% |
| 90 or more Minutes | 69 | 1.6% |
Commute Time by Sex in Vernon
The most common commute times in Vernon are 5 to 9 minutes (700 commuters, 32.3%) for males and 5 to 9 minutes (1,063 commuters, 52.1%) for females.
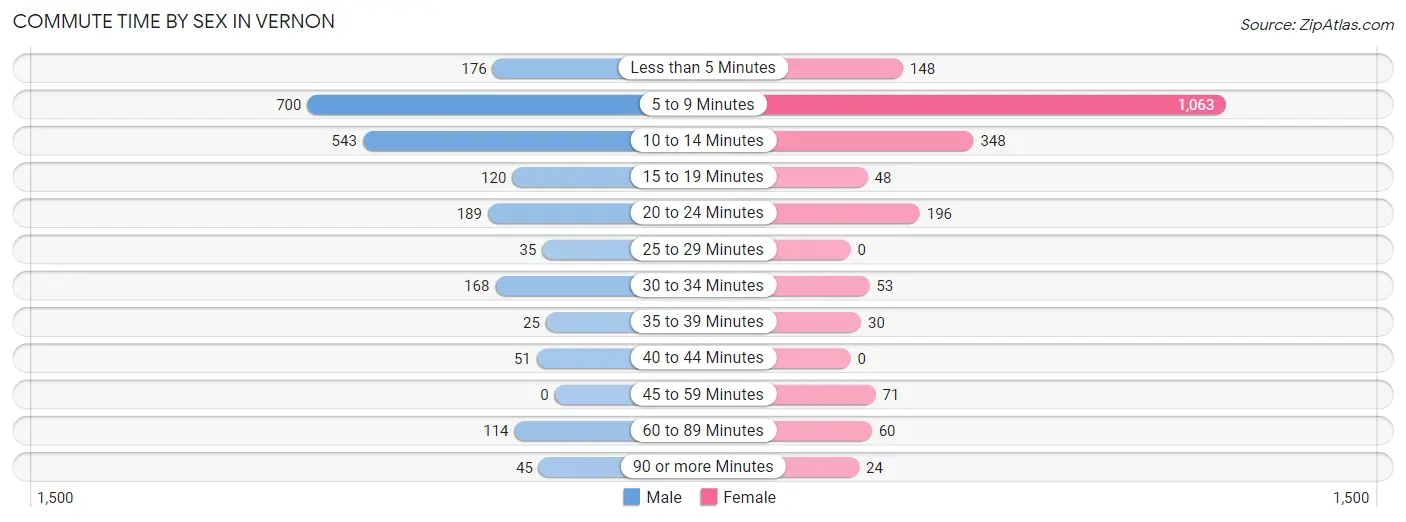
| Commute Time | Male | Female |
| Less than 5 Minutes | 176 (8.1%) | 148 (7.2%) |
| 5 to 9 Minutes | 700 (32.3%) | 1,063 (52.1%) |
| 10 to 14 Minutes | 543 (25.1%) | 348 (17.1%) |
| 15 to 19 Minutes | 120 (5.5%) | 48 (2.4%) |
| 20 to 24 Minutes | 189 (8.7%) | 196 (9.6%) |
| 25 to 29 Minutes | 35 (1.6%) | 0 (0.0%) |
| 30 to 34 Minutes | 168 (7.8%) | 53 (2.6%) |
| 35 to 39 Minutes | 25 (1.1%) | 30 (1.5%) |
| 40 to 44 Minutes | 51 (2.4%) | 0 (0.0%) |
| 45 to 59 Minutes | 0 (0.0%) | 71 (3.5%) |
| 60 to 89 Minutes | 114 (5.3%) | 60 (2.9%) |
| 90 or more Minutes | 45 (2.1%) | 24 (1.2%) |
Time of Departure to Work by Sex in Vernon
The most frequent times of departure to work in Vernon are 6:00 AM to 6:29 AM (366, 16.9%) for males and 7:30 AM to 7:59 AM (397, 19.5%) for females.
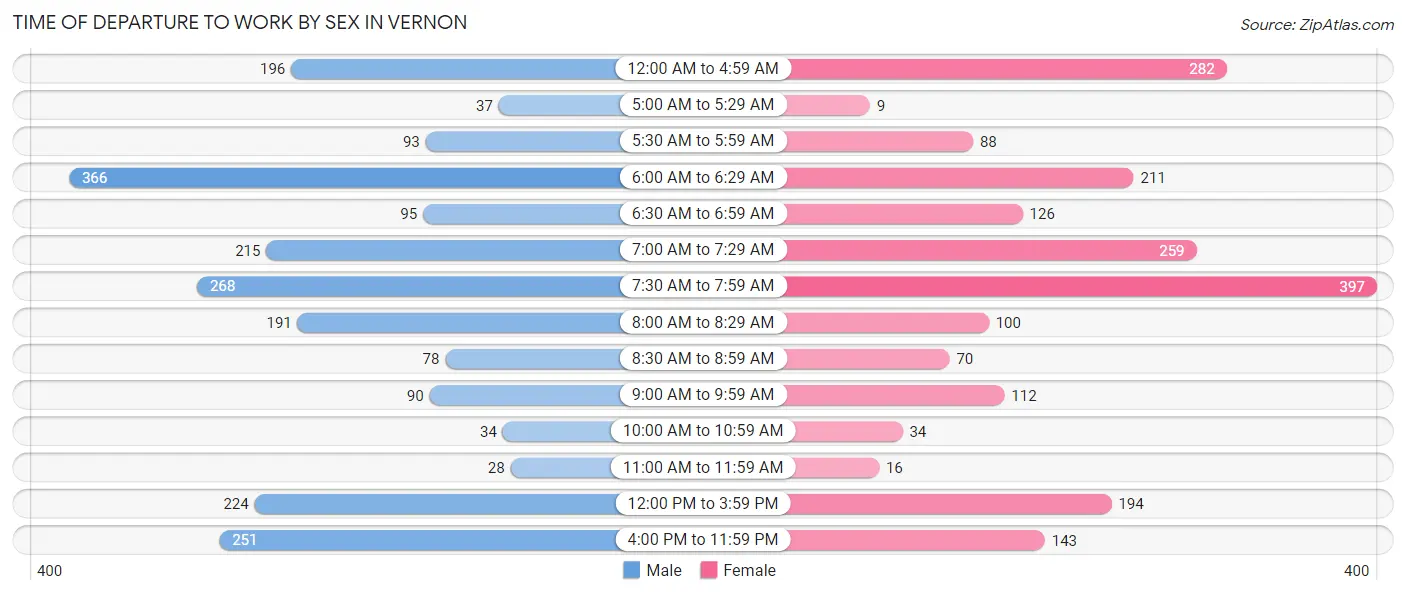
| Time of Departure | Male | Female |
| 12:00 AM to 4:59 AM | 196 (9.0%) | 282 (13.8%) |
| 5:00 AM to 5:29 AM | 37 (1.7%) | 9 (0.4%) |
| 5:30 AM to 5:59 AM | 93 (4.3%) | 88 (4.3%) |
| 6:00 AM to 6:29 AM | 366 (16.9%) | 211 (10.3%) |
| 6:30 AM to 6:59 AM | 95 (4.4%) | 126 (6.2%) |
| 7:00 AM to 7:29 AM | 215 (9.9%) | 259 (12.7%) |
| 7:30 AM to 7:59 AM | 268 (12.4%) | 397 (19.5%) |
| 8:00 AM to 8:29 AM | 191 (8.8%) | 100 (4.9%) |
| 8:30 AM to 8:59 AM | 78 (3.6%) | 70 (3.4%) |
| 9:00 AM to 9:59 AM | 90 (4.2%) | 112 (5.5%) |
| 10:00 AM to 10:59 AM | 34 (1.6%) | 34 (1.7%) |
| 11:00 AM to 11:59 AM | 28 (1.3%) | 16 (0.8%) |
| 12:00 PM to 3:59 PM | 224 (10.3%) | 194 (9.5%) |
| 4:00 PM to 11:59 PM | 251 (11.6%) | 143 (7.0%) |
| Total | 2,166 (100.0%) | 2,041 (100.0%) |
Housing Occupancy in Vernon
Occupancy by Ownership in Vernon
Of the total 3,748 dwellings in Vernon, owner-occupied units account for 2,111 (56.3%), while renter-occupied units make up 1,637 (43.7%).
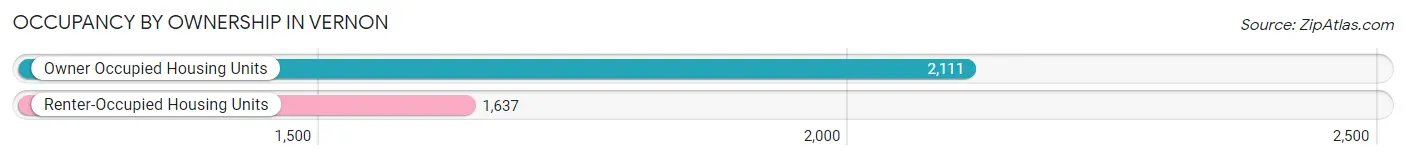
| Occupancy | # Housing Units | % Housing Units |
| Owner Occupied Housing Units | 2,111 | 56.3% |
| Renter-Occupied Housing Units | 1,637 | 43.7% |
| Total Occupied Housing Units | 3,748 | 100.0% |
Occupancy by Household Size in Vernon
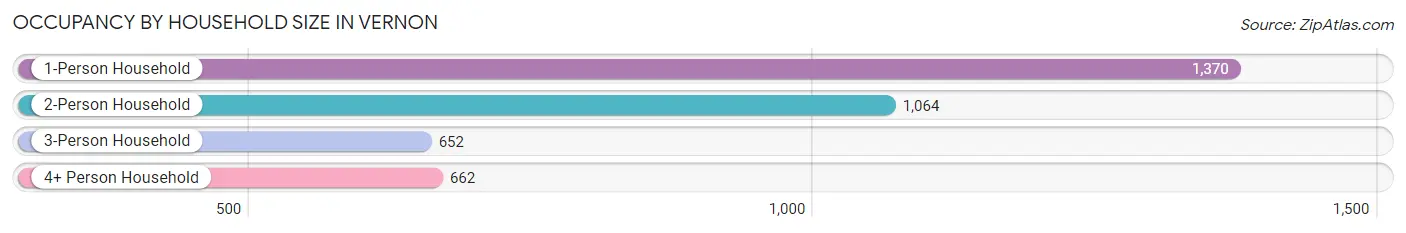
| Household Size | # Housing Units | % Housing Units |
| 1-Person Household | 1,370 | 36.5% |
| 2-Person Household | 1,064 | 28.4% |
| 3-Person Household | 652 | 17.4% |
| 4+ Person Household | 662 | 17.7% |
| Total Housing Units | 3,748 | 100.0% |
Occupancy by Ownership by Household Size in Vernon
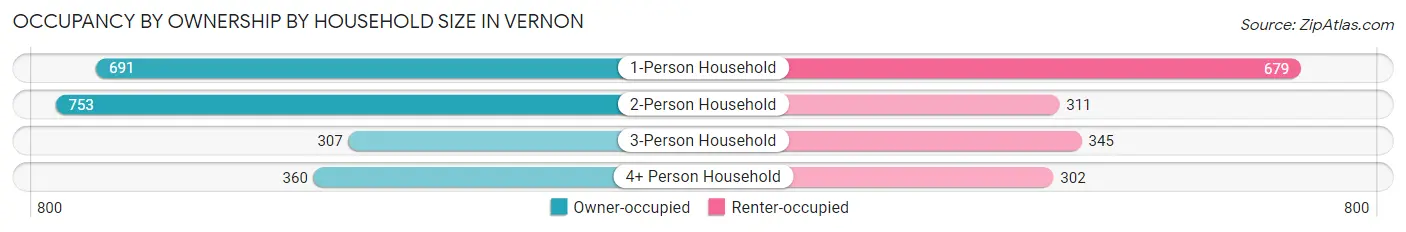
| Household Size | Owner-occupied | Renter-occupied |
| 1-Person Household | 691 (50.4%) | 679 (49.6%) |
| 2-Person Household | 753 (70.8%) | 311 (29.2%) |
| 3-Person Household | 307 (47.1%) | 345 (52.9%) |
| 4+ Person Household | 360 (54.4%) | 302 (45.6%) |
| Total Housing Units | 2,111 (56.3%) | 1,637 (43.7%) |
Occupancy by Educational Attainment in Vernon
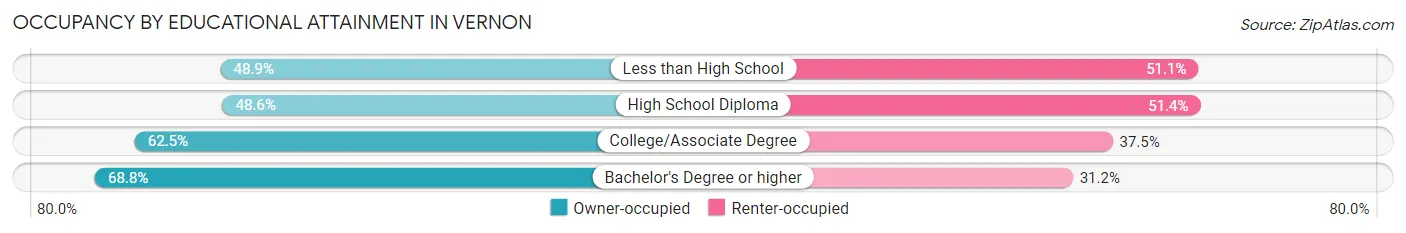
| Household Size | Owner-occupied | Renter-occupied |
| Less than High School | 362 (48.9%) | 378 (51.1%) |
| High School Diploma | 592 (48.6%) | 626 (51.4%) |
| College/Associate Degree | 742 (62.5%) | 445 (37.5%) |
| Bachelor's Degree or higher | 415 (68.8%) | 188 (31.2%) |
Occupancy by Age of Householder in Vernon
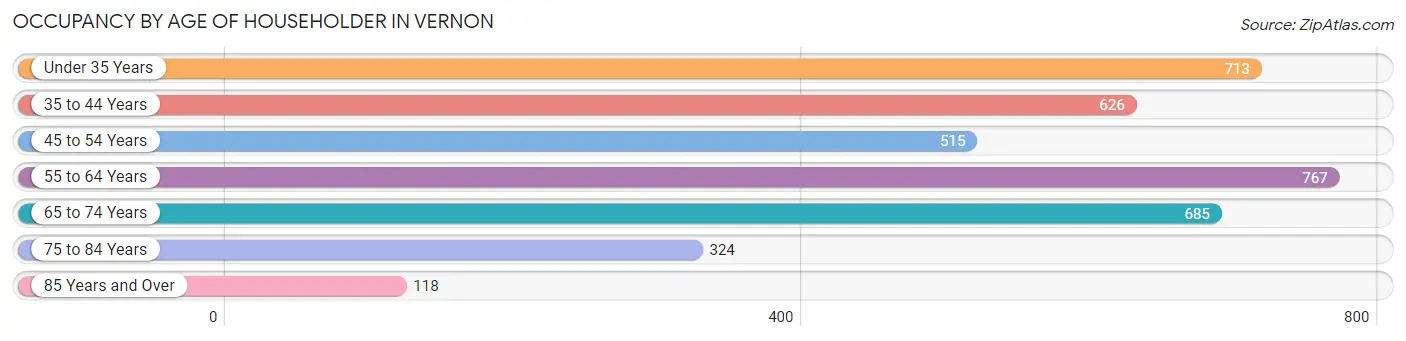
| Age Bracket | # Households | % Households |
| Under 35 Years | 713 | 19.0% |
| 35 to 44 Years | 626 | 16.7% |
| 45 to 54 Years | 515 | 13.7% |
| 55 to 64 Years | 767 | 20.5% |
| 65 to 74 Years | 685 | 18.3% |
| 75 to 84 Years | 324 | 8.6% |
| 85 Years and Over | 118 | 3.2% |
| Total | 3,748 | 100.0% |
Housing Finances in Vernon
Median Income by Occupancy in Vernon
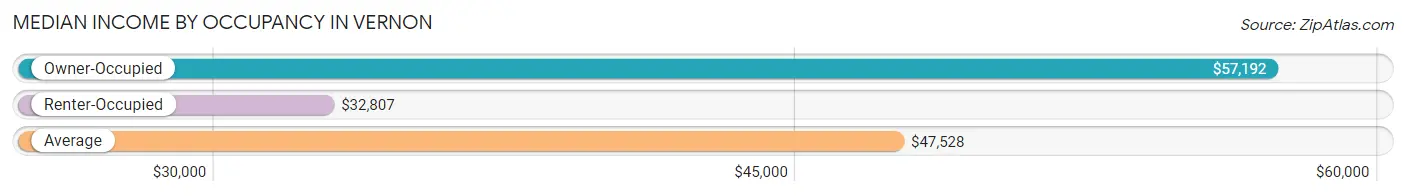
| Occupancy Type | # Households | Median Income |
| Owner-Occupied | 2,111 (56.3%) | $57,192 |
| Renter-Occupied | 1,637 (43.7%) | $32,807 |
| Average | 3,748 (100.0%) | $47,528 |
Occupancy by Householder Income Bracket in Vernon
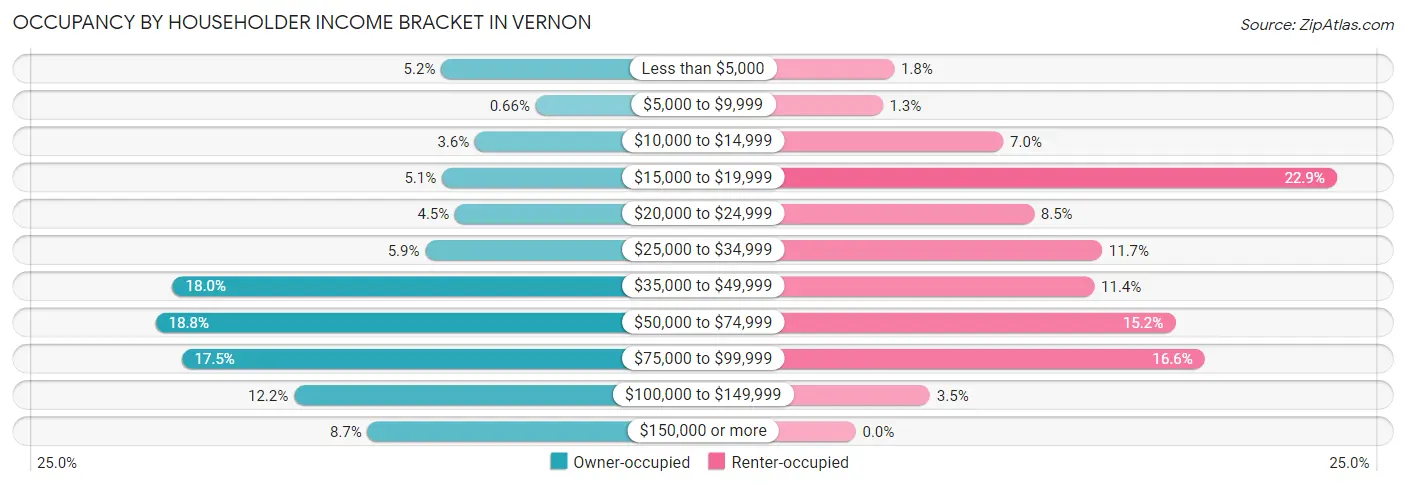
| Income Bracket | Owner-occupied | Renter-occupied |
| Less than $5,000 | 109 (5.2%) | 30 (1.8%) |
| $5,000 to $9,999 | 14 (0.7%) | 21 (1.3%) |
| $10,000 to $14,999 | 75 (3.5%) | 115 (7.0%) |
| $15,000 to $19,999 | 108 (5.1%) | 375 (22.9%) |
| $20,000 to $24,999 | 95 (4.5%) | 139 (8.5%) |
| $25,000 to $34,999 | 125 (5.9%) | 192 (11.7%) |
| $35,000 to $49,999 | 379 (17.9%) | 186 (11.4%) |
| $50,000 to $74,999 | 396 (18.8%) | 249 (15.2%) |
| $75,000 to $99,999 | 370 (17.5%) | 272 (16.6%) |
| $100,000 to $149,999 | 257 (12.2%) | 58 (3.5%) |
| $150,000 or more | 183 (8.7%) | 0 (0.0%) |
| Total | 2,111 (100.0%) | 1,637 (100.0%) |
Monthly Housing Cost Tiers in Vernon
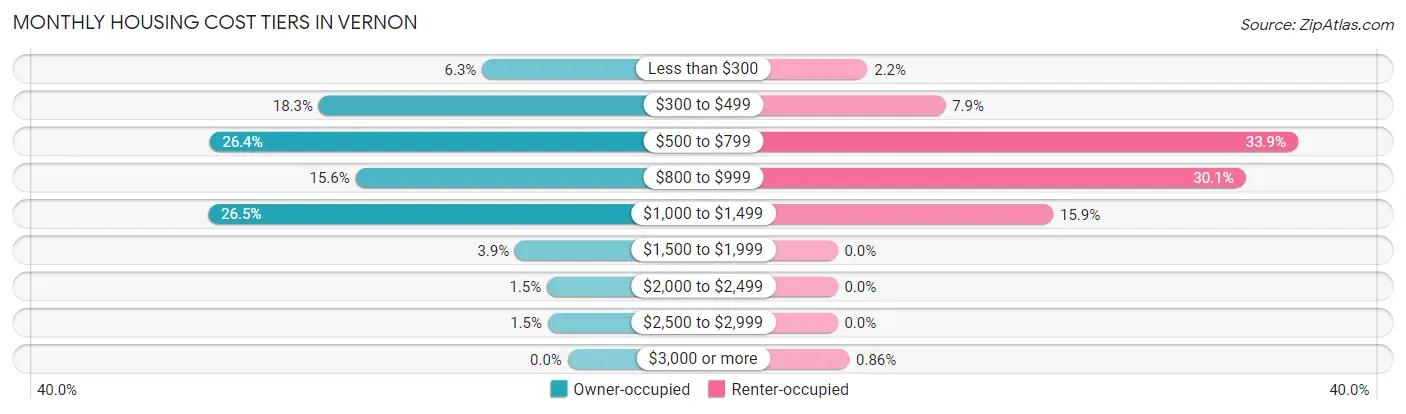
| Monthly Cost | Owner-occupied | Renter-occupied |
| Less than $300 | 133 (6.3%) | 36 (2.2%) |
| $300 to $499 | 387 (18.3%) | 130 (7.9%) |
| $500 to $799 | 557 (26.4%) | 555 (33.9%) |
| $800 to $999 | 330 (15.6%) | 492 (30.0%) |
| $1,000 to $1,499 | 559 (26.5%) | 260 (15.9%) |
| $1,500 to $1,999 | 82 (3.9%) | 0 (0.0%) |
| $2,000 to $2,499 | 32 (1.5%) | 0 (0.0%) |
| $2,500 to $2,999 | 31 (1.5%) | 0 (0.0%) |
| $3,000 or more | 0 (0.0%) | 14 (0.9%) |
| Total | 2,111 (100.0%) | 1,637 (100.0%) |
Physical Housing Characteristics in Vernon
Housing Structures in Vernon
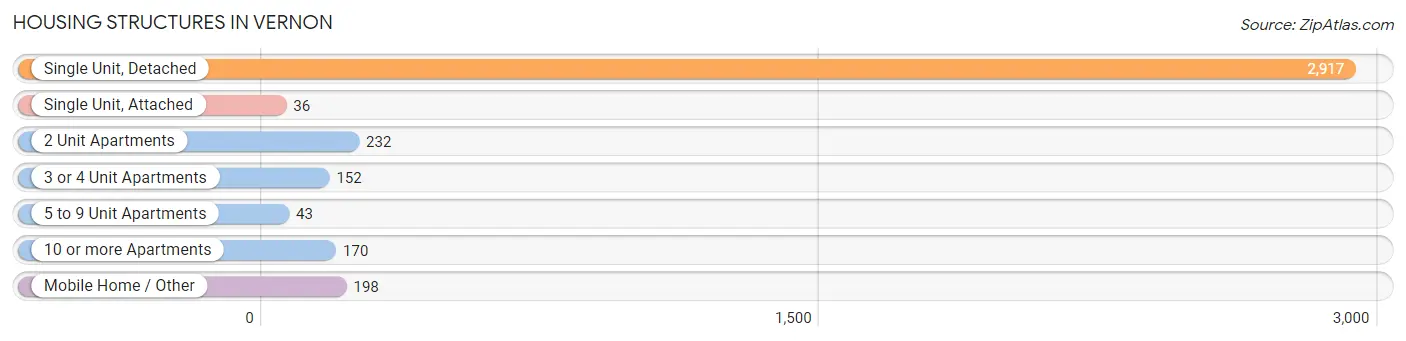
| Structure Type | # Housing Units | % Housing Units |
| Single Unit, Detached | 2,917 | 77.8% |
| Single Unit, Attached | 36 | 1.0% |
| 2 Unit Apartments | 232 | 6.2% |
| 3 or 4 Unit Apartments | 152 | 4.1% |
| 5 to 9 Unit Apartments | 43 | 1.1% |
| 10 or more Apartments | 170 | 4.5% |
| Mobile Home / Other | 198 | 5.3% |
| Total | 3,748 | 100.0% |
Housing Structures by Occupancy in Vernon
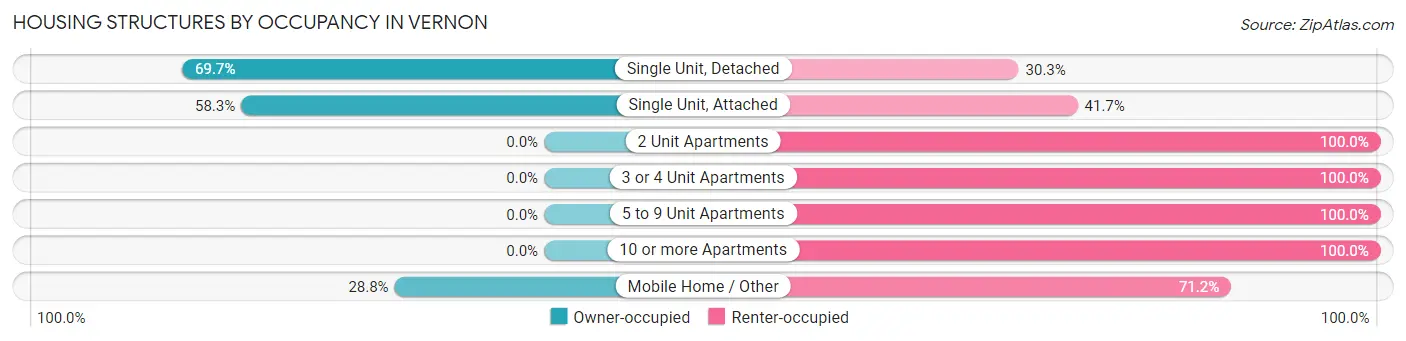
| Structure Type | Owner-occupied | Renter-occupied |
| Single Unit, Detached | 2,033 (69.7%) | 884 (30.3%) |
| Single Unit, Attached | 21 (58.3%) | 15 (41.7%) |
| 2 Unit Apartments | 0 (0.0%) | 232 (100.0%) |
| 3 or 4 Unit Apartments | 0 (0.0%) | 152 (100.0%) |
| 5 to 9 Unit Apartments | 0 (0.0%) | 43 (100.0%) |
| 10 or more Apartments | 0 (0.0%) | 170 (100.0%) |
| Mobile Home / Other | 57 (28.8%) | 141 (71.2%) |
| Total | 2,111 (56.3%) | 1,637 (43.7%) |
Housing Structures by Number of Rooms in Vernon
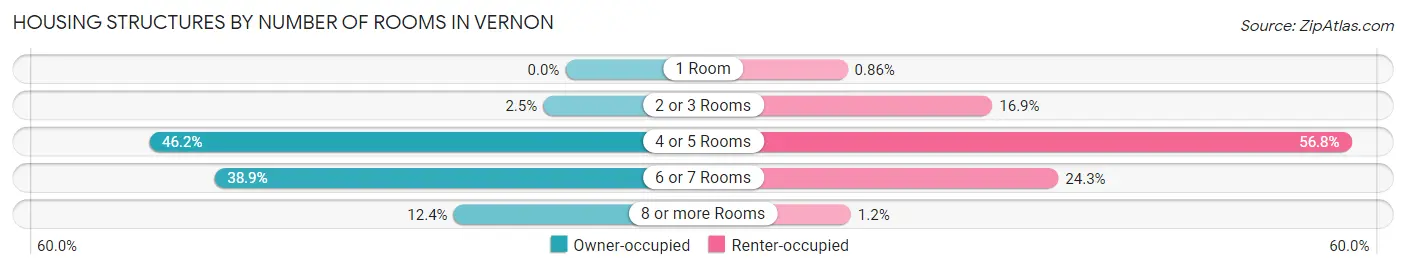
| Number of Rooms | Owner-occupied | Renter-occupied |
| 1 Room | 0 (0.0%) | 14 (0.9%) |
| 2 or 3 Rooms | 52 (2.5%) | 277 (16.9%) |
| 4 or 5 Rooms | 975 (46.2%) | 929 (56.8%) |
| 6 or 7 Rooms | 822 (38.9%) | 397 (24.2%) |
| 8 or more Rooms | 262 (12.4%) | 20 (1.2%) |
| Total | 2,111 (100.0%) | 1,637 (100.0%) |
Housing Structure by Heating Type in Vernon
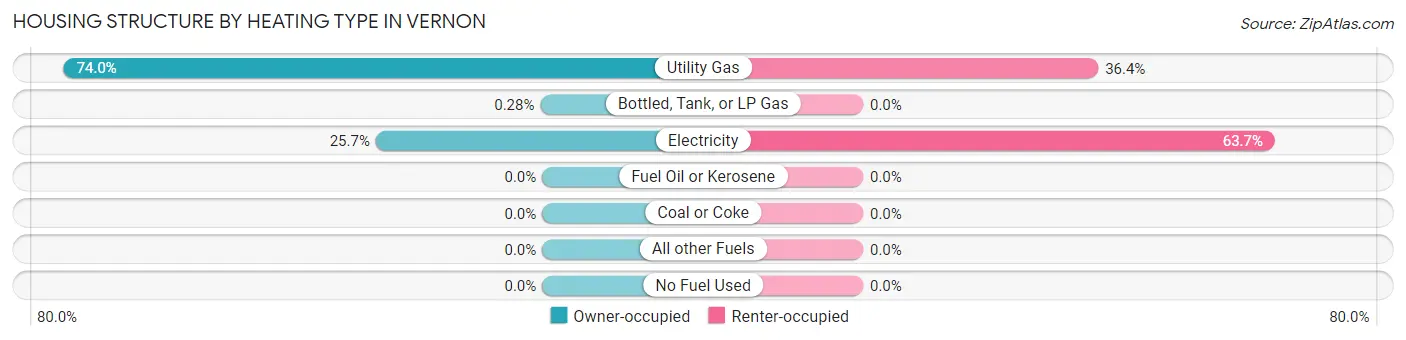
| Heating Type | Owner-occupied | Renter-occupied |
| Utility Gas | 1,562 (74.0%) | 595 (36.3%) |
| Bottled, Tank, or LP Gas | 6 (0.3%) | 0 (0.0%) |
| Electricity | 543 (25.7%) | 1,042 (63.6%) |
| Fuel Oil or Kerosene | 0 (0.0%) | 0 (0.0%) |
| Coal or Coke | 0 (0.0%) | 0 (0.0%) |
| All other Fuels | 0 (0.0%) | 0 (0.0%) |
| No Fuel Used | 0 (0.0%) | 0 (0.0%) |
| Total | 2,111 (100.0%) | 1,637 (100.0%) |
Household Vehicle Usage in Vernon
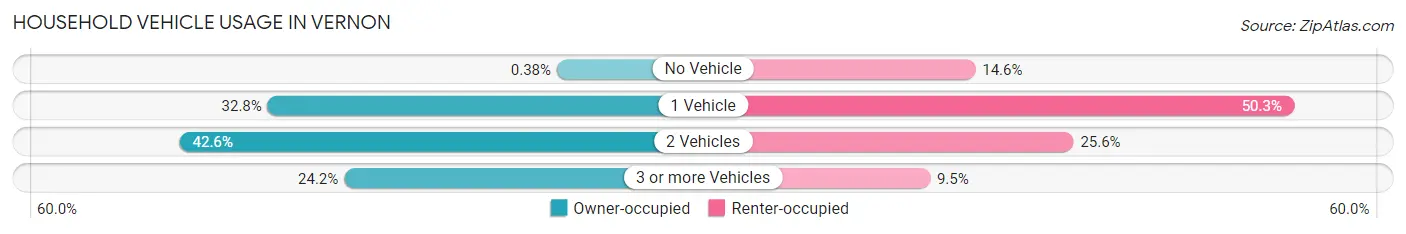
| Vehicles per Household | Owner-occupied | Renter-occupied |
| No Vehicle | 8 (0.4%) | 239 (14.6%) |
| 1 Vehicle | 692 (32.8%) | 823 (50.3%) |
| 2 Vehicles | 900 (42.6%) | 419 (25.6%) |
| 3 or more Vehicles | 511 (24.2%) | 156 (9.5%) |
| Total | 2,111 (100.0%) | 1,637 (100.0%) |
Real Estate & Mortgages in Vernon
Real Estate and Mortgage Overview in Vernon
| Characteristic | Without Mortgage | With Mortgage |
| Housing Units | 1,181 | 930 |
| Median Property Value | $71,800 | $95,700 |
| Median Household Income | $43,819 | $65 |
| Monthly Housing Costs | $529 | $0 |
| Real Estate Taxes | $988 | $64 |
Property Value by Mortgage Status in Vernon
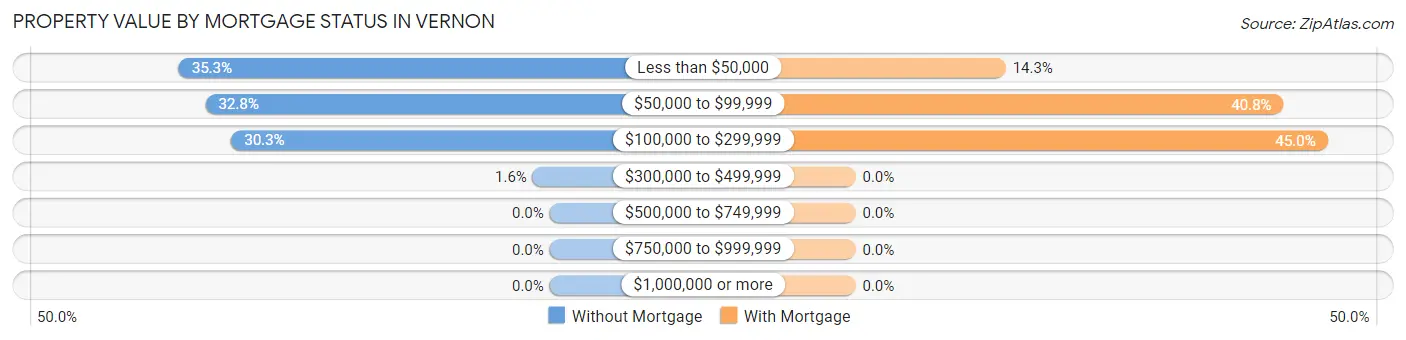
| Property Value | Without Mortgage | With Mortgage |
| Less than $50,000 | 417 (35.3%) | 133 (14.3%) |
| $50,000 to $99,999 | 387 (32.8%) | 379 (40.7%) |
| $100,000 to $299,999 | 358 (30.3%) | 418 (45.0%) |
| $300,000 to $499,999 | 19 (1.6%) | 0 (0.0%) |
| $500,000 to $749,999 | 0 (0.0%) | 0 (0.0%) |
| $750,000 to $999,999 | 0 (0.0%) | 0 (0.0%) |
| $1,000,000 or more | 0 (0.0%) | 0 (0.0%) |
| Total | 1,181 (100.0%) | 930 (100.0%) |
Household Income by Mortgage Status in Vernon
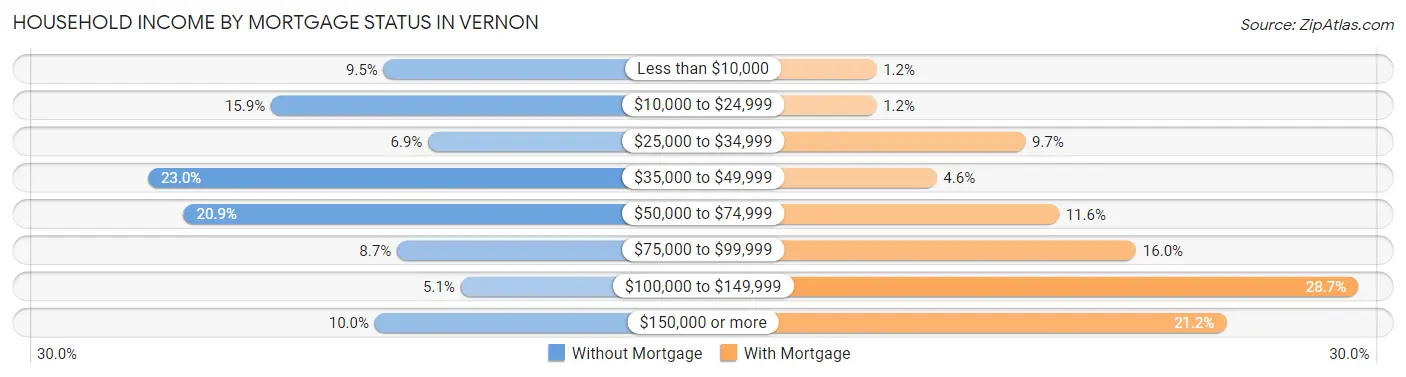
| Household Income | Without Mortgage | With Mortgage |
| Less than $10,000 | 112 (9.5%) | 11 (1.2%) |
| $10,000 to $24,999 | 188 (15.9%) | 11 (1.2%) |
| $25,000 to $34,999 | 82 (6.9%) | 90 (9.7%) |
| $35,000 to $49,999 | 271 (23.0%) | 43 (4.6%) |
| $50,000 to $74,999 | 247 (20.9%) | 108 (11.6%) |
| $75,000 to $99,999 | 103 (8.7%) | 149 (16.0%) |
| $100,000 to $149,999 | 60 (5.1%) | 267 (28.7%) |
| $150,000 or more | 118 (10.0%) | 197 (21.2%) |
| Total | 1,181 (100.0%) | 930 (100.0%) |
Property Value to Household Income Ratio in Vernon
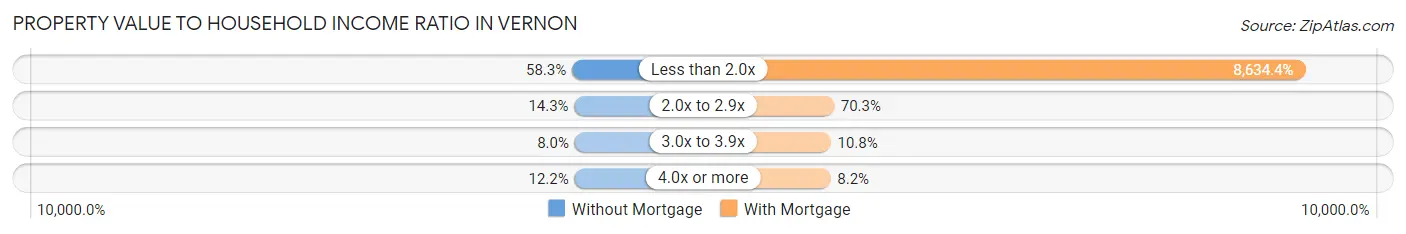
| Value-to-Income Ratio | Without Mortgage | With Mortgage |
| Less than 2.0x | 688 (58.3%) | 80,300 (8,634.4%) |
| 2.0x to 2.9x | 169 (14.3%) | 654 (70.3%) |
| 3.0x to 3.9x | 95 (8.0%) | 100 (10.7%) |
| 4.0x or more | 144 (12.2%) | 76 (8.2%) |
| Total | 1,181 (100.0%) | 930 (100.0%) |
Real Estate Taxes by Mortgage Status in Vernon
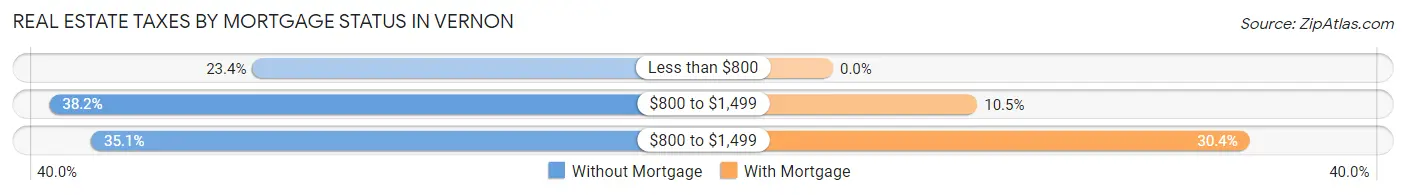
| Property Taxes | Without Mortgage | With Mortgage |
| Less than $800 | 276 (23.4%) | 0 (0.0%) |
| $800 to $1,499 | 451 (38.2%) | 98 (10.5%) |
| $800 to $1,499 | 415 (35.1%) | 283 (30.4%) |
| Total | 1,181 (100.0%) | 930 (100.0%) |
Health & Disability in Vernon
Health Insurance Coverage by Age in Vernon
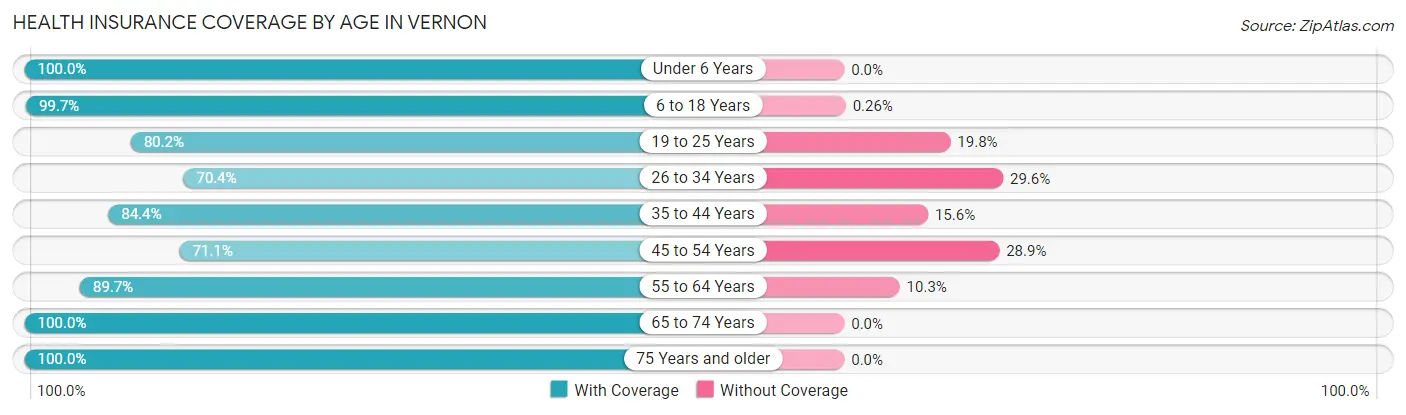
| Age Bracket | With Coverage | Without Coverage |
| Under 6 Years | 779 (100.0%) | 0 (0.0%) |
| 6 to 18 Years | 1,883 (99.7%) | 5 (0.3%) |
| 19 to 25 Years | 616 (80.2%) | 152 (19.8%) |
| 26 to 34 Years | 851 (70.4%) | 358 (29.6%) |
| 35 to 44 Years | 930 (84.4%) | 172 (15.6%) |
| 45 to 54 Years | 800 (71.1%) | 325 (28.9%) |
| 55 to 64 Years | 1,147 (89.7%) | 132 (10.3%) |
| 65 to 74 Years | 1,068 (100.0%) | 0 (0.0%) |
| 75 Years and older | 578 (100.0%) | 0 (0.0%) |
| Total | 8,652 (88.3%) | 1,144 (11.7%) |
Health Insurance Coverage by Citizenship Status in Vernon
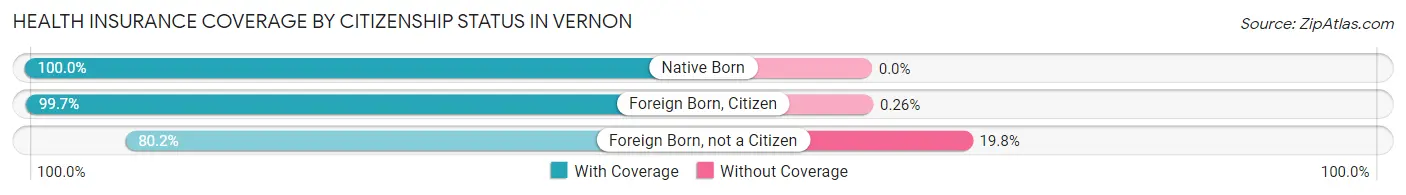
| Citizenship Status | With Coverage | Without Coverage |
| Native Born | 779 (100.0%) | 0 (0.0%) |
| Foreign Born, Citizen | 1,883 (99.7%) | 5 (0.3%) |
| Foreign Born, not a Citizen | 616 (80.2%) | 152 (19.8%) |
Health Insurance Coverage by Household Income in Vernon
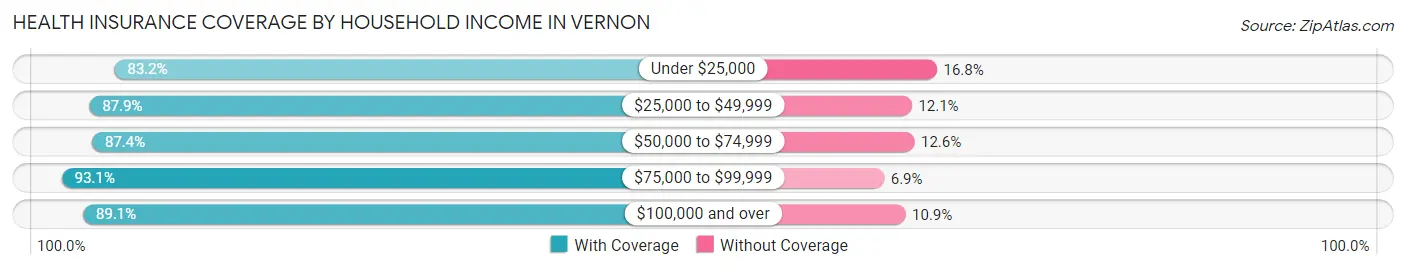
| Household Income | With Coverage | Without Coverage |
| Under $25,000 | 1,381 (83.2%) | 279 (16.8%) |
| $25,000 to $49,999 | 2,142 (87.9%) | 295 (12.1%) |
| $50,000 to $74,999 | 1,554 (87.4%) | 224 (12.6%) |
| $75,000 to $99,999 | 1,933 (93.1%) | 144 (6.9%) |
| $100,000 and over | 1,526 (89.1%) | 187 (10.9%) |
Public vs Private Health Insurance Coverage by Age in Vernon
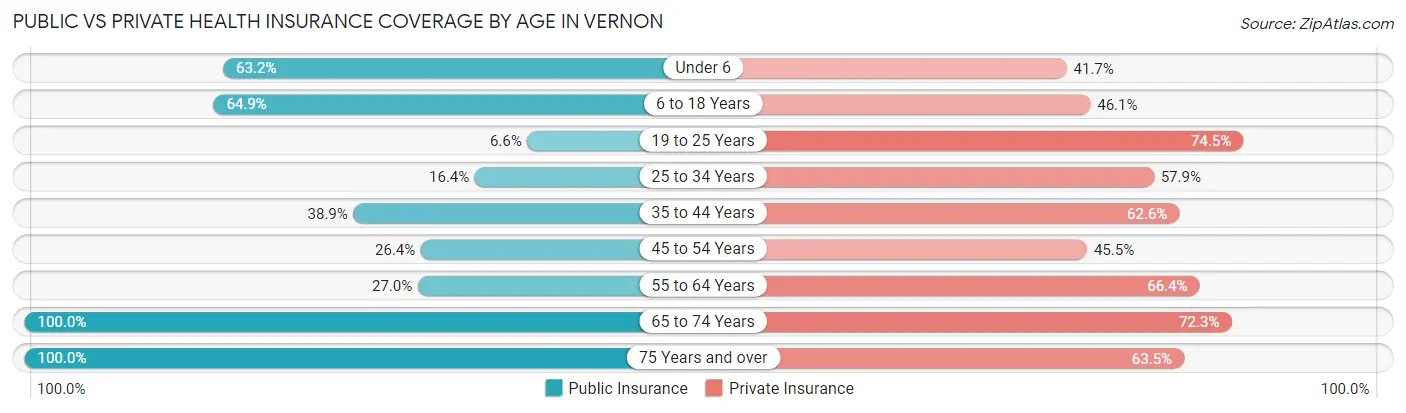
| Age Bracket | Public Insurance | Private Insurance |
| Under 6 | 492 (63.2%) | 325 (41.7%) |
| 6 to 18 Years | 1,226 (64.9%) | 871 (46.1%) |
| 19 to 25 Years | 51 (6.6%) | 572 (74.5%) |
| 25 to 34 Years | 198 (16.4%) | 700 (57.9%) |
| 35 to 44 Years | 429 (38.9%) | 690 (62.6%) |
| 45 to 54 Years | 297 (26.4%) | 512 (45.5%) |
| 55 to 64 Years | 345 (27.0%) | 849 (66.4%) |
| 65 to 74 Years | 1,068 (100.0%) | 772 (72.3%) |
| 75 Years and over | 578 (100.0%) | 367 (63.5%) |
| Total | 4,684 (47.8%) | 5,658 (57.8%) |
Disability Status by Sex by Age in Vernon
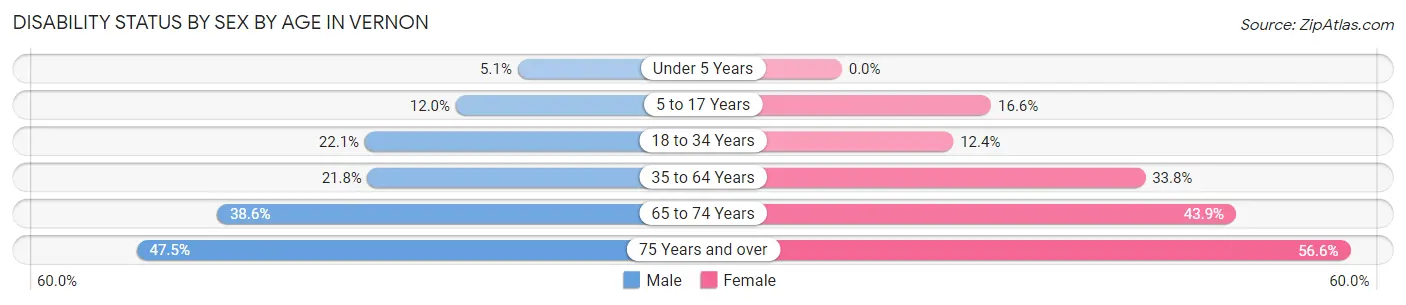
| Age Bracket | Male | Female |
| Under 5 Years | 16 (5.1%) | 0 (0.0%) |
| 5 to 17 Years | 116 (12.0%) | 137 (16.6%) |
| 18 to 34 Years | 225 (22.1%) | 146 (12.4%) |
| 35 to 64 Years | 366 (21.8%) | 617 (33.8%) |
| 65 to 74 Years | 194 (38.6%) | 248 (43.9%) |
| 75 Years and over | 106 (47.5%) | 201 (56.6%) |
Disability Class by Sex by Age in Vernon
Disability Class: Hearing Difficulty
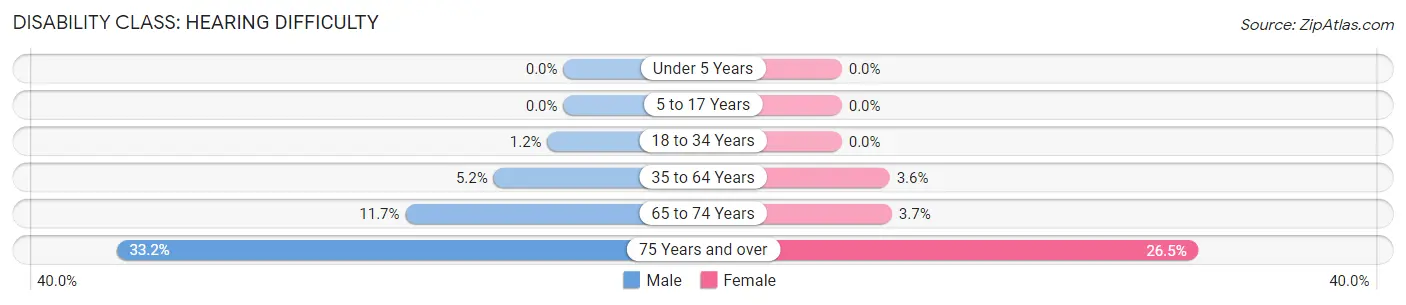
| Age Bracket | Male | Female |
| Under 5 Years | 0 (0.0%) | 0 (0.0%) |
| 5 to 17 Years | 0 (0.0%) | 0 (0.0%) |
| 18 to 34 Years | 12 (1.2%) | 0 (0.0%) |
| 35 to 64 Years | 87 (5.2%) | 65 (3.6%) |
| 65 to 74 Years | 59 (11.7%) | 21 (3.7%) |
| 75 Years and over | 74 (33.2%) | 94 (26.5%) |
Disability Class: Vision Difficulty
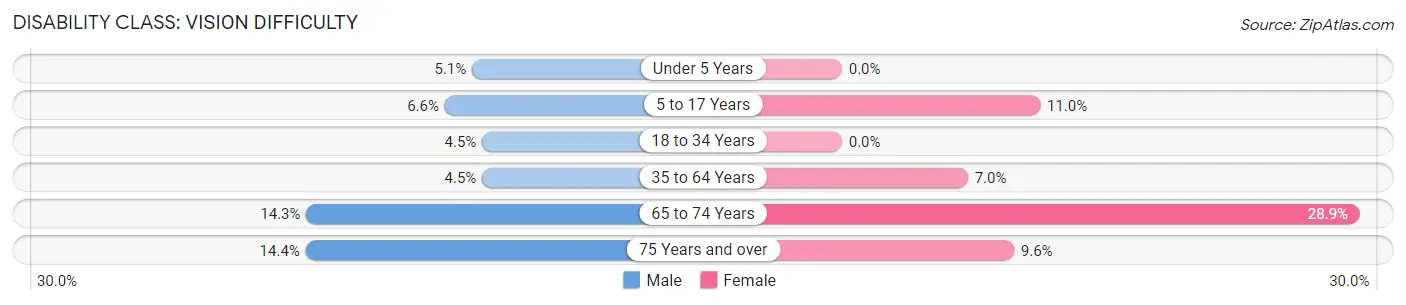
| Age Bracket | Male | Female |
| Under 5 Years | 16 (5.1%) | 0 (0.0%) |
| 5 to 17 Years | 64 (6.6%) | 91 (11.0%) |
| 18 to 34 Years | 46 (4.5%) | 0 (0.0%) |
| 35 to 64 Years | 76 (4.5%) | 128 (7.0%) |
| 65 to 74 Years | 72 (14.3%) | 163 (28.8%) |
| 75 Years and over | 32 (14.3%) | 34 (9.6%) |
Disability Class: Cognitive Difficulty
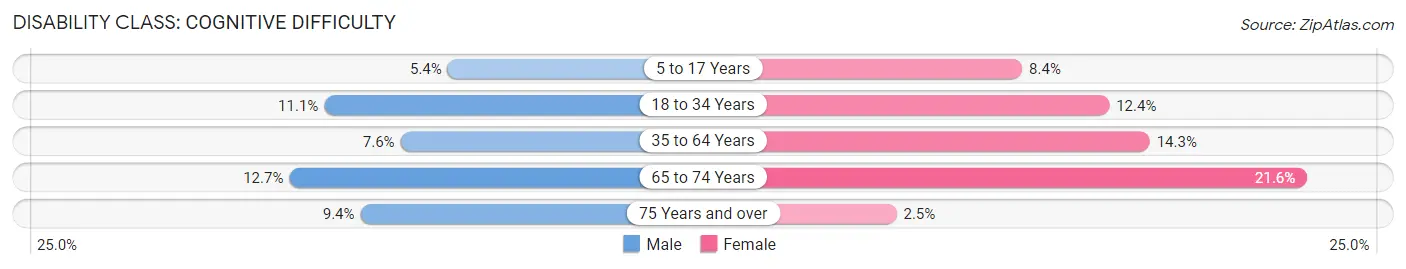
| Age Bracket | Male | Female |
| 5 to 17 Years | 52 (5.4%) | 69 (8.4%) |
| 18 to 34 Years | 113 (11.1%) | 146 (12.4%) |
| 35 to 64 Years | 127 (7.6%) | 261 (14.3%) |
| 65 to 74 Years | 64 (12.7%) | 122 (21.6%) |
| 75 Years and over | 21 (9.4%) | 9 (2.5%) |
Disability Class: Ambulatory Difficulty
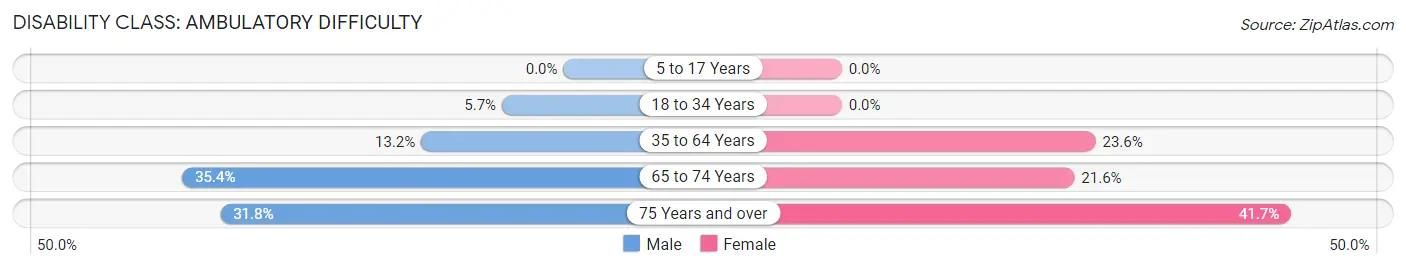
| Age Bracket | Male | Female |
| 5 to 17 Years | 0 (0.0%) | 0 (0.0%) |
| 18 to 34 Years | 58 (5.7%) | 0 (0.0%) |
| 35 to 64 Years | 222 (13.2%) | 430 (23.5%) |
| 65 to 74 Years | 178 (35.4%) | 122 (21.6%) |
| 75 Years and over | 71 (31.8%) | 148 (41.7%) |
Disability Class: Self-Care Difficulty
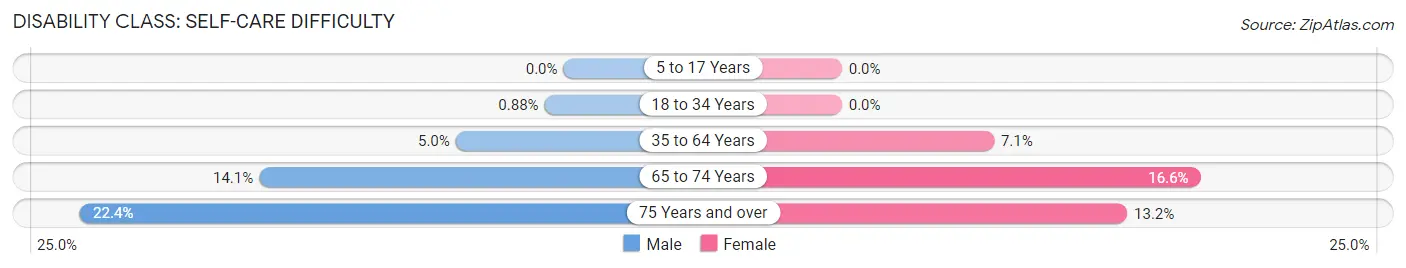
| Age Bracket | Male | Female |
| 5 to 17 Years | 0 (0.0%) | 0 (0.0%) |
| 18 to 34 Years | 9 (0.9%) | 0 (0.0%) |
| 35 to 64 Years | 84 (5.0%) | 129 (7.1%) |
| 65 to 74 Years | 71 (14.1%) | 94 (16.6%) |
| 75 Years and over | 50 (22.4%) | 47 (13.2%) |
Technology Access in Vernon
Computing Device Access in Vernon
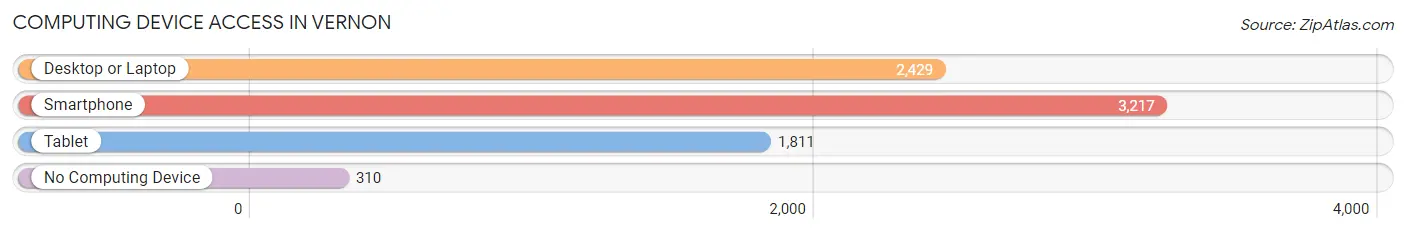
| Device Type | # Households | % Households |
| Desktop or Laptop | 2,429 | 64.8% |
| Smartphone | 3,217 | 85.8% |
| Tablet | 1,811 | 48.3% |
| No Computing Device | 310 | 8.3% |
| Total | 3,748 | 100.0% |
Internet Access in Vernon
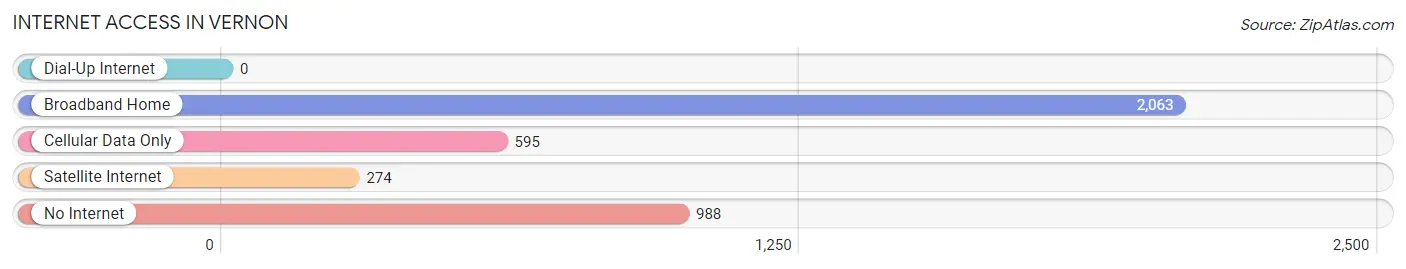
| Internet Type | # Households | % Households |
| Dial-Up Internet | 0 | 0.0% |
| Broadband Home | 2,063 | 55.0% |
| Cellular Data Only | 595 | 15.9% |
| Satellite Internet | 274 | 7.3% |
| No Internet | 988 | 26.4% |
| Total | 3,748 | 100.0% |
Vernon Summary
Vernon, Texas is a small city located in Wilbarger County in the north-central part of the state. It is the county seat and the largest city in Wilbarger County. The city is situated on the Red River, which forms the border between Texas and Oklahoma. The city was founded in 1887 and was named after George Washington’s home, Mount Vernon.
Geography
Vernon is located at the intersection of U.S. Highway 287 and State Highway 70. It is approximately 100 miles northwest of Fort Worth and 100 miles southeast of Amarillo. The city is situated on the Red River, which forms the border between Texas and Oklahoma. The city is surrounded by rolling hills and prairies, and is located in the Red River Valley. The climate is semi-arid, with hot summers and mild winters.
Economy
Vernon’s economy is largely based on agriculture and manufacturing. The city is home to several large agricultural operations, including cattle ranches, cotton farms, and wheat farms. The city is also home to several manufacturing companies, including a large poultry processing plant, a large food processing plant, and a large furniture manufacturing plant.
Demographics
As of the 2010 census, the population of Vernon was 11,002. The racial makeup of the city was 75.3% White, 0.7% African American, 0.7% Native American, 0.3% Asian, 0.1% Pacific Islander, 20.7% from other races, and 2.1% from two or more races. Hispanic or Latino of any race were 37.2% of the population.
The median income for a household in the city was $30,945, and the median income for a family was $37,813. The per capita income for the city was $17,845. About 18.2% of families and 22.2% of the population were below the poverty line, including 28.3% of those under age 18 and 16.2% of those age 65 or over.
Conclusion
Vernon, Texas is a small city located in Wilbarger County in the north-central part of the state. It is the county seat and the largest city in Wilbarger County. The city is situated on the Red River, which forms the border between Texas and Oklahoma. The city was founded in 1887 and was named after George Washington’s home, Mount Vernon. The economy of Vernon is largely based on agriculture and manufacturing, and the city is home to several large agricultural operations and manufacturing companies. As of the 2010 census, the population of Vernon was 11,002, with a median household income of $30,945 and a median family income of $37,813.
Common Questions
What is the Total Population of Vernon?
Total Population of Vernon is 10,018.
What is the Total Male Population of Vernon?
Total Male Population of Vernon is 4,884.
What is the Total Female Population of Vernon?
Total Female Population of Vernon is 5,134.
What is the Ratio of Males per 100 Females in Vernon?
There are 95.13 Males per 100 Females in Vernon.
What is the Ratio of Females per 100 Males in Vernon?
There are 105.12 Females per 100 Males in Vernon.
What is the Median Population Age in Vernon?
Median Population Age in Vernon is 36.7 Years.
What is the Average Family Size in Vernon
Average Family Size in Vernon is 3.3 People.
What is the Average Household Size in Vernon
Average Household Size in Vernon is 2.6 People.
What is Per Capita Income in Vernon?
Per Capita income in Vernon is $23,456.
What is the Median Family Income in Vernon?
Median Family Income in Vernon is $55,625.
What is the Median Household income in Vernon?
Median Household Income in Vernon is $47,528.
What is Income or Wage Gap in Vernon?
Income or Wage Gap in Vernon is 1.6%.
Women in Vernon earn 98.4 cents for every dollar earned by a man.
What is Inequality or Gini Index in Vernon?
Inequality or Gini Index in Vernon is 0.41.
How Large is the Labor Force in Vernon?
There are 4,812 People in the Labor Forcein in Vernon.
What is the Percentage of People in the Labor Force in Vernon?
60.2% of People are in the Labor Force in Vernon.
What is the Unemployment Rate in Vernon?
Unemployment Rate in Vernon is 11.3%.