Bridgman, MI
Bridgman Map
Bridgman Overview
2,378
TOTAL POPULATION
1,218
MALE POPULATION
1,160
FEMALE POPULATION
105.00
MALES / 100 FEMALES
95.24
FEMALES / 100 MALES
42.4
MEDIAN AGE
2.9
AVG FAMILY SIZE
2.5
AVG HOUSEHOLD SIZE
$37,560
PER CAPITA INCOME
$80,000
AVG FAMILY INCOME
$62,337
AVG HOUSEHOLD INCOME
47.0%
WAGE / INCOME GAP [ % ]
53.0¢/ $1
WAGE / INCOME GAP [ $ ]
0.43
INEQUALITY / GINI INDEX
1,115
LABOR FORCE [ PEOPLE ]
58.1%
PERCENT IN LABOR FORCE
1.7%
UNEMPLOYMENT RATE
Bridgman Zip Codes
Bridgman Area Codes
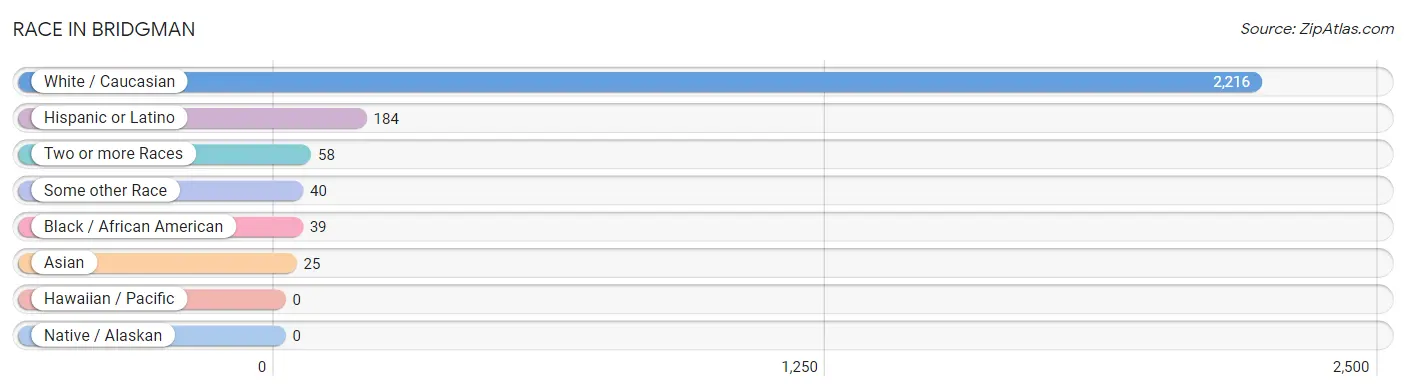
Race in Bridgman
The most populous races in Bridgman are White / Caucasian (2,216 | 93.2%), Hispanic or Latino (184 | 7.7%), and Two or more Races (58 | 2.4%).
| Race | # Population | % Population |
| Asian | 25 | 1.1% |
| Black / African American | 39 | 1.6% |
| Hawaiian / Pacific | 0 | 0.0% |
| Hispanic or Latino | 184 | 7.7% |
| Native / Alaskan | 0 | 0.0% |
| White / Caucasian | 2,216 | 93.2% |
| Two or more Races | 58 | 2.4% |
| Some other Race | 40 | 1.7% |
| Total | 2,378 | 100.0% |
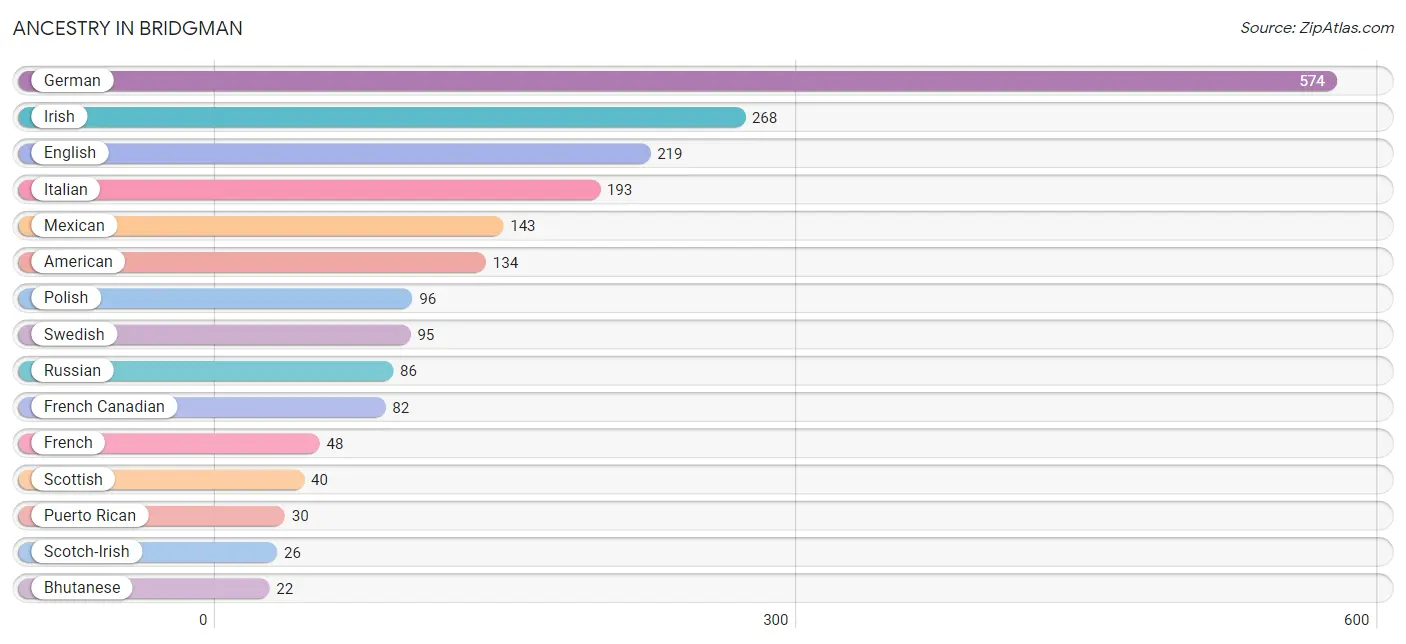
Ancestry in Bridgman
The most populous ancestries reported in Bridgman are German (574 | 24.1%), Irish (268 | 11.3%), English (219 | 9.2%), Italian (193 | 8.1%), and Mexican (143 | 6.0%), together accounting for 58.8% of all Bridgman residents.
| Ancestry | # Population | % Population |
| American | 134 | 5.6% |
| Arab | 4 | 0.2% |
| Belgian | 11 | 0.5% |
| Bhutanese | 22 | 0.9% |
| British | 6 | 0.3% |
| Czech | 6 | 0.3% |
| Dutch | 19 | 0.8% |
| Eastern European | 5 | 0.2% |
| English | 219 | 9.2% |
| European | 18 | 0.8% |
| Finnish | 4 | 0.2% |
| French | 48 | 2.0% |
| French Canadian | 82 | 3.5% |
| German | 574 | 24.1% |
| Greek | 4 | 0.2% |
| Hungarian | 4 | 0.2% |
| Irish | 268 | 11.3% |
| Italian | 193 | 8.1% |
| Korean | 20 | 0.8% |
| Lithuanian | 5 | 0.2% |
| Mexican | 143 | 6.0% |
| Polish | 96 | 4.0% |
| Portuguese | 6 | 0.3% |
| Puerto Rican | 30 | 1.3% |
| Russian | 86 | 3.6% |
| Scotch-Irish | 26 | 1.1% |
| Scottish | 40 | 1.7% |
| Serbian | 5 | 0.2% |
| Slovak | 10 | 0.4% |
| Swedish | 95 | 4.0% |
| Swiss | 4 | 0.2% |
| Welsh | 18 | 0.8% | View All 32 Rows |
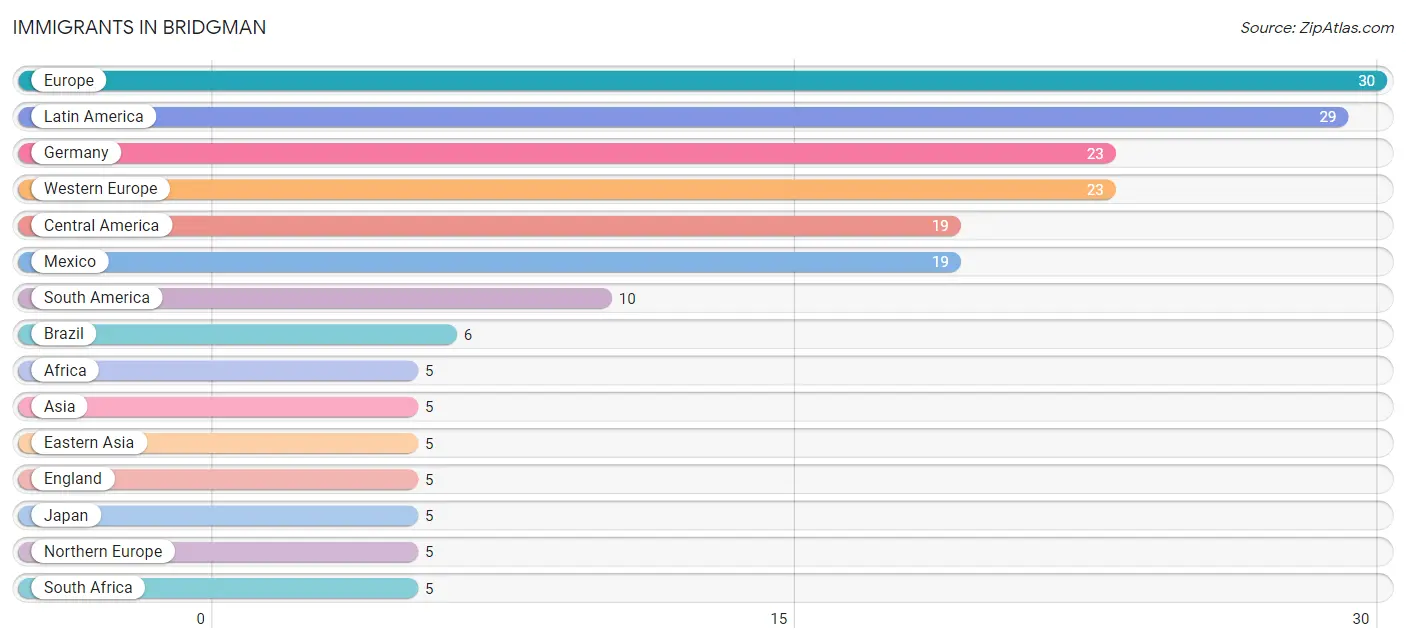
Immigrants in Bridgman
The most numerous immigrant groups reported in Bridgman came from Europe (30 | 1.3%), Latin America (29 | 1.2%), Germany (23 | 1.0%), Western Europe (23 | 1.0%), and Central America (19 | 0.8%), together accounting for 5.2% of all Bridgman residents.
| Immigration Origin | # Population | % Population |
| Africa | 5 | 0.2% |
| Asia | 5 | 0.2% |
| Brazil | 6 | 0.3% |
| Central America | 19 | 0.8% |
| Eastern Asia | 5 | 0.2% |
| Eastern Europe | 2 | 0.1% |
| England | 5 | 0.2% |
| Europe | 30 | 1.3% |
| Germany | 23 | 1.0% |
| Japan | 5 | 0.2% |
| Latin America | 29 | 1.2% |
| Mexico | 19 | 0.8% |
| Northern Europe | 5 | 0.2% |
| Poland | 2 | 0.1% |
| South Africa | 5 | 0.2% |
| South America | 10 | 0.4% |
| Western Europe | 23 | 1.0% | View All 17 Rows |
Sex and Age in Bridgman
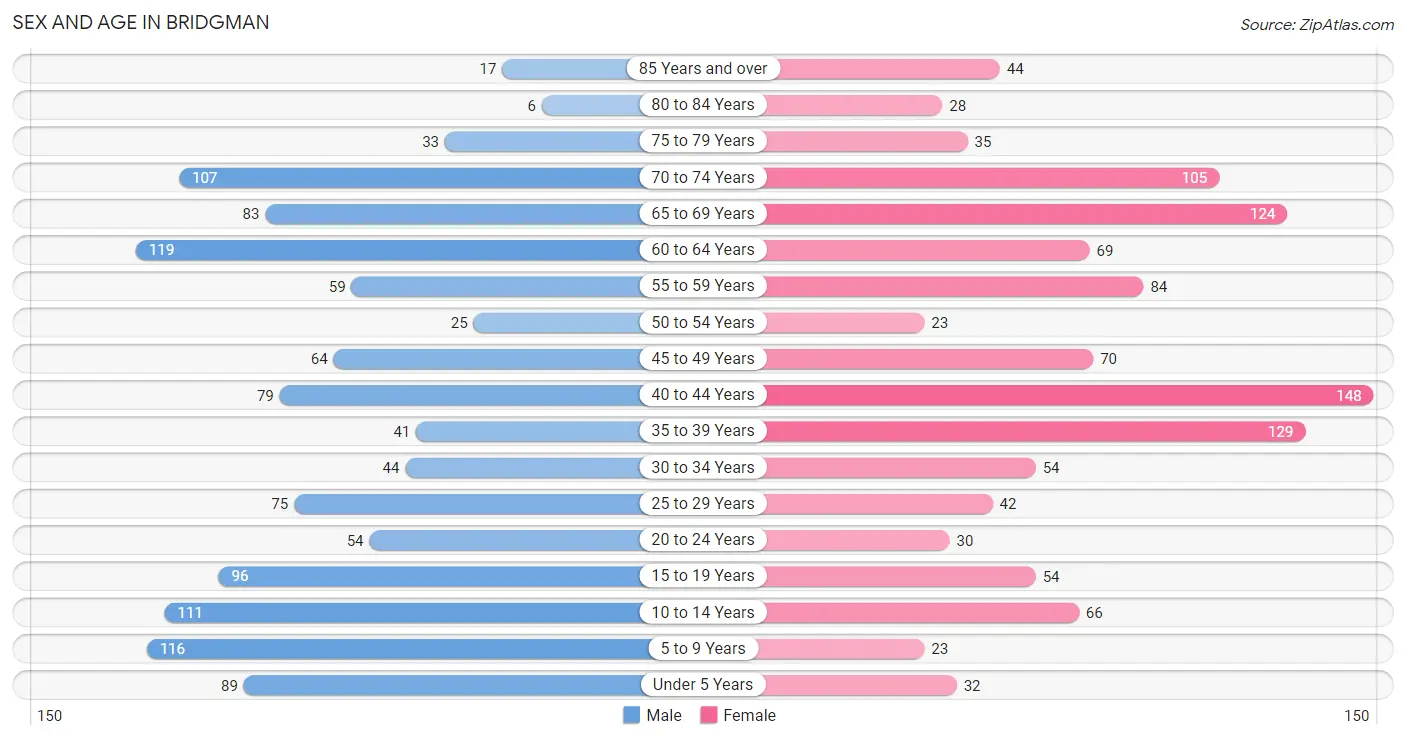
Sex and Age in Bridgman
The most populous age groups in Bridgman are 60 to 64 Years (119 | 9.8%) for men and 40 to 44 Years (148 | 12.8%) for women.
| Age Bracket | Male | Female |
| Under 5 Years | 89 (7.3%) | 32 (2.8%) |
| 5 to 9 Years | 116 (9.5%) | 23 (2.0%) |
| 10 to 14 Years | 111 (9.1%) | 66 (5.7%) |
| 15 to 19 Years | 96 (7.9%) | 54 (4.7%) |
| 20 to 24 Years | 54 (4.4%) | 30 (2.6%) |
| 25 to 29 Years | 75 (6.2%) | 42 (3.6%) |
| 30 to 34 Years | 44 (3.6%) | 54 (4.7%) |
| 35 to 39 Years | 41 (3.4%) | 129 (11.1%) |
| 40 to 44 Years | 79 (6.5%) | 148 (12.8%) |
| 45 to 49 Years | 64 (5.2%) | 70 (6.0%) |
| 50 to 54 Years | 25 (2.1%) | 23 (2.0%) |
| 55 to 59 Years | 59 (4.8%) | 84 (7.2%) |
| 60 to 64 Years | 119 (9.8%) | 69 (5.9%) |
| 65 to 69 Years | 83 (6.8%) | 124 (10.7%) |
| 70 to 74 Years | 107 (8.8%) | 105 (9.0%) |
| 75 to 79 Years | 33 (2.7%) | 35 (3.0%) |
| 80 to 84 Years | 6 (0.5%) | 28 (2.4%) |
| 85 Years and over | 17 (1.4%) | 44 (3.8%) |
| Total | 1,218 (100.0%) | 1,160 (100.0%) |
Families and Households in Bridgman
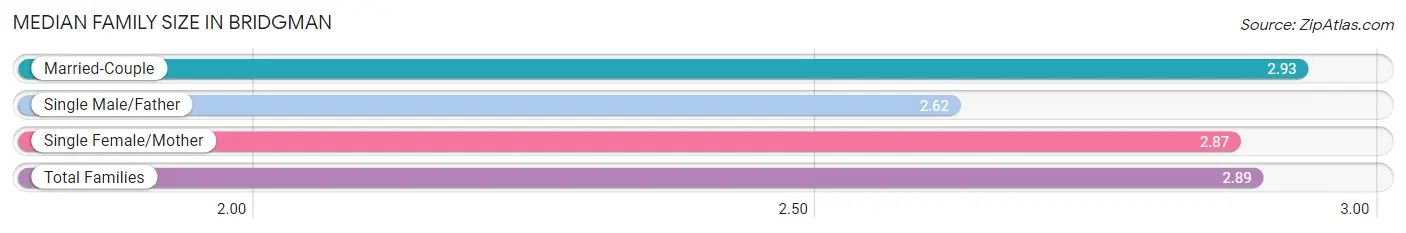
Median Family Size in Bridgman
The median family size in Bridgman is 2.89 persons per family, with married-couple families (433 | 71.0%) accounting for the largest median family size of 2.93 persons per family. On the other hand, single male/father families (63 | 10.3%) represent the smallest median family size with 2.62 persons per family.
| Family Type | # Families | Family Size |
| Married-Couple | 433 (71.0%) | 2.93 |
| Single Male/Father | 63 (10.3%) | 2.62 |
| Single Female/Mother | 114 (18.7%) | 2.87 |
| Total Families | 610 (100.0%) | 2.89 |
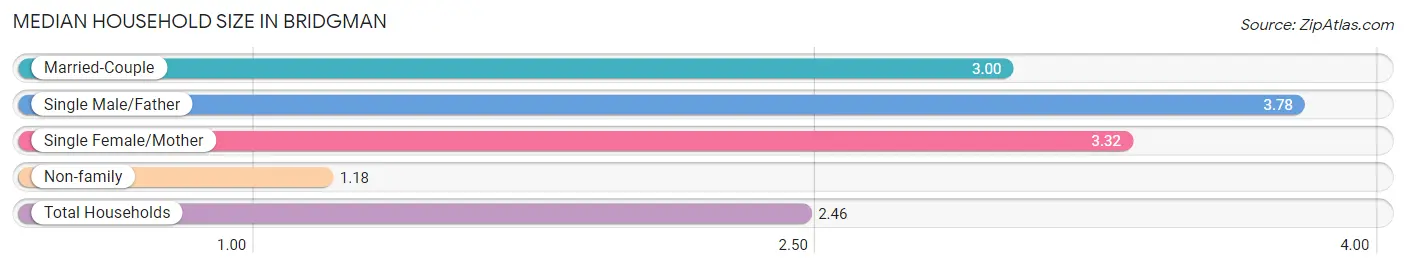
Median Household Size in Bridgman
The median household size in Bridgman is 2.46 persons per household, with single male/father households (63 | 6.8%) accounting for the largest median household size of 3.78 persons per household. non-family households (321 | 34.5%) represent the smallest median household size with 1.18 persons per household.
| Household Type | # Households | Household Size |
| Married-Couple | 433 (46.5%) | 3.00 |
| Single Male/Father | 63 (6.8%) | 3.78 |
| Single Female/Mother | 114 (12.2%) | 3.32 |
| Non-family | 321 (34.5%) | 1.18 |
| Total Households | 931 (100.0%) | 2.46 |
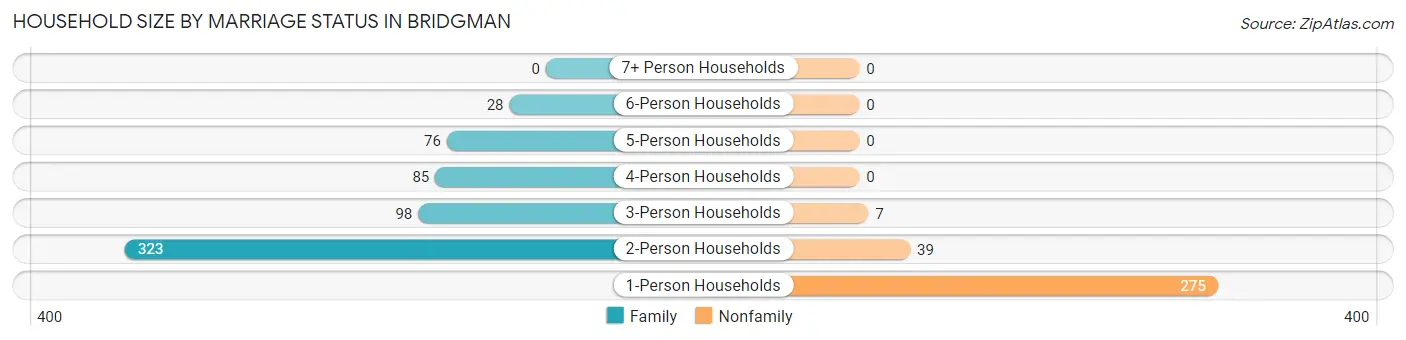
Household Size by Marriage Status in Bridgman
Out of a total of 931 households in Bridgman, 610 (65.5%) are family households, while 321 (34.5%) are nonfamily households. The most numerous type of family households are 2-person households, comprising 323, and the most common type of nonfamily households are 1-person households, comprising 275.
| Household Size | Family Households | Nonfamily Households |
| 1-Person Households | - | 275 (29.5%) |
| 2-Person Households | 323 (34.7%) | 39 (4.2%) |
| 3-Person Households | 98 (10.5%) | 7 (0.7%) |
| 4-Person Households | 85 (9.1%) | 0 (0.0%) |
| 5-Person Households | 76 (8.2%) | 0 (0.0%) |
| 6-Person Households | 28 (3.0%) | 0 (0.0%) |
| 7+ Person Households | 0 (0.0%) | 0 (0.0%) |
| Total | 610 (65.5%) | 321 (34.5%) |
Female Fertility in Bridgman
Fertility by Age in Bridgman
| Age Bracket | Women with Births | Births / 1,000 Women |
| 15 to 19 years | 0 (0.0%) | 0.0 |
| 20 to 34 years | 0 (0.0%) | 0.0 |
| 35 to 50 years | 0 (0.0%) | 0.0 |
| Total | 0 (0.0%) | 0.0 |
Fertility by Age by Marriage Status in Bridgman
| Age Bracket | Married | Unmarried |
| 15 to 19 years | 0 (0.0%) | 0 (0.0%) |
| 20 to 34 years | 0 (0.0%) | 0 (0.0%) |
| 35 to 50 years | 0 (0.0%) | 0 (0.0%) |
| Total | 0 (0.0%) | 0 (0.0%) |
Fertility by Education in Bridgman
| Educational Attainment | Women with Births | Births / 1,000 Women |
| Less than High School | 0 (0.0%) | 0.0 |
| High School Diploma | 0 (0.0%) | 0.0 |
| College or Associate's Degree | 0 (0.0%) | 0.0 |
| Bachelor's Degree | 0 (0.0%) | 0.0 |
| Graduate Degree | 0 (0.0%) | 0.0 |
| Total | 0 (0.0%) | 0.0 |
Fertility by Education by Marriage Status in Bridgman
| Educational Attainment | Married | Unmarried |
| Less than High School | 0 (0.0%) | 0 (0.0%) |
| High School Diploma | 0 (0.0%) | 0 (0.0%) |
| College or Associate's Degree | 0 (0.0%) | 0 (0.0%) |
| Bachelor's Degree | 0 (0.0%) | 0 (0.0%) |
| Graduate Degree | 0 (0.0%) | 0 (0.0%) |
| Total | 0 (0.0%) | 0 (0.0%) |
Income in Bridgman
Income Overview in Bridgman
Per Capita Income in Bridgman is $37,560, while median incomes of families and households are $80,000 and $62,337 respectively.
| Characteristic | Number | Measure |
| Per Capita Income | 2,378 | $37,560 |
| Median Family Income | 610 | $80,000 |
| Mean Family Income | 610 | $102,404 |
| Median Household Income | 931 | $62,337 |
| Mean Household Income | 931 | $88,799 |
| Income Deficit | 610 | $0 |
| Wage / Income Gap (%) | 2,378 | 46.97% |
| Wage / Income Gap ($) | 2,378 | 53.03¢ per $1 |
| Gini / Inequality Index | 2,378 | 0.43 |
Earnings by Sex in Bridgman
Average Earnings in Bridgman are $33,013, $46,429 for men and $24,620 for women, a difference of 47.0%.
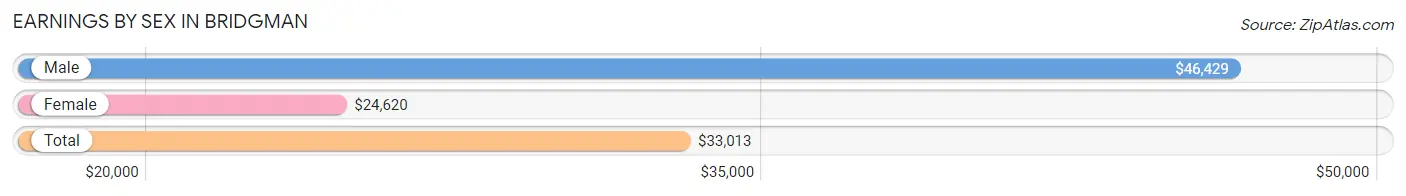
| Sex | Number | Average Earnings |
| Male | 624 (52.0%) | $46,429 |
| Female | 576 (48.0%) | $24,620 |
| Total | 1,200 (100.0%) | $33,013 |
Earnings by Sex by Income Bracket in Bridgman
The most common earnings brackets in Bridgman are $100,000+ for men (126 | 20.2%) and $7,500 to $9,999 for women (63 | 10.9%).
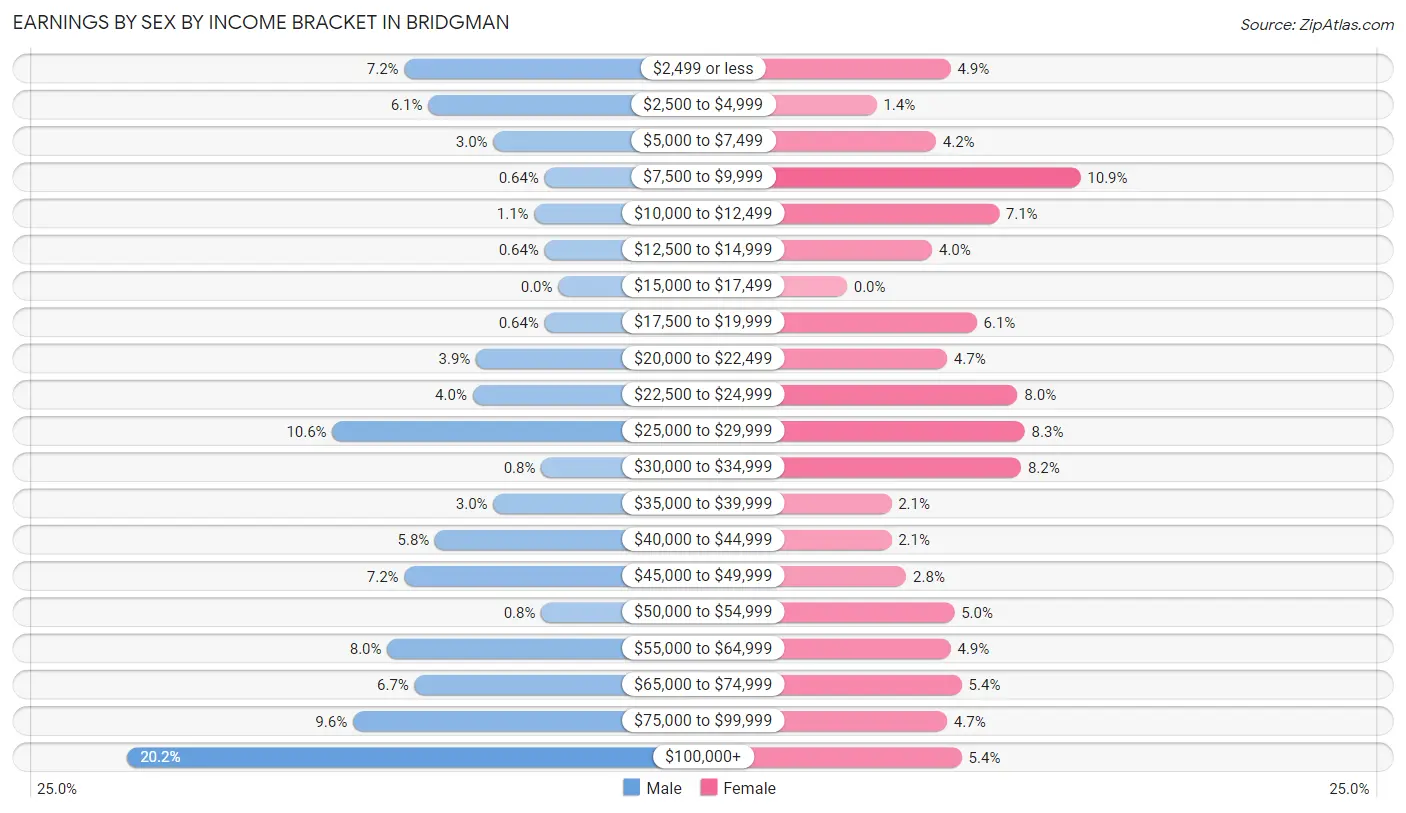
| Income | Male | Female |
| $2,499 or less | 45 (7.2%) | 28 (4.9%) |
| $2,500 to $4,999 | 38 (6.1%) | 8 (1.4%) |
| $5,000 to $7,499 | 19 (3.0%) | 24 (4.2%) |
| $7,500 to $9,999 | 4 (0.6%) | 63 (10.9%) |
| $10,000 to $12,499 | 7 (1.1%) | 41 (7.1%) |
| $12,500 to $14,999 | 4 (0.6%) | 23 (4.0%) |
| $15,000 to $17,499 | 0 (0.0%) | 0 (0.0%) |
| $17,500 to $19,999 | 4 (0.6%) | 35 (6.1%) |
| $20,000 to $22,499 | 24 (3.8%) | 27 (4.7%) |
| $22,500 to $24,999 | 25 (4.0%) | 46 (8.0%) |
| $25,000 to $29,999 | 66 (10.6%) | 48 (8.3%) |
| $30,000 to $34,999 | 5 (0.8%) | 47 (8.2%) |
| $35,000 to $39,999 | 19 (3.0%) | 12 (2.1%) |
| $40,000 to $44,999 | 36 (5.8%) | 12 (2.1%) |
| $45,000 to $49,999 | 45 (7.2%) | 16 (2.8%) |
| $50,000 to $54,999 | 5 (0.8%) | 29 (5.0%) |
| $55,000 to $64,999 | 50 (8.0%) | 28 (4.9%) |
| $65,000 to $74,999 | 42 (6.7%) | 31 (5.4%) |
| $75,000 to $99,999 | 60 (9.6%) | 27 (4.7%) |
| $100,000+ | 126 (20.2%) | 31 (5.4%) |
| Total | 624 (100.0%) | 576 (100.0%) |
Earnings by Sex by Educational Attainment in Bridgman
Average earnings in Bridgman are $56,208 for men and $25,500 for women, a difference of 54.6%. Men with an educational attainment of graduate degree enjoy the highest average annual earnings of $97,917, while those with college or associate's degree education earn the least with $41,250. Women with an educational attainment of bachelor's degree earn the most with the average annual earnings of $58,250, while those with high school diploma education have the smallest earnings of $11,359.
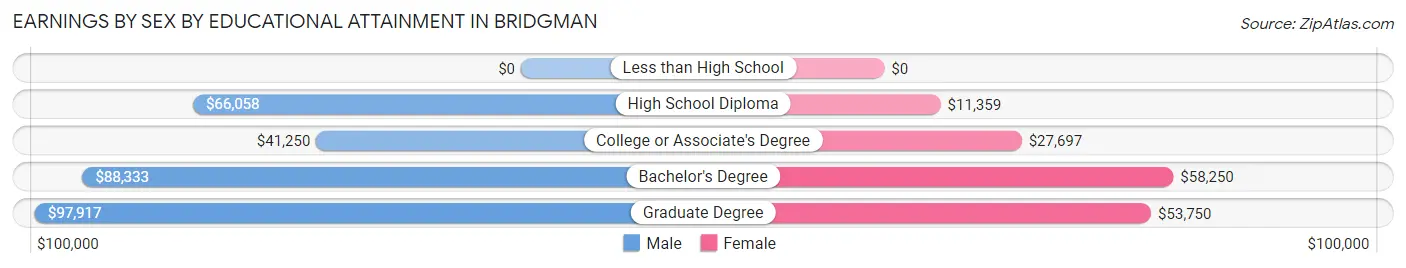
| Educational Attainment | Male Income | Female Income |
| Less than High School | - | - |
| High School Diploma | $66,058 | $11,359 |
| College or Associate's Degree | $41,250 | $27,697 |
| Bachelor's Degree | $88,333 | $58,250 |
| Graduate Degree | $97,917 | $53,750 |
| Total | $56,208 | $25,500 |
Family Income in Bridgman
Family Income Brackets in Bridgman
According to the Bridgman family income data, there are 129 families falling into the $100,000 to $149,999 income range, which is the most common income bracket and makes up 21.1% of all families.
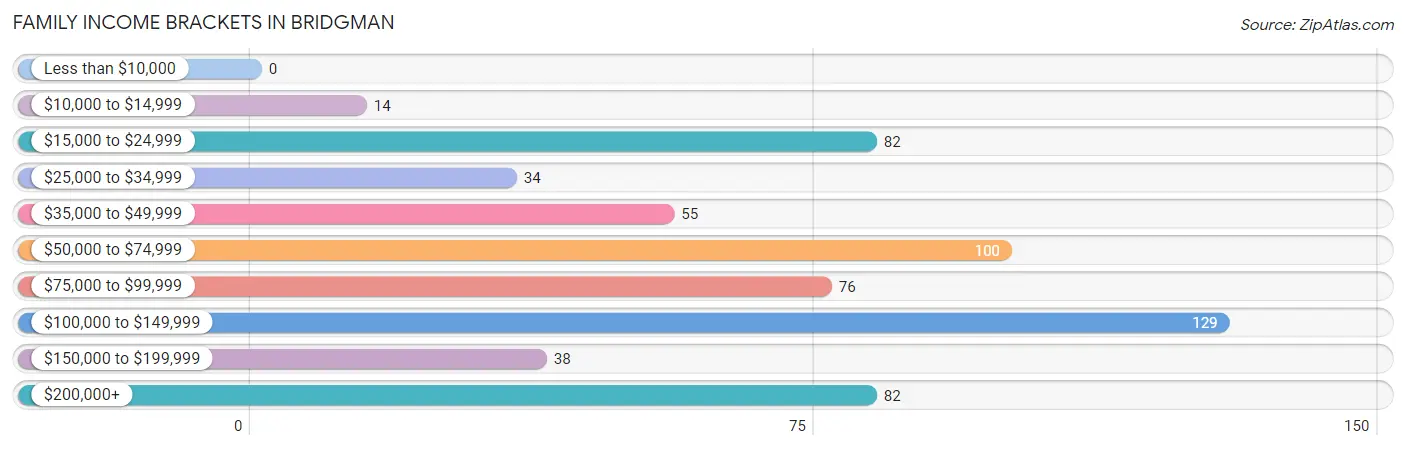
| Income Bracket | # Families | % Families |
| Less than $10,000 | 0 | 0.0% |
| $10,000 to $14,999 | 14 | 2.3% |
| $15,000 to $24,999 | 82 | 13.4% |
| $25,000 to $34,999 | 34 | 5.6% |
| $35,000 to $49,999 | 55 | 9.0% |
| $50,000 to $74,999 | 100 | 16.4% |
| $75,000 to $99,999 | 76 | 12.5% |
| $100,000 to $149,999 | 129 | 21.1% |
| $150,000 to $199,999 | 38 | 6.2% |
| $200,000+ | 82 | 13.4% |
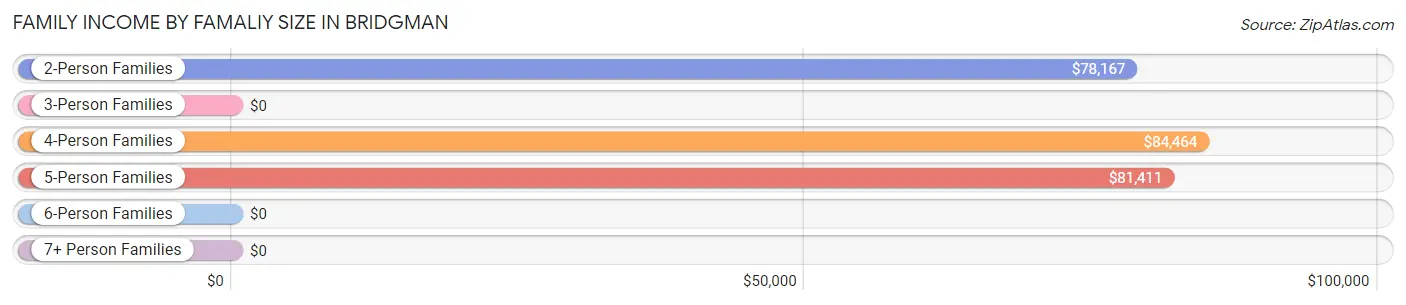
Family Income by Famaliy Size in Bridgman
4-person families (81 | 13.3%) account for the highest median family income in Bridgman with $84,464 per family, while 2-person families (362 | 59.3%) have the highest median income of $39,084 per family member.
| Income Bracket | # Families | Median Income |
| 2-Person Families | 362 (59.3%) | $78,167 |
| 3-Person Families | 105 (17.2%) | $0 |
| 4-Person Families | 81 (13.3%) | $84,464 |
| 5-Person Families | 59 (9.7%) | $81,411 |
| 6-Person Families | 3 (0.5%) | $0 |
| 7+ Person Families | 0 (0.0%) | $0 |
| Total | 610 (100.0%) | $80,000 |
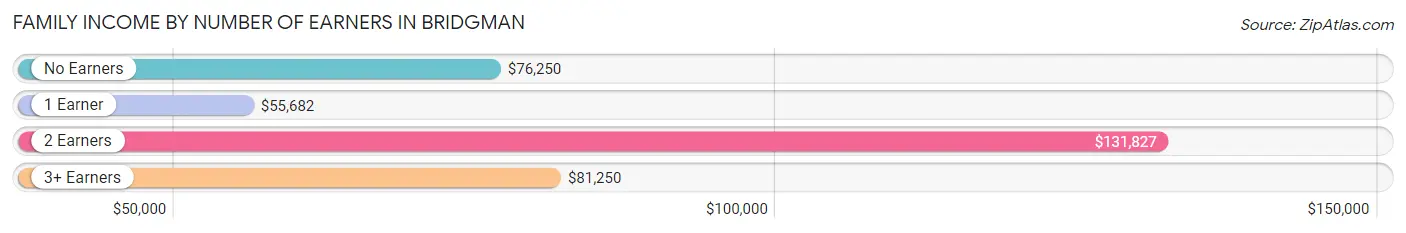
Family Income by Number of Earners in Bridgman
The median family income in Bridgman is $80,000, with families comprising 2 earners (181) having the highest median family income of $131,827, while families with 1 earner (274) have the lowest median family income of $55,682, accounting for 29.7% and 44.9% of families, respectively.
| Number of Earners | # Families | Median Income |
| No Earners | 90 (14.7%) | $76,250 |
| 1 Earner | 274 (44.9%) | $55,682 |
| 2 Earners | 181 (29.7%) | $131,827 |
| 3+ Earners | 65 (10.7%) | $81,250 |
| Total | 610 (100.0%) | $80,000 |
Household Income in Bridgman
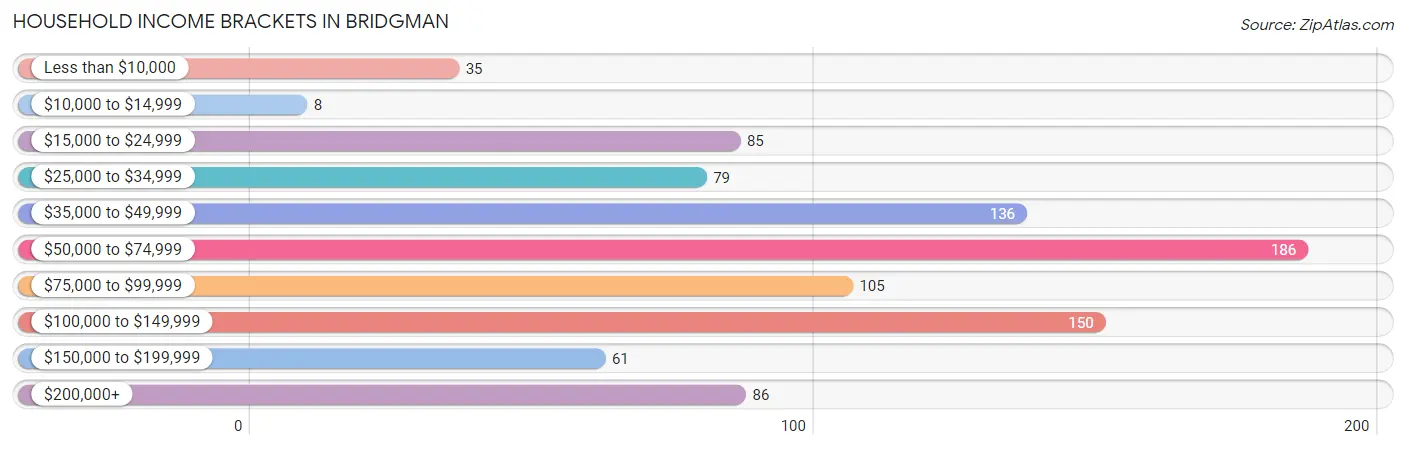
Household Income Brackets in Bridgman
With 186 households falling in the category, the $50,000 to $74,999 income range is the most frequent in Bridgman, accounting for 20.0% of all households. In contrast, only 8 households (0.9%) fall into the $10,000 to $14,999 income bracket, making it the least populous group.
| Income Bracket | # Households | % Households |
| Less than $10,000 | 35 | 3.8% |
| $10,000 to $14,999 | 8 | 0.9% |
| $15,000 to $24,999 | 85 | 9.1% |
| $25,000 to $34,999 | 79 | 8.5% |
| $35,000 to $49,999 | 136 | 14.6% |
| $50,000 to $74,999 | 186 | 20.0% |
| $75,000 to $99,999 | 105 | 11.3% |
| $100,000 to $149,999 | 150 | 16.1% |
| $150,000 to $199,999 | 61 | 6.6% |
| $200,000+ | 86 | 9.2% |
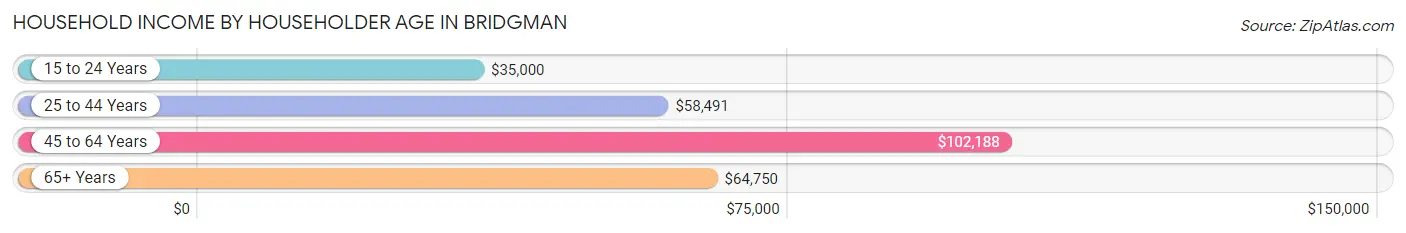
Household Income by Householder Age in Bridgman
The median household income in Bridgman is $62,337, with the highest median household income of $102,188 found in the 45 to 64 years age bracket for the primary householder. A total of 303 households (32.6%) fall into this category. Meanwhile, the 15 to 24 years age bracket for the primary householder has the lowest median household income of $35,000, with 24 households (2.6%) in this group.
| Income Bracket | # Households | Median Income |
| 15 to 24 Years | 24 (2.6%) | $35,000 |
| 25 to 44 Years | 307 (33.0%) | $58,491 |
| 45 to 64 Years | 303 (32.6%) | $102,188 |
| 65+ Years | 297 (31.9%) | $64,750 |
| Total | 931 (100.0%) | $62,337 |
Poverty in Bridgman
Income Below Poverty by Sex and Age in Bridgman
With 9.0% poverty level for males and 11.0% for females among the residents of Bridgman, 5 year old males and under 5 year old females are the most vulnerable to poverty, with 33 males (41.8%) and 16 females (50.0%) in their respective age groups living below the poverty level.
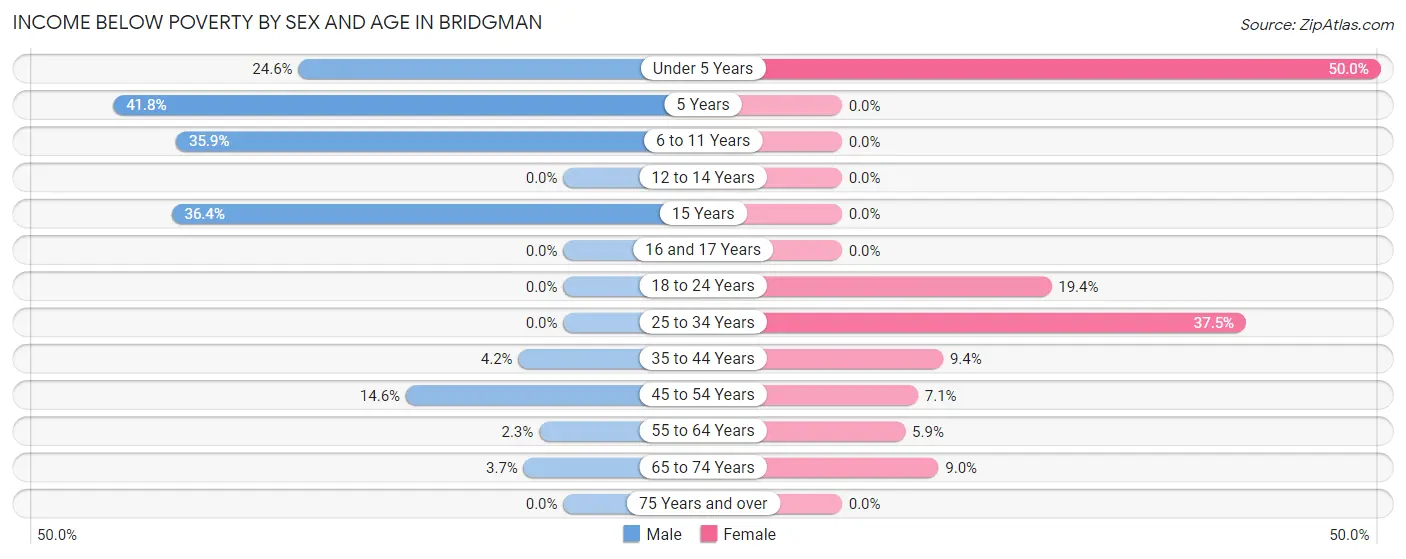
| Age Bracket | Male | Female |
| Under 5 Years | 15 (24.6%) | 16 (50.0%) |
| 5 Years | 33 (41.8%) | 0 (0.0%) |
| 6 to 11 Years | 23 (35.9%) | 0 (0.0%) |
| 12 to 14 Years | 0 (0.0%) | 0 (0.0%) |
| 15 Years | 4 (36.4%) | 0 (0.0%) |
| 16 and 17 Years | 0 (0.0%) | 0 (0.0%) |
| 18 to 24 Years | 0 (0.0%) | 7 (19.4%) |
| 25 to 34 Years | 0 (0.0%) | 36 (37.5%) |
| 35 to 44 Years | 5 (4.2%) | 26 (9.4%) |
| 45 to 54 Years | 13 (14.6%) | 6 (7.1%) |
| 55 to 64 Years | 4 (2.2%) | 9 (5.9%) |
| 65 to 74 Years | 7 (3.7%) | 19 (9.0%) |
| 75 Years and over | 0 (0.0%) | 0 (0.0%) |
| Total | 104 (9.0%) | 119 (11.0%) |
Income Above Poverty by Sex and Age in Bridgman
According to the poverty statistics in Bridgman, males aged 12 to 14 years and females aged 5 years are the age groups that are most secure financially, with 100.0% of males and 100.0% of females in these age groups living above the poverty line.
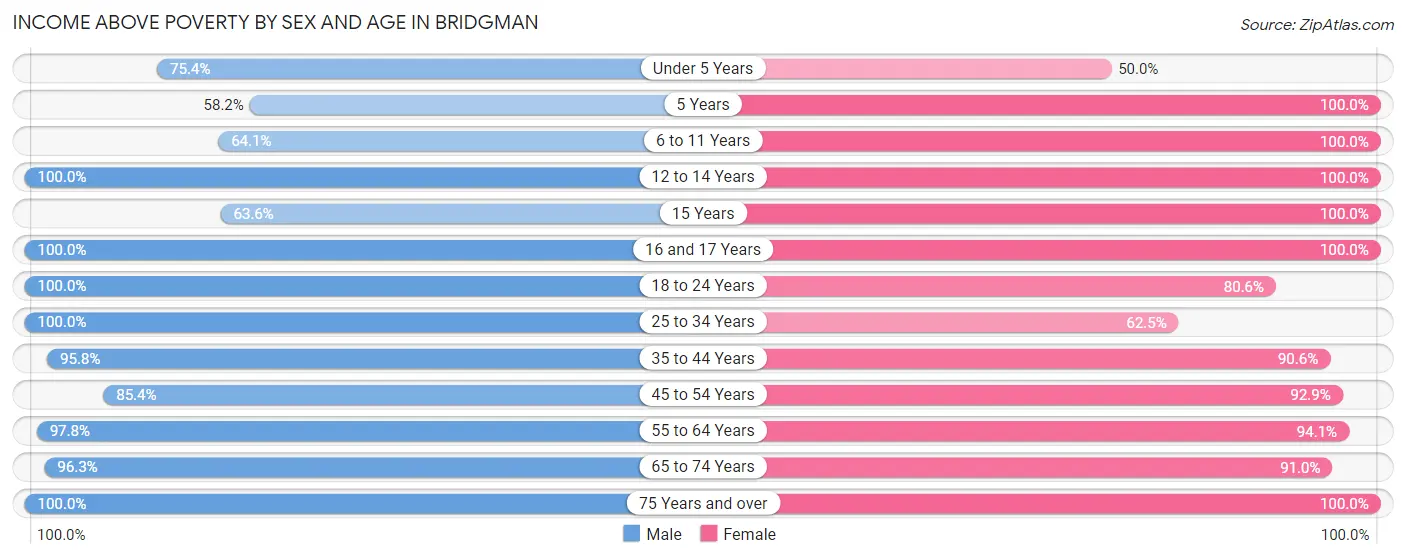
| Age Bracket | Male | Female |
| Under 5 Years | 46 (75.4%) | 16 (50.0%) |
| 5 Years | 46 (58.2%) | 8 (100.0%) |
| 6 to 11 Years | 41 (64.1%) | 45 (100.0%) |
| 12 to 14 Years | 54 (100.0%) | 36 (100.0%) |
| 15 Years | 7 (63.6%) | 11 (100.0%) |
| 16 and 17 Years | 72 (100.0%) | 37 (100.0%) |
| 18 to 24 Years | 67 (100.0%) | 29 (80.6%) |
| 25 to 34 Years | 119 (100.0%) | 60 (62.5%) |
| 35 to 44 Years | 115 (95.8%) | 251 (90.6%) |
| 45 to 54 Years | 76 (85.4%) | 79 (92.9%) |
| 55 to 64 Years | 174 (97.8%) | 144 (94.1%) |
| 65 to 74 Years | 183 (96.3%) | 193 (91.0%) |
| 75 Years and over | 51 (100.0%) | 53 (100.0%) |
| Total | 1,051 (91.0%) | 962 (89.0%) |
Income Below Poverty Among Married-Couple Families in Bridgman
The poverty statistics for married-couple families in Bridgman show that 2.1% or 9 of the total 433 families live below the poverty line. Families with 1 or 2 children have the highest poverty rate of 10.5%, comprising of 6 families. On the other hand, families with no children have the lowest poverty rate of 0.0%, which includes 0 families.
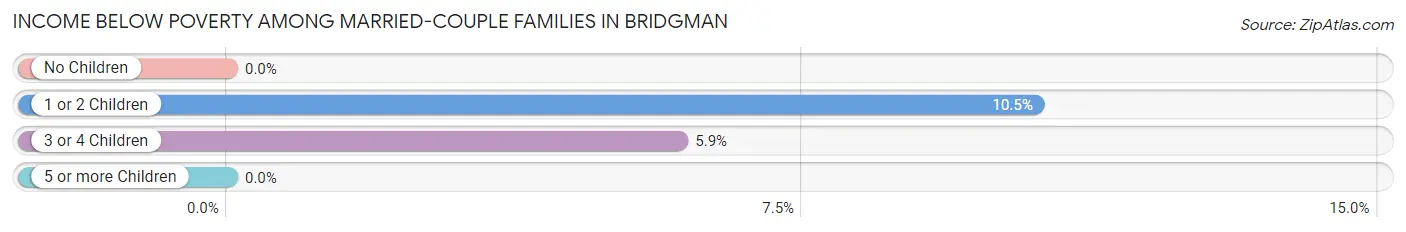
| Children | Above Poverty | Below Poverty |
| No Children | 325 (100.0%) | 0 (0.0%) |
| 1 or 2 Children | 51 (89.5%) | 6 (10.5%) |
| 3 or 4 Children | 48 (94.1%) | 3 (5.9%) |
| 5 or more Children | 0 (0.0%) | 0 (0.0%) |
| Total | 424 (97.9%) | 9 (2.1%) |
Income Below Poverty Among Single-Parent Households in Bridgman
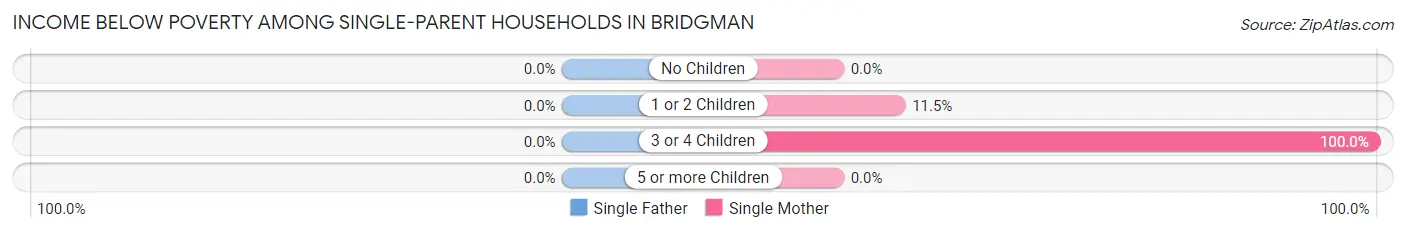
| Children | Single Father | Single Mother |
| No Children | 0 (0.0%) | 0 (0.0%) |
| 1 or 2 Children | 0 (0.0%) | 11 (11.5%) |
| 3 or 4 Children | 0 (0.0%) | 18 (100.0%) |
| 5 or more Children | 0 (0.0%) | 0 (0.0%) |
| Total | 0 (0.0%) | 29 (25.4%) |
Income Below Poverty Among Married-Couple vs Single-Parent Households in Bridgman
The poverty data for Bridgman shows that 9 of the married-couple family households (2.1%) and 29 of the single-parent households (16.4%) are living below the poverty level. Within the married-couple family households, those with 1 or 2 children have the highest poverty rate, with 6 households (10.5%) falling below the poverty line. Among the single-parent households, those with 3 or 4 children have the highest poverty rate, with 18 household (100.0%) living below poverty.
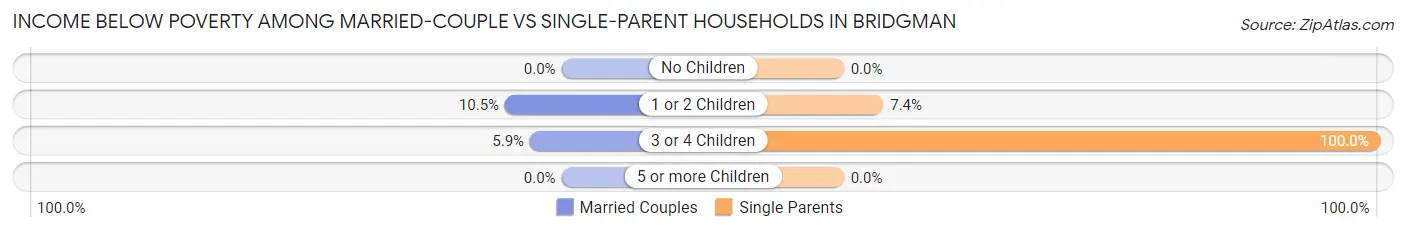
| Children | Married-Couple Families | Single-Parent Households |
| No Children | 0 (0.0%) | 0 (0.0%) |
| 1 or 2 Children | 6 (10.5%) | 11 (7.4%) |
| 3 or 4 Children | 3 (5.9%) | 18 (100.0%) |
| 5 or more Children | 0 (0.0%) | 0 (0.0%) |
| Total | 9 (2.1%) | 29 (16.4%) |
Employment Characteristics in Bridgman
Employment by Class of Employer in Bridgman
Among the 1,080 employed individuals in Bridgman, private company employees (745 | 69.0%), self-employed (not incorporated) (103 | 9.5%), and not-for-profit organizations (76 | 7.0%) make up the most common classes of employment.
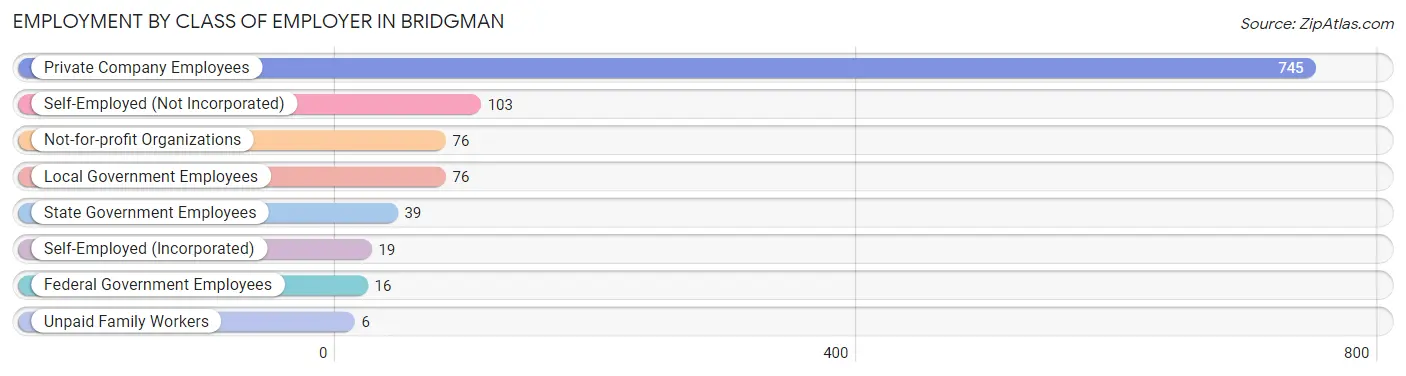
| Employer Class | # Employees | % Employees |
| Private Company Employees | 745 | 69.0% |
| Self-Employed (Incorporated) | 19 | 1.8% |
| Self-Employed (Not Incorporated) | 103 | 9.5% |
| Not-for-profit Organizations | 76 | 7.0% |
| Local Government Employees | 76 | 7.0% |
| State Government Employees | 39 | 3.6% |
| Federal Government Employees | 16 | 1.5% |
| Unpaid Family Workers | 6 | 0.6% |
| Total | 1,080 | 100.0% |
Employment Status by Age in Bridgman
According to the labor force statistics for Bridgman, out of the total population over 16 years of age (1,919), 58.1% or 1,115 individuals are in the labor force, with 1.7% or 19 of them unemployed. The age group with the highest labor force participation rate is 30 to 34 years, with 93.9% or 92 individuals in the labor force. Within the labor force, the 45 to 54 years age range has the highest percentage of unemployed individuals, with 4.2% or 7 of them being unemployed.
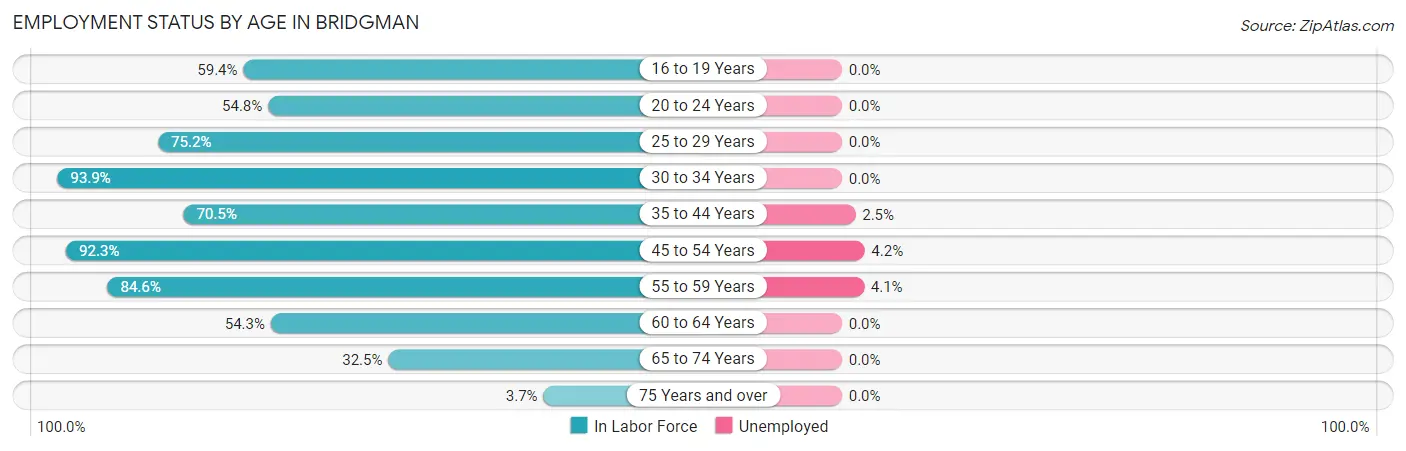
| Age Bracket | In Labor Force | Unemployed |
| 16 to 19 Years | 76 (59.4%) | 0 (0.0%) |
| 20 to 24 Years | 46 (54.8%) | 0 (0.0%) |
| 25 to 29 Years | 88 (75.2%) | 0 (0.0%) |
| 30 to 34 Years | 92 (93.9%) | 0 (0.0%) |
| 35 to 44 Years | 280 (70.5%) | 7 (2.5%) |
| 45 to 54 Years | 168 (92.3%) | 7 (4.2%) |
| 55 to 59 Years | 121 (84.6%) | 5 (4.1%) |
| 60 to 64 Years | 102 (54.3%) | 0 (0.0%) |
| 65 to 74 Years | 136 (32.5%) | 0 (0.0%) |
| 75 Years and over | 6 (3.7%) | 0 (0.0%) |
| Total | 1,115 (58.1%) | 19 (1.7%) |
Employment Status by Educational Attainment in Bridgman
According to labor force statistics for Bridgman, 75.6% of individuals (850) out of the total population between 25 and 64 years of age (1,125) are in the labor force, with 2.2% or 19 of them being unemployed. The group with the highest labor force participation rate are those with the educational attainment of high school diploma, with 83.0% or 244 individuals in the labor force. Within the labor force, individuals with high school diploma education have the highest percentage of unemployment, with 4.9% or 12 of them being unemployed.
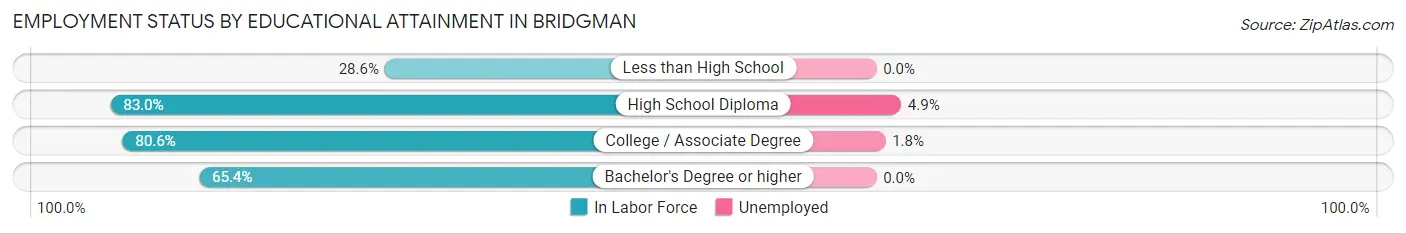
| Educational Attainment | In Labor Force | Unemployed |
| Less than High School | 8 (28.6%) | 0 (0.0%) |
| High School Diploma | 244 (83.0%) | 14 (4.9%) |
| College / Associate Degree | 391 (80.6%) | 9 (1.8%) |
| Bachelor's Degree or higher | 208 (65.4%) | 0 (0.0%) |
| Total | 850 (75.6%) | 25 (2.2%) |
Employment Occupations by Sex in Bridgman
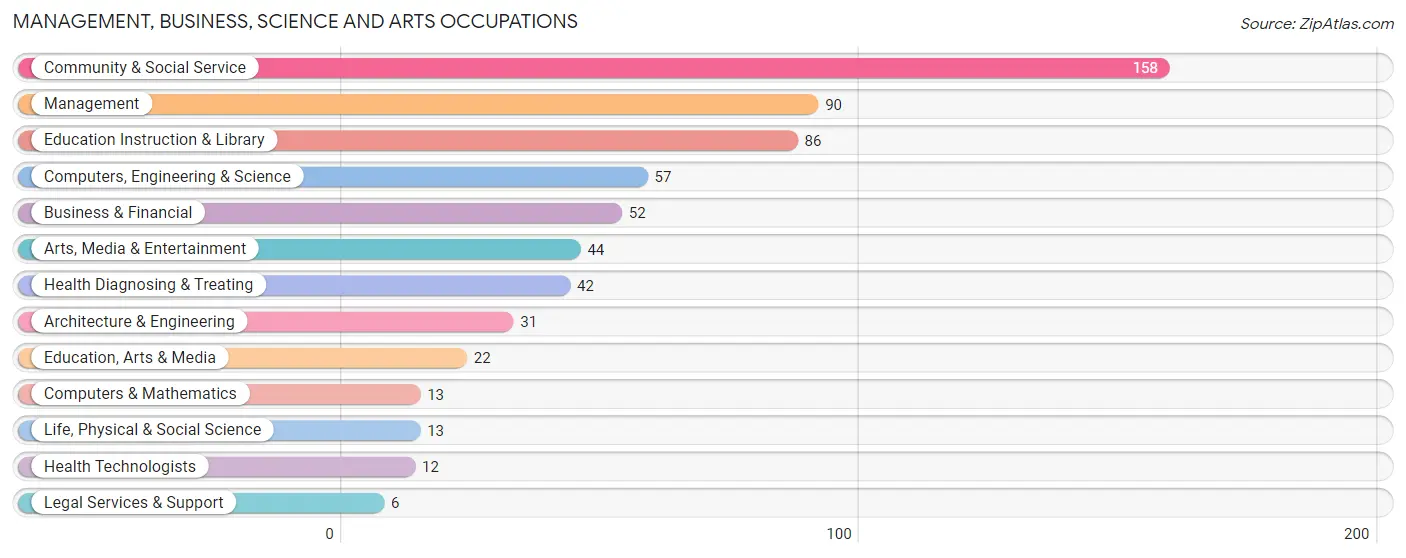
Management, Business, Science and Arts Occupations
The most common Management, Business, Science and Arts occupations in Bridgman are Community & Social Service (158 | 14.4%), Management (90 | 8.2%), Education Instruction & Library (86 | 7.9%), Computers, Engineering & Science (57 | 5.2%), and Business & Financial (52 | 4.7%).
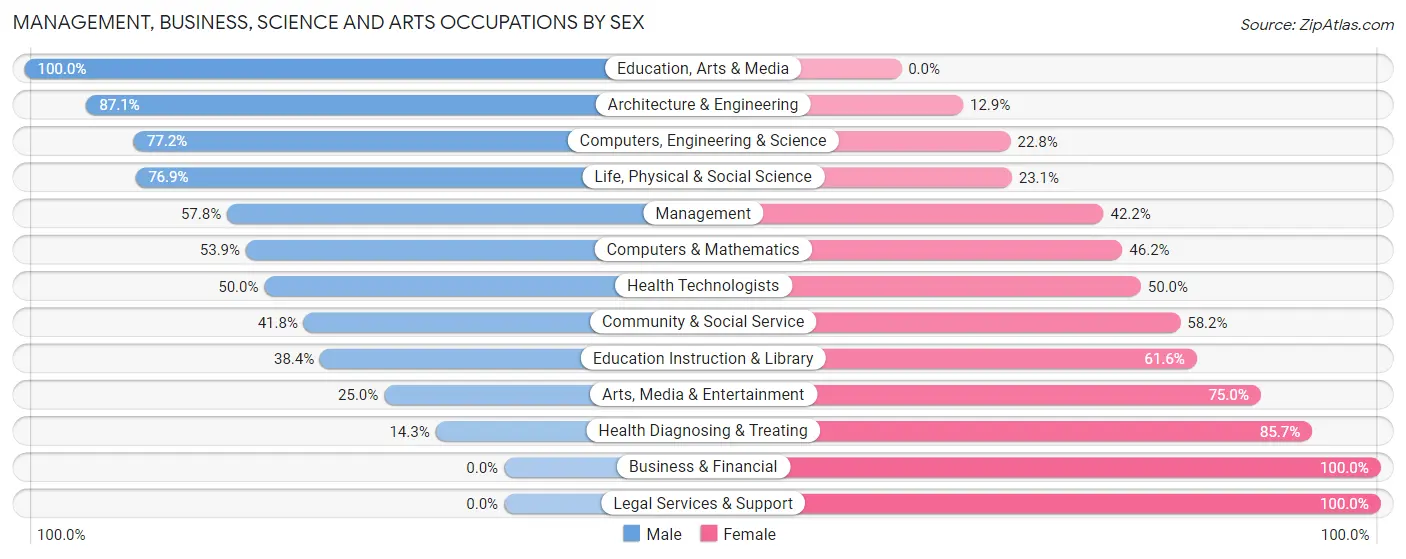
Management, Business, Science and Arts Occupations by Sex
Within the Management, Business, Science and Arts occupations in Bridgman, the most male-oriented occupations are Education, Arts & Media (100.0%), Architecture & Engineering (87.1%), and Computers, Engineering & Science (77.2%), while the most female-oriented occupations are Business & Financial (100.0%), Legal Services & Support (100.0%), and Health Diagnosing & Treating (85.7%).
| Occupation | Male | Female |
| Management | 52 (57.8%) | 38 (42.2%) |
| Business & Financial | 0 (0.0%) | 52 (100.0%) |
| Computers, Engineering & Science | 44 (77.2%) | 13 (22.8%) |
| Computers & Mathematics | 7 (53.8%) | 6 (46.2%) |
| Architecture & Engineering | 27 (87.1%) | 4 (12.9%) |
| Life, Physical & Social Science | 10 (76.9%) | 3 (23.1%) |
| Community & Social Service | 66 (41.8%) | 92 (58.2%) |
| Education, Arts & Media | 22 (100.0%) | 0 (0.0%) |
| Legal Services & Support | 0 (0.0%) | 6 (100.0%) |
| Education Instruction & Library | 33 (38.4%) | 53 (61.6%) |
| Arts, Media & Entertainment | 11 (25.0%) | 33 (75.0%) |
| Health Diagnosing & Treating | 6 (14.3%) | 36 (85.7%) |
| Health Technologists | 6 (50.0%) | 6 (50.0%) |
| Total (Category) | 168 (42.1%) | 231 (57.9%) |
| Total (Overall) | 556 (50.7%) | 540 (49.3%) |
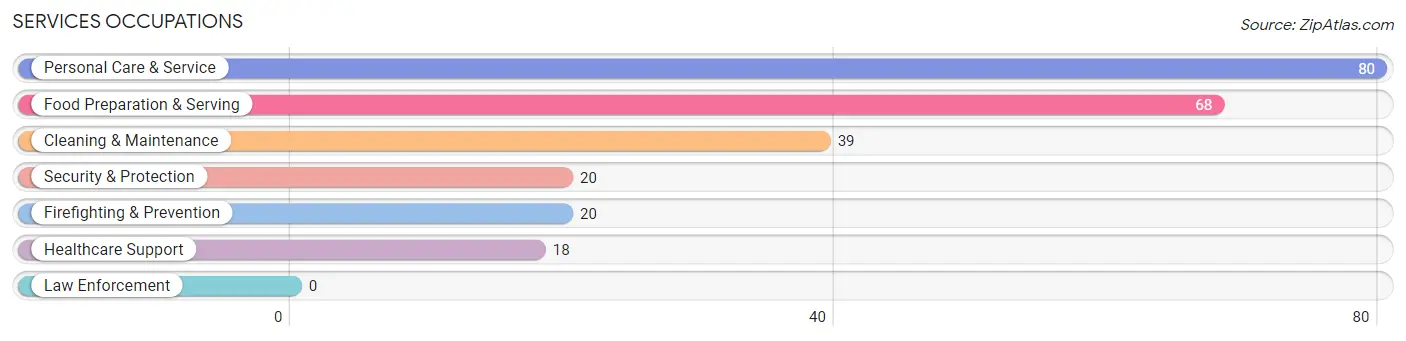
Services Occupations
The most common Services occupations in Bridgman are Personal Care & Service (80 | 7.3%), Food Preparation & Serving (68 | 6.2%), Cleaning & Maintenance (39 | 3.6%), Security & Protection (20 | 1.8%), and Firefighting & Prevention (20 | 1.8%).
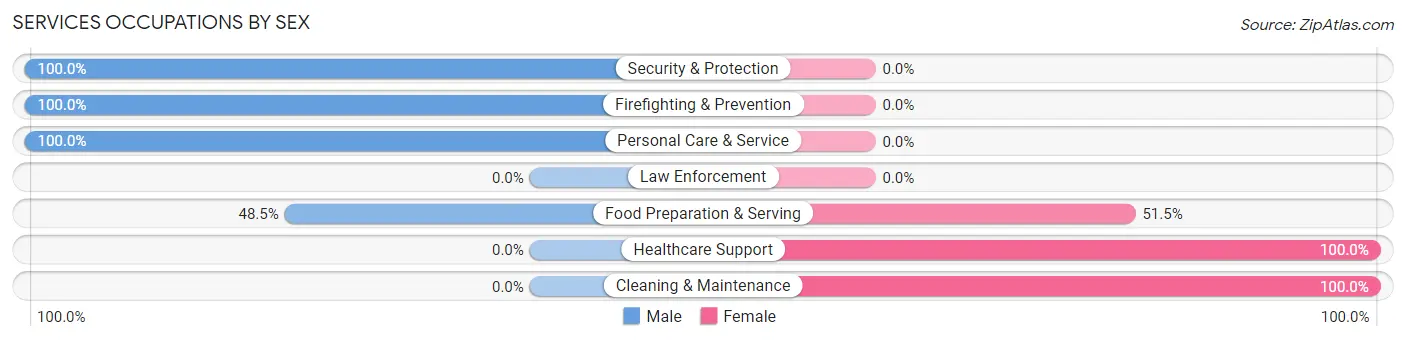
Services Occupations by Sex
Within the Services occupations in Bridgman, the most male-oriented occupations are Security & Protection (100.0%), Firefighting & Prevention (100.0%), and Personal Care & Service (100.0%), while the most female-oriented occupations are Healthcare Support (100.0%), Cleaning & Maintenance (100.0%), and Food Preparation & Serving (51.5%).
| Occupation | Male | Female |
| Healthcare Support | 0 (0.0%) | 18 (100.0%) |
| Security & Protection | 20 (100.0%) | 0 (0.0%) |
| Firefighting & Prevention | 20 (100.0%) | 0 (0.0%) |
| Law Enforcement | 0 (0.0%) | 0 (0.0%) |
| Food Preparation & Serving | 33 (48.5%) | 35 (51.5%) |
| Cleaning & Maintenance | 0 (0.0%) | 39 (100.0%) |
| Personal Care & Service | 80 (100.0%) | 0 (0.0%) |
| Total (Category) | 133 (59.1%) | 92 (40.9%) |
| Total (Overall) | 556 (50.7%) | 540 (49.3%) |
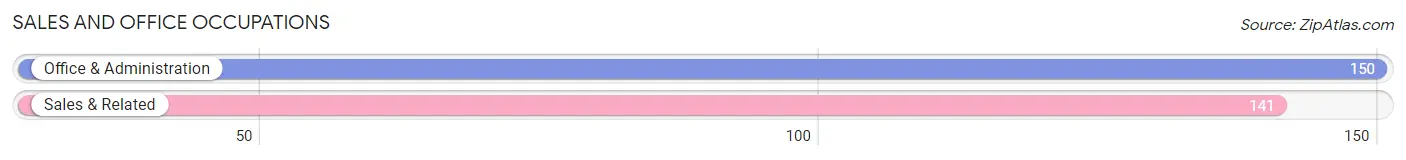
Sales and Office Occupations
The most common Sales and Office occupations in Bridgman are Office & Administration (150 | 13.7%), and Sales & Related (141 | 12.9%).
Sales and Office Occupations by Sex
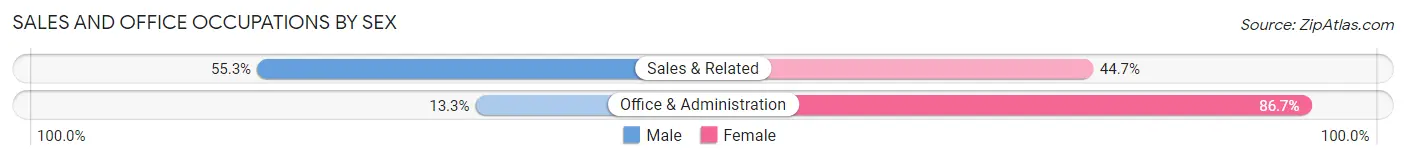
| Occupation | Male | Female |
| Sales & Related | 78 (55.3%) | 63 (44.7%) |
| Office & Administration | 20 (13.3%) | 130 (86.7%) |
| Total (Category) | 98 (33.7%) | 193 (66.3%) |
| Total (Overall) | 556 (50.7%) | 540 (49.3%) |
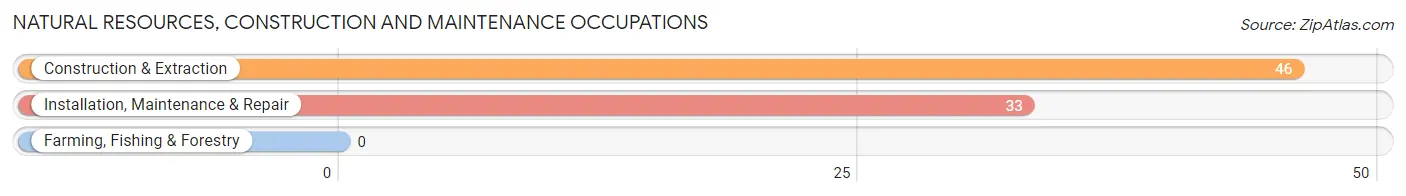
Natural Resources, Construction and Maintenance Occupations
The most common Natural Resources, Construction and Maintenance occupations in Bridgman are Construction & Extraction (46 | 4.2%), and Installation, Maintenance & Repair (33 | 3.0%).
Natural Resources, Construction and Maintenance Occupations by Sex
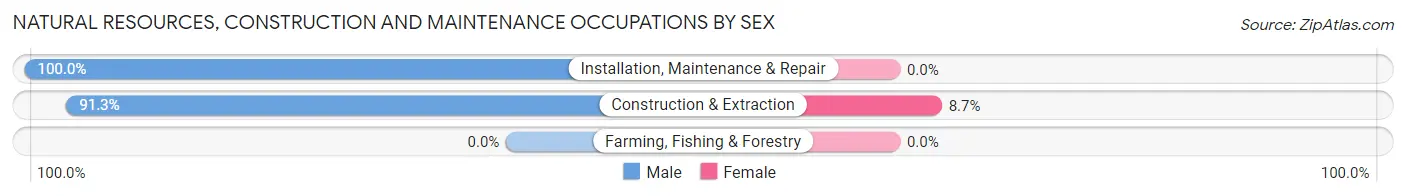
| Occupation | Male | Female |
| Farming, Fishing & Forestry | 0 (0.0%) | 0 (0.0%) |
| Construction & Extraction | 42 (91.3%) | 4 (8.7%) |
| Installation, Maintenance & Repair | 33 (100.0%) | 0 (0.0%) |
| Total (Category) | 75 (94.9%) | 4 (5.1%) |
| Total (Overall) | 556 (50.7%) | 540 (49.3%) |
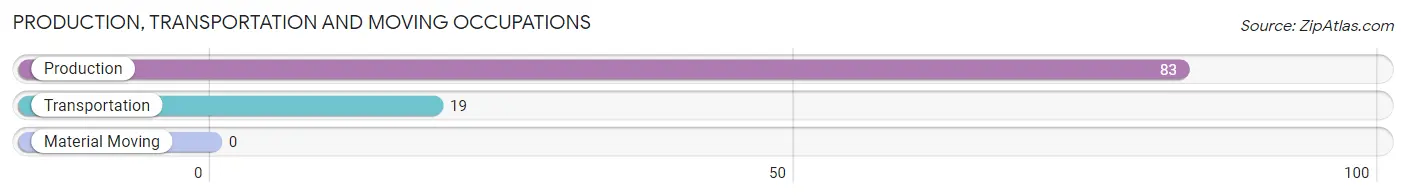
Production, Transportation and Moving Occupations
The most common Production, Transportation and Moving occupations in Bridgman are Production (83 | 7.6%), and Transportation (19 | 1.7%).
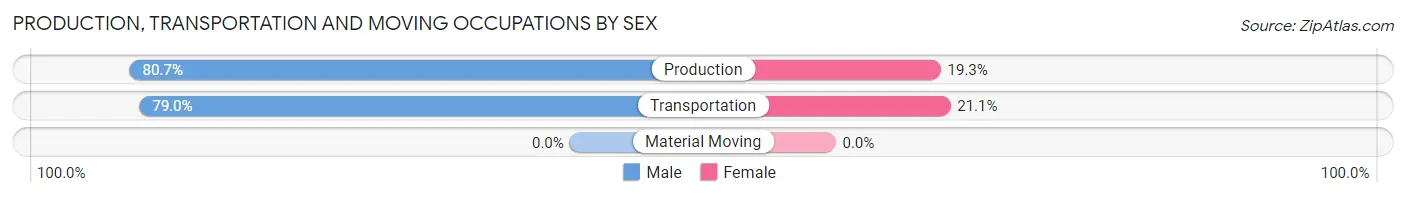
Production, Transportation and Moving Occupations by Sex
| Occupation | Male | Female |
| Production | 67 (80.7%) | 16 (19.3%) |
| Transportation | 15 (78.9%) | 4 (21.0%) |
| Material Moving | 0 (0.0%) | 0 (0.0%) |
| Total (Category) | 82 (80.4%) | 20 (19.6%) |
| Total (Overall) | 556 (50.7%) | 540 (49.3%) |
Employment Industries by Sex in Bridgman
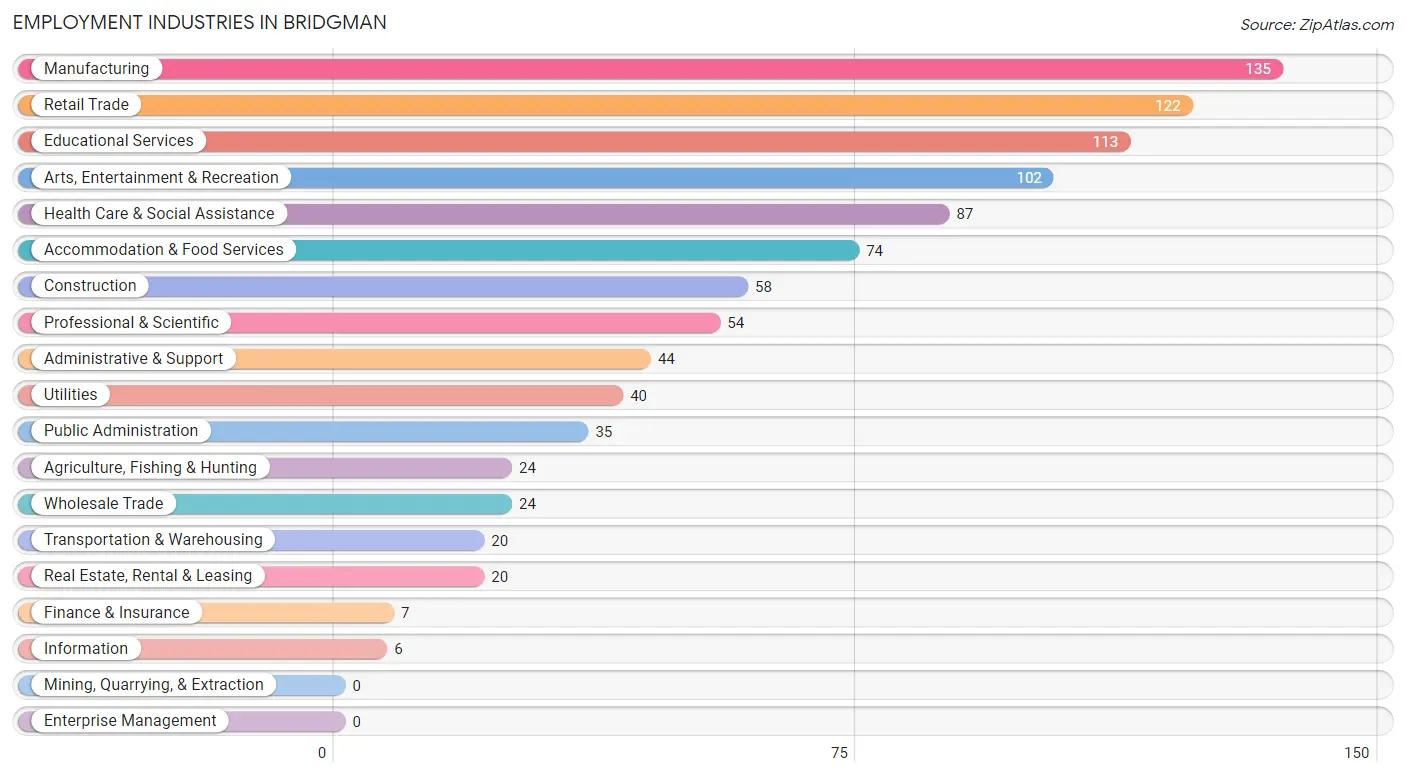
Employment Industries in Bridgman
The major employment industries in Bridgman include Manufacturing (135 | 12.3%), Retail Trade (122 | 11.1%), Educational Services (113 | 10.3%), Arts, Entertainment & Recreation (102 | 9.3%), and Health Care & Social Assistance (87 | 7.9%).
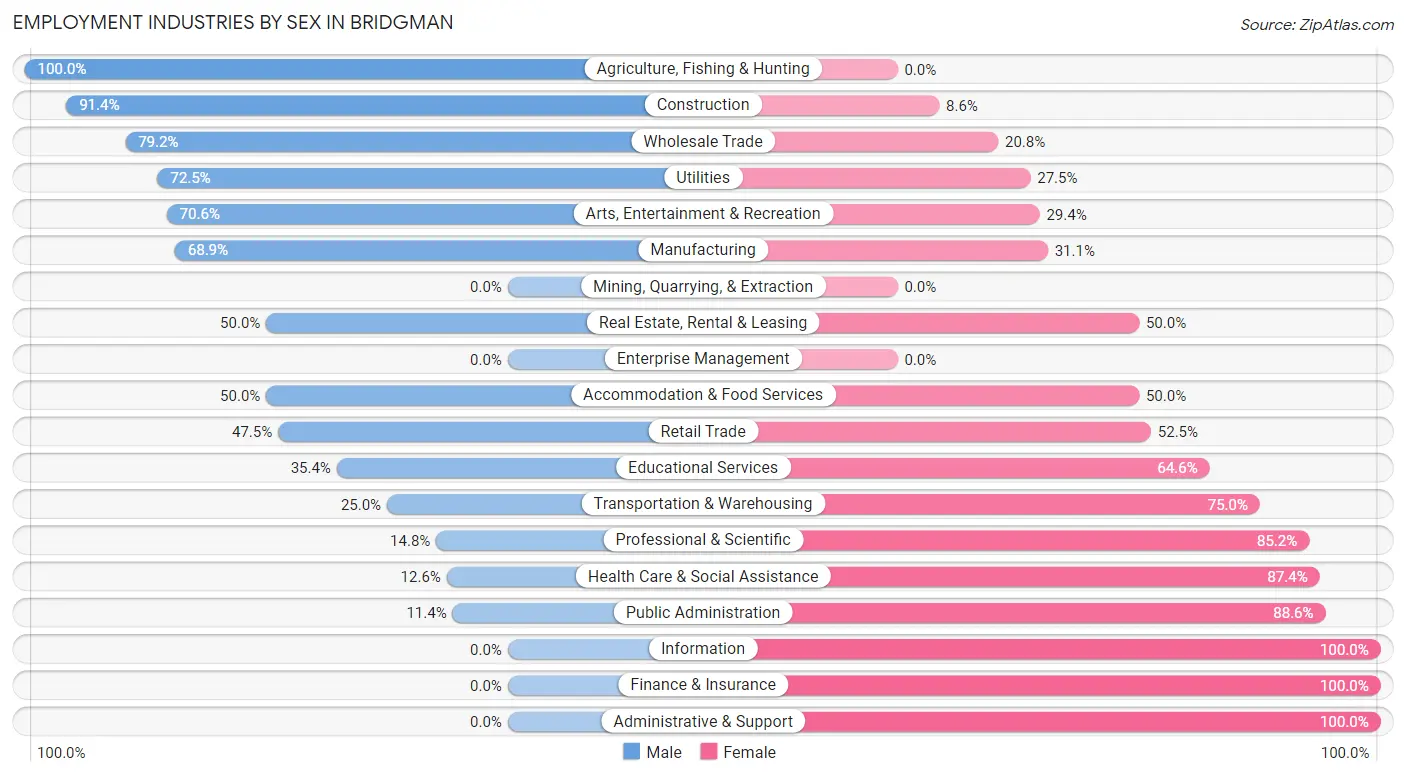
Employment Industries by Sex in Bridgman
The Bridgman industries that see more men than women are Agriculture, Fishing & Hunting (100.0%), Construction (91.4%), and Wholesale Trade (79.2%), whereas the industries that tend to have a higher number of women are Information (100.0%), Finance & Insurance (100.0%), and Administrative & Support (100.0%).
| Industry | Male | Female |
| Agriculture, Fishing & Hunting | 24 (100.0%) | 0 (0.0%) |
| Mining, Quarrying, & Extraction | 0 (0.0%) | 0 (0.0%) |
| Construction | 53 (91.4%) | 5 (8.6%) |
| Manufacturing | 93 (68.9%) | 42 (31.1%) |
| Wholesale Trade | 19 (79.2%) | 5 (20.8%) |
| Retail Trade | 58 (47.5%) | 64 (52.5%) |
| Transportation & Warehousing | 5 (25.0%) | 15 (75.0%) |
| Utilities | 29 (72.5%) | 11 (27.5%) |
| Information | 0 (0.0%) | 6 (100.0%) |
| Finance & Insurance | 0 (0.0%) | 7 (100.0%) |
| Real Estate, Rental & Leasing | 10 (50.0%) | 10 (50.0%) |
| Professional & Scientific | 8 (14.8%) | 46 (85.2%) |
| Enterprise Management | 0 (0.0%) | 0 (0.0%) |
| Administrative & Support | 0 (0.0%) | 44 (100.0%) |
| Educational Services | 40 (35.4%) | 73 (64.6%) |
| Health Care & Social Assistance | 11 (12.6%) | 76 (87.4%) |
| Arts, Entertainment & Recreation | 72 (70.6%) | 30 (29.4%) |
| Accommodation & Food Services | 37 (50.0%) | 37 (50.0%) |
| Public Administration | 4 (11.4%) | 31 (88.6%) |
| Total | 556 (50.7%) | 540 (49.3%) |
Education in Bridgman
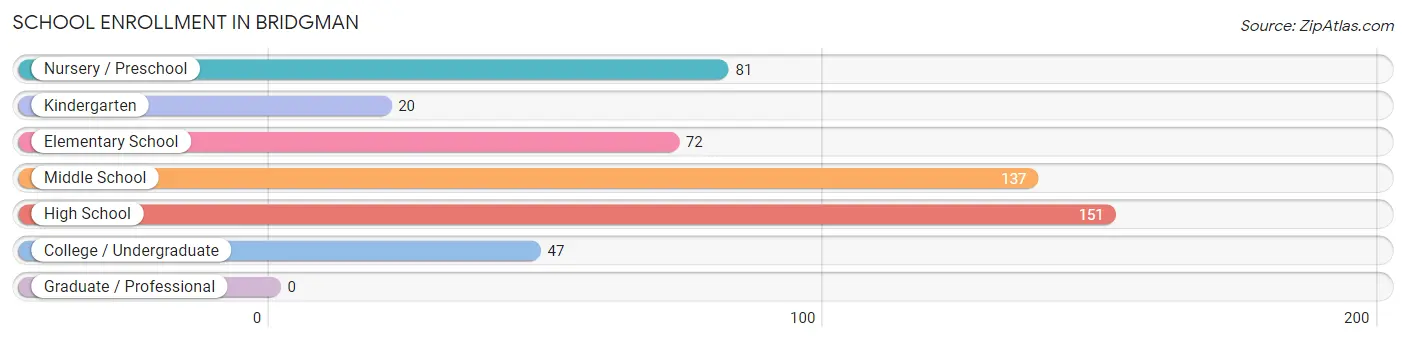
School Enrollment in Bridgman
The most common levels of schooling among the 508 students in Bridgman are high school (151 | 29.7%), middle school (137 | 27.0%), and nursery / preschool (81 | 15.9%).
| School Level | # Students | % Students |
| Nursery / Preschool | 81 | 15.9% |
| Kindergarten | 20 | 3.9% |
| Elementary School | 72 | 14.2% |
| Middle School | 137 | 27.0% |
| High School | 151 | 29.7% |
| College / Undergraduate | 47 | 9.2% |
| Graduate / Professional | 0 | 0.0% |
| Total | 508 | 100.0% |
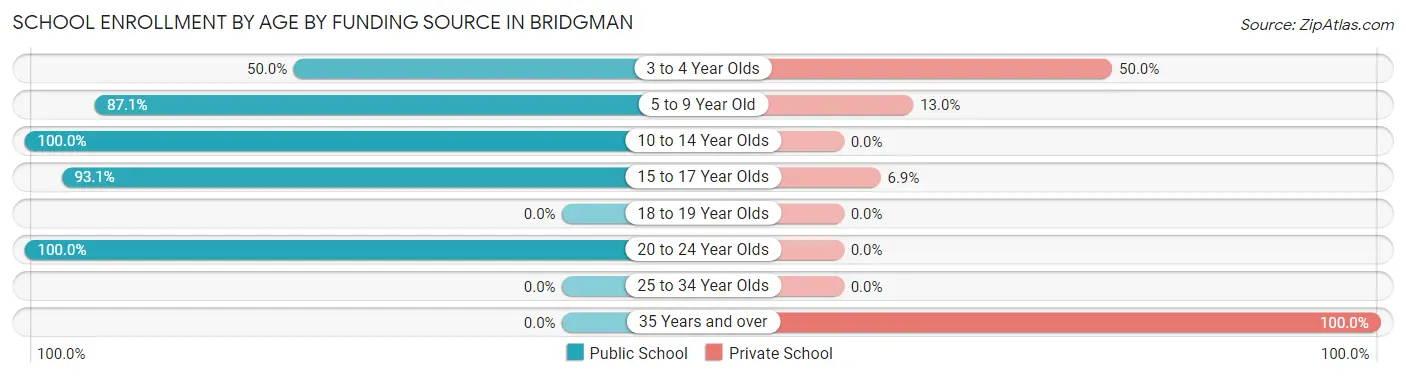
School Enrollment by Age by Funding Source in Bridgman
Out of a total of 508 students who are enrolled in schools in Bridgman, 40 (7.9%) attend a private institution, while the remaining 468 (92.1%) are enrolled in public schools. The age group of 35 years and over has the highest likelihood of being enrolled in private schools, with 6 (100.0% in the age bracket) enrolled. Conversely, the age group of 10 to 14 year olds has the lowest likelihood of being enrolled in a private school, with 177 (100.0% in the age bracket) attending a public institution.
| Age Bracket | Public School | Private School |
| 3 to 4 Year Olds | 7 (50.0%) | 7 (50.0%) |
| 5 to 9 Year Old | 121 (87.1%) | 18 (13.0%) |
| 10 to 14 Year Olds | 177 (100.0%) | 0 (0.0%) |
| 15 to 17 Year Olds | 122 (93.1%) | 9 (6.9%) |
| 18 to 19 Year Olds | 0 (0.0%) | 0 (0.0%) |
| 20 to 24 Year Olds | 41 (100.0%) | 0 (0.0%) |
| 25 to 34 Year Olds | 0 (0.0%) | 0 (0.0%) |
| 35 Years and over | 0 (0.0%) | 6 (100.0%) |
| Total | 468 (92.1%) | 40 (7.9%) |
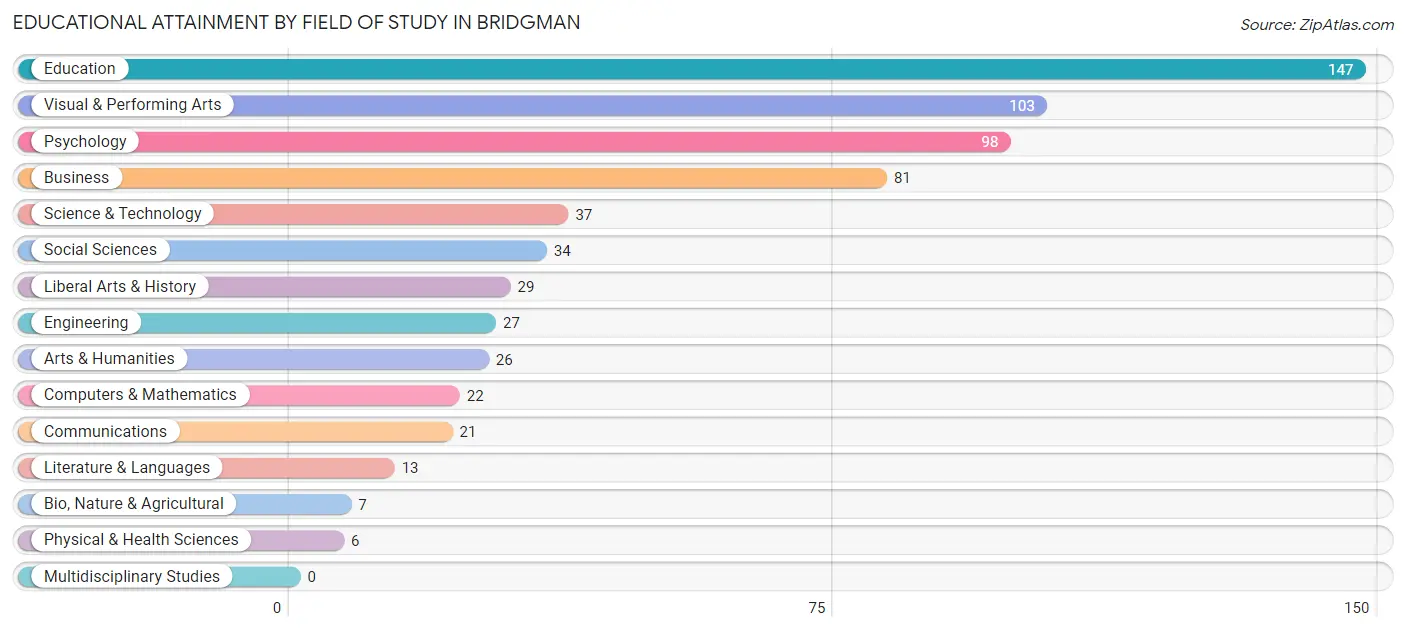
Educational Attainment by Field of Study in Bridgman
Education (147 | 22.6%), visual & performing arts (103 | 15.8%), psychology (98 | 15.0%), business (81 | 12.4%), and science & technology (37 | 5.7%) are the most common fields of study among 651 individuals in Bridgman who have obtained a bachelor's degree or higher.
| Field of Study | # Graduates | % Graduates |
| Computers & Mathematics | 22 | 3.4% |
| Bio, Nature & Agricultural | 7 | 1.1% |
| Physical & Health Sciences | 6 | 0.9% |
| Psychology | 98 | 15.0% |
| Social Sciences | 34 | 5.2% |
| Engineering | 27 | 4.2% |
| Multidisciplinary Studies | 0 | 0.0% |
| Science & Technology | 37 | 5.7% |
| Business | 81 | 12.4% |
| Education | 147 | 22.6% |
| Literature & Languages | 13 | 2.0% |
| Liberal Arts & History | 29 | 4.4% |
| Visual & Performing Arts | 103 | 15.8% |
| Communications | 21 | 3.2% |
| Arts & Humanities | 26 | 4.0% |
| Total | 651 | 100.0% |
Transportation & Commute in Bridgman
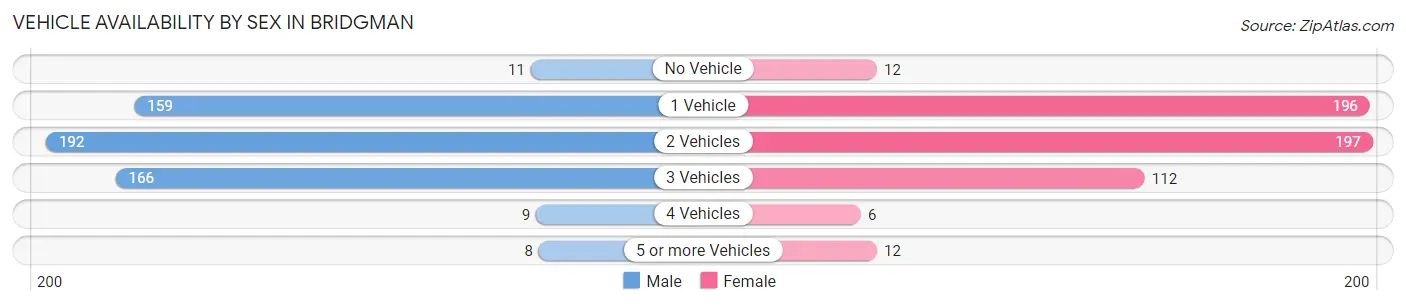
Vehicle Availability by Sex in Bridgman
The most prevalent vehicle ownership categories in Bridgman are males with 2 vehicles (192, accounting for 35.2%) and females with 2 vehicles (197, making up 35.9%).
| Vehicles Available | Male | Female |
| No Vehicle | 11 (2.0%) | 12 (2.2%) |
| 1 Vehicle | 159 (29.2%) | 196 (36.6%) |
| 2 Vehicles | 192 (35.2%) | 197 (36.8%) |
| 3 Vehicles | 166 (30.5%) | 112 (20.9%) |
| 4 Vehicles | 9 (1.7%) | 6 (1.1%) |
| 5 or more Vehicles | 8 (1.5%) | 12 (2.2%) |
| Total | 545 (100.0%) | 535 (100.0%) |
Commute Time in Bridgman
The most frequently occuring commute durations in Bridgman are 5 to 9 minutes (223 commuters, 21.5%), 15 to 19 minutes (174 commuters, 16.8%), and less than 5 minutes (166 commuters, 16.0%).
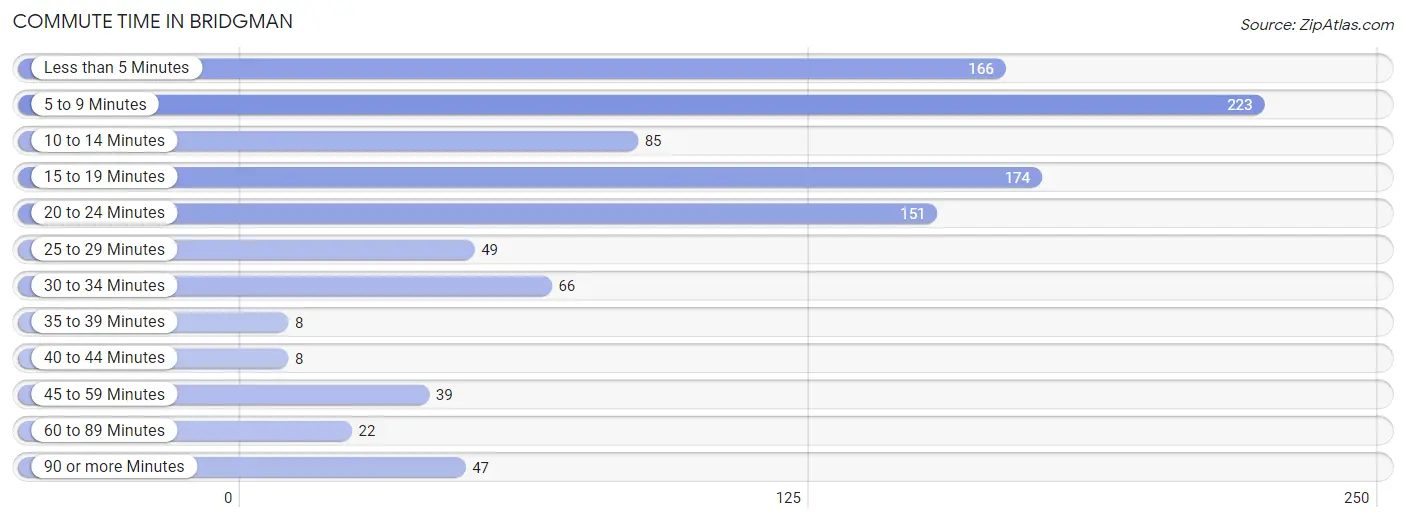
| Commute Time | # Commuters | % Commuters |
| Less than 5 Minutes | 166 | 16.0% |
| 5 to 9 Minutes | 223 | 21.5% |
| 10 to 14 Minutes | 85 | 8.2% |
| 15 to 19 Minutes | 174 | 16.8% |
| 20 to 24 Minutes | 151 | 14.5% |
| 25 to 29 Minutes | 49 | 4.7% |
| 30 to 34 Minutes | 66 | 6.4% |
| 35 to 39 Minutes | 8 | 0.8% |
| 40 to 44 Minutes | 8 | 0.8% |
| 45 to 59 Minutes | 39 | 3.8% |
| 60 to 89 Minutes | 22 | 2.1% |
| 90 or more Minutes | 47 | 4.5% |
Commute Time by Sex in Bridgman
The most common commute times in Bridgman are 15 to 19 minutes (112 commuters, 20.7%) for males and 5 to 9 minutes (129 commuters, 26.0%) for females.
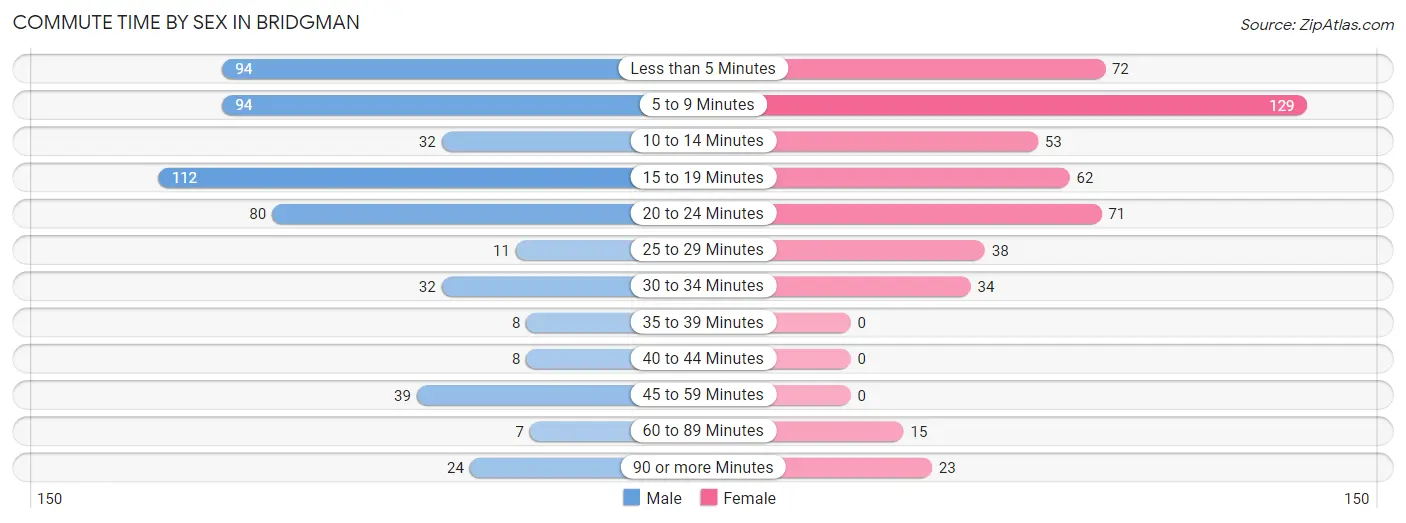
| Commute Time | Male | Female |
| Less than 5 Minutes | 94 (17.4%) | 72 (14.5%) |
| 5 to 9 Minutes | 94 (17.4%) | 129 (26.0%) |
| 10 to 14 Minutes | 32 (5.9%) | 53 (10.7%) |
| 15 to 19 Minutes | 112 (20.7%) | 62 (12.5%) |
| 20 to 24 Minutes | 80 (14.8%) | 71 (14.3%) |
| 25 to 29 Minutes | 11 (2.0%) | 38 (7.6%) |
| 30 to 34 Minutes | 32 (5.9%) | 34 (6.8%) |
| 35 to 39 Minutes | 8 (1.5%) | 0 (0.0%) |
| 40 to 44 Minutes | 8 (1.5%) | 0 (0.0%) |
| 45 to 59 Minutes | 39 (7.2%) | 0 (0.0%) |
| 60 to 89 Minutes | 7 (1.3%) | 15 (3.0%) |
| 90 or more Minutes | 24 (4.4%) | 23 (4.6%) |
Time of Departure to Work by Sex in Bridgman
The most frequent times of departure to work in Bridgman are 9:00 AM to 9:59 AM (93, 17.2%) for males and 8:30 AM to 8:59 AM (75, 15.1%) for females.
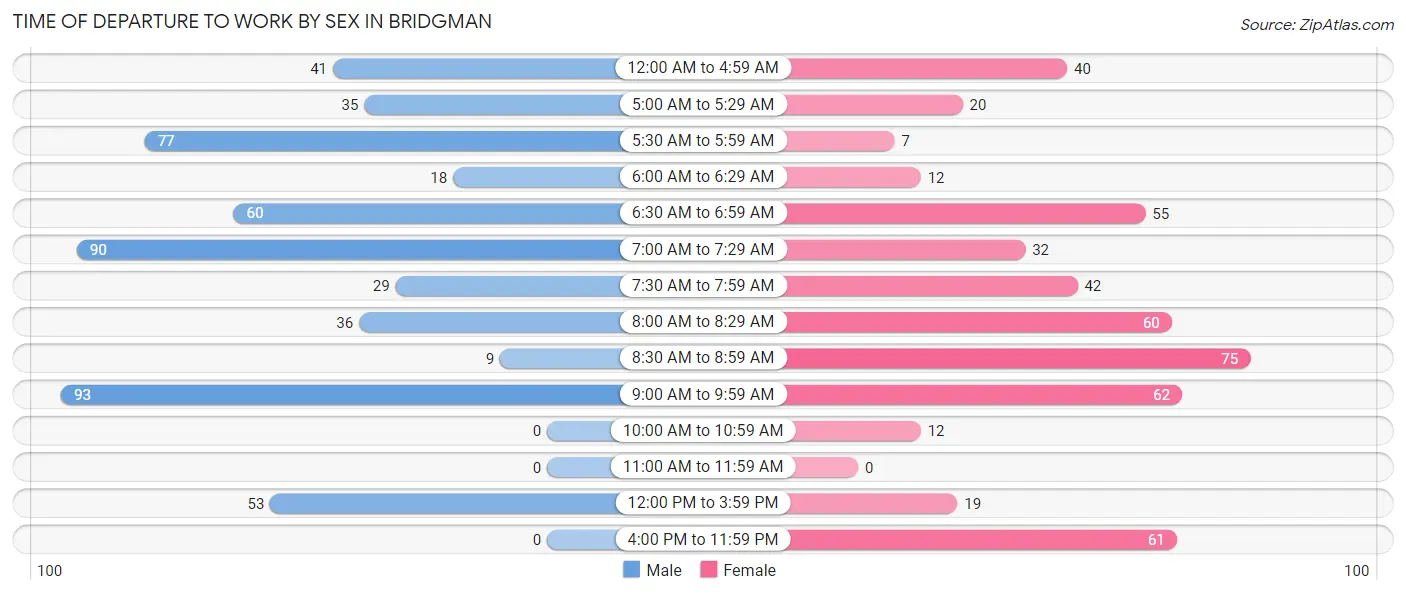
| Time of Departure | Male | Female |
| 12:00 AM to 4:59 AM | 41 (7.6%) | 40 (8.1%) |
| 5:00 AM to 5:29 AM | 35 (6.5%) | 20 (4.0%) |
| 5:30 AM to 5:59 AM | 77 (14.2%) | 7 (1.4%) |
| 6:00 AM to 6:29 AM | 18 (3.3%) | 12 (2.4%) |
| 6:30 AM to 6:59 AM | 60 (11.1%) | 55 (11.1%) |
| 7:00 AM to 7:29 AM | 90 (16.6%) | 32 (6.4%) |
| 7:30 AM to 7:59 AM | 29 (5.4%) | 42 (8.5%) |
| 8:00 AM to 8:29 AM | 36 (6.7%) | 60 (12.1%) |
| 8:30 AM to 8:59 AM | 9 (1.7%) | 75 (15.1%) |
| 9:00 AM to 9:59 AM | 93 (17.2%) | 62 (12.5%) |
| 10:00 AM to 10:59 AM | 0 (0.0%) | 12 (2.4%) |
| 11:00 AM to 11:59 AM | 0 (0.0%) | 0 (0.0%) |
| 12:00 PM to 3:59 PM | 53 (9.8%) | 19 (3.8%) |
| 4:00 PM to 11:59 PM | 0 (0.0%) | 61 (12.3%) |
| Total | 541 (100.0%) | 497 (100.0%) |
Housing Occupancy in Bridgman
Occupancy by Ownership in Bridgman
Of the total 931 dwellings in Bridgman, owner-occupied units account for 656 (70.5%), while renter-occupied units make up 275 (29.5%).
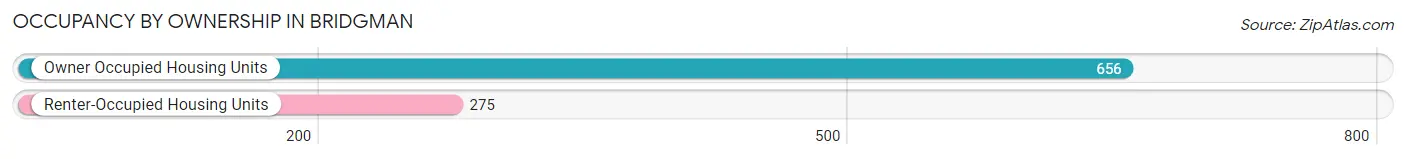
| Occupancy | # Housing Units | % Housing Units |
| Owner Occupied Housing Units | 656 | 70.5% |
| Renter-Occupied Housing Units | 275 | 29.5% |
| Total Occupied Housing Units | 931 | 100.0% |
Occupancy by Household Size in Bridgman
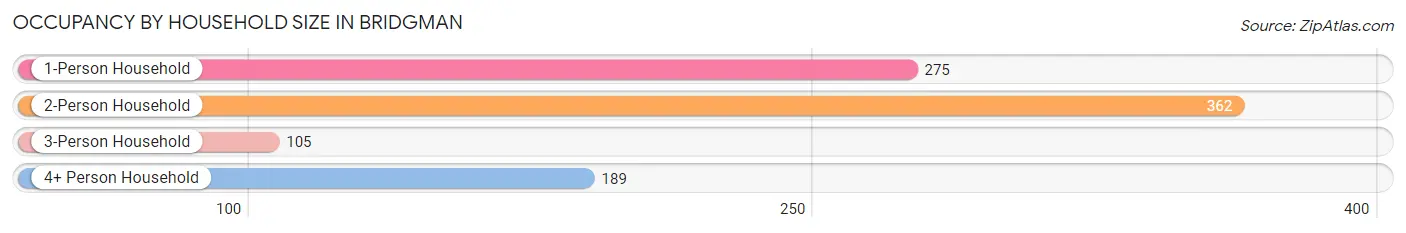
| Household Size | # Housing Units | % Housing Units |
| 1-Person Household | 275 | 29.5% |
| 2-Person Household | 362 | 38.9% |
| 3-Person Household | 105 | 11.3% |
| 4+ Person Household | 189 | 20.3% |
| Total Housing Units | 931 | 100.0% |
Occupancy by Ownership by Household Size in Bridgman
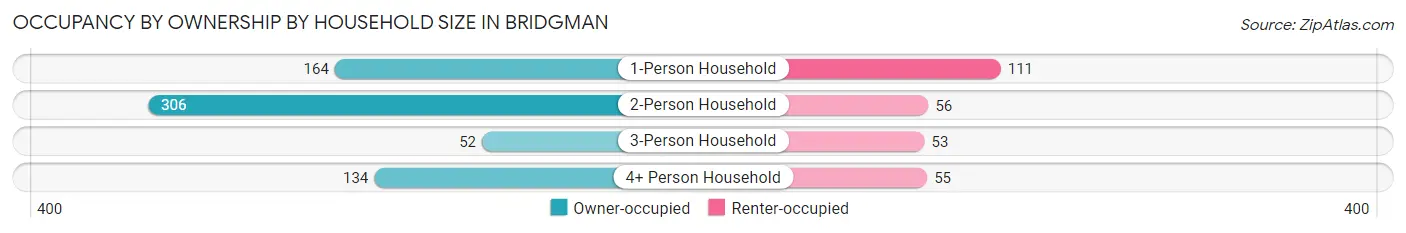
| Household Size | Owner-occupied | Renter-occupied |
| 1-Person Household | 164 (59.6%) | 111 (40.4%) |
| 2-Person Household | 306 (84.5%) | 56 (15.5%) |
| 3-Person Household | 52 (49.5%) | 53 (50.5%) |
| 4+ Person Household | 134 (70.9%) | 55 (29.1%) |
| Total Housing Units | 656 (70.5%) | 275 (29.5%) |
Occupancy by Educational Attainment in Bridgman
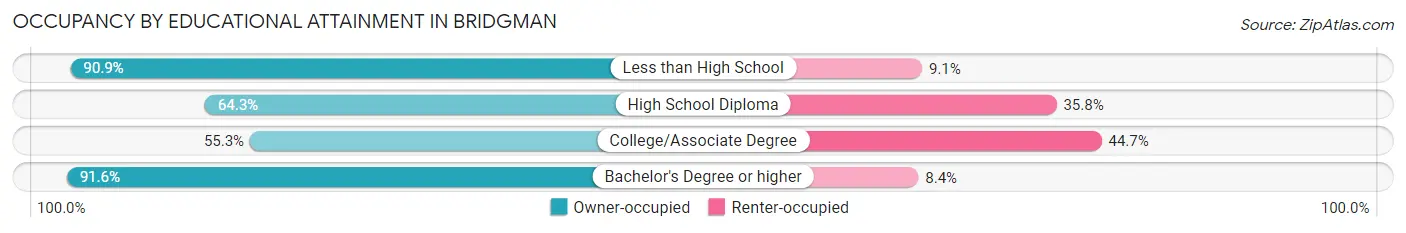
| Household Size | Owner-occupied | Renter-occupied |
| Less than High School | 10 (90.9%) | 1 (9.1%) |
| High School Diploma | 142 (64.2%) | 79 (35.7%) |
| College/Associate Degree | 208 (55.3%) | 168 (44.7%) |
| Bachelor's Degree or higher | 296 (91.6%) | 27 (8.4%) |
Occupancy by Age of Householder in Bridgman
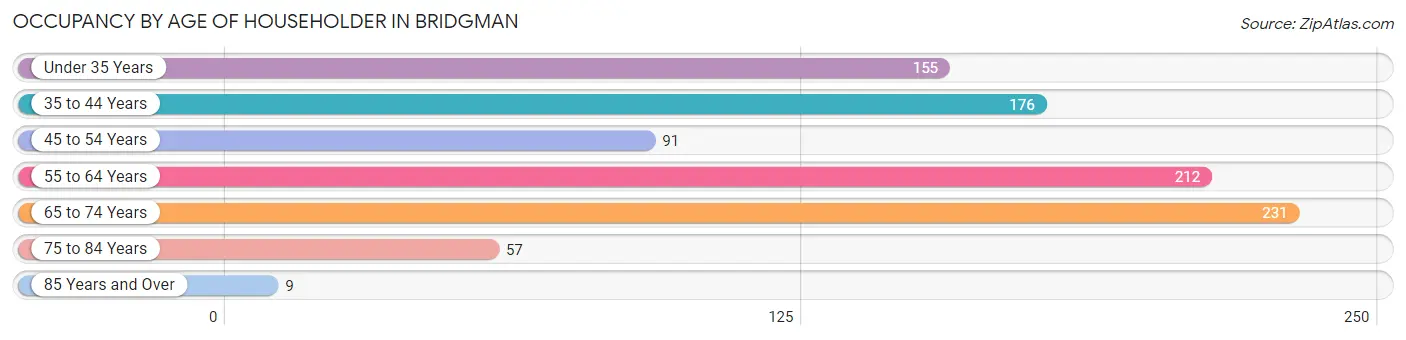
| Age Bracket | # Households | % Households |
| Under 35 Years | 155 | 16.7% |
| 35 to 44 Years | 176 | 18.9% |
| 45 to 54 Years | 91 | 9.8% |
| 55 to 64 Years | 212 | 22.8% |
| 65 to 74 Years | 231 | 24.8% |
| 75 to 84 Years | 57 | 6.1% |
| 85 Years and Over | 9 | 1.0% |
| Total | 931 | 100.0% |
Housing Finances in Bridgman
Median Income by Occupancy in Bridgman
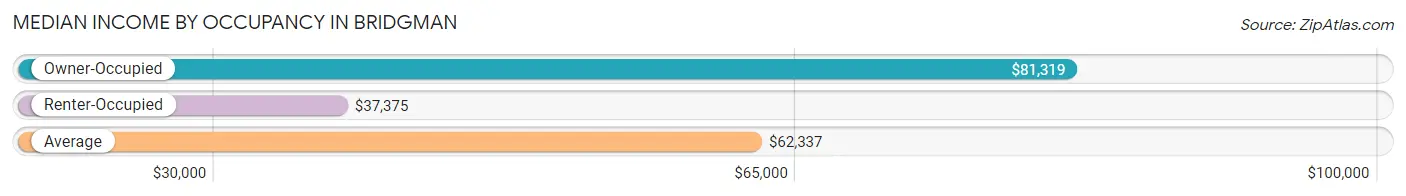
| Occupancy Type | # Households | Median Income |
| Owner-Occupied | 656 (70.5%) | $81,319 |
| Renter-Occupied | 275 (29.5%) | $37,375 |
| Average | 931 (100.0%) | $62,337 |
Occupancy by Householder Income Bracket in Bridgman
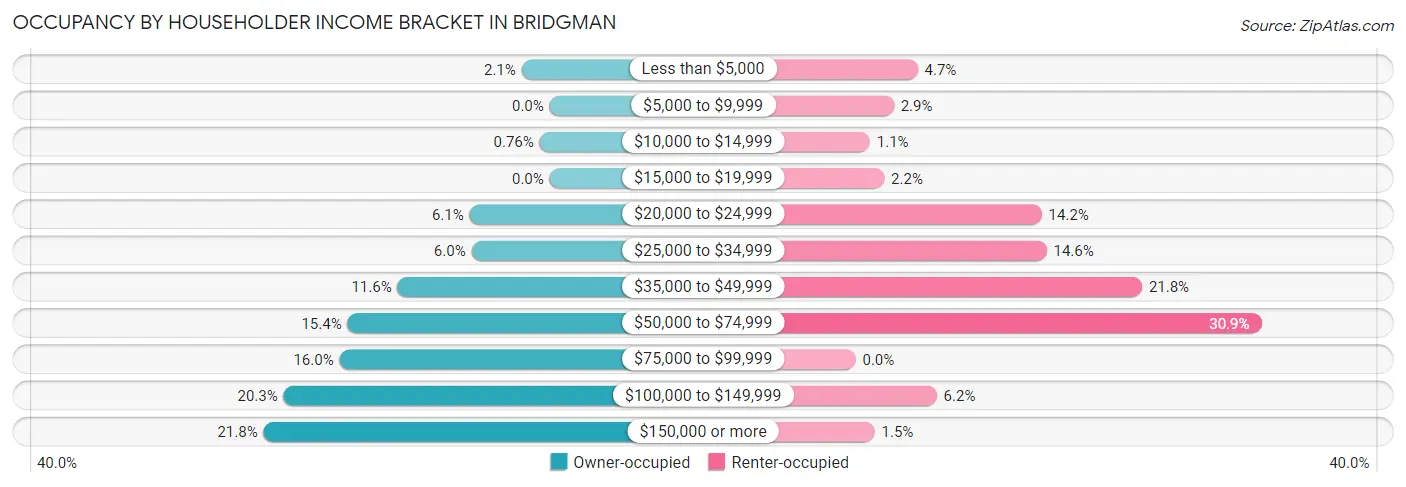
| Income Bracket | Owner-occupied | Renter-occupied |
| Less than $5,000 | 14 (2.1%) | 13 (4.7%) |
| $5,000 to $9,999 | 0 (0.0%) | 8 (2.9%) |
| $10,000 to $14,999 | 5 (0.8%) | 3 (1.1%) |
| $15,000 to $19,999 | 0 (0.0%) | 6 (2.2%) |
| $20,000 to $24,999 | 40 (6.1%) | 39 (14.2%) |
| $25,000 to $34,999 | 39 (5.9%) | 40 (14.5%) |
| $35,000 to $49,999 | 76 (11.6%) | 60 (21.8%) |
| $50,000 to $74,999 | 101 (15.4%) | 85 (30.9%) |
| $75,000 to $99,999 | 105 (16.0%) | 0 (0.0%) |
| $100,000 to $149,999 | 133 (20.3%) | 17 (6.2%) |
| $150,000 or more | 143 (21.8%) | 4 (1.5%) |
| Total | 656 (100.0%) | 275 (100.0%) |
Monthly Housing Cost Tiers in Bridgman
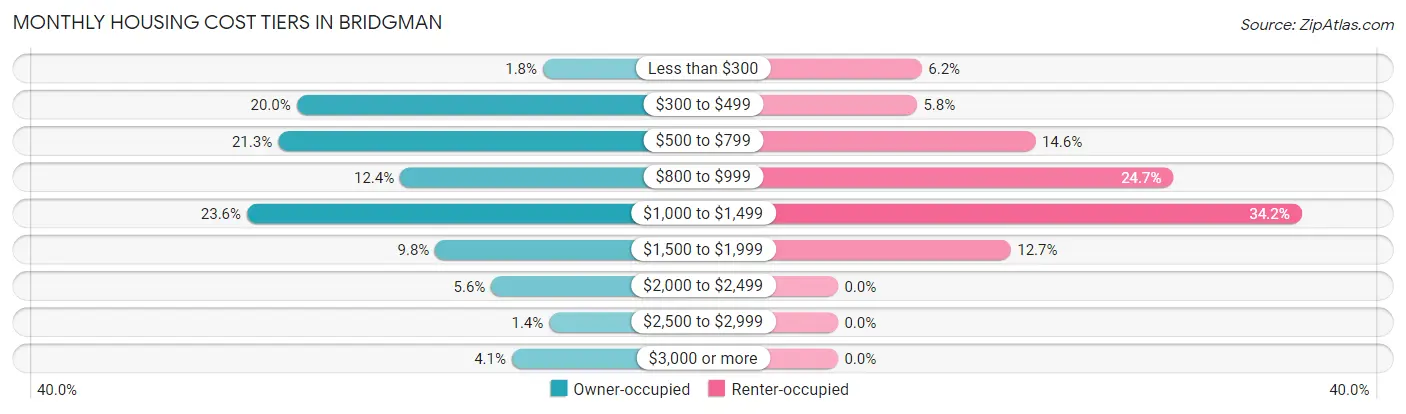
| Monthly Cost | Owner-occupied | Renter-occupied |
| Less than $300 | 12 (1.8%) | 17 (6.2%) |
| $300 to $499 | 131 (20.0%) | 16 (5.8%) |
| $500 to $799 | 140 (21.3%) | 40 (14.5%) |
| $800 to $999 | 81 (12.3%) | 68 (24.7%) |
| $1,000 to $1,499 | 155 (23.6%) | 94 (34.2%) |
| $1,500 to $1,999 | 64 (9.8%) | 35 (12.7%) |
| $2,000 to $2,499 | 37 (5.6%) | 0 (0.0%) |
| $2,500 to $2,999 | 9 (1.4%) | 0 (0.0%) |
| $3,000 or more | 27 (4.1%) | 0 (0.0%) |
| Total | 656 (100.0%) | 275 (100.0%) |
Physical Housing Characteristics in Bridgman
Housing Structures in Bridgman
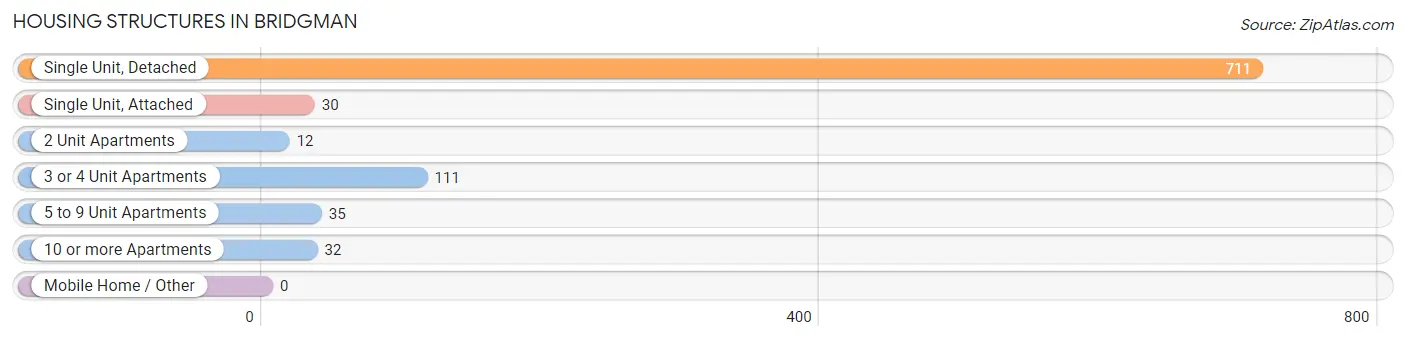
| Structure Type | # Housing Units | % Housing Units |
| Single Unit, Detached | 711 | 76.4% |
| Single Unit, Attached | 30 | 3.2% |
| 2 Unit Apartments | 12 | 1.3% |
| 3 or 4 Unit Apartments | 111 | 11.9% |
| 5 to 9 Unit Apartments | 35 | 3.8% |
| 10 or more Apartments | 32 | 3.4% |
| Mobile Home / Other | 0 | 0.0% |
| Total | 931 | 100.0% |
Housing Structures by Occupancy in Bridgman
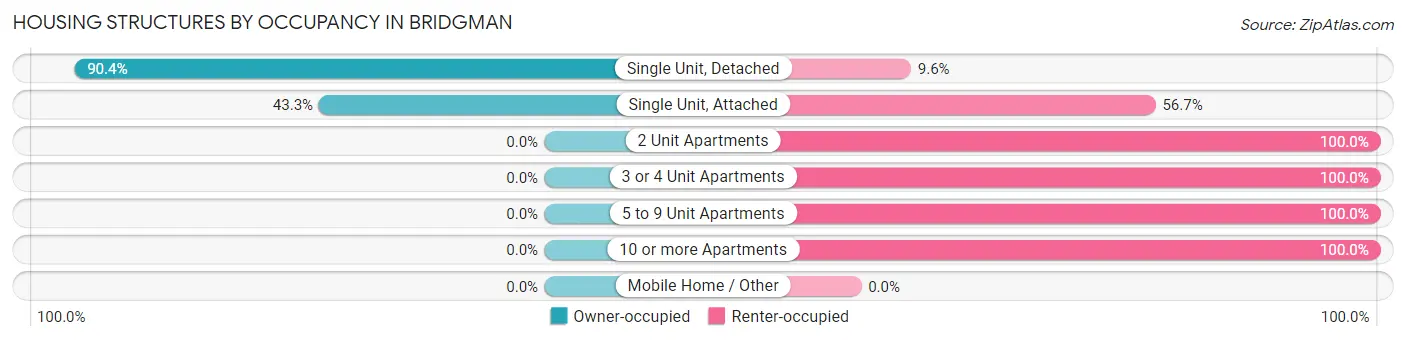
| Structure Type | Owner-occupied | Renter-occupied |
| Single Unit, Detached | 643 (90.4%) | 68 (9.6%) |
| Single Unit, Attached | 13 (43.3%) | 17 (56.7%) |
| 2 Unit Apartments | 0 (0.0%) | 12 (100.0%) |
| 3 or 4 Unit Apartments | 0 (0.0%) | 111 (100.0%) |
| 5 to 9 Unit Apartments | 0 (0.0%) | 35 (100.0%) |
| 10 or more Apartments | 0 (0.0%) | 32 (100.0%) |
| Mobile Home / Other | 0 (0.0%) | 0 (0.0%) |
| Total | 656 (70.5%) | 275 (29.5%) |
Housing Structures by Number of Rooms in Bridgman
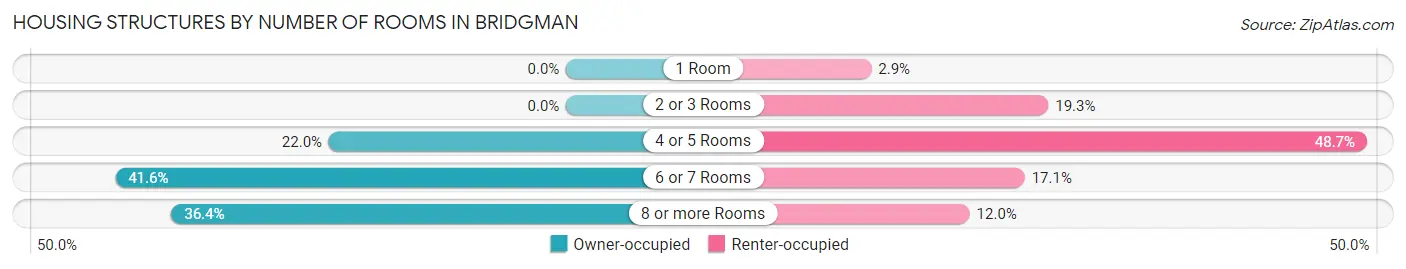
| Number of Rooms | Owner-occupied | Renter-occupied |
| 1 Room | 0 (0.0%) | 8 (2.9%) |
| 2 or 3 Rooms | 0 (0.0%) | 53 (19.3%) |
| 4 or 5 Rooms | 144 (22.0%) | 134 (48.7%) |
| 6 or 7 Rooms | 273 (41.6%) | 47 (17.1%) |
| 8 or more Rooms | 239 (36.4%) | 33 (12.0%) |
| Total | 656 (100.0%) | 275 (100.0%) |
Housing Structure by Heating Type in Bridgman
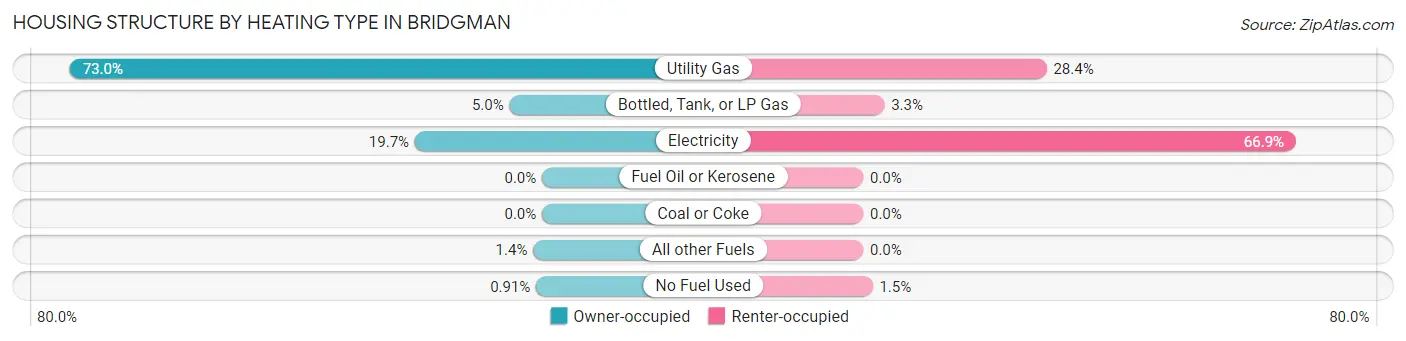
| Heating Type | Owner-occupied | Renter-occupied |
| Utility Gas | 479 (73.0%) | 78 (28.4%) |
| Bottled, Tank, or LP Gas | 33 (5.0%) | 9 (3.3%) |
| Electricity | 129 (19.7%) | 184 (66.9%) |
| Fuel Oil or Kerosene | 0 (0.0%) | 0 (0.0%) |
| Coal or Coke | 0 (0.0%) | 0 (0.0%) |
| All other Fuels | 9 (1.4%) | 0 (0.0%) |
| No Fuel Used | 6 (0.9%) | 4 (1.5%) |
| Total | 656 (100.0%) | 275 (100.0%) |
Household Vehicle Usage in Bridgman
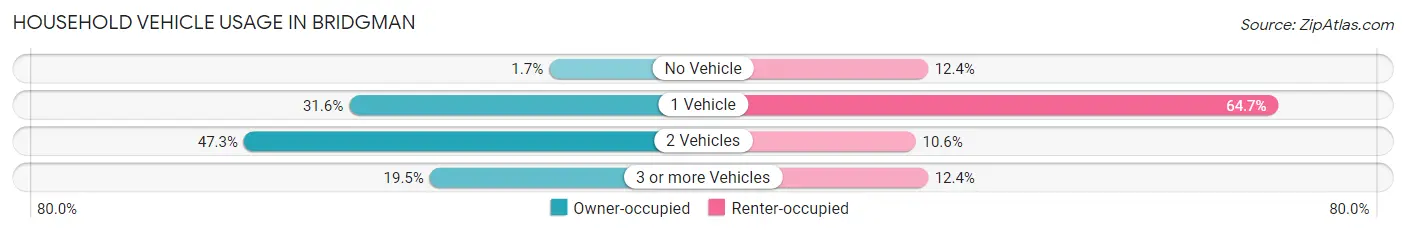
| Vehicles per Household | Owner-occupied | Renter-occupied |
| No Vehicle | 11 (1.7%) | 34 (12.4%) |
| 1 Vehicle | 207 (31.6%) | 178 (64.7%) |
| 2 Vehicles | 310 (47.3%) | 29 (10.5%) |
| 3 or more Vehicles | 128 (19.5%) | 34 (12.4%) |
| Total | 656 (100.0%) | 275 (100.0%) |
Real Estate & Mortgages in Bridgman
Real Estate and Mortgage Overview in Bridgman
| Characteristic | Without Mortgage | With Mortgage |
| Housing Units | 313 | 343 |
| Median Property Value | $200,500 | $228,500 |
| Median Household Income | $79,125 | $77 |
| Monthly Housing Costs | $520 | $27 |
| Real Estate Taxes | $2,390 | $19 |
Property Value by Mortgage Status in Bridgman
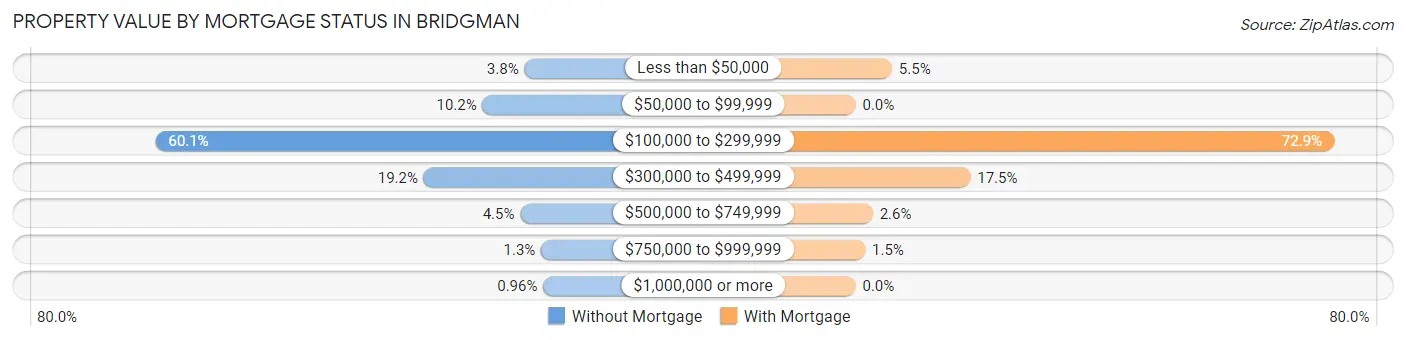
| Property Value | Without Mortgage | With Mortgage |
| Less than $50,000 | 12 (3.8%) | 19 (5.5%) |
| $50,000 to $99,999 | 32 (10.2%) | 0 (0.0%) |
| $100,000 to $299,999 | 188 (60.1%) | 250 (72.9%) |
| $300,000 to $499,999 | 60 (19.2%) | 60 (17.5%) |
| $500,000 to $749,999 | 14 (4.5%) | 9 (2.6%) |
| $750,000 to $999,999 | 4 (1.3%) | 5 (1.5%) |
| $1,000,000 or more | 3 (1.0%) | 0 (0.0%) |
| Total | 313 (100.0%) | 343 (100.0%) |
Household Income by Mortgage Status in Bridgman
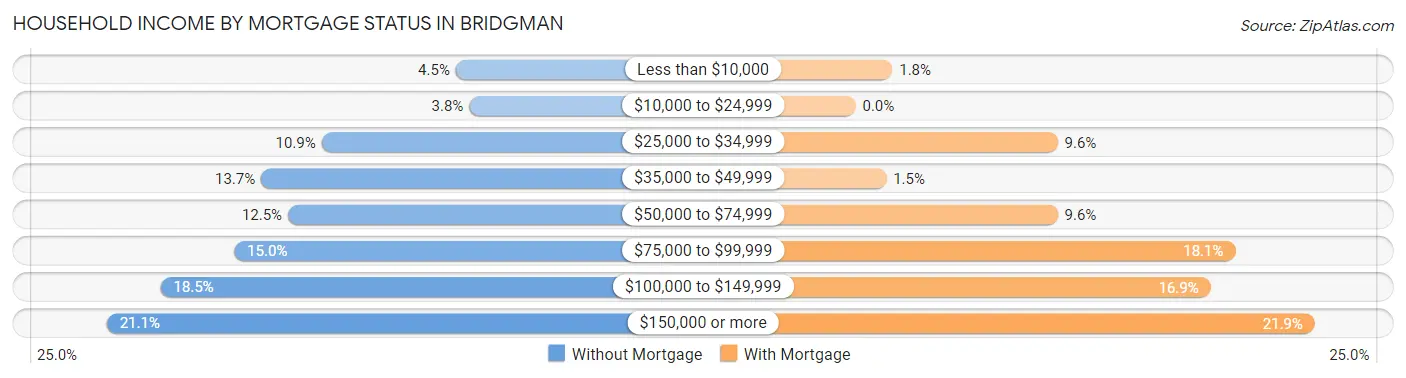
| Household Income | Without Mortgage | With Mortgage |
| Less than $10,000 | 14 (4.5%) | 6 (1.8%) |
| $10,000 to $24,999 | 12 (3.8%) | 0 (0.0%) |
| $25,000 to $34,999 | 34 (10.9%) | 33 (9.6%) |
| $35,000 to $49,999 | 43 (13.7%) | 5 (1.5%) |
| $50,000 to $74,999 | 39 (12.5%) | 33 (9.6%) |
| $75,000 to $99,999 | 47 (15.0%) | 62 (18.1%) |
| $100,000 to $149,999 | 58 (18.5%) | 58 (16.9%) |
| $150,000 or more | 66 (21.1%) | 75 (21.9%) |
| Total | 313 (100.0%) | 343 (100.0%) |
Property Value to Household Income Ratio in Bridgman
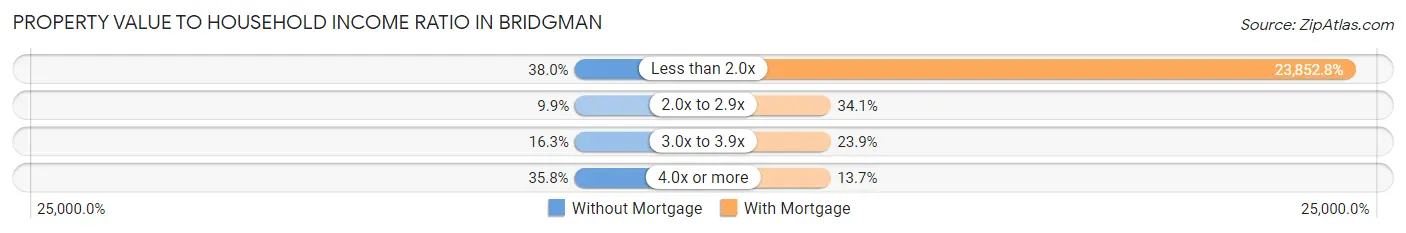
| Value-to-Income Ratio | Without Mortgage | With Mortgage |
| Less than 2.0x | 119 (38.0%) | 81,815 (23,852.8%) |
| 2.0x to 2.9x | 31 (9.9%) | 117 (34.1%) |
| 3.0x to 3.9x | 51 (16.3%) | 82 (23.9%) |
| 4.0x or more | 112 (35.8%) | 47 (13.7%) |
| Total | 313 (100.0%) | 343 (100.0%) |
Real Estate Taxes by Mortgage Status in Bridgman
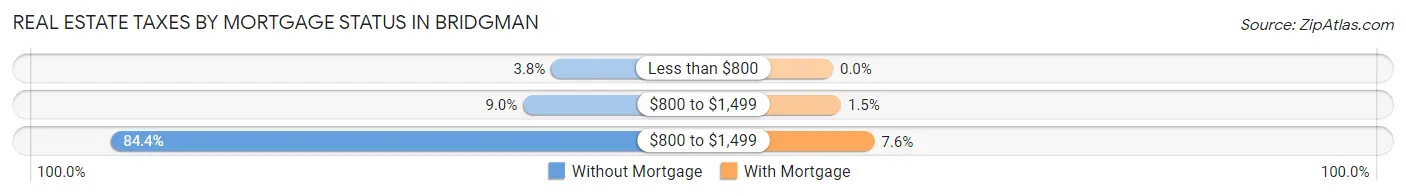
| Property Taxes | Without Mortgage | With Mortgage |
| Less than $800 | 12 (3.8%) | 0 (0.0%) |
| $800 to $1,499 | 28 (8.9%) | 5 (1.5%) |
| $800 to $1,499 | 264 (84.4%) | 26 (7.6%) |
| Total | 313 (100.0%) | 343 (100.0%) |
Health & Disability in Bridgman
Health Insurance Coverage by Age in Bridgman
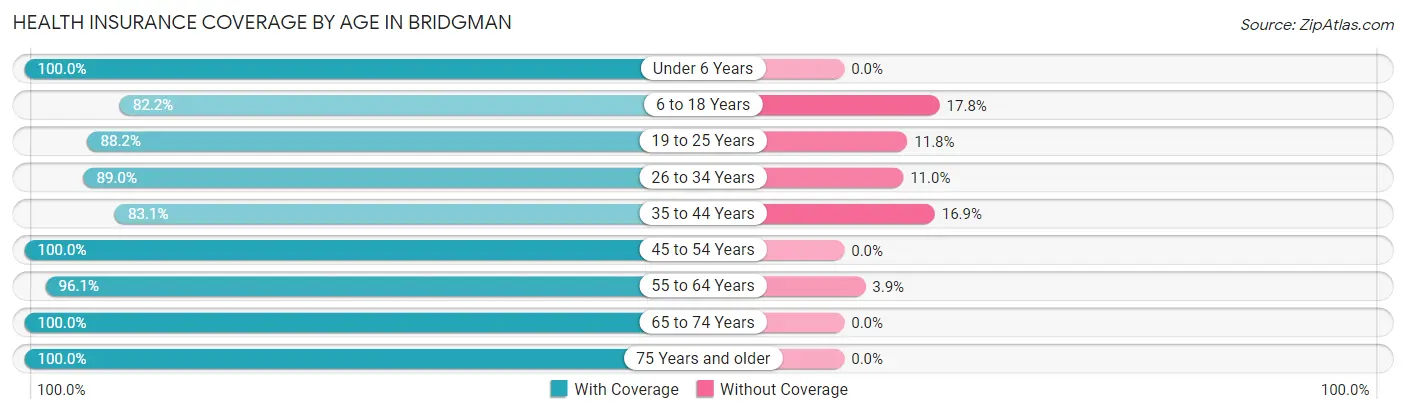
| Age Bracket | With Coverage | Without Coverage |
| Under 6 Years | 208 (100.0%) | 0 (0.0%) |
| 6 to 18 Years | 296 (82.2%) | 64 (17.8%) |
| 19 to 25 Years | 120 (88.2%) | 16 (11.8%) |
| 26 to 34 Years | 162 (89.0%) | 20 (11.0%) |
| 35 to 44 Years | 330 (83.1%) | 67 (16.9%) |
| 45 to 54 Years | 174 (100.0%) | 0 (0.0%) |
| 55 to 64 Years | 318 (96.1%) | 13 (3.9%) |
| 65 to 74 Years | 402 (100.0%) | 0 (0.0%) |
| 75 Years and older | 104 (100.0%) | 0 (0.0%) |
| Total | 2,114 (92.1%) | 180 (7.9%) |
Health Insurance Coverage by Citizenship Status in Bridgman
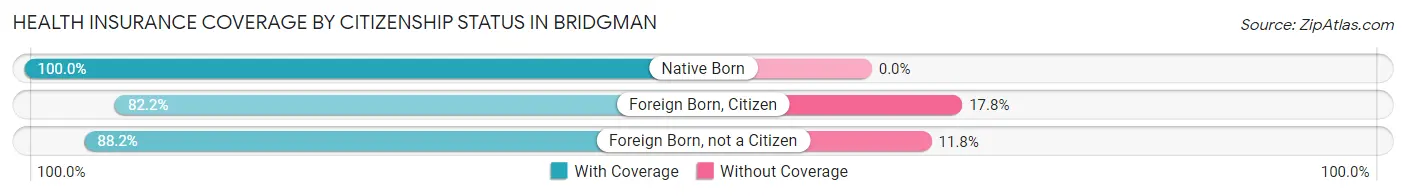
| Citizenship Status | With Coverage | Without Coverage |
| Native Born | 208 (100.0%) | 0 (0.0%) |
| Foreign Born, Citizen | 296 (82.2%) | 64 (17.8%) |
| Foreign Born, not a Citizen | 120 (88.2%) | 16 (11.8%) |
Health Insurance Coverage by Household Income in Bridgman
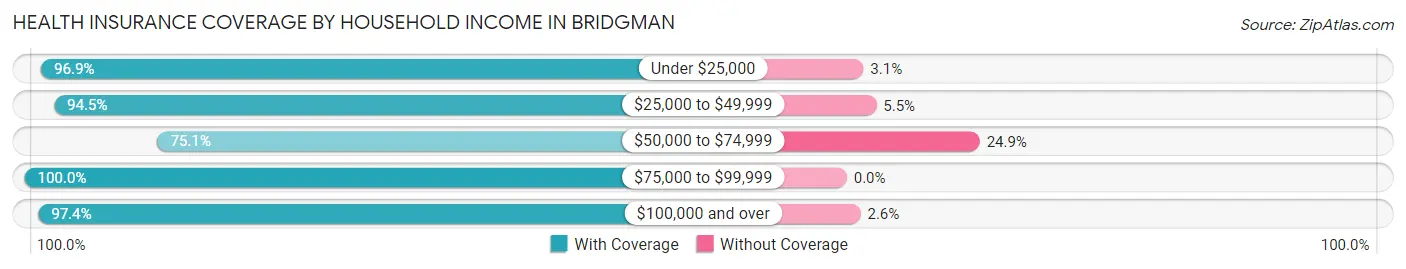
| Household Income | With Coverage | Without Coverage |
| Under $25,000 | 187 (96.9%) | 6 (3.1%) |
| $25,000 to $49,999 | 392 (94.5%) | 23 (5.5%) |
| $50,000 to $74,999 | 389 (75.1%) | 129 (24.9%) |
| $75,000 to $99,999 | 312 (100.0%) | 0 (0.0%) |
| $100,000 and over | 834 (97.4%) | 22 (2.6%) |
Public vs Private Health Insurance Coverage by Age in Bridgman
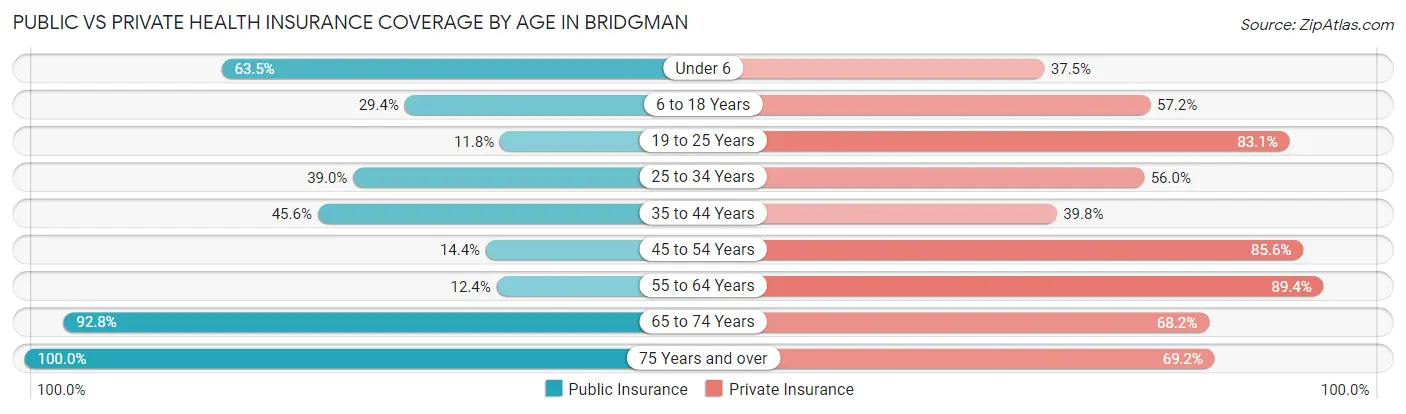
| Age Bracket | Public Insurance | Private Insurance |
| Under 6 | 132 (63.5%) | 78 (37.5%) |
| 6 to 18 Years | 106 (29.4%) | 206 (57.2%) |
| 19 to 25 Years | 16 (11.8%) | 113 (83.1%) |
| 25 to 34 Years | 71 (39.0%) | 102 (56.0%) |
| 35 to 44 Years | 181 (45.6%) | 158 (39.8%) |
| 45 to 54 Years | 25 (14.4%) | 149 (85.6%) |
| 55 to 64 Years | 41 (12.4%) | 296 (89.4%) |
| 65 to 74 Years | 373 (92.8%) | 274 (68.2%) |
| 75 Years and over | 104 (100.0%) | 72 (69.2%) |
| Total | 1,049 (45.7%) | 1,448 (63.1%) |
Disability Status by Sex by Age in Bridgman
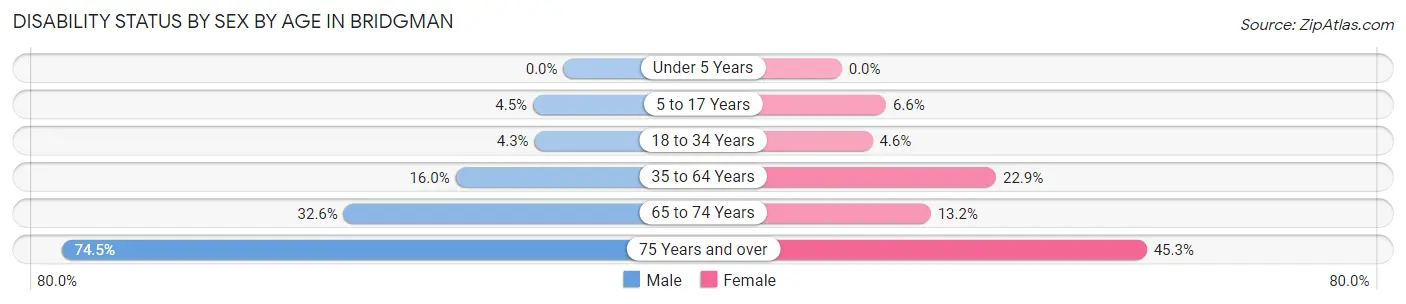
| Age Bracket | Male | Female |
| Under 5 Years | 0 (0.0%) | 0 (0.0%) |
| 5 to 17 Years | 14 (4.5%) | 9 (6.6%) |
| 18 to 34 Years | 8 (4.3%) | 6 (4.5%) |
| 35 to 64 Years | 62 (16.0%) | 118 (22.9%) |
| 65 to 74 Years | 62 (32.6%) | 28 (13.2%) |
| 75 Years and over | 38 (74.5%) | 24 (45.3%) |
Disability Class by Sex by Age in Bridgman
Disability Class: Hearing Difficulty
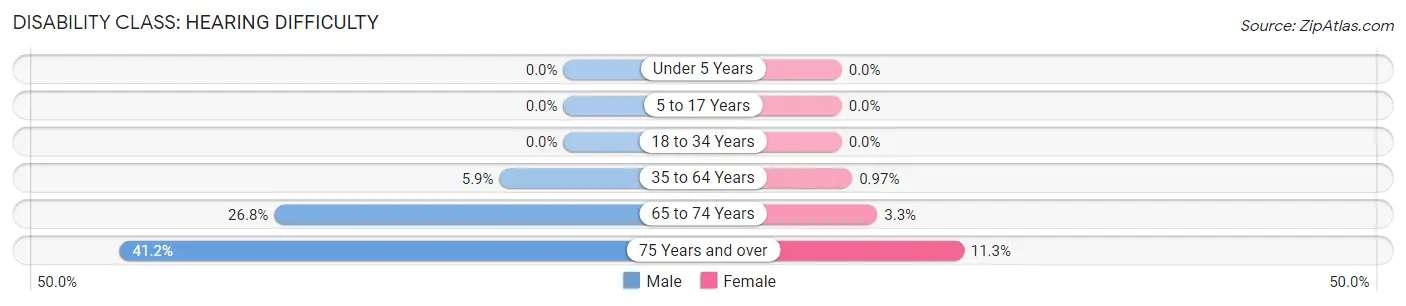
| Age Bracket | Male | Female |
| Under 5 Years | 0 (0.0%) | 0 (0.0%) |
| 5 to 17 Years | 0 (0.0%) | 0 (0.0%) |
| 18 to 34 Years | 0 (0.0%) | 0 (0.0%) |
| 35 to 64 Years | 23 (5.9%) | 5 (1.0%) |
| 65 to 74 Years | 51 (26.8%) | 7 (3.3%) |
| 75 Years and over | 21 (41.2%) | 6 (11.3%) |
Disability Class: Vision Difficulty
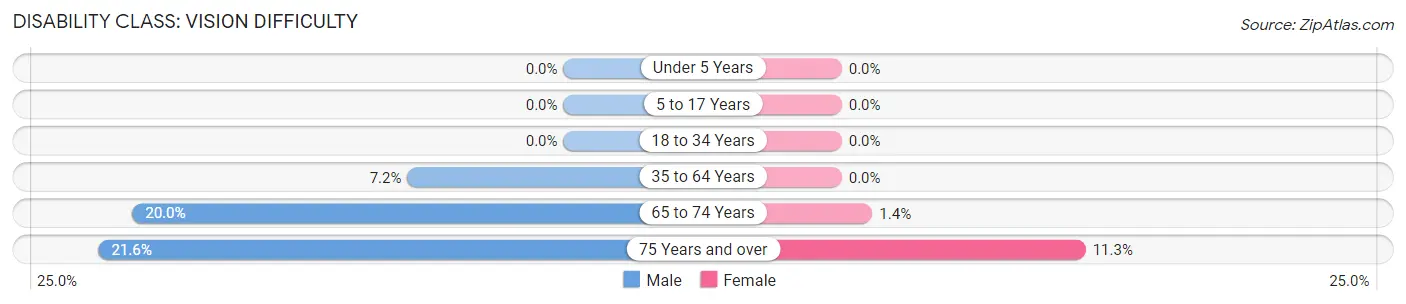
| Age Bracket | Male | Female |
| Under 5 Years | 0 (0.0%) | 0 (0.0%) |
| 5 to 17 Years | 0 (0.0%) | 0 (0.0%) |
| 18 to 34 Years | 0 (0.0%) | 0 (0.0%) |
| 35 to 64 Years | 28 (7.2%) | 0 (0.0%) |
| 65 to 74 Years | 38 (20.0%) | 3 (1.4%) |
| 75 Years and over | 11 (21.6%) | 6 (11.3%) |
Disability Class: Cognitive Difficulty
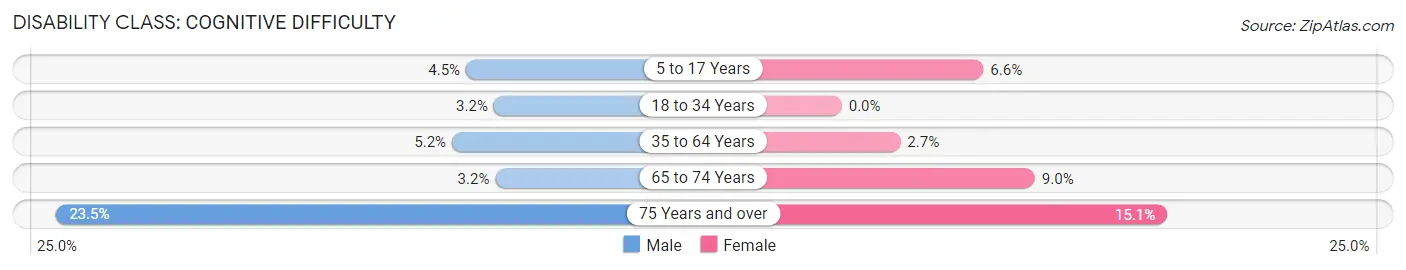
| Age Bracket | Male | Female |
| 5 to 17 Years | 14 (4.5%) | 9 (6.6%) |
| 18 to 34 Years | 6 (3.2%) | 0 (0.0%) |
| 35 to 64 Years | 20 (5.2%) | 14 (2.7%) |
| 65 to 74 Years | 6 (3.2%) | 19 (9.0%) |
| 75 Years and over | 12 (23.5%) | 8 (15.1%) |
Disability Class: Ambulatory Difficulty
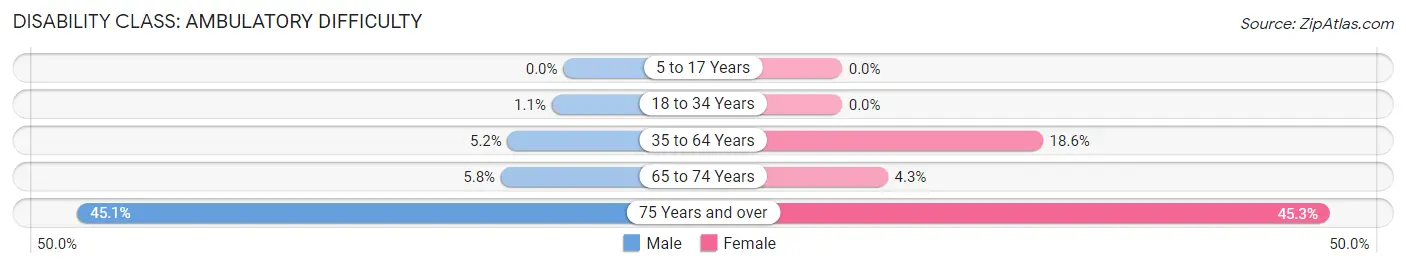
| Age Bracket | Male | Female |
| 5 to 17 Years | 0 (0.0%) | 0 (0.0%) |
| 18 to 34 Years | 2 (1.1%) | 0 (0.0%) |
| 35 to 64 Years | 20 (5.2%) | 96 (18.6%) |
| 65 to 74 Years | 11 (5.8%) | 9 (4.3%) |
| 75 Years and over | 23 (45.1%) | 24 (45.3%) |
Disability Class: Self-Care Difficulty
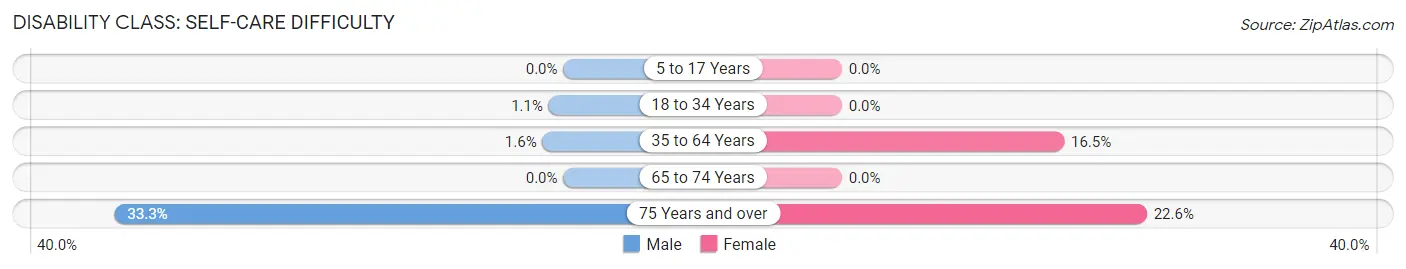
| Age Bracket | Male | Female |
| 5 to 17 Years | 0 (0.0%) | 0 (0.0%) |
| 18 to 34 Years | 2 (1.1%) | 0 (0.0%) |
| 35 to 64 Years | 6 (1.5%) | 85 (16.5%) |
| 65 to 74 Years | 0 (0.0%) | 0 (0.0%) |
| 75 Years and over | 17 (33.3%) | 12 (22.6%) |
Technology Access in Bridgman
Computing Device Access in Bridgman
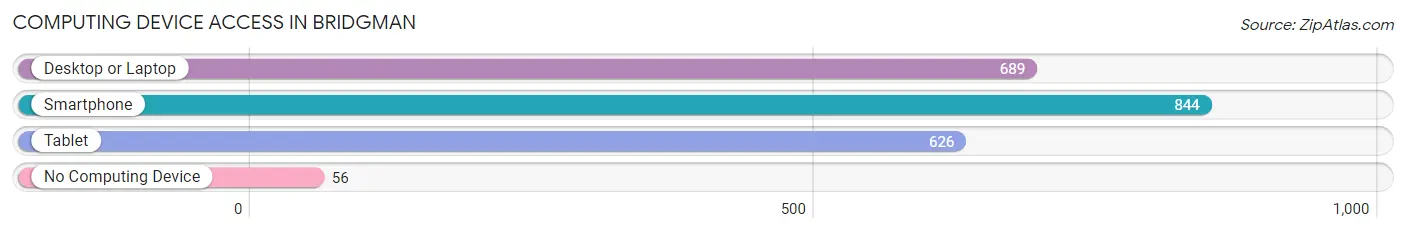
| Device Type | # Households | % Households |
| Desktop or Laptop | 689 | 74.0% |
| Smartphone | 844 | 90.7% |
| Tablet | 626 | 67.2% |
| No Computing Device | 56 | 6.0% |
| Total | 931 | 100.0% |
Internet Access in Bridgman
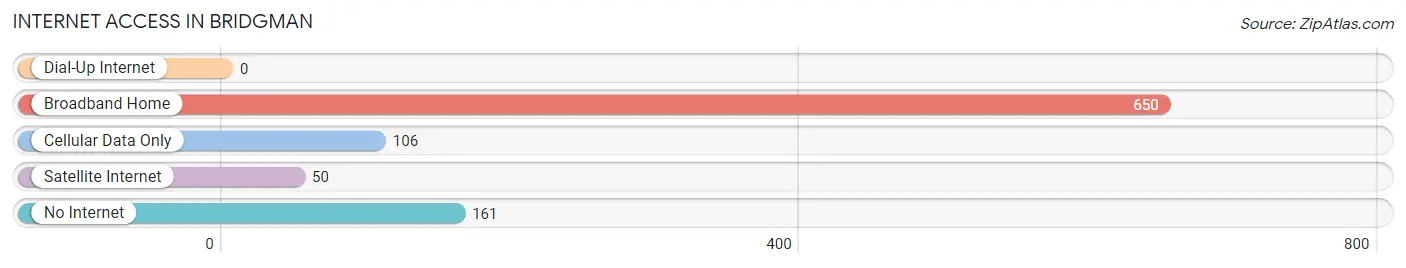
| Internet Type | # Households | % Households |
| Dial-Up Internet | 0 | 0.0% |
| Broadband Home | 650 | 69.8% |
| Cellular Data Only | 106 | 11.4% |
| Satellite Internet | 50 | 5.4% |
| No Internet | 161 | 17.3% |
| Total | 931 | 100.0% |
Bridgman Summary
Bridgman, Michigan is a small city located in Berrien County, Michigan. It is situated on the shores of Lake Michigan, just north of the Indiana border. The city has a population of 2,921 people, according to the 2010 census.
History
Bridgman was founded in 1873 by William Bridgman, a lumberman from New York. He purchased land from the government and began to develop the area. The first post office was established in 1874 and the first school was built in 1876. The city was incorporated in 1891.
In the early 1900s, Bridgman was a popular tourist destination. It was known for its beautiful beaches and resorts. The city was also home to a number of factories, including a canning factory, a brickyard, and a furniture factory.
In the 1950s, the city began to decline as the factories closed and the tourist industry declined. The city was hit hard by the Great Recession of 2008, but has since recovered and is now a thriving community.
Geography
Bridgman is located in southwestern Michigan, on the shores of Lake Michigan. It is situated in Berrien County, just north of the Indiana border. The city is bordered by the cities of St. Joseph, Benton Harbor, and Stevensville.
The city has a total area of 2.2 square miles, all of which is land. The terrain is mostly flat, with some rolling hills. The city is located in a temperate climate zone, with hot summers and cold winters.
Economy
Bridgman’s economy is largely based on tourism and manufacturing. The city is home to a number of resorts and hotels, as well as several restaurants and shops. The city is also home to a number of factories, including a canning factory, a brickyard, and a furniture factory.
The city is also home to a number of small businesses, including a winery, a brewery, and a distillery. The city is also home to a number of farms, which produce a variety of fruits and vegetables.
Demographics
According to the 2010 census, Bridgman has a population of 2,921 people. The population is predominantly white (90.2%), with small percentages of African American (3.2%), Hispanic (2.2%), and Asian (1.2%) residents. The median household income is $45,945, and the median age is 43.
Bridgman is a small city with a rich history and a bright future. It is a great place to live, work, and play, and is a great place to visit. With its beautiful beaches, resorts, and factories, Bridgman is a great place to call home.
Common Questions
What is the Total Population of Bridgman?
Total Population of Bridgman is 2,378.
What is the Total Male Population of Bridgman?
Total Male Population of Bridgman is 1,218.
What is the Total Female Population of Bridgman?
Total Female Population of Bridgman is 1,160.
What is the Ratio of Males per 100 Females in Bridgman?
There are 105.00 Males per 100 Females in Bridgman.
What is the Ratio of Females per 100 Males in Bridgman?
There are 95.24 Females per 100 Males in Bridgman.
What is the Median Population Age in Bridgman?
Median Population Age in Bridgman is 42.4 Years.
What is the Average Family Size in Bridgman
Average Family Size in Bridgman is 2.9 People.
What is the Average Household Size in Bridgman
Average Household Size in Bridgman is 2.5 People.
What is Per Capita Income in Bridgman?
Per Capita income in Bridgman is $37,560.
What is the Median Family Income in Bridgman?
Median Family Income in Bridgman is $80,000.
What is the Median Household income in Bridgman?
Median Household Income in Bridgman is $62,337.
What is Income or Wage Gap in Bridgman?
Income or Wage Gap in Bridgman is 47.0%.
Women in Bridgman earn 53.0 cents for every dollar earned by a man.
What is Inequality or Gini Index in Bridgman?
Inequality or Gini Index in Bridgman is 0.43.
How Large is the Labor Force in Bridgman?
There are 1,115 People in the Labor Forcein in Bridgman.
What is the Percentage of People in the Labor Force in Bridgman?
58.1% of People are in the Labor Force in Bridgman.
What is the Unemployment Rate in Bridgman?
Unemployment Rate in Bridgman is 1.7%.