Sand Lake, MI
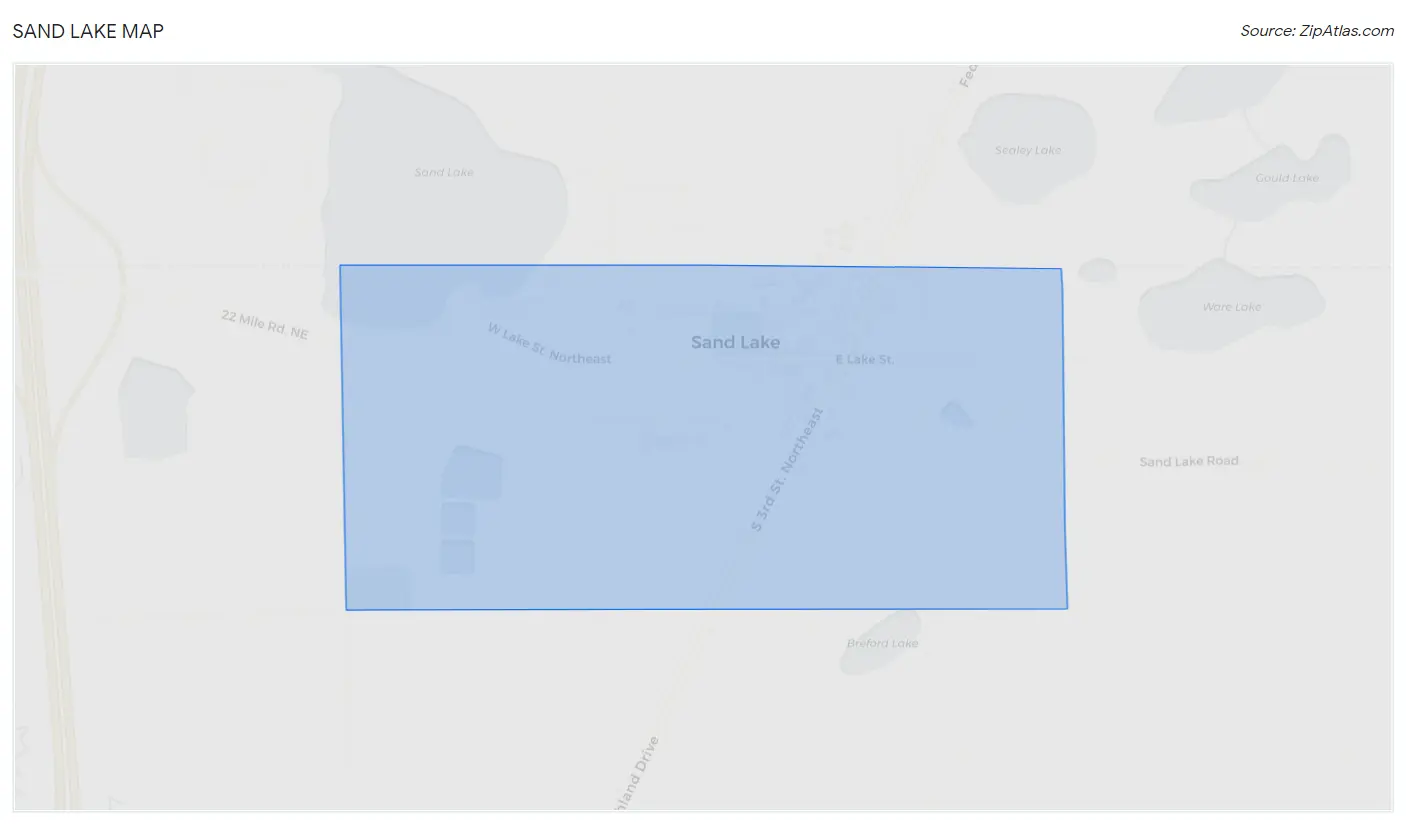
Sand Lake Map
Sand Lake Overview
492
TOTAL POPULATION
245
MALE POPULATION
247
FEMALE POPULATION
99.19
MALES / 100 FEMALES
100.82
FEMALES / 100 MALES
49.0
MEDIAN AGE
3.2
AVG FAMILY SIZE
2.2
AVG HOUSEHOLD SIZE
$26,106
PER CAPITA INCOME
$65,625
AVG FAMILY INCOME
35.1%
WAGE / INCOME GAP [ % ]
64.9¢/ $1
WAGE / INCOME GAP [ $ ]
0.47
INEQUALITY / GINI INDEX
200
LABOR FORCE [ PEOPLE ]
50.4%
PERCENT IN LABOR FORCE
2.5%
UNEMPLOYMENT RATE
Sand Lake Zip Codes
Sand Lake Area Codes
Race in Sand Lake
The most populous races in Sand Lake are White / Caucasian (450 | 91.5%), Two or more Races (32 | 6.5%), and Hispanic or Latino (18 | 3.7%).
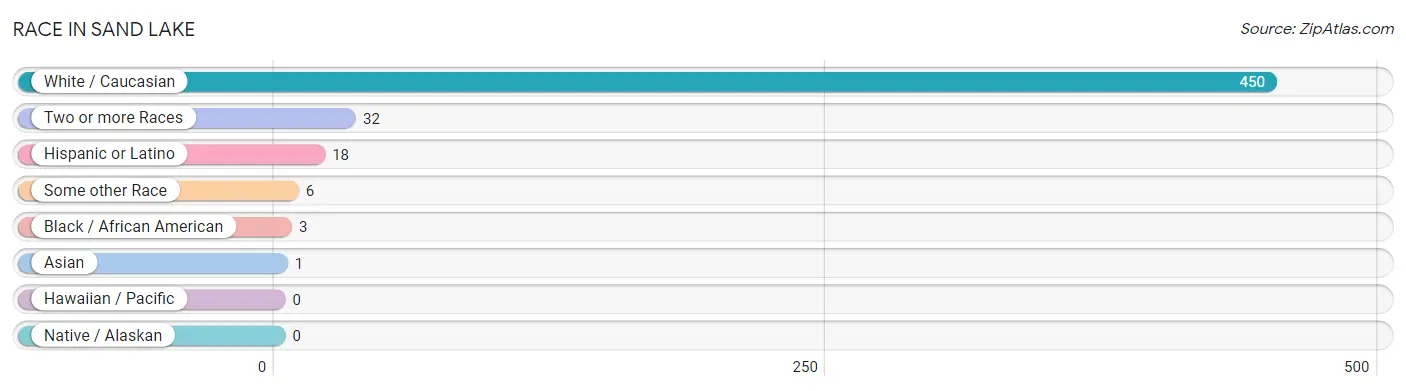
| Race | # Population | % Population |
| Asian | 1 | 0.2% |
| Black / African American | 3 | 0.6% |
| Hawaiian / Pacific | 0 | 0.0% |
| Hispanic or Latino | 18 | 3.7% |
| Native / Alaskan | 0 | 0.0% |
| White / Caucasian | 450 | 91.5% |
| Two or more Races | 32 | 6.5% |
| Some other Race | 6 | 1.2% |
| Total | 492 | 100.0% |
Ancestry in Sand Lake
The most populous ancestries reported in Sand Lake are German (70 | 14.2%), English (58 | 11.8%), French (45 | 9.1%), Irish (44 | 8.9%), and American (40 | 8.1%), together accounting for 52.2% of all Sand Lake residents.
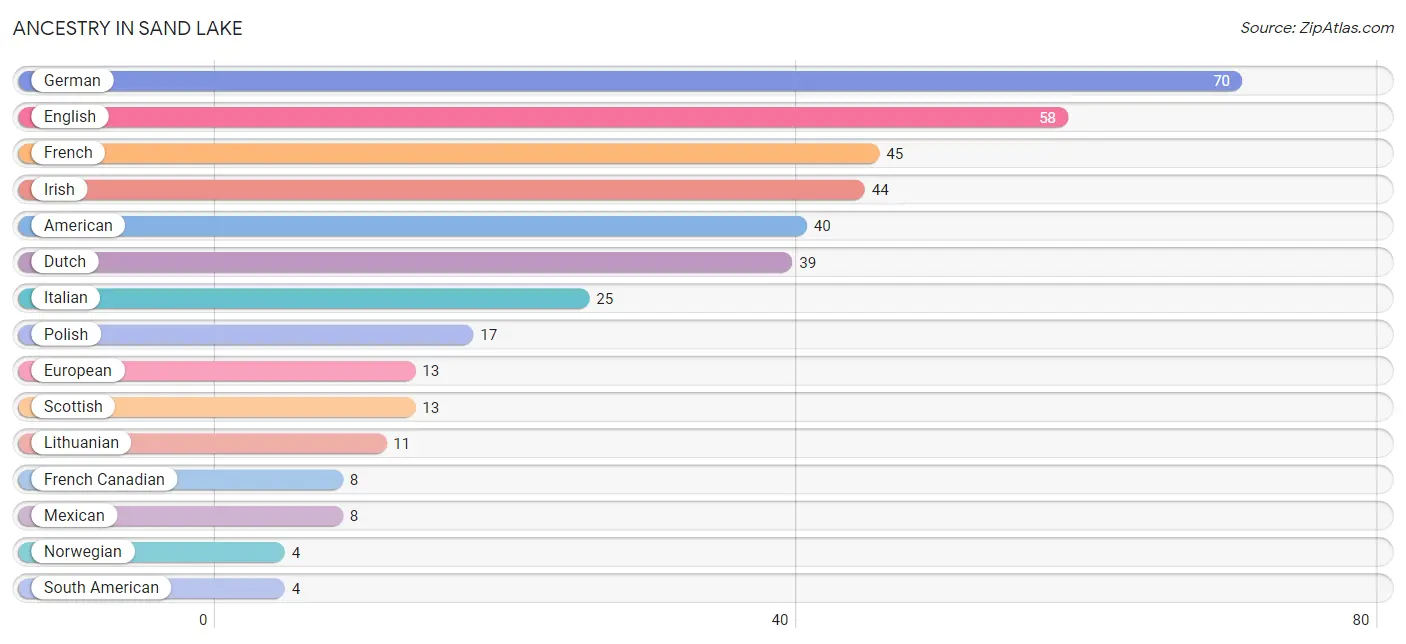
| Ancestry | # Population | % Population |
| African | 3 | 0.6% |
| American | 40 | 8.1% |
| Bolivian | 2 | 0.4% |
| Burmese | 1 | 0.2% |
| Cherokee | 1 | 0.2% |
| Colombian | 2 | 0.4% |
| Cuban | 2 | 0.4% |
| Dutch | 39 | 7.9% |
| English | 58 | 11.8% |
| European | 13 | 2.6% |
| French | 45 | 9.1% |
| French Canadian | 8 | 1.6% |
| German | 70 | 14.2% |
| Irish | 44 | 8.9% |
| Italian | 25 | 5.1% |
| Korean | 1 | 0.2% |
| Lithuanian | 11 | 2.2% |
| Mexican | 8 | 1.6% |
| Mexican American Indian | 1 | 0.2% |
| Northern European | 1 | 0.2% |
| Norwegian | 4 | 0.8% |
| Polish | 17 | 3.5% |
| Puerto Rican | 3 | 0.6% |
| Scotch-Irish | 3 | 0.6% |
| Scottish | 13 | 2.6% |
| South American | 4 | 0.8% |
| Subsaharan African | 3 | 0.6% |
| Swedish | 3 | 0.6% |
| Welsh | 1 | 0.2% | View All 29 Rows |
Immigrants in Sand Lake
The most numerous immigrant groups reported in Sand Lake came from Latin America (8 | 1.6%), South America (6 | 1.2%), Colombia (4 | 0.8%), Bolivia (2 | 0.4%), and Caribbean (2 | 0.4%), together accounting for 4.5% of all Sand Lake residents.
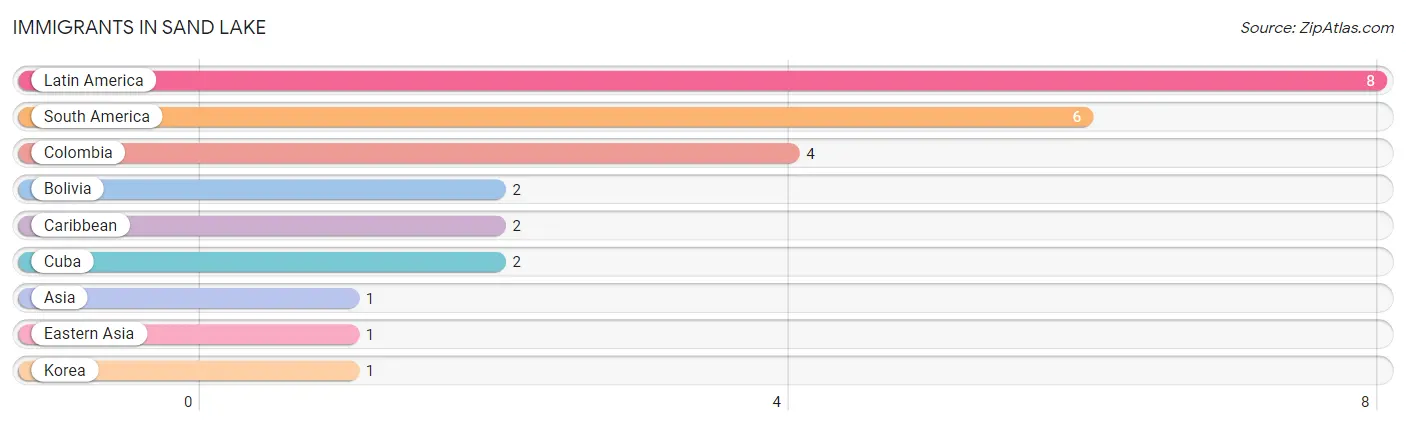
| Immigration Origin | # Population | % Population |
| Asia | 1 | 0.2% |
| Bolivia | 2 | 0.4% |
| Caribbean | 2 | 0.4% |
| Colombia | 4 | 0.8% |
| Cuba | 2 | 0.4% |
| Eastern Asia | 1 | 0.2% |
| Korea | 1 | 0.2% |
| Latin America | 8 | 1.6% |
| South America | 6 | 1.2% | View All 9 Rows |
Sex and Age in Sand Lake
Sex and Age in Sand Lake
The most populous age groups in Sand Lake are 60 to 64 Years (65 | 26.5%) for men and Under 5 Years (31 | 12.6%) for women.
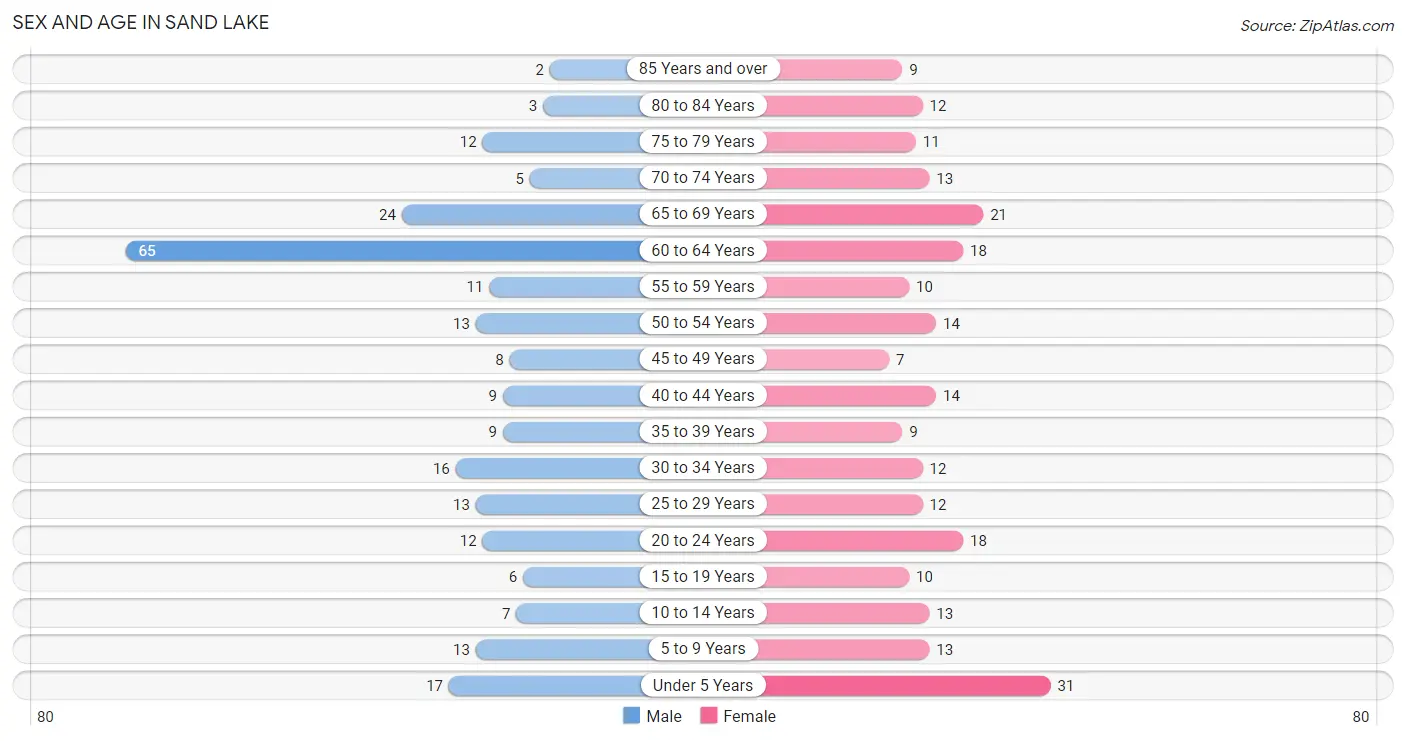
| Age Bracket | Male | Female |
| Under 5 Years | 17 (6.9%) | 31 (12.6%) |
| 5 to 9 Years | 13 (5.3%) | 13 (5.3%) |
| 10 to 14 Years | 7 (2.9%) | 13 (5.3%) |
| 15 to 19 Years | 6 (2.5%) | 10 (4.1%) |
| 20 to 24 Years | 12 (4.9%) | 18 (7.3%) |
| 25 to 29 Years | 13 (5.3%) | 12 (4.9%) |
| 30 to 34 Years | 16 (6.5%) | 12 (4.9%) |
| 35 to 39 Years | 9 (3.7%) | 9 (3.6%) |
| 40 to 44 Years | 9 (3.7%) | 14 (5.7%) |
| 45 to 49 Years | 8 (3.3%) | 7 (2.8%) |
| 50 to 54 Years | 13 (5.3%) | 14 (5.7%) |
| 55 to 59 Years | 11 (4.5%) | 10 (4.1%) |
| 60 to 64 Years | 65 (26.5%) | 18 (7.3%) |
| 65 to 69 Years | 24 (9.8%) | 21 (8.5%) |
| 70 to 74 Years | 5 (2.0%) | 13 (5.3%) |
| 75 to 79 Years | 12 (4.9%) | 11 (4.4%) |
| 80 to 84 Years | 3 (1.2%) | 12 (4.9%) |
| 85 Years and over | 2 (0.8%) | 9 (3.6%) |
| Total | 245 (100.0%) | 247 (100.0%) |
Families and Households in Sand Lake
Median Family Size in Sand Lake
The median family size in Sand Lake is 3.17 persons per family, with married-couple families (69 | 60.0%) accounting for the largest median family size of 3.42 persons per family. On the other hand, single male/father families (7 | 6.1%) represent the smallest median family size with 2.29 persons per family.
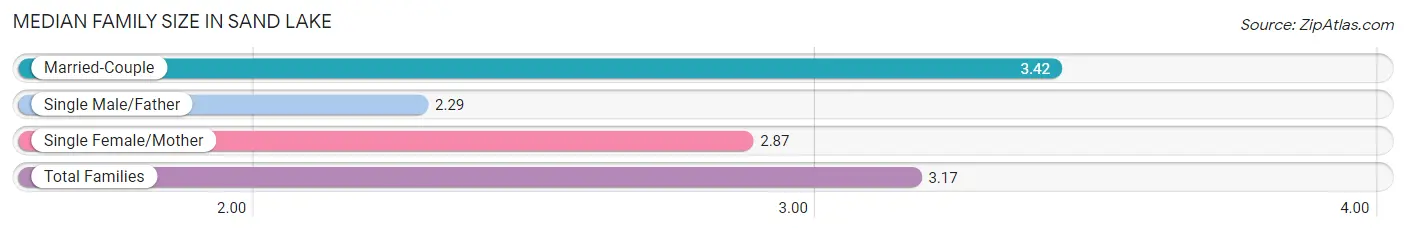
| Family Type | # Families | Family Size |
| Married-Couple | 69 (60.0%) | 3.42 |
| Single Male/Father | 7 (6.1%) | 2.29 |
| Single Female/Mother | 39 (33.9%) | 2.87 |
| Total Families | 115 (100.0%) | 3.17 |
Median Household Size in Sand Lake
The median household size in Sand Lake is 2.22 persons per household, with married-couple households (69 | 31.1%) accounting for the largest median household size of 3.43 persons per household. non-family households (107 | 48.2%) represent the smallest median household size with 1.03 persons per household.
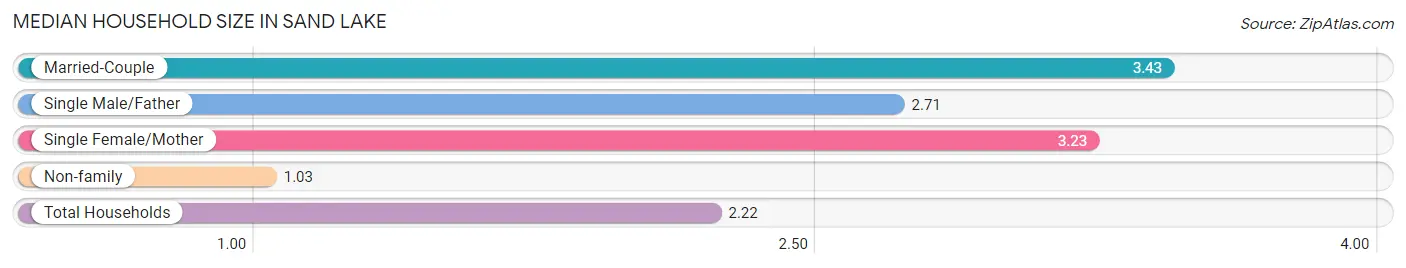
| Household Type | # Households | Household Size |
| Married-Couple | 69 (31.1%) | 3.43 |
| Single Male/Father | 7 (3.2%) | 2.71 |
| Single Female/Mother | 39 (17.6%) | 3.23 |
| Non-family | 107 (48.2%) | 1.03 |
| Total Households | 222 (100.0%) | 2.22 |
Household Size by Marriage Status in Sand Lake
Out of a total of 222 households in Sand Lake, 115 (51.8%) are family households, while 107 (48.2%) are nonfamily households. The most numerous type of family households are 2-person households, comprising 55, and the most common type of nonfamily households are 1-person households, comprising 105.
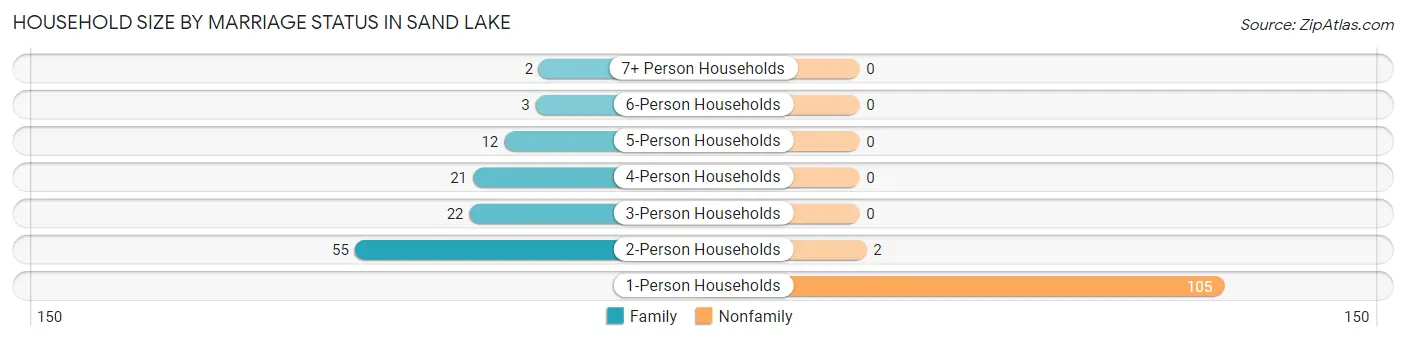
| Household Size | Family Households | Nonfamily Households |
| 1-Person Households | - | 105 (47.3%) |
| 2-Person Households | 55 (24.8%) | 2 (0.9%) |
| 3-Person Households | 22 (9.9%) | 0 (0.0%) |
| 4-Person Households | 21 (9.5%) | 0 (0.0%) |
| 5-Person Households | 12 (5.4%) | 0 (0.0%) |
| 6-Person Households | 3 (1.3%) | 0 (0.0%) |
| 7+ Person Households | 2 (0.9%) | 0 (0.0%) |
| Total | 115 (51.8%) | 107 (48.2%) |
Female Fertility in Sand Lake
Fertility by Age in Sand Lake
Average fertility rate in Sand Lake is 57.0 births per 1,000 women. Women in the age bracket of 20 to 34 years have the highest fertility rate with 119.0 births per 1,000 women. Women in the age bracket of 20 to 34 years acount for 100.0% of all women with births.
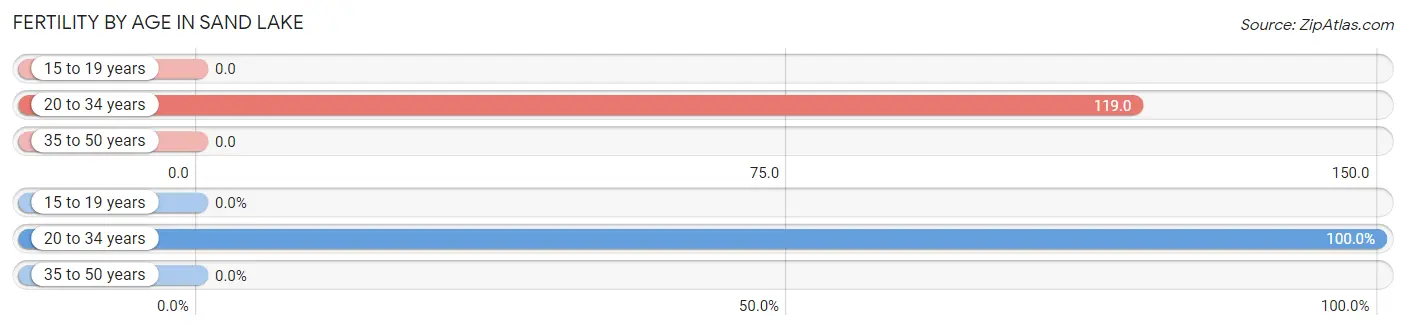
| Age Bracket | Women with Births | Births / 1,000 Women |
| 15 to 19 years | 0 (0.0%) | 0.0 |
| 20 to 34 years | 5 (100.0%) | 119.0 |
| 35 to 50 years | 0 (0.0%) | 0.0 |
| Total | 5 (100.0%) | 57.0 |
Fertility by Age by Marriage Status in Sand Lake
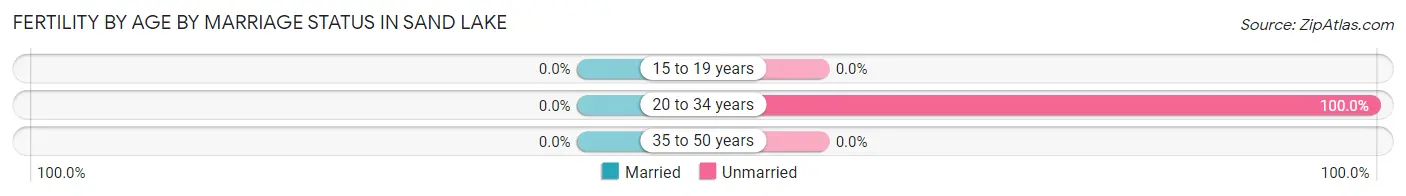
| Age Bracket | Married | Unmarried |
| 15 to 19 years | 0 (0.0%) | 0 (0.0%) |
| 20 to 34 years | 0 (0.0%) | 5 (100.0%) |
| 35 to 50 years | 0 (0.0%) | 0 (0.0%) |
| Total | 0 (0.0%) | 5 (100.0%) |
Fertility by Education in Sand Lake
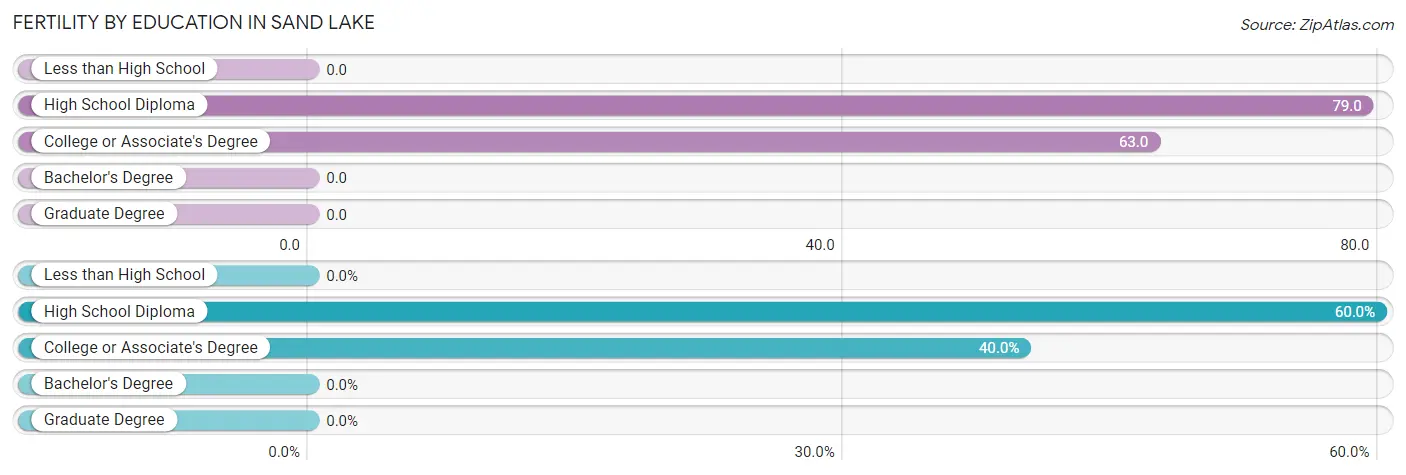
| Educational Attainment | Women with Births | Births / 1,000 Women |
| Less than High School | 0 (0.0%) | 0.0 |
| High School Diploma | 3 (60.0%) | 79.0 |
| College or Associate's Degree | 2 (40.0%) | 63.0 |
| Bachelor's Degree | 0 (0.0%) | 0.0 |
| Graduate Degree | 0 (0.0%) | 0.0 |
| Total | 5 (100.0%) | 57.0 |
Fertility by Education by Marriage Status in Sand Lake
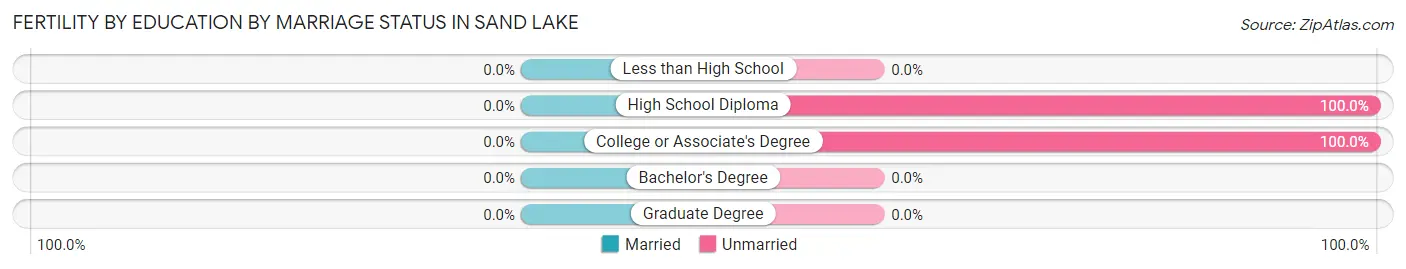
| Educational Attainment | Married | Unmarried |
| Less than High School | 0 (0.0%) | 0 (0.0%) |
| High School Diploma | 0 (0.0%) | 3 (100.0%) |
| College or Associate's Degree | 0 (0.0%) | 2 (100.0%) |
| Bachelor's Degree | 0 (0.0%) | 0 (0.0%) |
| Graduate Degree | 0 (0.0%) | 0 (0.0%) |
| Total | 0 (0.0%) | 5 (100.0%) |
Income in Sand Lake
Income Overview in Sand Lake
| Characteristic | Number | Measure |
| Per Capita Income | 492 | $26,106 |
| Median Family Income | 115 | $65,625 |
| Mean Family Income | 115 | $78,595 |
| Median Household Income | 222 | $0 |
| Mean Household Income | 222 | $55,357 |
| Income Deficit | 115 | $0 |
| Wage / Income Gap (%) | 492 | 35.13% |
| Wage / Income Gap ($) | 492 | 64.87¢ per $1 |
| Gini / Inequality Index | 492 | 0.47 |
Earnings by Sex in Sand Lake
Average Earnings in Sand Lake are $27,902, $34,479 for men and $22,368 for women, a difference of 35.1%.
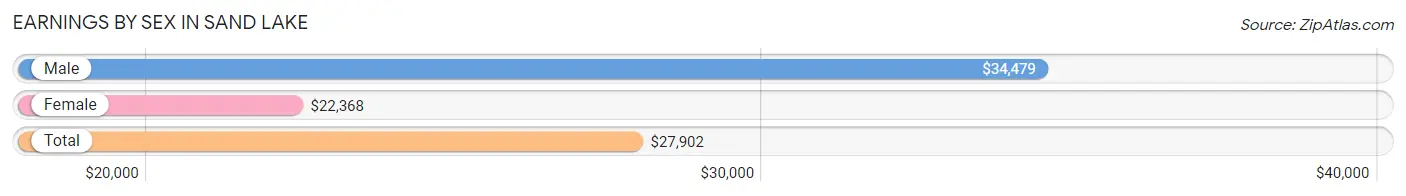
| Sex | Number | Average Earnings |
| Male | 106 (50.2%) | $34,479 |
| Female | 105 (49.8%) | $22,368 |
| Total | 211 (100.0%) | $27,902 |
Earnings by Sex by Income Bracket in Sand Lake
The most common earnings brackets in Sand Lake are $30,000 to $34,999 for men (13 | 12.3%) and $25,000 to $29,999 for women (14 | 13.3%).
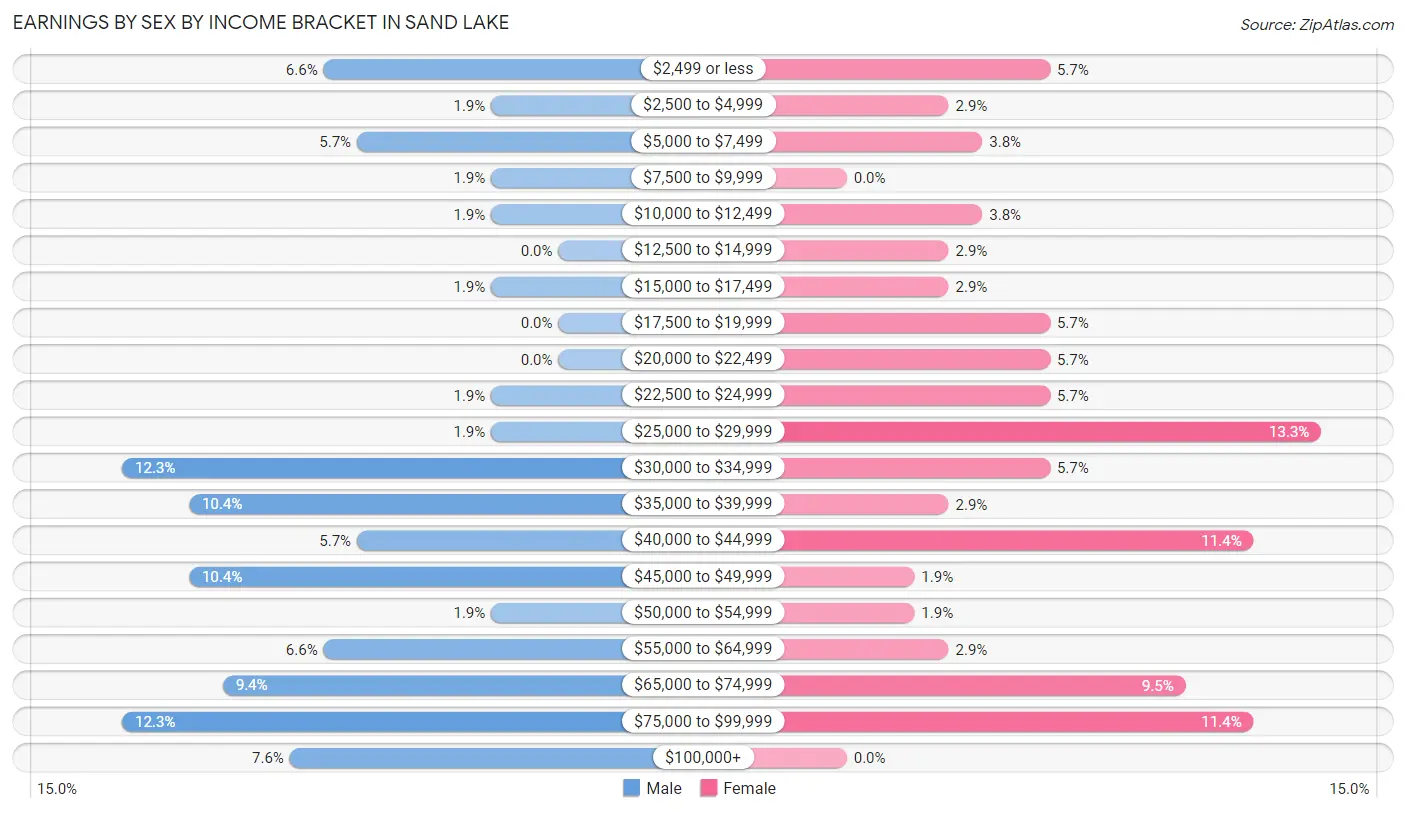
| Income | Male | Female |
| $2,499 or less | 7 (6.6%) | 6 (5.7%) |
| $2,500 to $4,999 | 2 (1.9%) | 3 (2.9%) |
| $5,000 to $7,499 | 6 (5.7%) | 4 (3.8%) |
| $7,500 to $9,999 | 2 (1.9%) | 0 (0.0%) |
| $10,000 to $12,499 | 2 (1.9%) | 4 (3.8%) |
| $12,500 to $14,999 | 0 (0.0%) | 3 (2.9%) |
| $15,000 to $17,499 | 2 (1.9%) | 3 (2.9%) |
| $17,500 to $19,999 | 0 (0.0%) | 6 (5.7%) |
| $20,000 to $22,499 | 0 (0.0%) | 6 (5.7%) |
| $22,500 to $24,999 | 2 (1.9%) | 6 (5.7%) |
| $25,000 to $29,999 | 2 (1.9%) | 14 (13.3%) |
| $30,000 to $34,999 | 13 (12.3%) | 6 (5.7%) |
| $35,000 to $39,999 | 11 (10.4%) | 3 (2.9%) |
| $40,000 to $44,999 | 6 (5.7%) | 12 (11.4%) |
| $45,000 to $49,999 | 11 (10.4%) | 2 (1.9%) |
| $50,000 to $54,999 | 2 (1.9%) | 2 (1.9%) |
| $55,000 to $64,999 | 7 (6.6%) | 3 (2.9%) |
| $65,000 to $74,999 | 10 (9.4%) | 10 (9.5%) |
| $75,000 to $99,999 | 13 (12.3%) | 12 (11.4%) |
| $100,000+ | 8 (7.5%) | 0 (0.0%) |
| Total | 106 (100.0%) | 105 (100.0%) |
Earnings by Sex by Educational Attainment in Sand Lake
Average earnings in Sand Lake are $45,909 for men and $40,208 for women, a difference of 12.4%. Men with an educational attainment of college or associate's degree enjoy the highest average annual earnings of $76,250, while those with less than high school education earn the least with $36,458. Women with an educational attainment of high school diploma earn the most with the average annual earnings of $41,250, while those with college or associate's degree education have the smallest earnings of $27,386.
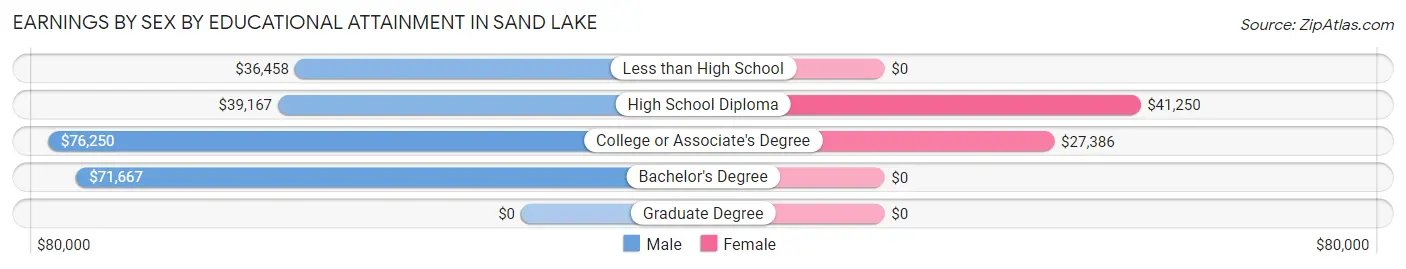
| Educational Attainment | Male Income | Female Income |
| Less than High School | $36,458 | $0 |
| High School Diploma | $39,167 | $41,250 |
| College or Associate's Degree | $76,250 | $27,386 |
| Bachelor's Degree | $71,667 | $0 |
| Graduate Degree | - | - |
| Total | $45,909 | $40,208 |
Family Income in Sand Lake
Family Income Brackets in Sand Lake
According to the Sand Lake family income data, there are 30 families falling into the $50,000 to $74,999 income range, which is the most common income bracket and makes up 26.1% of all families.
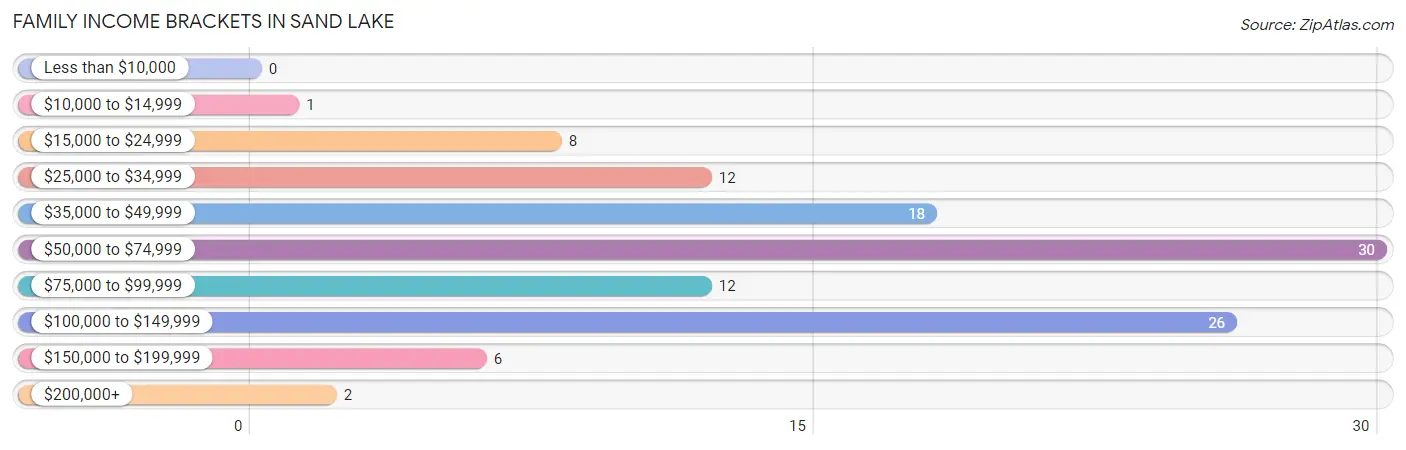
| Income Bracket | # Families | % Families |
| Less than $10,000 | 0 | 0.0% |
| $10,000 to $14,999 | 1 | 0.9% |
| $15,000 to $24,999 | 8 | 7.0% |
| $25,000 to $34,999 | 12 | 10.4% |
| $35,000 to $49,999 | 18 | 15.7% |
| $50,000 to $74,999 | 30 | 26.1% |
| $75,000 to $99,999 | 12 | 10.4% |
| $100,000 to $149,999 | 26 | 22.6% |
| $150,000 to $199,999 | 6 | 5.2% |
| $200,000+ | 2 | 1.7% |
Family Income by Famaliy Size in Sand Lake
4-person families (20 | 17.4%) account for the highest median family income in Sand Lake with $111,250 per family, while 3-person families (22 | 19.1%) have the highest median income of $31,250 per family member.
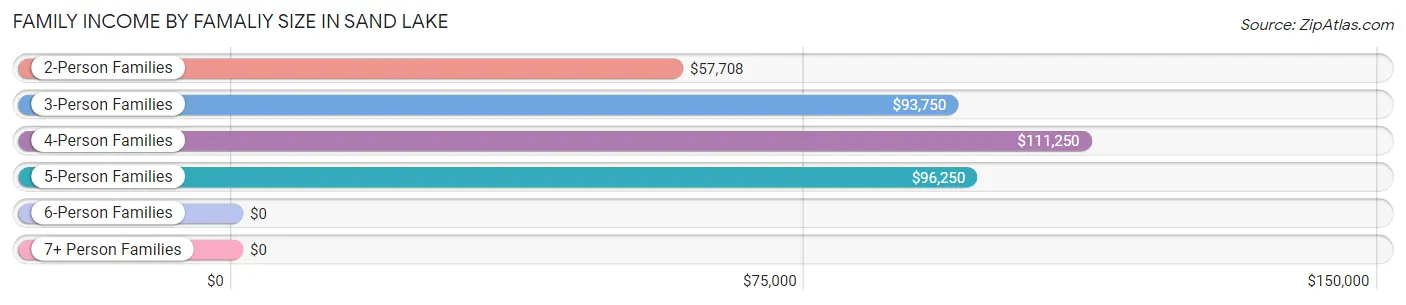
| Income Bracket | # Families | Median Income |
| 2-Person Families | 59 (51.3%) | $57,708 |
| 3-Person Families | 22 (19.1%) | $93,750 |
| 4-Person Families | 20 (17.4%) | $111,250 |
| 5-Person Families | 12 (10.4%) | $96,250 |
| 6-Person Families | 1 (0.9%) | $0 |
| 7+ Person Families | 1 (0.9%) | $0 |
| Total | 115 (100.0%) | $65,625 |
Family Income by Number of Earners in Sand Lake
The median family income in Sand Lake is $65,625, with families comprising 3+ earners (8) having the highest median family income of $133,750, while families with no earners (13) have the lowest median family income of $33,125, accounting for 7.0% and 11.3% of families, respectively.
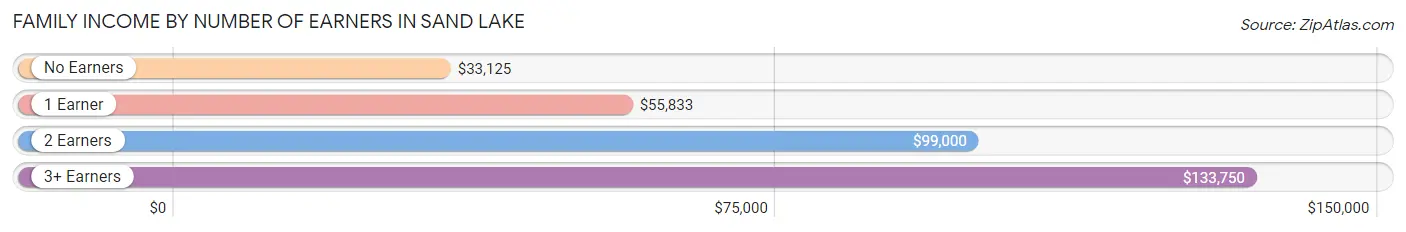
| Number of Earners | # Families | Median Income |
| No Earners | 13 (11.3%) | $33,125 |
| 1 Earner | 44 (38.3%) | $55,833 |
| 2 Earners | 50 (43.5%) | $99,000 |
| 3+ Earners | 8 (7.0%) | $133,750 |
| Total | 115 (100.0%) | $65,625 |
Household Income in Sand Lake
Household Income Brackets in Sand Lake
With 73 households falling in the category, the $15,000 to $24,999 income range is the most frequent in Sand Lake, accounting for 32.9% of all households. In contrast, only 4 households (1.8%) fall into the $200,000+ income bracket, making it the least populous group.
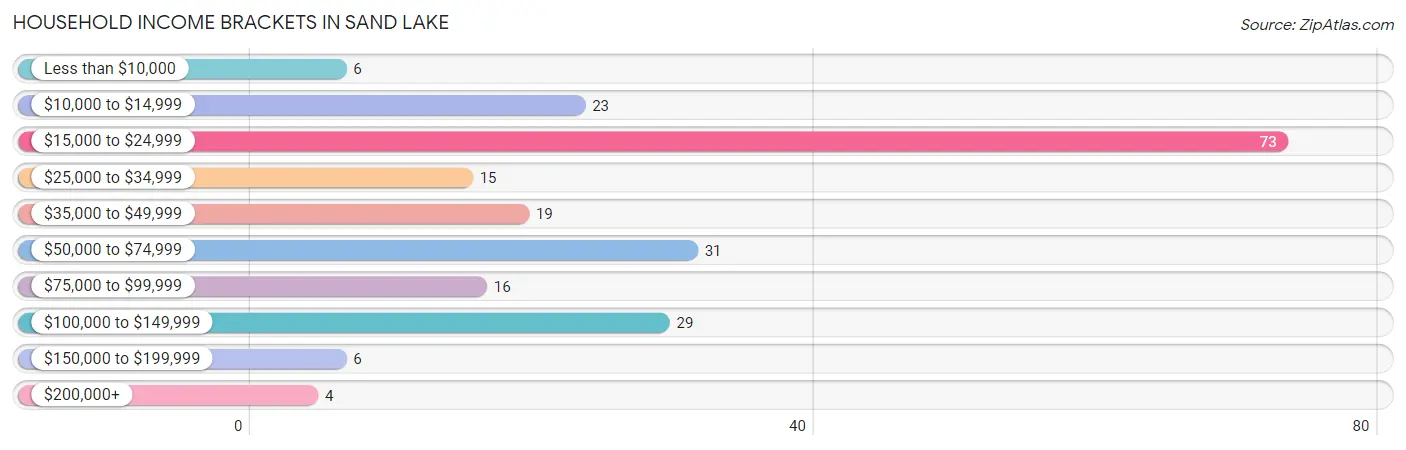
| Income Bracket | # Households | % Households |
| Less than $10,000 | 6 | 2.7% |
| $10,000 to $14,999 | 23 | 10.4% |
| $15,000 to $24,999 | 73 | 32.9% |
| $25,000 to $34,999 | 15 | 6.8% |
| $35,000 to $49,999 | 19 | 8.6% |
| $50,000 to $74,999 | 31 | 14.0% |
| $75,000 to $99,999 | 16 | 7.2% |
| $100,000 to $149,999 | 29 | 13.1% |
| $150,000 to $199,999 | 6 | 2.7% |
| $200,000+ | 4 | 1.8% |
Household Income by Householder Age in Sand Lake
The median household income in Sand Lake is $0, with the highest median household income of $66,250 found in the 25 to 44 years age bracket for the primary householder. A total of 42 households (18.9%) fall into this category. Meanwhile, the 15 to 24 years age bracket for the primary householder has the lowest median household income of $0, with 4 households (1.8%) in this group.
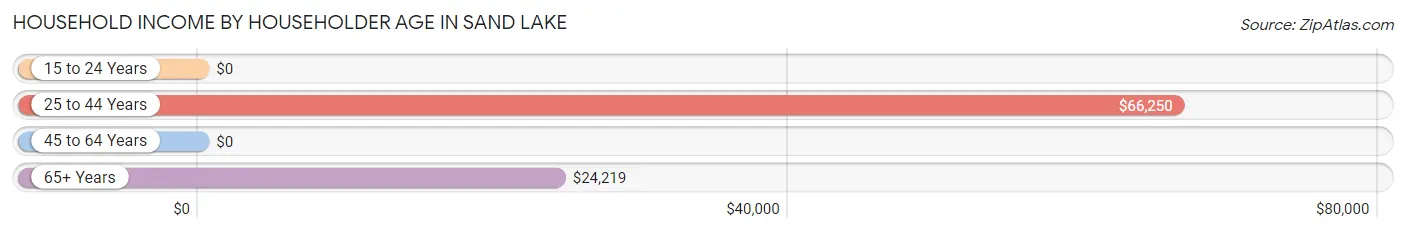
| Income Bracket | # Households | Median Income |
| 15 to 24 Years | 4 (1.8%) | $0 |
| 25 to 44 Years | 42 (18.9%) | $66,250 |
| 45 to 64 Years | 95 (42.8%) | $0 |
| 65+ Years | 81 (36.5%) | $24,219 |
| Total | 222 (100.0%) | $0 |
Poverty in Sand Lake
Income Below Poverty by Sex and Age in Sand Lake
With 7.3% poverty level for males and 9.3% for females among the residents of Sand Lake, 12 to 14 year old males and 5 year old females are the most vulnerable to poverty, with 2 males (40.0%) and 3 females (75.0%) in their respective age groups living below the poverty level.
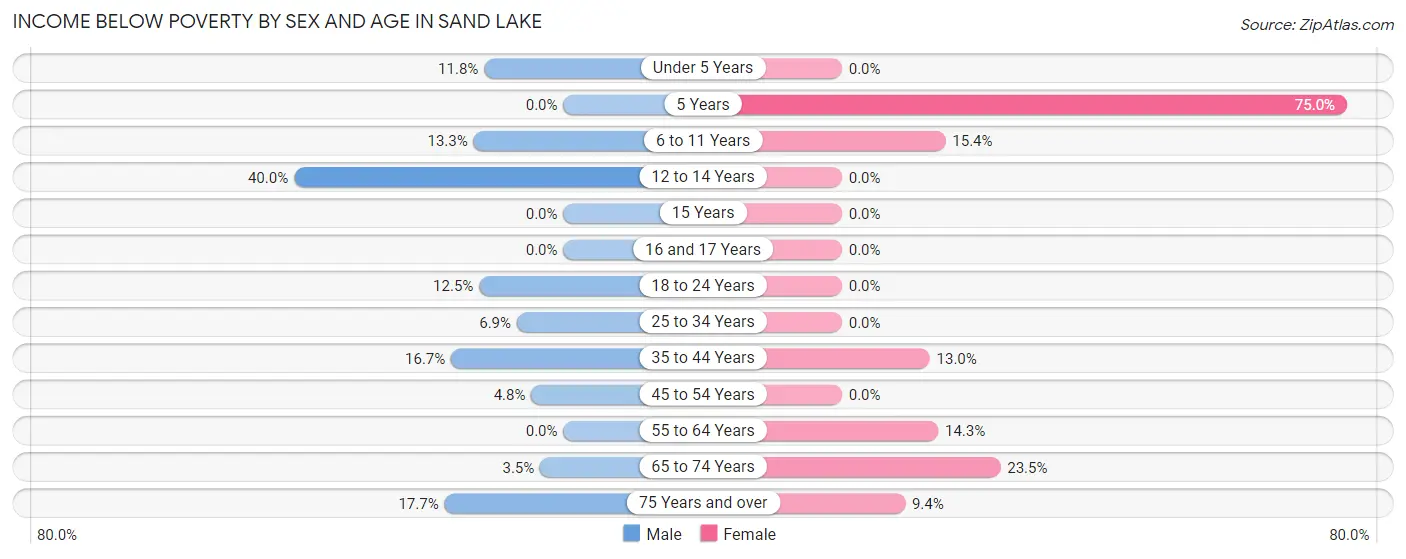
| Age Bracket | Male | Female |
| Under 5 Years | 2 (11.8%) | 0 (0.0%) |
| 5 Years | 0 (0.0%) | 3 (75.0%) |
| 6 to 11 Years | 2 (13.3%) | 2 (15.4%) |
| 12 to 14 Years | 2 (40.0%) | 0 (0.0%) |
| 15 Years | 0 (0.0%) | 0 (0.0%) |
| 16 and 17 Years | 0 (0.0%) | 0 (0.0%) |
| 18 to 24 Years | 2 (12.5%) | 0 (0.0%) |
| 25 to 34 Years | 2 (6.9%) | 0 (0.0%) |
| 35 to 44 Years | 3 (16.7%) | 3 (13.0%) |
| 45 to 54 Years | 1 (4.8%) | 0 (0.0%) |
| 55 to 64 Years | 0 (0.0%) | 4 (14.3%) |
| 65 to 74 Years | 1 (3.5%) | 8 (23.5%) |
| 75 Years and over | 3 (17.6%) | 3 (9.4%) |
| Total | 18 (7.3%) | 23 (9.3%) |
Income Above Poverty by Sex and Age in Sand Lake
According to the poverty statistics in Sand Lake, males aged 16 and 17 years and females aged under 5 years are the age groups that are most secure financially, with 100.0% of males and 100.0% of females in these age groups living above the poverty line.
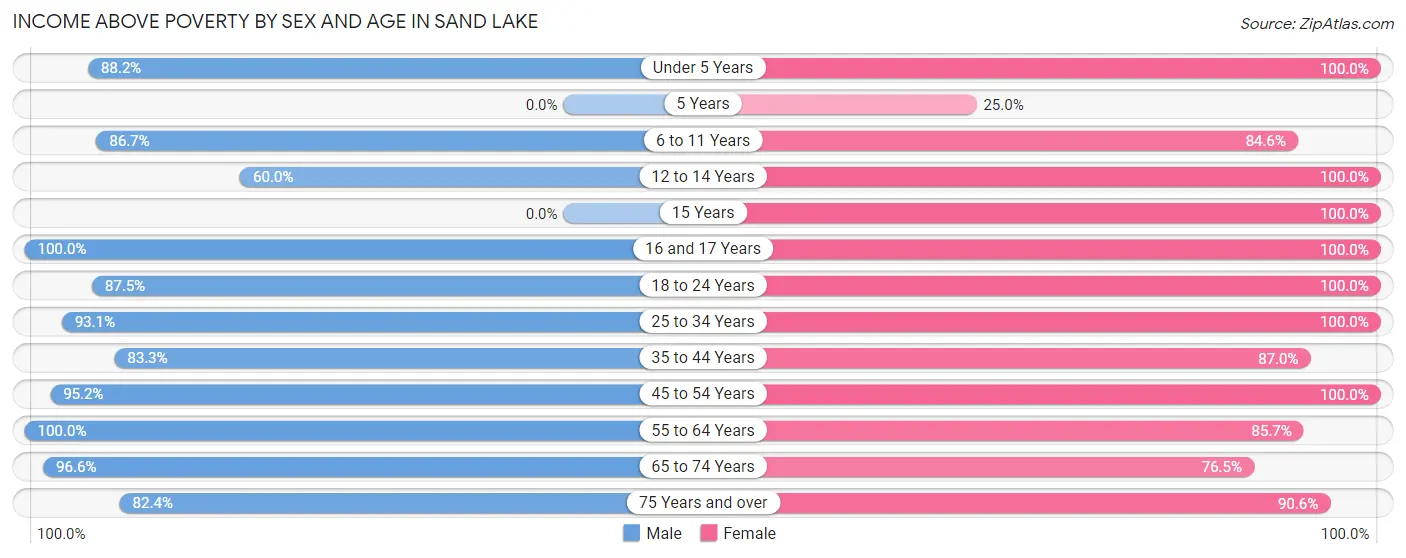
| Age Bracket | Male | Female |
| Under 5 Years | 15 (88.2%) | 31 (100.0%) |
| 5 Years | 0 (0.0%) | 1 (25.0%) |
| 6 to 11 Years | 13 (86.7%) | 11 (84.6%) |
| 12 to 14 Years | 3 (60.0%) | 9 (100.0%) |
| 15 Years | 0 (0.0%) | 1 (100.0%) |
| 16 and 17 Years | 2 (100.0%) | 1 (100.0%) |
| 18 to 24 Years | 14 (87.5%) | 26 (100.0%) |
| 25 to 34 Years | 27 (93.1%) | 24 (100.0%) |
| 35 to 44 Years | 15 (83.3%) | 20 (87.0%) |
| 45 to 54 Years | 20 (95.2%) | 21 (100.0%) |
| 55 to 64 Years | 76 (100.0%) | 24 (85.7%) |
| 65 to 74 Years | 28 (96.6%) | 26 (76.5%) |
| 75 Years and over | 14 (82.4%) | 29 (90.6%) |
| Total | 227 (92.6%) | 224 (90.7%) |
Income Below Poverty Among Married-Couple Families in Sand Lake
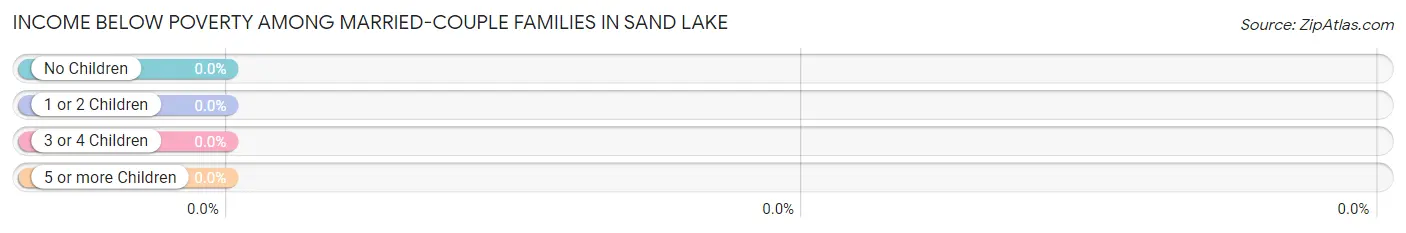
| Children | Above Poverty | Below Poverty |
| No Children | 43 (100.0%) | 0 (0.0%) |
| 1 or 2 Children | 17 (100.0%) | 0 (0.0%) |
| 3 or 4 Children | 8 (100.0%) | 0 (0.0%) |
| 5 or more Children | 1 (100.0%) | 0 (0.0%) |
| Total | 69 (100.0%) | 0 (0.0%) |
Income Below Poverty Among Single-Parent Households in Sand Lake
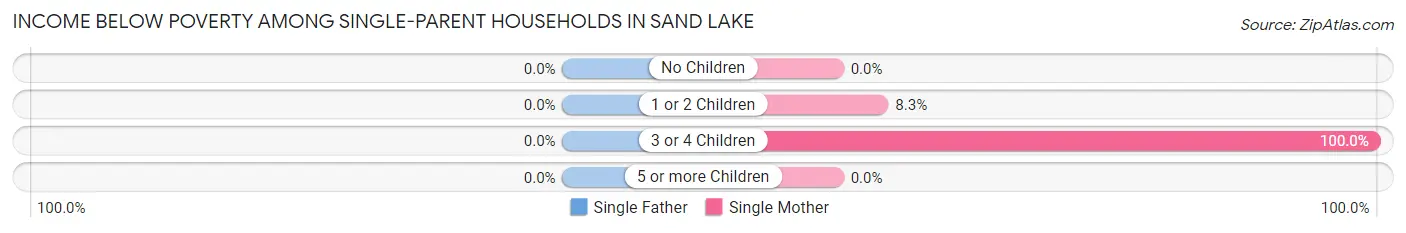
| Children | Single Father | Single Mother |
| No Children | 0 (0.0%) | 0 (0.0%) |
| 1 or 2 Children | 0 (0.0%) | 1 (8.3%) |
| 3 or 4 Children | 0 (0.0%) | 2 (100.0%) |
| 5 or more Children | 0 (0.0%) | 0 (0.0%) |
| Total | 0 (0.0%) | 3 (7.7%) |
Income Below Poverty Among Married-Couple vs Single-Parent Households in Sand Lake
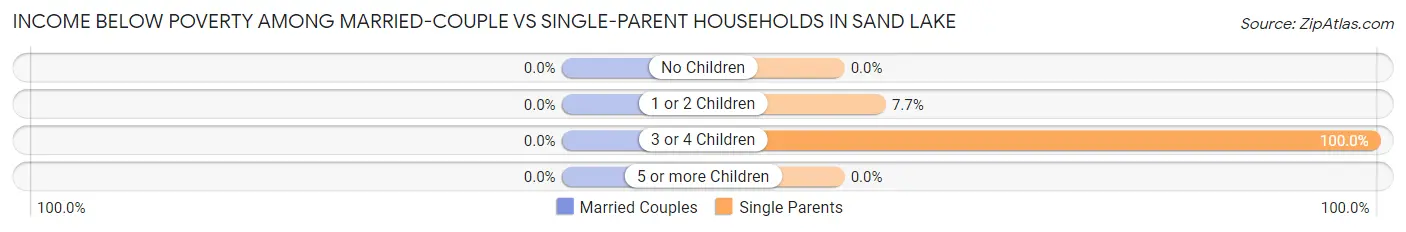
| Children | Married-Couple Families | Single-Parent Households |
| No Children | 0 (0.0%) | 0 (0.0%) |
| 1 or 2 Children | 0 (0.0%) | 1 (7.7%) |
| 3 or 4 Children | 0 (0.0%) | 2 (100.0%) |
| 5 or more Children | 0 (0.0%) | 0 (0.0%) |
| Total | 0 (0.0%) | 3 (6.5%) |
Employment Characteristics in Sand Lake
Employment by Class of Employer in Sand Lake
Among the 193 employed individuals in Sand Lake, private company employees (148 | 76.7%), self-employed (not incorporated) (13 | 6.7%), and federal government employees (13 | 6.7%) make up the most common classes of employment.
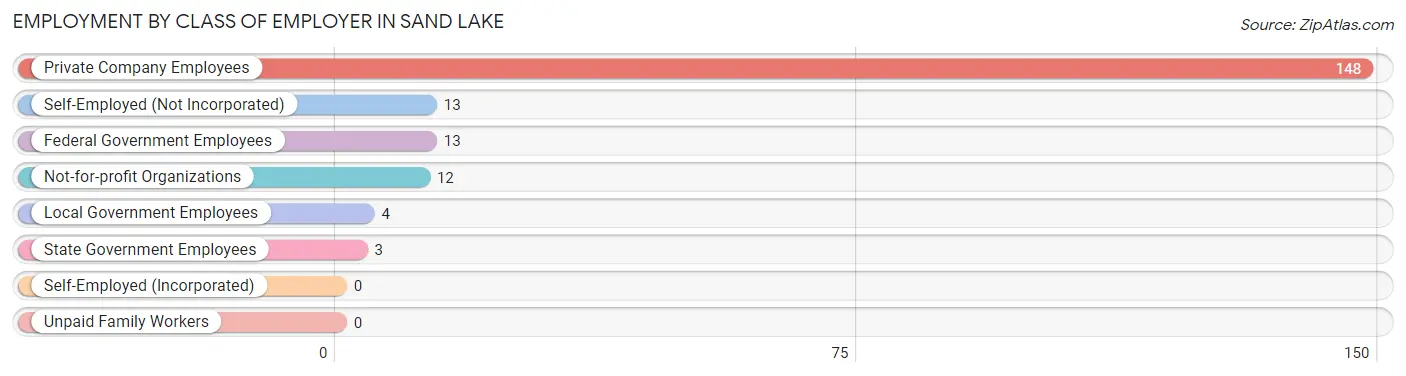
| Employer Class | # Employees | % Employees |
| Private Company Employees | 148 | 76.7% |
| Self-Employed (Incorporated) | 0 | 0.0% |
| Self-Employed (Not Incorporated) | 13 | 6.7% |
| Not-for-profit Organizations | 12 | 6.2% |
| Local Government Employees | 4 | 2.1% |
| State Government Employees | 3 | 1.5% |
| Federal Government Employees | 13 | 6.7% |
| Unpaid Family Workers | 0 | 0.0% |
| Total | 193 | 100.0% |
Employment Status by Age in Sand Lake
According to the labor force statistics for Sand Lake, out of the total population over 16 years of age (397), 50.4% or 200 individuals are in the labor force, with 2.5% or 5 of them unemployed. The age group with the highest labor force participation rate is 20 to 24 years, with 100.0% or 30 individuals in the labor force. Within the labor force, the 60 to 64 years age range has the highest percentage of unemployed individuals, with 9.5% or 2 of them being unemployed.
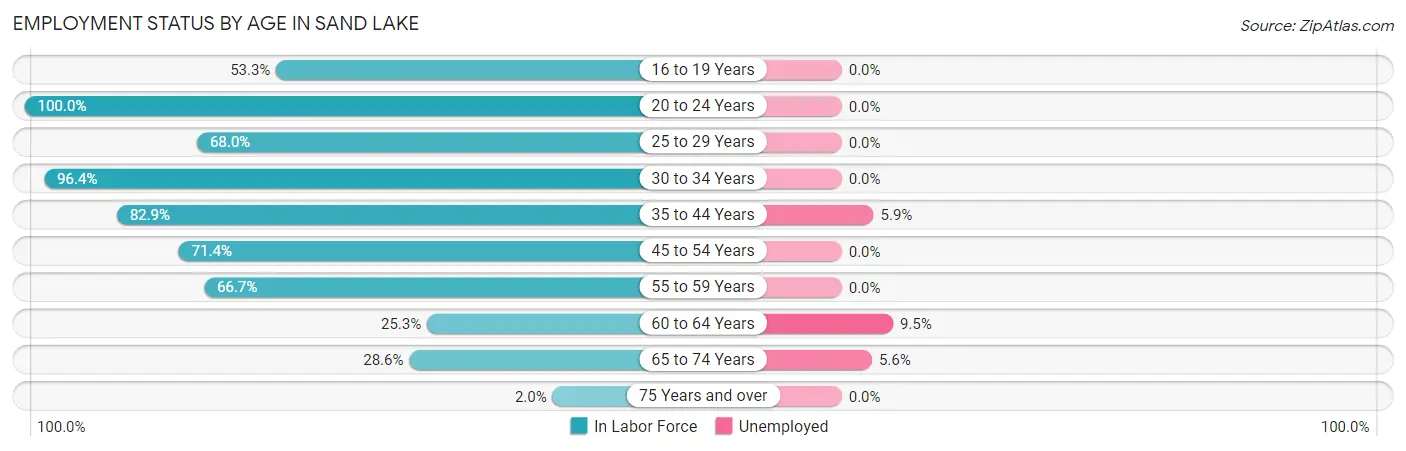
| Age Bracket | In Labor Force | Unemployed |
| 16 to 19 Years | 8 (53.3%) | 0 (0.0%) |
| 20 to 24 Years | 30 (100.0%) | 0 (0.0%) |
| 25 to 29 Years | 17 (68.0%) | 0 (0.0%) |
| 30 to 34 Years | 27 (96.4%) | 0 (0.0%) |
| 35 to 44 Years | 34 (82.9%) | 2 (5.9%) |
| 45 to 54 Years | 30 (71.4%) | 0 (0.0%) |
| 55 to 59 Years | 14 (66.7%) | 0 (0.0%) |
| 60 to 64 Years | 21 (25.3%) | 2 (9.5%) |
| 65 to 74 Years | 18 (28.6%) | 1 (5.6%) |
| 75 Years and over | 1 (2.0%) | 0 (0.0%) |
| Total | 200 (50.4%) | 5 (2.5%) |
Employment Status by Educational Attainment in Sand Lake
According to labor force statistics for Sand Lake, 59.6% of individuals (143) out of the total population between 25 and 64 years of age (240) are in the labor force, with 2.8% or 4 of them being unemployed. The group with the highest labor force participation rate are those with the educational attainment of bachelor's degree or higher, with 78.9% or 15 individuals in the labor force. Within the labor force, individuals with less than high school education have the highest percentage of unemployment, with 10.0% or 2 of them being unemployed.
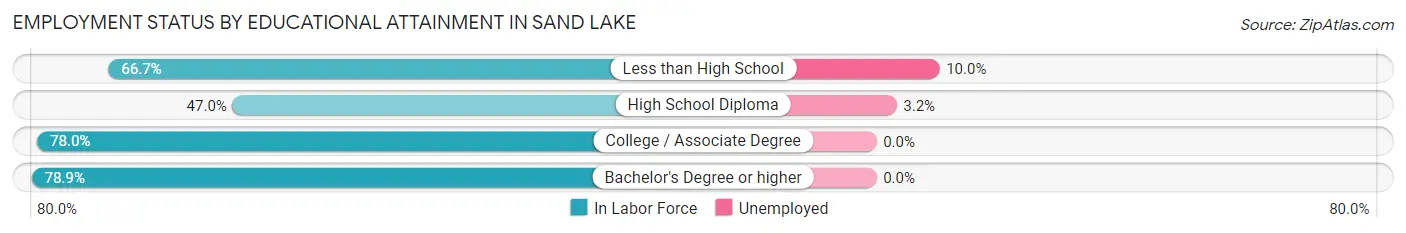
| Educational Attainment | In Labor Force | Unemployed |
| Less than High School | 20 (66.7%) | 3 (10.0%) |
| High School Diploma | 62 (47.0%) | 4 (3.2%) |
| College / Associate Degree | 46 (78.0%) | 0 (0.0%) |
| Bachelor's Degree or higher | 15 (78.9%) | 0 (0.0%) |
| Total | 143 (59.6%) | 7 (2.8%) |
Employment Occupations by Sex in Sand Lake
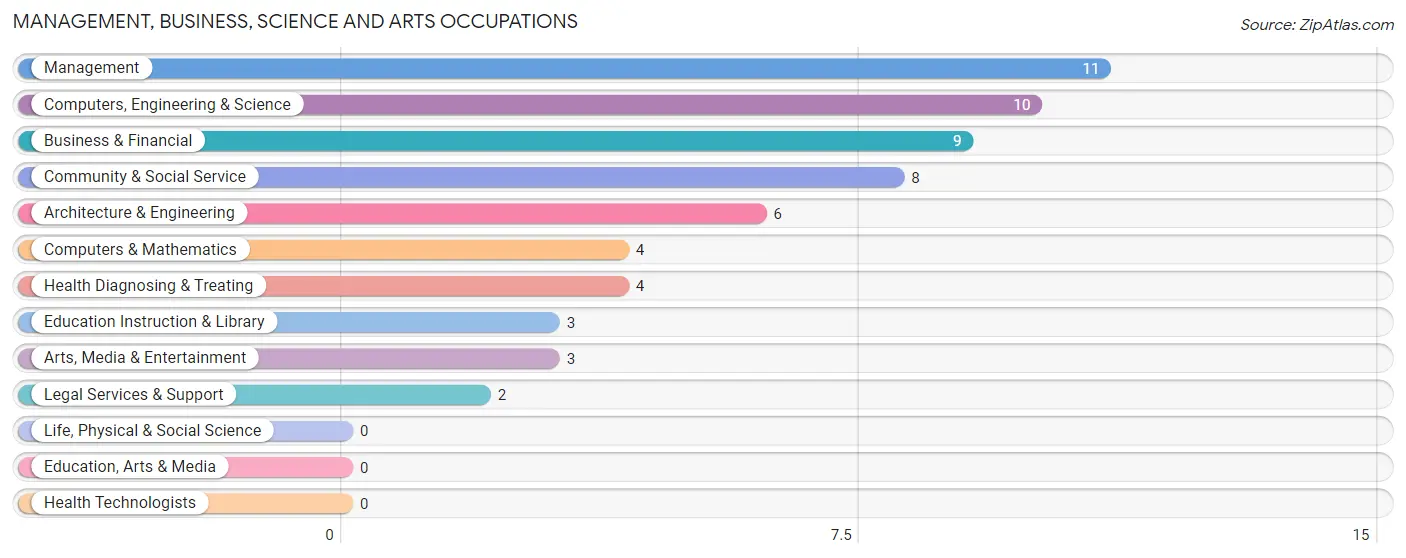
Management, Business, Science and Arts Occupations
The most common Management, Business, Science and Arts occupations in Sand Lake are Management (11 | 5.6%), Computers, Engineering & Science (10 | 5.1%), Business & Financial (9 | 4.6%), Community & Social Service (8 | 4.1%), and Architecture & Engineering (6 | 3.1%).
Management, Business, Science and Arts Occupations by Sex
Within the Management, Business, Science and Arts occupations in Sand Lake, the most male-oriented occupations are Legal Services & Support (100.0%), Community & Social Service (75.0%), and Business & Financial (66.7%), while the most female-oriented occupations are Health Diagnosing & Treating (100.0%), Management (72.7%), and Architecture & Engineering (66.7%).
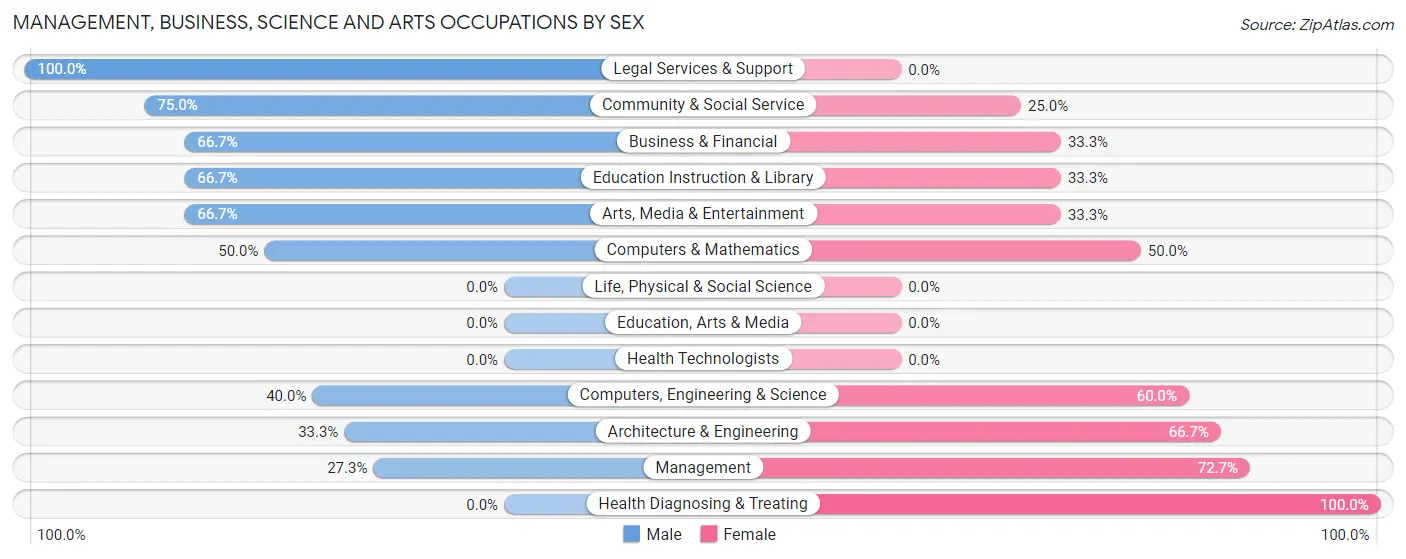
| Occupation | Male | Female |
| Management | 3 (27.3%) | 8 (72.7%) |
| Business & Financial | 6 (66.7%) | 3 (33.3%) |
| Computers, Engineering & Science | 4 (40.0%) | 6 (60.0%) |
| Computers & Mathematics | 2 (50.0%) | 2 (50.0%) |
| Architecture & Engineering | 2 (33.3%) | 4 (66.7%) |
| Life, Physical & Social Science | 0 (0.0%) | 0 (0.0%) |
| Community & Social Service | 6 (75.0%) | 2 (25.0%) |
| Education, Arts & Media | 0 (0.0%) | 0 (0.0%) |
| Legal Services & Support | 2 (100.0%) | 0 (0.0%) |
| Education Instruction & Library | 2 (66.7%) | 1 (33.3%) |
| Arts, Media & Entertainment | 2 (66.7%) | 1 (33.3%) |
| Health Diagnosing & Treating | 0 (0.0%) | 4 (100.0%) |
| Health Technologists | 0 (0.0%) | 0 (0.0%) |
| Total (Category) | 19 (45.2%) | 23 (54.8%) |
| Total (Overall) | 94 (48.2%) | 101 (51.8%) |
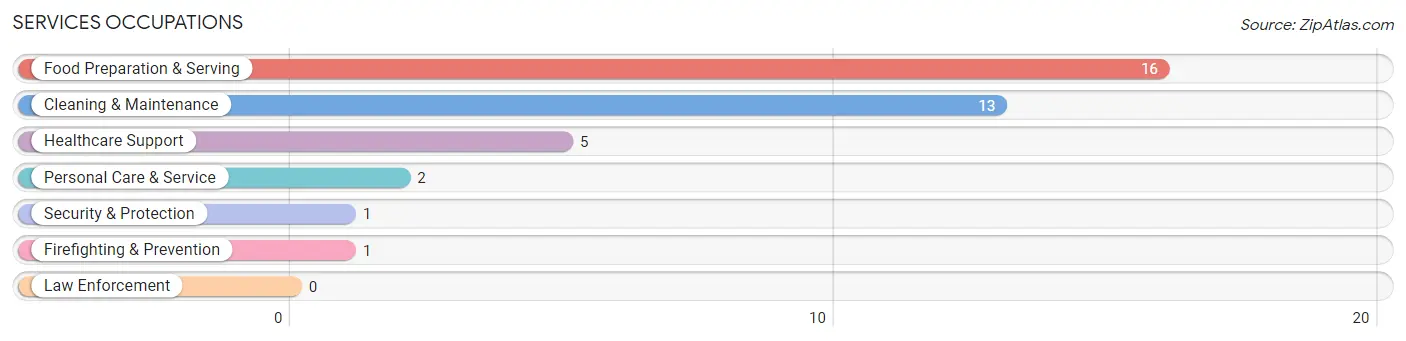
Services Occupations
The most common Services occupations in Sand Lake are Food Preparation & Serving (16 | 8.2%), Cleaning & Maintenance (13 | 6.7%), Healthcare Support (5 | 2.6%), Personal Care & Service (2 | 1.0%), and Security & Protection (1 | 0.5%).
Services Occupations by Sex
Within the Services occupations in Sand Lake, the most male-oriented occupations are Security & Protection (100.0%), Firefighting & Prevention (100.0%), and Cleaning & Maintenance (84.6%), while the most female-oriented occupations are Healthcare Support (100.0%), Personal Care & Service (100.0%), and Food Preparation & Serving (75.0%).
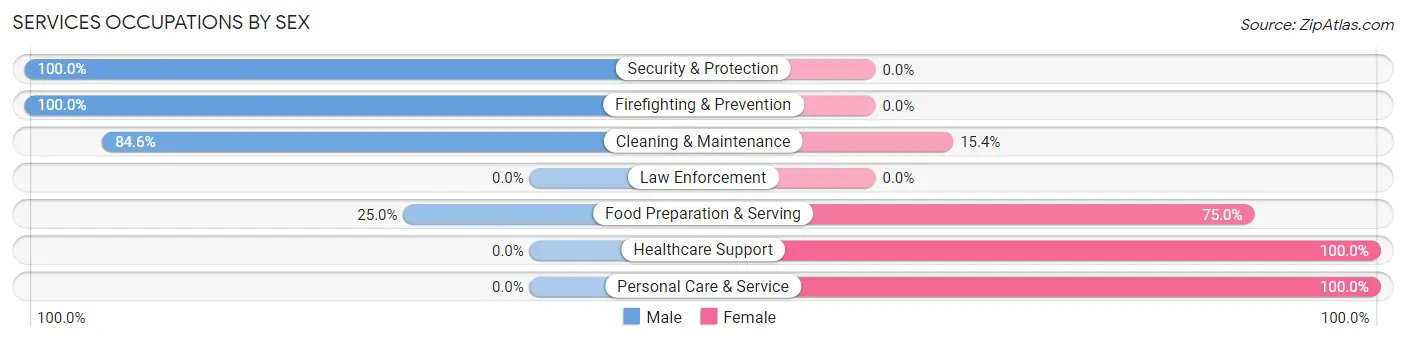
| Occupation | Male | Female |
| Healthcare Support | 0 (0.0%) | 5 (100.0%) |
| Security & Protection | 1 (100.0%) | 0 (0.0%) |
| Firefighting & Prevention | 1 (100.0%) | 0 (0.0%) |
| Law Enforcement | 0 (0.0%) | 0 (0.0%) |
| Food Preparation & Serving | 4 (25.0%) | 12 (75.0%) |
| Cleaning & Maintenance | 11 (84.6%) | 2 (15.4%) |
| Personal Care & Service | 0 (0.0%) | 2 (100.0%) |
| Total (Category) | 16 (43.2%) | 21 (56.8%) |
| Total (Overall) | 94 (48.2%) | 101 (51.8%) |
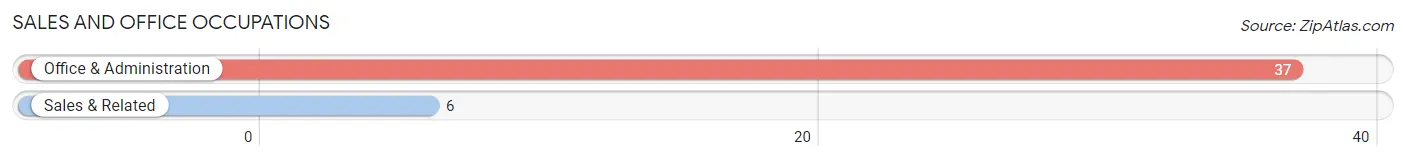
Sales and Office Occupations
The most common Sales and Office occupations in Sand Lake are Office & Administration (37 | 19.0%), and Sales & Related (6 | 3.1%).
Sales and Office Occupations by Sex
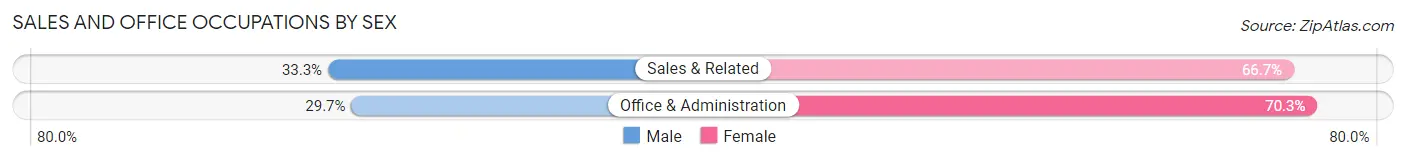
| Occupation | Male | Female |
| Sales & Related | 2 (33.3%) | 4 (66.7%) |
| Office & Administration | 11 (29.7%) | 26 (70.3%) |
| Total (Category) | 13 (30.2%) | 30 (69.8%) |
| Total (Overall) | 94 (48.2%) | 101 (51.8%) |
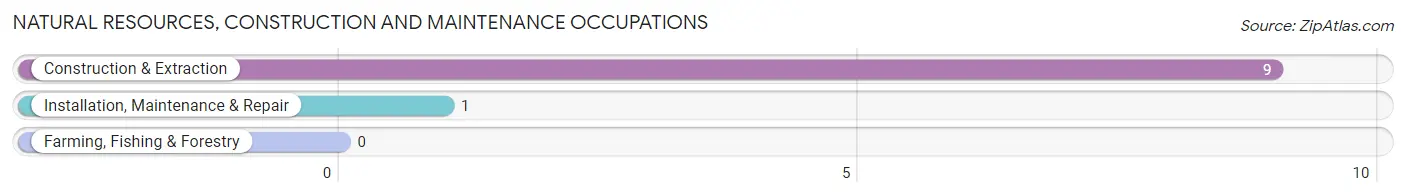
Natural Resources, Construction and Maintenance Occupations
The most common Natural Resources, Construction and Maintenance occupations in Sand Lake are Construction & Extraction (9 | 4.6%), and Installation, Maintenance & Repair (1 | 0.5%).
Natural Resources, Construction and Maintenance Occupations by Sex
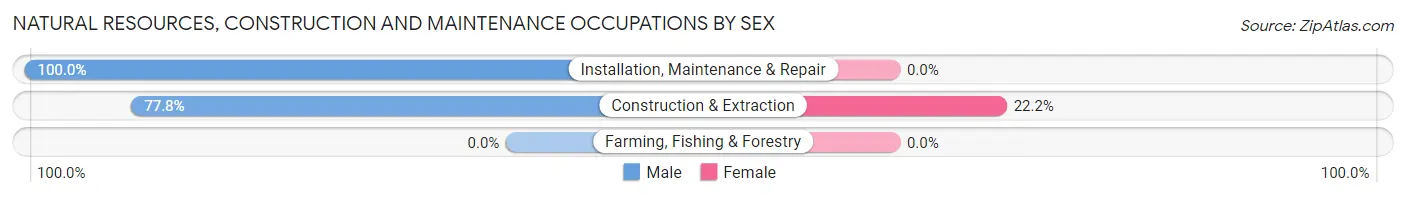
| Occupation | Male | Female |
| Farming, Fishing & Forestry | 0 (0.0%) | 0 (0.0%) |
| Construction & Extraction | 7 (77.8%) | 2 (22.2%) |
| Installation, Maintenance & Repair | 1 (100.0%) | 0 (0.0%) |
| Total (Category) | 8 (80.0%) | 2 (20.0%) |
| Total (Overall) | 94 (48.2%) | 101 (51.8%) |
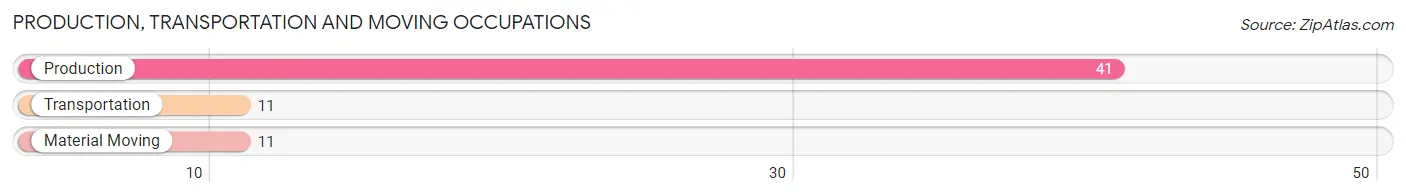
Production, Transportation and Moving Occupations
The most common Production, Transportation and Moving occupations in Sand Lake are Production (41 | 21.0%), Transportation (11 | 5.6%), and Material Moving (11 | 5.6%).
Production, Transportation and Moving Occupations by Sex
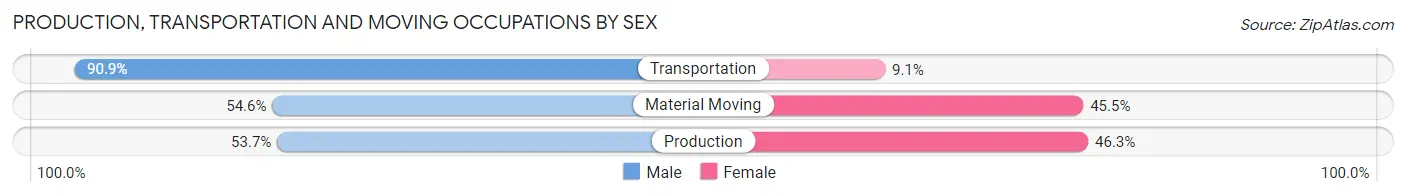
| Occupation | Male | Female |
| Production | 22 (53.7%) | 19 (46.3%) |
| Transportation | 10 (90.9%) | 1 (9.1%) |
| Material Moving | 6 (54.5%) | 5 (45.5%) |
| Total (Category) | 38 (60.3%) | 25 (39.7%) |
| Total (Overall) | 94 (48.2%) | 101 (51.8%) |
Employment Industries by Sex in Sand Lake
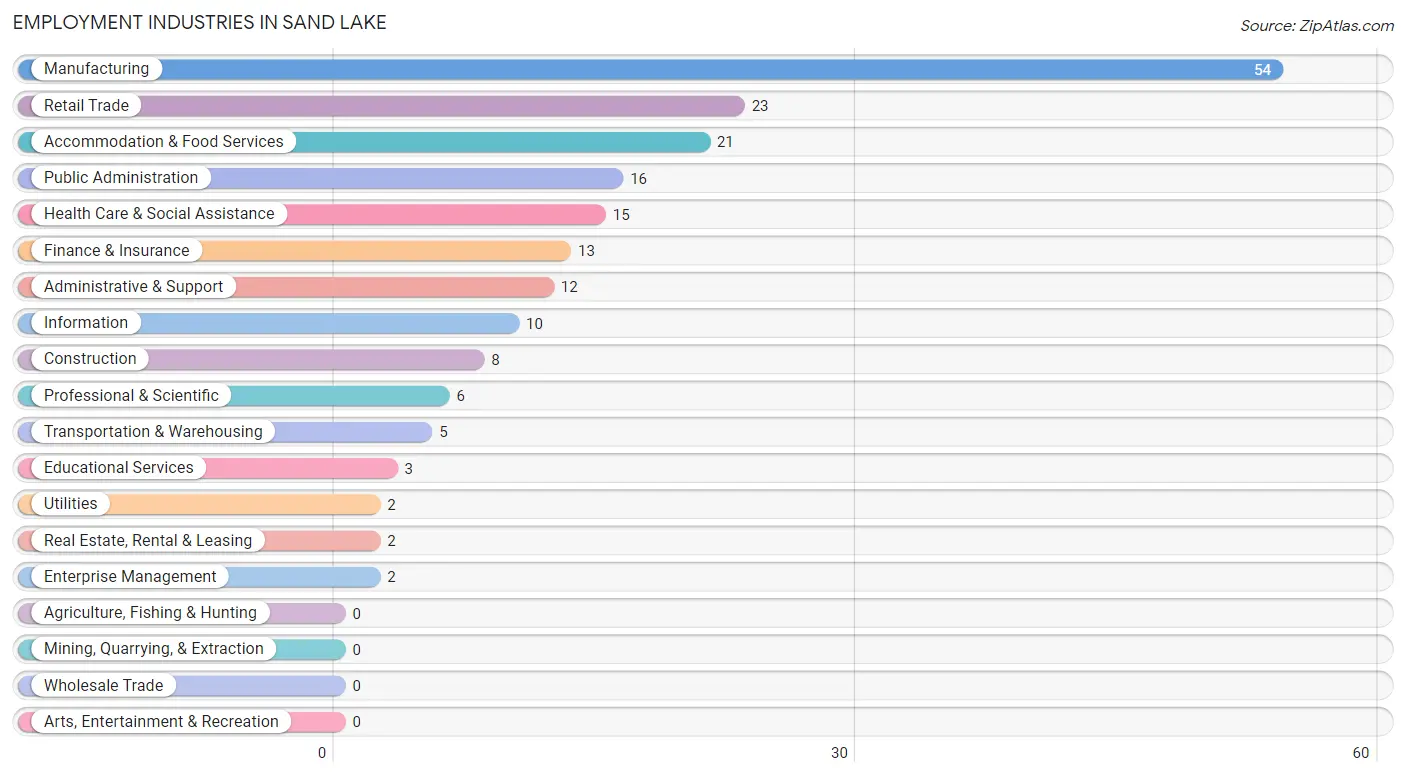
Employment Industries in Sand Lake
The major employment industries in Sand Lake include Manufacturing (54 | 27.7%), Retail Trade (23 | 11.8%), Accommodation & Food Services (21 | 10.8%), Public Administration (16 | 8.2%), and Health Care & Social Assistance (15 | 7.7%).
Employment Industries by Sex in Sand Lake
The Sand Lake industries that see more men than women are Transportation & Warehousing (100.0%), Utilities (100.0%), and Information (100.0%), whereas the industries that tend to have a higher number of women are Finance & Insurance (100.0%), Real Estate, Rental & Leasing (100.0%), and Enterprise Management (100.0%).
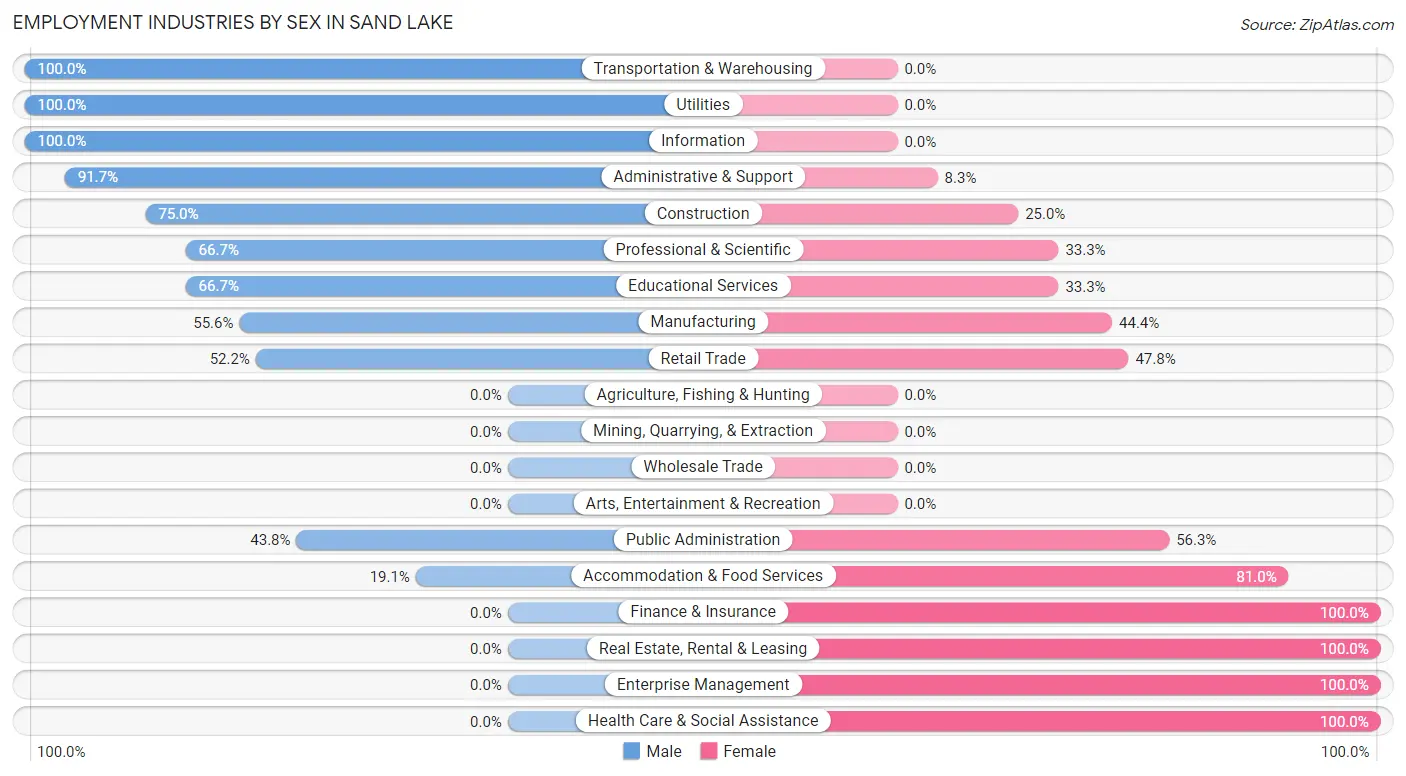
| Industry | Male | Female |
| Agriculture, Fishing & Hunting | 0 (0.0%) | 0 (0.0%) |
| Mining, Quarrying, & Extraction | 0 (0.0%) | 0 (0.0%) |
| Construction | 6 (75.0%) | 2 (25.0%) |
| Manufacturing | 30 (55.6%) | 24 (44.4%) |
| Wholesale Trade | 0 (0.0%) | 0 (0.0%) |
| Retail Trade | 12 (52.2%) | 11 (47.8%) |
| Transportation & Warehousing | 5 (100.0%) | 0 (0.0%) |
| Utilities | 2 (100.0%) | 0 (0.0%) |
| Information | 10 (100.0%) | 0 (0.0%) |
| Finance & Insurance | 0 (0.0%) | 13 (100.0%) |
| Real Estate, Rental & Leasing | 0 (0.0%) | 2 (100.0%) |
| Professional & Scientific | 4 (66.7%) | 2 (33.3%) |
| Enterprise Management | 0 (0.0%) | 2 (100.0%) |
| Administrative & Support | 11 (91.7%) | 1 (8.3%) |
| Educational Services | 2 (66.7%) | 1 (33.3%) |
| Health Care & Social Assistance | 0 (0.0%) | 15 (100.0%) |
| Arts, Entertainment & Recreation | 0 (0.0%) | 0 (0.0%) |
| Accommodation & Food Services | 4 (19.1%) | 17 (80.9%) |
| Public Administration | 7 (43.8%) | 9 (56.2%) |
| Total | 94 (48.2%) | 101 (51.8%) |
Education in Sand Lake
School Enrollment in Sand Lake
The most common levels of schooling among the 84 students in Sand Lake are elementary school (21 | 25.0%), college / undergraduate (17 | 20.2%), and nursery / preschool (16 | 19.1%).
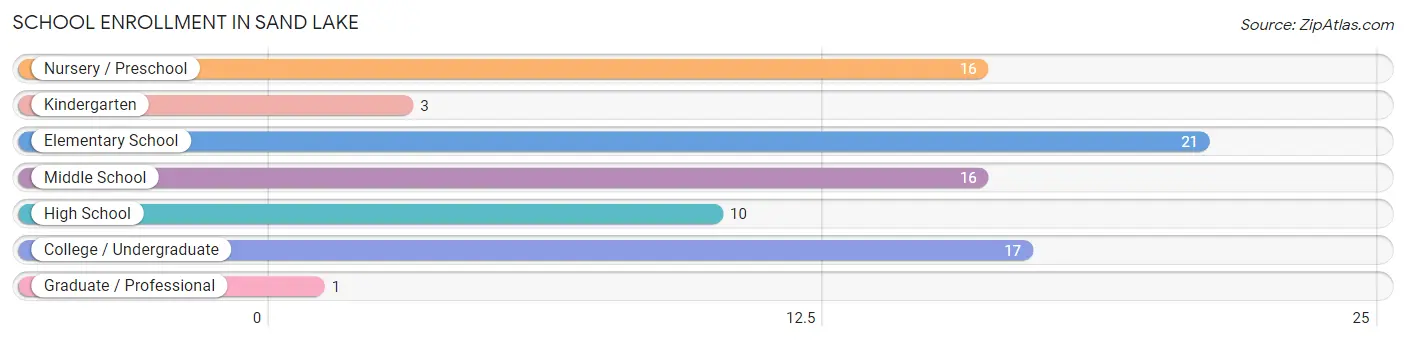
| School Level | # Students | % Students |
| Nursery / Preschool | 16 | 19.1% |
| Kindergarten | 3 | 3.6% |
| Elementary School | 21 | 25.0% |
| Middle School | 16 | 19.1% |
| High School | 10 | 11.9% |
| College / Undergraduate | 17 | 20.2% |
| Graduate / Professional | 1 | 1.2% |
| Total | 84 | 100.0% |
School Enrollment by Age by Funding Source in Sand Lake
Out of a total of 84 students who are enrolled in schools in Sand Lake, 11 (13.1%) attend a private institution, while the remaining 73 (86.9%) are enrolled in public schools. The age group of 25 to 34 year olds has the highest likelihood of being enrolled in private schools, with 6 (46.2% in the age bracket) enrolled. Conversely, the age group of 3 to 4 year olds has the lowest likelihood of being enrolled in a private school, with 13 (100.0% in the age bracket) attending a public institution.
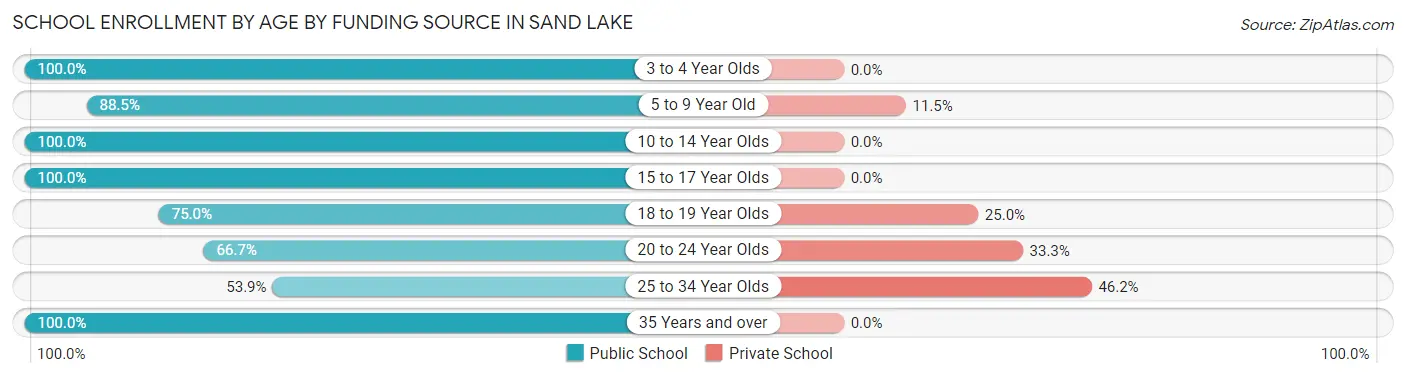
| Age Bracket | Public School | Private School |
| 3 to 4 Year Olds | 13 (100.0%) | 0 (0.0%) |
| 5 to 9 Year Old | 23 (88.5%) | 3 (11.5%) |
| 10 to 14 Year Olds | 20 (100.0%) | 0 (0.0%) |
| 15 to 17 Year Olds | 4 (100.0%) | 0 (0.0%) |
| 18 to 19 Year Olds | 3 (75.0%) | 1 (25.0%) |
| 20 to 24 Year Olds | 2 (66.7%) | 1 (33.3%) |
| 25 to 34 Year Olds | 7 (53.8%) | 6 (46.2%) |
| 35 Years and over | 1 (100.0%) | 0 (0.0%) |
| Total | 73 (86.9%) | 11 (13.1%) |
Educational Attainment by Field of Study in Sand Lake
Business (9 | 22.5%), education (6 | 15.0%), social sciences (4 | 10.0%), science & technology (4 | 10.0%), and liberal arts & history (4 | 10.0%) are the most common fields of study among 40 individuals in Sand Lake who have obtained a bachelor's degree or higher.
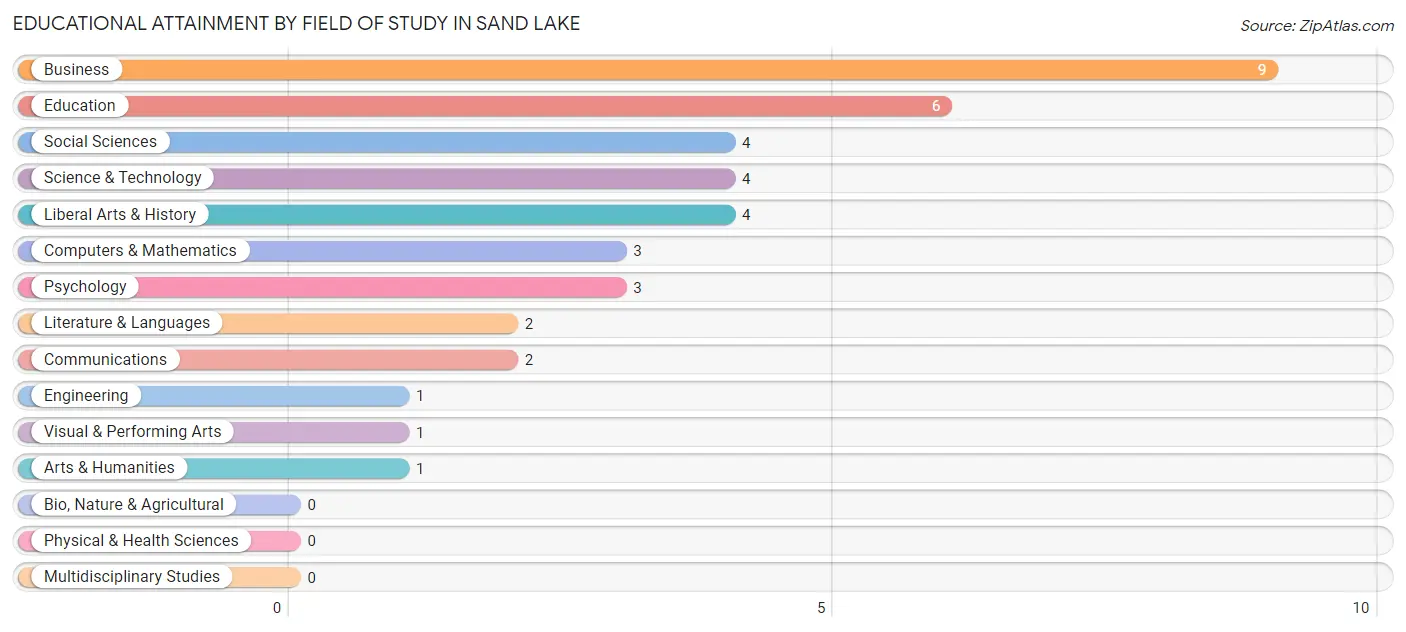
| Field of Study | # Graduates | % Graduates |
| Computers & Mathematics | 3 | 7.5% |
| Bio, Nature & Agricultural | 0 | 0.0% |
| Physical & Health Sciences | 0 | 0.0% |
| Psychology | 3 | 7.5% |
| Social Sciences | 4 | 10.0% |
| Engineering | 1 | 2.5% |
| Multidisciplinary Studies | 0 | 0.0% |
| Science & Technology | 4 | 10.0% |
| Business | 9 | 22.5% |
| Education | 6 | 15.0% |
| Literature & Languages | 2 | 5.0% |
| Liberal Arts & History | 4 | 10.0% |
| Visual & Performing Arts | 1 | 2.5% |
| Communications | 2 | 5.0% |
| Arts & Humanities | 1 | 2.5% |
| Total | 40 | 100.0% |
Transportation & Commute in Sand Lake
Vehicle Availability by Sex in Sand Lake
The most prevalent vehicle ownership categories in Sand Lake are males with 3 vehicles (35, accounting for 37.6%) and females with 3 vehicles (33, making up 35.0%).
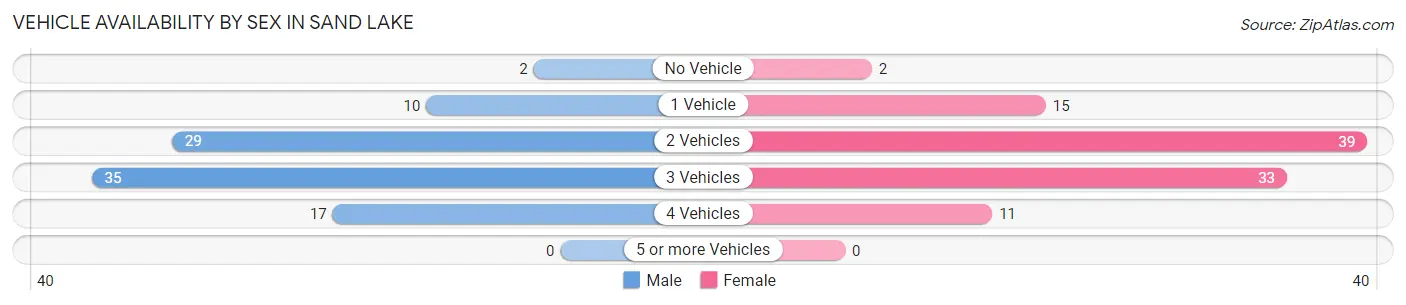
| Vehicles Available | Male | Female |
| No Vehicle | 2 (2.1%) | 2 (2.0%) |
| 1 Vehicle | 10 (10.7%) | 15 (15.0%) |
| 2 Vehicles | 29 (31.2%) | 39 (39.0%) |
| 3 Vehicles | 35 (37.6%) | 33 (33.0%) |
| 4 Vehicles | 17 (18.3%) | 11 (11.0%) |
| 5 or more Vehicles | 0 (0.0%) | 0 (0.0%) |
| Total | 93 (100.0%) | 100 (100.0%) |
Commute Time in Sand Lake
The most frequently occuring commute durations in Sand Lake are 20 to 24 minutes (35 commuters, 18.9%), 30 to 34 minutes (28 commuters, 15.1%), and 25 to 29 minutes (27 commuters, 14.6%).
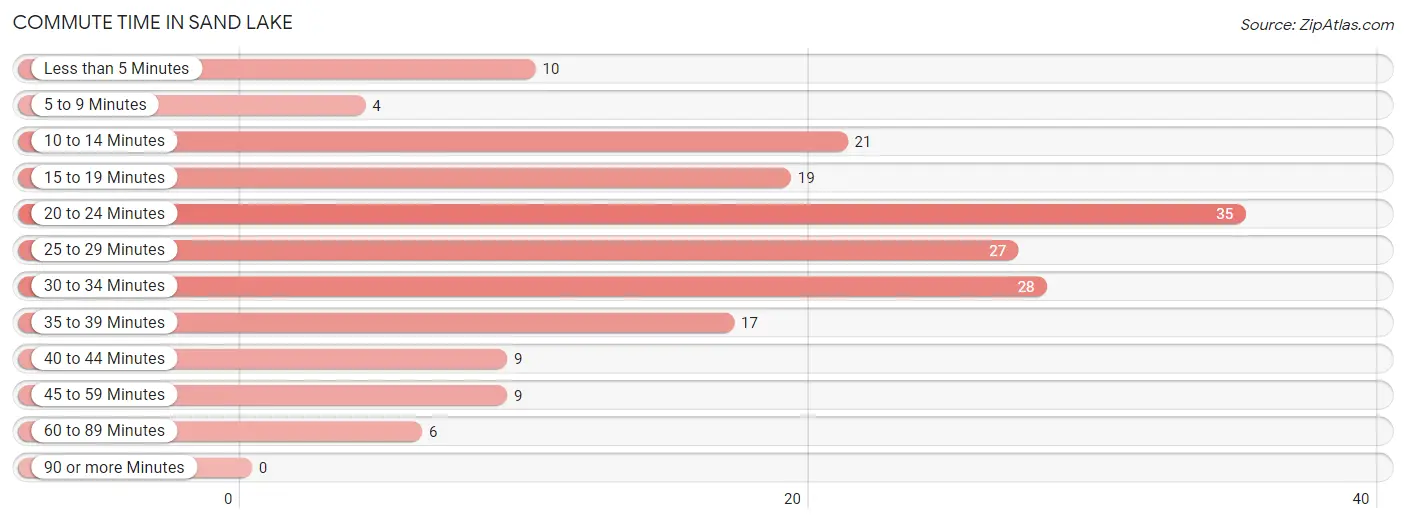
| Commute Time | # Commuters | % Commuters |
| Less than 5 Minutes | 10 | 5.4% |
| 5 to 9 Minutes | 4 | 2.2% |
| 10 to 14 Minutes | 21 | 11.4% |
| 15 to 19 Minutes | 19 | 10.3% |
| 20 to 24 Minutes | 35 | 18.9% |
| 25 to 29 Minutes | 27 | 14.6% |
| 30 to 34 Minutes | 28 | 15.1% |
| 35 to 39 Minutes | 17 | 9.2% |
| 40 to 44 Minutes | 9 | 4.9% |
| 45 to 59 Minutes | 9 | 4.9% |
| 60 to 89 Minutes | 6 | 3.2% |
| 90 or more Minutes | 0 | 0.0% |
Commute Time by Sex in Sand Lake
The most common commute times in Sand Lake are 35 to 39 minutes (16 commuters, 17.4%) for males and 20 to 24 minutes (25 commuters, 26.9%) for females.
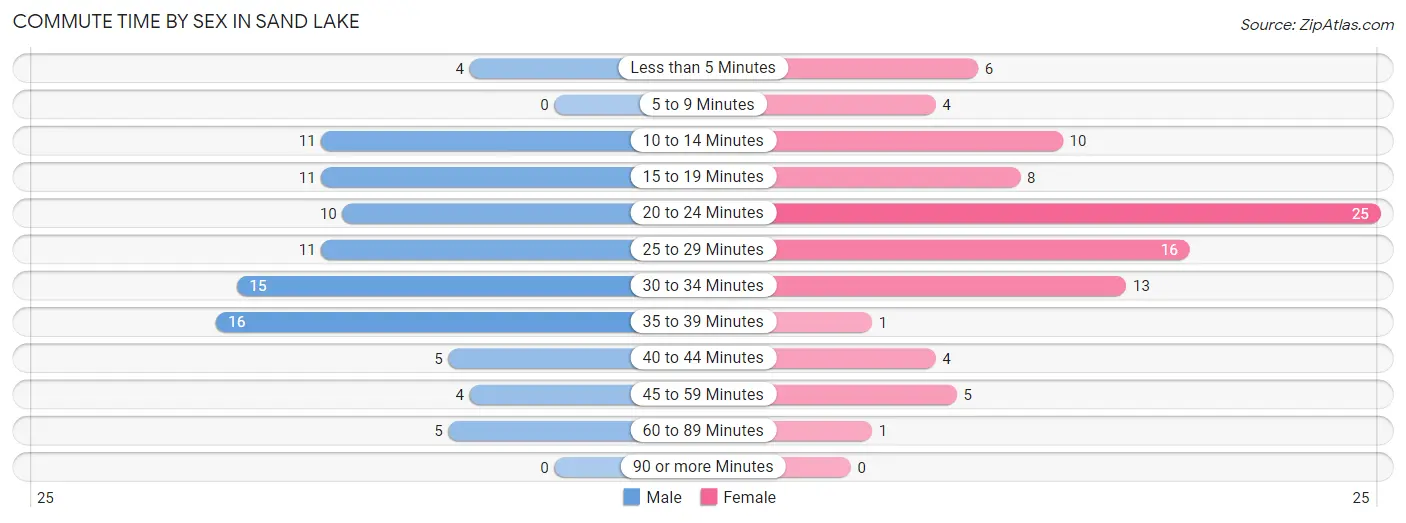
| Commute Time | Male | Female |
| Less than 5 Minutes | 4 (4.3%) | 6 (6.5%) |
| 5 to 9 Minutes | 0 (0.0%) | 4 (4.3%) |
| 10 to 14 Minutes | 11 (12.0%) | 10 (10.7%) |
| 15 to 19 Minutes | 11 (12.0%) | 8 (8.6%) |
| 20 to 24 Minutes | 10 (10.9%) | 25 (26.9%) |
| 25 to 29 Minutes | 11 (12.0%) | 16 (17.2%) |
| 30 to 34 Minutes | 15 (16.3%) | 13 (14.0%) |
| 35 to 39 Minutes | 16 (17.4%) | 1 (1.1%) |
| 40 to 44 Minutes | 5 (5.4%) | 4 (4.3%) |
| 45 to 59 Minutes | 4 (4.3%) | 5 (5.4%) |
| 60 to 89 Minutes | 5 (5.4%) | 1 (1.1%) |
| 90 or more Minutes | 0 (0.0%) | 0 (0.0%) |
Time of Departure to Work by Sex in Sand Lake
The most frequent times of departure to work in Sand Lake are 7:00 AM to 7:29 AM (17, 18.5%) for males and 6:30 AM to 6:59 AM (14, 15.0%) for females.
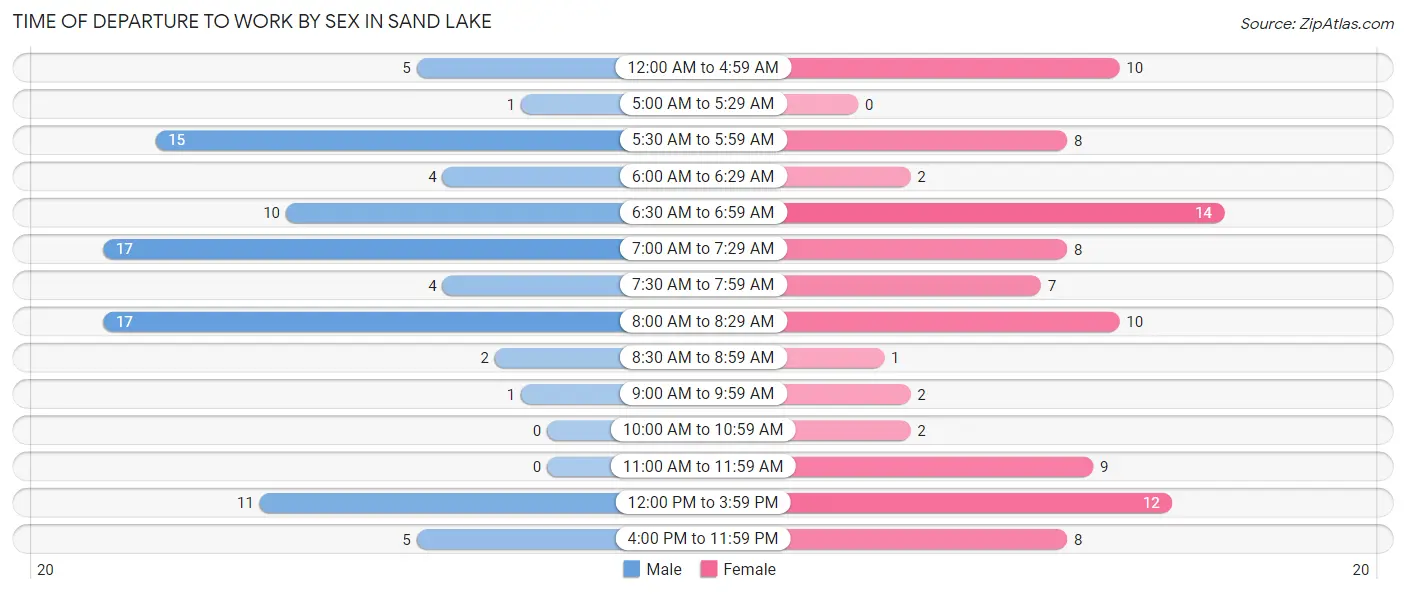
| Time of Departure | Male | Female |
| 12:00 AM to 4:59 AM | 5 (5.4%) | 10 (10.7%) |
| 5:00 AM to 5:29 AM | 1 (1.1%) | 0 (0.0%) |
| 5:30 AM to 5:59 AM | 15 (16.3%) | 8 (8.6%) |
| 6:00 AM to 6:29 AM | 4 (4.3%) | 2 (2.1%) |
| 6:30 AM to 6:59 AM | 10 (10.9%) | 14 (15.0%) |
| 7:00 AM to 7:29 AM | 17 (18.5%) | 8 (8.6%) |
| 7:30 AM to 7:59 AM | 4 (4.3%) | 7 (7.5%) |
| 8:00 AM to 8:29 AM | 17 (18.5%) | 10 (10.7%) |
| 8:30 AM to 8:59 AM | 2 (2.2%) | 1 (1.1%) |
| 9:00 AM to 9:59 AM | 1 (1.1%) | 2 (2.1%) |
| 10:00 AM to 10:59 AM | 0 (0.0%) | 2 (2.1%) |
| 11:00 AM to 11:59 AM | 0 (0.0%) | 9 (9.7%) |
| 12:00 PM to 3:59 PM | 11 (12.0%) | 12 (12.9%) |
| 4:00 PM to 11:59 PM | 5 (5.4%) | 8 (8.6%) |
| Total | 92 (100.0%) | 93 (100.0%) |
Housing Occupancy in Sand Lake
Occupancy by Ownership in Sand Lake
Of the total 569 dwellings in Sand Lake, owner-occupied units account for 514 (90.3%), while renter-occupied units make up 55 (9.7%).
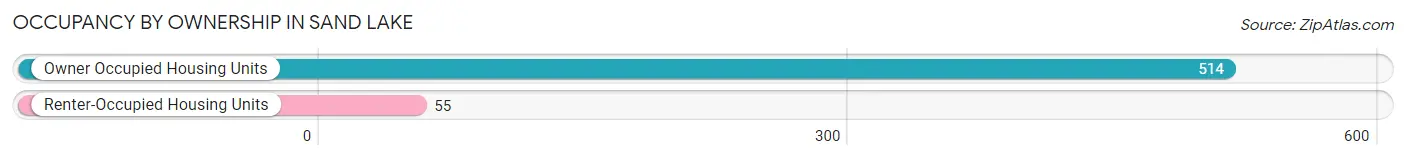
| Occupancy | # Housing Units | % Housing Units |
| Owner Occupied Housing Units | 514 | 90.3% |
| Renter-Occupied Housing Units | 55 | 9.7% |
| Total Occupied Housing Units | 569 | 100.0% |
Occupancy by Household Size in Sand Lake
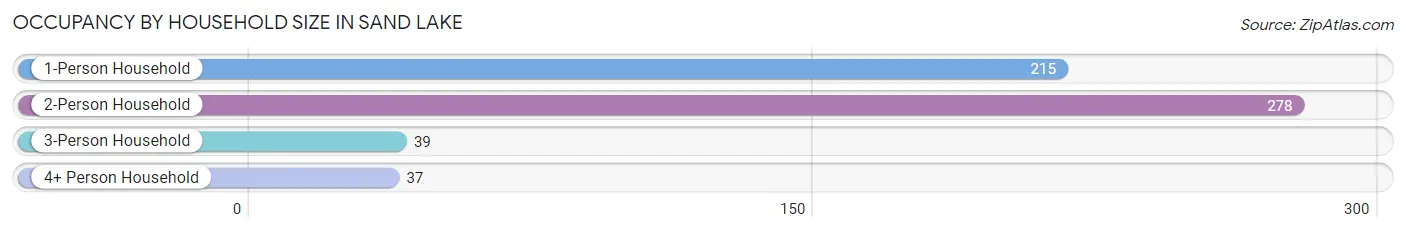
| Household Size | # Housing Units | % Housing Units |
| 1-Person Household | 215 | 37.8% |
| 2-Person Household | 278 | 48.9% |
| 3-Person Household | 39 | 6.9% |
| 4+ Person Household | 37 | 6.5% |
| Total Housing Units | 569 | 100.0% |
Occupancy by Ownership by Household Size in Sand Lake
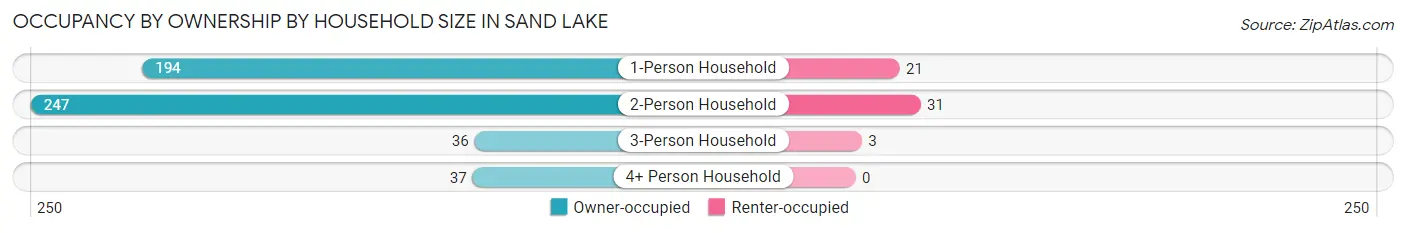
| Household Size | Owner-occupied | Renter-occupied |
| 1-Person Household | 194 (90.2%) | 21 (9.8%) |
| 2-Person Household | 247 (88.8%) | 31 (11.2%) |
| 3-Person Household | 36 (92.3%) | 3 (7.7%) |
| 4+ Person Household | 37 (100.0%) | 0 (0.0%) |
| Total Housing Units | 514 (90.3%) | 55 (9.7%) |
Occupancy by Educational Attainment in Sand Lake

| Household Size | Owner-occupied | Renter-occupied |
| Less than High School | 52 (64.2%) | 29 (35.8%) |
| High School Diploma | 191 (95.0%) | 10 (5.0%) |
| College/Associate Degree | 204 (92.7%) | 16 (7.3%) |
| Bachelor's Degree or higher | 67 (100.0%) | 0 (0.0%) |
Occupancy by Age of Householder in Sand Lake
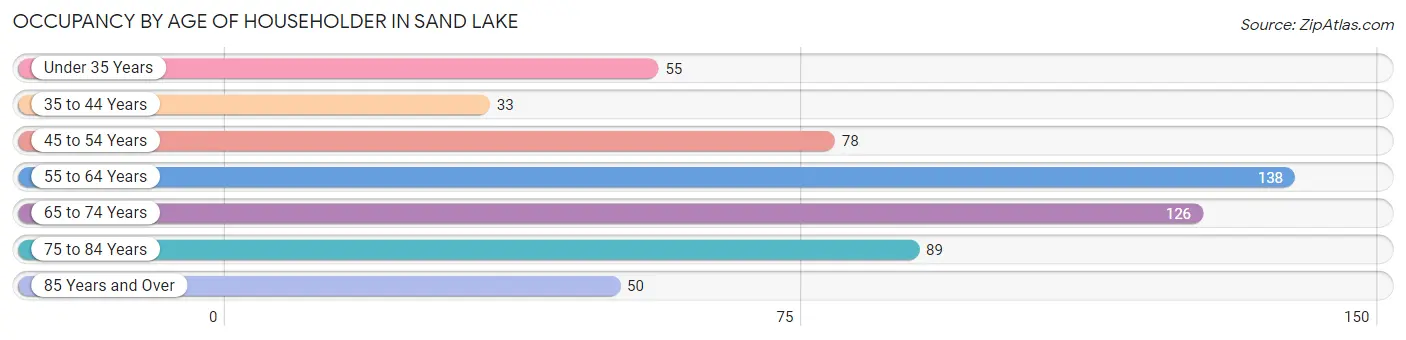
| Age Bracket | # Households | % Households |
| Under 35 Years | 55 | 9.7% |
| 35 to 44 Years | 33 | 5.8% |
| 45 to 54 Years | 78 | 13.7% |
| 55 to 64 Years | 138 | 24.2% |
| 65 to 74 Years | 126 | 22.1% |
| 75 to 84 Years | 89 | 15.6% |
| 85 Years and Over | 50 | 8.8% |
| Total | 569 | 100.0% |
Housing Finances in Sand Lake
Median Income by Occupancy in Sand Lake
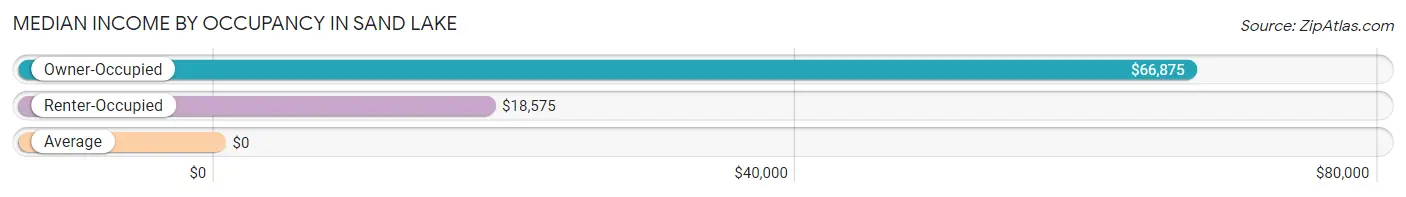
| Occupancy Type | # Households | Median Income |
| Owner-Occupied | 119 (53.6%) | $66,875 |
| Renter-Occupied | 103 (46.4%) | $18,575 |
| Average | 222 (100.0%) | $0 |
Occupancy by Householder Income Bracket in Sand Lake
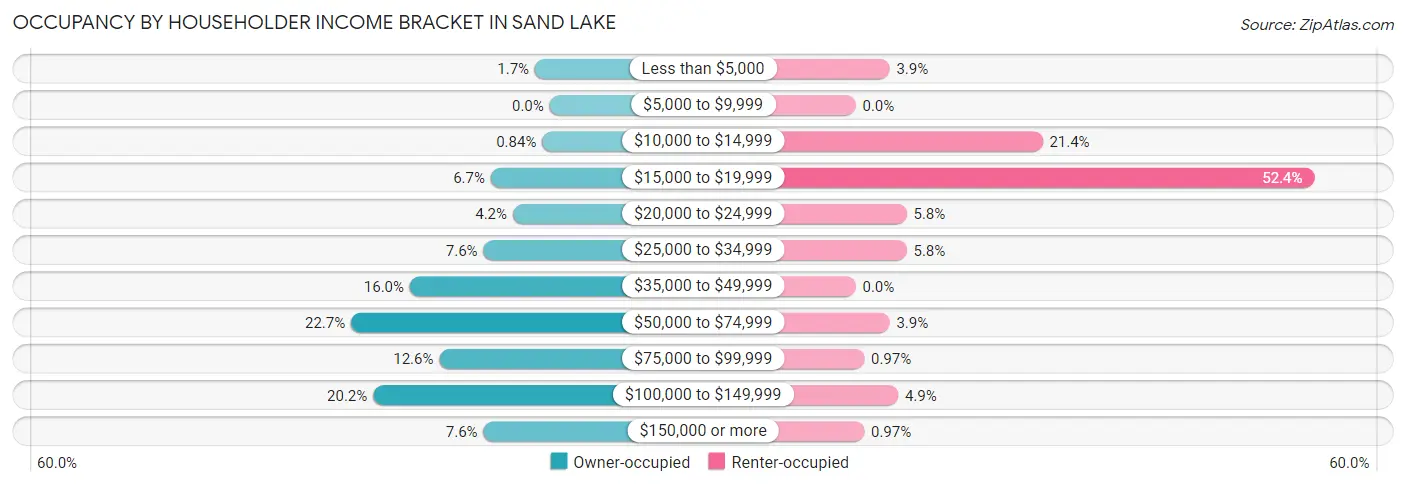
| Income Bracket | Owner-occupied | Renter-occupied |
| Less than $5,000 | 2 (1.7%) | 4 (3.9%) |
| $5,000 to $9,999 | 0 (0.0%) | 0 (0.0%) |
| $10,000 to $14,999 | 1 (0.8%) | 22 (21.4%) |
| $15,000 to $19,999 | 8 (6.7%) | 54 (52.4%) |
| $20,000 to $24,999 | 5 (4.2%) | 6 (5.8%) |
| $25,000 to $34,999 | 9 (7.6%) | 6 (5.8%) |
| $35,000 to $49,999 | 19 (16.0%) | 0 (0.0%) |
| $50,000 to $74,999 | 27 (22.7%) | 4 (3.9%) |
| $75,000 to $99,999 | 15 (12.6%) | 1 (1.0%) |
| $100,000 to $149,999 | 24 (20.2%) | 5 (4.9%) |
| $150,000 or more | 9 (7.6%) | 1 (1.0%) |
| Total | 119 (100.0%) | 103 (100.0%) |
Monthly Housing Cost Tiers in Sand Lake
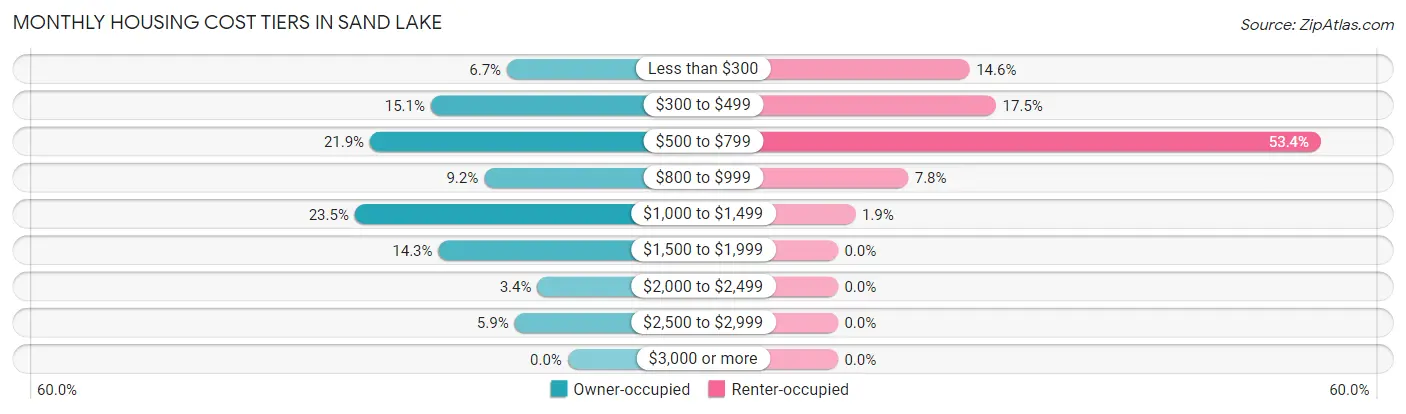
| Monthly Cost | Owner-occupied | Renter-occupied |
| Less than $300 | 8 (6.7%) | 15 (14.6%) |
| $300 to $499 | 18 (15.1%) | 18 (17.5%) |
| $500 to $799 | 26 (21.8%) | 55 (53.4%) |
| $800 to $999 | 11 (9.2%) | 8 (7.8%) |
| $1,000 to $1,499 | 28 (23.5%) | 2 (1.9%) |
| $1,500 to $1,999 | 17 (14.3%) | 0 (0.0%) |
| $2,000 to $2,499 | 4 (3.4%) | 0 (0.0%) |
| $2,500 to $2,999 | 7 (5.9%) | 0 (0.0%) |
| $3,000 or more | 0 (0.0%) | 0 (0.0%) |
| Total | 119 (100.0%) | 103 (100.0%) |
Physical Housing Characteristics in Sand Lake
Housing Structures in Sand Lake
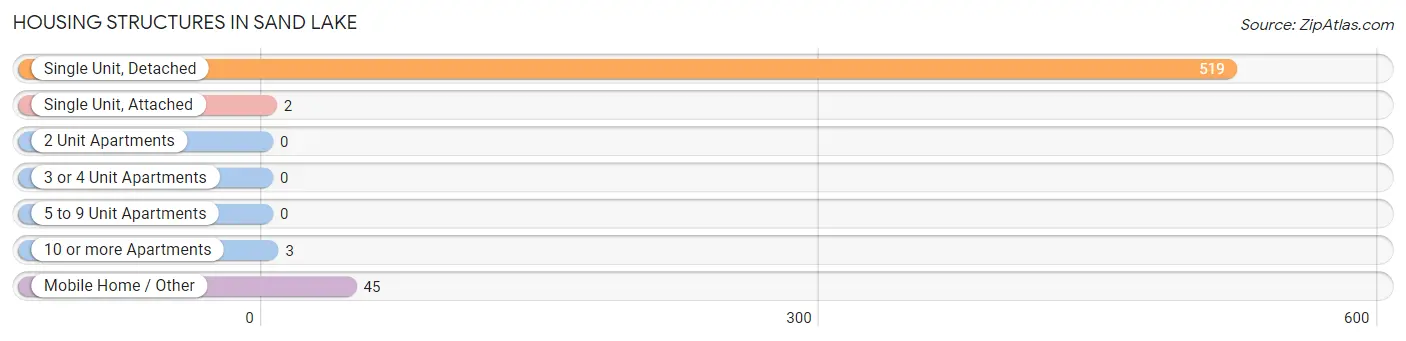
| Structure Type | # Housing Units | % Housing Units |
| Single Unit, Detached | 519 | 91.2% |
| Single Unit, Attached | 2 | 0.4% |
| 2 Unit Apartments | 0 | 0.0% |
| 3 or 4 Unit Apartments | 0 | 0.0% |
| 5 to 9 Unit Apartments | 0 | 0.0% |
| 10 or more Apartments | 3 | 0.5% |
| Mobile Home / Other | 45 | 7.9% |
| Total | 569 | 100.0% |
Housing Structures by Occupancy in Sand Lake
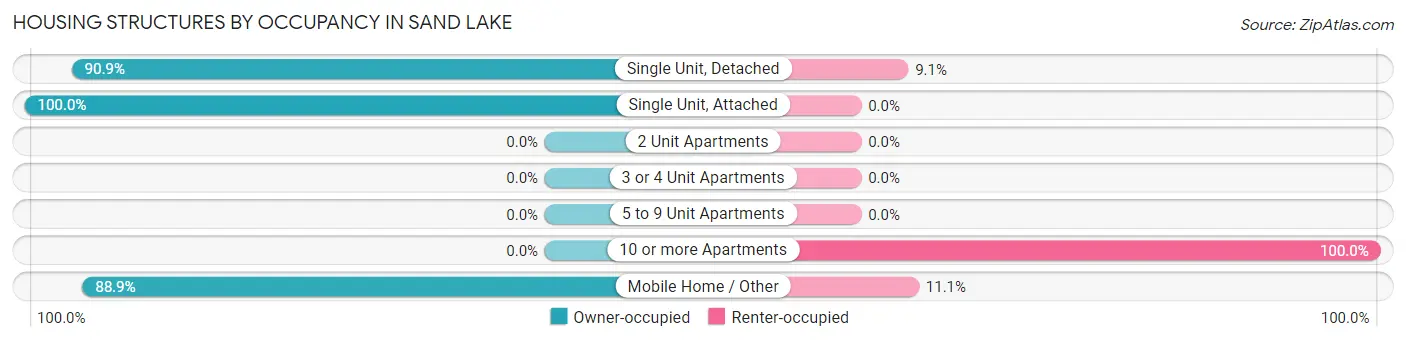
| Structure Type | Owner-occupied | Renter-occupied |
| Single Unit, Detached | 472 (90.9%) | 47 (9.1%) |
| Single Unit, Attached | 2 (100.0%) | 0 (0.0%) |
| 2 Unit Apartments | 0 (0.0%) | 0 (0.0%) |
| 3 or 4 Unit Apartments | 0 (0.0%) | 0 (0.0%) |
| 5 to 9 Unit Apartments | 0 (0.0%) | 0 (0.0%) |
| 10 or more Apartments | 0 (0.0%) | 3 (100.0%) |
| Mobile Home / Other | 40 (88.9%) | 5 (11.1%) |
| Total | 514 (90.3%) | 55 (9.7%) |
Housing Structures by Number of Rooms in Sand Lake
| Number of Rooms | Owner-occupied | Renter-occupied |
| 1 Room | 0 (0.0%) | 0 (0.0%) |
| 2 or 3 Rooms | 67 (13.0%) | 12 (21.8%) |
| 4 or 5 Rooms | 199 (38.7%) | 40 (72.7%) |
| 6 or 7 Rooms | 176 (34.2%) | 3 (5.4%) |
| 8 or more Rooms | 72 (14.0%) | 0 (0.0%) |
| Total | 514 (100.0%) | 55 (100.0%) |
Housing Structure by Heating Type in Sand Lake
| Heating Type | Owner-occupied | Renter-occupied |
| Utility Gas | 407 (79.2%) | 11 (20.0%) |
| Bottled, Tank, or LP Gas | 67 (13.0%) | 44 (80.0%) |
| Electricity | 12 (2.3%) | 0 (0.0%) |
| Fuel Oil or Kerosene | 0 (0.0%) | 0 (0.0%) |
| Coal or Coke | 0 (0.0%) | 0 (0.0%) |
| All other Fuels | 28 (5.4%) | 0 (0.0%) |
| No Fuel Used | 0 (0.0%) | 0 (0.0%) |
| Total | 514 (100.0%) | 55 (100.0%) |
Household Vehicle Usage in Sand Lake
| Vehicles per Household | Owner-occupied | Renter-occupied |
| No Vehicle | 9 (1.8%) | 5 (9.1%) |
| 1 Vehicle | 169 (32.9%) | 8 (14.5%) |
| 2 Vehicles | 255 (49.6%) | 42 (76.4%) |
| 3 or more Vehicles | 81 (15.8%) | 0 (0.0%) |
| Total | 514 (100.0%) | 55 (100.0%) |
Real Estate & Mortgages in Sand Lake
Real Estate and Mortgage Overview in Sand Lake
| Characteristic | Without Mortgage | With Mortgage |
| Housing Units | 268 | 77 |
| Median Property Value | $107,800 | $153,900 |
| Median Household Income | $43,571 | $5 |
| Monthly Housing Costs | $368 | $0 |
| Real Estate Taxes | $1,115 | $3 |
Property Value by Mortgage Status in Sand Lake
| Property Value | Without Mortgage | With Mortgage |
| Less than $50,000 | 65 (24.2%) | 2 (2.6%) |
| $50,000 to $99,999 | 60 (22.4%) | 10 (13.0%) |
| $100,000 to $299,999 | 121 (45.2%) | 55 (71.4%) |
| $300,000 to $499,999 | 19 (7.1%) | 10 (13.0%) |
| $500,000 to $749,999 | 3 (1.1%) | 0 (0.0%) |
| $750,000 to $999,999 | 0 (0.0%) | 0 (0.0%) |
| $1,000,000 or more | 0 (0.0%) | 0 (0.0%) |
| Total | 268 (100.0%) | 77 (100.0%) |
Household Income by Mortgage Status in Sand Lake
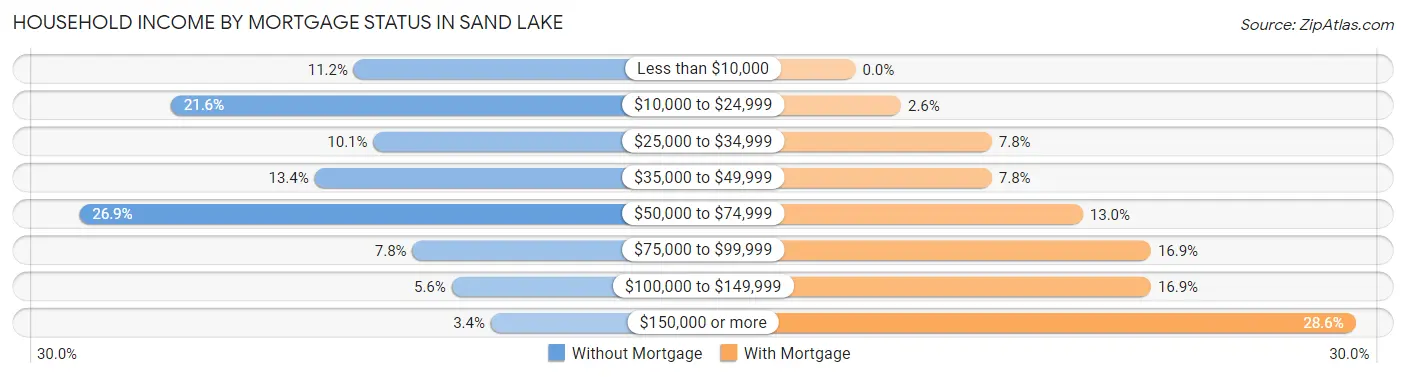
| Household Income | Without Mortgage | With Mortgage |
| Less than $10,000 | 30 (11.2%) | 0 (0.0%) |
| $10,000 to $24,999 | 58 (21.6%) | 2 (2.6%) |
| $25,000 to $34,999 | 27 (10.1%) | 6 (7.8%) |
| $35,000 to $49,999 | 36 (13.4%) | 6 (7.8%) |
| $50,000 to $74,999 | 72 (26.9%) | 10 (13.0%) |
| $75,000 to $99,999 | 21 (7.8%) | 13 (16.9%) |
| $100,000 to $149,999 | 15 (5.6%) | 13 (16.9%) |
| $150,000 or more | 9 (3.4%) | 22 (28.6%) |
| Total | 268 (100.0%) | 77 (100.0%) |
Property Value to Household Income Ratio in Sand Lake
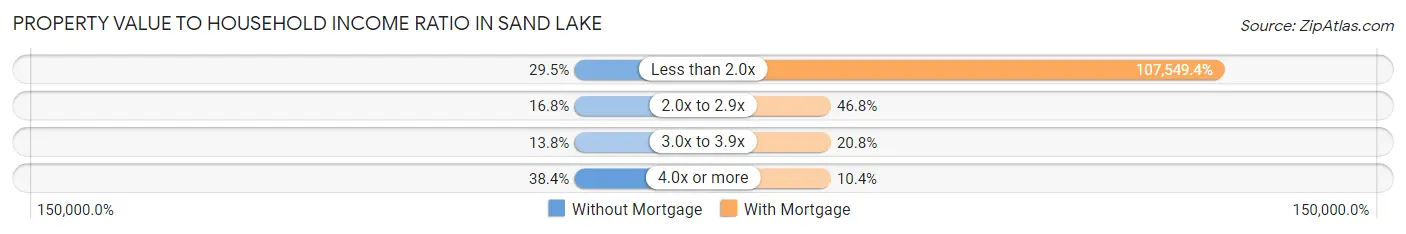
| Value-to-Income Ratio | Without Mortgage | With Mortgage |
| Less than 2.0x | 79 (29.5%) | 82,813 (107,549.4%) |
| 2.0x to 2.9x | 45 (16.8%) | 36 (46.8%) |
| 3.0x to 3.9x | 37 (13.8%) | 16 (20.8%) |
| 4.0x or more | 103 (38.4%) | 8 (10.4%) |
| Total | 268 (100.0%) | 77 (100.0%) |
Real Estate Taxes by Mortgage Status in Sand Lake
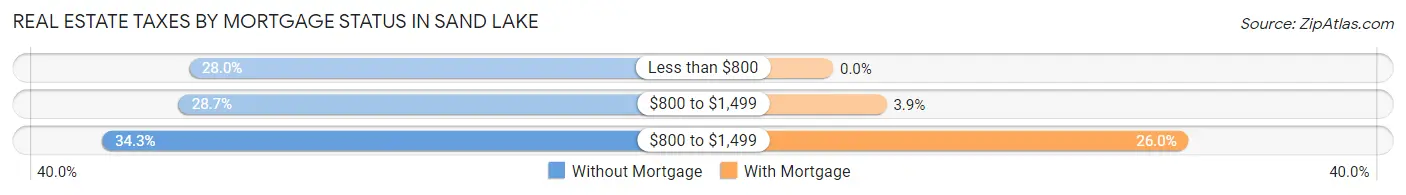
| Property Taxes | Without Mortgage | With Mortgage |
| Less than $800 | 75 (28.0%) | 0 (0.0%) |
| $800 to $1,499 | 77 (28.7%) | 3 (3.9%) |
| $800 to $1,499 | 92 (34.3%) | 20 (26.0%) |
| Total | 268 (100.0%) | 77 (100.0%) |
Health & Disability in Sand Lake
Health Insurance Coverage by Age in Sand Lake
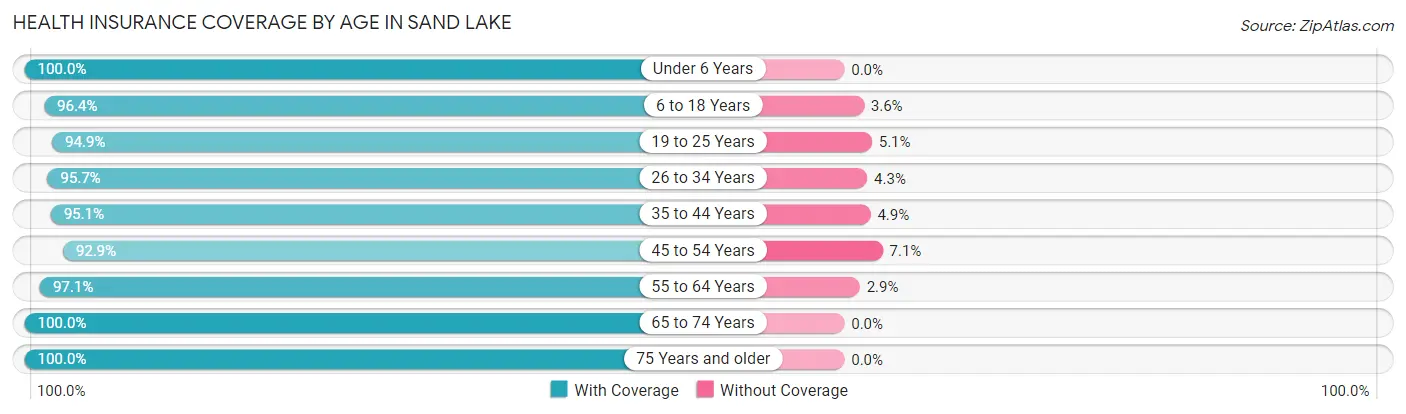
| Age Bracket | With Coverage | Without Coverage |
| Under 6 Years | 52 (100.0%) | 0 (0.0%) |
| 6 to 18 Years | 53 (96.4%) | 2 (3.6%) |
| 19 to 25 Years | 37 (94.9%) | 2 (5.1%) |
| 26 to 34 Years | 45 (95.7%) | 2 (4.3%) |
| 35 to 44 Years | 39 (95.1%) | 2 (4.9%) |
| 45 to 54 Years | 39 (92.9%) | 3 (7.1%) |
| 55 to 64 Years | 101 (97.1%) | 3 (2.9%) |
| 65 to 74 Years | 63 (100.0%) | 0 (0.0%) |
| 75 Years and older | 49 (100.0%) | 0 (0.0%) |
| Total | 478 (97.2%) | 14 (2.9%) |
Health Insurance Coverage by Citizenship Status in Sand Lake
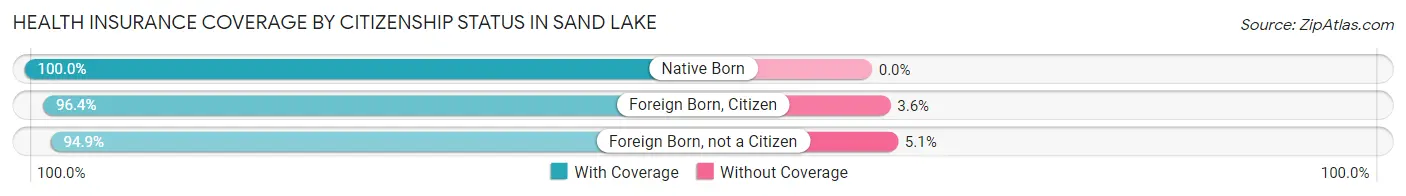
| Citizenship Status | With Coverage | Without Coverage |
| Native Born | 52 (100.0%) | 0 (0.0%) |
| Foreign Born, Citizen | 53 (96.4%) | 2 (3.6%) |
| Foreign Born, not a Citizen | 37 (94.9%) | 2 (5.1%) |
Health Insurance Coverage by Household Income in Sand Lake
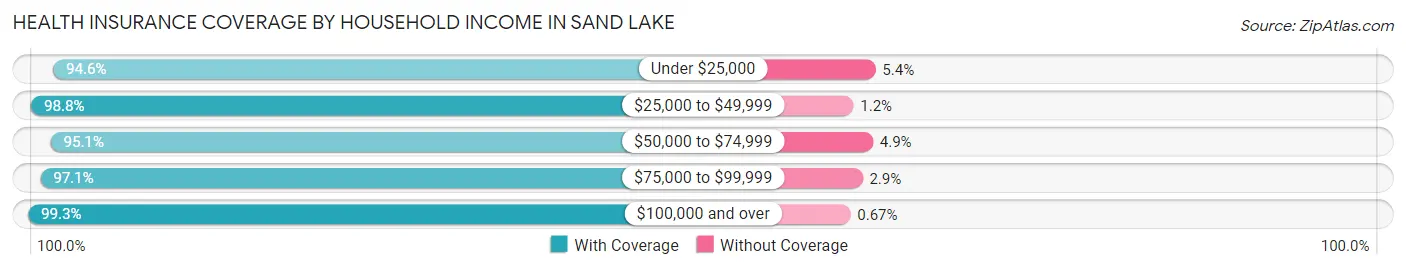
| Household Income | With Coverage | Without Coverage |
| Under $25,000 | 106 (94.6%) | 6 (5.4%) |
| $25,000 to $49,999 | 80 (98.8%) | 1 (1.2%) |
| $50,000 to $74,999 | 78 (95.1%) | 4 (4.9%) |
| $75,000 to $99,999 | 66 (97.1%) | 2 (2.9%) |
| $100,000 and over | 148 (99.3%) | 1 (0.7%) |
Public vs Private Health Insurance Coverage by Age in Sand Lake
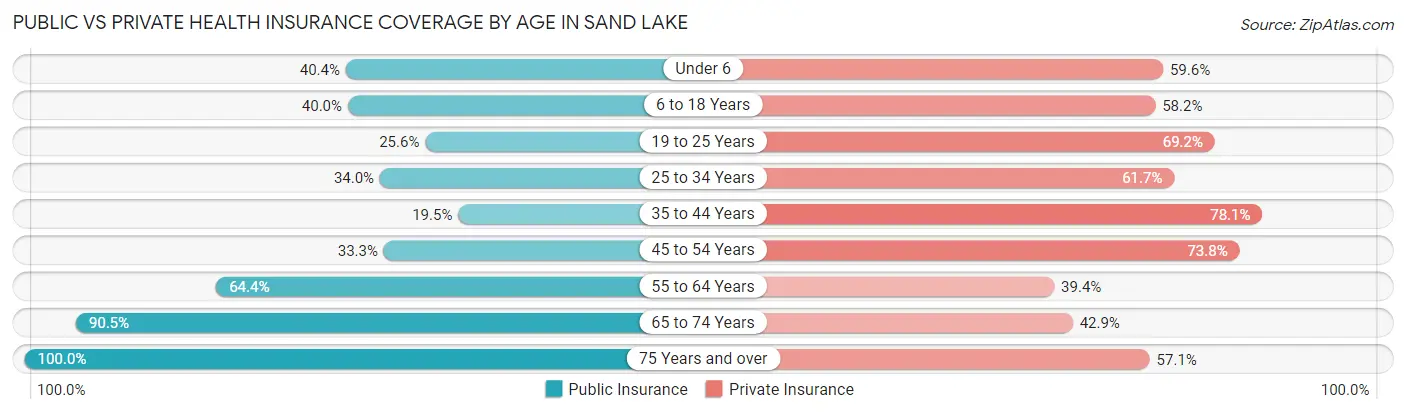
| Age Bracket | Public Insurance | Private Insurance |
| Under 6 | 21 (40.4%) | 31 (59.6%) |
| 6 to 18 Years | 22 (40.0%) | 32 (58.2%) |
| 19 to 25 Years | 10 (25.6%) | 27 (69.2%) |
| 25 to 34 Years | 16 (34.0%) | 29 (61.7%) |
| 35 to 44 Years | 8 (19.5%) | 32 (78.0%) |
| 45 to 54 Years | 14 (33.3%) | 31 (73.8%) |
| 55 to 64 Years | 67 (64.4%) | 41 (39.4%) |
| 65 to 74 Years | 57 (90.5%) | 27 (42.9%) |
| 75 Years and over | 49 (100.0%) | 28 (57.1%) |
| Total | 264 (53.7%) | 278 (56.5%) |
Disability Status by Sex by Age in Sand Lake
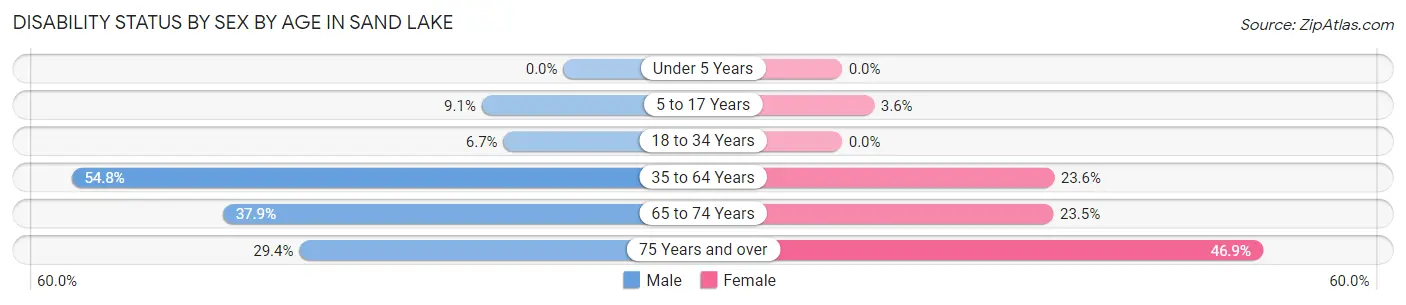
| Age Bracket | Male | Female |
| Under 5 Years | 0 (0.0%) | 0 (0.0%) |
| 5 to 17 Years | 2 (9.1%) | 1 (3.6%) |
| 18 to 34 Years | 3 (6.7%) | 0 (0.0%) |
| 35 to 64 Years | 63 (54.8%) | 17 (23.6%) |
| 65 to 74 Years | 11 (37.9%) | 8 (23.5%) |
| 75 Years and over | 5 (29.4%) | 15 (46.9%) |
Disability Class by Sex by Age in Sand Lake
Disability Class: Hearing Difficulty
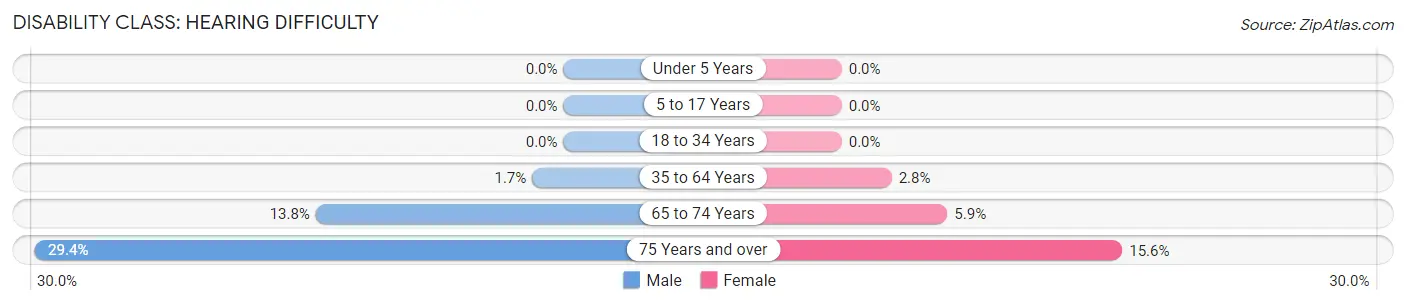
| Age Bracket | Male | Female |
| Under 5 Years | 0 (0.0%) | 0 (0.0%) |
| 5 to 17 Years | 0 (0.0%) | 0 (0.0%) |
| 18 to 34 Years | 0 (0.0%) | 0 (0.0%) |
| 35 to 64 Years | 2 (1.7%) | 2 (2.8%) |
| 65 to 74 Years | 4 (13.8%) | 2 (5.9%) |
| 75 Years and over | 5 (29.4%) | 5 (15.6%) |
Disability Class: Vision Difficulty
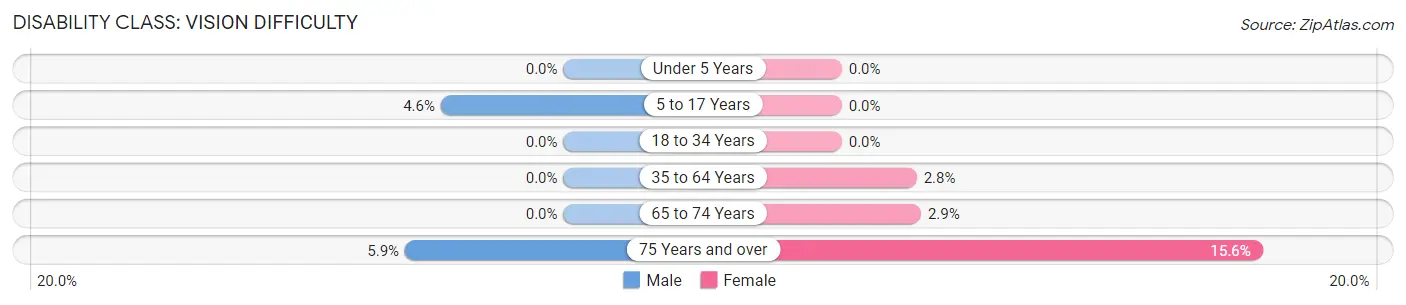
| Age Bracket | Male | Female |
| Under 5 Years | 0 (0.0%) | 0 (0.0%) |
| 5 to 17 Years | 1 (4.5%) | 0 (0.0%) |
| 18 to 34 Years | 0 (0.0%) | 0 (0.0%) |
| 35 to 64 Years | 0 (0.0%) | 2 (2.8%) |
| 65 to 74 Years | 0 (0.0%) | 1 (2.9%) |
| 75 Years and over | 1 (5.9%) | 5 (15.6%) |
Disability Class: Cognitive Difficulty
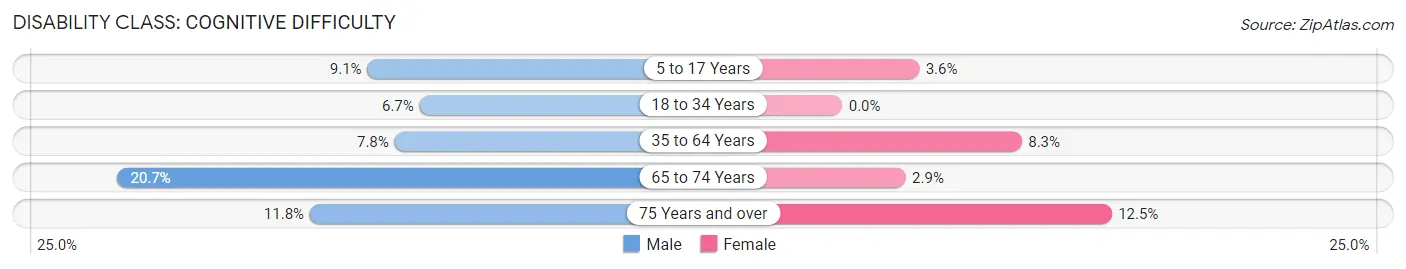
| Age Bracket | Male | Female |
| 5 to 17 Years | 2 (9.1%) | 1 (3.6%) |
| 18 to 34 Years | 3 (6.7%) | 0 (0.0%) |
| 35 to 64 Years | 9 (7.8%) | 6 (8.3%) |
| 65 to 74 Years | 6 (20.7%) | 1 (2.9%) |
| 75 Years and over | 2 (11.8%) | 4 (12.5%) |
Disability Class: Ambulatory Difficulty
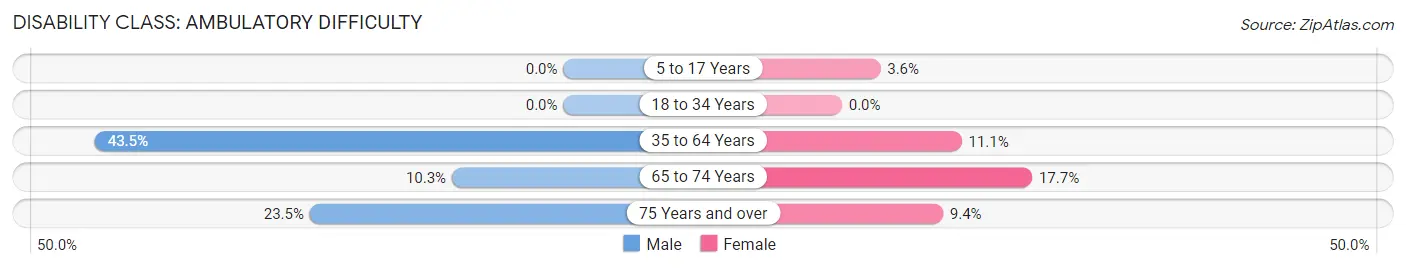
| Age Bracket | Male | Female |
| 5 to 17 Years | 0 (0.0%) | 1 (3.6%) |
| 18 to 34 Years | 0 (0.0%) | 0 (0.0%) |
| 35 to 64 Years | 50 (43.5%) | 8 (11.1%) |
| 65 to 74 Years | 3 (10.3%) | 6 (17.6%) |
| 75 Years and over | 4 (23.5%) | 3 (9.4%) |
Disability Class: Self-Care Difficulty
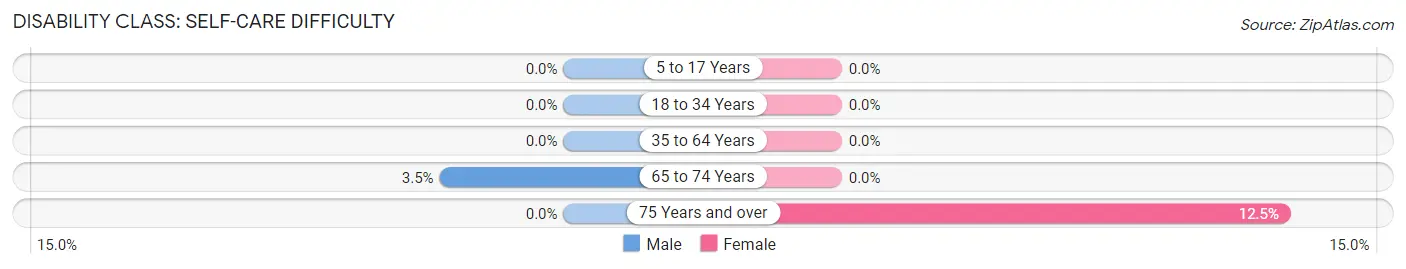
| Age Bracket | Male | Female |
| 5 to 17 Years | 0 (0.0%) | 0 (0.0%) |
| 18 to 34 Years | 0 (0.0%) | 0 (0.0%) |
| 35 to 64 Years | 0 (0.0%) | 0 (0.0%) |
| 65 to 74 Years | 1 (3.5%) | 0 (0.0%) |
| 75 Years and over | 0 (0.0%) | 4 (12.5%) |
Technology Access in Sand Lake
Computing Device Access in Sand Lake
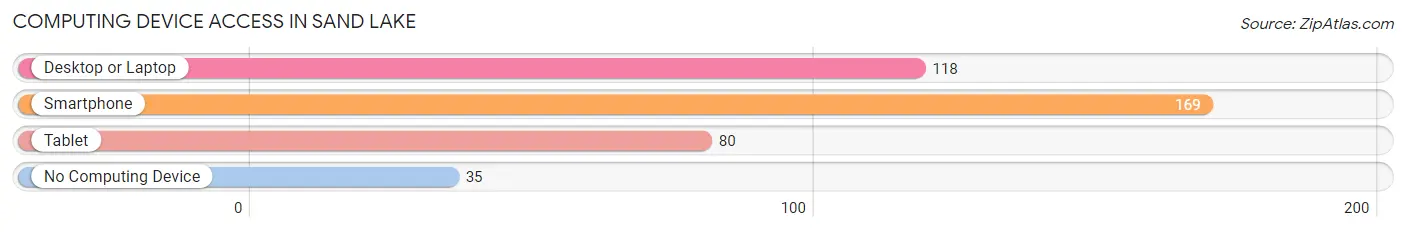
| Device Type | # Households | % Households |
| Desktop or Laptop | 118 | 53.1% |
| Smartphone | 169 | 76.1% |
| Tablet | 80 | 36.0% |
| No Computing Device | 35 | 15.8% |
| Total | 222 | 100.0% |
Internet Access in Sand Lake
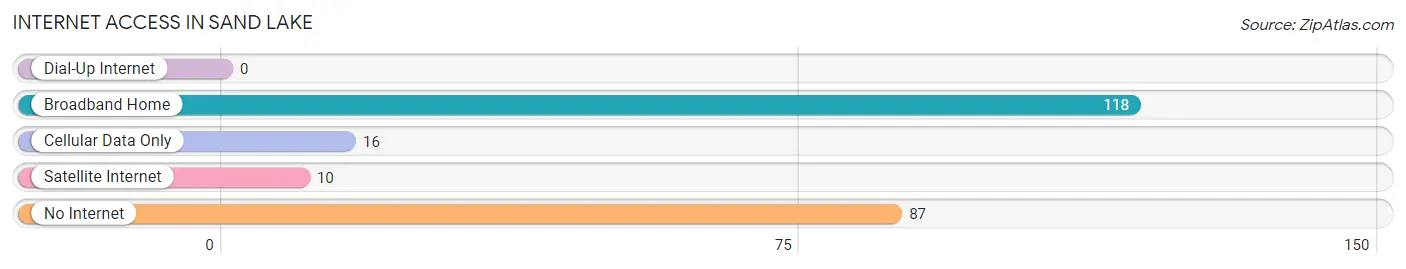
| Internet Type | # Households | % Households |
| Dial-Up Internet | 0 | 0.0% |
| Broadband Home | 118 | 53.1% |
| Cellular Data Only | 16 | 7.2% |
| Satellite Internet | 10 | 4.5% |
| No Internet | 87 | 39.2% |
| Total | 222 | 100.0% |
Sand Lake Summary
Sand Lake is a small unincorporated community located in the northern part of Michigan’s Lower Peninsula. It is situated in the northwest corner of Montcalm County, approximately 20 miles east of Grand Rapids. The community is surrounded by the townships of Reynolds, Winfield, and Bloomer. Sand Lake is a rural community with a population of approximately 1,000 people.
History
The area that is now Sand Lake was first settled in the early 1800s by a group of settlers from New York. The settlers were attracted to the area due to its abundance of natural resources, including timber and water. The first permanent settlement was established in 1836, when a group of settlers from New York purchased land from the federal government. The settlement was named Sand Lake after the nearby lake of the same name.
The community grew slowly over the next several decades, and by the late 1800s, it had become a thriving agricultural community. The area was known for its production of wheat, corn, and other grains. In addition, the area was home to several sawmills and gristmills.
In the early 1900s, the community began to experience a period of growth and development. The first school was built in 1906, and the first post office was established in 1908. The community also saw the construction of several churches, a general store, and a hotel.
Geography
Sand Lake is located in the northwest corner of Montcalm County, approximately 20 miles east of Grand Rapids. The community is surrounded by the townships of Reynolds, Winfield, and Bloomer. The area is characterized by rolling hills and wooded areas. The Sand Lake area is home to several lakes, including Sand Lake, which is the largest lake in the area.
The climate in the area is typical of the Midwest, with cold winters and warm summers. The average annual temperature is around 50 degrees Fahrenheit. The area receives an average of 30 inches of precipitation per year.
Economy
The economy of Sand Lake is largely based on agriculture. The area is known for its production of wheat, corn, and other grains. In addition, the area is home to several sawmills and gristmills.
The area is also home to several small businesses, including a general store, a hardware store, and a gas station. The community also has a post office and a library.
Demographics
As of the 2010 census, the population of Sand Lake was 1,000 people. The racial makeup of the community was 97.2% White, 0.7% African American, 0.3% Native American, 0.2% Asian, and 1.6% from other races. The median household income was $37,500, and the median age was 40 years.
Conclusion
Sand Lake is a small unincorporated community located in the northern part of Michigan’s Lower Peninsula. It is situated in the northwest corner of Montcalm County, approximately 20 miles east of Grand Rapids. The community is surrounded by the townships of Reynolds, Winfield, and Bloomer. Sand Lake is a rural community with a population of approximately 1,000 people. The economy of Sand Lake is largely based on agriculture, and the area is also home to several small businesses. The racial makeup of the community is predominantly White, with a small percentage of African American, Native American, and Asian residents.
Common Questions
What is the Total Population of Sand Lake?
Total Population of Sand Lake is 492.
What is the Total Male Population of Sand Lake?
Total Male Population of Sand Lake is 245.
What is the Total Female Population of Sand Lake?
Total Female Population of Sand Lake is 247.
What is the Ratio of Males per 100 Females in Sand Lake?
There are 99.19 Males per 100 Females in Sand Lake.
What is the Ratio of Females per 100 Males in Sand Lake?
There are 100.82 Females per 100 Males in Sand Lake.
What is the Median Population Age in Sand Lake?
Median Population Age in Sand Lake is 49.0 Years.
What is the Average Family Size in Sand Lake
Average Family Size in Sand Lake is 3.2 People.
What is the Average Household Size in Sand Lake
Average Household Size in Sand Lake is 2.2 People.
What is Per Capita Income in Sand Lake?
Per Capita income in Sand Lake is $26,106.
What is the Median Family Income in Sand Lake?
Median Family Income in Sand Lake is $65,625.
What is Income or Wage Gap in Sand Lake?
Income or Wage Gap in Sand Lake is 35.1%.
Women in Sand Lake earn 64.9 cents for every dollar earned by a man.
What is Inequality or Gini Index in Sand Lake?
Inequality or Gini Index in Sand Lake is 0.47.
How Large is the Labor Force in Sand Lake?
There are 200 People in the Labor Forcein in Sand Lake.
What is the Percentage of People in the Labor Force in Sand Lake?
50.4% of People are in the Labor Force in Sand Lake.
What is the Unemployment Rate in Sand Lake?
Unemployment Rate in Sand Lake is 2.5%.