Cass City, MI
Cass City Map
Cass City Overview
2,274
TOTAL POPULATION
1,198
MALE POPULATION
1,076
FEMALE POPULATION
111.34
MALES / 100 FEMALES
89.82
FEMALES / 100 MALES
43.8
MEDIAN AGE
3.2
AVG FAMILY SIZE
2.5
AVG HOUSEHOLD SIZE
$29,123
PER CAPITA INCOME
$73,750
AVG FAMILY INCOME
$54,875
AVG HOUSEHOLD INCOME
9.8%
WAGE / INCOME GAP [ % ]
90.2¢/ $1
WAGE / INCOME GAP [ $ ]
0.45
INEQUALITY / GINI INDEX
959
LABOR FORCE [ PEOPLE ]
52.4%
PERCENT IN LABOR FORCE
8.7%
UNEMPLOYMENT RATE
Cass City Zip Codes
Cass City Area Codes
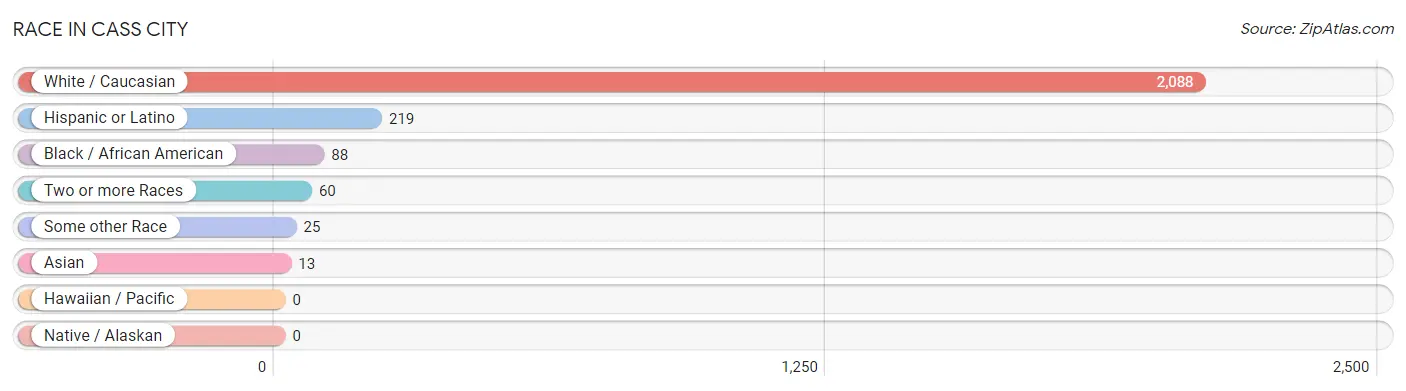
Race in Cass City
The most populous races in Cass City are White / Caucasian (2,088 | 91.8%), Hispanic or Latino (219 | 9.6%), and Black / African American (88 | 3.9%).
| Race | # Population | % Population |
| Asian | 13 | 0.6% |
| Black / African American | 88 | 3.9% |
| Hawaiian / Pacific | 0 | 0.0% |
| Hispanic or Latino | 219 | 9.6% |
| Native / Alaskan | 0 | 0.0% |
| White / Caucasian | 2,088 | 91.8% |
| Two or more Races | 60 | 2.6% |
| Some other Race | 25 | 1.1% |
| Total | 2,274 | 100.0% |
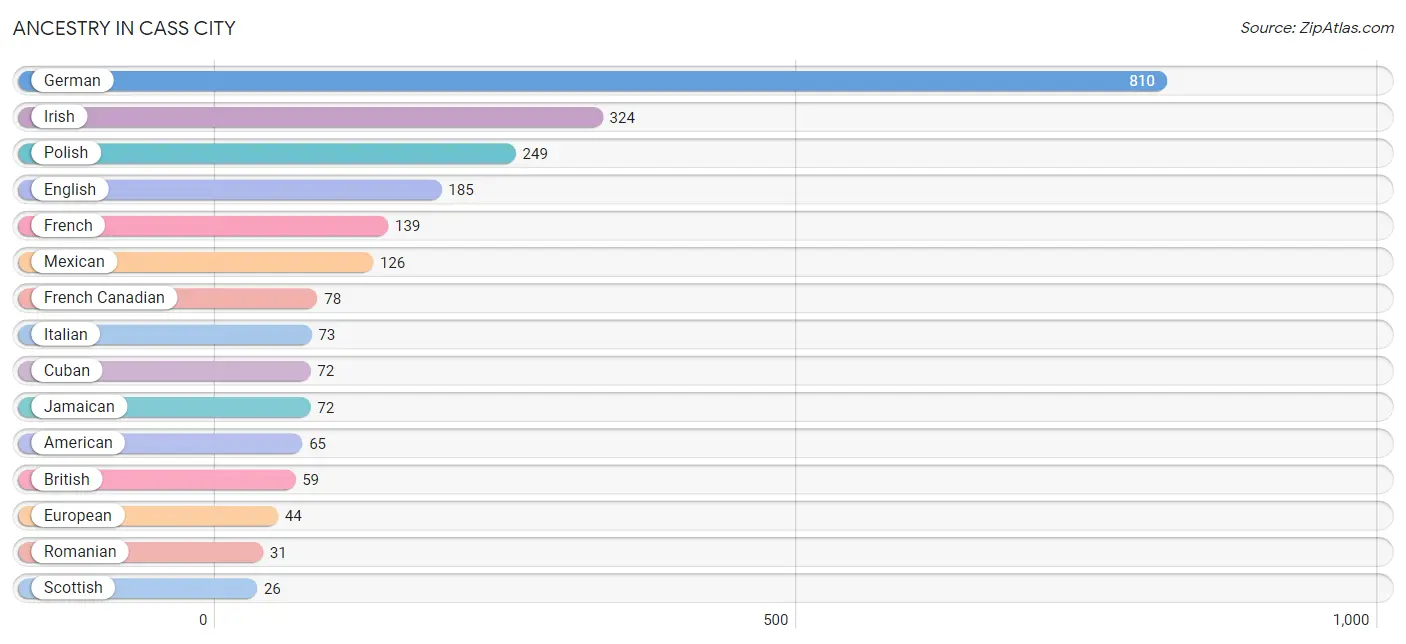
Ancestry in Cass City
The most populous ancestries reported in Cass City are German (810 | 35.6%), Irish (324 | 14.2%), Polish (249 | 11.0%), English (185 | 8.1%), and French (139 | 6.1%), together accounting for 75.1% of all Cass City residents.
| Ancestry | # Population | % Population |
| African | 11 | 0.5% |
| American | 65 | 2.9% |
| Arab | 9 | 0.4% |
| Belgian | 12 | 0.5% |
| British | 59 | 2.6% |
| Canadian | 8 | 0.4% |
| Cherokee | 24 | 1.1% |
| Cuban | 72 | 3.2% |
| Czech | 4 | 0.2% |
| Dutch | 10 | 0.4% |
| Eastern European | 5 | 0.2% |
| English | 185 | 8.1% |
| European | 44 | 1.9% |
| French | 139 | 6.1% |
| French Canadian | 78 | 3.4% |
| German | 810 | 35.6% |
| Hungarian | 16 | 0.7% |
| Indian (Asian) | 6 | 0.3% |
| Irish | 324 | 14.2% |
| Italian | 73 | 3.2% |
| Jamaican | 72 | 3.2% |
| Korean | 14 | 0.6% |
| Lebanese | 9 | 0.4% |
| Lithuanian | 5 | 0.2% |
| Malaysian | 6 | 0.3% |
| Mexican | 126 | 5.5% |
| Norwegian | 5 | 0.2% |
| Polish | 249 | 11.0% |
| Romanian | 31 | 1.4% |
| Russian | 5 | 0.2% |
| Scotch-Irish | 15 | 0.7% |
| Scottish | 26 | 1.1% |
| Spaniard | 8 | 0.4% |
| Sri Lankan | 6 | 0.3% |
| Subsaharan African | 11 | 0.5% |
| Swiss | 5 | 0.2% |
| Welsh | 6 | 0.3% | View All 37 Rows |
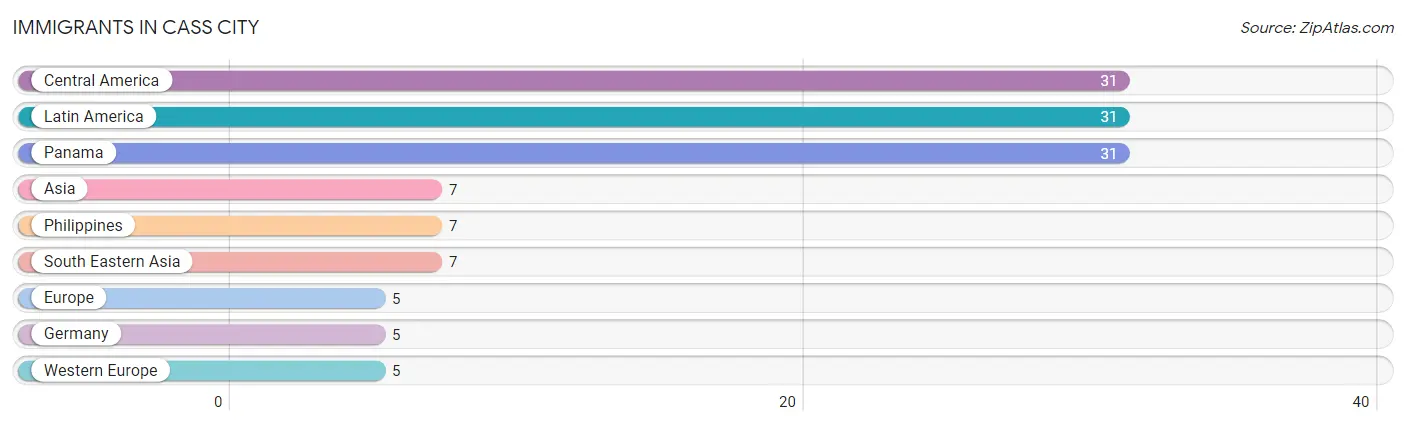
Immigrants in Cass City
The most numerous immigrant groups reported in Cass City came from Central America (31 | 1.4%), Latin America (31 | 1.4%), Panama (31 | 1.4%), Asia (7 | 0.3%), and Philippines (7 | 0.3%), together accounting for 4.7% of all Cass City residents.
| Immigration Origin | # Population | % Population |
| Asia | 7 | 0.3% |
| Central America | 31 | 1.4% |
| Europe | 5 | 0.2% |
| Germany | 5 | 0.2% |
| Latin America | 31 | 1.4% |
| Panama | 31 | 1.4% |
| Philippines | 7 | 0.3% |
| South Eastern Asia | 7 | 0.3% |
| Western Europe | 5 | 0.2% | View All 9 Rows |
Sex and Age in Cass City
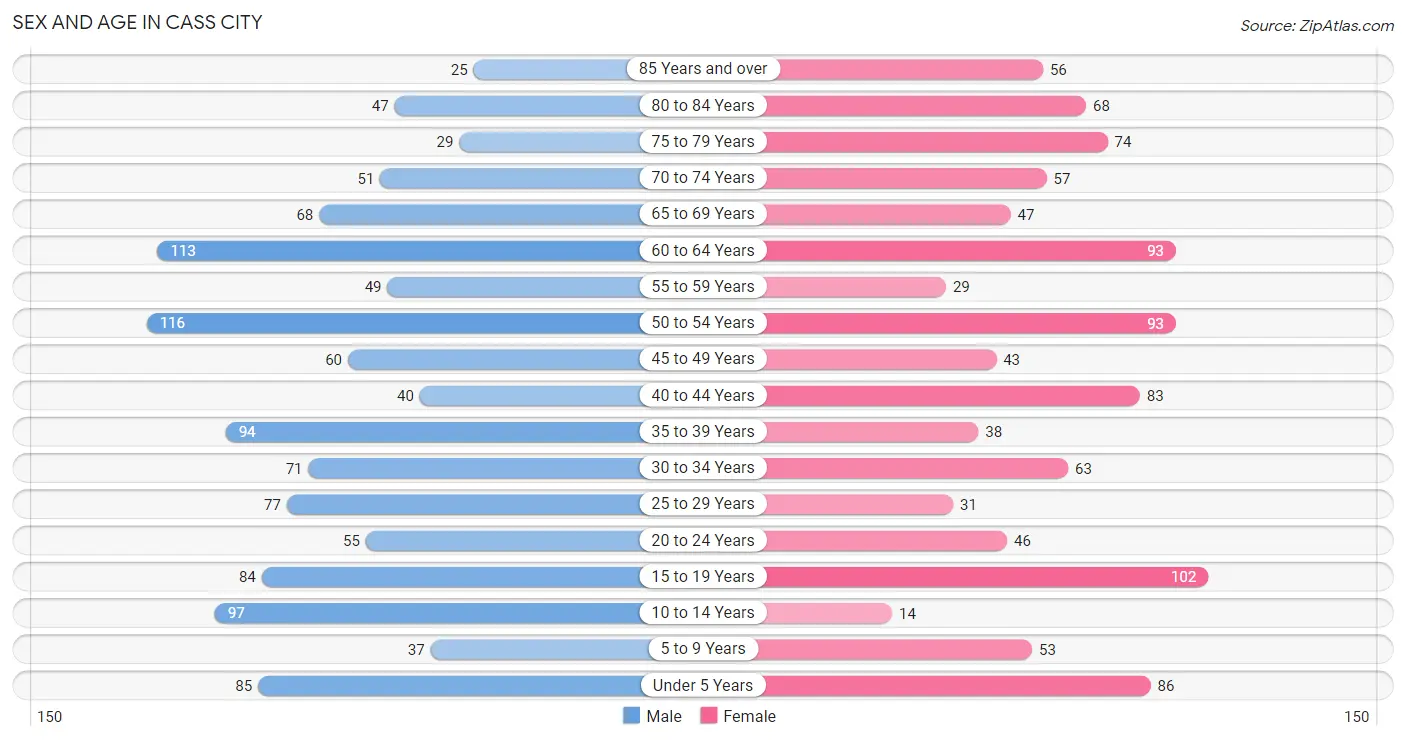
Sex and Age in Cass City
The most populous age groups in Cass City are 50 to 54 Years (116 | 9.7%) for men and 15 to 19 Years (102 | 9.5%) for women.
| Age Bracket | Male | Female |
| Under 5 Years | 85 (7.1%) | 86 (8.0%) |
| 5 to 9 Years | 37 (3.1%) | 53 (4.9%) |
| 10 to 14 Years | 97 (8.1%) | 14 (1.3%) |
| 15 to 19 Years | 84 (7.0%) | 102 (9.5%) |
| 20 to 24 Years | 55 (4.6%) | 46 (4.3%) |
| 25 to 29 Years | 77 (6.4%) | 31 (2.9%) |
| 30 to 34 Years | 71 (5.9%) | 63 (5.9%) |
| 35 to 39 Years | 94 (7.9%) | 38 (3.5%) |
| 40 to 44 Years | 40 (3.3%) | 83 (7.7%) |
| 45 to 49 Years | 60 (5.0%) | 43 (4.0%) |
| 50 to 54 Years | 116 (9.7%) | 93 (8.6%) |
| 55 to 59 Years | 49 (4.1%) | 29 (2.7%) |
| 60 to 64 Years | 113 (9.4%) | 93 (8.6%) |
| 65 to 69 Years | 68 (5.7%) | 47 (4.4%) |
| 70 to 74 Years | 51 (4.3%) | 57 (5.3%) |
| 75 to 79 Years | 29 (2.4%) | 74 (6.9%) |
| 80 to 84 Years | 47 (3.9%) | 68 (6.3%) |
| 85 Years and over | 25 (2.1%) | 56 (5.2%) |
| Total | 1,198 (100.0%) | 1,076 (100.0%) |
Families and Households in Cass City
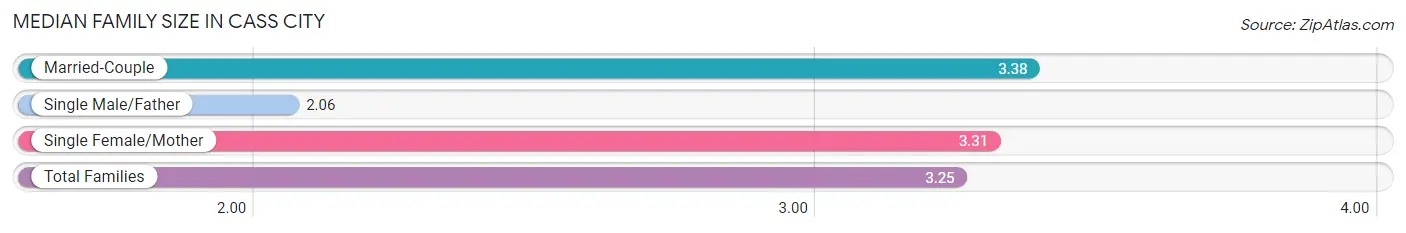
Median Family Size in Cass City
The median family size in Cass City is 3.25 persons per family, with married-couple families (412 | 78.0%) accounting for the largest median family size of 3.38 persons per family. On the other hand, single male/father families (49 | 9.3%) represent the smallest median family size with 2.06 persons per family.
| Family Type | # Families | Family Size |
| Married-Couple | 412 (78.0%) | 3.38 |
| Single Male/Father | 49 (9.3%) | 2.06 |
| Single Female/Mother | 67 (12.7%) | 3.31 |
| Total Families | 528 (100.0%) | 3.25 |
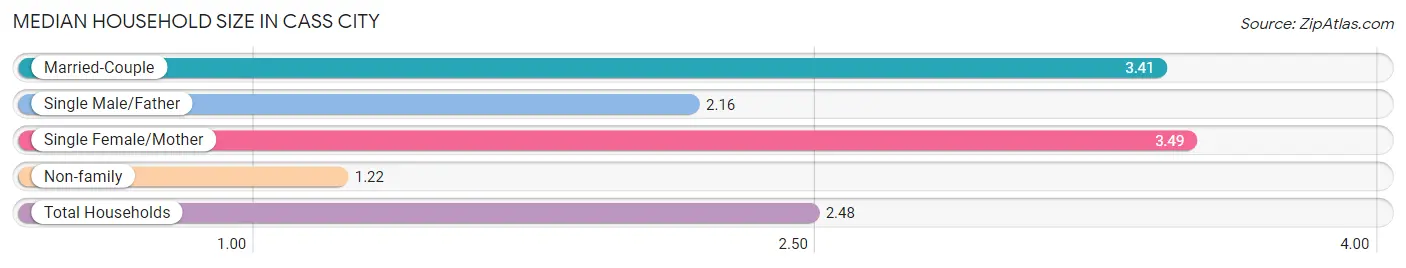
Median Household Size in Cass City
The median household size in Cass City is 2.48 persons per household, with single female/mother households (67 | 7.7%) accounting for the largest median household size of 3.49 persons per household. non-family households (347 | 39.7%) represent the smallest median household size with 1.22 persons per household.
| Household Type | # Households | Household Size |
| Married-Couple | 412 (47.1%) | 3.41 |
| Single Male/Father | 49 (5.6%) | 2.16 |
| Single Female/Mother | 67 (7.7%) | 3.49 |
| Non-family | 347 (39.7%) | 1.22 |
| Total Households | 875 (100.0%) | 2.48 |
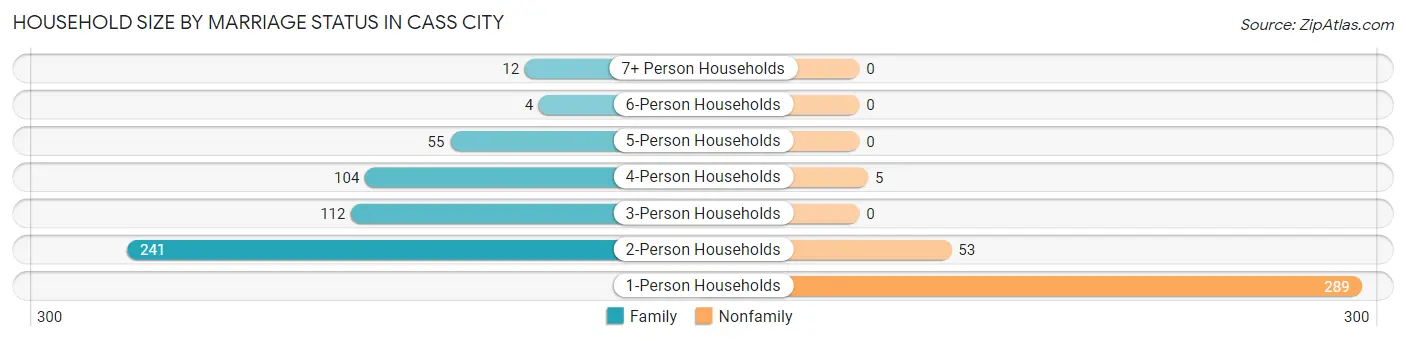
Household Size by Marriage Status in Cass City
Out of a total of 875 households in Cass City, 528 (60.3%) are family households, while 347 (39.7%) are nonfamily households. The most numerous type of family households are 2-person households, comprising 241, and the most common type of nonfamily households are 1-person households, comprising 289.
| Household Size | Family Households | Nonfamily Households |
| 1-Person Households | - | 289 (33.0%) |
| 2-Person Households | 241 (27.5%) | 53 (6.1%) |
| 3-Person Households | 112 (12.8%) | 0 (0.0%) |
| 4-Person Households | 104 (11.9%) | 5 (0.6%) |
| 5-Person Households | 55 (6.3%) | 0 (0.0%) |
| 6-Person Households | 4 (0.5%) | 0 (0.0%) |
| 7+ Person Households | 12 (1.4%) | 0 (0.0%) |
| Total | 528 (60.3%) | 347 (39.7%) |
Female Fertility in Cass City
Fertility by Age in Cass City
Average fertility rate in Cass City is 24.0 births per 1,000 women. Women in the age bracket of 20 to 34 years have the highest fertility rate with 71.0 births per 1,000 women. Women in the age bracket of 20 to 34 years acount for 100.0% of all women with births.
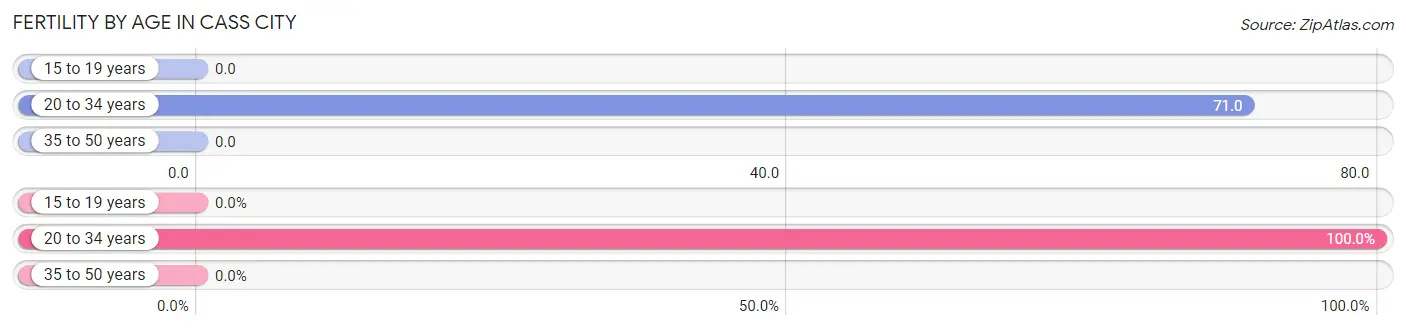
| Age Bracket | Women with Births | Births / 1,000 Women |
| 15 to 19 years | 0 (0.0%) | 0.0 |
| 20 to 34 years | 10 (100.0%) | 71.0 |
| 35 to 50 years | 0 (0.0%) | 0.0 |
| Total | 10 (100.0%) | 24.0 |
Fertility by Age by Marriage Status in Cass City
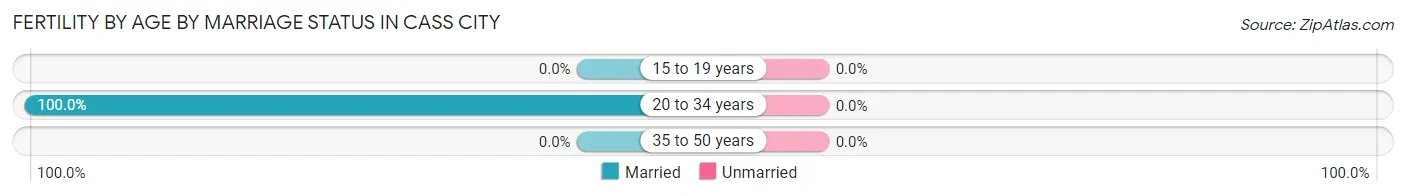
| Age Bracket | Married | Unmarried |
| 15 to 19 years | 0 (0.0%) | 0 (0.0%) |
| 20 to 34 years | 10 (100.0%) | 0 (0.0%) |
| 35 to 50 years | 0 (0.0%) | 0 (0.0%) |
| Total | 10 (100.0%) | 0 (0.0%) |
Fertility by Education in Cass City
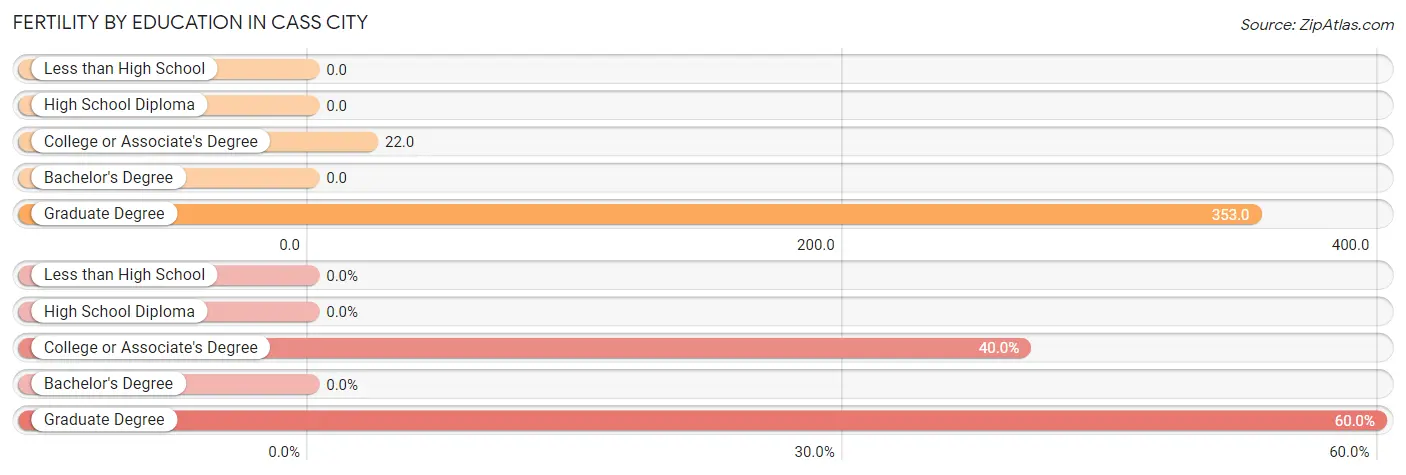
| Educational Attainment | Women with Births | Births / 1,000 Women |
| Less than High School | 0 (0.0%) | 0.0 |
| High School Diploma | 0 (0.0%) | 0.0 |
| College or Associate's Degree | 4 (40.0%) | 22.0 |
| Bachelor's Degree | 0 (0.0%) | 0.0 |
| Graduate Degree | 6 (60.0%) | 353.0 |
| Total | 10 (100.0%) | 24.0 |
Fertility by Education by Marriage Status in Cass City
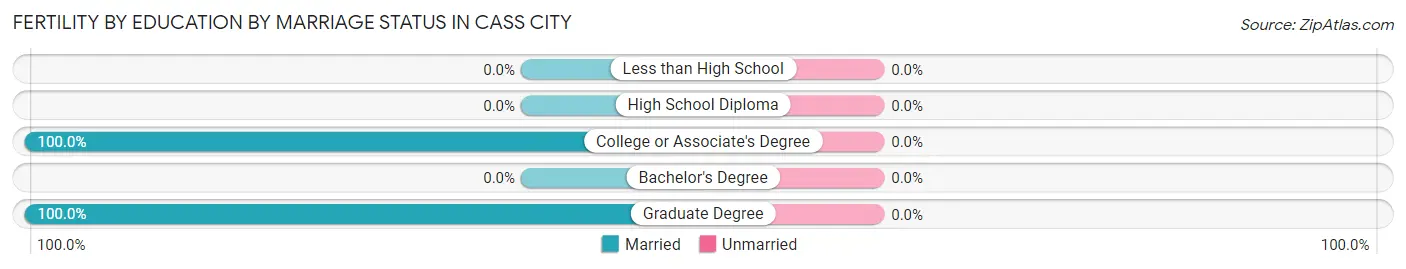
| Educational Attainment | Married | Unmarried |
| Less than High School | 0 (0.0%) | 0 (0.0%) |
| High School Diploma | 0 (0.0%) | 0 (0.0%) |
| College or Associate's Degree | 4 (100.0%) | 0 (0.0%) |
| Bachelor's Degree | 0 (0.0%) | 0 (0.0%) |
| Graduate Degree | 6 (100.0%) | 0 (0.0%) |
| Total | 10 (100.0%) | 0 (0.0%) |
Income in Cass City
Income Overview in Cass City
Per Capita Income in Cass City is $29,123, while median incomes of families and households are $73,750 and $54,875 respectively.
| Characteristic | Number | Measure |
| Per Capita Income | 2,274 | $29,123 |
| Median Family Income | 528 | $73,750 |
| Mean Family Income | 528 | $89,498 |
| Median Household Income | 875 | $54,875 |
| Mean Household Income | 875 | $70,586 |
| Income Deficit | 528 | $0 |
| Wage / Income Gap (%) | 2,274 | 9.85% |
| Wage / Income Gap ($) | 2,274 | 90.15¢ per $1 |
| Gini / Inequality Index | 2,274 | 0.45 |
Earnings by Sex in Cass City
Average Earnings in Cass City are $38,007, $38,939 for men and $35,104 for women, a difference of 9.9%.
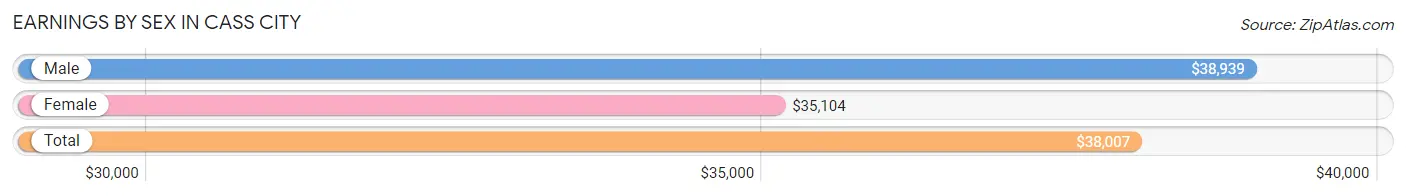
| Sex | Number | Average Earnings |
| Male | 572 (59.7%) | $38,939 |
| Female | 386 (40.3%) | $35,104 |
| Total | 958 (100.0%) | $38,007 |
Earnings by Sex by Income Bracket in Cass City
The most common earnings brackets in Cass City are $75,000 to $99,999 for men (82 | 14.3%) and $25,000 to $29,999 for women (49 | 12.7%).
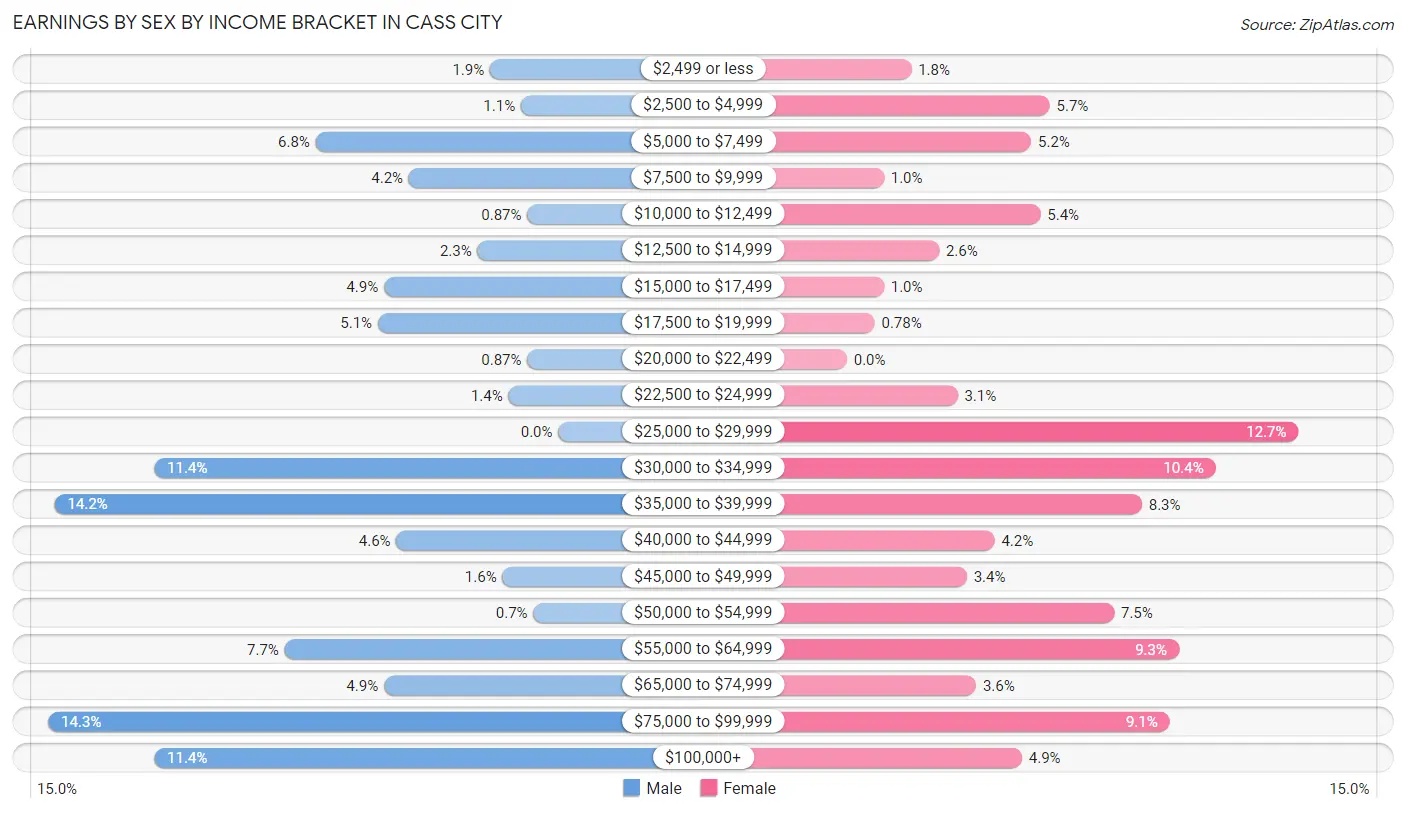
| Income | Male | Female |
| $2,499 or less | 11 (1.9%) | 7 (1.8%) |
| $2,500 to $4,999 | 6 (1.1%) | 22 (5.7%) |
| $5,000 to $7,499 | 39 (6.8%) | 20 (5.2%) |
| $7,500 to $9,999 | 24 (4.2%) | 4 (1.0%) |
| $10,000 to $12,499 | 5 (0.9%) | 21 (5.4%) |
| $12,500 to $14,999 | 13 (2.3%) | 10 (2.6%) |
| $15,000 to $17,499 | 28 (4.9%) | 4 (1.0%) |
| $17,500 to $19,999 | 29 (5.1%) | 3 (0.8%) |
| $20,000 to $22,499 | 5 (0.9%) | 0 (0.0%) |
| $22,500 to $24,999 | 8 (1.4%) | 12 (3.1%) |
| $25,000 to $29,999 | 0 (0.0%) | 49 (12.7%) |
| $30,000 to $34,999 | 65 (11.4%) | 40 (10.4%) |
| $35,000 to $39,999 | 81 (14.2%) | 32 (8.3%) |
| $40,000 to $44,999 | 26 (4.5%) | 16 (4.2%) |
| $45,000 to $49,999 | 9 (1.6%) | 13 (3.4%) |
| $50,000 to $54,999 | 4 (0.7%) | 29 (7.5%) |
| $55,000 to $64,999 | 44 (7.7%) | 36 (9.3%) |
| $65,000 to $74,999 | 28 (4.9%) | 14 (3.6%) |
| $75,000 to $99,999 | 82 (14.3%) | 35 (9.1%) |
| $100,000+ | 65 (11.4%) | 19 (4.9%) |
| Total | 572 (100.0%) | 386 (100.0%) |
Earnings by Sex by Educational Attainment in Cass City
Average earnings in Cass City are $41,688 for men and $37,813 for women, a difference of 9.3%. Men with an educational attainment of bachelor's degree enjoy the highest average annual earnings of $83,000, while those with less than high school education earn the least with $37,935. Women with an educational attainment of graduate degree earn the most with the average annual earnings of $67,500, while those with less than high school education have the smallest earnings of $20,000.
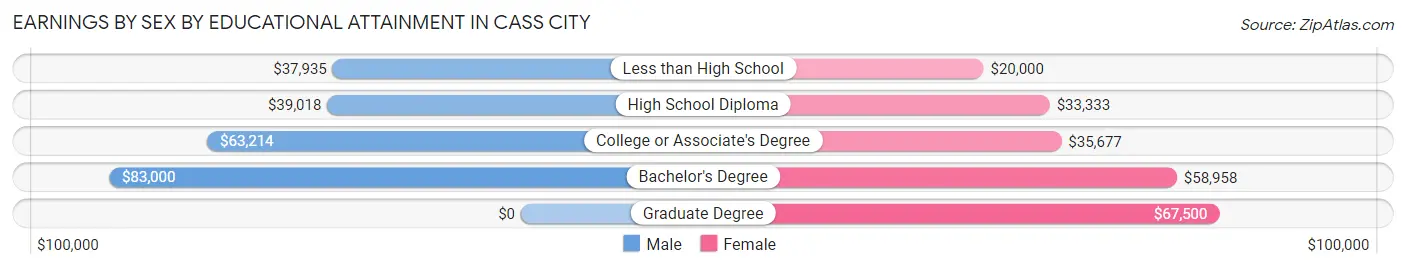
| Educational Attainment | Male Income | Female Income |
| Less than High School | $37,935 | $20,000 |
| High School Diploma | $39,018 | $33,333 |
| College or Associate's Degree | $63,214 | $35,677 |
| Bachelor's Degree | $83,000 | $58,958 |
| Graduate Degree | - | - |
| Total | $41,688 | $37,813 |
Family Income in Cass City
Family Income Brackets in Cass City
According to the Cass City family income data, there are 108 families falling into the $50,000 to $74,999 income range, which is the most common income bracket and makes up 20.4% of all families.
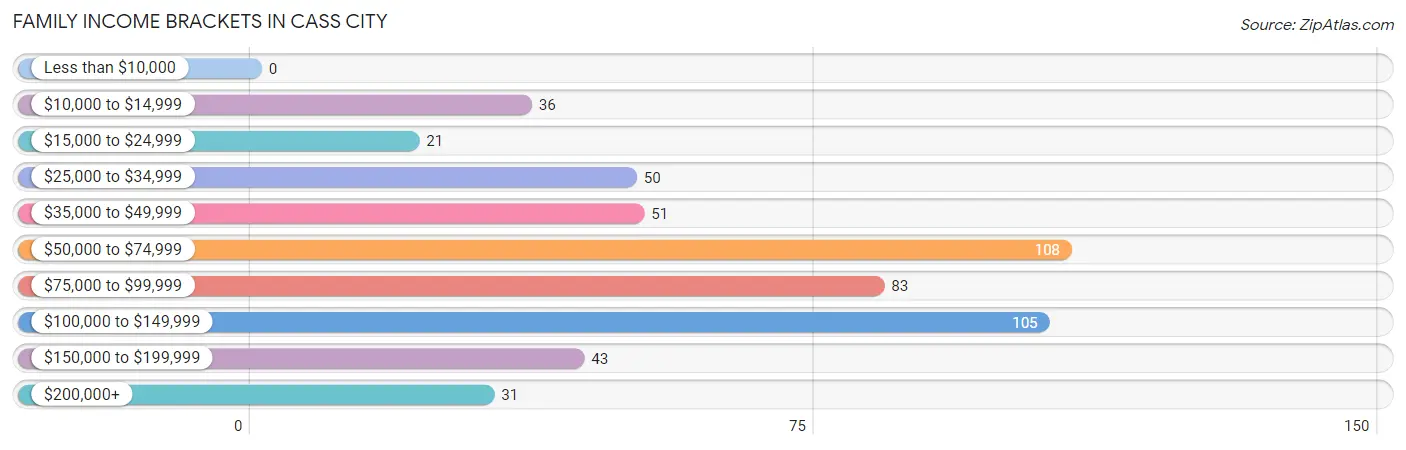
| Income Bracket | # Families | % Families |
| Less than $10,000 | 0 | 0.0% |
| $10,000 to $14,999 | 36 | 6.8% |
| $15,000 to $24,999 | 21 | 4.0% |
| $25,000 to $34,999 | 50 | 9.5% |
| $35,000 to $49,999 | 51 | 9.7% |
| $50,000 to $74,999 | 108 | 20.5% |
| $75,000 to $99,999 | 83 | 15.7% |
| $100,000 to $149,999 | 105 | 19.9% |
| $150,000 to $199,999 | 43 | 8.1% |
| $200,000+ | 31 | 5.9% |
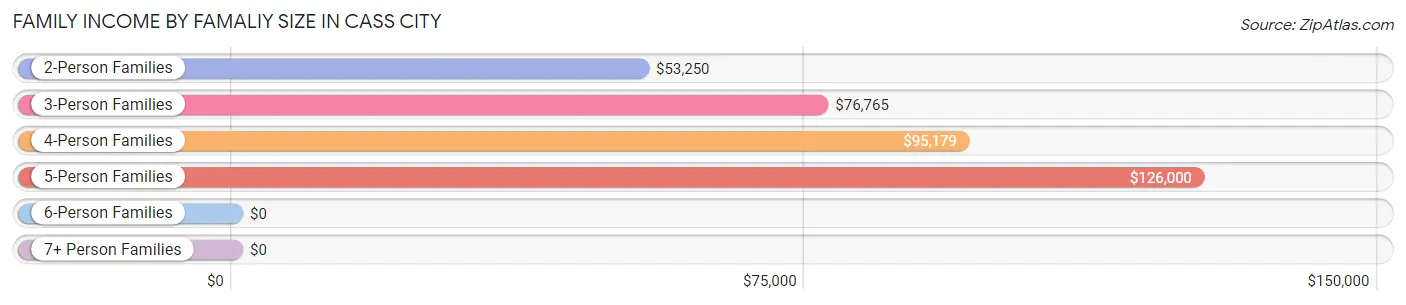
Family Income by Famaliy Size in Cass City
5-person families (50 | 9.5%) account for the highest median family income in Cass City with $126,000 per family, while 2-person families (251 | 47.5%) have the highest median income of $26,625 per family member.
| Income Bracket | # Families | Median Income |
| 2-Person Families | 251 (47.5%) | $53,250 |
| 3-Person Families | 110 (20.8%) | $76,765 |
| 4-Person Families | 101 (19.1%) | $95,179 |
| 5-Person Families | 50 (9.5%) | $126,000 |
| 6-Person Families | 10 (1.9%) | $0 |
| 7+ Person Families | 6 (1.1%) | $0 |
| Total | 528 (100.0%) | $73,750 |
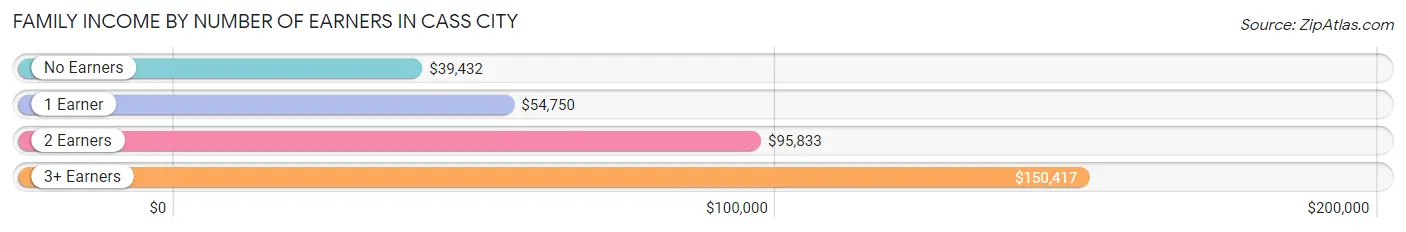
Family Income by Number of Earners in Cass City
The median family income in Cass City is $73,750, with families comprising 3+ earners (80) having the highest median family income of $150,417, while families with no earners (143) have the lowest median family income of $39,432, accounting for 15.1% and 27.1% of families, respectively.
| Number of Earners | # Families | Median Income |
| No Earners | 143 (27.1%) | $39,432 |
| 1 Earner | 141 (26.7%) | $54,750 |
| 2 Earners | 164 (31.1%) | $95,833 |
| 3+ Earners | 80 (15.1%) | $150,417 |
| Total | 528 (100.0%) | $73,750 |
Household Income in Cass City
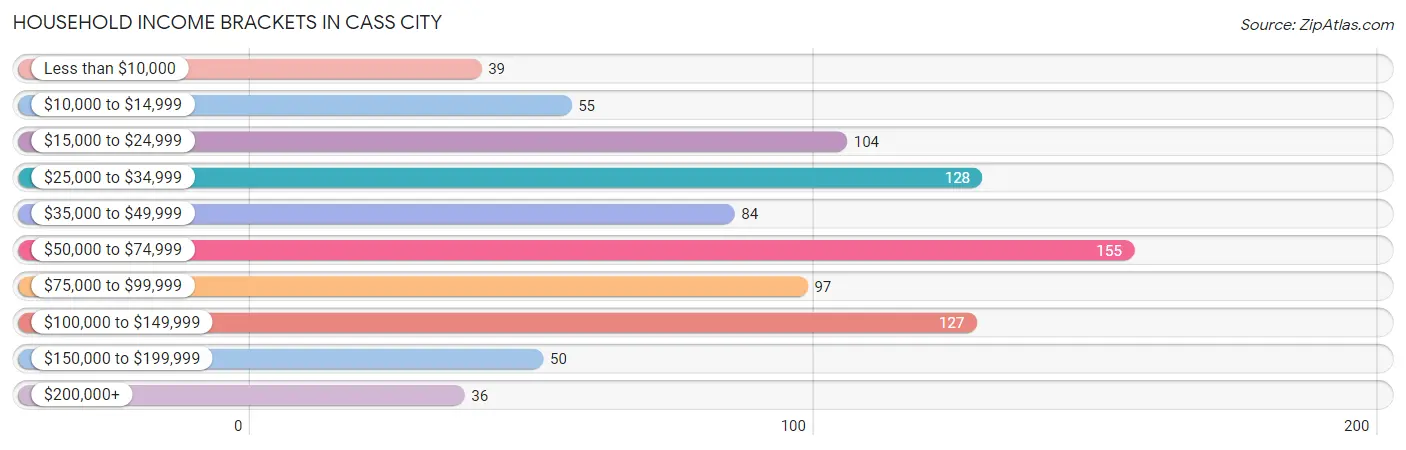
Household Income Brackets in Cass City
With 155 households falling in the category, the $50,000 to $74,999 income range is the most frequent in Cass City, accounting for 17.7% of all households. In contrast, only 36 households (4.1%) fall into the $200,000+ income bracket, making it the least populous group.
| Income Bracket | # Households | % Households |
| Less than $10,000 | 39 | 4.5% |
| $10,000 to $14,999 | 55 | 6.3% |
| $15,000 to $24,999 | 104 | 11.9% |
| $25,000 to $34,999 | 128 | 14.6% |
| $35,000 to $49,999 | 84 | 9.6% |
| $50,000 to $74,999 | 155 | 17.7% |
| $75,000 to $99,999 | 97 | 11.1% |
| $100,000 to $149,999 | 127 | 14.5% |
| $150,000 to $199,999 | 50 | 5.7% |
| $200,000+ | 36 | 4.1% |
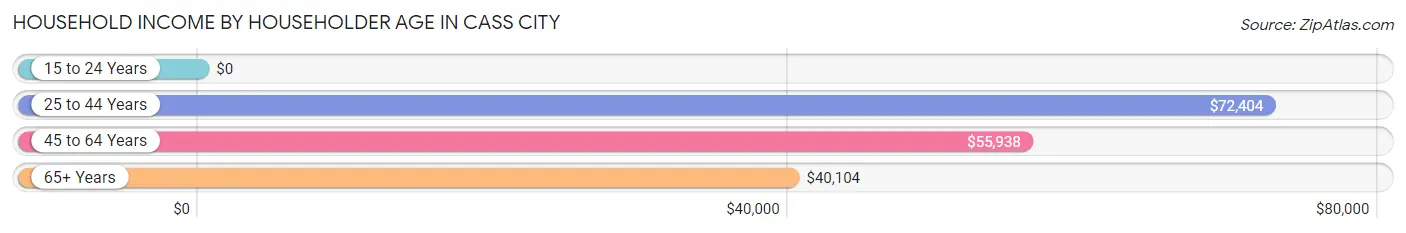
Household Income by Householder Age in Cass City
The median household income in Cass City is $54,875, with the highest median household income of $72,404 found in the 25 to 44 years age bracket for the primary householder. A total of 247 households (28.2%) fall into this category. Meanwhile, the 15 to 24 years age bracket for the primary householder has the lowest median household income of $0, with 28 households (3.2%) in this group.
| Income Bracket | # Households | Median Income |
| 15 to 24 Years | 28 (3.2%) | $0 |
| 25 to 44 Years | 247 (28.2%) | $72,404 |
| 45 to 64 Years | 313 (35.8%) | $55,938 |
| 65+ Years | 287 (32.8%) | $40,104 |
| Total | 875 (100.0%) | $54,875 |
Poverty in Cass City
Income Below Poverty by Sex and Age in Cass City
With 13.0% poverty level for males and 16.4% for females among the residents of Cass City, 5 year old males and 5 year old females are the most vulnerable to poverty, with 5 males (31.2%) and 6 females (100.0%) in their respective age groups living below the poverty level.
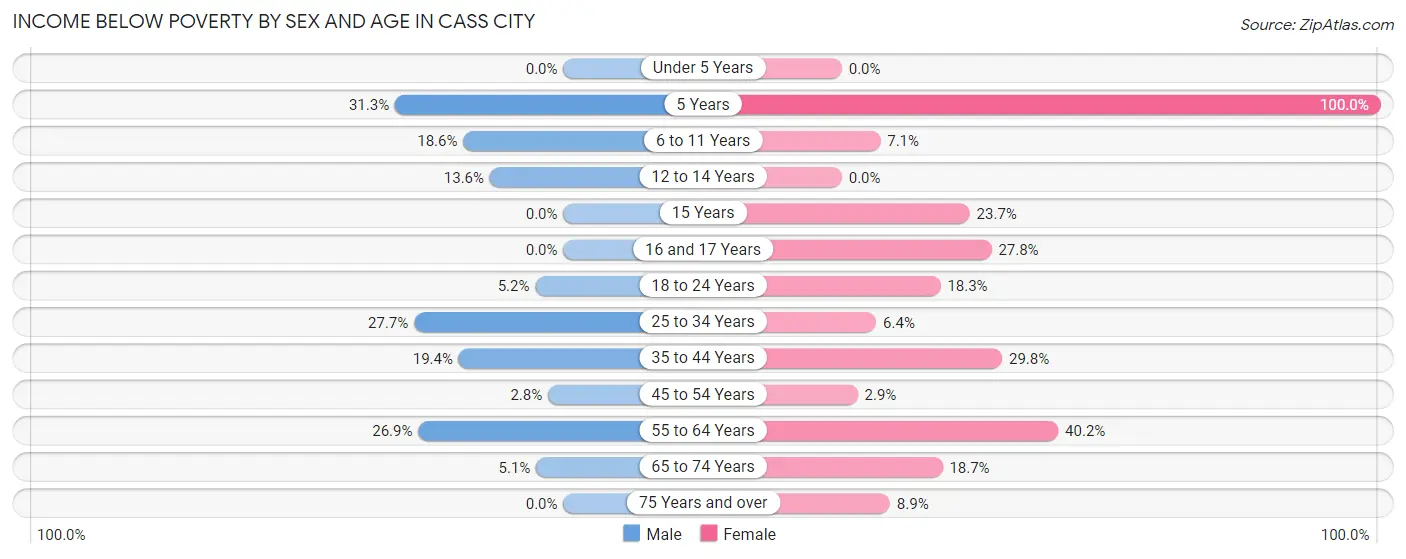
| Age Bracket | Male | Female |
| Under 5 Years | 0 (0.0%) | 0 (0.0%) |
| 5 Years | 5 (31.2%) | 6 (100.0%) |
| 6 to 11 Years | 13 (18.6%) | 4 (7.1%) |
| 12 to 14 Years | 6 (13.6%) | 0 (0.0%) |
| 15 Years | 0 (0.0%) | 14 (23.7%) |
| 16 and 17 Years | 0 (0.0%) | 5 (27.8%) |
| 18 to 24 Years | 5 (5.2%) | 13 (18.3%) |
| 25 to 34 Years | 41 (27.7%) | 6 (6.4%) |
| 35 to 44 Years | 26 (19.4%) | 36 (29.7%) |
| 45 to 54 Years | 5 (2.8%) | 4 (2.9%) |
| 55 to 64 Years | 42 (26.9%) | 49 (40.2%) |
| 65 to 74 Years | 5 (5.1%) | 17 (18.7%) |
| 75 Years and over | 0 (0.0%) | 15 (8.9%) |
| Total | 148 (13.0%) | 169 (16.4%) |
Income Above Poverty by Sex and Age in Cass City
According to the poverty statistics in Cass City, males aged under 5 years and females aged under 5 years are the age groups that are most secure financially, with 100.0% of males and 100.0% of females in these age groups living above the poverty line.
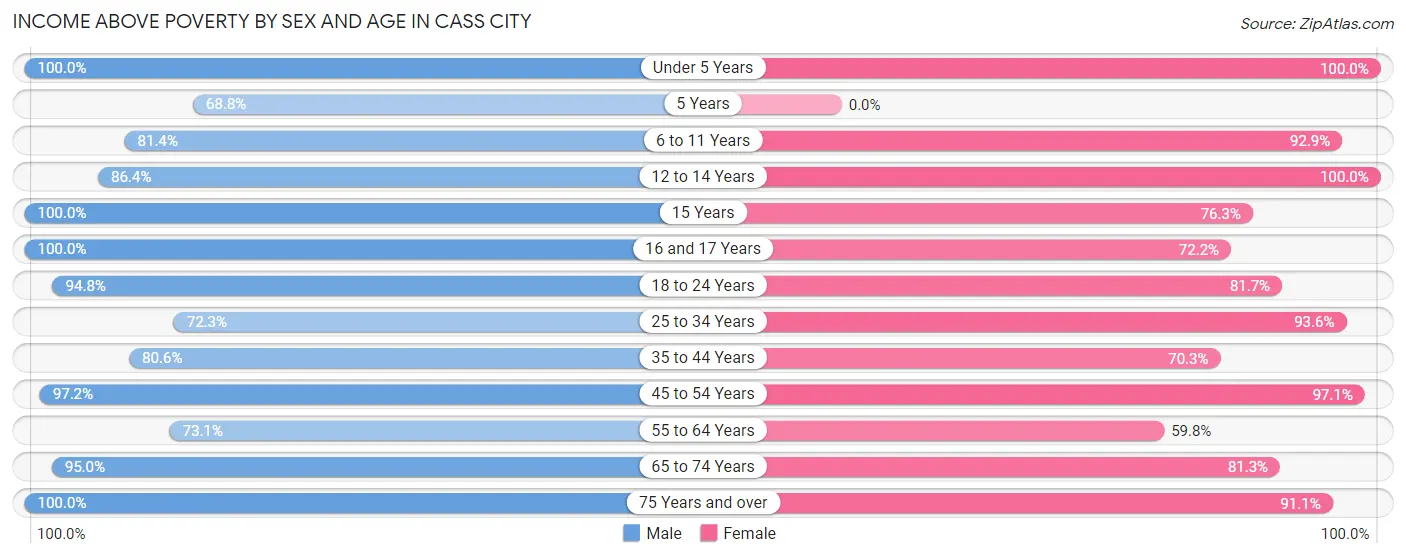
| Age Bracket | Male | Female |
| Under 5 Years | 85 (100.0%) | 86 (100.0%) |
| 5 Years | 11 (68.8%) | 0 (0.0%) |
| 6 to 11 Years | 57 (81.4%) | 52 (92.9%) |
| 12 to 14 Years | 38 (86.4%) | 5 (100.0%) |
| 15 Years | 13 (100.0%) | 45 (76.3%) |
| 16 and 17 Years | 30 (100.0%) | 13 (72.2%) |
| 18 to 24 Years | 91 (94.8%) | 58 (81.7%) |
| 25 to 34 Years | 107 (72.3%) | 88 (93.6%) |
| 35 to 44 Years | 108 (80.6%) | 85 (70.3%) |
| 45 to 54 Years | 171 (97.2%) | 132 (97.1%) |
| 55 to 64 Years | 114 (73.1%) | 73 (59.8%) |
| 65 to 74 Years | 94 (95.0%) | 74 (81.3%) |
| 75 Years and over | 73 (100.0%) | 153 (91.1%) |
| Total | 992 (87.0%) | 864 (83.6%) |
Income Below Poverty Among Married-Couple Families in Cass City
The poverty statistics for married-couple families in Cass City show that 7.3% or 30 of the total 412 families live below the poverty line. Families with no children have the highest poverty rate of 10.5%, comprising of 26 families. On the other hand, families with 3 or 4 children have the lowest poverty rate of 0.0%, which includes 0 families.
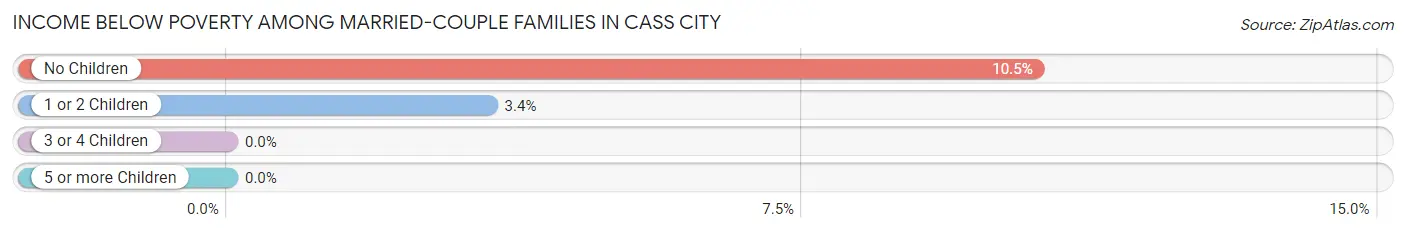
| Children | Above Poverty | Below Poverty |
| No Children | 221 (89.5%) | 26 (10.5%) |
| 1 or 2 Children | 114 (96.6%) | 4 (3.4%) |
| 3 or 4 Children | 47 (100.0%) | 0 (0.0%) |
| 5 or more Children | 0 (0.0%) | 0 (0.0%) |
| Total | 382 (92.7%) | 30 (7.3%) |
Income Below Poverty Among Single-Parent Households in Cass City
According to the poverty data in Cass City, 10.2% or 5 single-father households and 14.9% or 10 single-mother households are living below the poverty line. Among single-father households, those with 1 or 2 children have the highest poverty rate, with 5 households (16.7%) experiencing poverty. Likewise, among single-mother households, those with 5 or more children have the highest poverty rate, with 6 households (100.0%) falling below the poverty line.
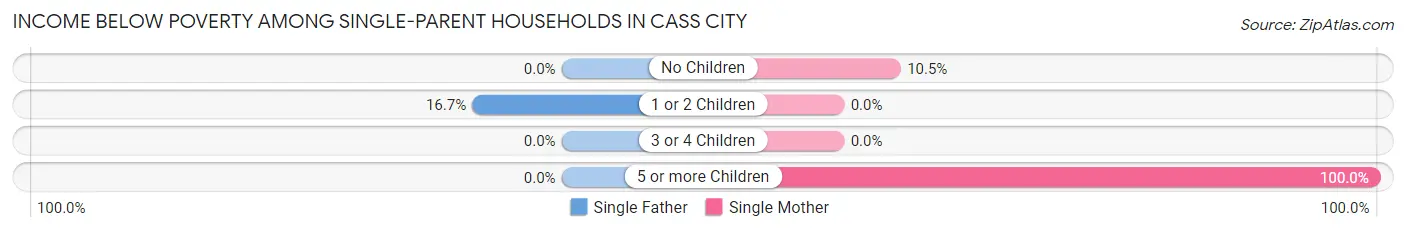
| Children | Single Father | Single Mother |
| No Children | 0 (0.0%) | 4 (10.5%) |
| 1 or 2 Children | 5 (16.7%) | 0 (0.0%) |
| 3 or 4 Children | 0 (0.0%) | 0 (0.0%) |
| 5 or more Children | 0 (0.0%) | 6 (100.0%) |
| Total | 5 (10.2%) | 10 (14.9%) |
Income Below Poverty Among Married-Couple vs Single-Parent Households in Cass City
The poverty data for Cass City shows that 30 of the married-couple family households (7.3%) and 15 of the single-parent households (12.9%) are living below the poverty level. Within the married-couple family households, those with no children have the highest poverty rate, with 26 households (10.5%) falling below the poverty line. Among the single-parent households, those with 5 or more children have the highest poverty rate, with 6 household (100.0%) living below poverty.
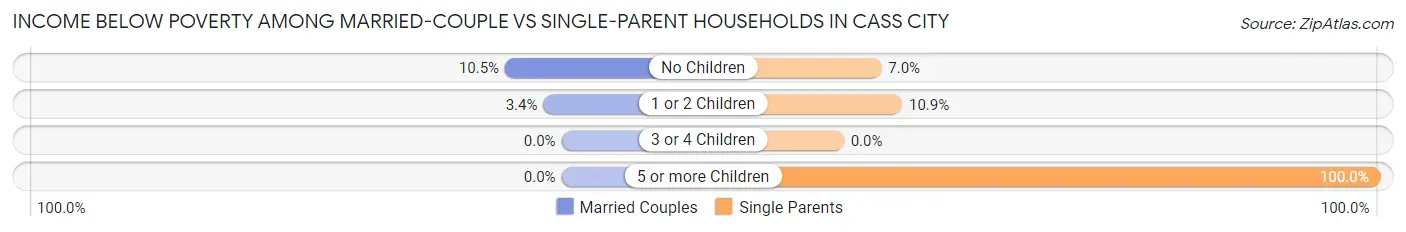
| Children | Married-Couple Families | Single-Parent Households |
| No Children | 26 (10.5%) | 4 (7.0%) |
| 1 or 2 Children | 4 (3.4%) | 5 (10.9%) |
| 3 or 4 Children | 0 (0.0%) | 0 (0.0%) |
| 5 or more Children | 0 (0.0%) | 6 (100.0%) |
| Total | 30 (7.3%) | 15 (12.9%) |
Employment Characteristics in Cass City
Employment by Class of Employer in Cass City
Among the 868 employed individuals in Cass City, private company employees (676 | 77.9%), local government employees (74 | 8.5%), and not-for-profit organizations (64 | 7.4%) make up the most common classes of employment.
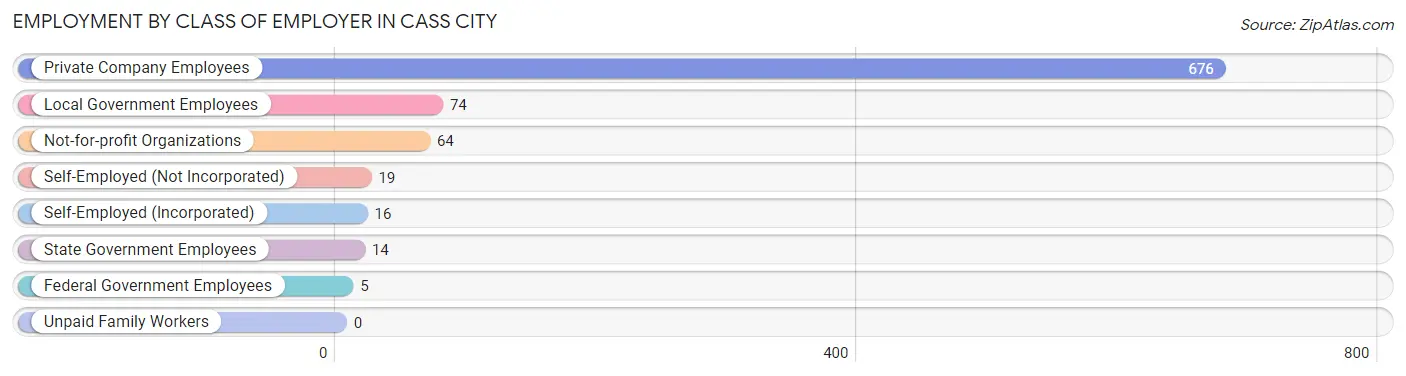
| Employer Class | # Employees | % Employees |
| Private Company Employees | 676 | 77.9% |
| Self-Employed (Incorporated) | 16 | 1.8% |
| Self-Employed (Not Incorporated) | 19 | 2.2% |
| Not-for-profit Organizations | 64 | 7.4% |
| Local Government Employees | 74 | 8.5% |
| State Government Employees | 14 | 1.6% |
| Federal Government Employees | 5 | 0.6% |
| Unpaid Family Workers | 0 | 0.0% |
| Total | 868 | 100.0% |
Employment Status by Age in Cass City
According to the labor force statistics for Cass City, out of the total population over 16 years of age (1,830), 52.4% or 959 individuals are in the labor force, with 8.7% or 83 of them unemployed. The age group with the highest labor force participation rate is 55 to 59 years, with 92.3% or 72 individuals in the labor force. Within the labor force, the 20 to 24 years age range has the highest percentage of unemployed individuals, with 41.9% or 36 of them being unemployed.
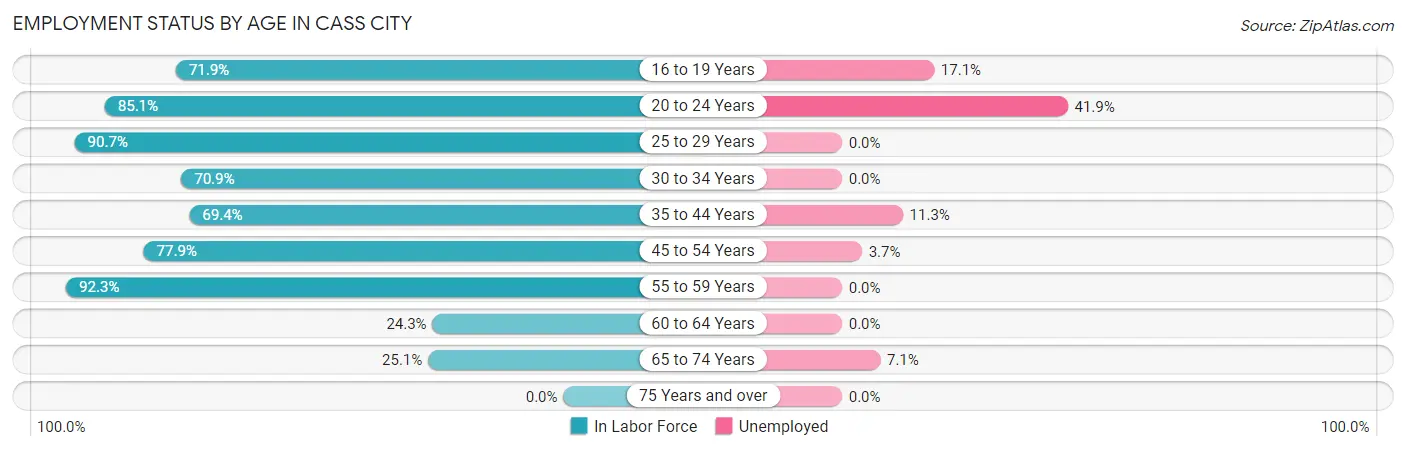
| Age Bracket | In Labor Force | Unemployed |
| 16 to 19 Years | 82 (71.9%) | 14 (17.1%) |
| 20 to 24 Years | 86 (85.1%) | 36 (41.9%) |
| 25 to 29 Years | 98 (90.7%) | 0 (0.0%) |
| 30 to 34 Years | 95 (70.9%) | 0 (0.0%) |
| 35 to 44 Years | 177 (69.4%) | 20 (11.3%) |
| 45 to 54 Years | 243 (77.9%) | 9 (3.7%) |
| 55 to 59 Years | 72 (92.3%) | 0 (0.0%) |
| 60 to 64 Years | 50 (24.3%) | 0 (0.0%) |
| 65 to 74 Years | 56 (25.1%) | 4 (7.1%) |
| 75 Years and over | 0 (0.0%) | 0 (0.0%) |
| Total | 959 (52.4%) | 83 (8.7%) |
Employment Status by Educational Attainment in Cass City
According to labor force statistics for Cass City, 67.2% of individuals (734) out of the total population between 25 and 64 years of age (1,093) are in the labor force, with 3.9% or 29 of them being unemployed. The group with the highest labor force participation rate are those with the educational attainment of bachelor's degree or higher, with 84.5% or 197 individuals in the labor force. Within the labor force, individuals with high school diploma education have the highest percentage of unemployment, with 10.0% or 23 of them being unemployed.
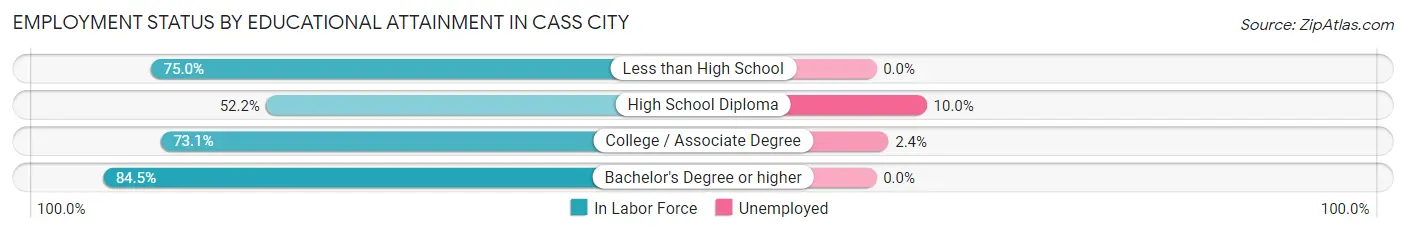
| Educational Attainment | In Labor Force | Unemployed |
| Less than High School | 54 (75.0%) | 0 (0.0%) |
| High School Diploma | 229 (52.2%) | 44 (10.0%) |
| College / Associate Degree | 255 (73.1%) | 8 (2.4%) |
| Bachelor's Degree or higher | 197 (84.5%) | 0 (0.0%) |
| Total | 734 (67.2%) | 43 (3.9%) |
Employment Occupations by Sex in Cass City
Management, Business, Science and Arts Occupations
The most common Management, Business, Science and Arts occupations in Cass City are Management (76 | 8.7%), Health Diagnosing & Treating (69 | 7.9%), Health Technologists (61 | 7.0%), Community & Social Service (49 | 5.6%), and Business & Financial (31 | 3.5%).
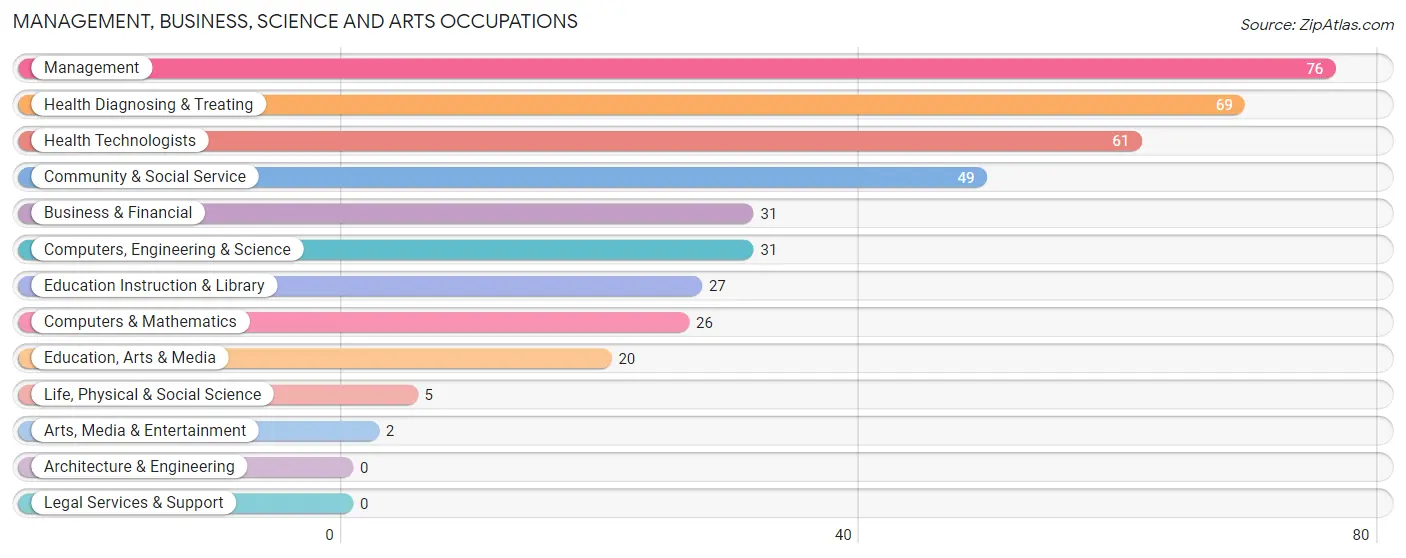
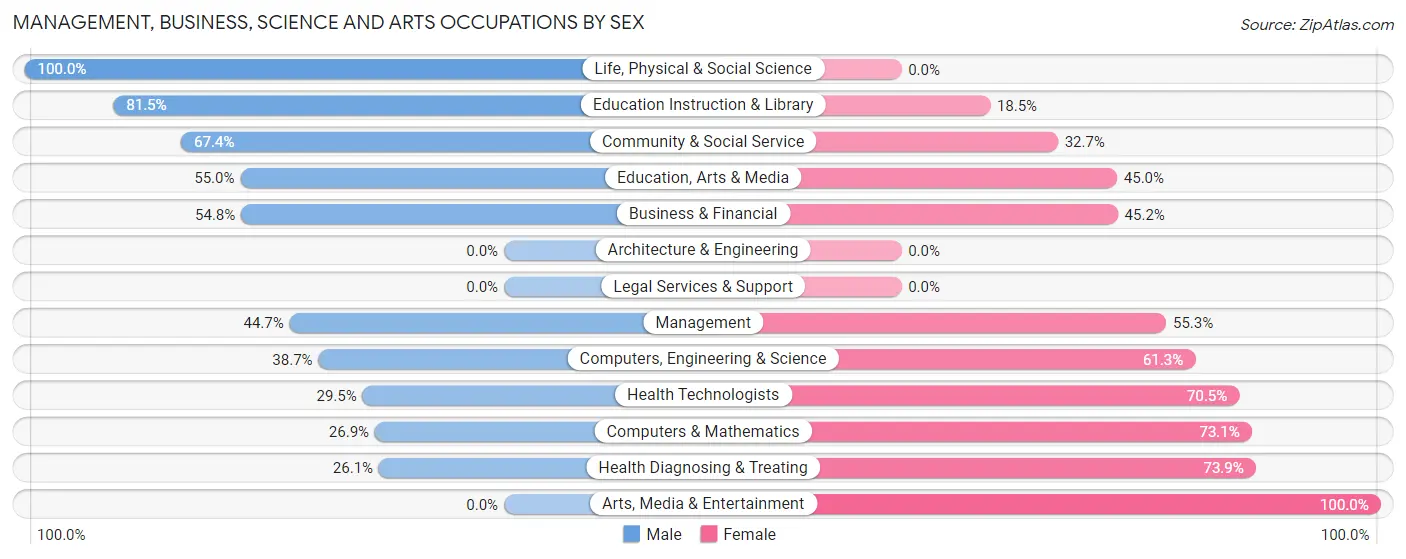
Management, Business, Science and Arts Occupations by Sex
Within the Management, Business, Science and Arts occupations in Cass City, the most male-oriented occupations are Life, Physical & Social Science (100.0%), Education Instruction & Library (81.5%), and Community & Social Service (67.3%), while the most female-oriented occupations are Arts, Media & Entertainment (100.0%), Health Diagnosing & Treating (73.9%), and Computers & Mathematics (73.1%).
| Occupation | Male | Female |
| Management | 34 (44.7%) | 42 (55.3%) |
| Business & Financial | 17 (54.8%) | 14 (45.2%) |
| Computers, Engineering & Science | 12 (38.7%) | 19 (61.3%) |
| Computers & Mathematics | 7 (26.9%) | 19 (73.1%) |
| Architecture & Engineering | 0 (0.0%) | 0 (0.0%) |
| Life, Physical & Social Science | 5 (100.0%) | 0 (0.0%) |
| Community & Social Service | 33 (67.3%) | 16 (32.7%) |
| Education, Arts & Media | 11 (55.0%) | 9 (45.0%) |
| Legal Services & Support | 0 (0.0%) | 0 (0.0%) |
| Education Instruction & Library | 22 (81.5%) | 5 (18.5%) |
| Arts, Media & Entertainment | 0 (0.0%) | 2 (100.0%) |
| Health Diagnosing & Treating | 18 (26.1%) | 51 (73.9%) |
| Health Technologists | 18 (29.5%) | 43 (70.5%) |
| Total (Category) | 114 (44.5%) | 142 (55.5%) |
| Total (Overall) | 511 (58.3%) | 365 (41.7%) |
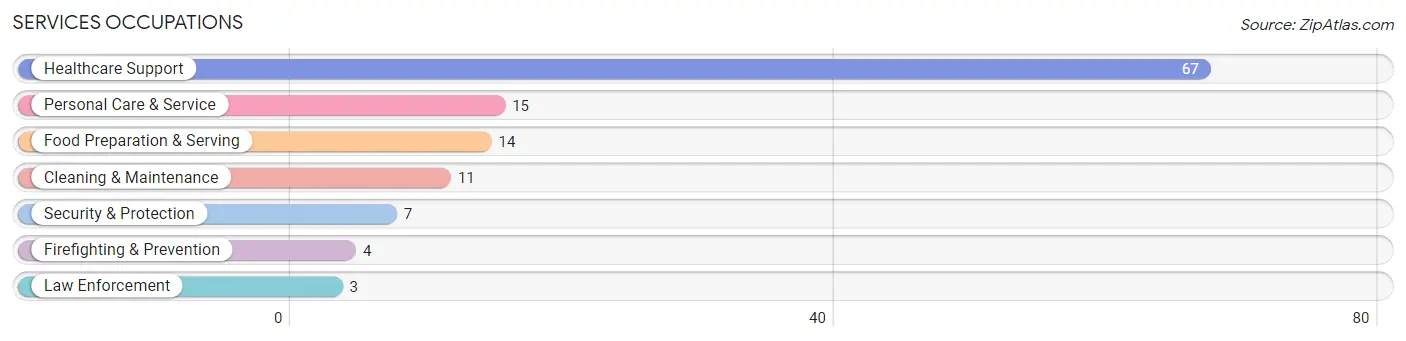
Services Occupations
The most common Services occupations in Cass City are Healthcare Support (67 | 7.6%), Personal Care & Service (15 | 1.7%), Food Preparation & Serving (14 | 1.6%), Cleaning & Maintenance (11 | 1.3%), and Security & Protection (7 | 0.8%).
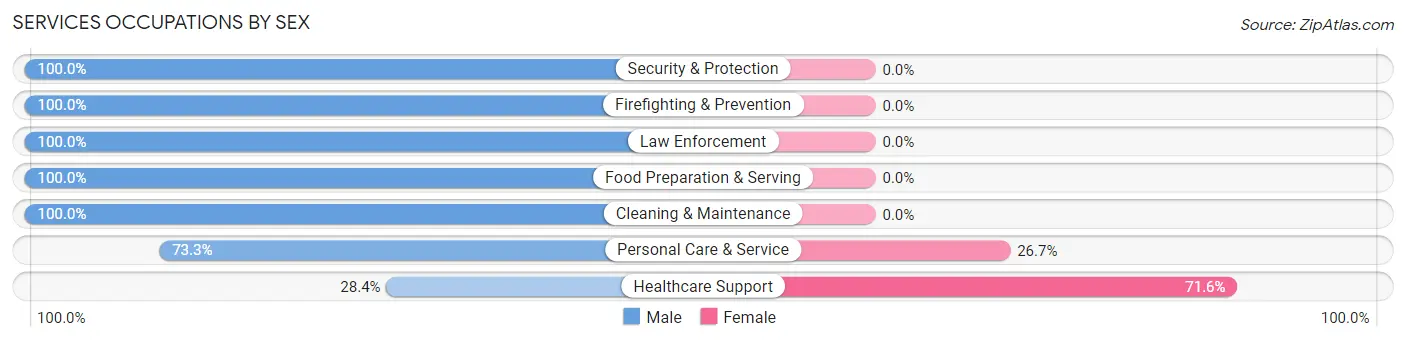
Services Occupations by Sex
Within the Services occupations in Cass City, the most male-oriented occupations are Security & Protection (100.0%), Firefighting & Prevention (100.0%), and Law Enforcement (100.0%), while the most female-oriented occupations are Healthcare Support (71.6%), and Personal Care & Service (26.7%).
| Occupation | Male | Female |
| Healthcare Support | 19 (28.4%) | 48 (71.6%) |
| Security & Protection | 7 (100.0%) | 0 (0.0%) |
| Firefighting & Prevention | 4 (100.0%) | 0 (0.0%) |
| Law Enforcement | 3 (100.0%) | 0 (0.0%) |
| Food Preparation & Serving | 14 (100.0%) | 0 (0.0%) |
| Cleaning & Maintenance | 11 (100.0%) | 0 (0.0%) |
| Personal Care & Service | 11 (73.3%) | 4 (26.7%) |
| Total (Category) | 62 (54.4%) | 52 (45.6%) |
| Total (Overall) | 511 (58.3%) | 365 (41.7%) |
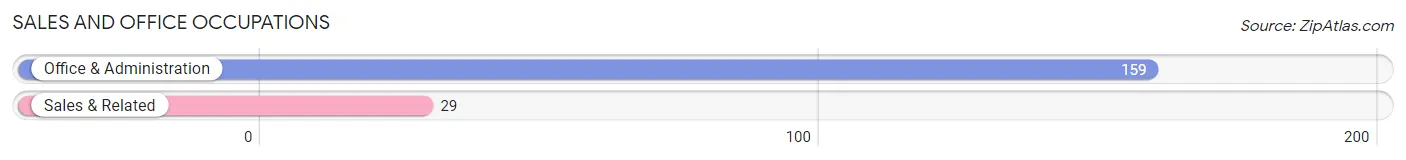
Sales and Office Occupations
The most common Sales and Office occupations in Cass City are Office & Administration (159 | 18.1%), and Sales & Related (29 | 3.3%).
Sales and Office Occupations by Sex
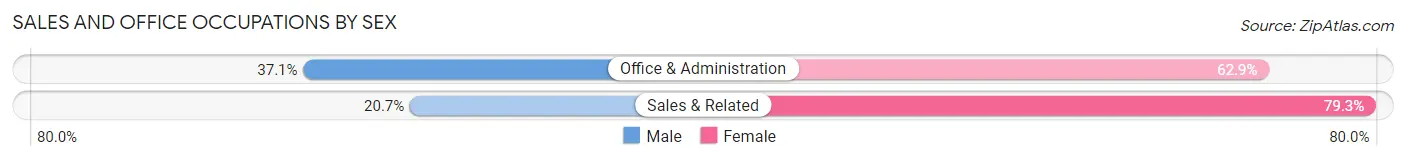
| Occupation | Male | Female |
| Sales & Related | 6 (20.7%) | 23 (79.3%) |
| Office & Administration | 59 (37.1%) | 100 (62.9%) |
| Total (Category) | 65 (34.6%) | 123 (65.4%) |
| Total (Overall) | 511 (58.3%) | 365 (41.7%) |
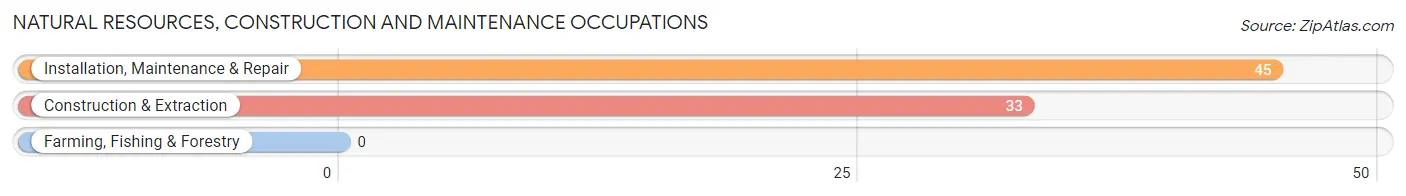
Natural Resources, Construction and Maintenance Occupations
The most common Natural Resources, Construction and Maintenance occupations in Cass City are Installation, Maintenance & Repair (45 | 5.1%), and Construction & Extraction (33 | 3.8%).
Natural Resources, Construction and Maintenance Occupations by Sex
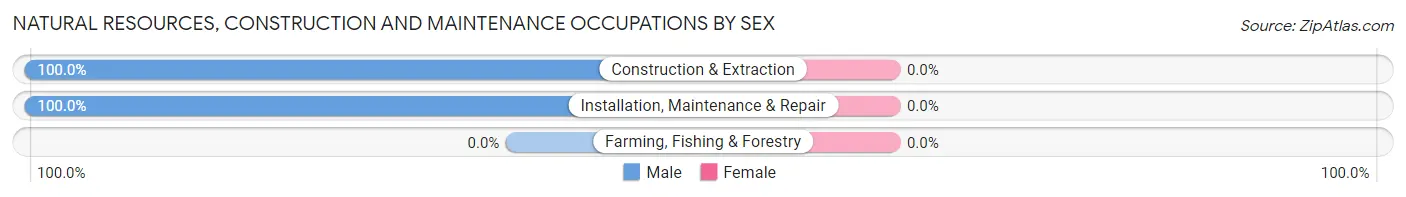
| Occupation | Male | Female |
| Farming, Fishing & Forestry | 0 (0.0%) | 0 (0.0%) |
| Construction & Extraction | 33 (100.0%) | 0 (0.0%) |
| Installation, Maintenance & Repair | 45 (100.0%) | 0 (0.0%) |
| Total (Category) | 78 (100.0%) | 0 (0.0%) |
| Total (Overall) | 511 (58.3%) | 365 (41.7%) |
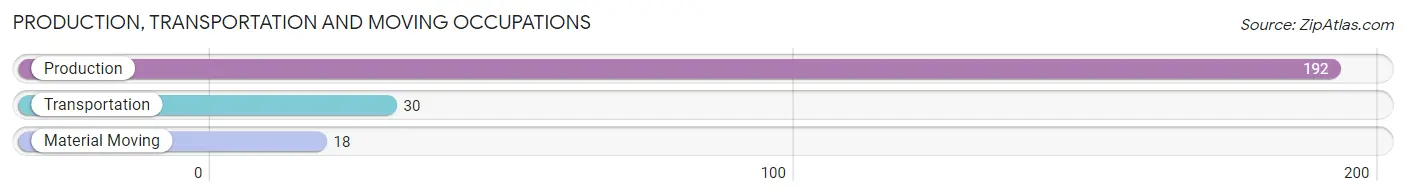
Production, Transportation and Moving Occupations
The most common Production, Transportation and Moving occupations in Cass City are Production (192 | 21.9%), Transportation (30 | 3.4%), and Material Moving (18 | 2.1%).
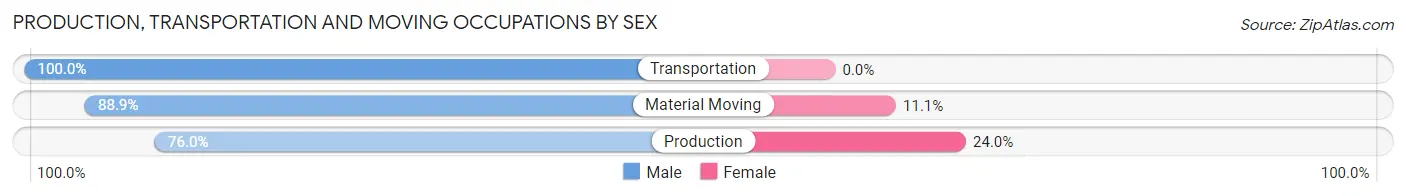
Production, Transportation and Moving Occupations by Sex
| Occupation | Male | Female |
| Production | 146 (76.0%) | 46 (24.0%) |
| Transportation | 30 (100.0%) | 0 (0.0%) |
| Material Moving | 16 (88.9%) | 2 (11.1%) |
| Total (Category) | 192 (80.0%) | 48 (20.0%) |
| Total (Overall) | 511 (58.3%) | 365 (41.7%) |
Employment Industries by Sex in Cass City
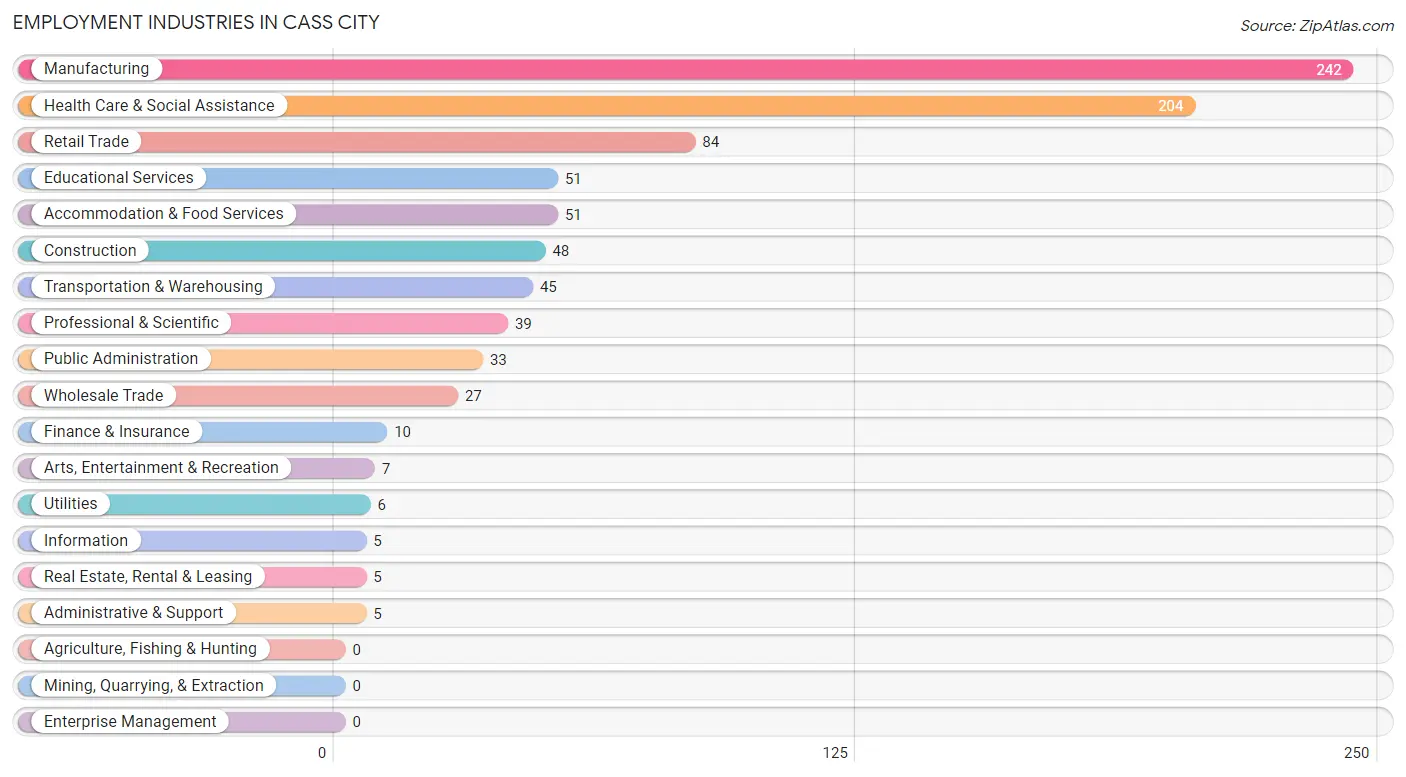
Employment Industries in Cass City
The major employment industries in Cass City include Manufacturing (242 | 27.6%), Health Care & Social Assistance (204 | 23.3%), Retail Trade (84 | 9.6%), Educational Services (51 | 5.8%), and Accommodation & Food Services (51 | 5.8%).
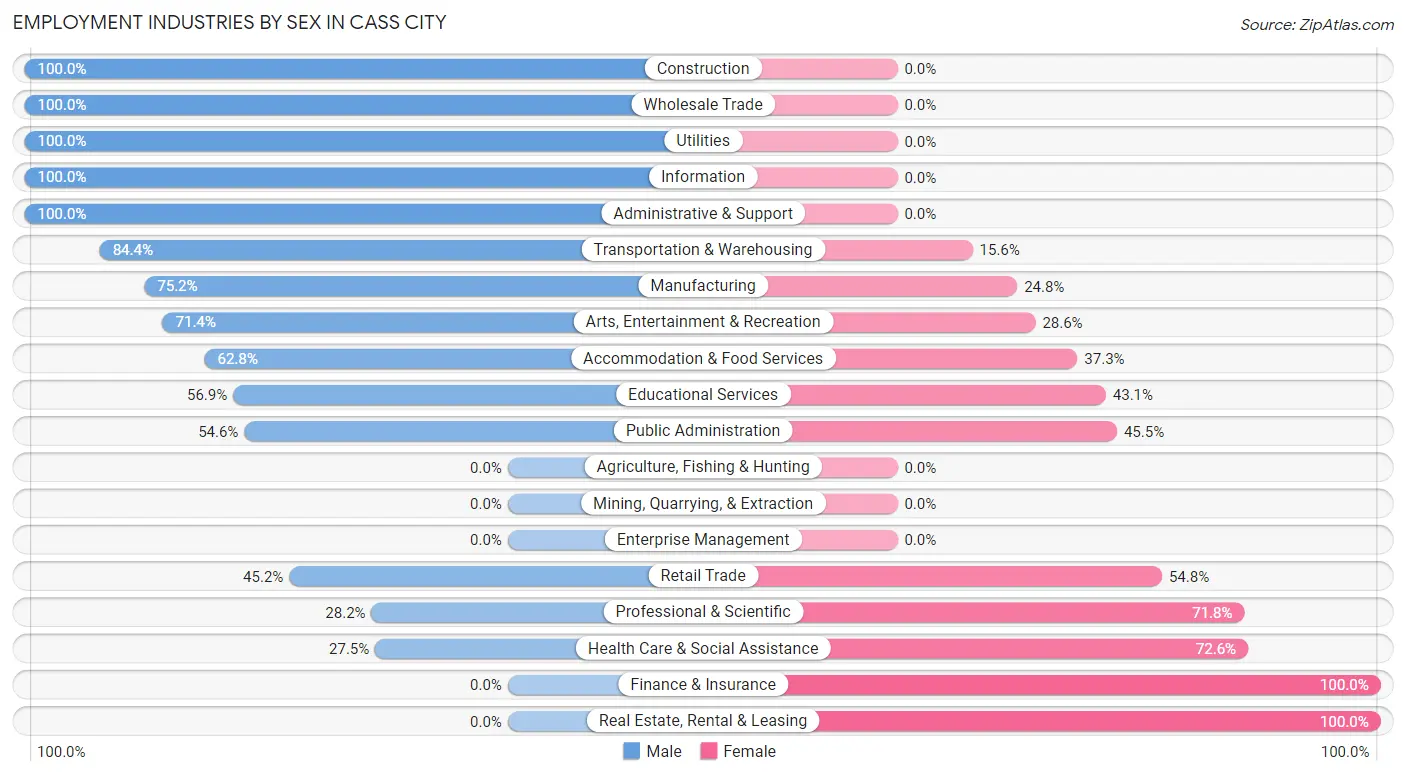
Employment Industries by Sex in Cass City
The Cass City industries that see more men than women are Construction (100.0%), Wholesale Trade (100.0%), and Utilities (100.0%), whereas the industries that tend to have a higher number of women are Finance & Insurance (100.0%), Real Estate, Rental & Leasing (100.0%), and Health Care & Social Assistance (72.6%).
| Industry | Male | Female |
| Agriculture, Fishing & Hunting | 0 (0.0%) | 0 (0.0%) |
| Mining, Quarrying, & Extraction | 0 (0.0%) | 0 (0.0%) |
| Construction | 48 (100.0%) | 0 (0.0%) |
| Manufacturing | 182 (75.2%) | 60 (24.8%) |
| Wholesale Trade | 27 (100.0%) | 0 (0.0%) |
| Retail Trade | 38 (45.2%) | 46 (54.8%) |
| Transportation & Warehousing | 38 (84.4%) | 7 (15.6%) |
| Utilities | 6 (100.0%) | 0 (0.0%) |
| Information | 5 (100.0%) | 0 (0.0%) |
| Finance & Insurance | 0 (0.0%) | 10 (100.0%) |
| Real Estate, Rental & Leasing | 0 (0.0%) | 5 (100.0%) |
| Professional & Scientific | 11 (28.2%) | 28 (71.8%) |
| Enterprise Management | 0 (0.0%) | 0 (0.0%) |
| Administrative & Support | 5 (100.0%) | 0 (0.0%) |
| Educational Services | 29 (56.9%) | 22 (43.1%) |
| Health Care & Social Assistance | 56 (27.5%) | 148 (72.6%) |
| Arts, Entertainment & Recreation | 5 (71.4%) | 2 (28.6%) |
| Accommodation & Food Services | 32 (62.7%) | 19 (37.2%) |
| Public Administration | 18 (54.5%) | 15 (45.5%) |
| Total | 511 (58.3%) | 365 (41.7%) |
Education in Cass City
School Enrollment in Cass City
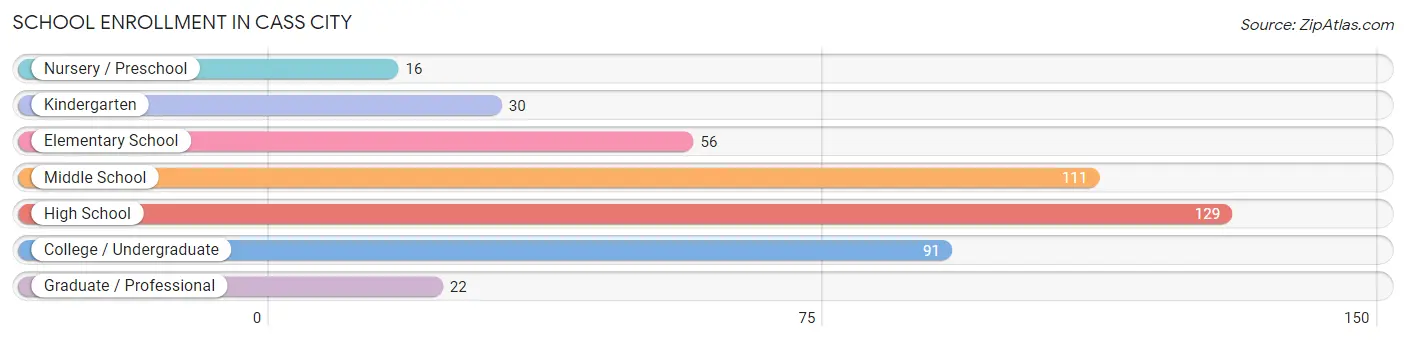
The most common levels of schooling among the 455 students in Cass City are high school (129 | 28.3%), middle school (111 | 24.4%), and college / undergraduate (91 | 20.0%).
| School Level | # Students | % Students |
| Nursery / Preschool | 16 | 3.5% |
| Kindergarten | 30 | 6.6% |
| Elementary School | 56 | 12.3% |
| Middle School | 111 | 24.4% |
| High School | 129 | 28.3% |
| College / Undergraduate | 91 | 20.0% |
| Graduate / Professional | 22 | 4.8% |
| Total | 455 | 100.0% |
School Enrollment by Age by Funding Source in Cass City
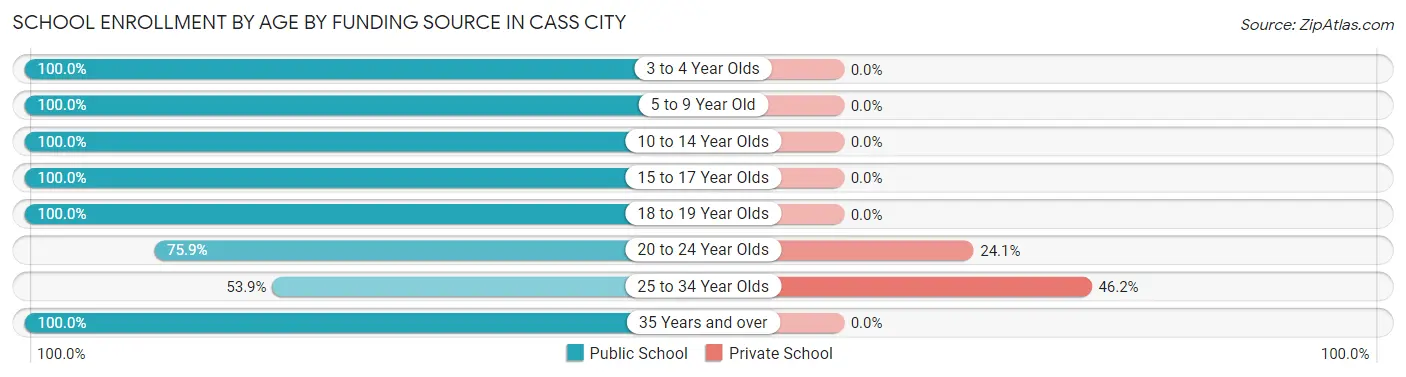
Out of a total of 455 students who are enrolled in schools in Cass City, 19 (4.2%) attend a private institution, while the remaining 436 (95.8%) are enrolled in public schools. The age group of 25 to 34 year olds has the highest likelihood of being enrolled in private schools, with 12 (46.2% in the age bracket) enrolled. Conversely, the age group of 3 to 4 year olds has the lowest likelihood of being enrolled in a private school, with 5 (100.0% in the age bracket) attending a public institution.
| Age Bracket | Public School | Private School |
| 3 to 4 Year Olds | 5 (100.0%) | 0 (0.0%) |
| 5 to 9 Year Old | 85 (100.0%) | 0 (0.0%) |
| 10 to 14 Year Olds | 111 (100.0%) | 0 (0.0%) |
| 15 to 17 Year Olds | 120 (100.0%) | 0 (0.0%) |
| 18 to 19 Year Olds | 53 (100.0%) | 0 (0.0%) |
| 20 to 24 Year Olds | 22 (75.9%) | 7 (24.1%) |
| 25 to 34 Year Olds | 14 (53.8%) | 12 (46.2%) |
| 35 Years and over | 26 (100.0%) | 0 (0.0%) |
| Total | 436 (95.8%) | 19 (4.2%) |
Educational Attainment by Field of Study in Cass City
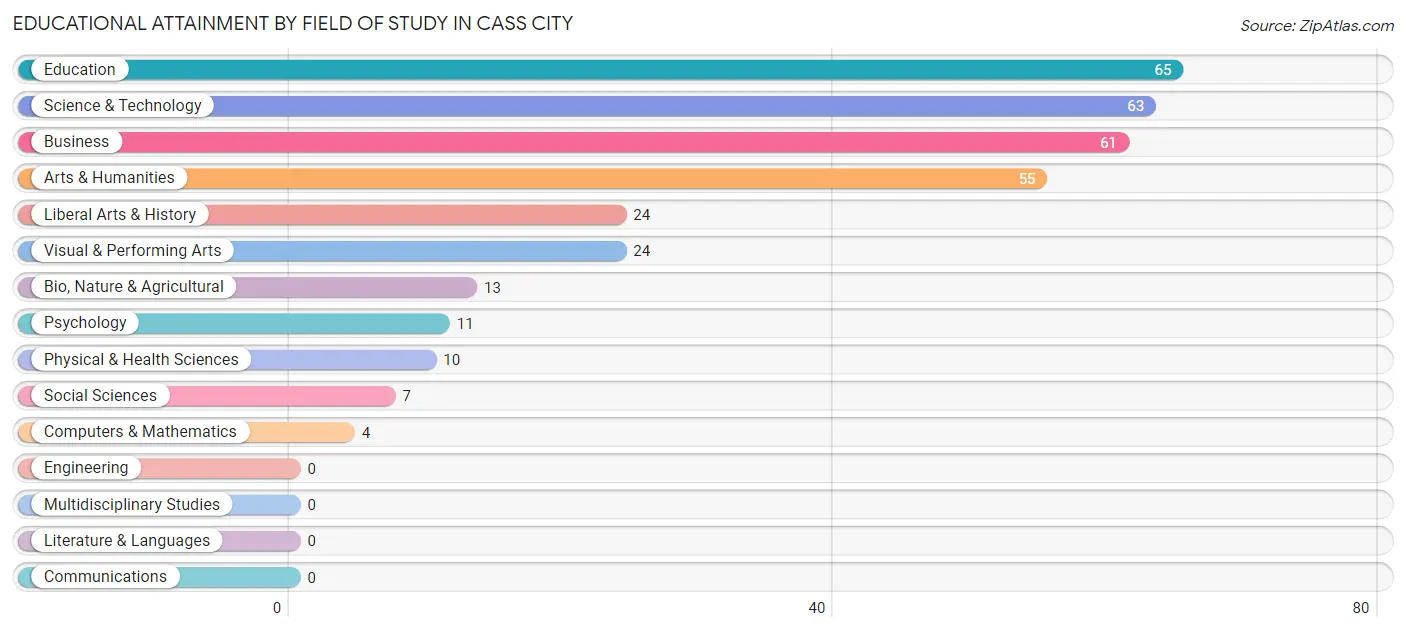
Education (65 | 19.3%), science & technology (63 | 18.7%), business (61 | 18.1%), arts & humanities (55 | 16.3%), and liberal arts & history (24 | 7.1%) are the most common fields of study among 337 individuals in Cass City who have obtained a bachelor's degree or higher.
| Field of Study | # Graduates | % Graduates |
| Computers & Mathematics | 4 | 1.2% |
| Bio, Nature & Agricultural | 13 | 3.9% |
| Physical & Health Sciences | 10 | 3.0% |
| Psychology | 11 | 3.3% |
| Social Sciences | 7 | 2.1% |
| Engineering | 0 | 0.0% |
| Multidisciplinary Studies | 0 | 0.0% |
| Science & Technology | 63 | 18.7% |
| Business | 61 | 18.1% |
| Education | 65 | 19.3% |
| Literature & Languages | 0 | 0.0% |
| Liberal Arts & History | 24 | 7.1% |
| Visual & Performing Arts | 24 | 7.1% |
| Communications | 0 | 0.0% |
| Arts & Humanities | 55 | 16.3% |
| Total | 337 | 100.0% |
Transportation & Commute in Cass City
Vehicle Availability by Sex in Cass City
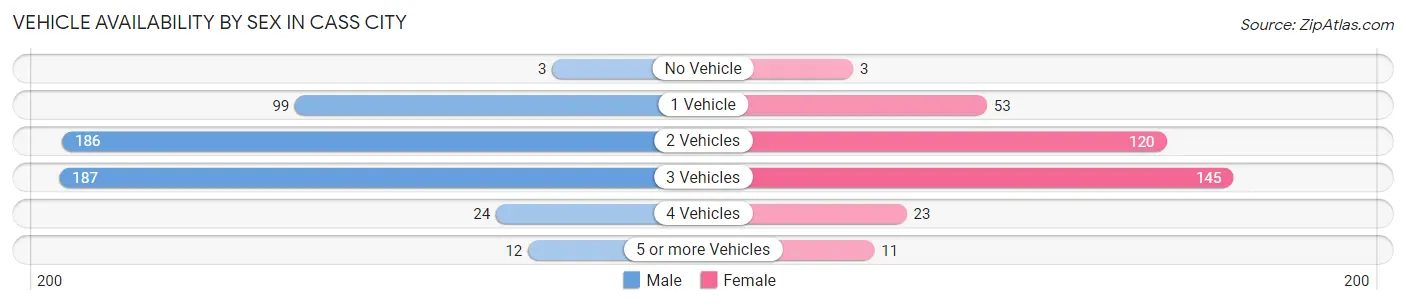
The most prevalent vehicle ownership categories in Cass City are males with 3 vehicles (187, accounting for 36.6%) and females with 3 vehicles (145, making up 52.7%).
| Vehicles Available | Male | Female |
| No Vehicle | 3 (0.6%) | 3 (0.9%) |
| 1 Vehicle | 99 (19.4%) | 53 (14.9%) |
| 2 Vehicles | 186 (36.4%) | 120 (33.8%) |
| 3 Vehicles | 187 (36.6%) | 145 (40.8%) |
| 4 Vehicles | 24 (4.7%) | 23 (6.5%) |
| 5 or more Vehicles | 12 (2.4%) | 11 (3.1%) |
| Total | 511 (100.0%) | 355 (100.0%) |
Commute Time in Cass City
The most frequently occuring commute durations in Cass City are 5 to 9 minutes (256 commuters, 30.1%), less than 5 minutes (147 commuters, 17.3%), and 30 to 34 minutes (143 commuters, 16.8%).
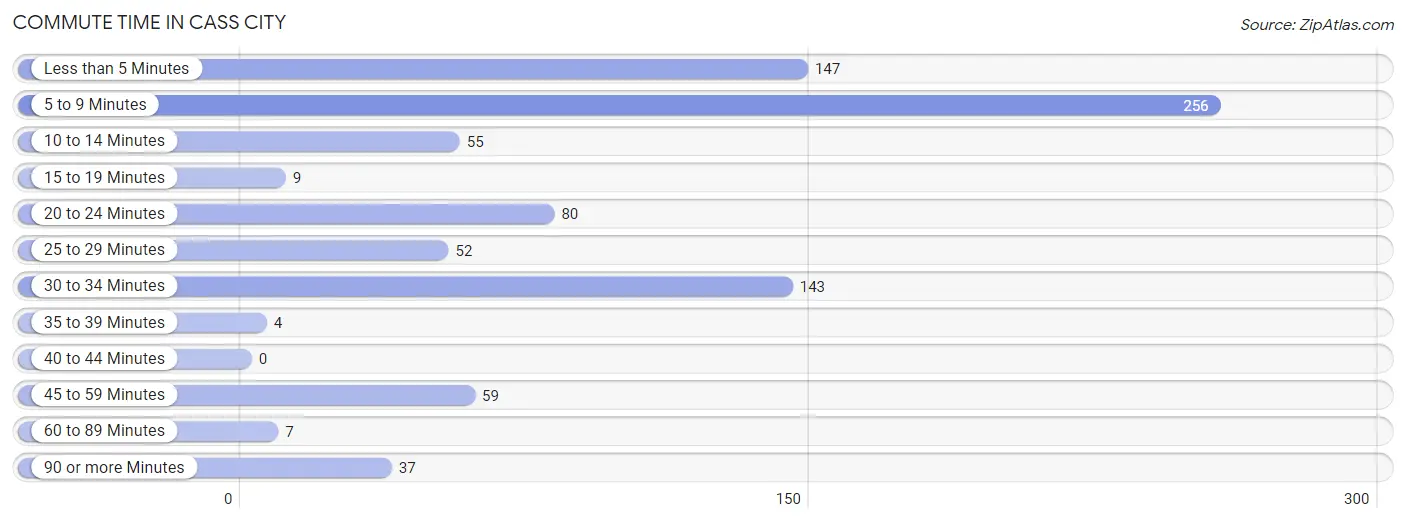
| Commute Time | # Commuters | % Commuters |
| Less than 5 Minutes | 147 | 17.3% |
| 5 to 9 Minutes | 256 | 30.1% |
| 10 to 14 Minutes | 55 | 6.5% |
| 15 to 19 Minutes | 9 | 1.1% |
| 20 to 24 Minutes | 80 | 9.4% |
| 25 to 29 Minutes | 52 | 6.1% |
| 30 to 34 Minutes | 143 | 16.8% |
| 35 to 39 Minutes | 4 | 0.5% |
| 40 to 44 Minutes | 0 | 0.0% |
| 45 to 59 Minutes | 59 | 7.0% |
| 60 to 89 Minutes | 7 | 0.8% |
| 90 or more Minutes | 37 | 4.4% |
Commute Time by Sex in Cass City
The most common commute times in Cass City are 5 to 9 minutes (150 commuters, 30.0%) for males and 5 to 9 minutes (106 commuters, 30.4%) for females.
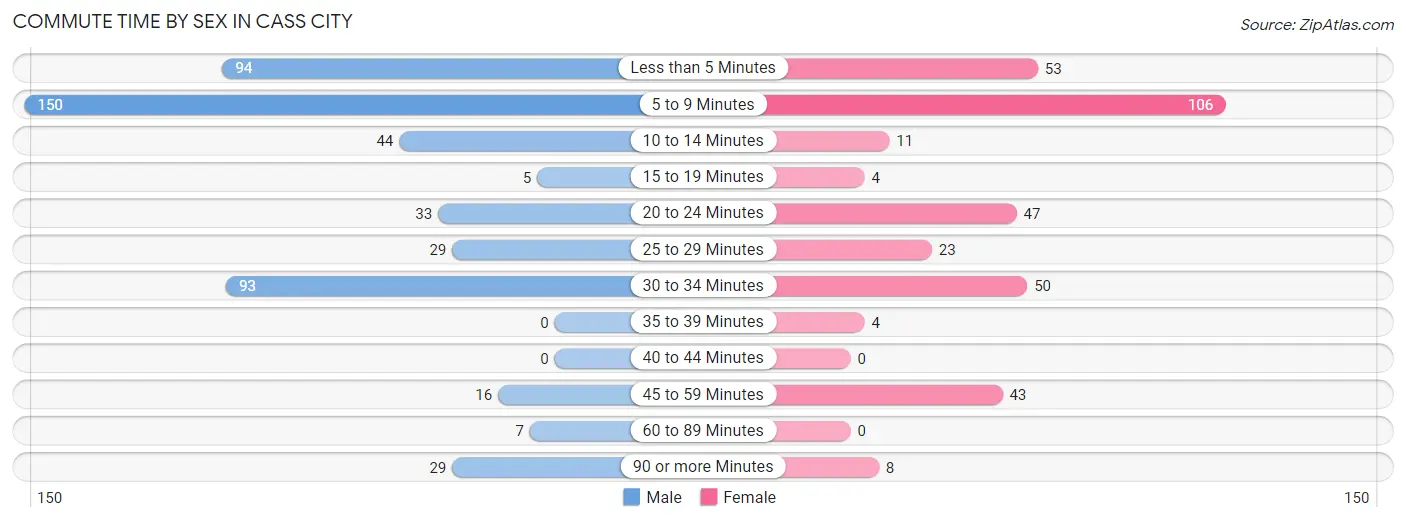
| Commute Time | Male | Female |
| Less than 5 Minutes | 94 (18.8%) | 53 (15.2%) |
| 5 to 9 Minutes | 150 (30.0%) | 106 (30.4%) |
| 10 to 14 Minutes | 44 (8.8%) | 11 (3.2%) |
| 15 to 19 Minutes | 5 (1.0%) | 4 (1.1%) |
| 20 to 24 Minutes | 33 (6.6%) | 47 (13.5%) |
| 25 to 29 Minutes | 29 (5.8%) | 23 (6.6%) |
| 30 to 34 Minutes | 93 (18.6%) | 50 (14.3%) |
| 35 to 39 Minutes | 0 (0.0%) | 4 (1.1%) |
| 40 to 44 Minutes | 0 (0.0%) | 0 (0.0%) |
| 45 to 59 Minutes | 16 (3.2%) | 43 (12.3%) |
| 60 to 89 Minutes | 7 (1.4%) | 0 (0.0%) |
| 90 or more Minutes | 29 (5.8%) | 8 (2.3%) |
Time of Departure to Work by Sex in Cass City
The most frequent times of departure to work in Cass City are 7:00 AM to 7:29 AM (75, 15.0%) for males and 7:30 AM to 7:59 AM (79, 22.6%) for females.
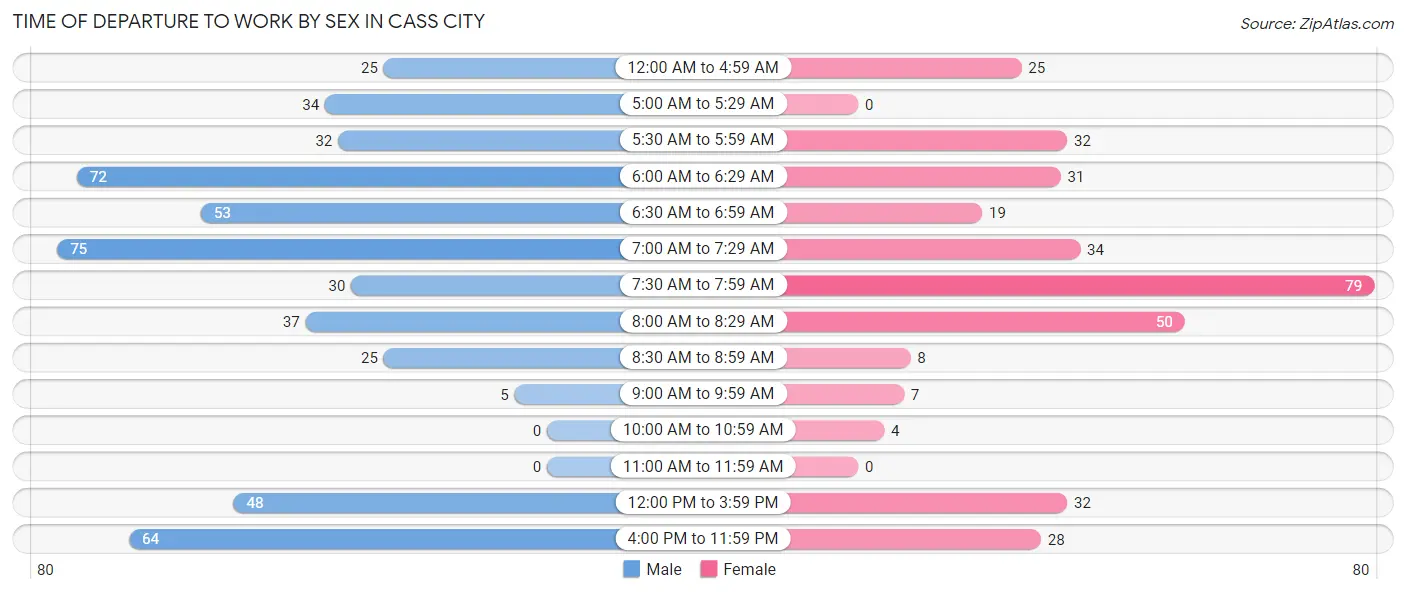
| Time of Departure | Male | Female |
| 12:00 AM to 4:59 AM | 25 (5.0%) | 25 (7.2%) |
| 5:00 AM to 5:29 AM | 34 (6.8%) | 0 (0.0%) |
| 5:30 AM to 5:59 AM | 32 (6.4%) | 32 (9.2%) |
| 6:00 AM to 6:29 AM | 72 (14.4%) | 31 (8.9%) |
| 6:30 AM to 6:59 AM | 53 (10.6%) | 19 (5.4%) |
| 7:00 AM to 7:29 AM | 75 (15.0%) | 34 (9.7%) |
| 7:30 AM to 7:59 AM | 30 (6.0%) | 79 (22.6%) |
| 8:00 AM to 8:29 AM | 37 (7.4%) | 50 (14.3%) |
| 8:30 AM to 8:59 AM | 25 (5.0%) | 8 (2.3%) |
| 9:00 AM to 9:59 AM | 5 (1.0%) | 7 (2.0%) |
| 10:00 AM to 10:59 AM | 0 (0.0%) | 4 (1.1%) |
| 11:00 AM to 11:59 AM | 0 (0.0%) | 0 (0.0%) |
| 12:00 PM to 3:59 PM | 48 (9.6%) | 32 (9.2%) |
| 4:00 PM to 11:59 PM | 64 (12.8%) | 28 (8.0%) |
| Total | 500 (100.0%) | 349 (100.0%) |
Housing Occupancy in Cass City
Occupancy by Ownership in Cass City
Of the total 875 dwellings in Cass City, owner-occupied units account for 673 (76.9%), while renter-occupied units make up 202 (23.1%).
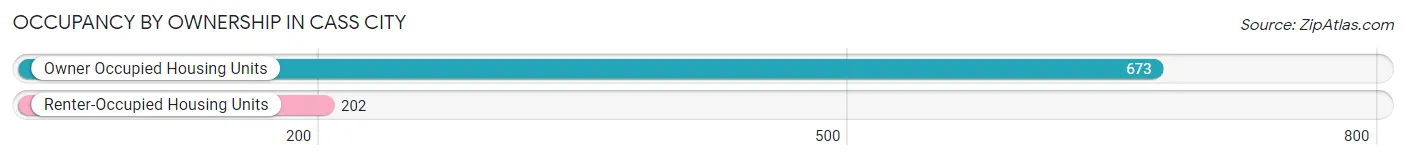
| Occupancy | # Housing Units | % Housing Units |
| Owner Occupied Housing Units | 673 | 76.9% |
| Renter-Occupied Housing Units | 202 | 23.1% |
| Total Occupied Housing Units | 875 | 100.0% |
Occupancy by Household Size in Cass City
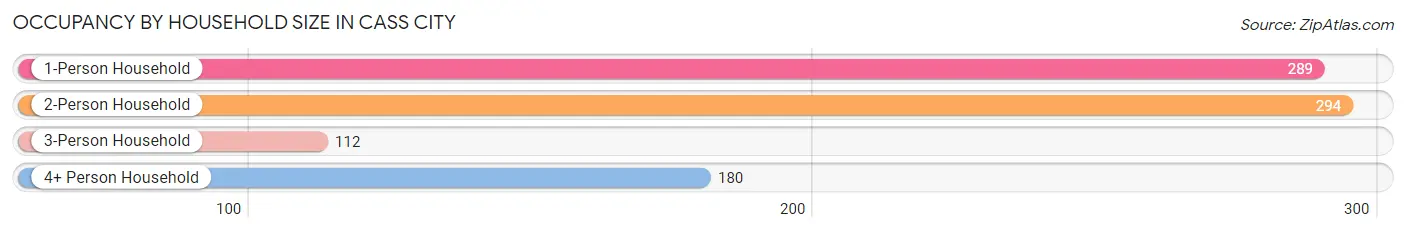
| Household Size | # Housing Units | % Housing Units |
| 1-Person Household | 289 | 33.0% |
| 2-Person Household | 294 | 33.6% |
| 3-Person Household | 112 | 12.8% |
| 4+ Person Household | 180 | 20.6% |
| Total Housing Units | 875 | 100.0% |
Occupancy by Ownership by Household Size in Cass City
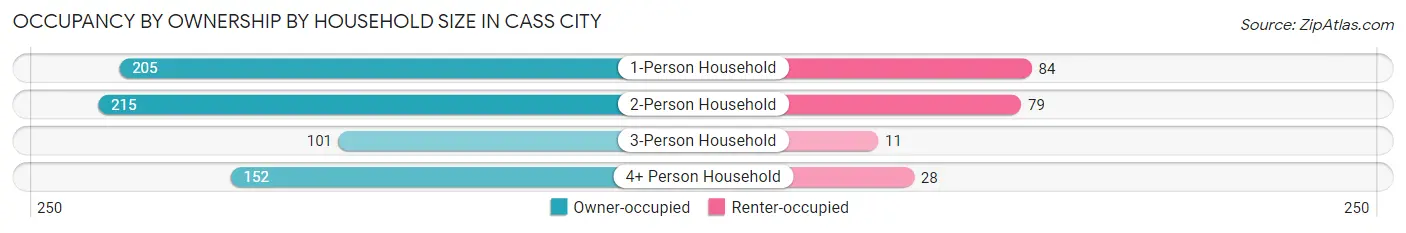
| Household Size | Owner-occupied | Renter-occupied |
| 1-Person Household | 205 (70.9%) | 84 (29.1%) |
| 2-Person Household | 215 (73.1%) | 79 (26.9%) |
| 3-Person Household | 101 (90.2%) | 11 (9.8%) |
| 4+ Person Household | 152 (84.4%) | 28 (15.6%) |
| Total Housing Units | 673 (76.9%) | 202 (23.1%) |
Occupancy by Educational Attainment in Cass City
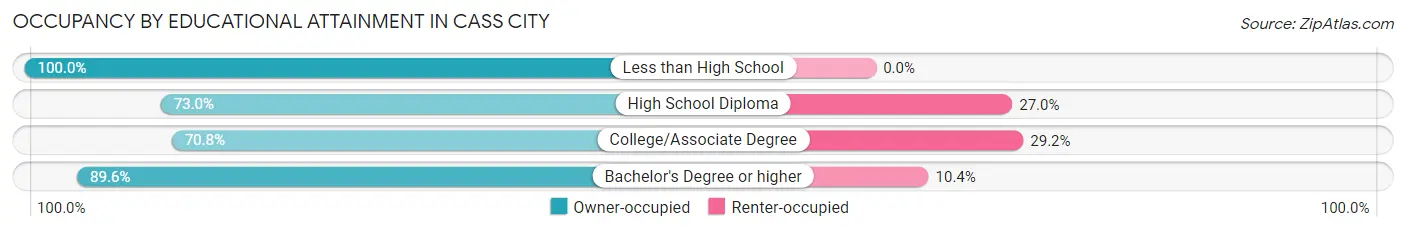
| Household Size | Owner-occupied | Renter-occupied |
| Less than High School | 47 (100.0%) | 0 (0.0%) |
| High School Diploma | 238 (73.0%) | 88 (27.0%) |
| College/Associate Degree | 233 (70.8%) | 96 (29.2%) |
| Bachelor's Degree or higher | 155 (89.6%) | 18 (10.4%) |
Occupancy by Age of Householder in Cass City
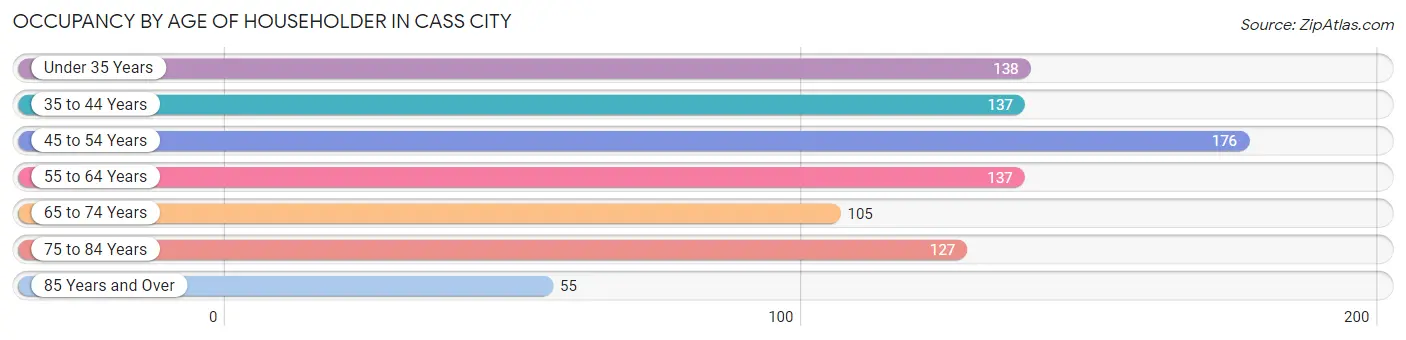
| Age Bracket | # Households | % Households |
| Under 35 Years | 138 | 15.8% |
| 35 to 44 Years | 137 | 15.7% |
| 45 to 54 Years | 176 | 20.1% |
| 55 to 64 Years | 137 | 15.7% |
| 65 to 74 Years | 105 | 12.0% |
| 75 to 84 Years | 127 | 14.5% |
| 85 Years and Over | 55 | 6.3% |
| Total | 875 | 100.0% |
Housing Finances in Cass City
Median Income by Occupancy in Cass City
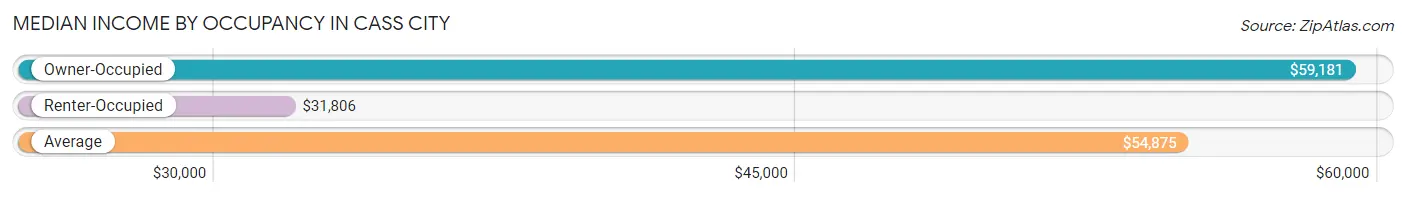
| Occupancy Type | # Households | Median Income |
| Owner-Occupied | 673 (76.9%) | $59,181 |
| Renter-Occupied | 202 (23.1%) | $31,806 |
| Average | 875 (100.0%) | $54,875 |
Occupancy by Householder Income Bracket in Cass City
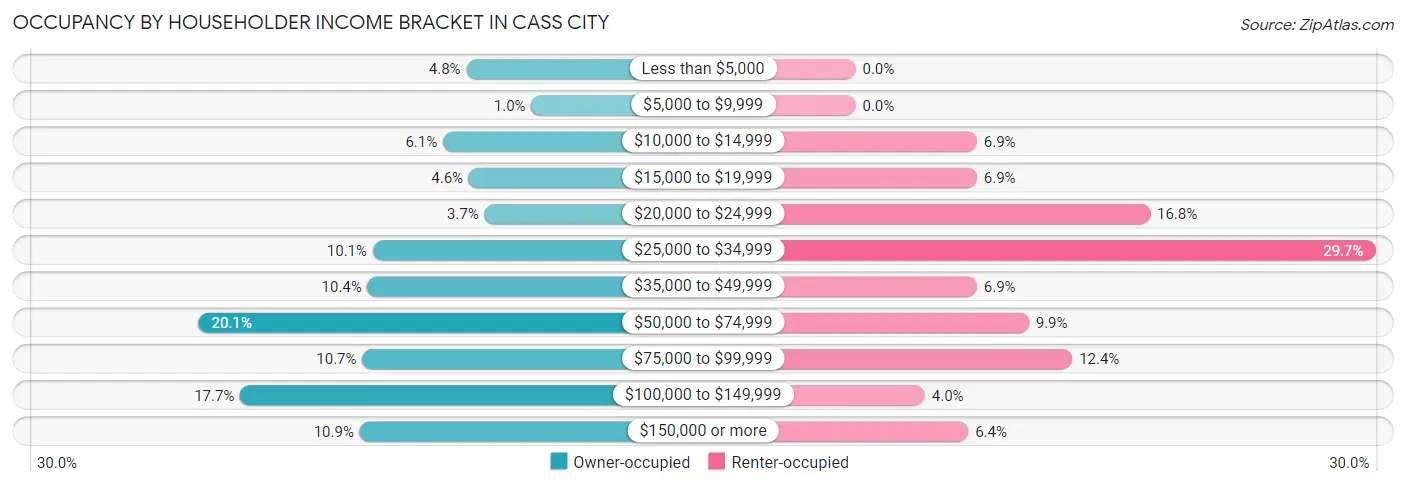
| Income Bracket | Owner-occupied | Renter-occupied |
| Less than $5,000 | 32 (4.8%) | 0 (0.0%) |
| $5,000 to $9,999 | 7 (1.0%) | 0 (0.0%) |
| $10,000 to $14,999 | 41 (6.1%) | 14 (6.9%) |
| $15,000 to $19,999 | 31 (4.6%) | 14 (6.9%) |
| $20,000 to $24,999 | 25 (3.7%) | 34 (16.8%) |
| $25,000 to $34,999 | 68 (10.1%) | 60 (29.7%) |
| $35,000 to $49,999 | 70 (10.4%) | 14 (6.9%) |
| $50,000 to $74,999 | 135 (20.1%) | 20 (9.9%) |
| $75,000 to $99,999 | 72 (10.7%) | 25 (12.4%) |
| $100,000 to $149,999 | 119 (17.7%) | 8 (4.0%) |
| $150,000 or more | 73 (10.8%) | 13 (6.4%) |
| Total | 673 (100.0%) | 202 (100.0%) |
Monthly Housing Cost Tiers in Cass City
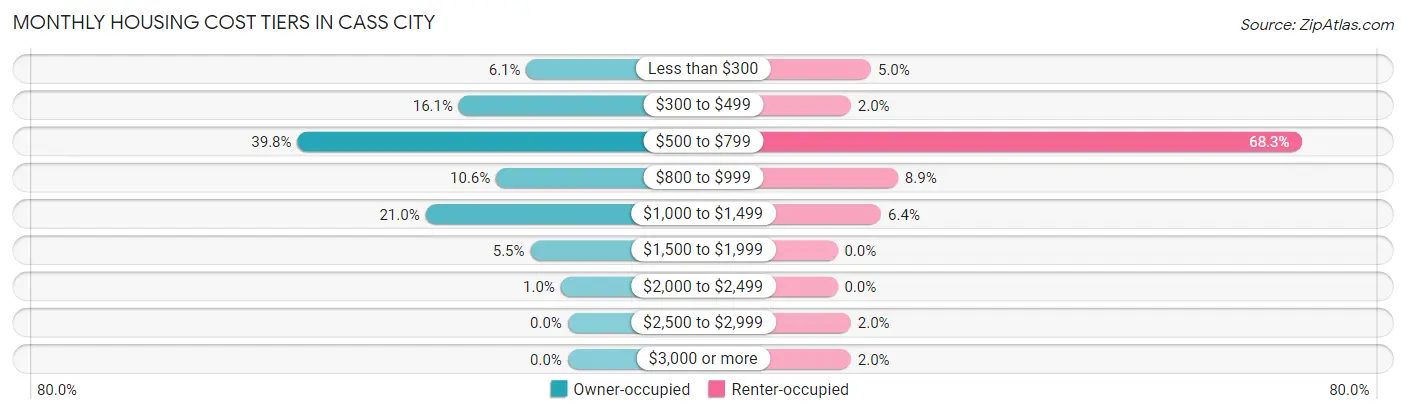
| Monthly Cost | Owner-occupied | Renter-occupied |
| Less than $300 | 41 (6.1%) | 10 (5.0%) |
| $300 to $499 | 108 (16.1%) | 4 (2.0%) |
| $500 to $799 | 268 (39.8%) | 138 (68.3%) |
| $800 to $999 | 71 (10.5%) | 18 (8.9%) |
| $1,000 to $1,499 | 141 (20.9%) | 13 (6.4%) |
| $1,500 to $1,999 | 37 (5.5%) | 0 (0.0%) |
| $2,000 to $2,499 | 7 (1.0%) | 0 (0.0%) |
| $2,500 to $2,999 | 0 (0.0%) | 4 (2.0%) |
| $3,000 or more | 0 (0.0%) | 4 (2.0%) |
| Total | 673 (100.0%) | 202 (100.0%) |
Physical Housing Characteristics in Cass City
Housing Structures in Cass City
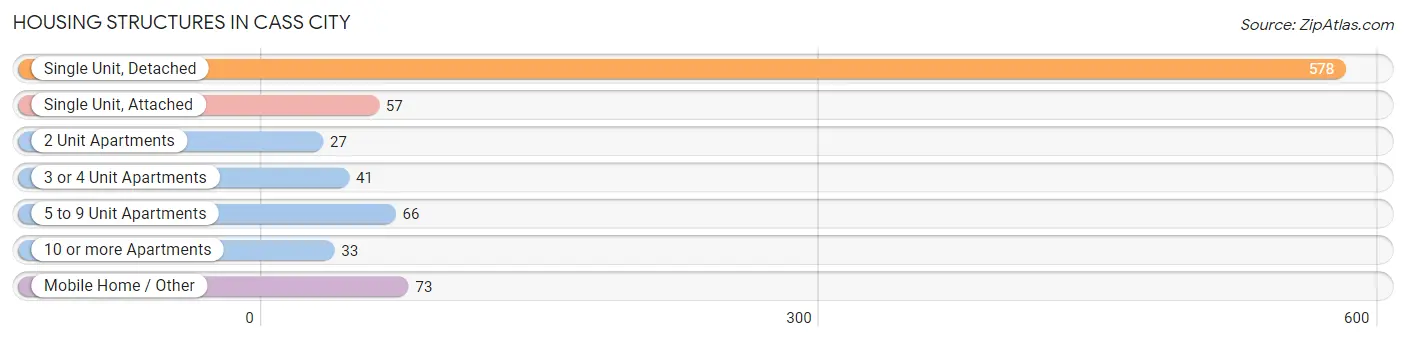
| Structure Type | # Housing Units | % Housing Units |
| Single Unit, Detached | 578 | 66.1% |
| Single Unit, Attached | 57 | 6.5% |
| 2 Unit Apartments | 27 | 3.1% |
| 3 or 4 Unit Apartments | 41 | 4.7% |
| 5 to 9 Unit Apartments | 66 | 7.5% |
| 10 or more Apartments | 33 | 3.8% |
| Mobile Home / Other | 73 | 8.3% |
| Total | 875 | 100.0% |
Housing Structures by Occupancy in Cass City
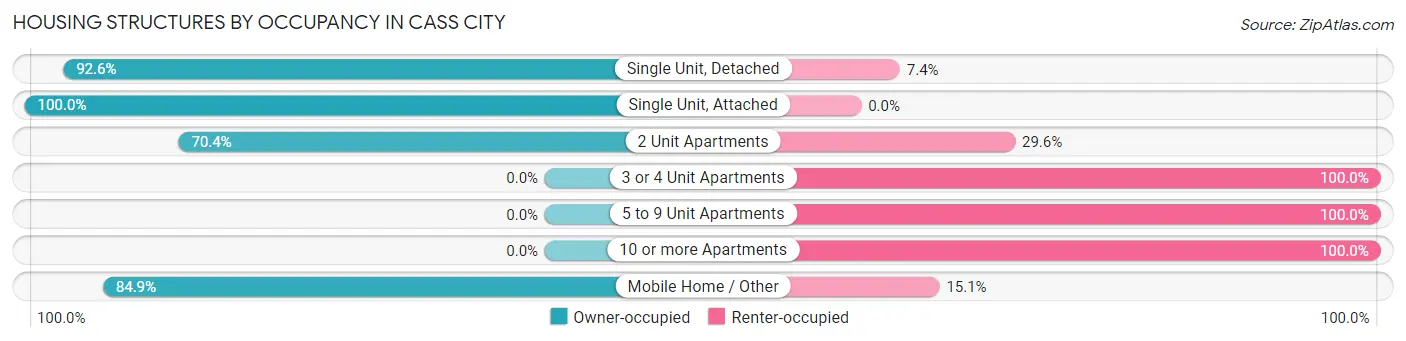
| Structure Type | Owner-occupied | Renter-occupied |
| Single Unit, Detached | 535 (92.6%) | 43 (7.4%) |
| Single Unit, Attached | 57 (100.0%) | 0 (0.0%) |
| 2 Unit Apartments | 19 (70.4%) | 8 (29.6%) |
| 3 or 4 Unit Apartments | 0 (0.0%) | 41 (100.0%) |
| 5 to 9 Unit Apartments | 0 (0.0%) | 66 (100.0%) |
| 10 or more Apartments | 0 (0.0%) | 33 (100.0%) |
| Mobile Home / Other | 62 (84.9%) | 11 (15.1%) |
| Total | 673 (76.9%) | 202 (23.1%) |
Housing Structures by Number of Rooms in Cass City
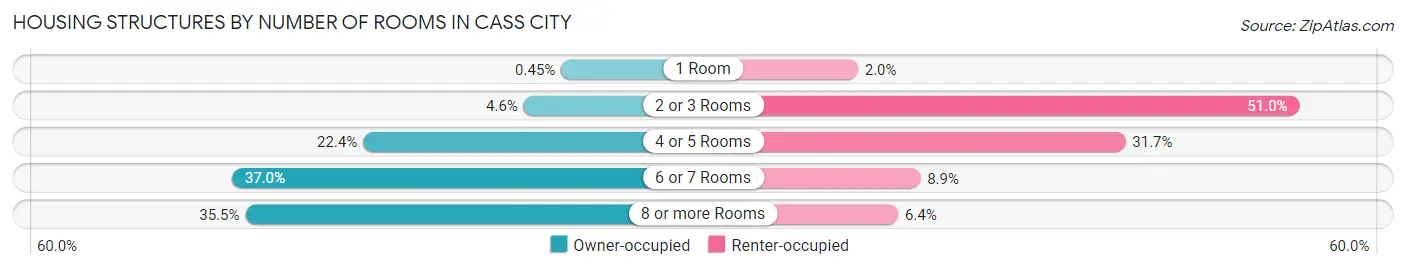
| Number of Rooms | Owner-occupied | Renter-occupied |
| 1 Room | 3 (0.4%) | 4 (2.0%) |
| 2 or 3 Rooms | 31 (4.6%) | 103 (51.0%) |
| 4 or 5 Rooms | 151 (22.4%) | 64 (31.7%) |
| 6 or 7 Rooms | 249 (37.0%) | 18 (8.9%) |
| 8 or more Rooms | 239 (35.5%) | 13 (6.4%) |
| Total | 673 (100.0%) | 202 (100.0%) |
Housing Structure by Heating Type in Cass City
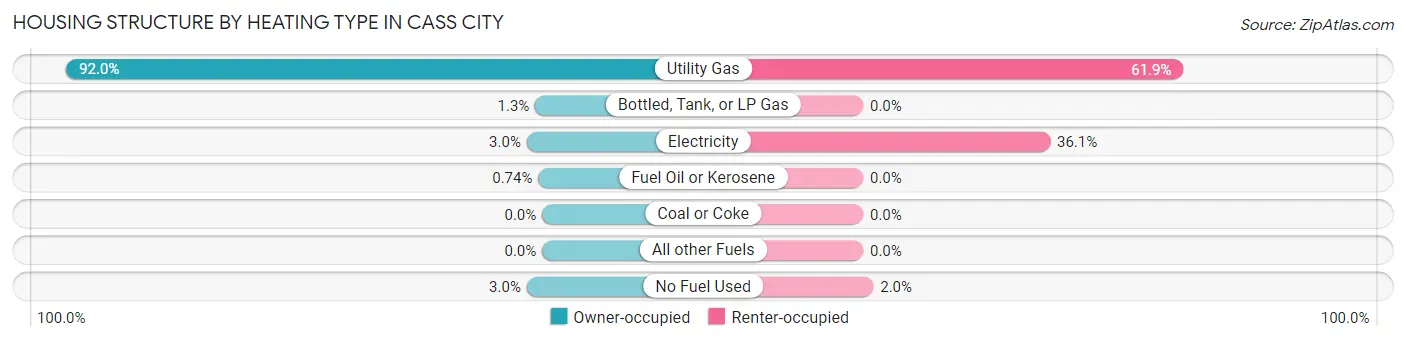
| Heating Type | Owner-occupied | Renter-occupied |
| Utility Gas | 619 (92.0%) | 125 (61.9%) |
| Bottled, Tank, or LP Gas | 9 (1.3%) | 0 (0.0%) |
| Electricity | 20 (3.0%) | 73 (36.1%) |
| Fuel Oil or Kerosene | 5 (0.7%) | 0 (0.0%) |
| Coal or Coke | 0 (0.0%) | 0 (0.0%) |
| All other Fuels | 0 (0.0%) | 0 (0.0%) |
| No Fuel Used | 20 (3.0%) | 4 (2.0%) |
| Total | 673 (100.0%) | 202 (100.0%) |
Household Vehicle Usage in Cass City
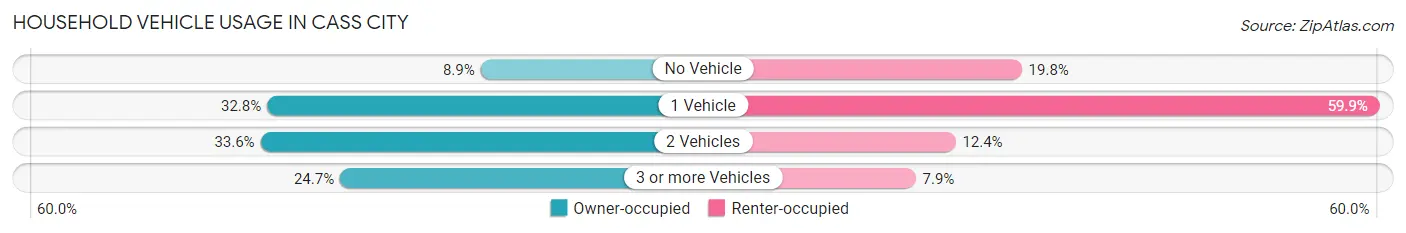
| Vehicles per Household | Owner-occupied | Renter-occupied |
| No Vehicle | 60 (8.9%) | 40 (19.8%) |
| 1 Vehicle | 221 (32.8%) | 121 (59.9%) |
| 2 Vehicles | 226 (33.6%) | 25 (12.4%) |
| 3 or more Vehicles | 166 (24.7%) | 16 (7.9%) |
| Total | 673 (100.0%) | 202 (100.0%) |
Real Estate & Mortgages in Cass City
Real Estate and Mortgage Overview in Cass City
| Characteristic | Without Mortgage | With Mortgage |
| Housing Units | 361 | 312 |
| Median Property Value | $98,500 | $104,400 |
| Median Household Income | $44,844 | $50 |
| Monthly Housing Costs | $541 | $0 |
| Real Estate Taxes | $1,629 | $19 |
Property Value by Mortgage Status in Cass City
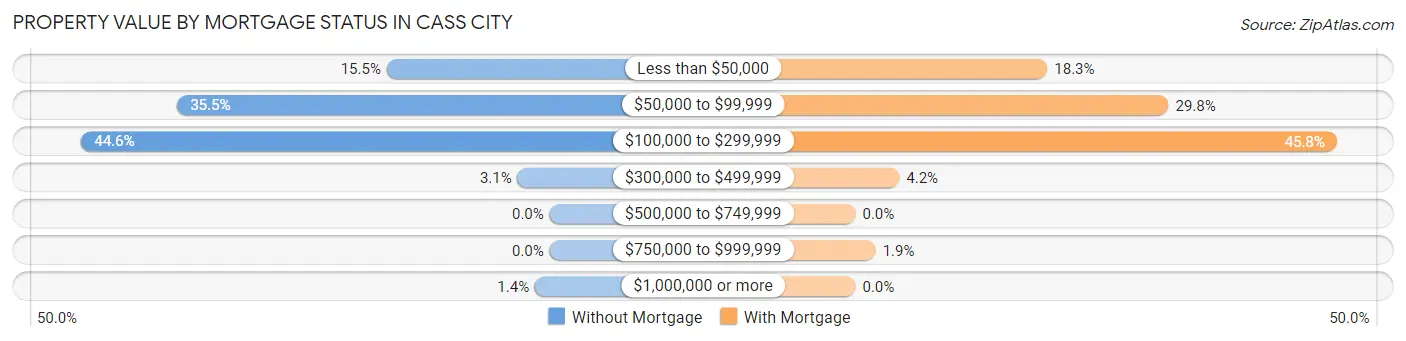
| Property Value | Without Mortgage | With Mortgage |
| Less than $50,000 | 56 (15.5%) | 57 (18.3%) |
| $50,000 to $99,999 | 128 (35.5%) | 93 (29.8%) |
| $100,000 to $299,999 | 161 (44.6%) | 143 (45.8%) |
| $300,000 to $499,999 | 11 (3.0%) | 13 (4.2%) |
| $500,000 to $749,999 | 0 (0.0%) | 0 (0.0%) |
| $750,000 to $999,999 | 0 (0.0%) | 6 (1.9%) |
| $1,000,000 or more | 5 (1.4%) | 0 (0.0%) |
| Total | 361 (100.0%) | 312 (100.0%) |
Household Income by Mortgage Status in Cass City
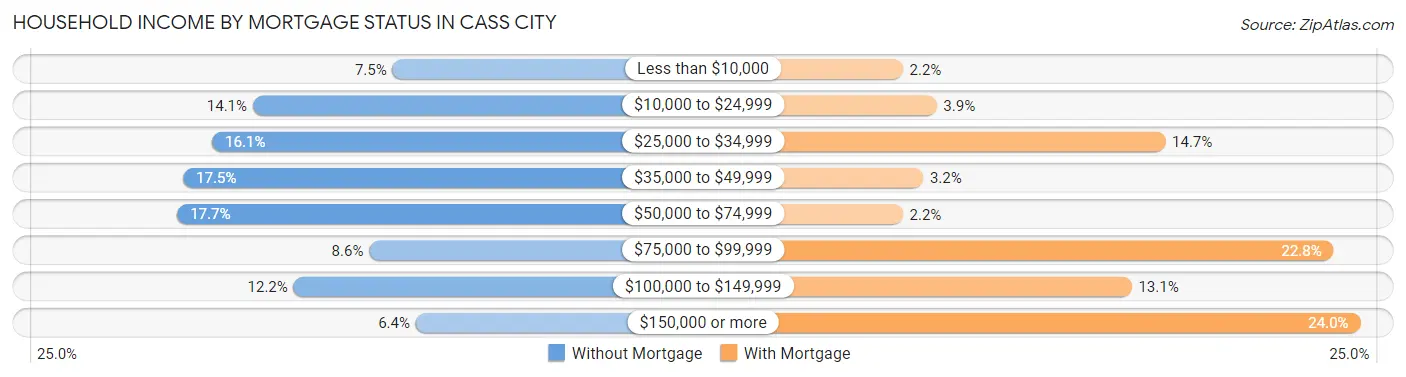
| Household Income | Without Mortgage | With Mortgage |
| Less than $10,000 | 27 (7.5%) | 7 (2.2%) |
| $10,000 to $24,999 | 51 (14.1%) | 12 (3.8%) |
| $25,000 to $34,999 | 58 (16.1%) | 46 (14.7%) |
| $35,000 to $49,999 | 63 (17.4%) | 10 (3.2%) |
| $50,000 to $74,999 | 64 (17.7%) | 7 (2.2%) |
| $75,000 to $99,999 | 31 (8.6%) | 71 (22.8%) |
| $100,000 to $149,999 | 44 (12.2%) | 41 (13.1%) |
| $150,000 or more | 23 (6.4%) | 75 (24.0%) |
| Total | 361 (100.0%) | 312 (100.0%) |
Property Value to Household Income Ratio in Cass City
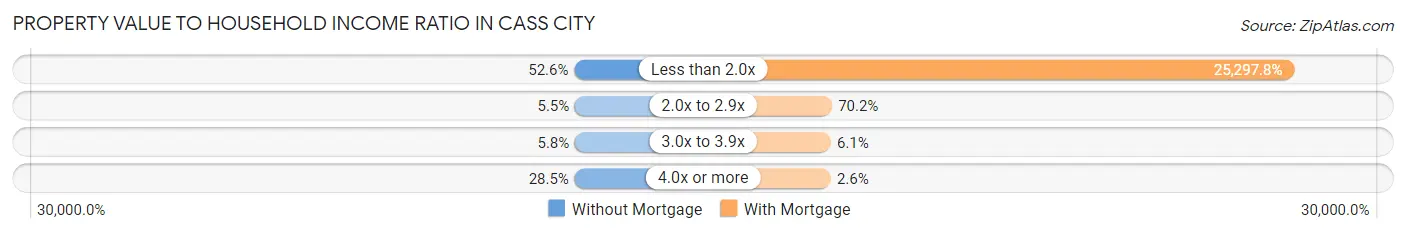
| Value-to-Income Ratio | Without Mortgage | With Mortgage |
| Less than 2.0x | 190 (52.6%) | 78,929 (25,297.8%) |
| 2.0x to 2.9x | 20 (5.5%) | 219 (70.2%) |
| 3.0x to 3.9x | 21 (5.8%) | 19 (6.1%) |
| 4.0x or more | 103 (28.5%) | 8 (2.6%) |
| Total | 361 (100.0%) | 312 (100.0%) |
Real Estate Taxes by Mortgage Status in Cass City
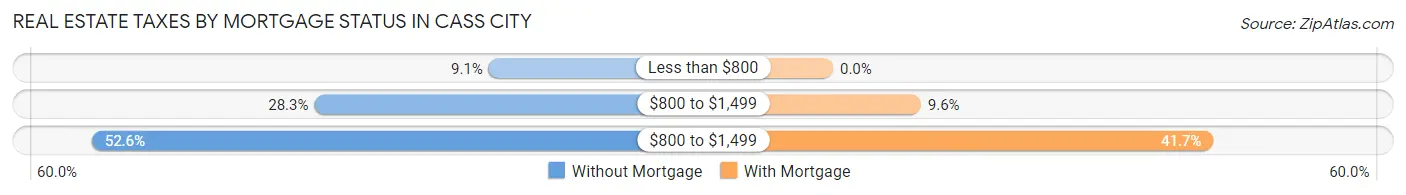
| Property Taxes | Without Mortgage | With Mortgage |
| Less than $800 | 33 (9.1%) | 0 (0.0%) |
| $800 to $1,499 | 102 (28.2%) | 30 (9.6%) |
| $800 to $1,499 | 190 (52.6%) | 130 (41.7%) |
| Total | 361 (100.0%) | 312 (100.0%) |
Health & Disability in Cass City
Health Insurance Coverage by Age in Cass City
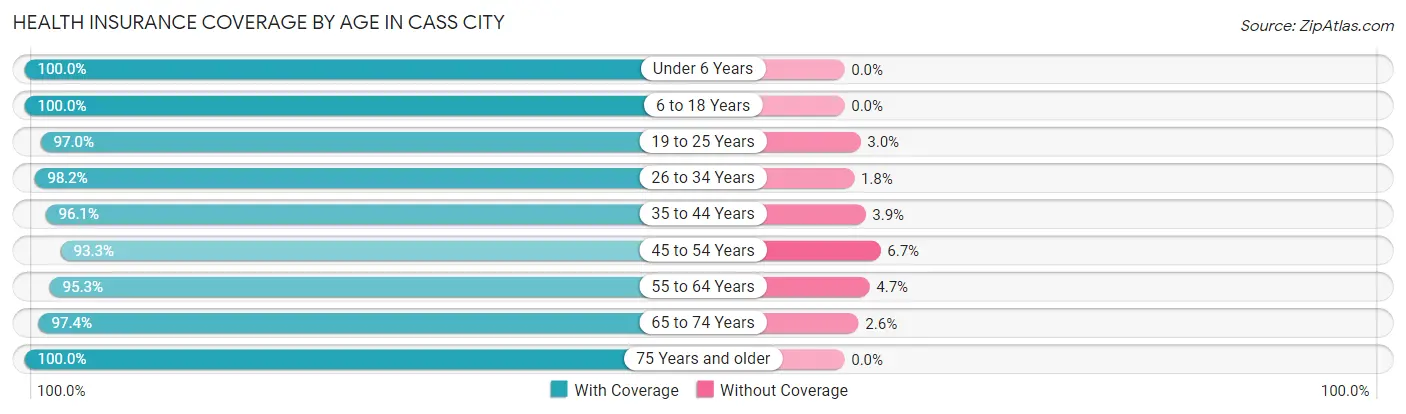
| Age Bracket | With Coverage | Without Coverage |
| Under 6 Years | 193 (100.0%) | 0 (0.0%) |
| 6 to 18 Years | 320 (100.0%) | 0 (0.0%) |
| 19 to 25 Years | 162 (97.0%) | 5 (3.0%) |
| 26 to 34 Years | 217 (98.2%) | 4 (1.8%) |
| 35 to 44 Years | 245 (96.1%) | 10 (3.9%) |
| 45 to 54 Years | 291 (93.3%) | 21 (6.7%) |
| 55 to 64 Years | 265 (95.3%) | 13 (4.7%) |
| 65 to 74 Years | 185 (97.4%) | 5 (2.6%) |
| 75 Years and older | 241 (100.0%) | 0 (0.0%) |
| Total | 2,119 (97.3%) | 58 (2.7%) |
Health Insurance Coverage by Citizenship Status in Cass City
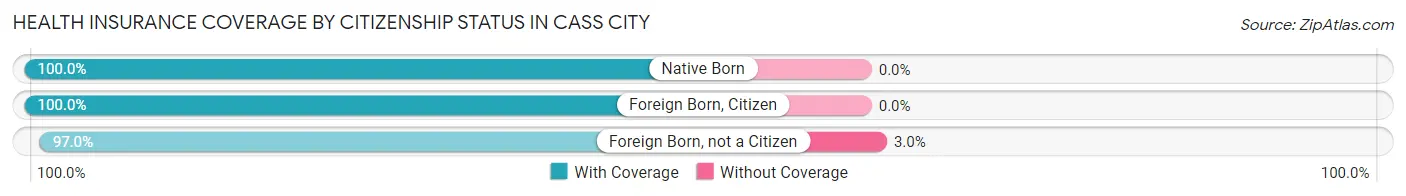
| Citizenship Status | With Coverage | Without Coverage |
| Native Born | 193 (100.0%) | 0 (0.0%) |
| Foreign Born, Citizen | 320 (100.0%) | 0 (0.0%) |
| Foreign Born, not a Citizen | 162 (97.0%) | 5 (3.0%) |
Health Insurance Coverage by Household Income in Cass City
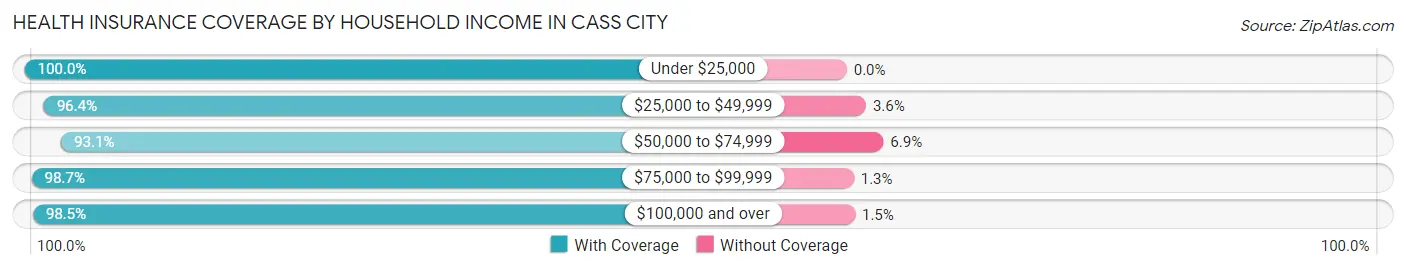
| Household Income | With Coverage | Without Coverage |
| Under $25,000 | 336 (100.0%) | 0 (0.0%) |
| $25,000 to $49,999 | 376 (96.4%) | 14 (3.6%) |
| $50,000 to $74,999 | 394 (93.1%) | 29 (6.9%) |
| $75,000 to $99,999 | 302 (98.7%) | 4 (1.3%) |
| $100,000 and over | 702 (98.5%) | 11 (1.5%) |
Public vs Private Health Insurance Coverage by Age in Cass City
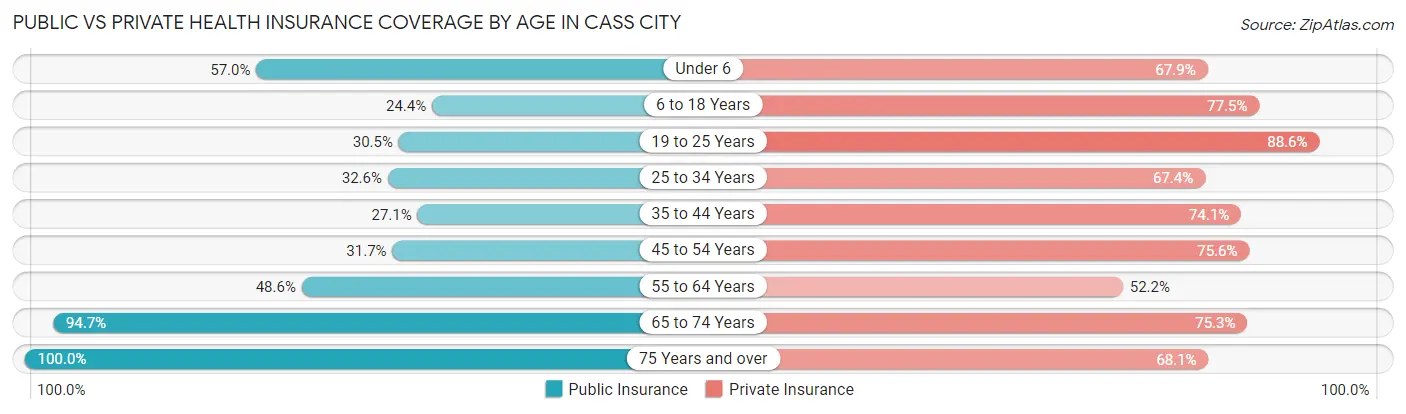
| Age Bracket | Public Insurance | Private Insurance |
| Under 6 | 110 (57.0%) | 131 (67.9%) |
| 6 to 18 Years | 78 (24.4%) | 248 (77.5%) |
| 19 to 25 Years | 51 (30.5%) | 148 (88.6%) |
| 25 to 34 Years | 72 (32.6%) | 149 (67.4%) |
| 35 to 44 Years | 69 (27.1%) | 189 (74.1%) |
| 45 to 54 Years | 99 (31.7%) | 236 (75.6%) |
| 55 to 64 Years | 135 (48.6%) | 145 (52.2%) |
| 65 to 74 Years | 180 (94.7%) | 143 (75.3%) |
| 75 Years and over | 241 (100.0%) | 164 (68.0%) |
| Total | 1,035 (47.5%) | 1,553 (71.3%) |
Disability Status by Sex by Age in Cass City
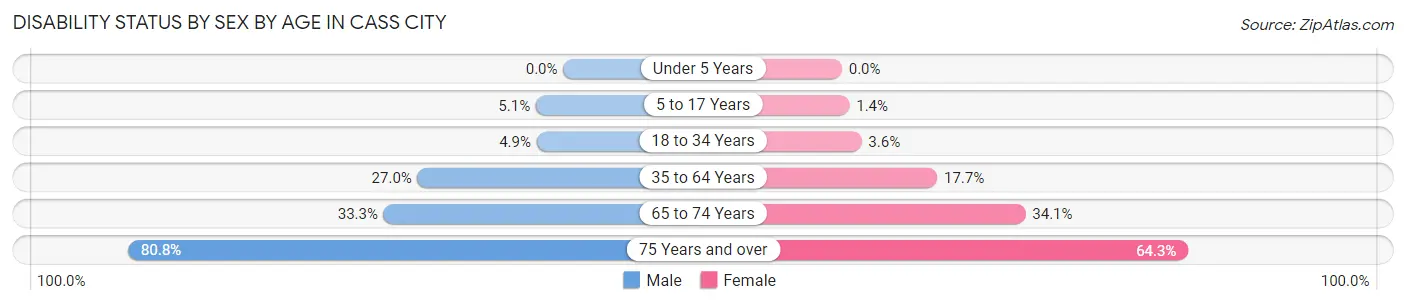
| Age Bracket | Male | Female |
| Under 5 Years | 0 (0.0%) | 0 (0.0%) |
| 5 to 17 Years | 9 (5.1%) | 2 (1.4%) |
| 18 to 34 Years | 12 (4.9%) | 6 (3.6%) |
| 35 to 64 Years | 126 (27.0%) | 67 (17.7%) |
| 65 to 74 Years | 33 (33.3%) | 31 (34.1%) |
| 75 Years and over | 59 (80.8%) | 108 (64.3%) |
Disability Class by Sex by Age in Cass City
Disability Class: Hearing Difficulty
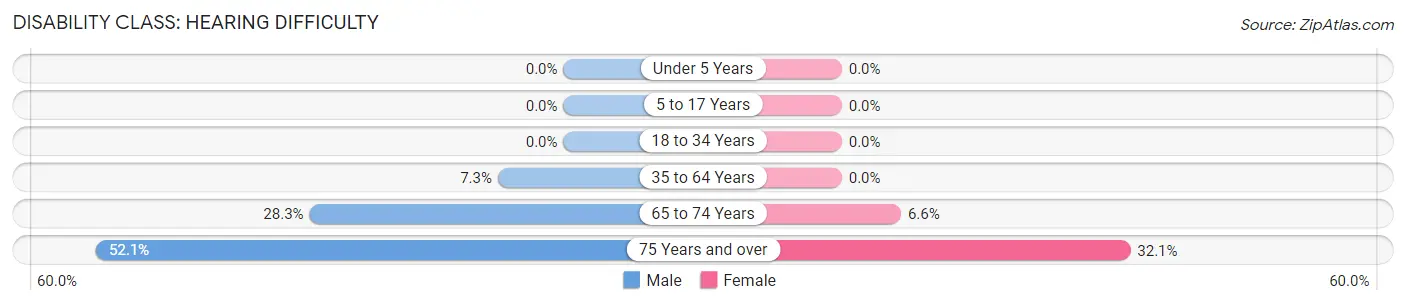
| Age Bracket | Male | Female |
| Under 5 Years | 0 (0.0%) | 0 (0.0%) |
| 5 to 17 Years | 0 (0.0%) | 0 (0.0%) |
| 18 to 34 Years | 0 (0.0%) | 0 (0.0%) |
| 35 to 64 Years | 34 (7.3%) | 0 (0.0%) |
| 65 to 74 Years | 28 (28.3%) | 6 (6.6%) |
| 75 Years and over | 38 (52.0%) | 54 (32.1%) |
Disability Class: Vision Difficulty
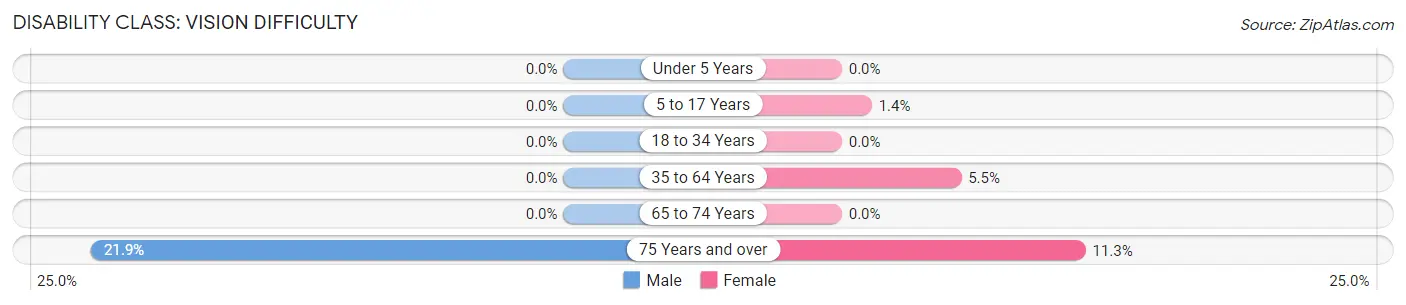
| Age Bracket | Male | Female |
| Under 5 Years | 0 (0.0%) | 0 (0.0%) |
| 5 to 17 Years | 0 (0.0%) | 2 (1.4%) |
| 18 to 34 Years | 0 (0.0%) | 0 (0.0%) |
| 35 to 64 Years | 0 (0.0%) | 21 (5.5%) |
| 65 to 74 Years | 0 (0.0%) | 0 (0.0%) |
| 75 Years and over | 16 (21.9%) | 19 (11.3%) |
Disability Class: Cognitive Difficulty
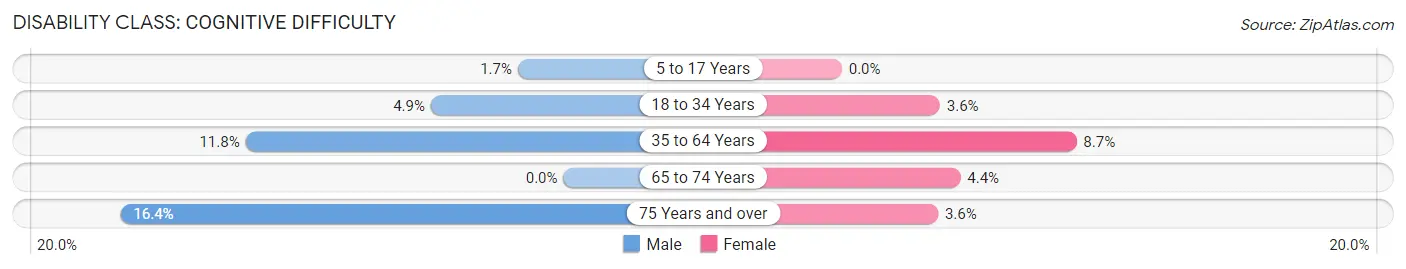
| Age Bracket | Male | Female |
| 5 to 17 Years | 3 (1.7%) | 0 (0.0%) |
| 18 to 34 Years | 12 (4.9%) | 6 (3.6%) |
| 35 to 64 Years | 55 (11.8%) | 33 (8.7%) |
| 65 to 74 Years | 0 (0.0%) | 4 (4.4%) |
| 75 Years and over | 12 (16.4%) | 6 (3.6%) |
Disability Class: Ambulatory Difficulty
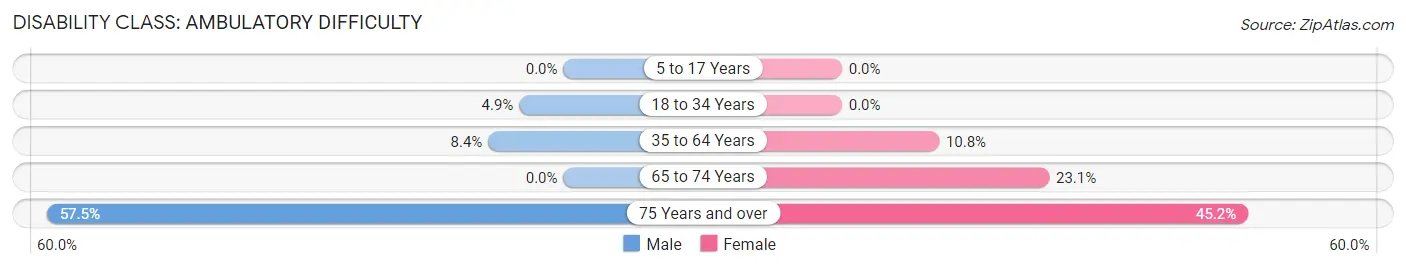
| Age Bracket | Male | Female |
| 5 to 17 Years | 0 (0.0%) | 0 (0.0%) |
| 18 to 34 Years | 12 (4.9%) | 0 (0.0%) |
| 35 to 64 Years | 39 (8.4%) | 41 (10.8%) |
| 65 to 74 Years | 0 (0.0%) | 21 (23.1%) |
| 75 Years and over | 42 (57.5%) | 76 (45.2%) |
Disability Class: Self-Care Difficulty
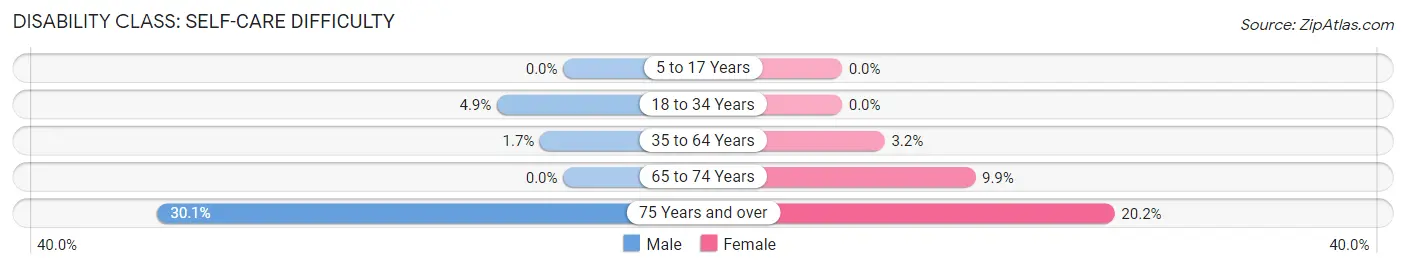
| Age Bracket | Male | Female |
| 5 to 17 Years | 0 (0.0%) | 0 (0.0%) |
| 18 to 34 Years | 12 (4.9%) | 0 (0.0%) |
| 35 to 64 Years | 8 (1.7%) | 12 (3.2%) |
| 65 to 74 Years | 0 (0.0%) | 9 (9.9%) |
| 75 Years and over | 22 (30.1%) | 34 (20.2%) |
Technology Access in Cass City
Computing Device Access in Cass City
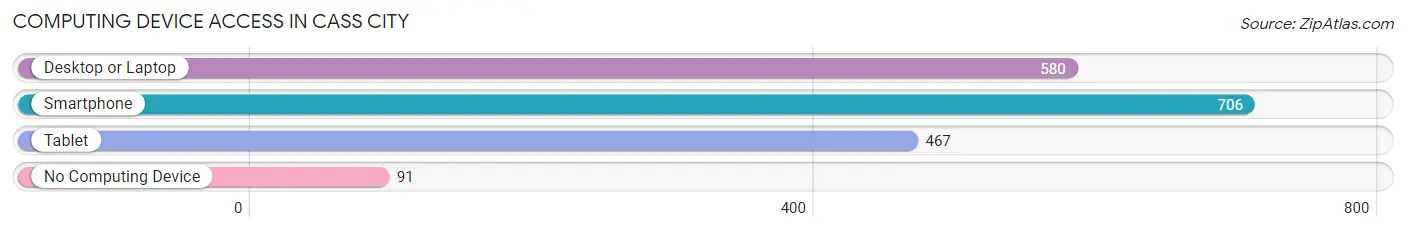
| Device Type | # Households | % Households |
| Desktop or Laptop | 580 | 66.3% |
| Smartphone | 706 | 80.7% |
| Tablet | 467 | 53.4% |
| No Computing Device | 91 | 10.4% |
| Total | 875 | 100.0% |
Internet Access in Cass City
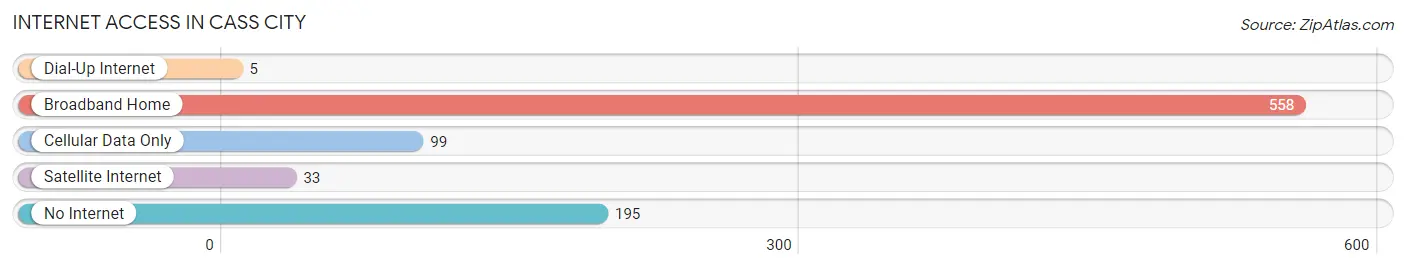
| Internet Type | # Households | % Households |
| Dial-Up Internet | 5 | 0.6% |
| Broadband Home | 558 | 63.8% |
| Cellular Data Only | 99 | 11.3% |
| Satellite Internet | 33 | 3.8% |
| No Internet | 195 | 22.3% |
| Total | 875 | 100.0% |
Cass City Summary
Cass City is a small village located in the Thumb region of Michigan, in the United States. It is the county seat of Tuscola County and is situated on the Cass River. The village has a population of 1,717 people, according to the 2010 census.
History
The area that is now Cass City was first settled in 1854 by a group of German immigrants. The village was originally known as Cassopolis, after the Cass River, which runs through the area. The village was incorporated in 1871 and the name was changed to Cass City in 1873.
The village was an important center of commerce in the late 19th and early 20th centuries. It was home to several factories, including a flour mill, a sawmill, a furniture factory, and a brickyard. The village also had a railroad station, which connected it to other towns in the region.
In the late 19th century, Cass City was a popular destination for tourists. It was known for its beautiful scenery and its many outdoor activities, such as fishing, hunting, and boating.
Geography
Cass City is located in the Thumb region of Michigan, in the United States. It is situated on the Cass River, which runs through the village. The village is located about 25 miles (40 km) north of Saginaw and about 50 miles (80 km) south of Bay City.
The village is surrounded by farmland and is located in a rural area. The nearest major city is Flint, which is about 40 miles (64 km) away.
Economy
The economy of Cass City is largely based on agriculture. The village is home to several farms, which produce a variety of crops, including corn, soybeans, wheat, and hay. The village also has several businesses, including a grocery store, a hardware store, and a restaurant.
The village is also home to several manufacturing companies, including a furniture factory, a sawmill, and a brickyard.
Demographics
According to the 2010 census, the population of Cass City is 1,717 people. The village has a median household income of $37,917 and a median home value of $90,000. The village is predominantly white, with 91.3% of the population identifying as such. The remaining 8.7% of the population is made up of African Americans, Native Americans, Asians, and other races.
The village has a high rate of poverty, with 24.3% of the population living below the poverty line. The village also has a high rate of unemployment, with 8.3% of the population unemployed.
Conclusion
Cass City is a small village located in the Thumb region of Michigan, in the United States. It is the county seat of Tuscola County and is situated on the Cass River. The village has a population of 1,717 people, according to the 2010 census. The economy of Cass City is largely based on agriculture, with several farms producing a variety of crops. The village also has several businesses and manufacturing companies. The village is predominantly white, with 91.3% of the population identifying as such. The village has a high rate of poverty and unemployment.
Common Questions
What is the Total Population of Cass City?
Total Population of Cass City is 2,274.
What is the Total Male Population of Cass City?
Total Male Population of Cass City is 1,198.
What is the Total Female Population of Cass City?
Total Female Population of Cass City is 1,076.
What is the Ratio of Males per 100 Females in Cass City?
There are 111.34 Males per 100 Females in Cass City.
What is the Ratio of Females per 100 Males in Cass City?
There are 89.82 Females per 100 Males in Cass City.
What is the Median Population Age in Cass City?
Median Population Age in Cass City is 43.8 Years.
What is the Average Family Size in Cass City
Average Family Size in Cass City is 3.2 People.
What is the Average Household Size in Cass City
Average Household Size in Cass City is 2.5 People.
What is Per Capita Income in Cass City?
Per Capita income in Cass City is $29,123.
What is the Median Family Income in Cass City?
Median Family Income in Cass City is $73,750.
What is the Median Household income in Cass City?
Median Household Income in Cass City is $54,875.
What is Income or Wage Gap in Cass City?
Income or Wage Gap in Cass City is 9.8%.
Women in Cass City earn 90.2 cents for every dollar earned by a man.
What is Inequality or Gini Index in Cass City?
Inequality or Gini Index in Cass City is 0.45.
How Large is the Labor Force in Cass City?
There are 959 People in the Labor Forcein in Cass City.
What is the Percentage of People in the Labor Force in Cass City?
52.4% of People are in the Labor Force in Cass City.
What is the Unemployment Rate in Cass City?
Unemployment Rate in Cass City is 8.7%.