Harvey, MI
Harvey Map
Harvey Overview
3,335
TOTAL POPULATION
1,715
MALE POPULATION
1,620
FEMALE POPULATION
105.86
MALES / 100 FEMALES
94.46
FEMALES / 100 MALES
39.8
MEDIAN AGE
3.0
AVG FAMILY SIZE
2.5
AVG HOUSEHOLD SIZE
$36,221
PER CAPITA INCOME
$90,242
AVG FAMILY INCOME
$74,093
AVG HOUSEHOLD INCOME
8.4%
WAGE / INCOME GAP [ % ]
91.6¢/ $1
WAGE / INCOME GAP [ $ ]
0.42
INEQUALITY / GINI INDEX
1,753
LABOR FORCE [ PEOPLE ]
66.1%
PERCENT IN LABOR FORCE
3.8%
UNEMPLOYMENT RATE
Harvey Area Codes
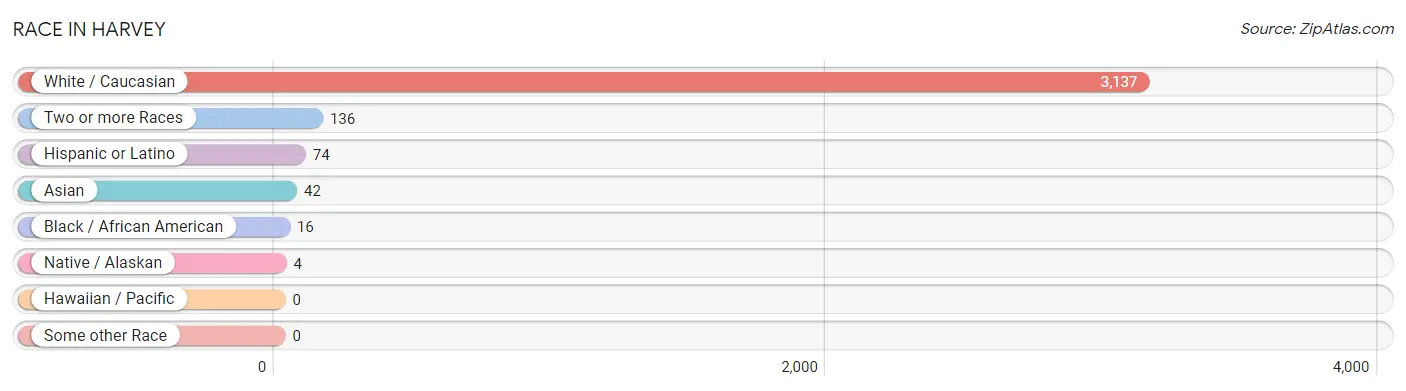
Race in Harvey
The most populous races in Harvey are White / Caucasian (3,137 | 94.1%), Two or more Races (136 | 4.1%), and Hispanic or Latino (74 | 2.2%).
| Race | # Population | % Population |
| Asian | 42 | 1.3% |
| Black / African American | 16 | 0.5% |
| Hawaiian / Pacific | 0 | 0.0% |
| Hispanic or Latino | 74 | 2.2% |
| Native / Alaskan | 4 | 0.1% |
| White / Caucasian | 3,137 | 94.1% |
| Two or more Races | 136 | 4.1% |
| Some other Race | 0 | 0.0% |
| Total | 3,335 | 100.0% |
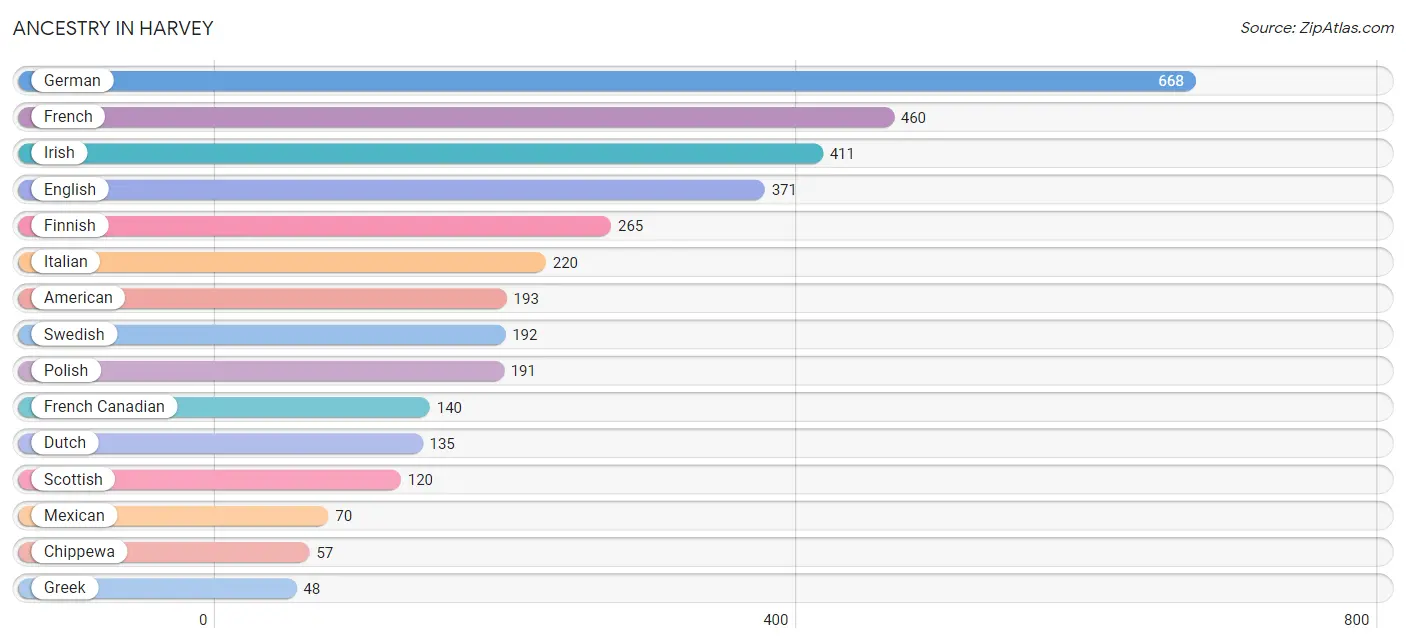
Ancestry in Harvey
The most populous ancestries reported in Harvey are German (668 | 20.0%), French (460 | 13.8%), Irish (411 | 12.3%), English (371 | 11.1%), and Finnish (265 | 8.0%), together accounting for 65.2% of all Harvey residents.
| Ancestry | # Population | % Population |
| American | 193 | 5.8% |
| Arab | 23 | 0.7% |
| Austrian | 21 | 0.6% |
| British | 4 | 0.1% |
| Burmese | 27 | 0.8% |
| Canadian | 5 | 0.2% |
| Chickasaw | 13 | 0.4% |
| Chippewa | 57 | 1.7% |
| Croatian | 11 | 0.3% |
| Cuban | 4 | 0.1% |
| Danish | 10 | 0.3% |
| Dutch | 135 | 4.1% |
| English | 371 | 11.1% |
| European | 43 | 1.3% |
| Finnish | 265 | 8.0% |
| French | 460 | 13.8% |
| French Canadian | 140 | 4.2% |
| German | 668 | 20.0% |
| Greek | 48 | 1.4% |
| Hungarian | 41 | 1.2% |
| Irish | 411 | 12.3% |
| Italian | 220 | 6.6% |
| Korean | 30 | 0.9% |
| Lebanese | 18 | 0.5% |
| Lithuanian | 20 | 0.6% |
| Mexican | 70 | 2.1% |
| Moroccan | 5 | 0.2% |
| Northern European | 15 | 0.4% |
| Norwegian | 38 | 1.1% |
| Pennsylvania German | 4 | 0.1% |
| Polish | 191 | 5.7% |
| Portuguese | 5 | 0.2% |
| Russian | 12 | 0.4% |
| Scotch-Irish | 18 | 0.5% |
| Scottish | 120 | 3.6% |
| Slavic | 4 | 0.1% |
| Slovak | 6 | 0.2% |
| Sri Lankan | 12 | 0.4% |
| Swedish | 192 | 5.8% |
| Ukrainian | 11 | 0.3% | View All 40 Rows |
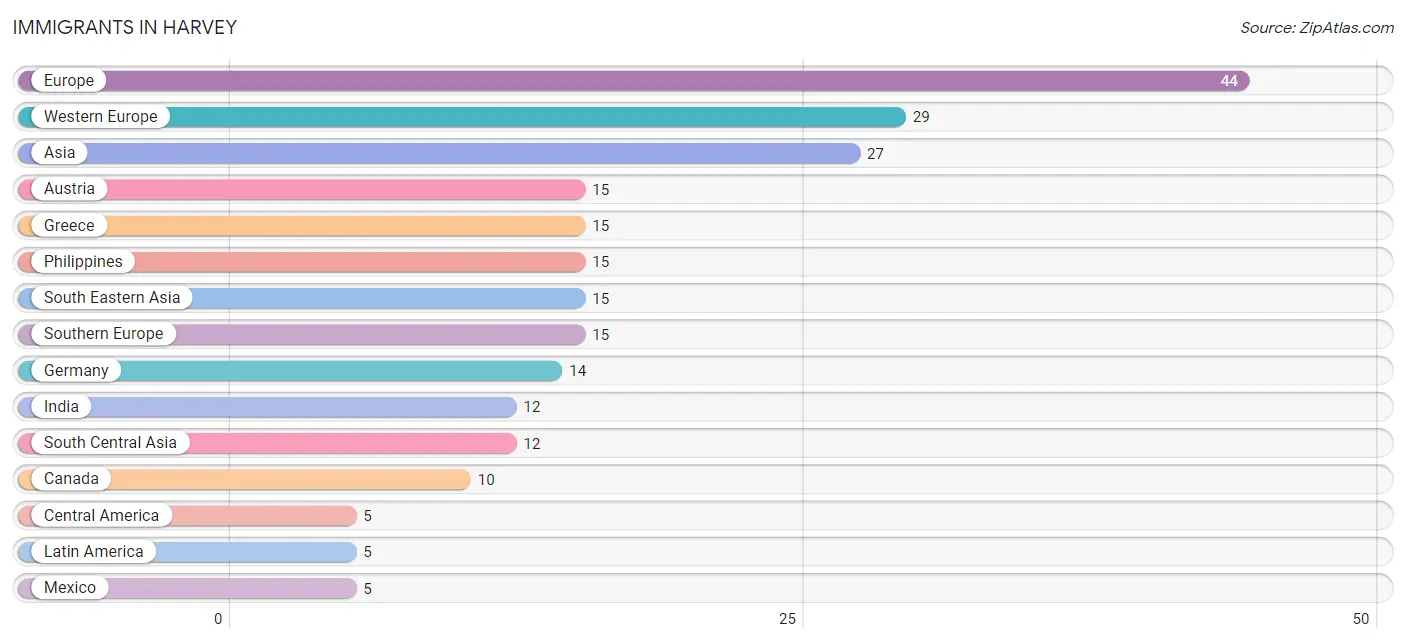
Immigrants in Harvey
The most numerous immigrant groups reported in Harvey came from Europe (44 | 1.3%), Western Europe (29 | 0.9%), Asia (27 | 0.8%), Austria (15 | 0.4%), and Greece (15 | 0.4%), together accounting for 3.9% of all Harvey residents.
| Immigration Origin | # Population | % Population |
| Asia | 27 | 0.8% |
| Austria | 15 | 0.4% |
| Canada | 10 | 0.3% |
| Central America | 5 | 0.2% |
| Europe | 44 | 1.3% |
| Germany | 14 | 0.4% |
| Greece | 15 | 0.4% |
| India | 12 | 0.4% |
| Latin America | 5 | 0.2% |
| Mexico | 5 | 0.2% |
| Philippines | 15 | 0.4% |
| South Central Asia | 12 | 0.4% |
| South Eastern Asia | 15 | 0.4% |
| Southern Europe | 15 | 0.4% |
| Western Europe | 29 | 0.9% | View All 15 Rows |
Sex and Age in Harvey
Sex and Age in Harvey
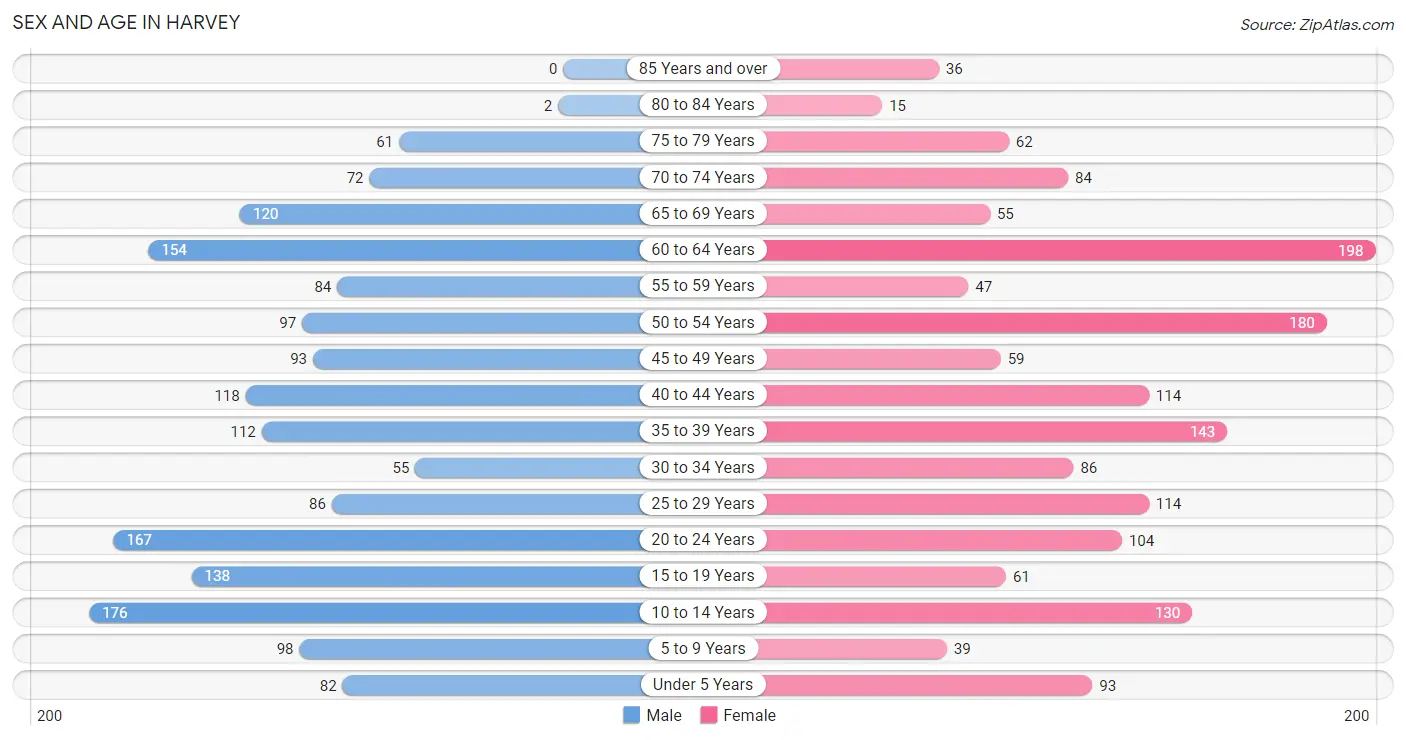
The most populous age groups in Harvey are 10 to 14 Years (176 | 10.3%) for men and 60 to 64 Years (198 | 12.2%) for women.
| Age Bracket | Male | Female |
| Under 5 Years | 82 (4.8%) | 93 (5.7%) |
| 5 to 9 Years | 98 (5.7%) | 39 (2.4%) |
| 10 to 14 Years | 176 (10.3%) | 130 (8.0%) |
| 15 to 19 Years | 138 (8.1%) | 61 (3.8%) |
| 20 to 24 Years | 167 (9.7%) | 104 (6.4%) |
| 25 to 29 Years | 86 (5.0%) | 114 (7.0%) |
| 30 to 34 Years | 55 (3.2%) | 86 (5.3%) |
| 35 to 39 Years | 112 (6.5%) | 143 (8.8%) |
| 40 to 44 Years | 118 (6.9%) | 114 (7.0%) |
| 45 to 49 Years | 93 (5.4%) | 59 (3.6%) |
| 50 to 54 Years | 97 (5.7%) | 180 (11.1%) |
| 55 to 59 Years | 84 (4.9%) | 47 (2.9%) |
| 60 to 64 Years | 154 (9.0%) | 198 (12.2%) |
| 65 to 69 Years | 120 (7.0%) | 55 (3.4%) |
| 70 to 74 Years | 72 (4.2%) | 84 (5.2%) |
| 75 to 79 Years | 61 (3.6%) | 62 (3.8%) |
| 80 to 84 Years | 2 (0.1%) | 15 (0.9%) |
| 85 Years and over | 0 (0.0%) | 36 (2.2%) |
| Total | 1,715 (100.0%) | 1,620 (100.0%) |
Families and Households in Harvey
Median Family Size in Harvey
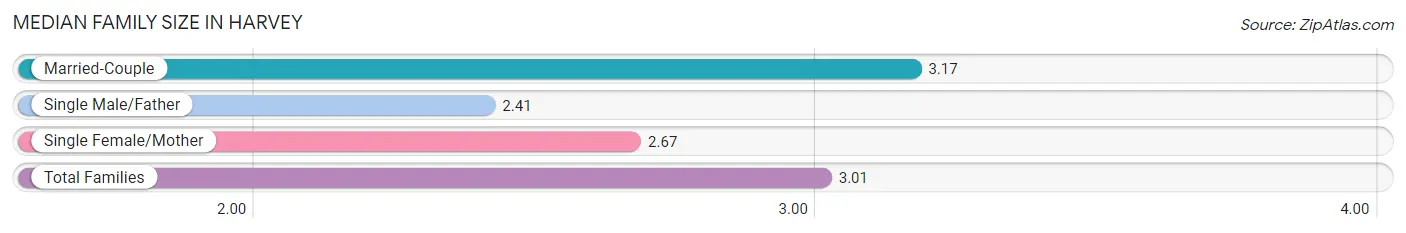
The median family size in Harvey is 3.01 persons per family, with married-couple families (615 | 72.4%) accounting for the largest median family size of 3.17 persons per family. On the other hand, single male/father families (85 | 10.0%) represent the smallest median family size with 2.41 persons per family.
| Family Type | # Families | Family Size |
| Married-Couple | 615 (72.4%) | 3.17 |
| Single Male/Father | 85 (10.0%) | 2.41 |
| Single Female/Mother | 150 (17.6%) | 2.67 |
| Total Families | 850 (100.0%) | 3.01 |
Median Household Size in Harvey
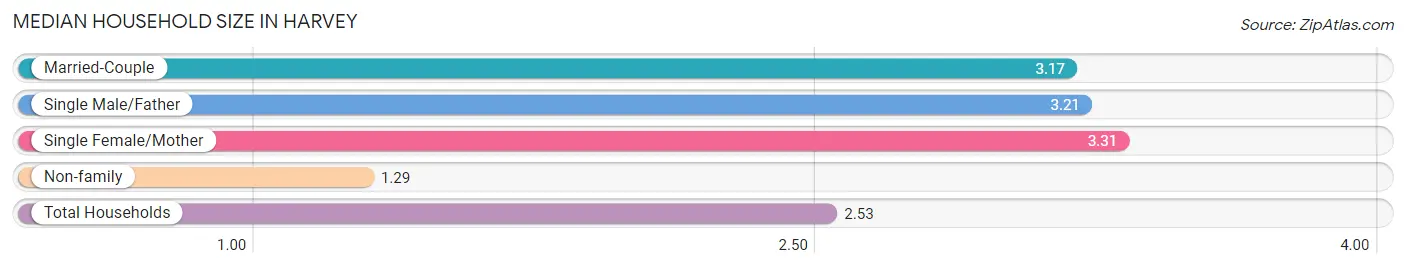
The median household size in Harvey is 2.53 persons per household, with single female/mother households (150 | 11.5%) accounting for the largest median household size of 3.31 persons per household. non-family households (455 | 34.9%) represent the smallest median household size with 1.29 persons per household.
| Household Type | # Households | Household Size |
| Married-Couple | 615 (47.1%) | 3.17 |
| Single Male/Father | 85 (6.5%) | 3.21 |
| Single Female/Mother | 150 (11.5%) | 3.31 |
| Non-family | 455 (34.9%) | 1.29 |
| Total Households | 1,305 (100.0%) | 2.53 |
Household Size by Marriage Status in Harvey
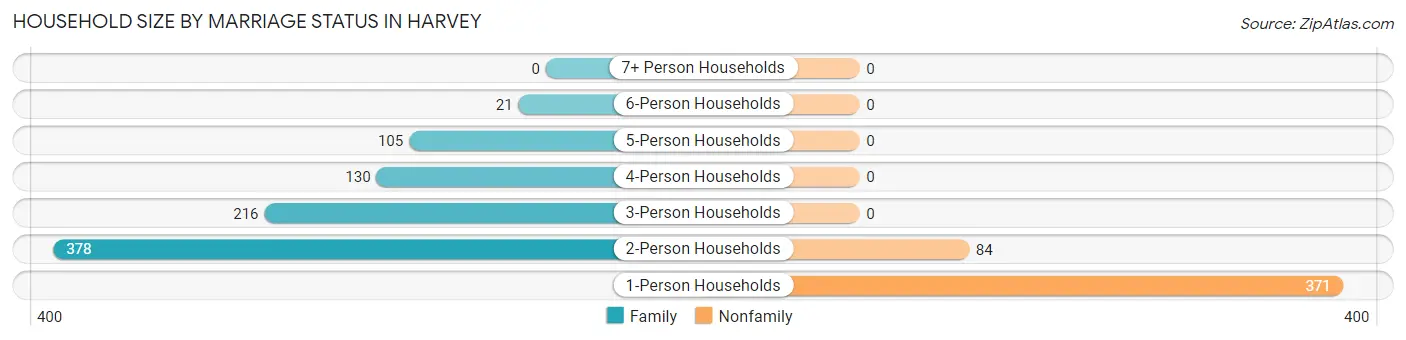
Out of a total of 1,305 households in Harvey, 850 (65.1%) are family households, while 455 (34.9%) are nonfamily households. The most numerous type of family households are 2-person households, comprising 378, and the most common type of nonfamily households are 1-person households, comprising 371.
| Household Size | Family Households | Nonfamily Households |
| 1-Person Households | - | 371 (28.4%) |
| 2-Person Households | 378 (29.0%) | 84 (6.4%) |
| 3-Person Households | 216 (16.6%) | 0 (0.0%) |
| 4-Person Households | 130 (10.0%) | 0 (0.0%) |
| 5-Person Households | 105 (8.1%) | 0 (0.0%) |
| 6-Person Households | 21 (1.6%) | 0 (0.0%) |
| 7+ Person Households | 0 (0.0%) | 0 (0.0%) |
| Total | 850 (65.1%) | 455 (34.9%) |
Female Fertility in Harvey
Fertility by Age in Harvey
Average fertility rate in Harvey is 28.0 births per 1,000 women. Women in the age bracket of 20 to 34 years have the highest fertility rate with 46.0 births per 1,000 women. Women in the age bracket of 20 to 34 years acount for 73.7% of all women with births.
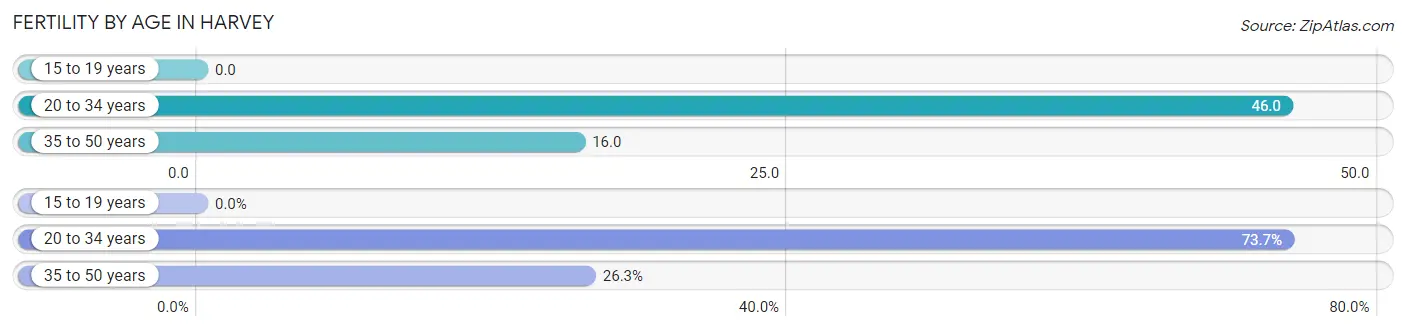
| Age Bracket | Women with Births | Births / 1,000 Women |
| 15 to 19 years | 0 (0.0%) | 0.0 |
| 20 to 34 years | 14 (73.7%) | 46.0 |
| 35 to 50 years | 5 (26.3%) | 16.0 |
| Total | 19 (100.0%) | 28.0 |
Fertility by Age by Marriage Status in Harvey
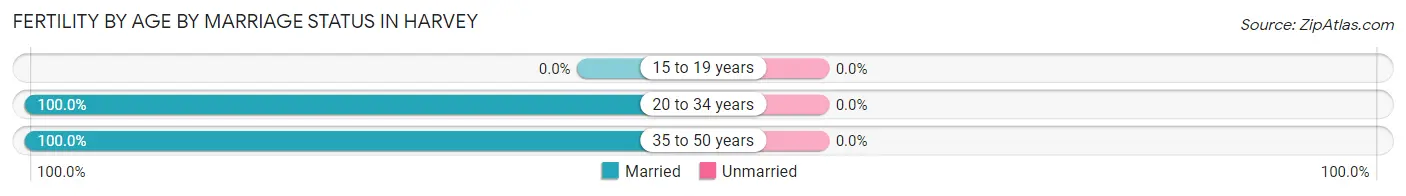
| Age Bracket | Married | Unmarried |
| 15 to 19 years | 0 (0.0%) | 0 (0.0%) |
| 20 to 34 years | 14 (100.0%) | 0 (0.0%) |
| 35 to 50 years | 5 (100.0%) | 0 (0.0%) |
| Total | 19 (100.0%) | 0 (0.0%) |
Fertility by Education in Harvey
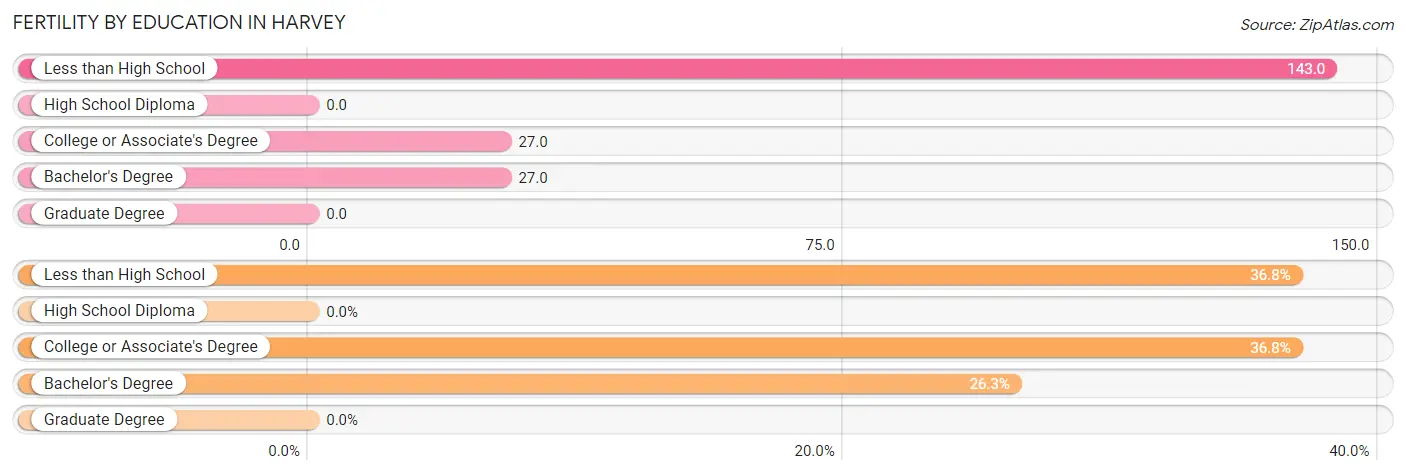
| Educational Attainment | Women with Births | Births / 1,000 Women |
| Less than High School | 7 (36.8%) | 143.0 |
| High School Diploma | 0 (0.0%) | 0.0 |
| College or Associate's Degree | 7 (36.8%) | 27.0 |
| Bachelor's Degree | 5 (26.3%) | 27.0 |
| Graduate Degree | 0 (0.0%) | 0.0 |
| Total | 19 (100.0%) | 28.0 |
Fertility by Education by Marriage Status in Harvey
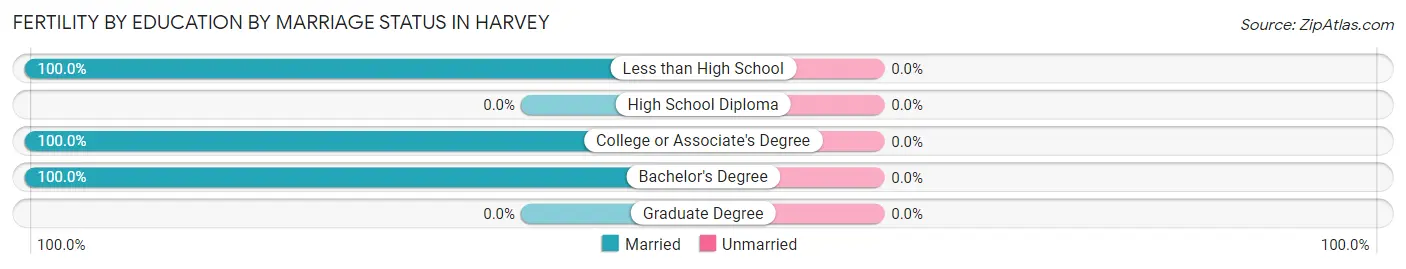
| Educational Attainment | Married | Unmarried |
| Less than High School | 7 (100.0%) | 0 (0.0%) |
| High School Diploma | 0 (0.0%) | 0 (0.0%) |
| College or Associate's Degree | 7 (100.0%) | 0 (0.0%) |
| Bachelor's Degree | 5 (100.0%) | 0 (0.0%) |
| Graduate Degree | 0 (0.0%) | 0 (0.0%) |
| Total | 19 (100.0%) | 0 (0.0%) |
Income in Harvey
Income Overview in Harvey
Per Capita Income in Harvey is $36,221, while median incomes of families and households are $90,242 and $74,093 respectively.
| Characteristic | Number | Measure |
| Per Capita Income | 3,335 | $36,221 |
| Median Family Income | 850 | $90,242 |
| Mean Family Income | 850 | $105,709 |
| Median Household Income | 1,305 | $74,093 |
| Mean Household Income | 1,305 | $91,292 |
| Income Deficit | 850 | $0 |
| Wage / Income Gap (%) | 3,335 | 8.43% |
| Wage / Income Gap ($) | 3,335 | 91.57¢ per $1 |
| Gini / Inequality Index | 3,335 | 0.42 |
Earnings by Sex in Harvey
Average Earnings in Harvey are $34,338, $34,765 for men and $31,833 for women, a difference of 8.4%.
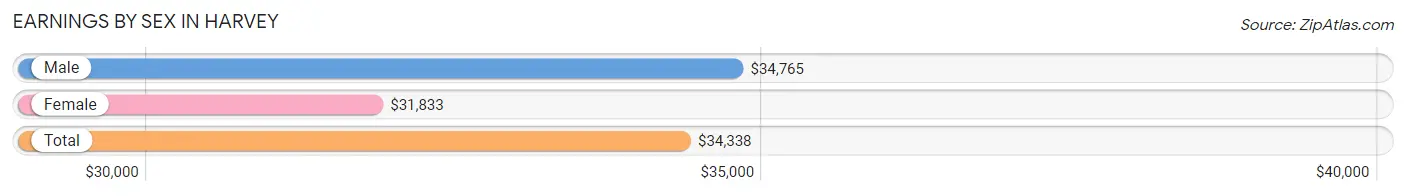
| Sex | Number | Average Earnings |
| Male | 989 (55.2%) | $34,765 |
| Female | 802 (44.8%) | $31,833 |
| Total | 1,791 (100.0%) | $34,338 |
Earnings by Sex by Income Bracket in Harvey
The most common earnings brackets in Harvey are $100,000+ for men (169 | 17.1%) and $55,000 to $64,999 for women (103 | 12.8%).
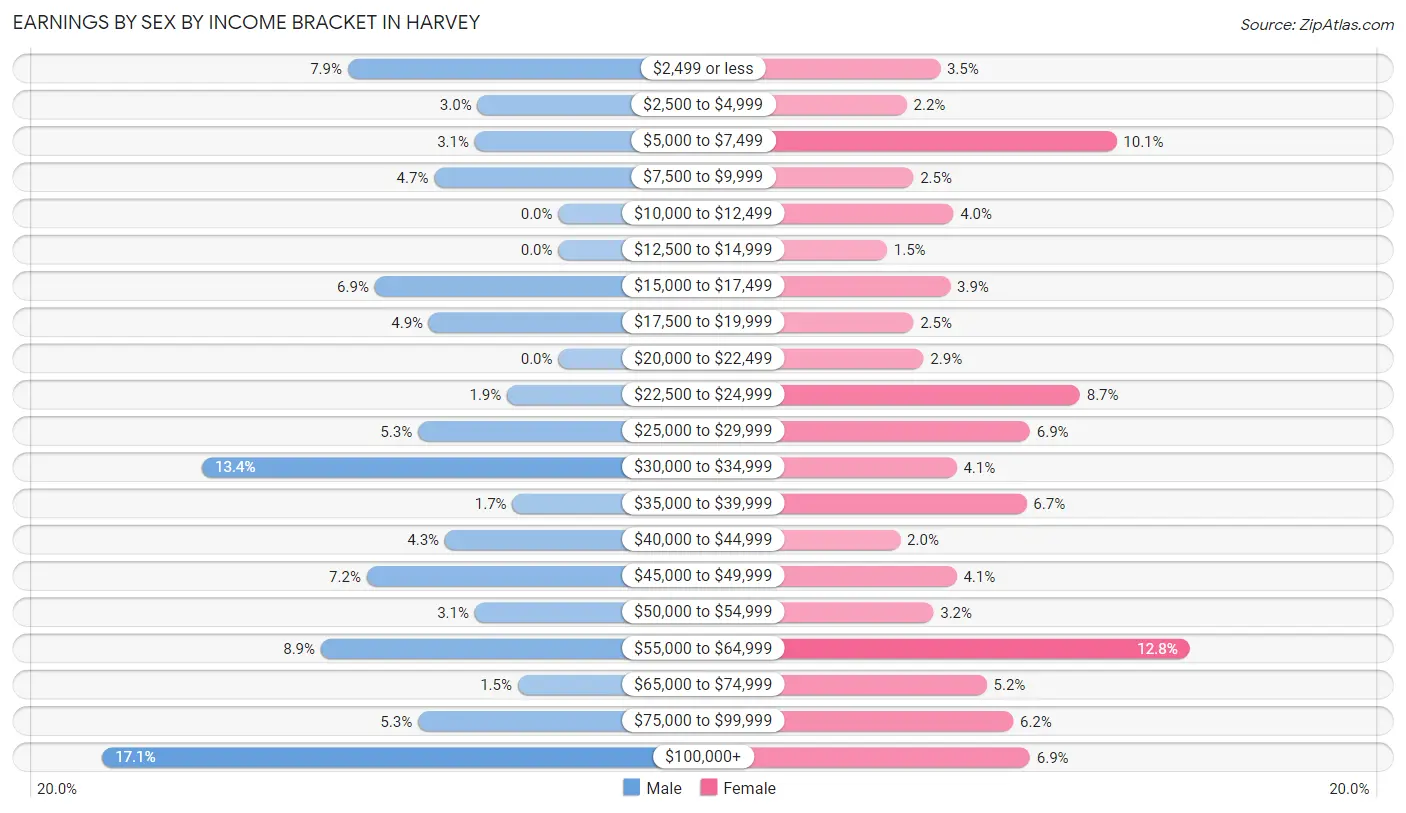
| Income | Male | Female |
| $2,499 or less | 78 (7.9%) | 28 (3.5%) |
| $2,500 to $4,999 | 30 (3.0%) | 18 (2.2%) |
| $5,000 to $7,499 | 31 (3.1%) | 81 (10.1%) |
| $7,500 to $9,999 | 46 (4.6%) | 20 (2.5%) |
| $10,000 to $12,499 | 0 (0.0%) | 32 (4.0%) |
| $12,500 to $14,999 | 0 (0.0%) | 12 (1.5%) |
| $15,000 to $17,499 | 68 (6.9%) | 31 (3.9%) |
| $17,500 to $19,999 | 48 (4.9%) | 20 (2.5%) |
| $20,000 to $22,499 | 0 (0.0%) | 23 (2.9%) |
| $22,500 to $24,999 | 19 (1.9%) | 70 (8.7%) |
| $25,000 to $29,999 | 52 (5.3%) | 55 (6.9%) |
| $30,000 to $34,999 | 132 (13.4%) | 33 (4.1%) |
| $35,000 to $39,999 | 17 (1.7%) | 54 (6.7%) |
| $40,000 to $44,999 | 42 (4.3%) | 16 (2.0%) |
| $45,000 to $49,999 | 71 (7.2%) | 33 (4.1%) |
| $50,000 to $54,999 | 31 (3.1%) | 26 (3.2%) |
| $55,000 to $64,999 | 88 (8.9%) | 103 (12.8%) |
| $65,000 to $74,999 | 15 (1.5%) | 42 (5.2%) |
| $75,000 to $99,999 | 52 (5.3%) | 50 (6.2%) |
| $100,000+ | 169 (17.1%) | 55 (6.9%) |
| Total | 989 (100.0%) | 802 (100.0%) |
Earnings by Sex by Educational Attainment in Harvey
Average earnings in Harvey are $46,954 for men and $34,236 for women, a difference of 27.1%. Men with an educational attainment of bachelor's degree enjoy the highest average annual earnings of $50,927, while those with high school diploma education earn the least with $35,313. Women with an educational attainment of graduate degree earn the most with the average annual earnings of $92,639, while those with high school diploma education have the smallest earnings of $22,946.
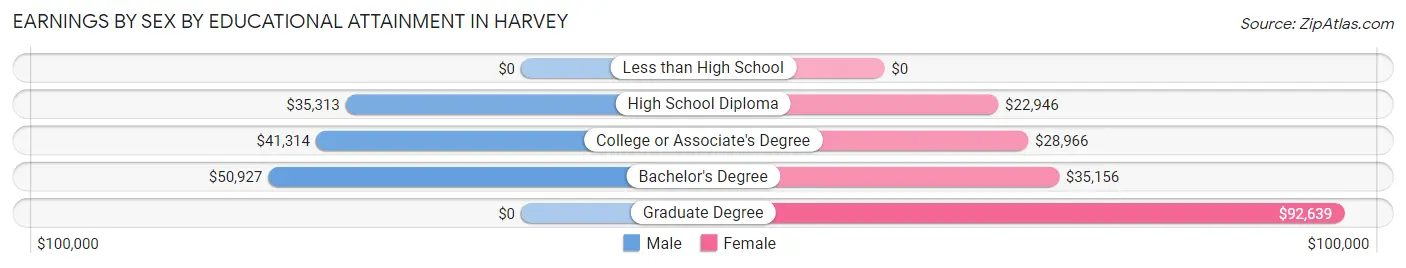
| Educational Attainment | Male Income | Female Income |
| Less than High School | - | - |
| High School Diploma | $35,313 | $22,946 |
| College or Associate's Degree | $41,314 | $28,966 |
| Bachelor's Degree | $50,927 | $35,156 |
| Graduate Degree | - | - |
| Total | $46,954 | $34,236 |
Family Income in Harvey
Family Income Brackets in Harvey
According to the Harvey family income data, there are 192 families falling into the $50,000 to $74,999 income range, which is the most common income bracket and makes up 22.6% of all families. Conversely, the $10,000 to $14,999 income bracket is the least frequent group with only 5 families (0.6%) belonging to this category.
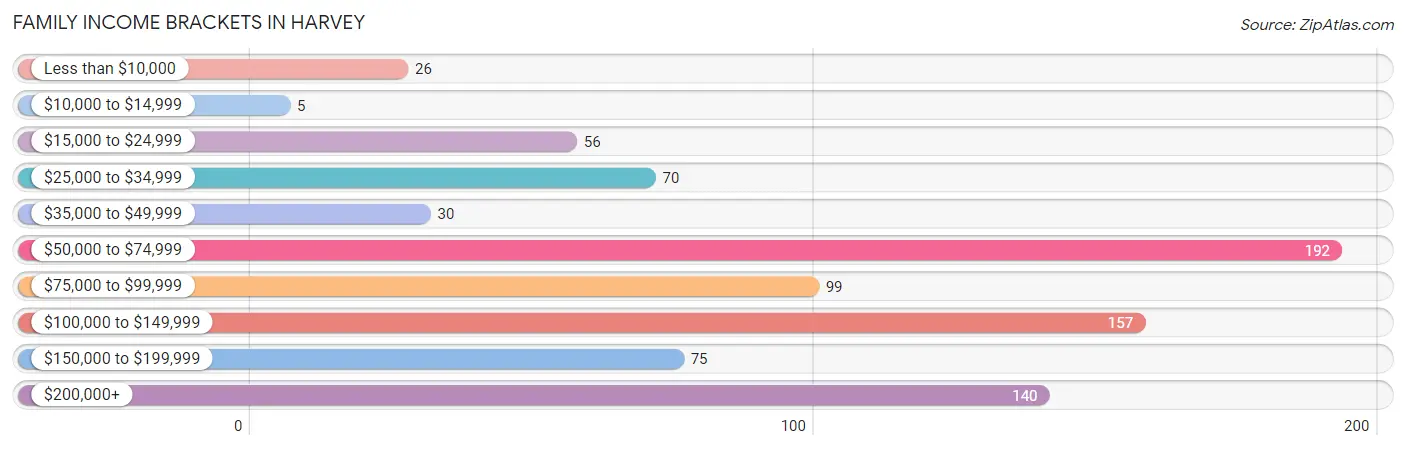
| Income Bracket | # Families | % Families |
| Less than $10,000 | 26 | 3.1% |
| $10,000 to $14,999 | 5 | 0.6% |
| $15,000 to $24,999 | 56 | 6.6% |
| $25,000 to $34,999 | 70 | 8.2% |
| $35,000 to $49,999 | 30 | 3.5% |
| $50,000 to $74,999 | 192 | 22.6% |
| $75,000 to $99,999 | 99 | 11.6% |
| $100,000 to $149,999 | 157 | 18.5% |
| $150,000 to $199,999 | 75 | 8.8% |
| $200,000+ | 140 | 16.5% |
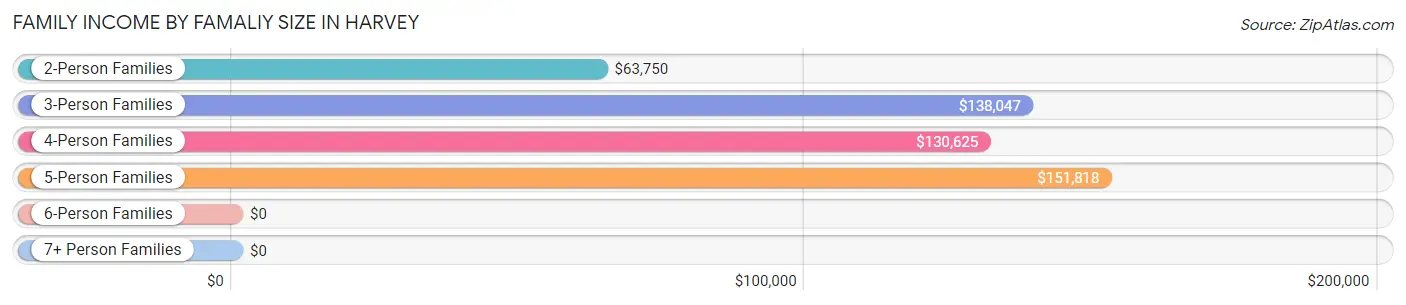
Family Income by Famaliy Size in Harvey
5-person families (92 | 10.8%) account for the highest median family income in Harvey with $151,818 per family, while 3-person families (189 | 22.2%) have the highest median income of $46,016 per family member.
| Income Bracket | # Families | Median Income |
| 2-Person Families | 461 (54.2%) | $63,750 |
| 3-Person Families | 189 (22.2%) | $138,047 |
| 4-Person Families | 87 (10.2%) | $130,625 |
| 5-Person Families | 92 (10.8%) | $151,818 |
| 6-Person Families | 21 (2.5%) | $0 |
| 7+ Person Families | 0 (0.0%) | $0 |
| Total | 850 (100.0%) | $90,242 |
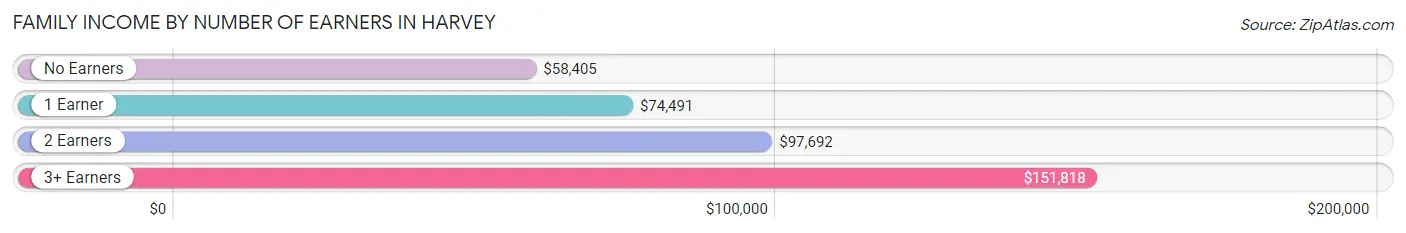
Family Income by Number of Earners in Harvey
The median family income in Harvey is $90,242, with families comprising 3+ earners (94) having the highest median family income of $151,818, while families with no earners (149) have the lowest median family income of $58,405, accounting for 11.1% and 17.5% of families, respectively.
| Number of Earners | # Families | Median Income |
| No Earners | 149 (17.5%) | $58,405 |
| 1 Earner | 325 (38.2%) | $74,491 |
| 2 Earners | 282 (33.2%) | $97,692 |
| 3+ Earners | 94 (11.1%) | $151,818 |
| Total | 850 (100.0%) | $90,242 |
Household Income in Harvey
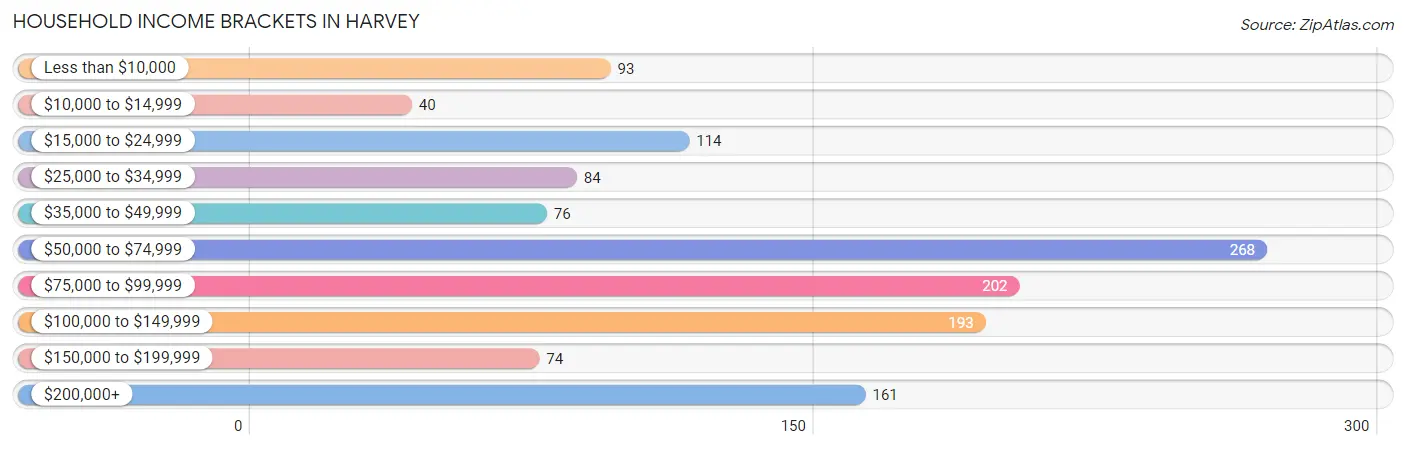
Household Income Brackets in Harvey
With 268 households falling in the category, the $50,000 to $74,999 income range is the most frequent in Harvey, accounting for 20.5% of all households. In contrast, only 40 households (3.1%) fall into the $10,000 to $14,999 income bracket, making it the least populous group.
| Income Bracket | # Households | % Households |
| Less than $10,000 | 93 | 7.1% |
| $10,000 to $14,999 | 40 | 3.1% |
| $15,000 to $24,999 | 114 | 8.7% |
| $25,000 to $34,999 | 84 | 6.4% |
| $35,000 to $49,999 | 76 | 5.8% |
| $50,000 to $74,999 | 268 | 20.5% |
| $75,000 to $99,999 | 202 | 15.5% |
| $100,000 to $149,999 | 193 | 14.8% |
| $150,000 to $199,999 | 74 | 5.7% |
| $200,000+ | 161 | 12.3% |
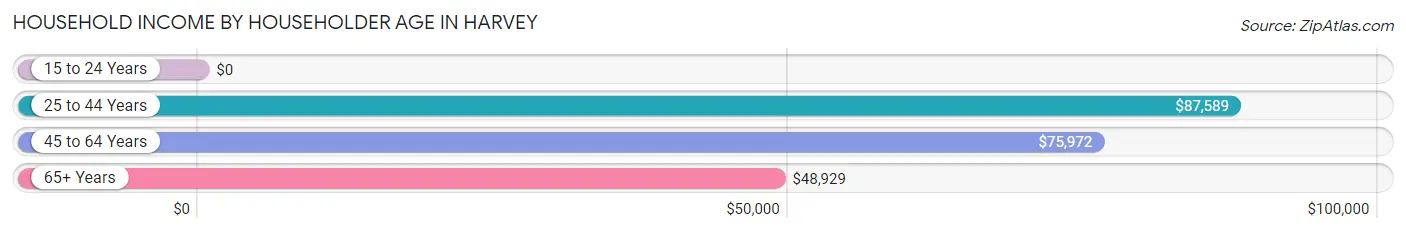
Household Income by Householder Age in Harvey
The median household income in Harvey is $74,093, with the highest median household income of $87,589 found in the 25 to 44 years age bracket for the primary householder. A total of 371 households (28.4%) fall into this category. Meanwhile, the 15 to 24 years age bracket for the primary householder has the lowest median household income of $0, with 45 households (3.5%) in this group.
| Income Bracket | # Households | Median Income |
| 15 to 24 Years | 45 (3.5%) | $0 |
| 25 to 44 Years | 371 (28.4%) | $87,589 |
| 45 to 64 Years | 543 (41.6%) | $75,972 |
| 65+ Years | 346 (26.5%) | $48,929 |
| Total | 1,305 (100.0%) | $74,093 |
Poverty in Harvey
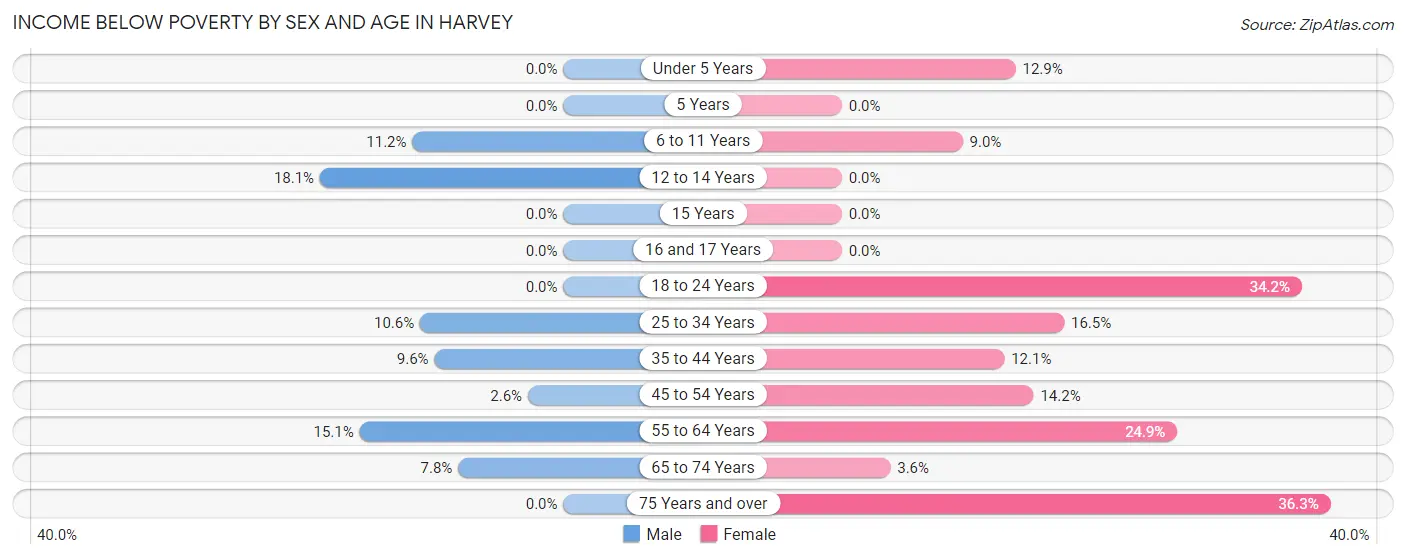
Income Below Poverty by Sex and Age in Harvey
With 7.3% poverty level for males and 16.4% for females among the residents of Harvey, 12 to 14 year old males and 75 year old and over females are the most vulnerable to poverty, with 15 males (18.1%) and 41 females (36.3%) in their respective age groups living below the poverty level.
| Age Bracket | Male | Female |
| Under 5 Years | 0 (0.0%) | 12 (12.9%) |
| 5 Years | 0 (0.0%) | 0 (0.0%) |
| 6 to 11 Years | 13 (11.2%) | 7 (9.0%) |
| 12 to 14 Years | 15 (18.1%) | 0 (0.0%) |
| 15 Years | 0 (0.0%) | 0 (0.0%) |
| 16 and 17 Years | 0 (0.0%) | 0 (0.0%) |
| 18 to 24 Years | 0 (0.0%) | 42 (34.2%) |
| 25 to 34 Years | 15 (10.6%) | 33 (16.5%) |
| 35 to 44 Years | 22 (9.6%) | 31 (12.1%) |
| 45 to 54 Years | 5 (2.6%) | 34 (14.2%) |
| 55 to 64 Years | 36 (15.1%) | 61 (24.9%) |
| 65 to 74 Years | 15 (7.8%) | 5 (3.6%) |
| 75 Years and over | 0 (0.0%) | 41 (36.3%) |
| Total | 121 (7.3%) | 266 (16.4%) |
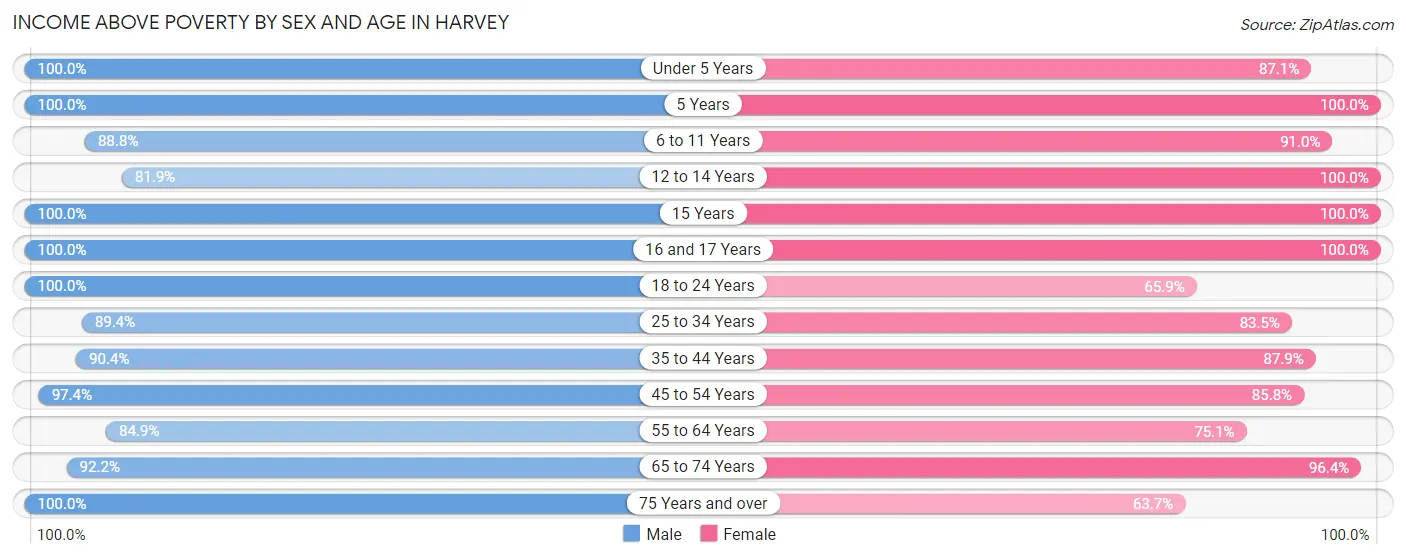
Income Above Poverty by Sex and Age in Harvey
According to the poverty statistics in Harvey, males aged under 5 years and females aged 5 years are the age groups that are most secure financially, with 100.0% of males and 100.0% of females in these age groups living above the poverty line.
| Age Bracket | Male | Female |
| Under 5 Years | 82 (100.0%) | 81 (87.1%) |
| 5 Years | 13 (100.0%) | 11 (100.0%) |
| 6 to 11 Years | 103 (88.8%) | 71 (91.0%) |
| 12 to 14 Years | 68 (81.9%) | 80 (100.0%) |
| 15 Years | 41 (100.0%) | 24 (100.0%) |
| 16 and 17 Years | 22 (100.0%) | 18 (100.0%) |
| 18 to 24 Years | 242 (100.0%) | 81 (65.8%) |
| 25 to 34 Years | 126 (89.4%) | 167 (83.5%) |
| 35 to 44 Years | 208 (90.4%) | 226 (87.9%) |
| 45 to 54 Years | 185 (97.4%) | 205 (85.8%) |
| 55 to 64 Years | 202 (84.9%) | 184 (75.1%) |
| 65 to 74 Years | 177 (92.2%) | 134 (96.4%) |
| 75 Years and over | 63 (100.0%) | 72 (63.7%) |
| Total | 1,532 (92.7%) | 1,354 (83.6%) |
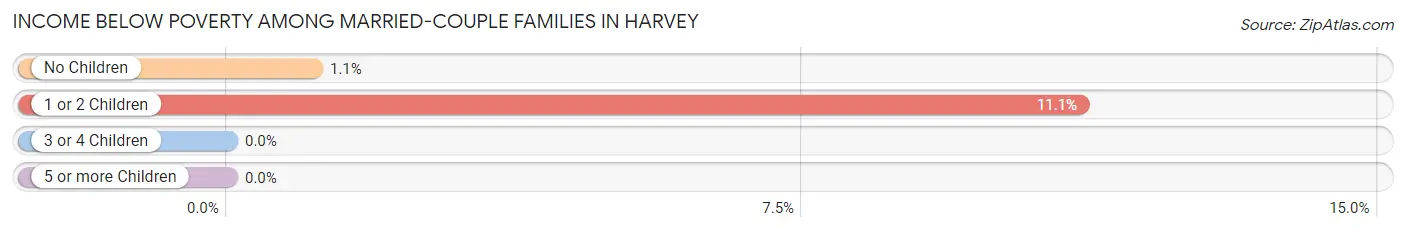
Income Below Poverty Among Married-Couple Families in Harvey
The poverty statistics for married-couple families in Harvey show that 3.7% or 23 of the total 615 families live below the poverty line. Families with 1 or 2 children have the highest poverty rate of 11.1%, comprising of 19 families. On the other hand, families with 3 or 4 children have the lowest poverty rate of 0.0%, which includes 0 families.
| Children | Above Poverty | Below Poverty |
| No Children | 356 (98.9%) | 4 (1.1%) |
| 1 or 2 Children | 152 (88.9%) | 19 (11.1%) |
| 3 or 4 Children | 84 (100.0%) | 0 (0.0%) |
| 5 or more Children | 0 (0.0%) | 0 (0.0%) |
| Total | 592 (96.3%) | 23 (3.7%) |
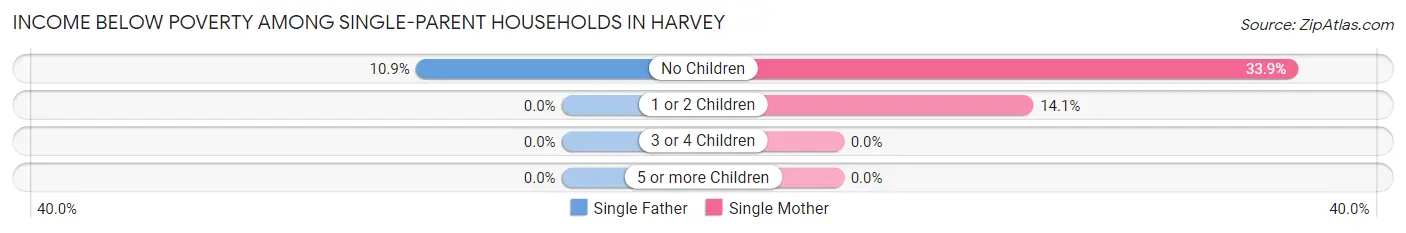
Income Below Poverty Among Single-Parent Households in Harvey
According to the poverty data in Harvey, 5.9% or 5 single-father households and 22.7% or 34 single-mother households are living below the poverty line. Among single-father households, those with no children have the highest poverty rate, with 5 households (10.9%) experiencing poverty. Likewise, among single-mother households, those with no children have the highest poverty rate, with 22 households (33.9%) falling below the poverty line.
| Children | Single Father | Single Mother |
| No Children | 5 (10.9%) | 22 (33.9%) |
| 1 or 2 Children | 0 (0.0%) | 12 (14.1%) |
| 3 or 4 Children | 0 (0.0%) | 0 (0.0%) |
| 5 or more Children | 0 (0.0%) | 0 (0.0%) |
| Total | 5 (5.9%) | 34 (22.7%) |
Income Below Poverty Among Married-Couple vs Single-Parent Households in Harvey
The poverty data for Harvey shows that 23 of the married-couple family households (3.7%) and 39 of the single-parent households (16.6%) are living below the poverty level. Within the married-couple family households, those with 1 or 2 children have the highest poverty rate, with 19 households (11.1%) falling below the poverty line. Among the single-parent households, those with no children have the highest poverty rate, with 27 household (24.3%) living below poverty.
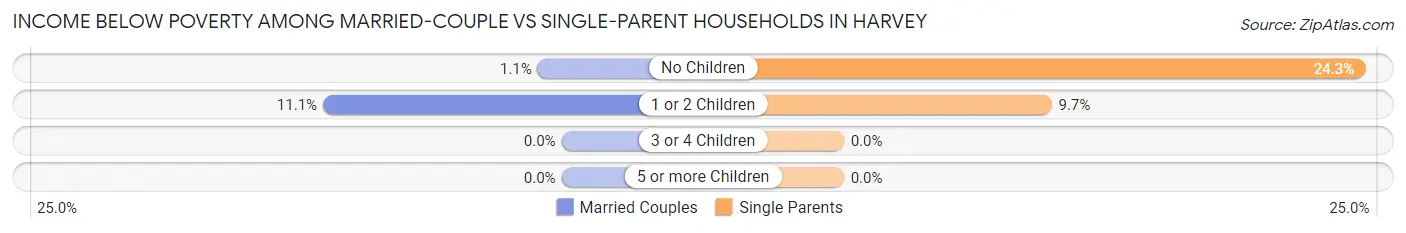
| Children | Married-Couple Families | Single-Parent Households |
| No Children | 4 (1.1%) | 27 (24.3%) |
| 1 or 2 Children | 19 (11.1%) | 12 (9.7%) |
| 3 or 4 Children | 0 (0.0%) | 0 (0.0%) |
| 5 or more Children | 0 (0.0%) | 0 (0.0%) |
| Total | 23 (3.7%) | 39 (16.6%) |
Employment Characteristics in Harvey
Employment by Class of Employer in Harvey
Among the 1,656 employed individuals in Harvey, private company employees (1,122 | 67.7%), self-employed (not incorporated) (135 | 8.2%), and state government employees (122 | 7.4%) make up the most common classes of employment.
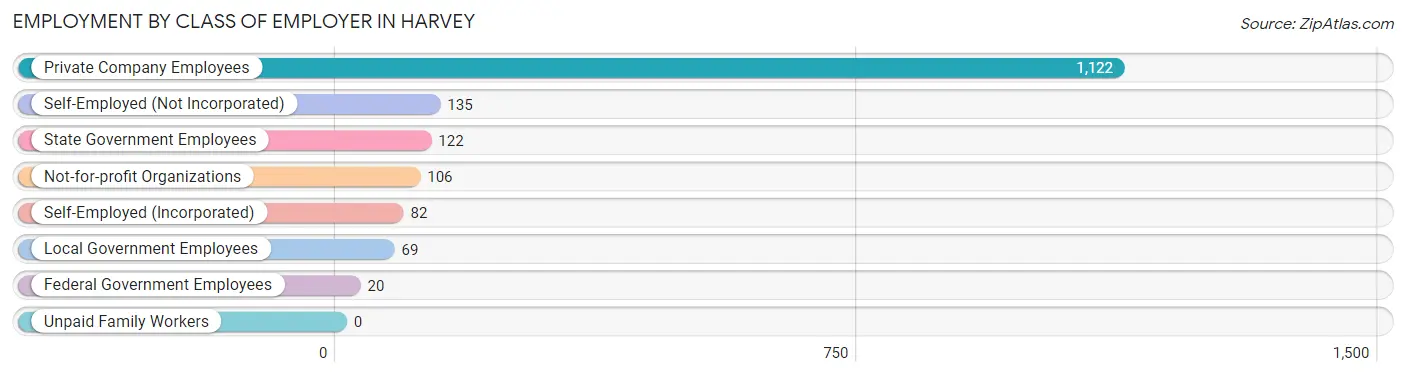
| Employer Class | # Employees | % Employees |
| Private Company Employees | 1,122 | 67.7% |
| Self-Employed (Incorporated) | 82 | 5.0% |
| Self-Employed (Not Incorporated) | 135 | 8.2% |
| Not-for-profit Organizations | 106 | 6.4% |
| Local Government Employees | 69 | 4.2% |
| State Government Employees | 122 | 7.4% |
| Federal Government Employees | 20 | 1.2% |
| Unpaid Family Workers | 0 | 0.0% |
| Total | 1,656 | 100.0% |
Employment Status by Age in Harvey
According to the labor force statistics for Harvey, out of the total population over 16 years of age (2,652), 66.1% or 1,753 individuals are in the labor force, with 3.8% or 67 of them unemployed. The age group with the highest labor force participation rate is 20 to 24 years, with 100.0% or 271 individuals in the labor force. Within the labor force, the 25 to 29 years age range has the highest percentage of unemployed individuals, with 8.2% or 15 of them being unemployed.
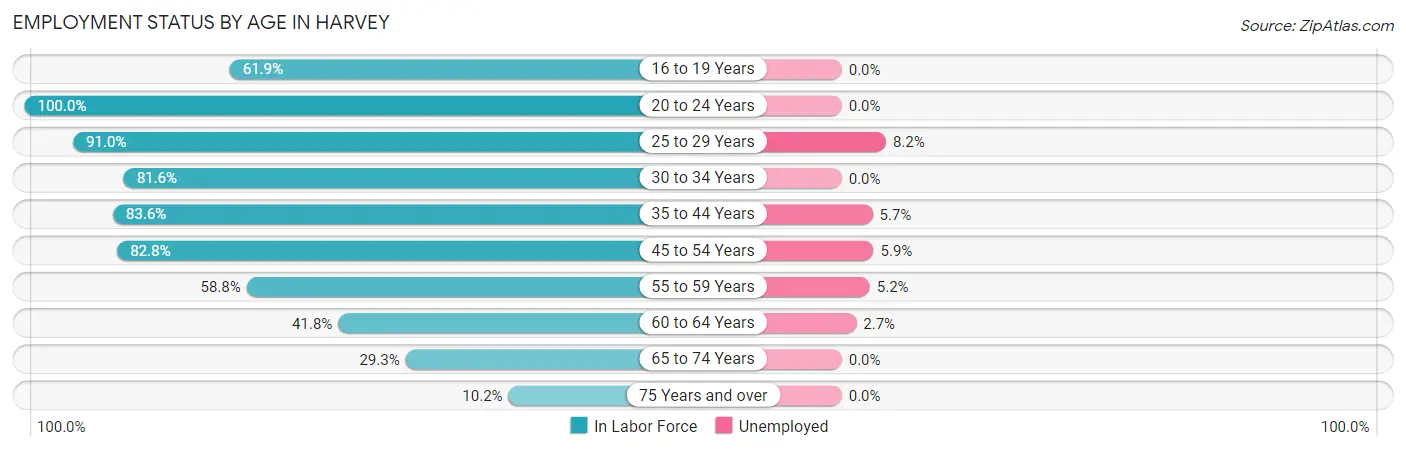
| Age Bracket | In Labor Force | Unemployed |
| 16 to 19 Years | 83 (61.9%) | 0 (0.0%) |
| 20 to 24 Years | 271 (100.0%) | 0 (0.0%) |
| 25 to 29 Years | 182 (91.0%) | 15 (8.2%) |
| 30 to 34 Years | 115 (81.6%) | 0 (0.0%) |
| 35 to 44 Years | 407 (83.6%) | 23 (5.7%) |
| 45 to 54 Years | 355 (82.8%) | 21 (5.9%) |
| 55 to 59 Years | 77 (58.8%) | 4 (5.2%) |
| 60 to 64 Years | 147 (41.8%) | 4 (2.7%) |
| 65 to 74 Years | 97 (29.3%) | 0 (0.0%) |
| 75 Years and over | 18 (10.2%) | 0 (0.0%) |
| Total | 1,753 (66.1%) | 67 (3.8%) |
Employment Status by Educational Attainment in Harvey
According to labor force statistics for Harvey, 73.7% of individuals (1,282) out of the total population between 25 and 64 years of age (1,740) are in the labor force, with 5.2% or 67 of them being unemployed. The group with the highest labor force participation rate are those with the educational attainment of bachelor's degree or higher, with 85.5% or 645 individuals in the labor force. Within the labor force, individuals with high school diploma education have the highest percentage of unemployment, with 9.9% or 22 of them being unemployed.
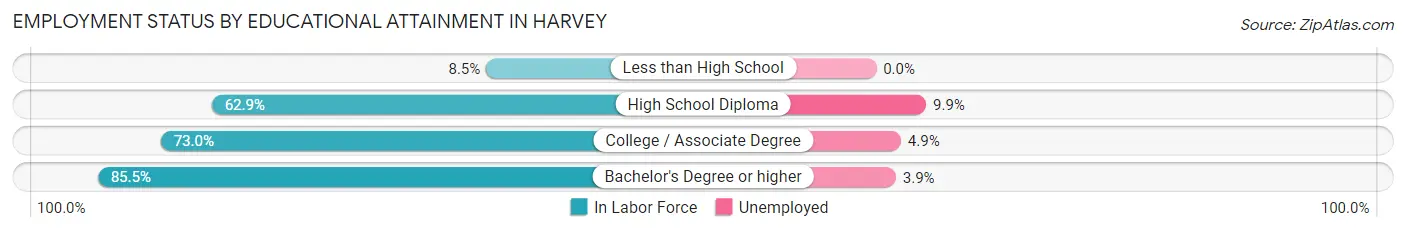
| Educational Attainment | In Labor Force | Unemployed |
| Less than High School | 6 (8.5%) | 0 (0.0%) |
| High School Diploma | 222 (62.9%) | 35 (9.9%) |
| College / Associate Degree | 410 (73.0%) | 28 (4.9%) |
| Bachelor's Degree or higher | 645 (85.5%) | 29 (3.9%) |
| Total | 1,282 (73.7%) | 90 (5.2%) |
Employment Occupations by Sex in Harvey
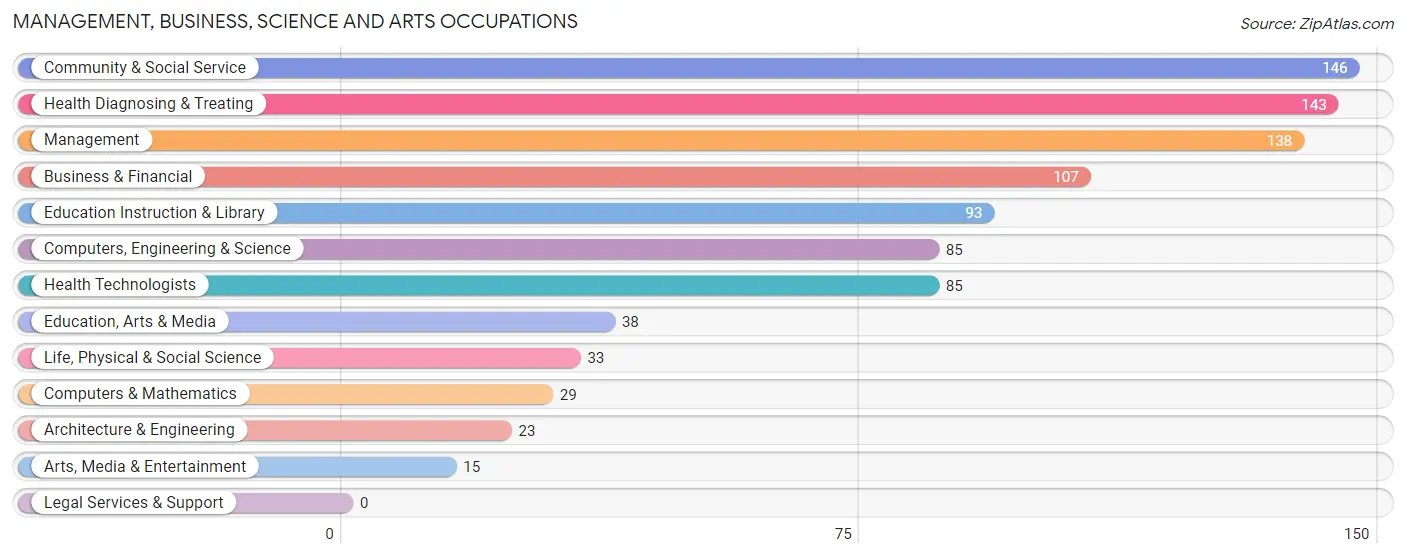
Management, Business, Science and Arts Occupations
The most common Management, Business, Science and Arts occupations in Harvey are Community & Social Service (146 | 8.7%), Health Diagnosing & Treating (143 | 8.5%), Management (138 | 8.2%), Business & Financial (107 | 6.4%), and Education Instruction & Library (93 | 5.5%).
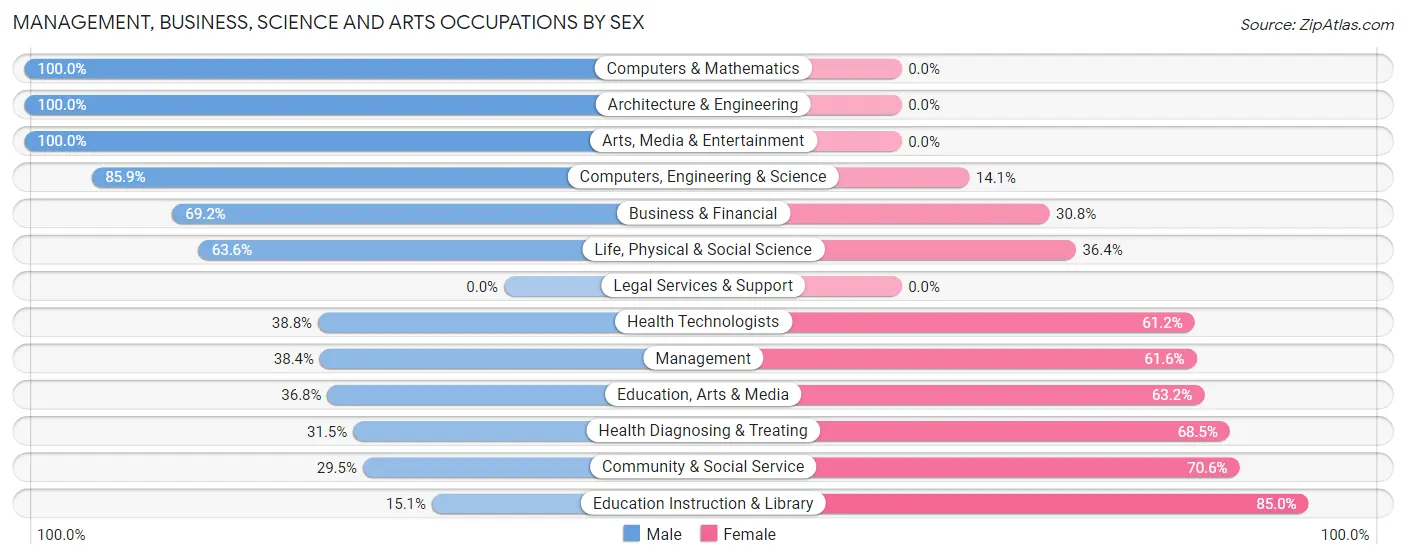
Management, Business, Science and Arts Occupations by Sex
Within the Management, Business, Science and Arts occupations in Harvey, the most male-oriented occupations are Computers & Mathematics (100.0%), Architecture & Engineering (100.0%), and Arts, Media & Entertainment (100.0%), while the most female-oriented occupations are Education Instruction & Library (85.0%), Community & Social Service (70.6%), and Health Diagnosing & Treating (68.5%).
| Occupation | Male | Female |
| Management | 53 (38.4%) | 85 (61.6%) |
| Business & Financial | 74 (69.2%) | 33 (30.8%) |
| Computers, Engineering & Science | 73 (85.9%) | 12 (14.1%) |
| Computers & Mathematics | 29 (100.0%) | 0 (0.0%) |
| Architecture & Engineering | 23 (100.0%) | 0 (0.0%) |
| Life, Physical & Social Science | 21 (63.6%) | 12 (36.4%) |
| Community & Social Service | 43 (29.4%) | 103 (70.6%) |
| Education, Arts & Media | 14 (36.8%) | 24 (63.2%) |
| Legal Services & Support | 0 (0.0%) | 0 (0.0%) |
| Education Instruction & Library | 14 (15.0%) | 79 (85.0%) |
| Arts, Media & Entertainment | 15 (100.0%) | 0 (0.0%) |
| Health Diagnosing & Treating | 45 (31.5%) | 98 (68.5%) |
| Health Technologists | 33 (38.8%) | 52 (61.2%) |
| Total (Category) | 288 (46.5%) | 331 (53.5%) |
| Total (Overall) | 890 (52.8%) | 795 (47.2%) |
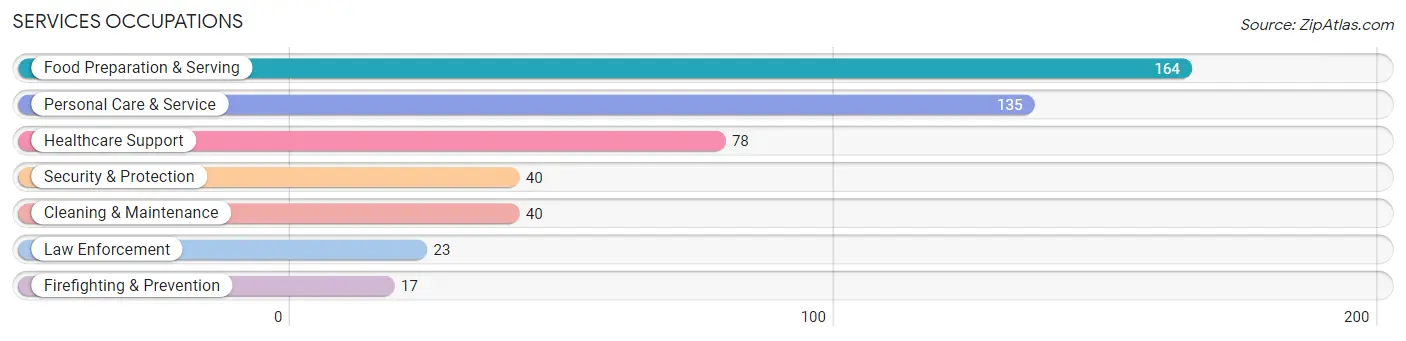
Services Occupations
The most common Services occupations in Harvey are Food Preparation & Serving (164 | 9.7%), Personal Care & Service (135 | 8.0%), Healthcare Support (78 | 4.6%), Security & Protection (40 | 2.4%), and Cleaning & Maintenance (40 | 2.4%).
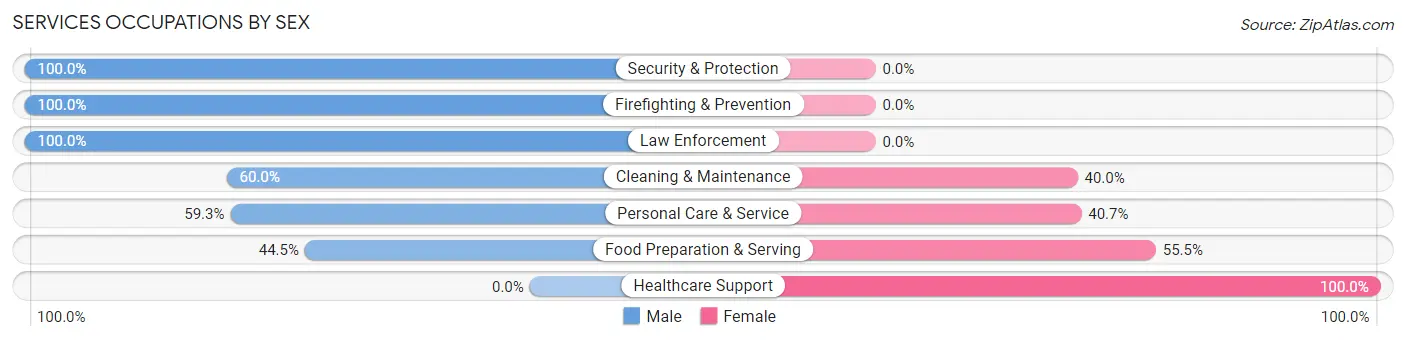
Services Occupations by Sex
Within the Services occupations in Harvey, the most male-oriented occupations are Security & Protection (100.0%), Firefighting & Prevention (100.0%), and Law Enforcement (100.0%), while the most female-oriented occupations are Healthcare Support (100.0%), Food Preparation & Serving (55.5%), and Personal Care & Service (40.7%).
| Occupation | Male | Female |
| Healthcare Support | 0 (0.0%) | 78 (100.0%) |
| Security & Protection | 40 (100.0%) | 0 (0.0%) |
| Firefighting & Prevention | 17 (100.0%) | 0 (0.0%) |
| Law Enforcement | 23 (100.0%) | 0 (0.0%) |
| Food Preparation & Serving | 73 (44.5%) | 91 (55.5%) |
| Cleaning & Maintenance | 24 (60.0%) | 16 (40.0%) |
| Personal Care & Service | 80 (59.3%) | 55 (40.7%) |
| Total (Category) | 217 (47.5%) | 240 (52.5%) |
| Total (Overall) | 890 (52.8%) | 795 (47.2%) |
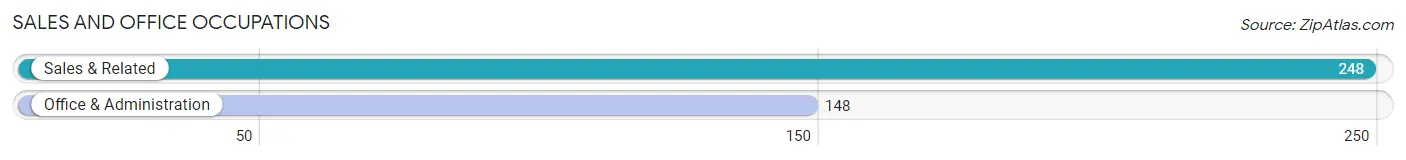
Sales and Office Occupations
The most common Sales and Office occupations in Harvey are Sales & Related (248 | 14.7%), and Office & Administration (148 | 8.8%).
Sales and Office Occupations by Sex
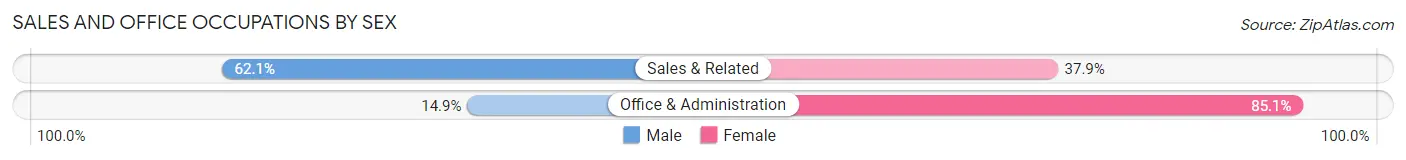
| Occupation | Male | Female |
| Sales & Related | 154 (62.1%) | 94 (37.9%) |
| Office & Administration | 22 (14.9%) | 126 (85.1%) |
| Total (Category) | 176 (44.4%) | 220 (55.6%) |
| Total (Overall) | 890 (52.8%) | 795 (47.2%) |
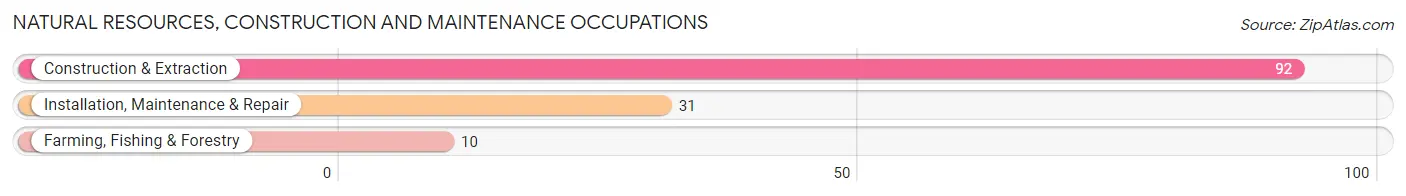
Natural Resources, Construction and Maintenance Occupations
The most common Natural Resources, Construction and Maintenance occupations in Harvey are Construction & Extraction (92 | 5.5%), Installation, Maintenance & Repair (31 | 1.8%), and Farming, Fishing & Forestry (10 | 0.6%).
Natural Resources, Construction and Maintenance Occupations by Sex
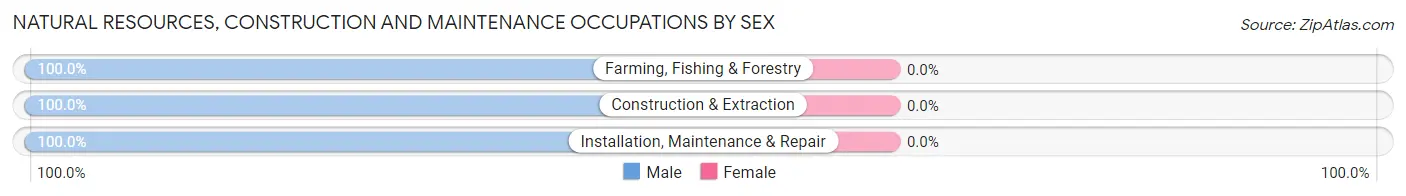
| Occupation | Male | Female |
| Farming, Fishing & Forestry | 10 (100.0%) | 0 (0.0%) |
| Construction & Extraction | 92 (100.0%) | 0 (0.0%) |
| Installation, Maintenance & Repair | 31 (100.0%) | 0 (0.0%) |
| Total (Category) | 133 (100.0%) | 0 (0.0%) |
| Total (Overall) | 890 (52.8%) | 795 (47.2%) |
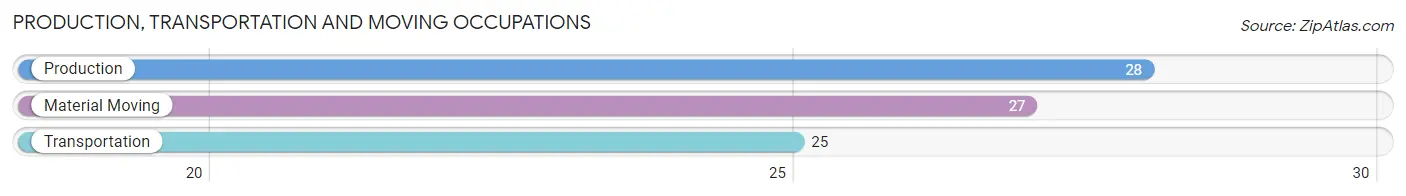
Production, Transportation and Moving Occupations
The most common Production, Transportation and Moving occupations in Harvey are Production (28 | 1.7%), Material Moving (27 | 1.6%), and Transportation (25 | 1.5%).
Production, Transportation and Moving Occupations by Sex
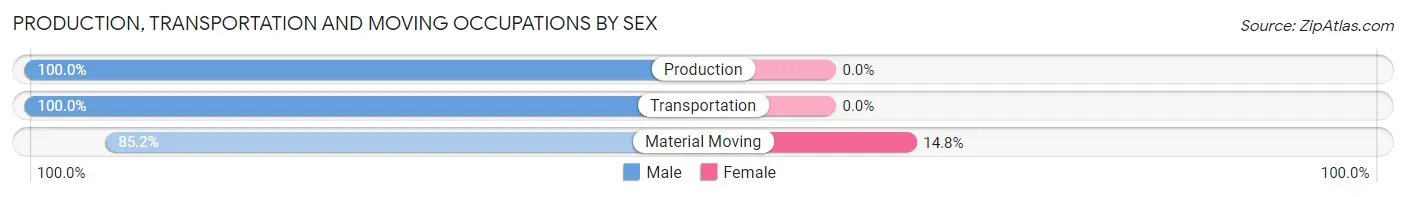
| Occupation | Male | Female |
| Production | 28 (100.0%) | 0 (0.0%) |
| Transportation | 25 (100.0%) | 0 (0.0%) |
| Material Moving | 23 (85.2%) | 4 (14.8%) |
| Total (Category) | 76 (95.0%) | 4 (5.0%) |
| Total (Overall) | 890 (52.8%) | 795 (47.2%) |
Employment Industries by Sex in Harvey
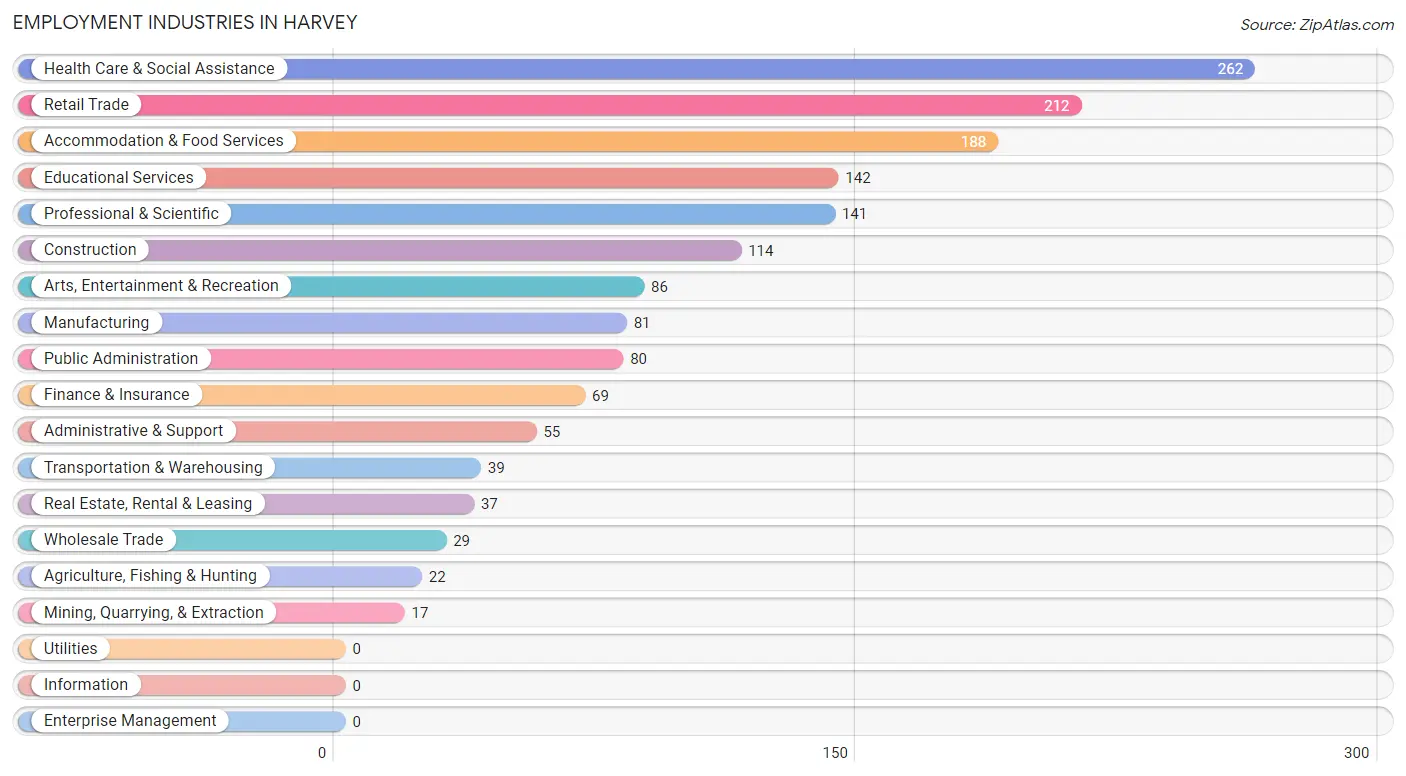
Employment Industries in Harvey
The major employment industries in Harvey include Health Care & Social Assistance (262 | 15.5%), Retail Trade (212 | 12.6%), Accommodation & Food Services (188 | 11.2%), Educational Services (142 | 8.4%), and Professional & Scientific (141 | 8.4%).
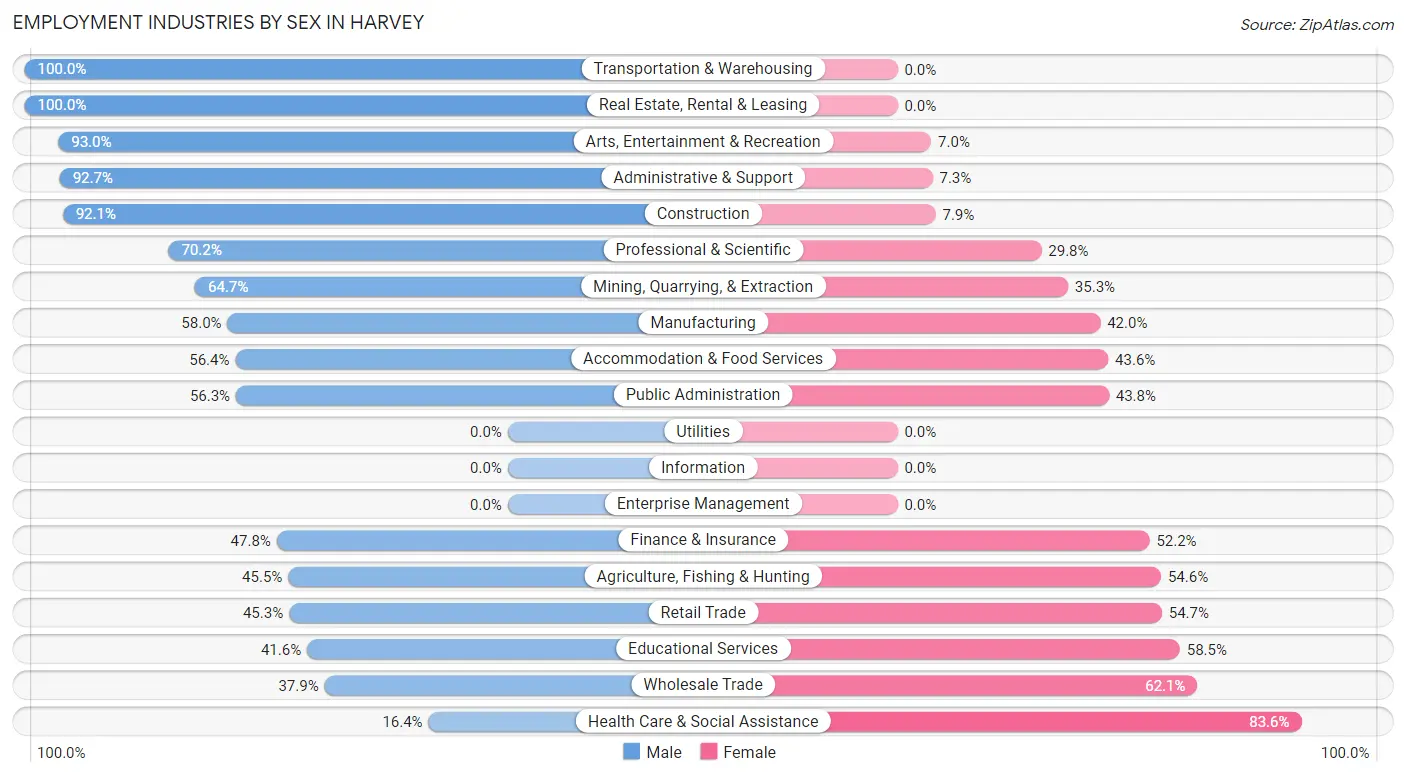
Employment Industries by Sex in Harvey
The Harvey industries that see more men than women are Transportation & Warehousing (100.0%), Real Estate, Rental & Leasing (100.0%), and Arts, Entertainment & Recreation (93.0%), whereas the industries that tend to have a higher number of women are Health Care & Social Assistance (83.6%), Wholesale Trade (62.1%), and Educational Services (58.5%).
| Industry | Male | Female |
| Agriculture, Fishing & Hunting | 10 (45.5%) | 12 (54.5%) |
| Mining, Quarrying, & Extraction | 11 (64.7%) | 6 (35.3%) |
| Construction | 105 (92.1%) | 9 (7.9%) |
| Manufacturing | 47 (58.0%) | 34 (42.0%) |
| Wholesale Trade | 11 (37.9%) | 18 (62.1%) |
| Retail Trade | 96 (45.3%) | 116 (54.7%) |
| Transportation & Warehousing | 39 (100.0%) | 0 (0.0%) |
| Utilities | 0 (0.0%) | 0 (0.0%) |
| Information | 0 (0.0%) | 0 (0.0%) |
| Finance & Insurance | 33 (47.8%) | 36 (52.2%) |
| Real Estate, Rental & Leasing | 37 (100.0%) | 0 (0.0%) |
| Professional & Scientific | 99 (70.2%) | 42 (29.8%) |
| Enterprise Management | 0 (0.0%) | 0 (0.0%) |
| Administrative & Support | 51 (92.7%) | 4 (7.3%) |
| Educational Services | 59 (41.5%) | 83 (58.5%) |
| Health Care & Social Assistance | 43 (16.4%) | 219 (83.6%) |
| Arts, Entertainment & Recreation | 80 (93.0%) | 6 (7.0%) |
| Accommodation & Food Services | 106 (56.4%) | 82 (43.6%) |
| Public Administration | 45 (56.2%) | 35 (43.8%) |
| Total | 890 (52.8%) | 795 (47.2%) |
Education in Harvey
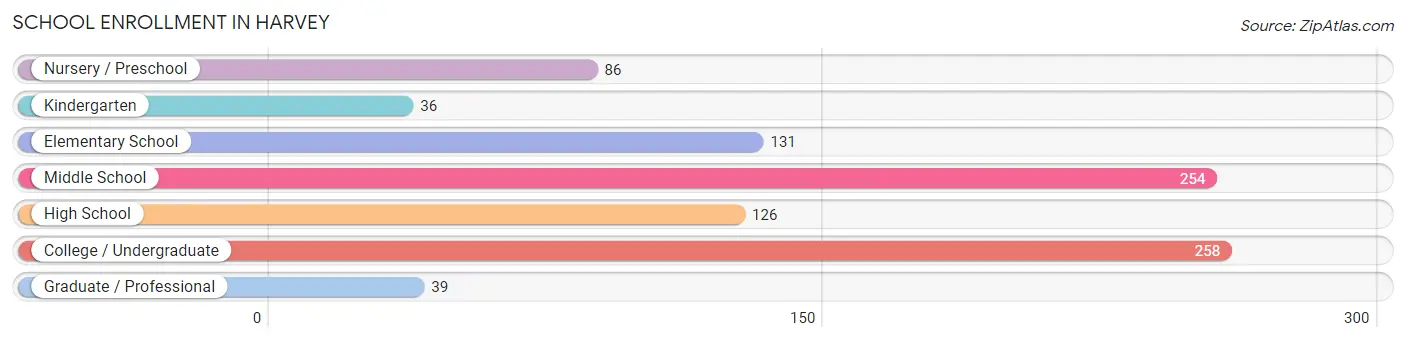
School Enrollment in Harvey
The most common levels of schooling among the 930 students in Harvey are college / undergraduate (258 | 27.7%), middle school (254 | 27.3%), and elementary school (131 | 14.1%).
| School Level | # Students | % Students |
| Nursery / Preschool | 86 | 9.2% |
| Kindergarten | 36 | 3.9% |
| Elementary School | 131 | 14.1% |
| Middle School | 254 | 27.3% |
| High School | 126 | 13.6% |
| College / Undergraduate | 258 | 27.7% |
| Graduate / Professional | 39 | 4.2% |
| Total | 930 | 100.0% |
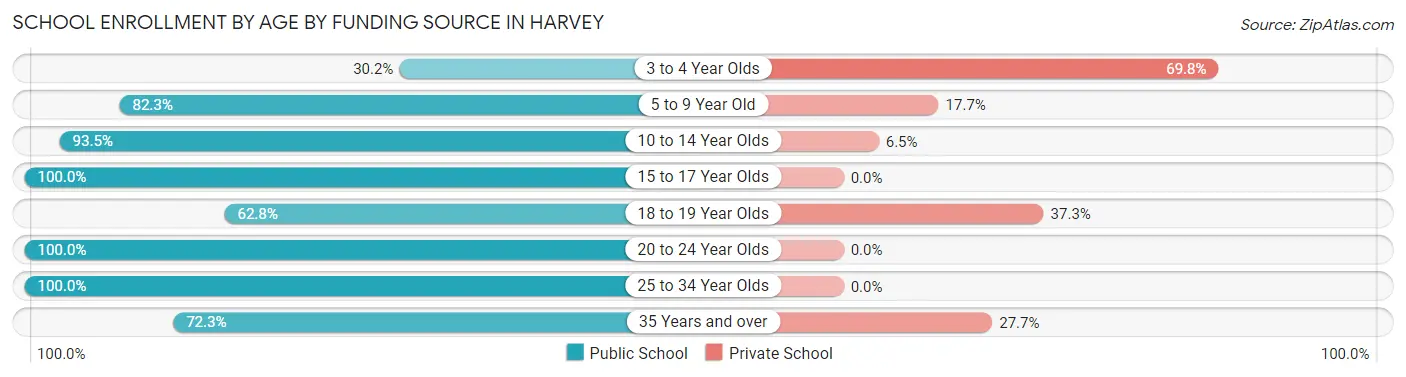
School Enrollment by Age by Funding Source in Harvey
Out of a total of 930 students who are enrolled in schools in Harvey, 140 (15.1%) attend a private institution, while the remaining 790 (84.9%) are enrolled in public schools. The age group of 3 to 4 year olds has the highest likelihood of being enrolled in private schools, with 60 (69.8% in the age bracket) enrolled. Conversely, the age group of 15 to 17 year olds has the lowest likelihood of being enrolled in a private school, with 105 (100.0% in the age bracket) attending a public institution.
| Age Bracket | Public School | Private School |
| 3 to 4 Year Olds | 26 (30.2%) | 60 (69.8%) |
| 5 to 9 Year Old | 107 (82.3%) | 23 (17.7%) |
| 10 to 14 Year Olds | 286 (93.5%) | 20 (6.5%) |
| 15 to 17 Year Olds | 105 (100.0%) | 0 (0.0%) |
| 18 to 19 Year Olds | 32 (62.7%) | 19 (37.2%) |
| 20 to 24 Year Olds | 170 (100.0%) | 0 (0.0%) |
| 25 to 34 Year Olds | 17 (100.0%) | 0 (0.0%) |
| 35 Years and over | 47 (72.3%) | 18 (27.7%) |
| Total | 790 (84.9%) | 140 (15.1%) |
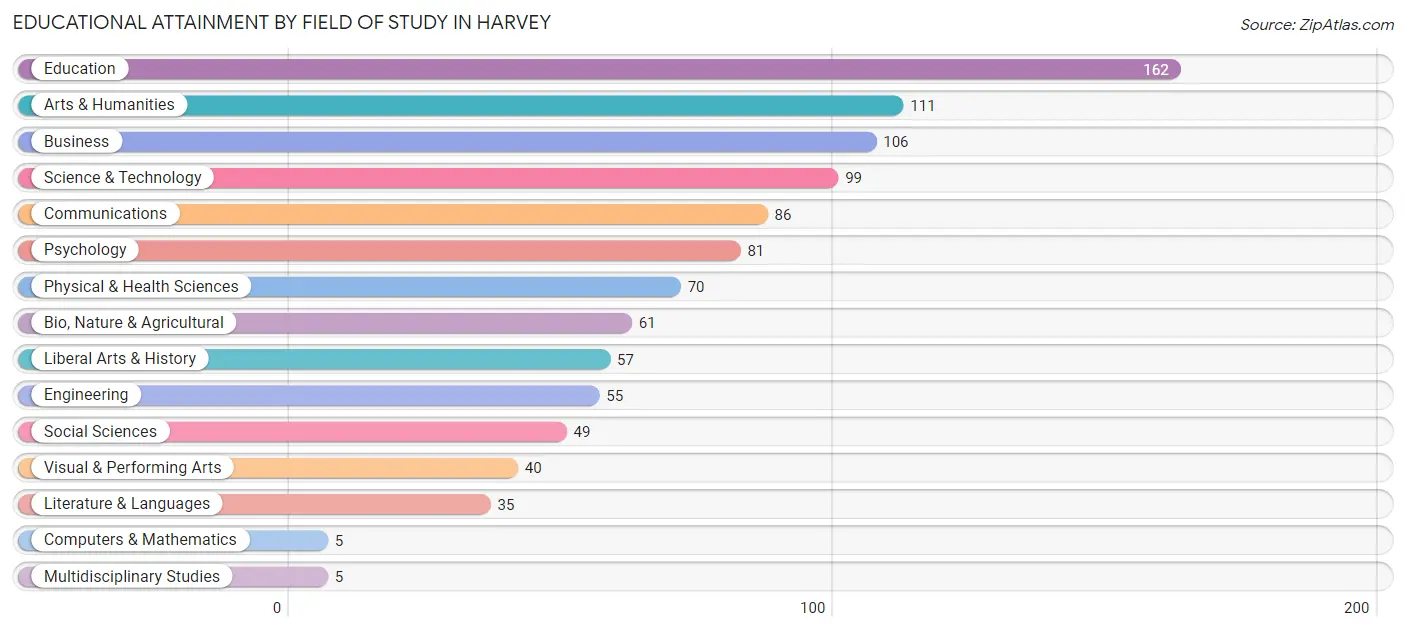
Educational Attainment by Field of Study in Harvey
Education (162 | 15.9%), arts & humanities (111 | 10.9%), business (106 | 10.4%), science & technology (99 | 9.7%), and communications (86 | 8.4%) are the most common fields of study among 1,022 individuals in Harvey who have obtained a bachelor's degree or higher.
| Field of Study | # Graduates | % Graduates |
| Computers & Mathematics | 5 | 0.5% |
| Bio, Nature & Agricultural | 61 | 6.0% |
| Physical & Health Sciences | 70 | 6.9% |
| Psychology | 81 | 7.9% |
| Social Sciences | 49 | 4.8% |
| Engineering | 55 | 5.4% |
| Multidisciplinary Studies | 5 | 0.5% |
| Science & Technology | 99 | 9.7% |
| Business | 106 | 10.4% |
| Education | 162 | 15.9% |
| Literature & Languages | 35 | 3.4% |
| Liberal Arts & History | 57 | 5.6% |
| Visual & Performing Arts | 40 | 3.9% |
| Communications | 86 | 8.4% |
| Arts & Humanities | 111 | 10.9% |
| Total | 1,022 | 100.0% |
Transportation & Commute in Harvey
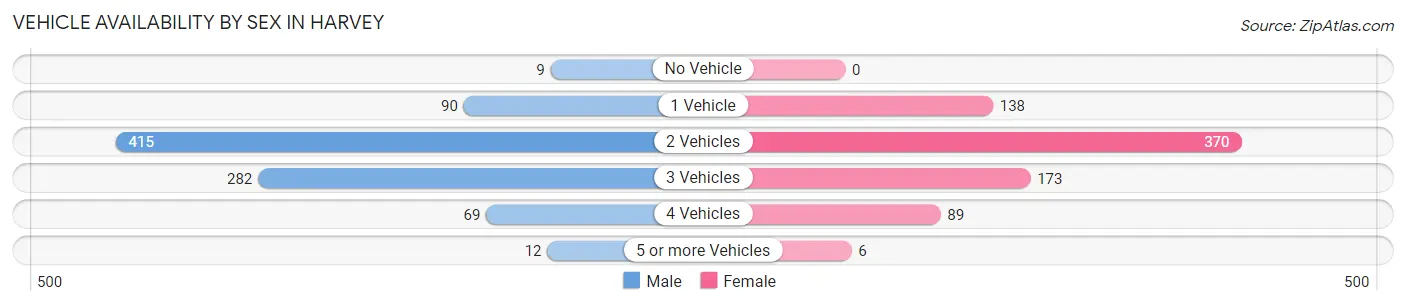
Vehicle Availability by Sex in Harvey
The most prevalent vehicle ownership categories in Harvey are males with 2 vehicles (415, accounting for 47.3%) and females with 2 vehicles (370, making up 53.5%).
| Vehicles Available | Male | Female |
| No Vehicle | 9 (1.0%) | 0 (0.0%) |
| 1 Vehicle | 90 (10.3%) | 138 (17.8%) |
| 2 Vehicles | 415 (47.3%) | 370 (47.7%) |
| 3 Vehicles | 282 (32.2%) | 173 (22.3%) |
| 4 Vehicles | 69 (7.9%) | 89 (11.5%) |
| 5 or more Vehicles | 12 (1.4%) | 6 (0.8%) |
| Total | 877 (100.0%) | 776 (100.0%) |
Commute Time in Harvey
The most frequently occuring commute durations in Harvey are 10 to 14 minutes (554 commuters, 34.8%), 15 to 19 minutes (407 commuters, 25.6%), and 20 to 24 minutes (197 commuters, 12.4%).
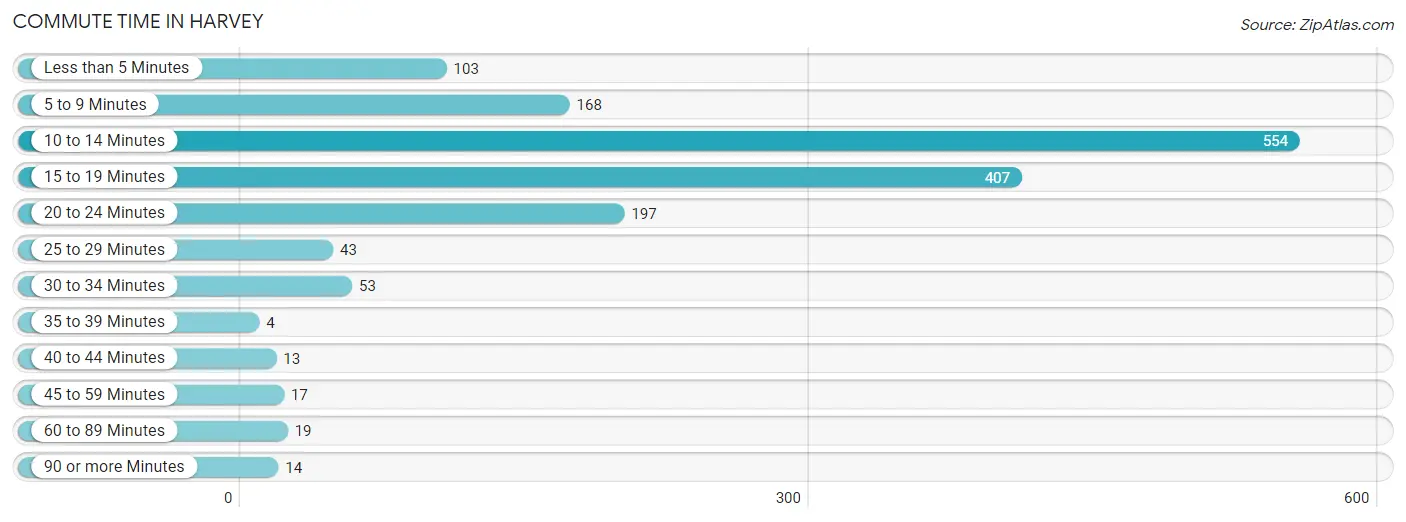
| Commute Time | # Commuters | % Commuters |
| Less than 5 Minutes | 103 | 6.5% |
| 5 to 9 Minutes | 168 | 10.5% |
| 10 to 14 Minutes | 554 | 34.8% |
| 15 to 19 Minutes | 407 | 25.6% |
| 20 to 24 Minutes | 197 | 12.4% |
| 25 to 29 Minutes | 43 | 2.7% |
| 30 to 34 Minutes | 53 | 3.3% |
| 35 to 39 Minutes | 4 | 0.3% |
| 40 to 44 Minutes | 13 | 0.8% |
| 45 to 59 Minutes | 17 | 1.1% |
| 60 to 89 Minutes | 19 | 1.2% |
| 90 or more Minutes | 14 | 0.9% |
Commute Time by Sex in Harvey
The most common commute times in Harvey are 10 to 14 minutes (316 commuters, 36.9%) for males and 10 to 14 minutes (238 commuters, 32.3%) for females.
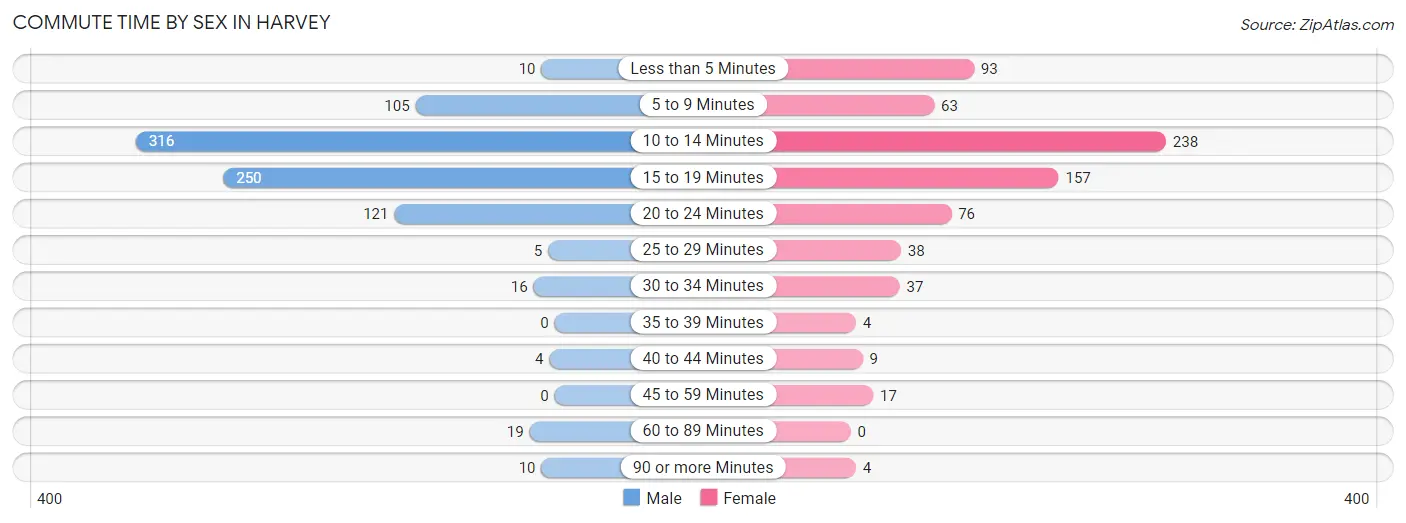
| Commute Time | Male | Female |
| Less than 5 Minutes | 10 (1.2%) | 93 (12.6%) |
| 5 to 9 Minutes | 105 (12.3%) | 63 (8.6%) |
| 10 to 14 Minutes | 316 (36.9%) | 238 (32.3%) |
| 15 to 19 Minutes | 250 (29.2%) | 157 (21.3%) |
| 20 to 24 Minutes | 121 (14.1%) | 76 (10.3%) |
| 25 to 29 Minutes | 5 (0.6%) | 38 (5.2%) |
| 30 to 34 Minutes | 16 (1.9%) | 37 (5.0%) |
| 35 to 39 Minutes | 0 (0.0%) | 4 (0.5%) |
| 40 to 44 Minutes | 4 (0.5%) | 9 (1.2%) |
| 45 to 59 Minutes | 0 (0.0%) | 17 (2.3%) |
| 60 to 89 Minutes | 19 (2.2%) | 0 (0.0%) |
| 90 or more Minutes | 10 (1.2%) | 4 (0.5%) |
Time of Departure to Work by Sex in Harvey
The most frequent times of departure to work in Harvey are 7:00 AM to 7:29 AM (189, 22.1%) for males and 7:30 AM to 7:59 AM (151, 20.5%) for females.
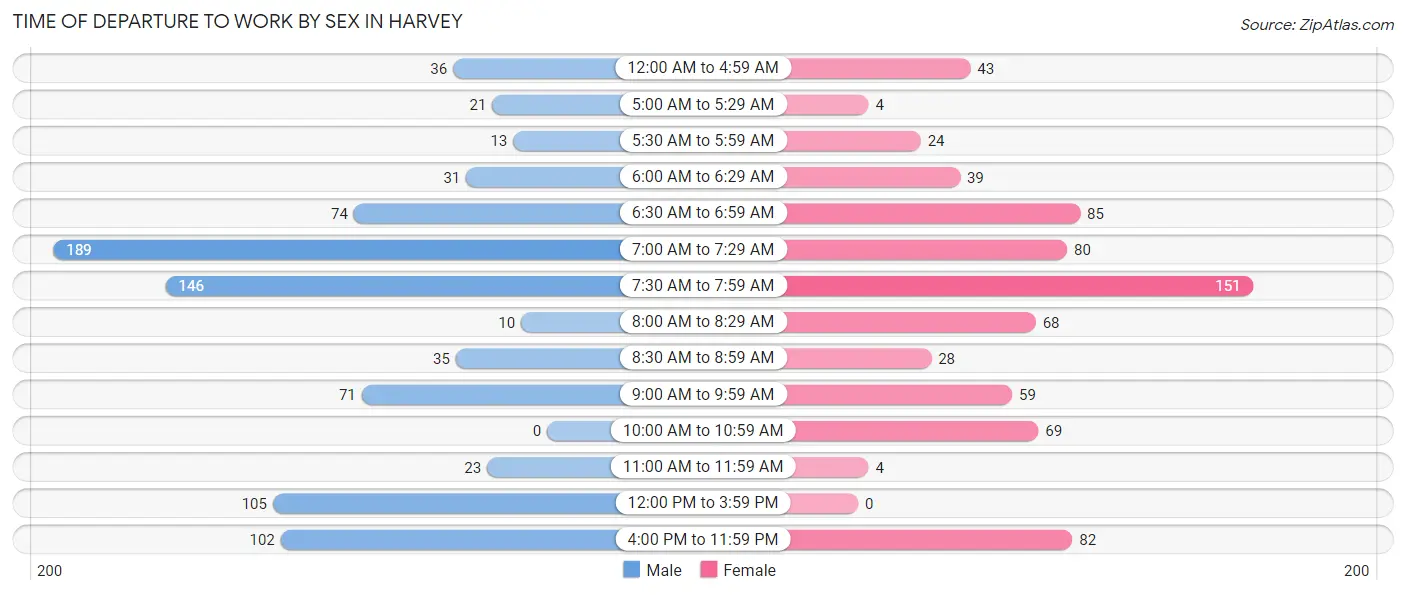
| Time of Departure | Male | Female |
| 12:00 AM to 4:59 AM | 36 (4.2%) | 43 (5.8%) |
| 5:00 AM to 5:29 AM | 21 (2.5%) | 4 (0.5%) |
| 5:30 AM to 5:59 AM | 13 (1.5%) | 24 (3.3%) |
| 6:00 AM to 6:29 AM | 31 (3.6%) | 39 (5.3%) |
| 6:30 AM to 6:59 AM | 74 (8.6%) | 85 (11.6%) |
| 7:00 AM to 7:29 AM | 189 (22.1%) | 80 (10.9%) |
| 7:30 AM to 7:59 AM | 146 (17.1%) | 151 (20.5%) |
| 8:00 AM to 8:29 AM | 10 (1.2%) | 68 (9.2%) |
| 8:30 AM to 8:59 AM | 35 (4.1%) | 28 (3.8%) |
| 9:00 AM to 9:59 AM | 71 (8.3%) | 59 (8.0%) |
| 10:00 AM to 10:59 AM | 0 (0.0%) | 69 (9.4%) |
| 11:00 AM to 11:59 AM | 23 (2.7%) | 4 (0.5%) |
| 12:00 PM to 3:59 PM | 105 (12.3%) | 0 (0.0%) |
| 4:00 PM to 11:59 PM | 102 (11.9%) | 82 (11.1%) |
| Total | 856 (100.0%) | 736 (100.0%) |
Housing Occupancy in Harvey
Occupancy by Ownership in Harvey
Of the total 1,305 dwellings in Harvey, owner-occupied units account for 1,089 (83.5%), while renter-occupied units make up 216 (16.6%).
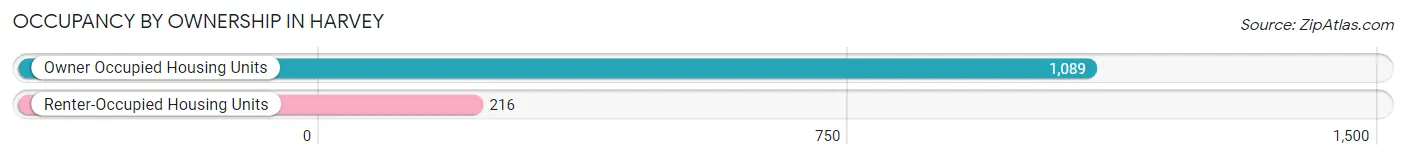
| Occupancy | # Housing Units | % Housing Units |
| Owner Occupied Housing Units | 1,089 | 83.5% |
| Renter-Occupied Housing Units | 216 | 16.6% |
| Total Occupied Housing Units | 1,305 | 100.0% |
Occupancy by Household Size in Harvey
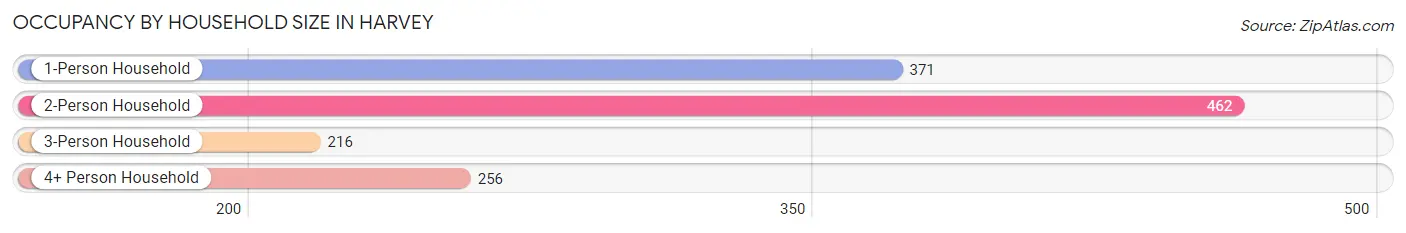
| Household Size | # Housing Units | % Housing Units |
| 1-Person Household | 371 | 28.4% |
| 2-Person Household | 462 | 35.4% |
| 3-Person Household | 216 | 16.6% |
| 4+ Person Household | 256 | 19.6% |
| Total Housing Units | 1,305 | 100.0% |
Occupancy by Ownership by Household Size in Harvey
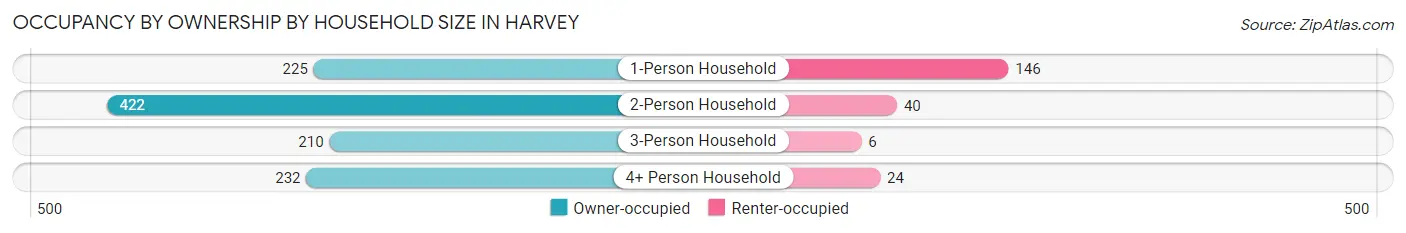
| Household Size | Owner-occupied | Renter-occupied |
| 1-Person Household | 225 (60.7%) | 146 (39.4%) |
| 2-Person Household | 422 (91.3%) | 40 (8.7%) |
| 3-Person Household | 210 (97.2%) | 6 (2.8%) |
| 4+ Person Household | 232 (90.6%) | 24 (9.4%) |
| Total Housing Units | 1,089 (83.5%) | 216 (16.6%) |
Occupancy by Educational Attainment in Harvey
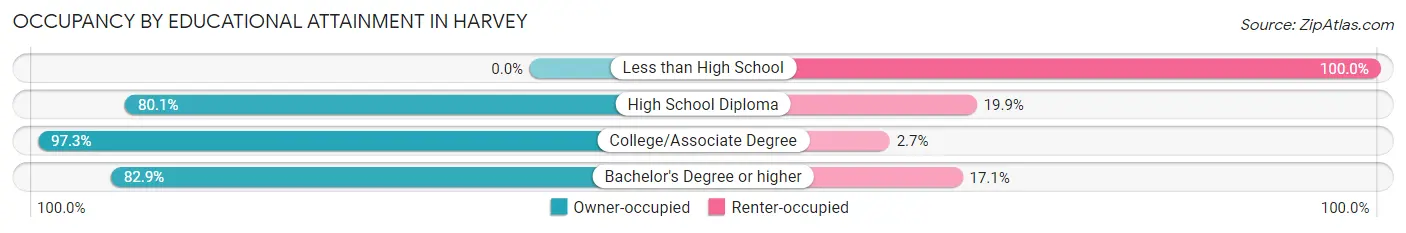
| Household Size | Owner-occupied | Renter-occupied |
| Less than High School | 0 (0.0%) | 53 (100.0%) |
| High School Diploma | 229 (80.1%) | 57 (19.9%) |
| College/Associate Degree | 400 (97.3%) | 11 (2.7%) |
| Bachelor's Degree or higher | 460 (82.9%) | 95 (17.1%) |
Occupancy by Age of Householder in Harvey
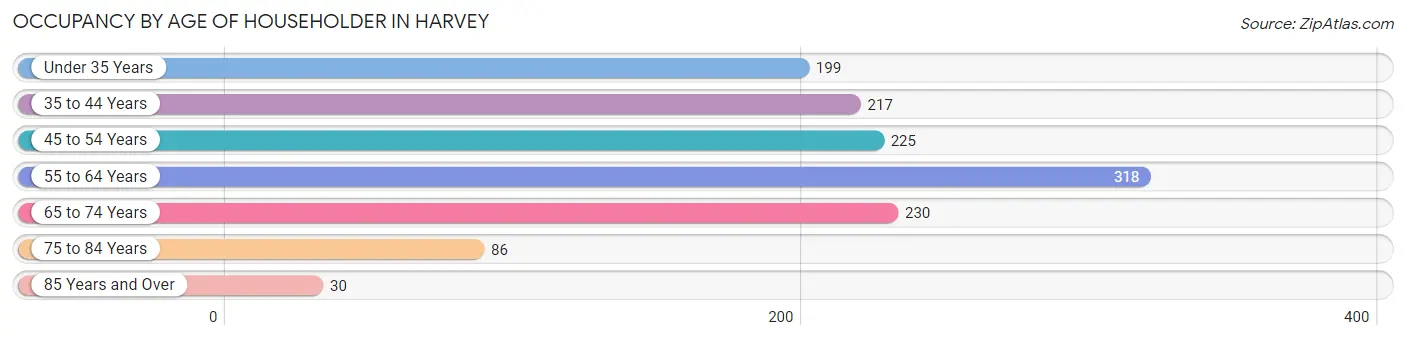
| Age Bracket | # Households | % Households |
| Under 35 Years | 199 | 15.2% |
| 35 to 44 Years | 217 | 16.6% |
| 45 to 54 Years | 225 | 17.2% |
| 55 to 64 Years | 318 | 24.4% |
| 65 to 74 Years | 230 | 17.6% |
| 75 to 84 Years | 86 | 6.6% |
| 85 Years and Over | 30 | 2.3% |
| Total | 1,305 | 100.0% |
Housing Finances in Harvey
Median Income by Occupancy in Harvey
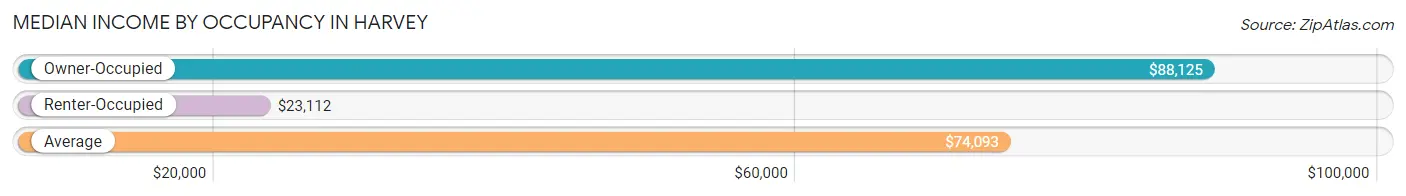
| Occupancy Type | # Households | Median Income |
| Owner-Occupied | 1,089 (83.5%) | $88,125 |
| Renter-Occupied | 216 (16.6%) | $23,112 |
| Average | 1,305 (100.0%) | $74,093 |
Occupancy by Householder Income Bracket in Harvey
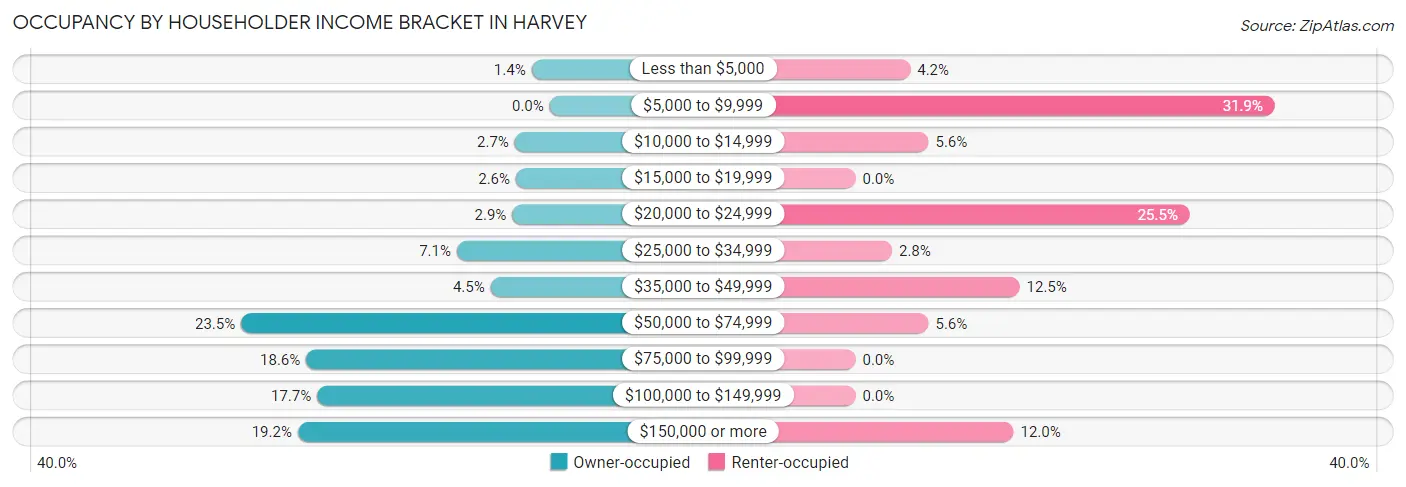
| Income Bracket | Owner-occupied | Renter-occupied |
| Less than $5,000 | 15 (1.4%) | 9 (4.2%) |
| $5,000 to $9,999 | 0 (0.0%) | 69 (31.9%) |
| $10,000 to $14,999 | 29 (2.7%) | 12 (5.6%) |
| $15,000 to $19,999 | 28 (2.6%) | 0 (0.0%) |
| $20,000 to $24,999 | 31 (2.9%) | 55 (25.5%) |
| $25,000 to $34,999 | 77 (7.1%) | 6 (2.8%) |
| $35,000 to $49,999 | 49 (4.5%) | 27 (12.5%) |
| $50,000 to $74,999 | 256 (23.5%) | 12 (5.6%) |
| $75,000 to $99,999 | 202 (18.5%) | 0 (0.0%) |
| $100,000 to $149,999 | 193 (17.7%) | 0 (0.0%) |
| $150,000 or more | 209 (19.2%) | 26 (12.0%) |
| Total | 1,089 (100.0%) | 216 (100.0%) |
Monthly Housing Cost Tiers in Harvey
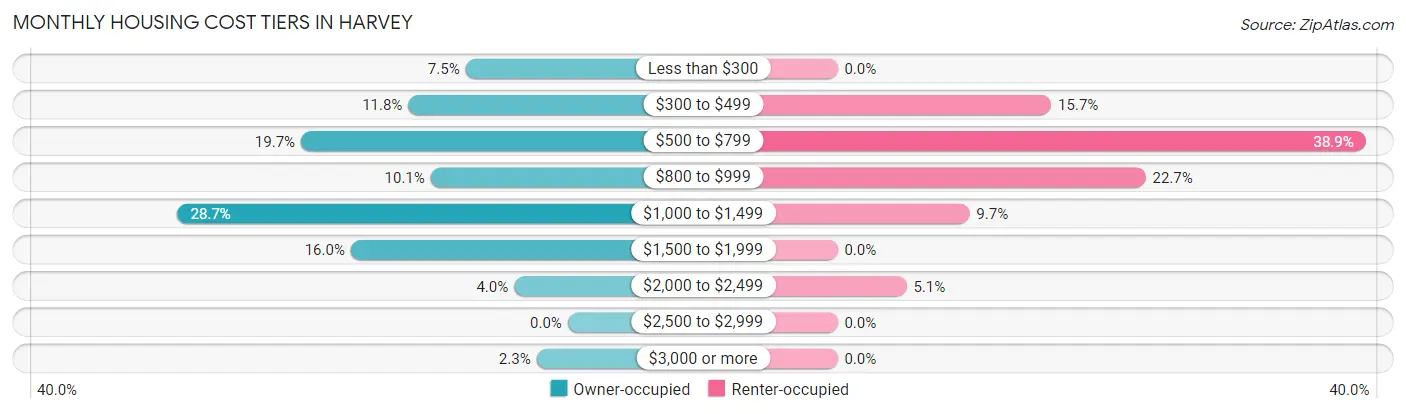
| Monthly Cost | Owner-occupied | Renter-occupied |
| Less than $300 | 82 (7.5%) | 0 (0.0%) |
| $300 to $499 | 128 (11.7%) | 34 (15.7%) |
| $500 to $799 | 214 (19.7%) | 84 (38.9%) |
| $800 to $999 | 110 (10.1%) | 49 (22.7%) |
| $1,000 to $1,499 | 313 (28.7%) | 21 (9.7%) |
| $1,500 to $1,999 | 174 (16.0%) | 0 (0.0%) |
| $2,000 to $2,499 | 43 (4.0%) | 11 (5.1%) |
| $2,500 to $2,999 | 0 (0.0%) | 0 (0.0%) |
| $3,000 or more | 25 (2.3%) | 0 (0.0%) |
| Total | 1,089 (100.0%) | 216 (100.0%) |
Physical Housing Characteristics in Harvey
Housing Structures in Harvey
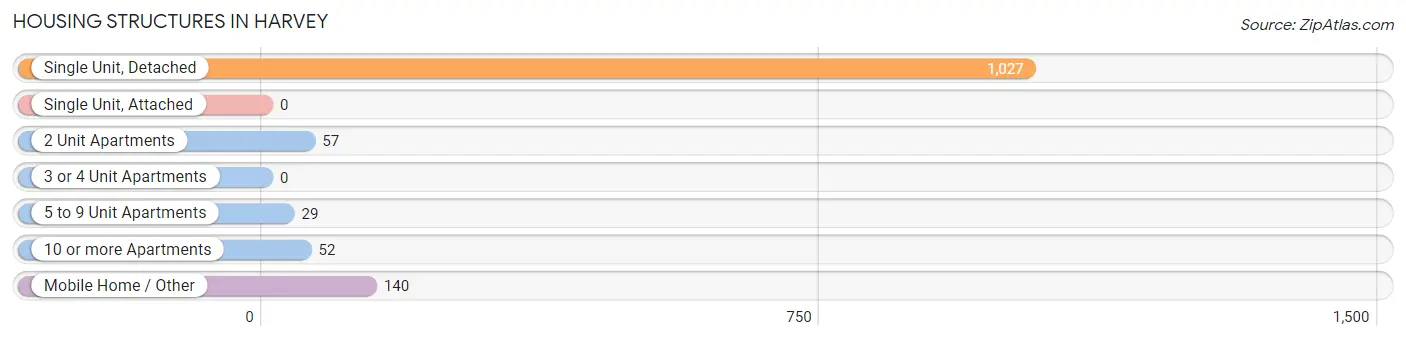
| Structure Type | # Housing Units | % Housing Units |
| Single Unit, Detached | 1,027 | 78.7% |
| Single Unit, Attached | 0 | 0.0% |
| 2 Unit Apartments | 57 | 4.4% |
| 3 or 4 Unit Apartments | 0 | 0.0% |
| 5 to 9 Unit Apartments | 29 | 2.2% |
| 10 or more Apartments | 52 | 4.0% |
| Mobile Home / Other | 140 | 10.7% |
| Total | 1,305 | 100.0% |
Housing Structures by Occupancy in Harvey
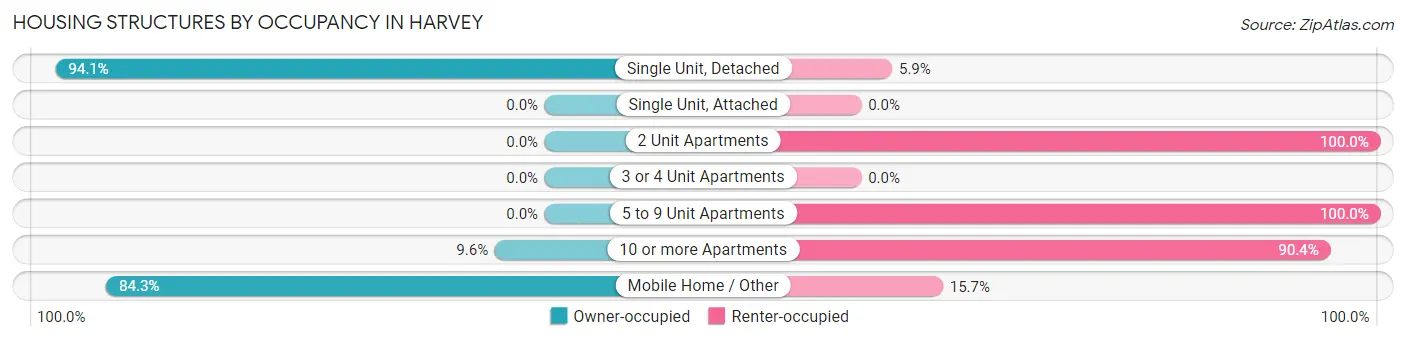
| Structure Type | Owner-occupied | Renter-occupied |
| Single Unit, Detached | 966 (94.1%) | 61 (5.9%) |
| Single Unit, Attached | 0 (0.0%) | 0 (0.0%) |
| 2 Unit Apartments | 0 (0.0%) | 57 (100.0%) |
| 3 or 4 Unit Apartments | 0 (0.0%) | 0 (0.0%) |
| 5 to 9 Unit Apartments | 0 (0.0%) | 29 (100.0%) |
| 10 or more Apartments | 5 (9.6%) | 47 (90.4%) |
| Mobile Home / Other | 118 (84.3%) | 22 (15.7%) |
| Total | 1,089 (83.5%) | 216 (16.6%) |
Housing Structures by Number of Rooms in Harvey
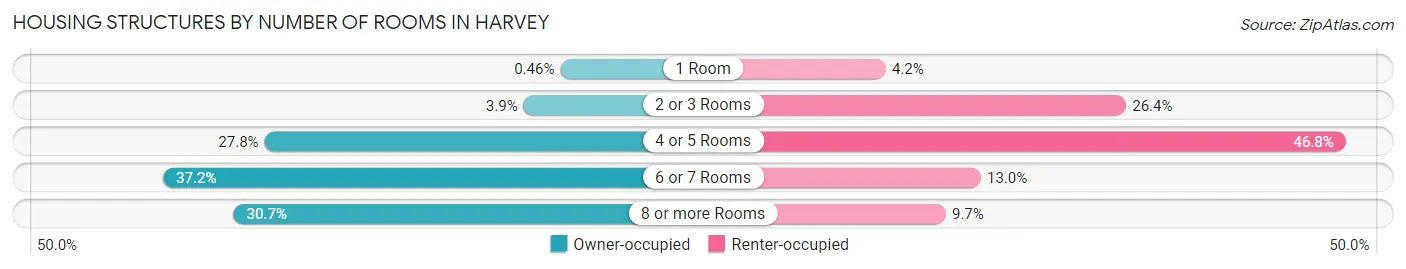
| Number of Rooms | Owner-occupied | Renter-occupied |
| 1 Room | 5 (0.5%) | 9 (4.2%) |
| 2 or 3 Rooms | 42 (3.9%) | 57 (26.4%) |
| 4 or 5 Rooms | 303 (27.8%) | 101 (46.8%) |
| 6 or 7 Rooms | 405 (37.2%) | 28 (13.0%) |
| 8 or more Rooms | 334 (30.7%) | 21 (9.7%) |
| Total | 1,089 (100.0%) | 216 (100.0%) |
Housing Structure by Heating Type in Harvey
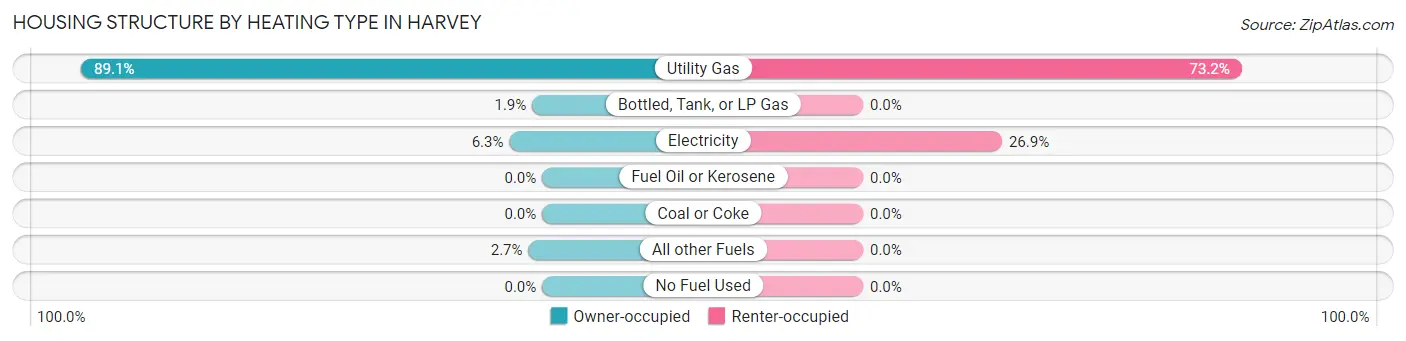
| Heating Type | Owner-occupied | Renter-occupied |
| Utility Gas | 970 (89.1%) | 158 (73.2%) |
| Bottled, Tank, or LP Gas | 21 (1.9%) | 0 (0.0%) |
| Electricity | 69 (6.3%) | 58 (26.9%) |
| Fuel Oil or Kerosene | 0 (0.0%) | 0 (0.0%) |
| Coal or Coke | 0 (0.0%) | 0 (0.0%) |
| All other Fuels | 29 (2.7%) | 0 (0.0%) |
| No Fuel Used | 0 (0.0%) | 0 (0.0%) |
| Total | 1,089 (100.0%) | 216 (100.0%) |
Household Vehicle Usage in Harvey
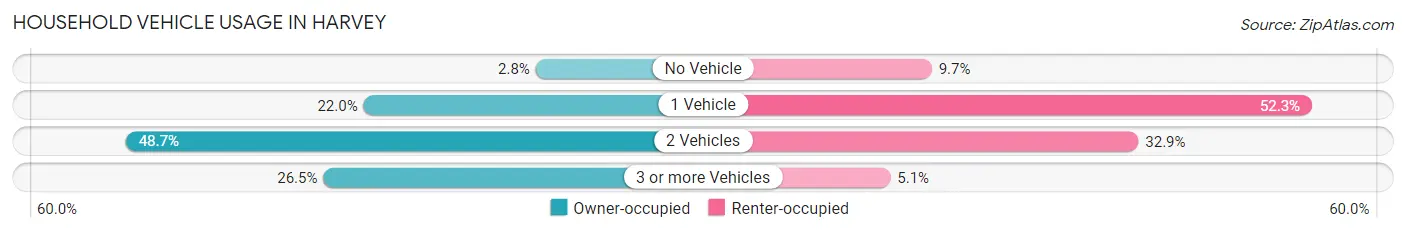
| Vehicles per Household | Owner-occupied | Renter-occupied |
| No Vehicle | 30 (2.8%) | 21 (9.7%) |
| 1 Vehicle | 240 (22.0%) | 113 (52.3%) |
| 2 Vehicles | 530 (48.7%) | 71 (32.9%) |
| 3 or more Vehicles | 289 (26.5%) | 11 (5.1%) |
| Total | 1,089 (100.0%) | 216 (100.0%) |
Real Estate & Mortgages in Harvey
Real Estate and Mortgage Overview in Harvey
| Characteristic | Without Mortgage | With Mortgage |
| Housing Units | 389 | 700 |
| Median Property Value | $194,500 | $231,000 |
| Median Household Income | $64,653 | $180 |
| Monthly Housing Costs | $481 | $25 |
| Real Estate Taxes | $1,392 | $72 |
Property Value by Mortgage Status in Harvey
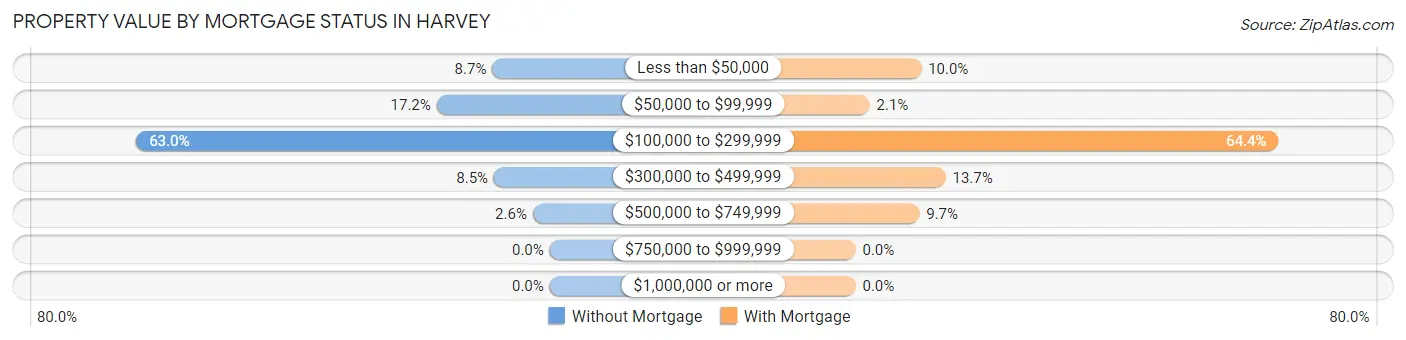
| Property Value | Without Mortgage | With Mortgage |
| Less than $50,000 | 34 (8.7%) | 70 (10.0%) |
| $50,000 to $99,999 | 67 (17.2%) | 15 (2.1%) |
| $100,000 to $299,999 | 245 (63.0%) | 451 (64.4%) |
| $300,000 to $499,999 | 33 (8.5%) | 96 (13.7%) |
| $500,000 to $749,999 | 10 (2.6%) | 68 (9.7%) |
| $750,000 to $999,999 | 0 (0.0%) | 0 (0.0%) |
| $1,000,000 or more | 0 (0.0%) | 0 (0.0%) |
| Total | 389 (100.0%) | 700 (100.0%) |
Household Income by Mortgage Status in Harvey
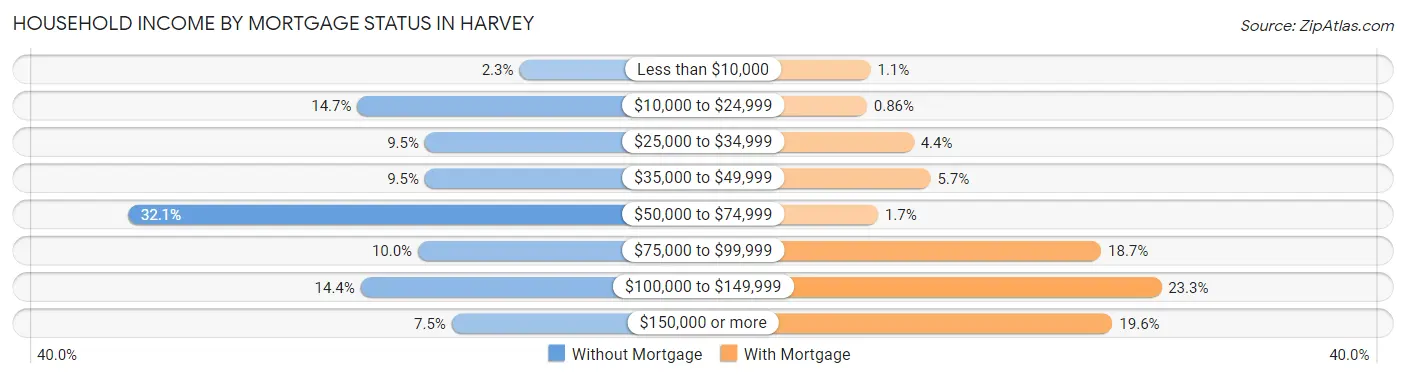
| Household Income | Without Mortgage | With Mortgage |
| Less than $10,000 | 9 (2.3%) | 8 (1.1%) |
| $10,000 to $24,999 | 57 (14.6%) | 6 (0.9%) |
| $25,000 to $34,999 | 37 (9.5%) | 31 (4.4%) |
| $35,000 to $49,999 | 37 (9.5%) | 40 (5.7%) |
| $50,000 to $74,999 | 125 (32.1%) | 12 (1.7%) |
| $75,000 to $99,999 | 39 (10.0%) | 131 (18.7%) |
| $100,000 to $149,999 | 56 (14.4%) | 163 (23.3%) |
| $150,000 or more | 29 (7.5%) | 137 (19.6%) |
| Total | 389 (100.0%) | 700 (100.0%) |
Property Value to Household Income Ratio in Harvey
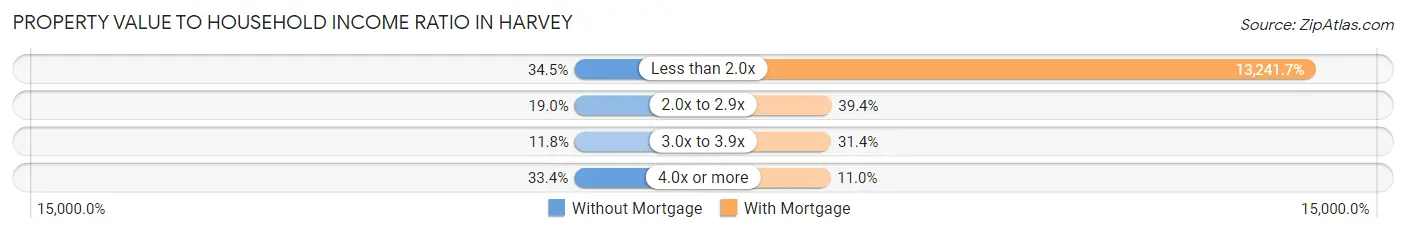
| Value-to-Income Ratio | Without Mortgage | With Mortgage |
| Less than 2.0x | 134 (34.4%) | 92,692 (13,241.7%) |
| 2.0x to 2.9x | 74 (19.0%) | 276 (39.4%) |
| 3.0x to 3.9x | 46 (11.8%) | 220 (31.4%) |
| 4.0x or more | 130 (33.4%) | 77 (11.0%) |
| Total | 389 (100.0%) | 700 (100.0%) |
Real Estate Taxes by Mortgage Status in Harvey
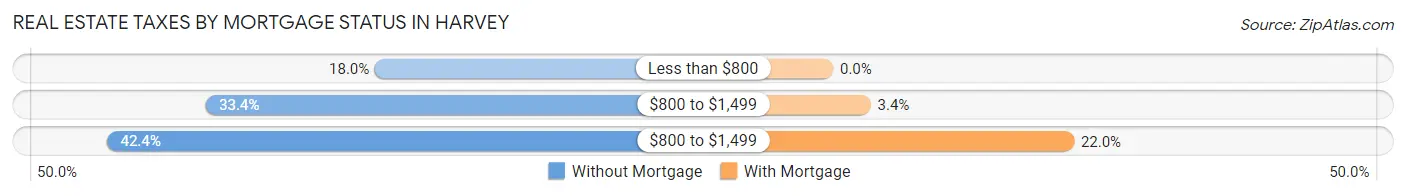
| Property Taxes | Without Mortgage | With Mortgage |
| Less than $800 | 70 (18.0%) | 0 (0.0%) |
| $800 to $1,499 | 130 (33.4%) | 24 (3.4%) |
| $800 to $1,499 | 165 (42.4%) | 154 (22.0%) |
| Total | 389 (100.0%) | 700 (100.0%) |
Health & Disability in Harvey
Health Insurance Coverage by Age in Harvey
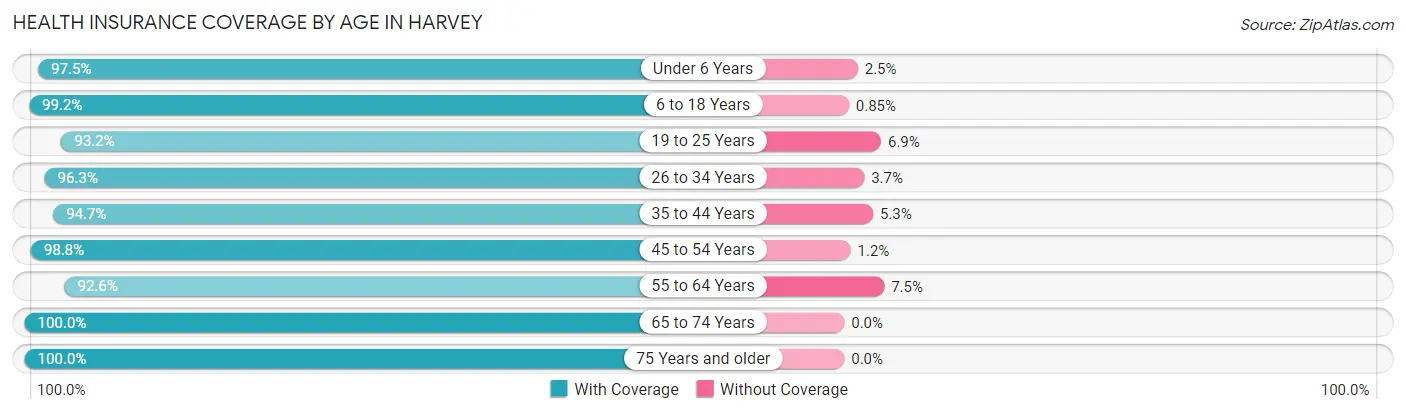
| Age Bracket | With Coverage | Without Coverage |
| Under 6 Years | 194 (97.5%) | 5 (2.5%) |
| 6 to 18 Years | 581 (99.2%) | 5 (0.9%) |
| 19 to 25 Years | 299 (93.1%) | 22 (6.9%) |
| 26 to 34 Years | 311 (96.3%) | 12 (3.7%) |
| 35 to 44 Years | 461 (94.7%) | 26 (5.3%) |
| 45 to 54 Years | 424 (98.8%) | 5 (1.2%) |
| 55 to 64 Years | 447 (92.5%) | 36 (7.4%) |
| 65 to 74 Years | 331 (100.0%) | 0 (0.0%) |
| 75 Years and older | 176 (100.0%) | 0 (0.0%) |
| Total | 3,224 (96.7%) | 111 (3.3%) |
Health Insurance Coverage by Citizenship Status in Harvey
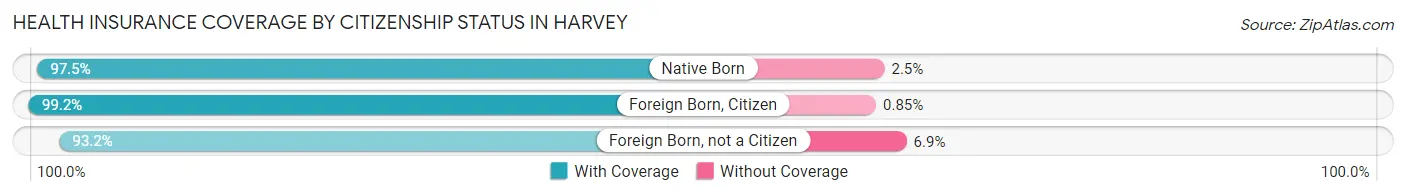
| Citizenship Status | With Coverage | Without Coverage |
| Native Born | 194 (97.5%) | 5 (2.5%) |
| Foreign Born, Citizen | 581 (99.2%) | 5 (0.9%) |
| Foreign Born, not a Citizen | 299 (93.1%) | 22 (6.9%) |
Health Insurance Coverage by Household Income in Harvey
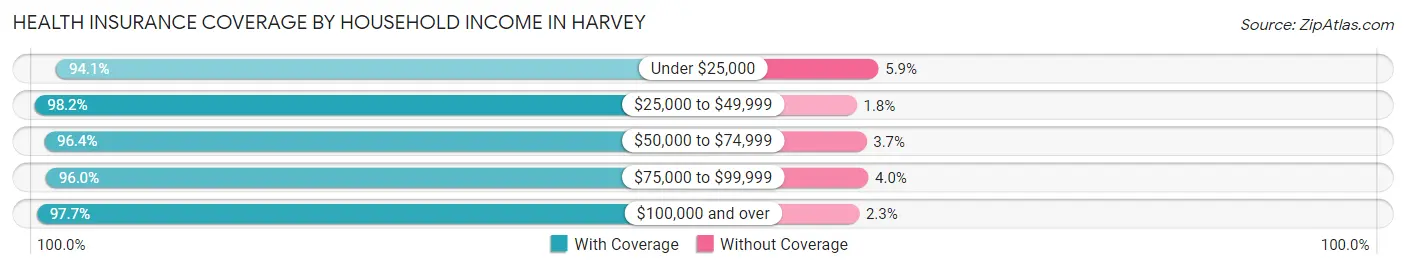
| Household Income | With Coverage | Without Coverage |
| Under $25,000 | 351 (94.1%) | 22 (5.9%) |
| $25,000 to $49,999 | 323 (98.2%) | 6 (1.8%) |
| $50,000 to $74,999 | 660 (96.4%) | 25 (3.6%) |
| $75,000 to $99,999 | 625 (96.0%) | 26 (4.0%) |
| $100,000 and over | 1,241 (97.7%) | 29 (2.3%) |
Public vs Private Health Insurance Coverage by Age in Harvey
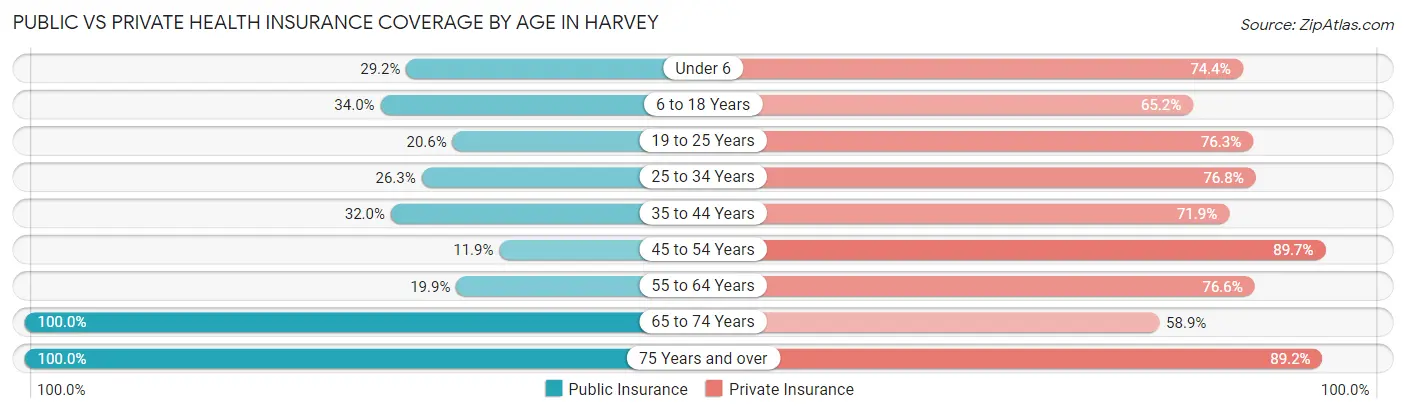
| Age Bracket | Public Insurance | Private Insurance |
| Under 6 | 58 (29.1%) | 148 (74.4%) |
| 6 to 18 Years | 199 (34.0%) | 382 (65.2%) |
| 19 to 25 Years | 66 (20.6%) | 245 (76.3%) |
| 25 to 34 Years | 85 (26.3%) | 248 (76.8%) |
| 35 to 44 Years | 156 (32.0%) | 350 (71.9%) |
| 45 to 54 Years | 51 (11.9%) | 385 (89.7%) |
| 55 to 64 Years | 96 (19.9%) | 370 (76.6%) |
| 65 to 74 Years | 331 (100.0%) | 195 (58.9%) |
| 75 Years and over | 176 (100.0%) | 157 (89.2%) |
| Total | 1,218 (36.5%) | 2,480 (74.4%) |
Disability Status by Sex by Age in Harvey
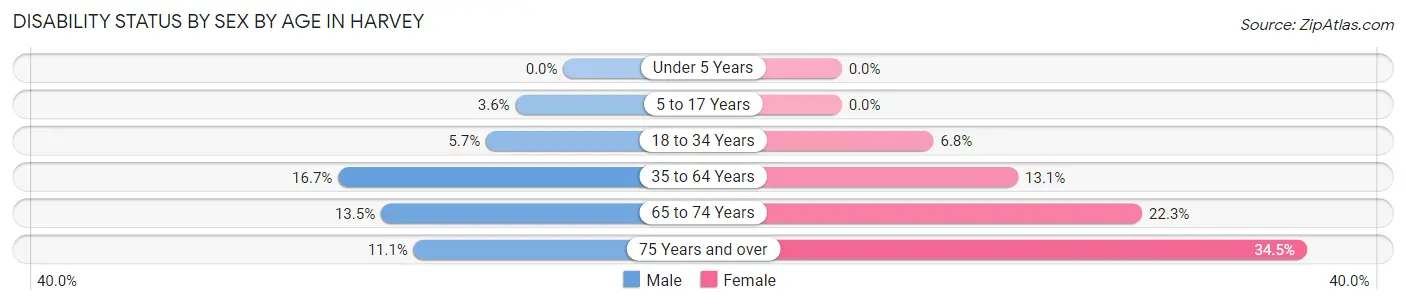
| Age Bracket | Male | Female |
| Under 5 Years | 0 (0.0%) | 0 (0.0%) |
| 5 to 17 Years | 12 (3.6%) | 0 (0.0%) |
| 18 to 34 Years | 22 (5.7%) | 22 (6.8%) |
| 35 to 64 Years | 110 (16.7%) | 97 (13.1%) |
| 65 to 74 Years | 26 (13.5%) | 31 (22.3%) |
| 75 Years and over | 7 (11.1%) | 39 (34.5%) |
Disability Class by Sex by Age in Harvey
Disability Class: Hearing Difficulty
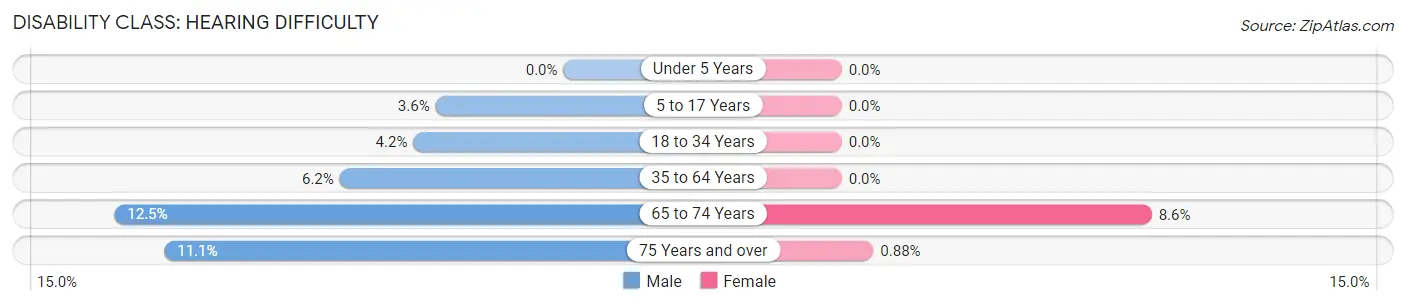
| Age Bracket | Male | Female |
| Under 5 Years | 0 (0.0%) | 0 (0.0%) |
| 5 to 17 Years | 12 (3.6%) | 0 (0.0%) |
| 18 to 34 Years | 16 (4.2%) | 0 (0.0%) |
| 35 to 64 Years | 41 (6.2%) | 0 (0.0%) |
| 65 to 74 Years | 24 (12.5%) | 12 (8.6%) |
| 75 Years and over | 7 (11.1%) | 1 (0.9%) |
Disability Class: Vision Difficulty
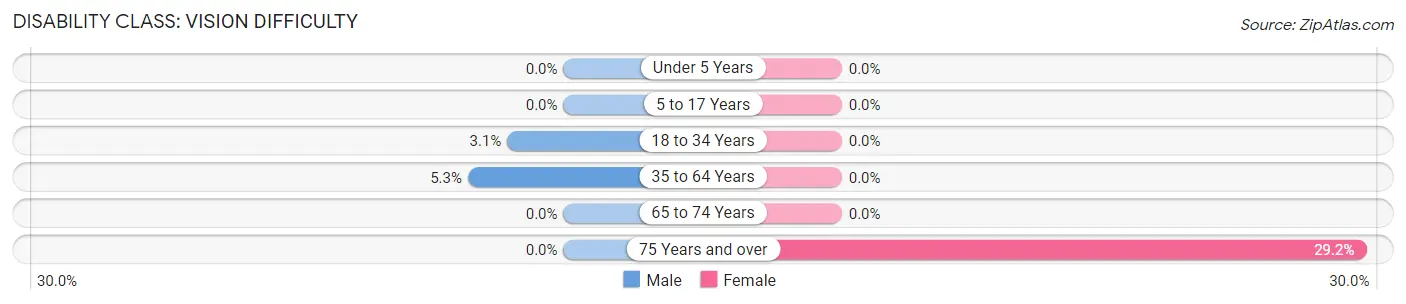
| Age Bracket | Male | Female |
| Under 5 Years | 0 (0.0%) | 0 (0.0%) |
| 5 to 17 Years | 0 (0.0%) | 0 (0.0%) |
| 18 to 34 Years | 12 (3.1%) | 0 (0.0%) |
| 35 to 64 Years | 35 (5.3%) | 0 (0.0%) |
| 65 to 74 Years | 0 (0.0%) | 0 (0.0%) |
| 75 Years and over | 0 (0.0%) | 33 (29.2%) |
Disability Class: Cognitive Difficulty
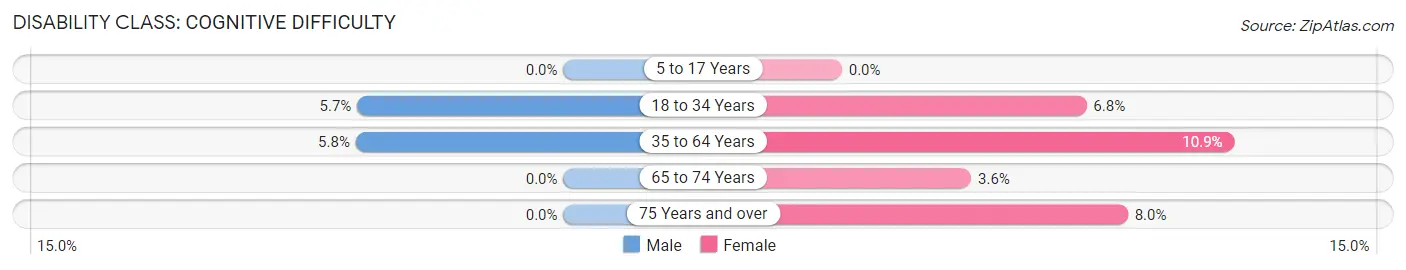
| Age Bracket | Male | Female |
| 5 to 17 Years | 0 (0.0%) | 0 (0.0%) |
| 18 to 34 Years | 22 (5.7%) | 22 (6.8%) |
| 35 to 64 Years | 38 (5.8%) | 81 (10.9%) |
| 65 to 74 Years | 0 (0.0%) | 5 (3.6%) |
| 75 Years and over | 0 (0.0%) | 9 (8.0%) |
Disability Class: Ambulatory Difficulty
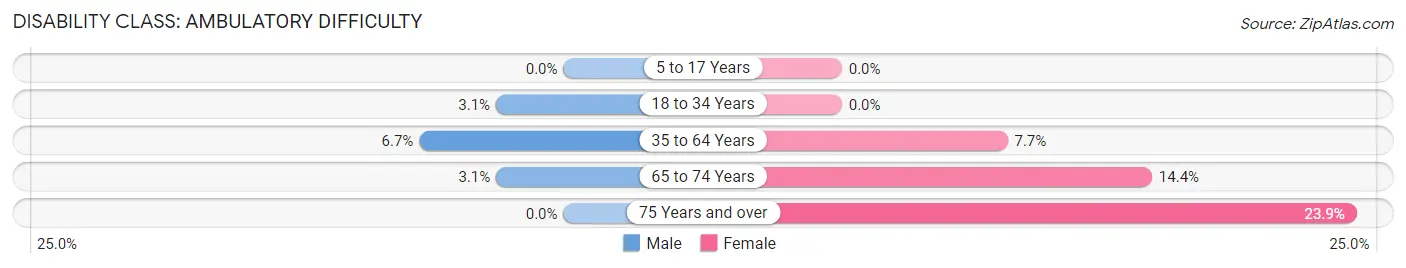
| Age Bracket | Male | Female |
| 5 to 17 Years | 0 (0.0%) | 0 (0.0%) |
| 18 to 34 Years | 12 (3.1%) | 0 (0.0%) |
| 35 to 64 Years | 44 (6.7%) | 57 (7.7%) |
| 65 to 74 Years | 6 (3.1%) | 20 (14.4%) |
| 75 Years and over | 0 (0.0%) | 27 (23.9%) |
Disability Class: Self-Care Difficulty
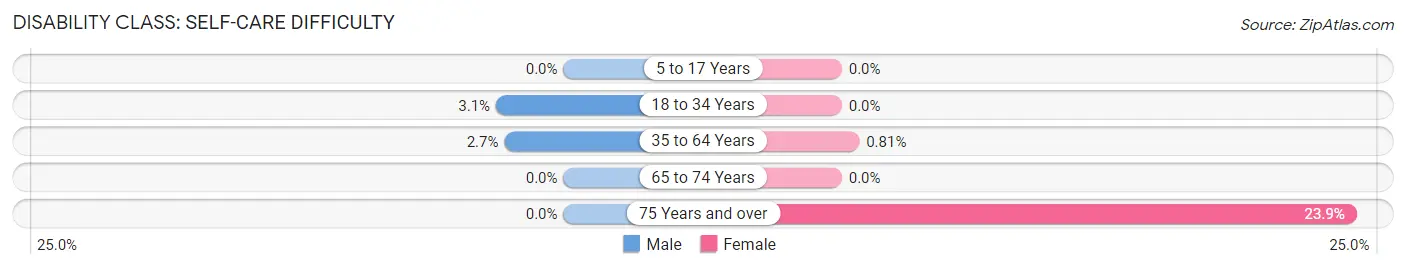
| Age Bracket | Male | Female |
| 5 to 17 Years | 0 (0.0%) | 0 (0.0%) |
| 18 to 34 Years | 12 (3.1%) | 0 (0.0%) |
| 35 to 64 Years | 18 (2.7%) | 6 (0.8%) |
| 65 to 74 Years | 0 (0.0%) | 0 (0.0%) |
| 75 Years and over | 0 (0.0%) | 27 (23.9%) |
Technology Access in Harvey
Computing Device Access in Harvey
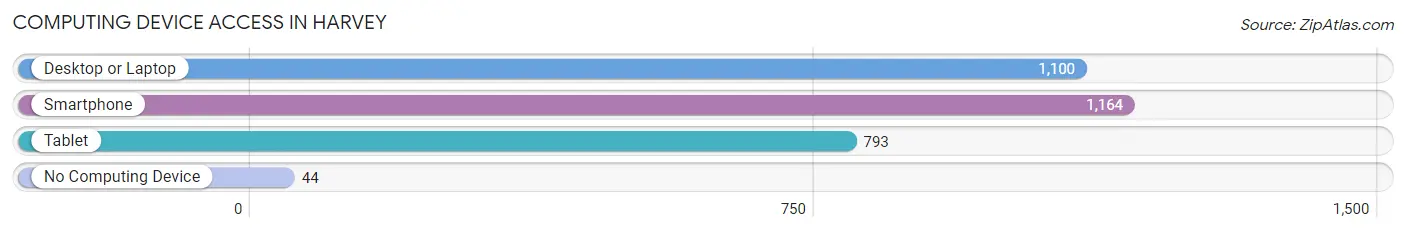
| Device Type | # Households | % Households |
| Desktop or Laptop | 1,100 | 84.3% |
| Smartphone | 1,164 | 89.2% |
| Tablet | 793 | 60.8% |
| No Computing Device | 44 | 3.4% |
| Total | 1,305 | 100.0% |
Internet Access in Harvey
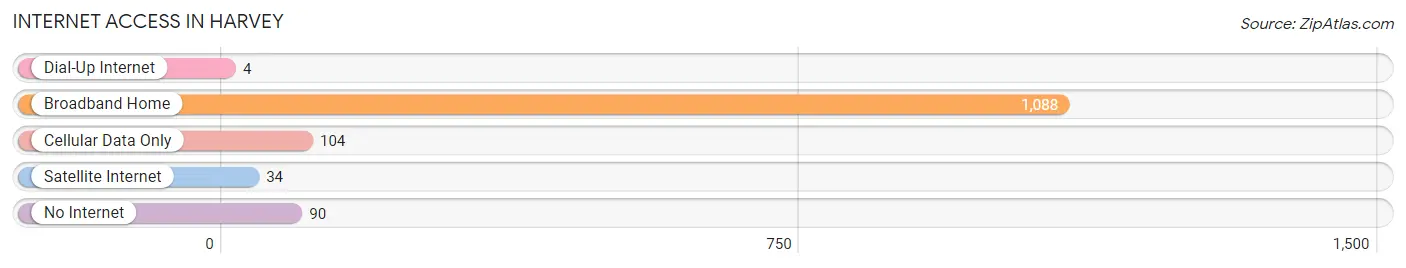
| Internet Type | # Households | % Households |
| Dial-Up Internet | 4 | 0.3% |
| Broadband Home | 1,088 | 83.4% |
| Cellular Data Only | 104 | 8.0% |
| Satellite Internet | 34 | 2.6% |
| No Internet | 90 | 6.9% |
| Total | 1,305 | 100.0% |
Harvey Summary
Harvey is a city located in the Upper Peninsula of Michigan, United States. It is the county seat of Marquette County and is located on the shores of Lake Superior. The population was 2,541 at the 2010 census.
History
Harvey was founded in 1871 by William Harvey, a lumberman from Wisconsin. He named the city after himself and it was incorporated as a village in 1887. The city was originally a lumber town, but it soon became a center for iron ore mining. The city was also home to a large paper mill, which was built in the early 1900s.
The city was the site of a major labor strike in 1913, when the workers of the paper mill went on strike for better wages and working conditions. The strike lasted for several months and was eventually settled in favor of the workers.
Geography
Harvey is located at 46°37′N 87°37′W (46.619, -87.619). According to the United States Census Bureau, the city has a total area of 4.2 square miles (10.8 km2), of which 4.1 square miles (10.6 km2) is land and 0.1 square miles (0.2 km2) (2.17%) is water.
Economy
Harvey’s economy is largely based on the mining and lumber industries. The city is home to several large mining companies, including Cliffs Natural Resources, which operates several iron ore mines in the area. The city is also home to several lumber mills, which produce lumber for the local and regional markets.
The city is also home to several small businesses, including restaurants, retail stores, and service providers. The city is also home to a large paper mill, which produces paper products for the local and regional markets.
Demographics
As of the census of 2010, there were 2,541 people, 1,093 households, and 645 families residing in the city. The population density was 617.2 people per square mile (238.2/km2). There were 1,223 housing units at an average density of 298.3 per square mile (115.2/km2). The racial makeup of the city was 97.2% White, 0.2% African American, 0.7% Native American, 0.3% Asian, 0.1% Pacific Islander, 0.3% from other races, and 1.3% from two or more races. Hispanic or Latino of any race were 1.2% of the population.
There were 1,093 households, out of which 25.2% had children under the age of 18 living with them, 43.2% were married couples living together, 11.7% had a female householder with no husband present, and 40.2% were non-families. 34.2% of all households were made up of individuals, and 14.2% had someone living alone who was 65 years of age or older. The average household size was 2.27 and the average family size was 2.90.
In the city, the population was spread out, with 22.2% under the age of 18, 8.2% from 18 to 24, 25.2% from 25 to 44, 25.7% from 45 to 64, and 18.7% who were 65 years of age or older. The median age was 40 years. For every 100 females, there were 91.2 males. For every 100 females age 18 and over, there were 88.2 males.
The median income for a household in the city was $31,250, and the median income for a family was $41,250. Males had a median income of $31,250 versus $21,250 for females. The per capita income for the city was $17,845. About 10.2% of families and 13.2% of the population were below the poverty line, including 17.2% of those under age 18 and 8.2% of those age 65 or over.
Common Questions
What is the Total Population of Harvey?
Total Population of Harvey is 3,335.
What is the Total Male Population of Harvey?
Total Male Population of Harvey is 1,715.
What is the Total Female Population of Harvey?
Total Female Population of Harvey is 1,620.
What is the Ratio of Males per 100 Females in Harvey?
There are 105.86 Males per 100 Females in Harvey.
What is the Ratio of Females per 100 Males in Harvey?
There are 94.46 Females per 100 Males in Harvey.
What is the Median Population Age in Harvey?
Median Population Age in Harvey is 39.8 Years.
What is the Average Family Size in Harvey
Average Family Size in Harvey is 3.0 People.
What is the Average Household Size in Harvey
Average Household Size in Harvey is 2.5 People.
What is Per Capita Income in Harvey?
Per Capita income in Harvey is $36,221.
What is the Median Family Income in Harvey?
Median Family Income in Harvey is $90,242.
What is the Median Household income in Harvey?
Median Household Income in Harvey is $74,093.
What is Income or Wage Gap in Harvey?
Income or Wage Gap in Harvey is 8.4%.
Women in Harvey earn 91.6 cents for every dollar earned by a man.
What is Inequality or Gini Index in Harvey?
Inequality or Gini Index in Harvey is 0.42.
How Large is the Labor Force in Harvey?
There are 1,753 People in the Labor Forcein in Harvey.
What is the Percentage of People in the Labor Force in Harvey?
66.1% of People are in the Labor Force in Harvey.
What is the Unemployment Rate in Harvey?
Unemployment Rate in Harvey is 3.8%.