Cities with the Most Immigrants from Romania in New York
RELATED REPORTS & OPTIONS
Romania
New York
Compare Cities
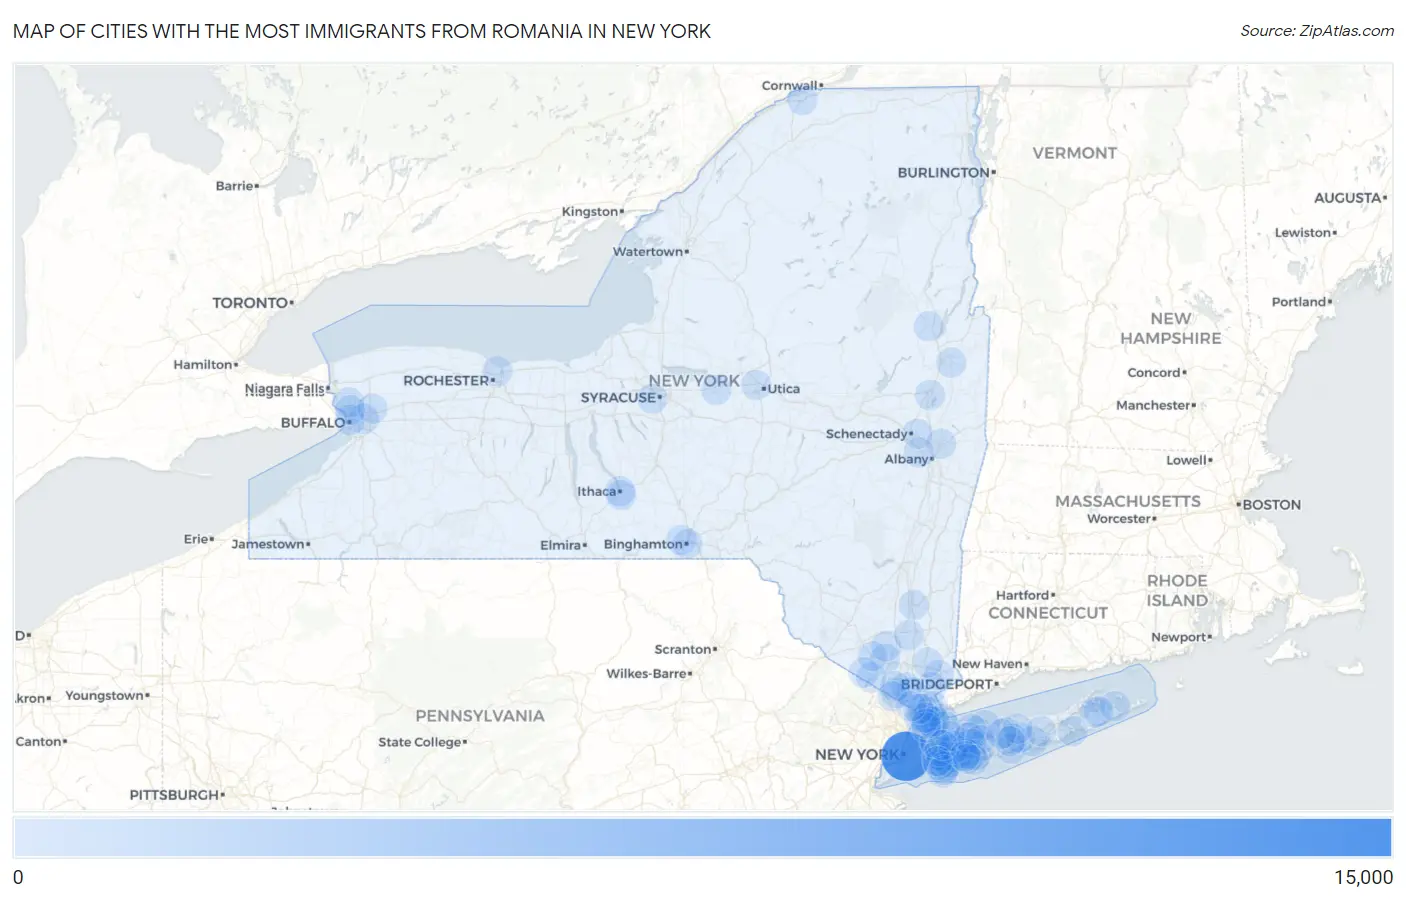
Map of Cities with the Most Immigrants from Romania in New York
0
15,000
Cities with the Most Immigrants from Romania in New York
| City | Romania | vs State | vs National | |
| 1. | New York | 12,802 | 19,252(66.50%)#1 | 164,406(7.79%)#1 |
| 2. | Yonkers | 322 | 19,252(1.67%)#2 | 164,406(0.20%)#55 |
| 3. | Cheektowaga | 248 | 19,252(1.29%)#3 | 164,406(0.15%)#80 |
| 4. | New Rochelle | 189 | 19,252(0.98%)#4 | 164,406(0.11%)#110 |
| 5. | Valley Cottage | 181 | 19,252(0.94%)#5 | 164,406(0.11%)#117 |
| 6. | Hicksville | 168 | 19,252(0.87%)#6 | 164,406(0.10%)#127 |
| 7. | Ithaca | 115 | 19,252(0.60%)#7 | 164,406(0.07%)#216 |
| 8. | Buffalo | 113 | 19,252(0.59%)#8 | 164,406(0.07%)#221 |
| 9. | Chappaqua | 106 | 19,252(0.55%)#9 | 164,406(0.06%)#236 |
| 10. | New City | 99 | 19,252(0.51%)#10 | 164,406(0.06%)#256 |
| 11. | Great Neck | 97 | 19,252(0.50%)#11 | 164,406(0.06%)#267 |
| 12. | Tuckahoe | 94 | 19,252(0.49%)#12 | 164,406(0.06%)#277 |
| 13. | Scarsdale | 88 | 19,252(0.46%)#13 | 164,406(0.05%)#295 |
| 14. | North New Hyde Park | 79 | 19,252(0.41%)#14 | 164,406(0.05%)#337 |
| 15. | Levittown | 74 | 19,252(0.38%)#15 | 164,406(0.05%)#358 |
| 16. | Lynbrook | 73 | 19,252(0.38%)#16 | 164,406(0.04%)#365 |
| 17. | Franklin Square | 72 | 19,252(0.37%)#17 | 164,406(0.04%)#368 |
| 18. | Monsey | 71 | 19,252(0.37%)#18 | 164,406(0.04%)#377 |
| 19. | East Hills | 70 | 19,252(0.36%)#19 | 164,406(0.04%)#384 |
| 20. | Bayport | 67 | 19,252(0.35%)#20 | 164,406(0.04%)#409 |
| 21. | Larchmont | 66 | 19,252(0.34%)#21 | 164,406(0.04%)#419 |
| 22. | Tonawanda | 63 | 19,252(0.33%)#22 | 164,406(0.04%)#432 |
| 23. | Massena | 63 | 19,252(0.33%)#23 | 164,406(0.04%)#435 |
| 24. | Long Beach | 59 | 19,252(0.31%)#24 | 164,406(0.04%)#458 |
| 25. | Bedford Hills | 59 | 19,252(0.31%)#25 | 164,406(0.04%)#461 |
| 26. | Plainview | 55 | 19,252(0.29%)#26 | 164,406(0.03%)#493 |
| 27. | Kiryas Joel | 53 | 19,252(0.28%)#27 | 164,406(0.03%)#504 |
| 28. | Shirley | 53 | 19,252(0.28%)#28 | 164,406(0.03%)#506 |
| 29. | Rockville Centre | 53 | 19,252(0.28%)#29 | 164,406(0.03%)#507 |
| 30. | Ardsley | 52 | 19,252(0.27%)#30 | 164,406(0.03%)#525 |
| 31. | Elmont | 50 | 19,252(0.26%)#31 | 164,406(0.03%)#547 |
| 32. | Lake Grove | 50 | 19,252(0.26%)#32 | 164,406(0.03%)#550 |
| 33. | Medford | 48 | 19,252(0.25%)#33 | 164,406(0.03%)#571 |
| 34. | Holtsville | 46 | 19,252(0.24%)#34 | 164,406(0.03%)#599 |
| 35. | Greenlawn | 44 | 19,252(0.23%)#35 | 164,406(0.03%)#623 |
| 36. | Johnson City | 42 | 19,252(0.22%)#36 | 164,406(0.03%)#653 |
| 37. | Hewlett | 42 | 19,252(0.22%)#37 | 164,406(0.03%)#654 |
| 38. | Rye | 41 | 19,252(0.21%)#38 | 164,406(0.02%)#672 |
| 39. | Wesley Hills | 40 | 19,252(0.21%)#39 | 164,406(0.02%)#682 |
| 40. | West Babylon | 39 | 19,252(0.20%)#40 | 164,406(0.02%)#698 |
| 41. | Deer Park | 39 | 19,252(0.20%)#41 | 164,406(0.02%)#700 |
| 42. | New Cassel | 39 | 19,252(0.20%)#42 | 164,406(0.02%)#705 |
| 43. | Whitesboro | 39 | 19,252(0.20%)#43 | 164,406(0.02%)#712 |
| 44. | Binghamton | 38 | 19,252(0.20%)#44 | 164,406(0.02%)#715 |
| 45. | Manorville | 38 | 19,252(0.20%)#45 | 164,406(0.02%)#722 |
| 46. | North Bellmore | 37 | 19,252(0.19%)#46 | 164,406(0.02%)#738 |
| 47. | Fort Salonga | 36 | 19,252(0.19%)#47 | 164,406(0.02%)#767 |
| 48. | Washingtonville | 36 | 19,252(0.19%)#48 | 164,406(0.02%)#769 |
| 49. | Baldwin | 35 | 19,252(0.18%)#49 | 164,406(0.02%)#776 |
| 50. | Melville | 33 | 19,252(0.17%)#50 | 164,406(0.02%)#813 |
| 51. | New Hyde Park | 33 | 19,252(0.17%)#51 | 164,406(0.02%)#817 |
| 52. | Noyack | 33 | 19,252(0.17%)#52 | 164,406(0.02%)#821 |
| 53. | Greenwood Lake | 33 | 19,252(0.17%)#53 | 164,406(0.02%)#822 |
| 54. | Oceanside | 32 | 19,252(0.17%)#54 | 164,406(0.02%)#828 |
| 55. | Warwick | 32 | 19,252(0.17%)#55 | 164,406(0.02%)#837 |
| 56. | North Amityville | 31 | 19,252(0.16%)#56 | 164,406(0.02%)#853 |
| 57. | Jefferson Valley Yorktown | 31 | 19,252(0.16%)#57 | 164,406(0.02%)#855 |
| 58. | Salisbury | 31 | 19,252(0.16%)#58 | 164,406(0.02%)#856 |
| 59. | Huntington | 30 | 19,252(0.16%)#59 | 164,406(0.02%)#876 |
| 60. | Kenmore | 30 | 19,252(0.16%)#60 | 164,406(0.02%)#877 |
| 61. | South Farmingdale | 30 | 19,252(0.16%)#61 | 164,406(0.02%)#878 |
| 62. | Glen Cove | 29 | 19,252(0.15%)#62 | 164,406(0.02%)#897 |
| 63. | Warrensburg | 29 | 19,252(0.15%)#63 | 164,406(0.02%)#908 |
| 64. | Island Park | 28 | 19,252(0.15%)#64 | 164,406(0.02%)#941 |
| 65. | Airmont | 26 | 19,252(0.14%)#65 | 164,406(0.02%)#989 |
| 66. | Westmere | 26 | 19,252(0.14%)#66 | 164,406(0.02%)#992 |
| 67. | Westvale | 26 | 19,252(0.14%)#67 | 164,406(0.02%)#997 |
| 68. | Coram | 25 | 19,252(0.13%)#68 | 164,406(0.02%)#1,010 |
| 69. | West Hills | 25 | 19,252(0.13%)#69 | 164,406(0.02%)#1,023 |
| 70. | Holbrook | 24 | 19,252(0.12%)#70 | 164,406(0.01%)#1,041 |
| 71. | Great Neck Plaza | 24 | 19,252(0.12%)#71 | 164,406(0.01%)#1,049 |
| 72. | Old Brookville | 24 | 19,252(0.12%)#72 | 164,406(0.01%)#1,055 |
| 73. | White Plains | 23 | 19,252(0.12%)#73 | 164,406(0.01%)#1,059 |
| 74. | Mamaroneck | 23 | 19,252(0.12%)#74 | 164,406(0.01%)#1,070 |
| 75. | Dix Hills | 22 | 19,252(0.11%)#75 | 164,406(0.01%)#1,094 |
| 76. | Copiague | 21 | 19,252(0.11%)#76 | 164,406(0.01%)#1,127 |
| 77. | Eastchester | 21 | 19,252(0.11%)#77 | 164,406(0.01%)#1,128 |
| 78. | Oneida | 21 | 19,252(0.11%)#78 | 164,406(0.01%)#1,134 |
| 79. | Troy | 20 | 19,252(0.10%)#79 | 164,406(0.01%)#1,145 |
| 80. | Irondequoit | 20 | 19,252(0.10%)#80 | 164,406(0.01%)#1,146 |
| 81. | Saratoga Springs | 20 | 19,252(0.10%)#81 | 164,406(0.01%)#1,152 |
| 82. | Springs | 20 | 19,252(0.10%)#82 | 164,406(0.01%)#1,167 |
| 83. | Pelham Manor | 20 | 19,252(0.10%)#83 | 164,406(0.01%)#1,171 |
| 84. | Hampton Bays | 19 | 19,252(0.10%)#84 | 164,406(0.01%)#1,191 |
| 85. | Dobbs Ferry | 19 | 19,252(0.10%)#85 | 164,406(0.01%)#1,199 |
| 86. | Pelham | 19 | 19,252(0.10%)#86 | 164,406(0.01%)#1,205 |
| 87. | East Massapequa | 18 | 19,252(0.09%)#87 | 164,406(0.01%)#1,238 |
| 88. | Nesconset | 18 | 19,252(0.09%)#88 | 164,406(0.01%)#1,243 |
| 89. | South Hill | 18 | 19,252(0.09%)#89 | 164,406(0.01%)#1,253 |
| 90. | Chester | 18 | 19,252(0.09%)#90 | 164,406(0.01%)#1,258 |
| 91. | Fort Edward | 18 | 19,252(0.09%)#91 | 164,406(0.01%)#1,259 |
| 92. | Niskayuna | 17 | 19,252(0.09%)#92 | 164,406(0.01%)#1,277 |
| 93. | North Massapequa | 17 | 19,252(0.09%)#93 | 164,406(0.01%)#1,280 |
| 94. | Harris Hill | 17 | 19,252(0.09%)#94 | 164,406(0.01%)#1,294 |
| 95. | Sag Harbor | 17 | 19,252(0.09%)#95 | 164,406(0.01%)#1,302 |
| 96. | Poughkeepsie | 16 | 19,252(0.08%)#96 | 164,406(0.01%)#1,324 |
| 97. | Beacon | 16 | 19,252(0.08%)#97 | 164,406(0.01%)#1,344 |
| 98. | Searingtown | 16 | 19,252(0.08%)#98 | 164,406(0.01%)#1,355 |
| 99. | Sparkill | 16 | 19,252(0.08%)#99 | 164,406(0.01%)#1,362 |
| 100. | Valley Stream | 14 | 19,252(0.07%)#100 | 164,406(0.01%)#1,417 |
Common Questions
What are the Top 10 Cities with the Most Immigrants from Romania in New York?
Top 10 Cities with the Most Immigrants from Romania in New York are:
#1
12,802
#2
322
#3
248
#4
189
#5
181
#6
168
#7
115
#8
113
#9
106
#10
99
What city has the Most Immigrants from Romania in New York?
New York has the Most Immigrants from Romania in New York with 12,802.
What is the Total Immigrants from Romania in the State of New York?
Total Immigrants from Romania in New York is 19,252.
What is the Total Immigrants from Romania in the United States?
Total Immigrants from Romania in the United States is 164,406.