Rowley, MA
Rowley Map
Rowley Overview
1,642
TOTAL POPULATION
729
MALE POPULATION
913
FEMALE POPULATION
79.85
MALES / 100 FEMALES
125.24
FEMALES / 100 MALES
52.3
MEDIAN AGE
3.0
AVG FAMILY SIZE
2.4
AVG HOUSEHOLD SIZE
$70,283
PER CAPITA INCOME
$104,316
AVG FAMILY INCOME
$101,995
AVG HOUSEHOLD INCOME
0.50
INEQUALITY / GINI INDEX
1,017
LABOR FORCE [ PEOPLE ]
76.9%
PERCENT IN LABOR FORCE
Rowley Zip Codes
Rowley Area Codes
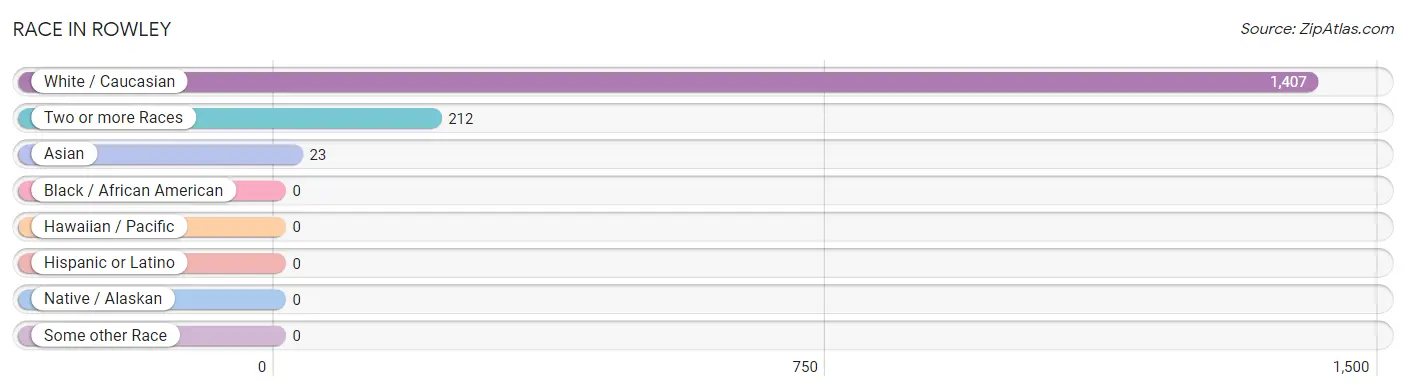
Race in Rowley
The most populous races in Rowley are White / Caucasian (1,407 | 85.7%), Two or more Races (212 | 12.9%), and Asian (23 | 1.4%).
| Race | # Population | % Population |
| Asian | 23 | 1.4% |
| Black / African American | 0 | 0.0% |
| Hawaiian / Pacific | 0 | 0.0% |
| Hispanic or Latino | 0 | 0.0% |
| Native / Alaskan | 0 | 0.0% |
| White / Caucasian | 1,407 | 85.7% |
| Two or more Races | 212 | 12.9% |
| Some other Race | 0 | 0.0% |
| Total | 1,642 | 100.0% |
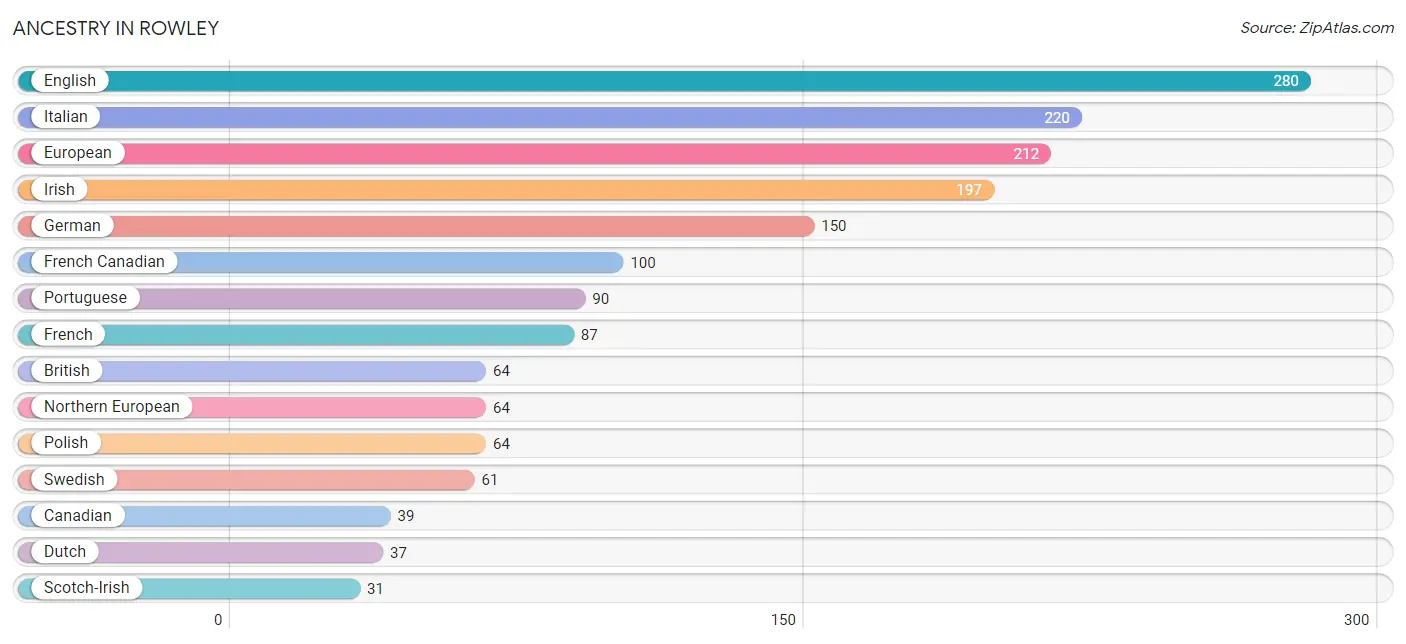
Ancestry in Rowley
The most populous ancestries reported in Rowley are English (280 | 17.1%), Italian (220 | 13.4%), European (212 | 12.9%), Irish (197 | 12.0%), and German (150 | 9.1%), together accounting for 64.5% of all Rowley residents.
| Ancestry | # Population | % Population |
| American | 16 | 1.0% |
| Basque | 18 | 1.1% |
| British | 64 | 3.9% |
| Burmese | 23 | 1.4% |
| Canadian | 39 | 2.4% |
| Dutch | 37 | 2.2% |
| English | 280 | 17.1% |
| European | 212 | 12.9% |
| Finnish | 17 | 1.0% |
| French | 87 | 5.3% |
| French Canadian | 100 | 6.1% |
| German | 150 | 9.1% |
| Irish | 197 | 12.0% |
| Italian | 220 | 13.4% |
| Lithuanian | 14 | 0.9% |
| Northern European | 64 | 3.9% |
| Norwegian | 17 | 1.0% |
| Polish | 64 | 3.9% |
| Portuguese | 90 | 5.5% |
| Romanian | 18 | 1.1% |
| Scotch-Irish | 31 | 1.9% |
| Scottish | 30 | 1.8% |
| Swedish | 61 | 3.7% | View All 23 Rows |
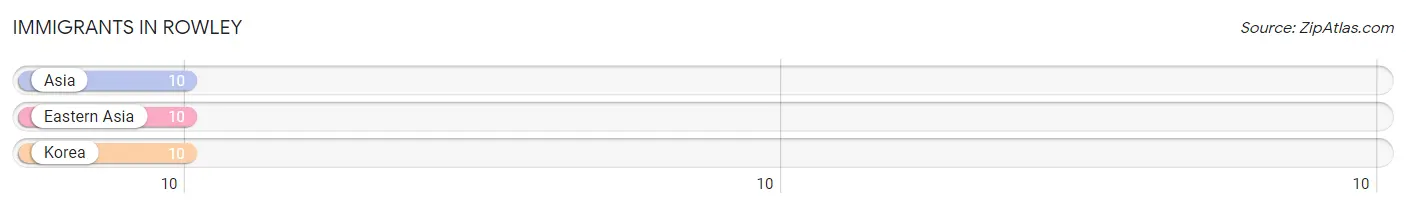
Immigrants in Rowley
The most numerous immigrant groups reported in Rowley came from Asia (10 | 0.6%), Eastern Asia (10 | 0.6%), and Korea (10 | 0.6%), together accounting for 1.8% of all Rowley residents.
| Immigration Origin | # Population | % Population |
| Asia | 10 | 0.6% |
| Eastern Asia | 10 | 0.6% |
| Korea | 10 | 0.6% | View All 3 Rows |
Sex and Age in Rowley
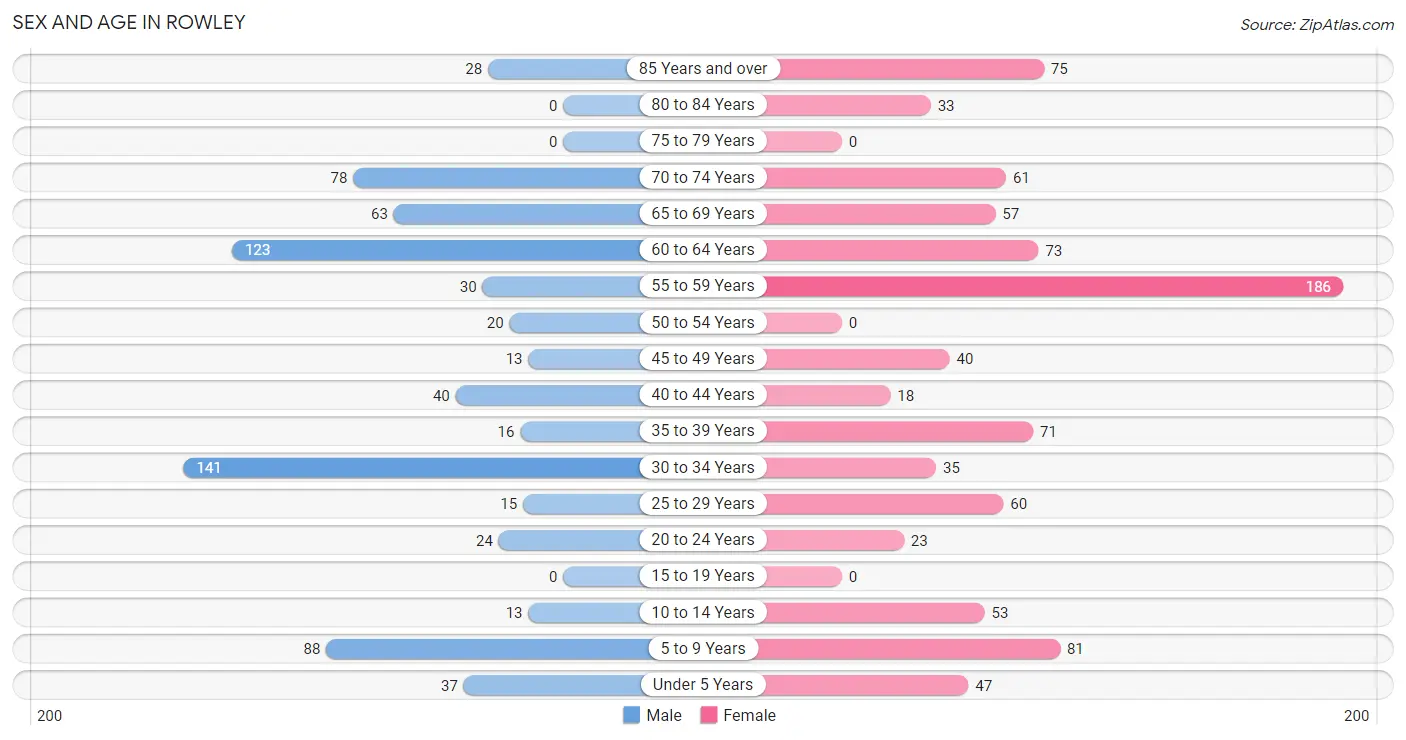
Sex and Age in Rowley
The most populous age groups in Rowley are 30 to 34 Years (141 | 19.3%) for men and 55 to 59 Years (186 | 20.4%) for women.
| Age Bracket | Male | Female |
| Under 5 Years | 37 (5.1%) | 47 (5.1%) |
| 5 to 9 Years | 88 (12.1%) | 81 (8.9%) |
| 10 to 14 Years | 13 (1.8%) | 53 (5.8%) |
| 15 to 19 Years | 0 (0.0%) | 0 (0.0%) |
| 20 to 24 Years | 24 (3.3%) | 23 (2.5%) |
| 25 to 29 Years | 15 (2.1%) | 60 (6.6%) |
| 30 to 34 Years | 141 (19.3%) | 35 (3.8%) |
| 35 to 39 Years | 16 (2.2%) | 71 (7.8%) |
| 40 to 44 Years | 40 (5.5%) | 18 (2.0%) |
| 45 to 49 Years | 13 (1.8%) | 40 (4.4%) |
| 50 to 54 Years | 20 (2.7%) | 0 (0.0%) |
| 55 to 59 Years | 30 (4.1%) | 186 (20.4%) |
| 60 to 64 Years | 123 (16.9%) | 73 (8.0%) |
| 65 to 69 Years | 63 (8.6%) | 57 (6.2%) |
| 70 to 74 Years | 78 (10.7%) | 61 (6.7%) |
| 75 to 79 Years | 0 (0.0%) | 0 (0.0%) |
| 80 to 84 Years | 0 (0.0%) | 33 (3.6%) |
| 85 Years and over | 28 (3.8%) | 75 (8.2%) |
| Total | 729 (100.0%) | 913 (100.0%) |
Families and Households in Rowley
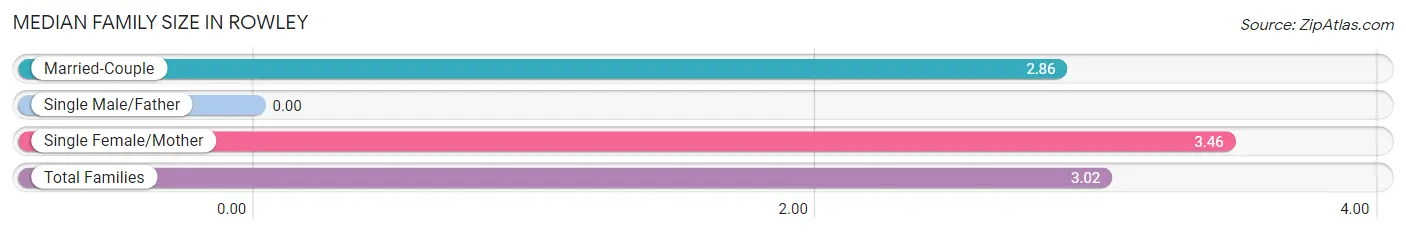
Median Family Size in Rowley
| Family Type | # Families | Family Size |
| Married-Couple | 342 (72.9%) | 2.86 |
| Single Male/Father | 0 (0.0%) | - |
| Single Female/Mother | 127 (27.1%) | 3.46 |
| Total Families | 469 (100.0%) | 3.02 |
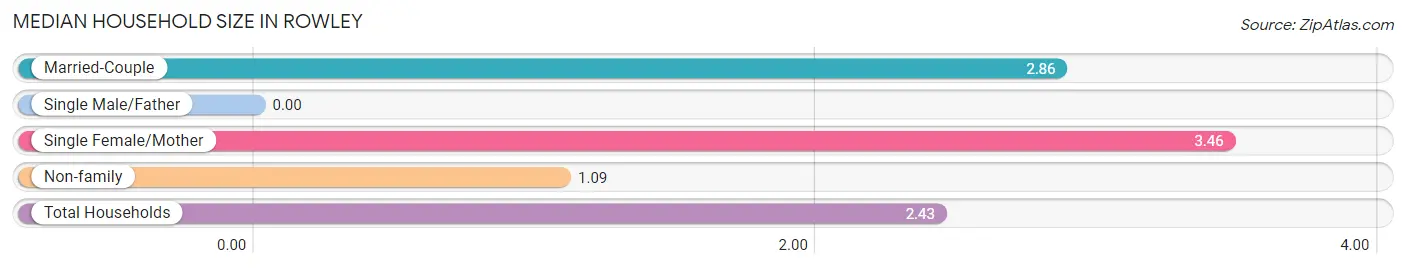
Median Household Size in Rowley
| Household Type | # Households | Household Size |
| Married-Couple | 342 (50.7%) | 2.86 |
| Single Male/Father | 0 (0.0%) | - |
| Single Female/Mother | 127 (18.8%) | 3.46 |
| Non-family | 206 (30.5%) | 1.09 |
| Total Households | 675 (100.0%) | 2.43 |
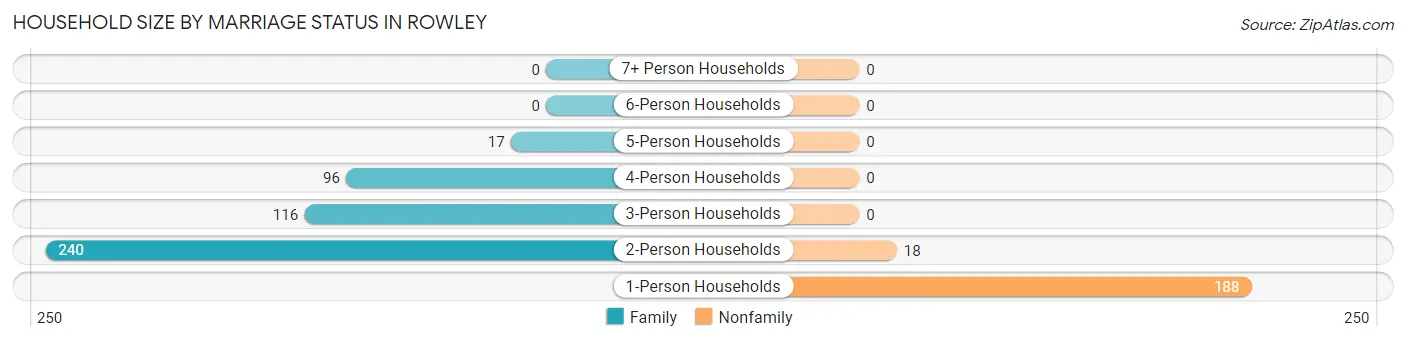
Household Size by Marriage Status in Rowley
Out of a total of 675 households in Rowley, 469 (69.5%) are family households, while 206 (30.5%) are nonfamily households. The most numerous type of family households are 2-person households, comprising 240, and the most common type of nonfamily households are 1-person households, comprising 188.
| Household Size | Family Households | Nonfamily Households |
| 1-Person Households | - | 188 (27.9%) |
| 2-Person Households | 240 (35.6%) | 18 (2.7%) |
| 3-Person Households | 116 (17.2%) | 0 (0.0%) |
| 4-Person Households | 96 (14.2%) | 0 (0.0%) |
| 5-Person Households | 17 (2.5%) | 0 (0.0%) |
| 6-Person Households | 0 (0.0%) | 0 (0.0%) |
| 7+ Person Households | 0 (0.0%) | 0 (0.0%) |
| Total | 469 (69.5%) | 206 (30.5%) |
Female Fertility in Rowley
Fertility by Age in Rowley
Average fertility rate in Rowley is 73.0 births per 1,000 women. Women in the age bracket of 20 to 34 years have the highest fertility rate with 153.0 births per 1,000 women. Women in the age bracket of 20 to 34 years acount for 100.0% of all women with births.
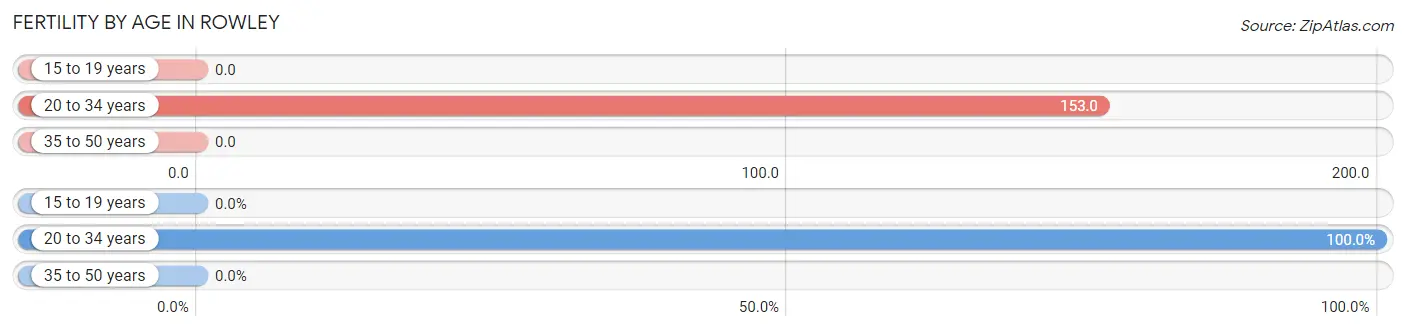
| Age Bracket | Women with Births | Births / 1,000 Women |
| 15 to 19 years | 0 (0.0%) | 0.0 |
| 20 to 34 years | 18 (100.0%) | 153.0 |
| 35 to 50 years | 0 (0.0%) | 0.0 |
| Total | 18 (100.0%) | 73.0 |
Fertility by Age by Marriage Status in Rowley
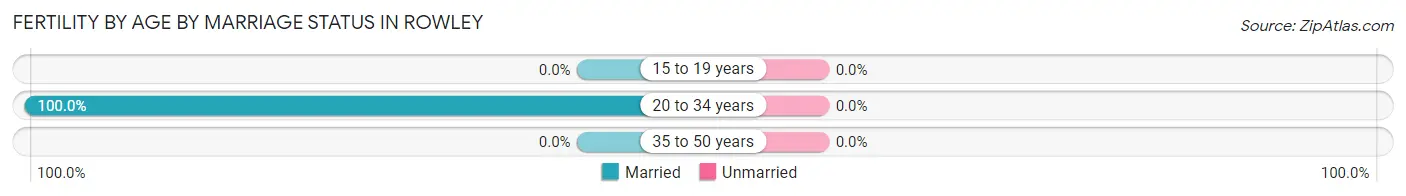
| Age Bracket | Married | Unmarried |
| 15 to 19 years | 0 (0.0%) | 0 (0.0%) |
| 20 to 34 years | 18 (100.0%) | 0 (0.0%) |
| 35 to 50 years | 0 (0.0%) | 0 (0.0%) |
| Total | 18 (100.0%) | 0 (0.0%) |
Fertility by Education in Rowley
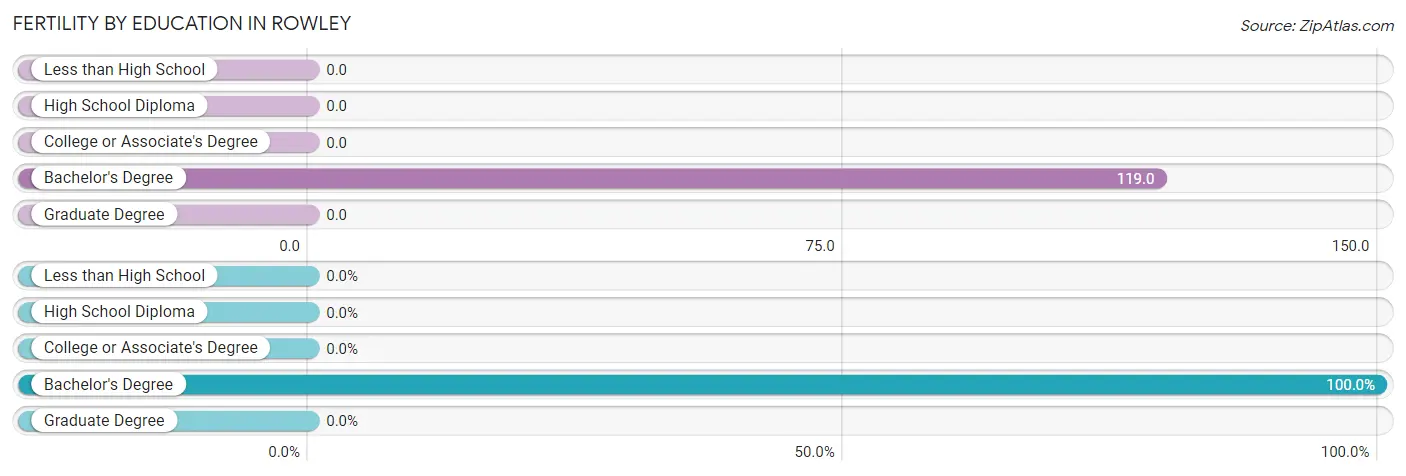
| Educational Attainment | Women with Births | Births / 1,000 Women |
| Less than High School | 0 (0.0%) | 0.0 |
| High School Diploma | 0 (0.0%) | 0.0 |
| College or Associate's Degree | 0 (0.0%) | 0.0 |
| Bachelor's Degree | 18 (100.0%) | 119.0 |
| Graduate Degree | 0 (0.0%) | 0.0 |
| Total | 18 (100.0%) | 73.0 |
Fertility by Education by Marriage Status in Rowley
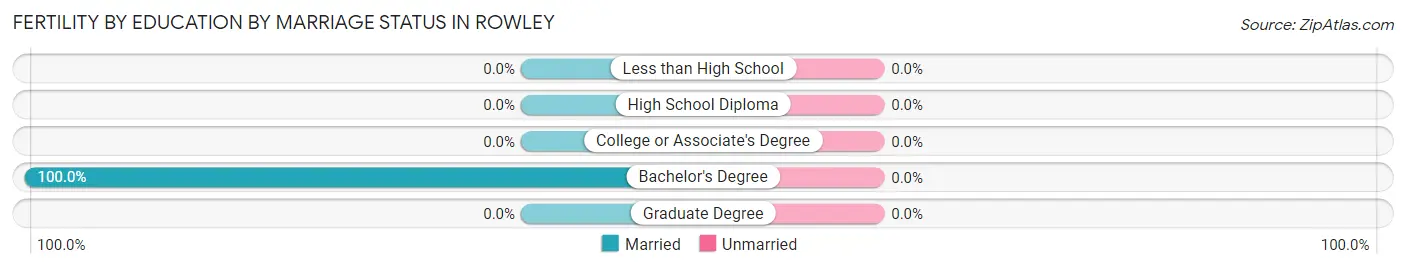
| Educational Attainment | Married | Unmarried |
| Less than High School | 0 (0.0%) | 0 (0.0%) |
| High School Diploma | 0 (0.0%) | 0 (0.0%) |
| College or Associate's Degree | 0 (0.0%) | 0 (0.0%) |
| Bachelor's Degree | 18 (100.0%) | 0 (0.0%) |
| Graduate Degree | 0 (0.0%) | 0 (0.0%) |
| Total | 18 (100.0%) | 0 (0.0%) |
Income in Rowley
Income Overview in Rowley
Per Capita Income in Rowley is $70,283, while median incomes of families and households are $104,316 and $101,995 respectively.
| Characteristic | Number | Measure |
| Per Capita Income | 1,642 | $70,283 |
| Median Family Income | 469 | $104,316 |
| Mean Family Income | 469 | $162,463 |
| Median Household Income | 675 | $101,995 |
| Mean Household Income | 675 | $166,159 |
| Income Deficit | 469 | $0 |
| Wage / Income Gap (%) | 1,642 | 0.00% |
| Wage / Income Gap ($) | 1,642 | 100.00¢ per $1 |
| Gini / Inequality Index | 1,642 | 0.50 |
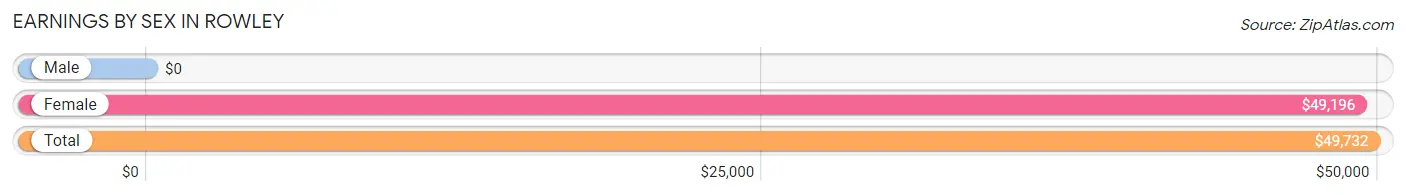
Earnings by Sex in Rowley
| Sex | Number | Average Earnings |
| Male | 492 (47.7%) | $0 |
| Female | 539 (52.3%) | $49,196 |
| Total | 1,031 (100.0%) | $49,732 |
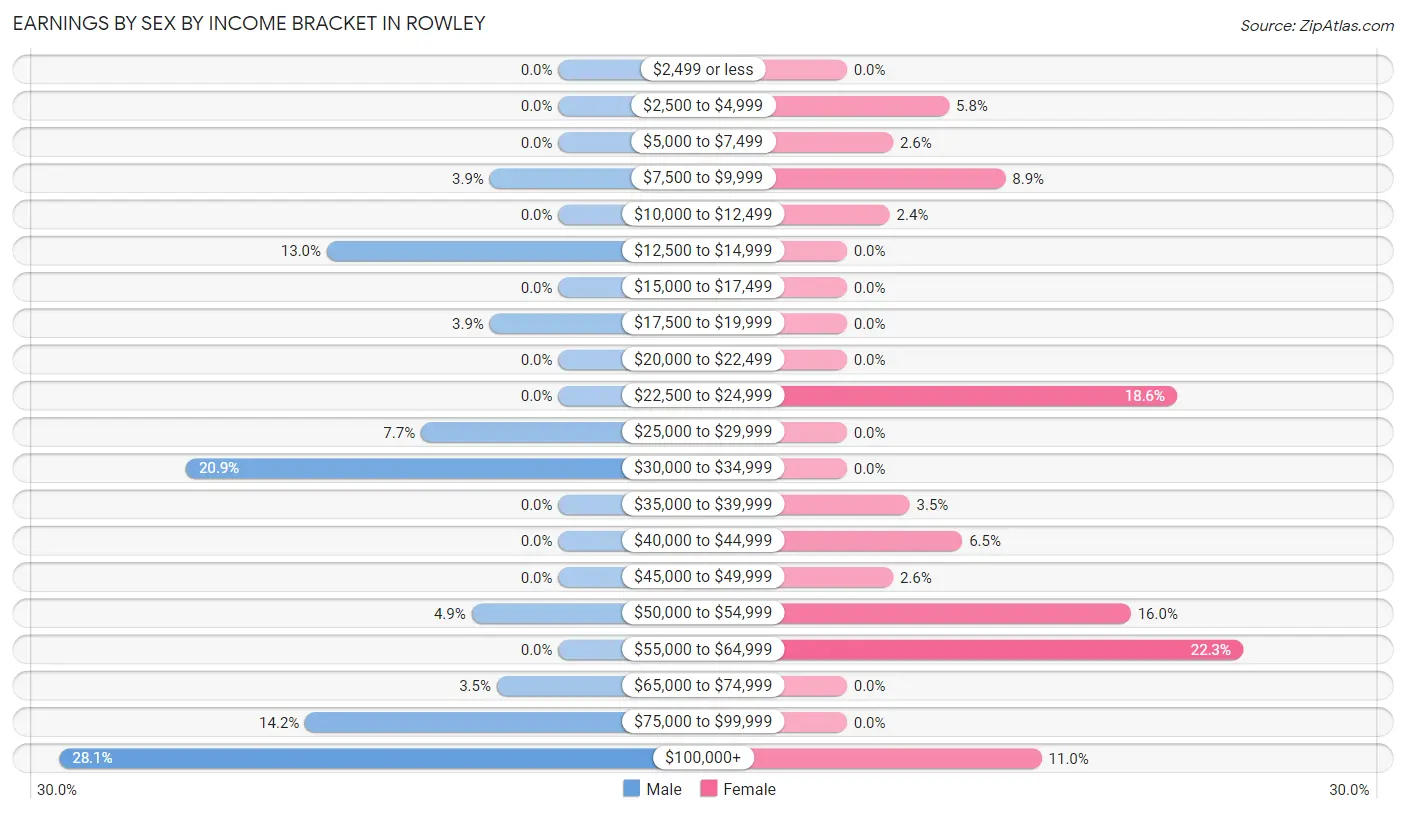
Earnings by Sex by Income Bracket in Rowley
The most common earnings brackets in Rowley are $100,000+ for men (138 | 28.1%) and $55,000 to $64,999 for women (120 | 22.3%).
| Income | Male | Female |
| $2,499 or less | 0 (0.0%) | 0 (0.0%) |
| $2,500 to $4,999 | 0 (0.0%) | 31 (5.8%) |
| $5,000 to $7,499 | 0 (0.0%) | 14 (2.6%) |
| $7,500 to $9,999 | 19 (3.9%) | 48 (8.9%) |
| $10,000 to $12,499 | 0 (0.0%) | 13 (2.4%) |
| $12,500 to $14,999 | 64 (13.0%) | 0 (0.0%) |
| $15,000 to $17,499 | 0 (0.0%) | 0 (0.0%) |
| $17,500 to $19,999 | 19 (3.9%) | 0 (0.0%) |
| $20,000 to $22,499 | 0 (0.0%) | 0 (0.0%) |
| $22,500 to $24,999 | 0 (0.0%) | 100 (18.5%) |
| $25,000 to $29,999 | 38 (7.7%) | 0 (0.0%) |
| $30,000 to $34,999 | 103 (20.9%) | 0 (0.0%) |
| $35,000 to $39,999 | 0 (0.0%) | 19 (3.5%) |
| $40,000 to $44,999 | 0 (0.0%) | 35 (6.5%) |
| $45,000 to $49,999 | 0 (0.0%) | 14 (2.6%) |
| $50,000 to $54,999 | 24 (4.9%) | 86 (16.0%) |
| $55,000 to $64,999 | 0 (0.0%) | 120 (22.3%) |
| $65,000 to $74,999 | 17 (3.5%) | 0 (0.0%) |
| $75,000 to $99,999 | 70 (14.2%) | 0 (0.0%) |
| $100,000+ | 138 (28.1%) | 59 (11.0%) |
| Total | 492 (100.0%) | 539 (100.0%) |
Earnings by Sex by Educational Attainment in Rowley
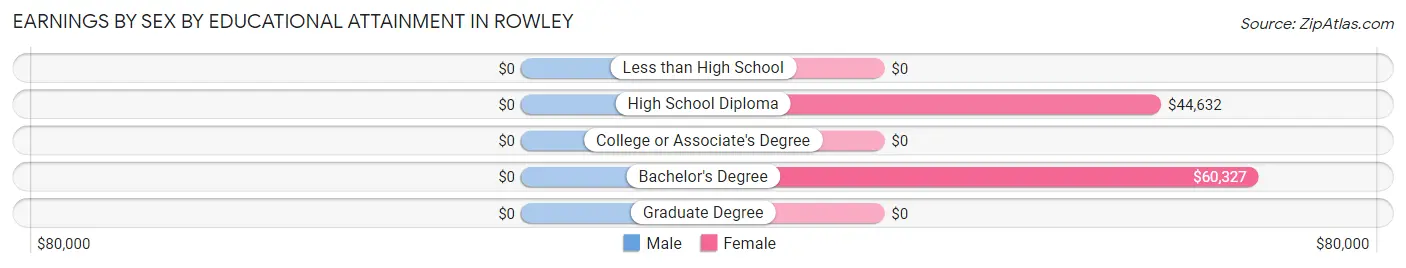
| Educational Attainment | Male Income | Female Income |
| Less than High School | - | - |
| High School Diploma | - | - |
| College or Associate's Degree | - | - |
| Bachelor's Degree | - | - |
| Graduate Degree | - | - |
| Total | - | - |
Family Income in Rowley
Family Income Brackets in Rowley
According to the Rowley family income data, there are 132 families falling into the $200,000+ income range, which is the most common income bracket and makes up 28.1% of all families.
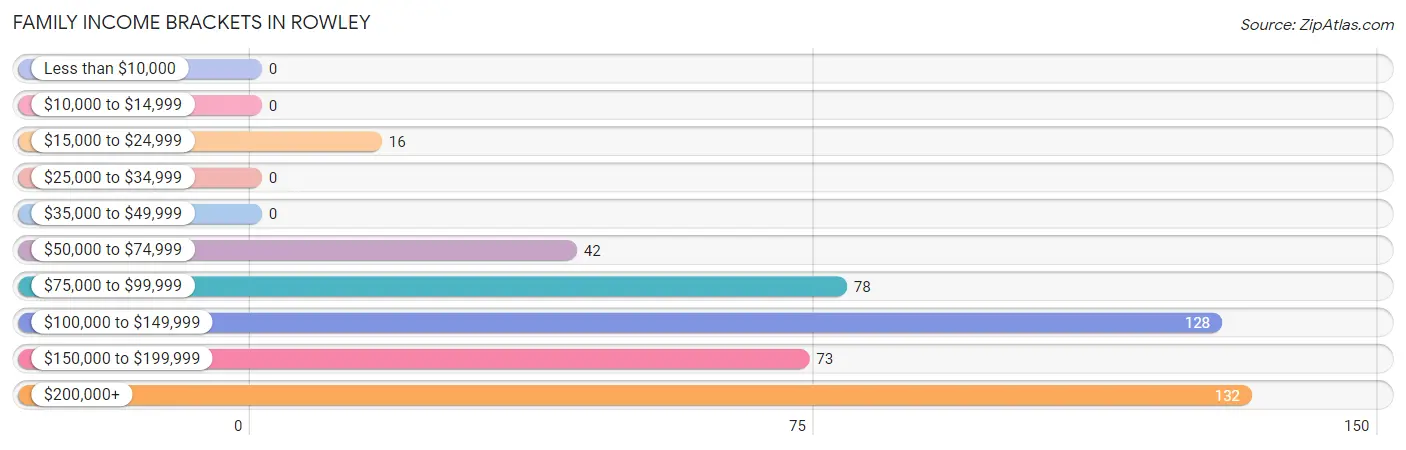
| Income Bracket | # Families | % Families |
| Less than $10,000 | 0 | 0.0% |
| $10,000 to $14,999 | 0 | 0.0% |
| $15,000 to $24,999 | 16 | 3.4% |
| $25,000 to $34,999 | 0 | 0.0% |
| $35,000 to $49,999 | 0 | 0.0% |
| $50,000 to $74,999 | 42 | 9.0% |
| $75,000 to $99,999 | 78 | 16.6% |
| $100,000 to $149,999 | 128 | 27.3% |
| $150,000 to $199,999 | 73 | 15.6% |
| $200,000+ | 132 | 28.1% |
Family Income by Famaliy Size in Rowley
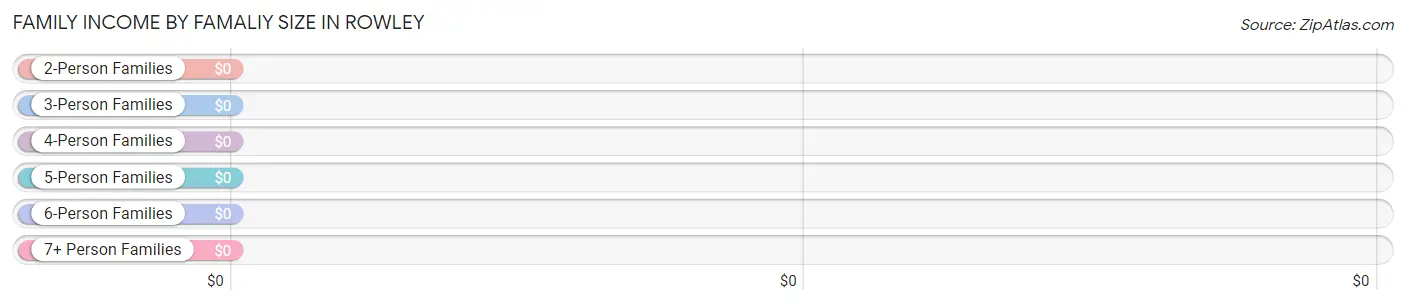
| Income Bracket | # Families | Median Income |
| 2-Person Families | 240 (51.2%) | $0 |
| 3-Person Families | 116 (24.7%) | $0 |
| 4-Person Families | 96 (20.5%) | $0 |
| 5-Person Families | 17 (3.6%) | $0 |
| 6-Person Families | 0 (0.0%) | $0 |
| 7+ Person Families | 0 (0.0%) | $0 |
| Total | 469 (100.0%) | $104,316 |
Family Income by Number of Earners in Rowley
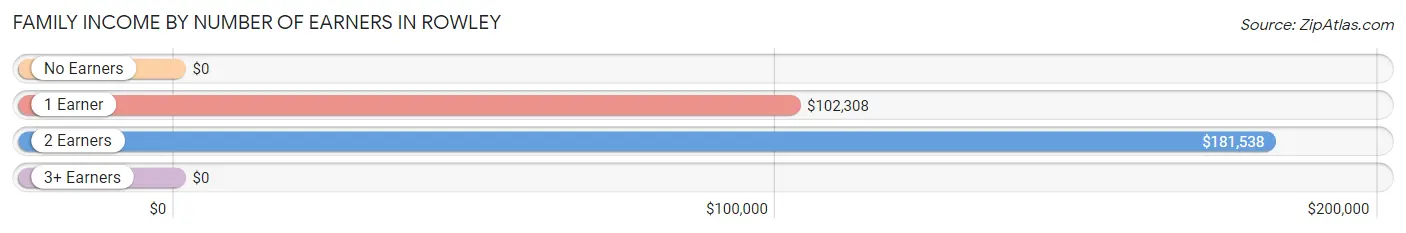
| Number of Earners | # Families | Median Income |
| No Earners | 58 (12.4%) | $0 |
| 1 Earner | 96 (20.5%) | $102,308 |
| 2 Earners | 234 (49.9%) | $181,538 |
| 3+ Earners | 81 (17.3%) | $0 |
| Total | 469 (100.0%) | $104,316 |
Household Income in Rowley
Household Income Brackets in Rowley
With 160 households falling in the category, the $200,000+ income range is the most frequent in Rowley, accounting for 23.7% of all households. In contrast, only 14 households (2.1%) fall into the $25,000 to $34,999 income bracket, making it the least populous group.
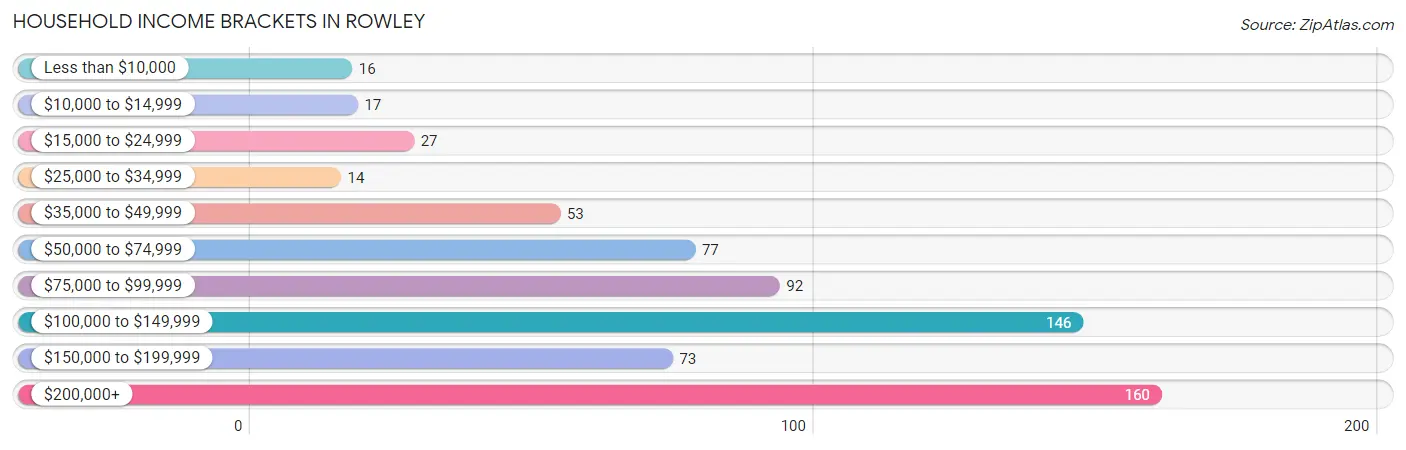
| Income Bracket | # Households | % Households |
| Less than $10,000 | 16 | 2.4% |
| $10,000 to $14,999 | 17 | 2.5% |
| $15,000 to $24,999 | 27 | 4.0% |
| $25,000 to $34,999 | 14 | 2.1% |
| $35,000 to $49,999 | 53 | 7.9% |
| $50,000 to $74,999 | 77 | 11.4% |
| $75,000 to $99,999 | 92 | 13.6% |
| $100,000 to $149,999 | 146 | 21.6% |
| $150,000 to $199,999 | 73 | 10.8% |
| $200,000+ | 160 | 23.7% |
Household Income by Householder Age in Rowley
The median household income in Rowley is $101,995, with the highest median household income of $103,691 found in the 45 to 64 years age bracket for the primary householder. A total of 199 households (29.5%) fall into this category.
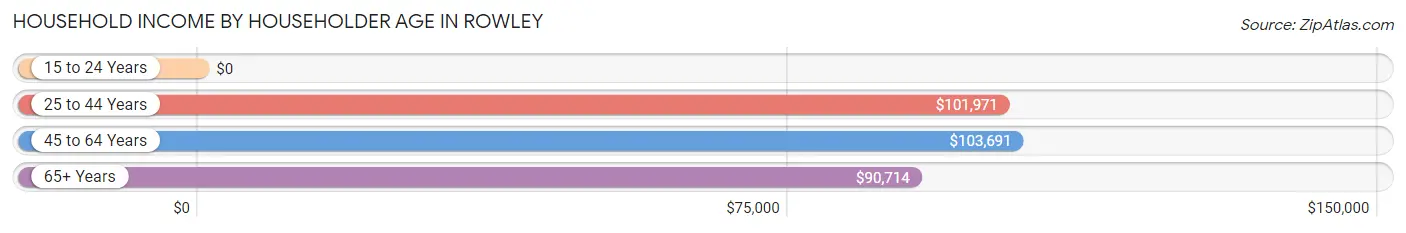
| Income Bracket | # Households | Median Income |
| 15 to 24 Years | 0 (0.0%) | $0 |
| 25 to 44 Years | 200 (29.6%) | $101,971 |
| 45 to 64 Years | 199 (29.5%) | $103,691 |
| 65+ Years | 276 (40.9%) | $90,714 |
| Total | 675 (100.0%) | $101,995 |
Poverty in Rowley
Income Below Poverty by Sex and Age in Rowley
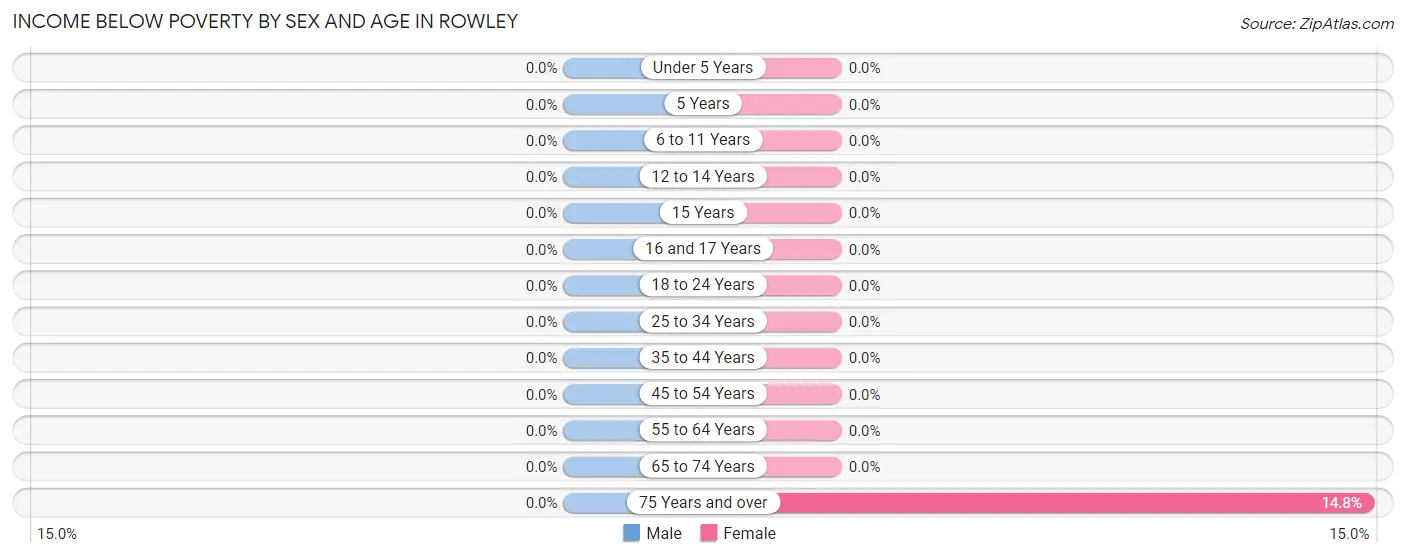
| Age Bracket | Male | Female |
| Under 5 Years | 0 (0.0%) | 0 (0.0%) |
| 5 Years | 0 (0.0%) | 0 (0.0%) |
| 6 to 11 Years | 0 (0.0%) | 0 (0.0%) |
| 12 to 14 Years | 0 (0.0%) | 0 (0.0%) |
| 15 Years | 0 (0.0%) | 0 (0.0%) |
| 16 and 17 Years | 0 (0.0%) | 0 (0.0%) |
| 18 to 24 Years | 0 (0.0%) | 0 (0.0%) |
| 25 to 34 Years | 0 (0.0%) | 0 (0.0%) |
| 35 to 44 Years | 0 (0.0%) | 0 (0.0%) |
| 45 to 54 Years | 0 (0.0%) | 0 (0.0%) |
| 55 to 64 Years | 0 (0.0%) | 0 (0.0%) |
| 65 to 74 Years | 0 (0.0%) | 0 (0.0%) |
| 75 Years and over | 0 (0.0%) | 16 (14.8%) |
| Total | 0 (0.0%) | 16 (1.8%) |
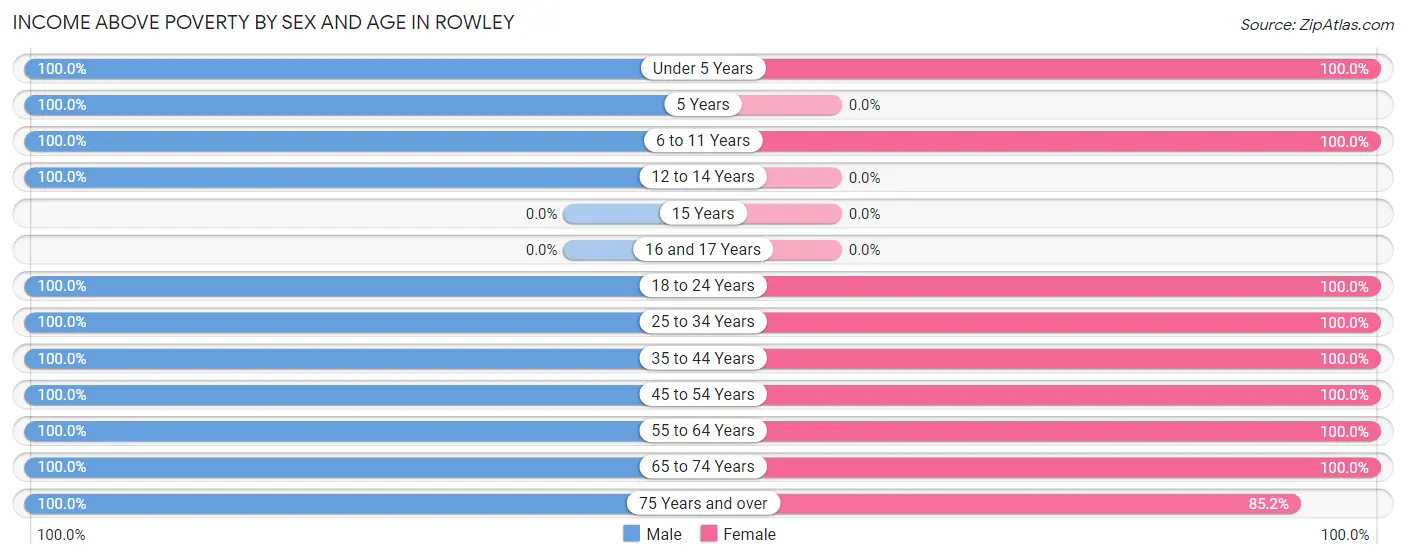
Income Above Poverty by Sex and Age in Rowley
According to the poverty statistics in Rowley, males aged under 5 years and females aged under 5 years are the age groups that are most secure financially, with 100.0% of males and 100.0% of females in these age groups living above the poverty line.
| Age Bracket | Male | Female |
| Under 5 Years | 37 (100.0%) | 47 (100.0%) |
| 5 Years | 74 (100.0%) | 0 (0.0%) |
| 6 to 11 Years | 14 (100.0%) | 134 (100.0%) |
| 12 to 14 Years | 13 (100.0%) | 0 (0.0%) |
| 15 Years | 0 (0.0%) | 0 (0.0%) |
| 16 and 17 Years | 0 (0.0%) | 0 (0.0%) |
| 18 to 24 Years | 24 (100.0%) | 23 (100.0%) |
| 25 to 34 Years | 156 (100.0%) | 95 (100.0%) |
| 35 to 44 Years | 56 (100.0%) | 89 (100.0%) |
| 45 to 54 Years | 33 (100.0%) | 40 (100.0%) |
| 55 to 64 Years | 153 (100.0%) | 259 (100.0%) |
| 65 to 74 Years | 141 (100.0%) | 118 (100.0%) |
| 75 Years and over | 28 (100.0%) | 92 (85.2%) |
| Total | 729 (100.0%) | 897 (98.3%) |
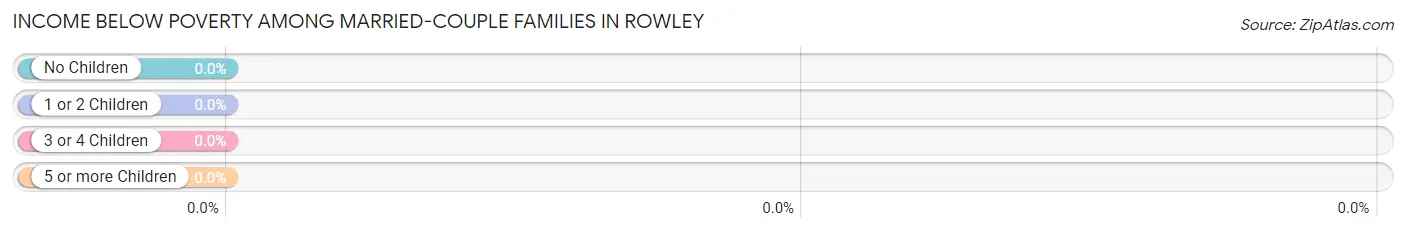
Income Below Poverty Among Married-Couple Families in Rowley
| Children | Above Poverty | Below Poverty |
| No Children | 258 (100.0%) | 0 (0.0%) |
| 1 or 2 Children | 84 (100.0%) | 0 (0.0%) |
| 3 or 4 Children | 0 (0.0%) | 0 (0.0%) |
| 5 or more Children | 0 (0.0%) | 0 (0.0%) |
| Total | 342 (100.0%) | 0 (0.0%) |
Income Below Poverty Among Single-Parent Households in Rowley
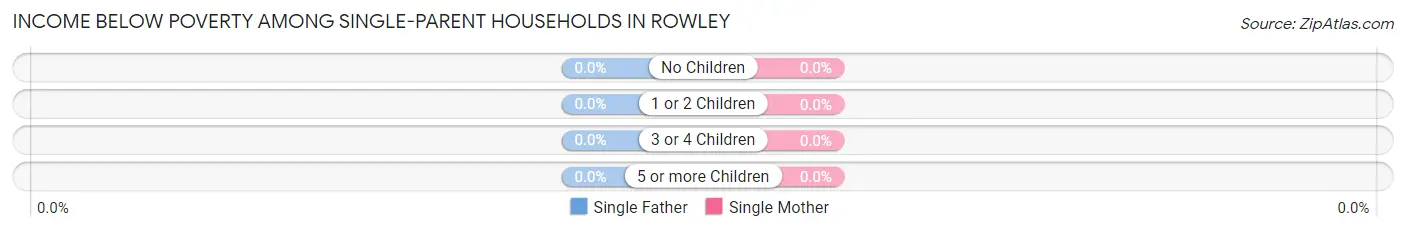
| Children | Single Father | Single Mother |
| No Children | 0 (0.0%) | 0 (0.0%) |
| 1 or 2 Children | 0 (0.0%) | 0 (0.0%) |
| 3 or 4 Children | 0 (0.0%) | 0 (0.0%) |
| 5 or more Children | 0 (0.0%) | 0 (0.0%) |
| Total | 0 (0.0%) | 0 (0.0%) |
Income Below Poverty Among Married-Couple vs Single-Parent Households in Rowley
| Children | Married-Couple Families | Single-Parent Households |
| No Children | 0 (0.0%) | 0 (0.0%) |
| 1 or 2 Children | 0 (0.0%) | 0 (0.0%) |
| 3 or 4 Children | 0 (0.0%) | 0 (0.0%) |
| 5 or more Children | 0 (0.0%) | 0 (0.0%) |
| Total | 0 (0.0%) | 0 (0.0%) |
Employment Characteristics in Rowley
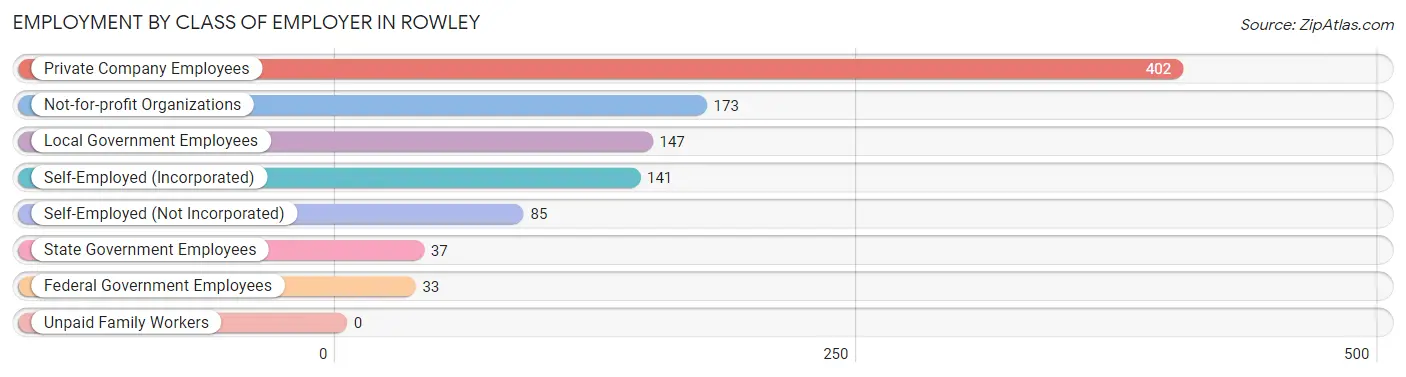
Employment by Class of Employer in Rowley
Among the 1,018 employed individuals in Rowley, private company employees (402 | 39.5%), not-for-profit organizations (173 | 17.0%), and local government employees (147 | 14.4%) make up the most common classes of employment.
| Employer Class | # Employees | % Employees |
| Private Company Employees | 402 | 39.5% |
| Self-Employed (Incorporated) | 141 | 13.9% |
| Self-Employed (Not Incorporated) | 85 | 8.4% |
| Not-for-profit Organizations | 173 | 17.0% |
| Local Government Employees | 147 | 14.4% |
| State Government Employees | 37 | 3.6% |
| Federal Government Employees | 33 | 3.2% |
| Unpaid Family Workers | 0 | 0.0% |
| Total | 1,018 | 100.0% |
Employment Status by Age in Rowley
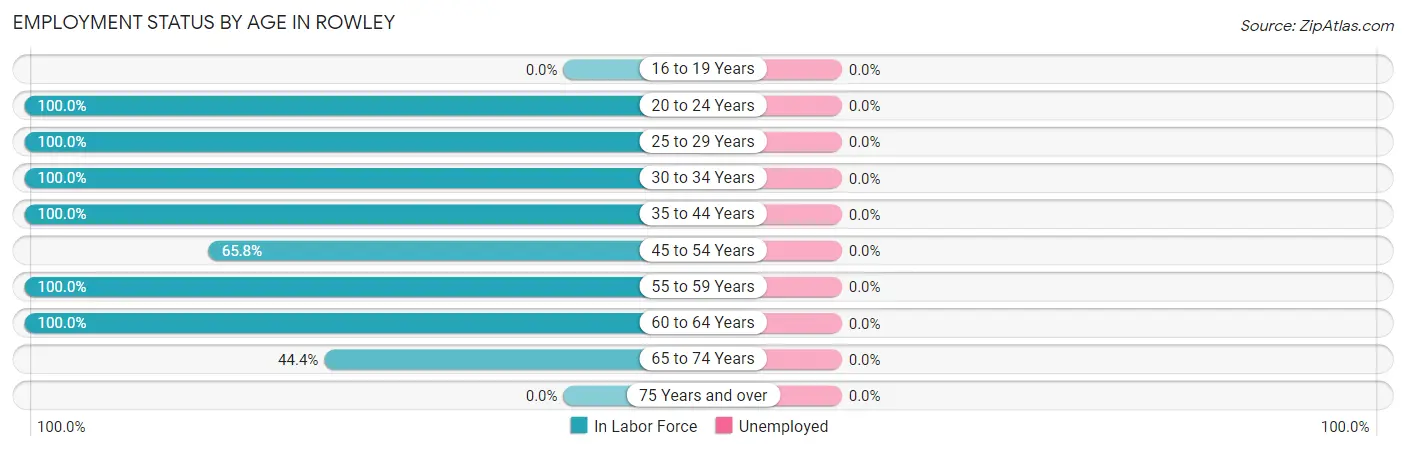
| Age Bracket | In Labor Force | Unemployed |
| 16 to 19 Years | 0 (0.0%) | 0 (0.0%) |
| 20 to 24 Years | 47 (100.0%) | 0 (0.0%) |
| 25 to 29 Years | 75 (100.0%) | 0 (0.0%) |
| 30 to 34 Years | 176 (100.0%) | 0 (0.0%) |
| 35 to 44 Years | 145 (100.0%) | 0 (0.0%) |
| 45 to 54 Years | 48 (65.8%) | 0 (0.0%) |
| 55 to 59 Years | 216 (100.0%) | 0 (0.0%) |
| 60 to 64 Years | 196 (100.0%) | 0 (0.0%) |
| 65 to 74 Years | 115 (44.4%) | 0 (0.0%) |
| 75 Years and over | 0 (0.0%) | 0 (0.0%) |
| Total | 1,017 (76.9%) | 0 (0.0%) |
Employment Status by Educational Attainment in Rowley
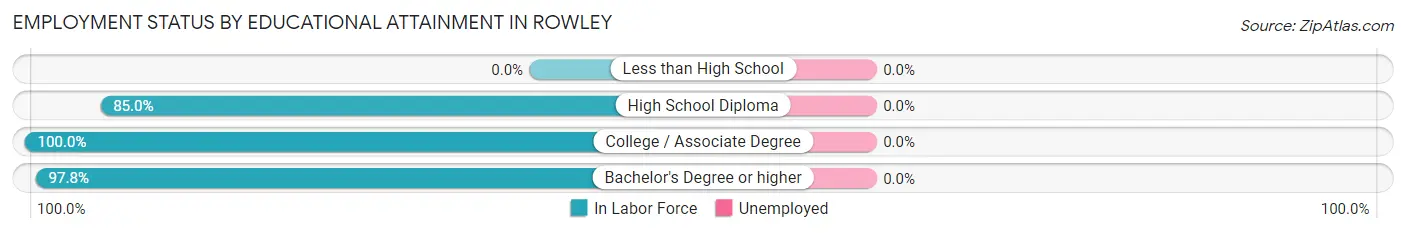
| Educational Attainment | In Labor Force | Unemployed |
| Less than High School | 0 (0.0%) | 0 (0.0%) |
| High School Diploma | 68 (85.0%) | 0 (0.0%) |
| College / Associate Degree | 212 (100.0%) | 0 (0.0%) |
| Bachelor's Degree or higher | 576 (97.8%) | 0 (0.0%) |
| Total | 856 (97.2%) | 0 (0.0%) |
Employment Occupations by Sex in Rowley
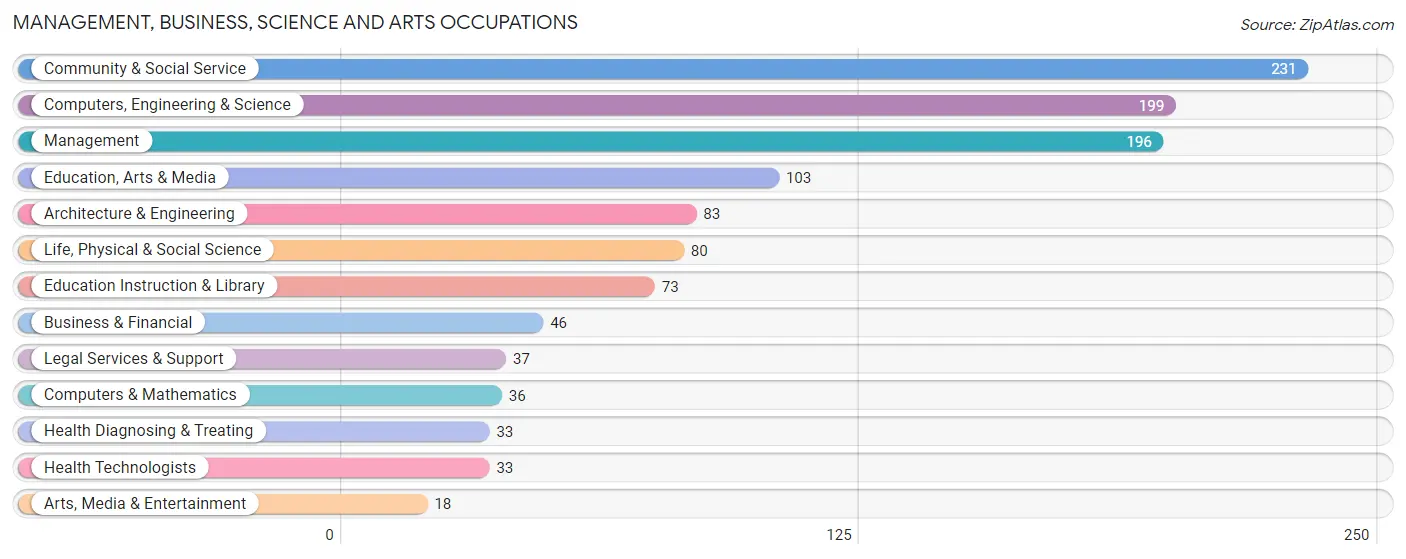
Management, Business, Science and Arts Occupations
The most common Management, Business, Science and Arts occupations in Rowley are Community & Social Service (231 | 22.7%), Computers, Engineering & Science (199 | 19.6%), Management (196 | 19.3%), Education, Arts & Media (103 | 10.1%), and Architecture & Engineering (83 | 8.2%).
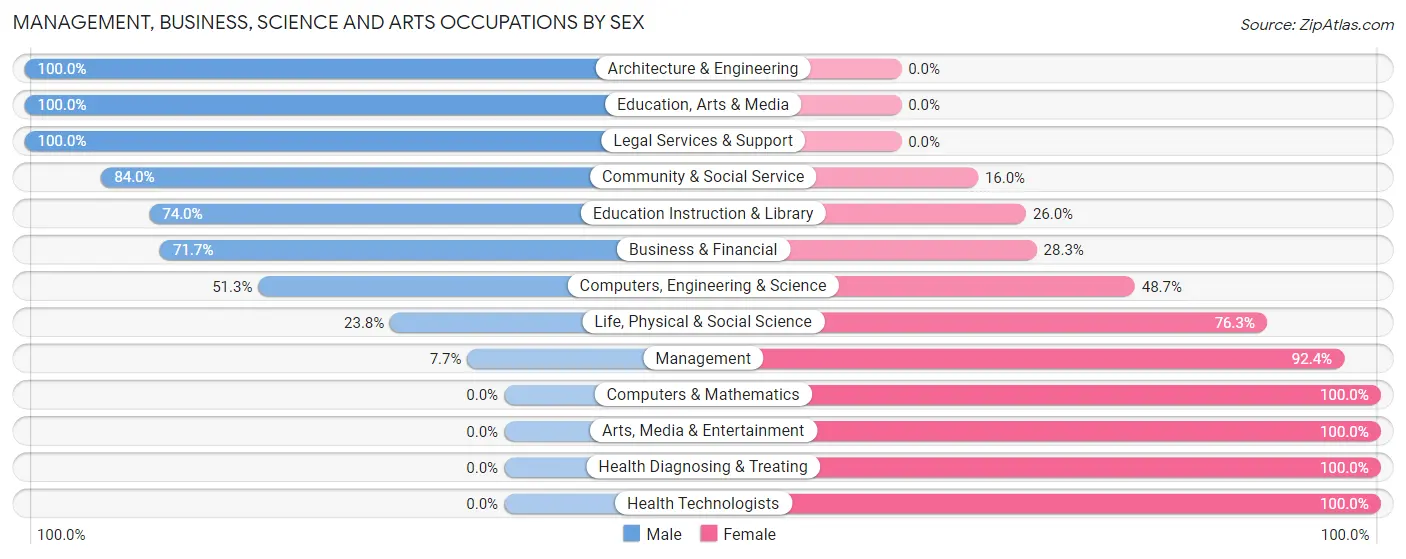
Management, Business, Science and Arts Occupations by Sex
Within the Management, Business, Science and Arts occupations in Rowley, the most male-oriented occupations are Architecture & Engineering (100.0%), Education, Arts & Media (100.0%), and Legal Services & Support (100.0%), while the most female-oriented occupations are Computers & Mathematics (100.0%), Arts, Media & Entertainment (100.0%), and Health Diagnosing & Treating (100.0%).
| Occupation | Male | Female |
| Management | 15 (7.6%) | 181 (92.3%) |
| Business & Financial | 33 (71.7%) | 13 (28.3%) |
| Computers, Engineering & Science | 102 (51.3%) | 97 (48.7%) |
| Computers & Mathematics | 0 (0.0%) | 36 (100.0%) |
| Architecture & Engineering | 83 (100.0%) | 0 (0.0%) |
| Life, Physical & Social Science | 19 (23.7%) | 61 (76.2%) |
| Community & Social Service | 194 (84.0%) | 37 (16.0%) |
| Education, Arts & Media | 103 (100.0%) | 0 (0.0%) |
| Legal Services & Support | 37 (100.0%) | 0 (0.0%) |
| Education Instruction & Library | 54 (74.0%) | 19 (26.0%) |
| Arts, Media & Entertainment | 0 (0.0%) | 18 (100.0%) |
| Health Diagnosing & Treating | 0 (0.0%) | 33 (100.0%) |
| Health Technologists | 0 (0.0%) | 33 (100.0%) |
| Total (Category) | 344 (48.8%) | 361 (51.2%) |
| Total (Overall) | 492 (48.3%) | 526 (51.7%) |
Services Occupations
Services Occupations by Sex
| Occupation | Male | Female |
| Healthcare Support | 0 (0.0%) | 0 (0.0%) |
| Security & Protection | 0 (0.0%) | 0 (0.0%) |
| Firefighting & Prevention | 0 (0.0%) | 0 (0.0%) |
| Law Enforcement | 0 (0.0%) | 0 (0.0%) |
| Food Preparation & Serving | 0 (0.0%) | 0 (0.0%) |
| Cleaning & Maintenance | 0 (0.0%) | 0 (0.0%) |
| Personal Care & Service | 0 (0.0%) | 0 (0.0%) |
| Total (Category) | 0 (0.0%) | 0 (0.0%) |
| Total (Overall) | 492 (48.3%) | 526 (51.7%) |
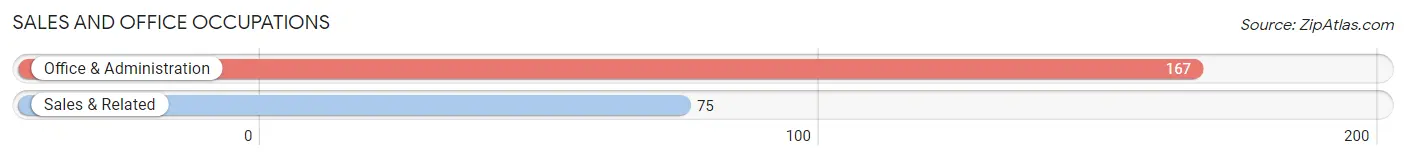
Sales and Office Occupations
The most common Sales and Office occupations in Rowley are Office & Administration (167 | 16.4%), and Sales & Related (75 | 7.4%).
Sales and Office Occupations by Sex
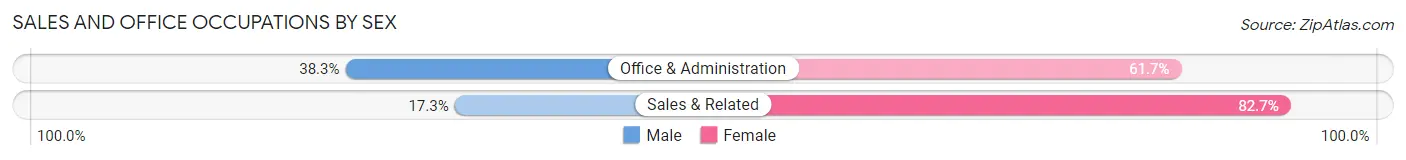
| Occupation | Male | Female |
| Sales & Related | 13 (17.3%) | 62 (82.7%) |
| Office & Administration | 64 (38.3%) | 103 (61.7%) |
| Total (Category) | 77 (31.8%) | 165 (68.2%) |
| Total (Overall) | 492 (48.3%) | 526 (51.7%) |
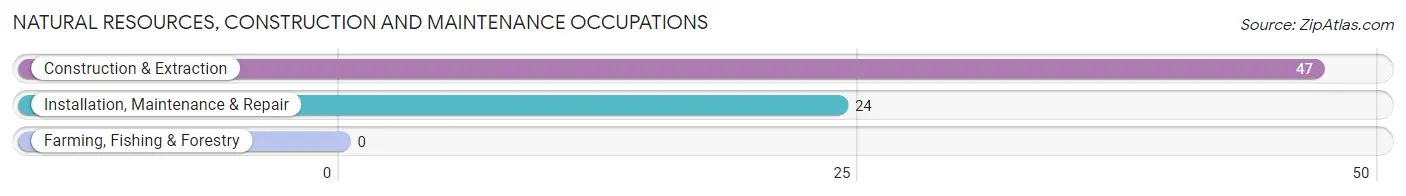
Natural Resources, Construction and Maintenance Occupations
The most common Natural Resources, Construction and Maintenance occupations in Rowley are Construction & Extraction (47 | 4.6%), and Installation, Maintenance & Repair (24 | 2.4%).
Natural Resources, Construction and Maintenance Occupations by Sex
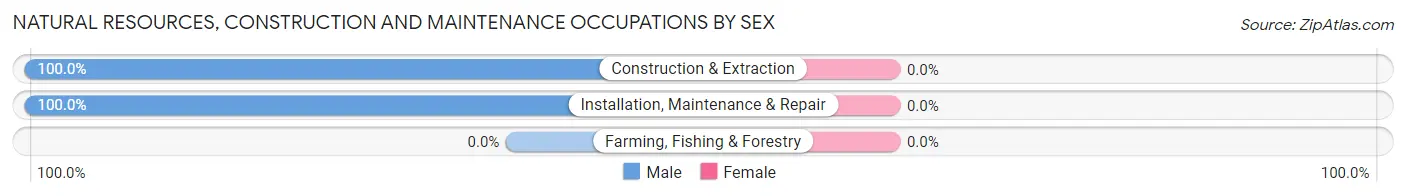
| Occupation | Male | Female |
| Farming, Fishing & Forestry | 0 (0.0%) | 0 (0.0%) |
| Construction & Extraction | 47 (100.0%) | 0 (0.0%) |
| Installation, Maintenance & Repair | 24 (100.0%) | 0 (0.0%) |
| Total (Category) | 71 (100.0%) | 0 (0.0%) |
| Total (Overall) | 492 (48.3%) | 526 (51.7%) |
Production, Transportation and Moving Occupations
Production, Transportation and Moving Occupations by Sex
| Occupation | Male | Female |
| Production | 0 (0.0%) | 0 (0.0%) |
| Transportation | 0 (0.0%) | 0 (0.0%) |
| Material Moving | 0 (0.0%) | 0 (0.0%) |
| Total (Category) | 0 (0.0%) | 0 (0.0%) |
| Total (Overall) | 492 (48.3%) | 526 (51.7%) |
Employment Industries by Sex in Rowley
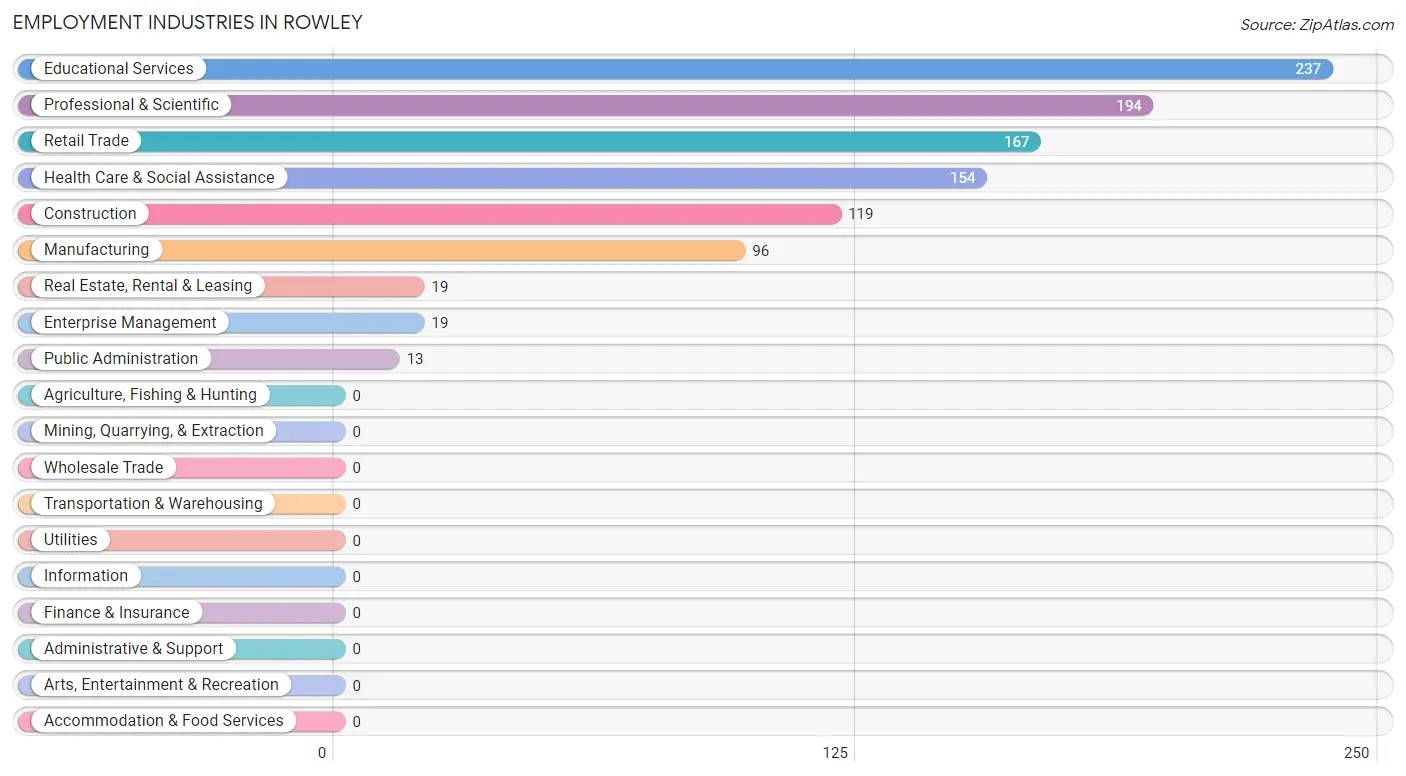
Employment Industries in Rowley
The major employment industries in Rowley include Educational Services (237 | 23.3%), Professional & Scientific (194 | 19.1%), Retail Trade (167 | 16.4%), Health Care & Social Assistance (154 | 15.1%), and Construction (119 | 11.7%).
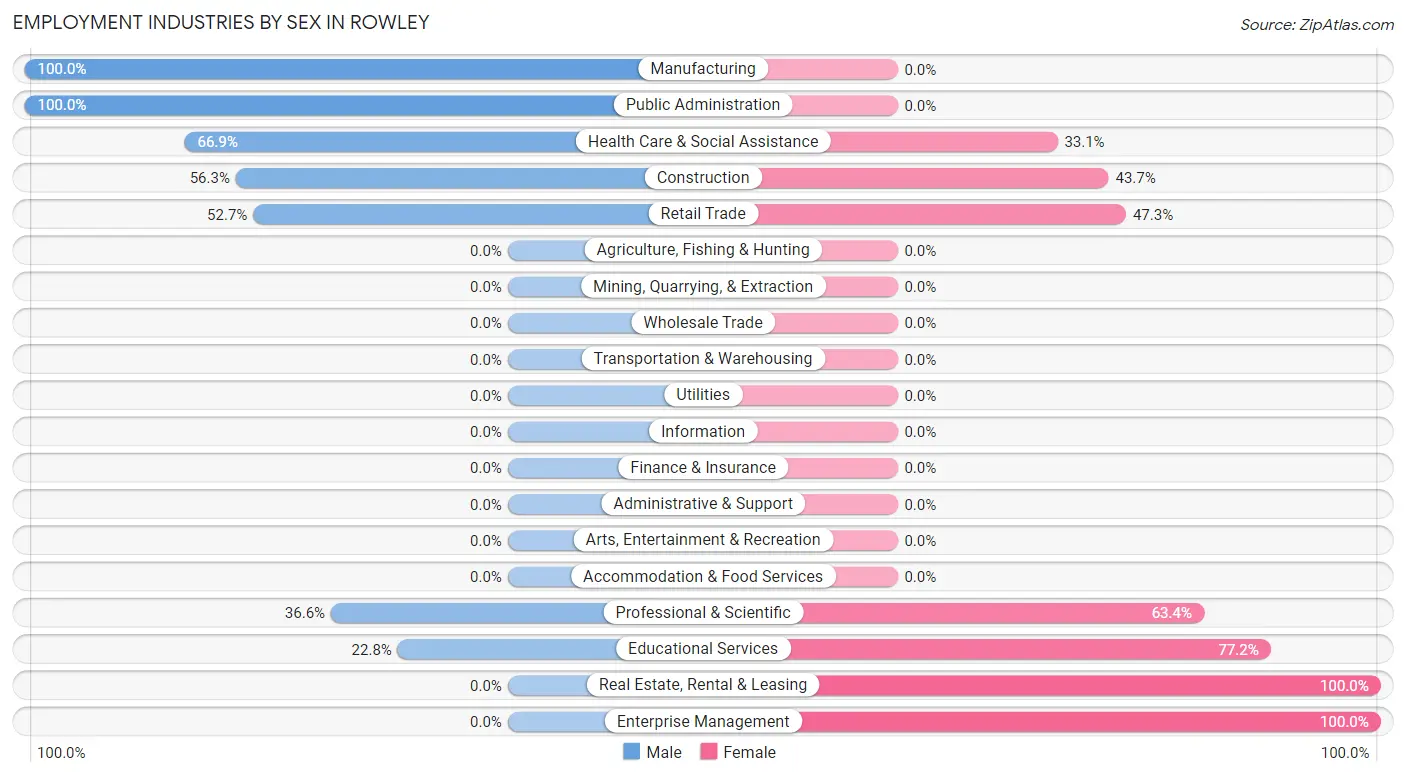
Employment Industries by Sex in Rowley
The Rowley industries that see more men than women are Manufacturing (100.0%), Public Administration (100.0%), and Health Care & Social Assistance (66.9%), whereas the industries that tend to have a higher number of women are Real Estate, Rental & Leasing (100.0%), Enterprise Management (100.0%), and Educational Services (77.2%).
| Industry | Male | Female |
| Agriculture, Fishing & Hunting | 0 (0.0%) | 0 (0.0%) |
| Mining, Quarrying, & Extraction | 0 (0.0%) | 0 (0.0%) |
| Construction | 67 (56.3%) | 52 (43.7%) |
| Manufacturing | 96 (100.0%) | 0 (0.0%) |
| Wholesale Trade | 0 (0.0%) | 0 (0.0%) |
| Retail Trade | 88 (52.7%) | 79 (47.3%) |
| Transportation & Warehousing | 0 (0.0%) | 0 (0.0%) |
| Utilities | 0 (0.0%) | 0 (0.0%) |
| Information | 0 (0.0%) | 0 (0.0%) |
| Finance & Insurance | 0 (0.0%) | 0 (0.0%) |
| Real Estate, Rental & Leasing | 0 (0.0%) | 19 (100.0%) |
| Professional & Scientific | 71 (36.6%) | 123 (63.4%) |
| Enterprise Management | 0 (0.0%) | 19 (100.0%) |
| Administrative & Support | 0 (0.0%) | 0 (0.0%) |
| Educational Services | 54 (22.8%) | 183 (77.2%) |
| Health Care & Social Assistance | 103 (66.9%) | 51 (33.1%) |
| Arts, Entertainment & Recreation | 0 (0.0%) | 0 (0.0%) |
| Accommodation & Food Services | 0 (0.0%) | 0 (0.0%) |
| Public Administration | 13 (100.0%) | 0 (0.0%) |
| Total | 492 (48.3%) | 526 (51.7%) |
Education in Rowley
School Enrollment in Rowley
The most common levels of schooling among the 272 students in Rowley are elementary school (77 | 28.3%), kindergarten (72 | 26.5%), and middle school (66 | 24.3%).
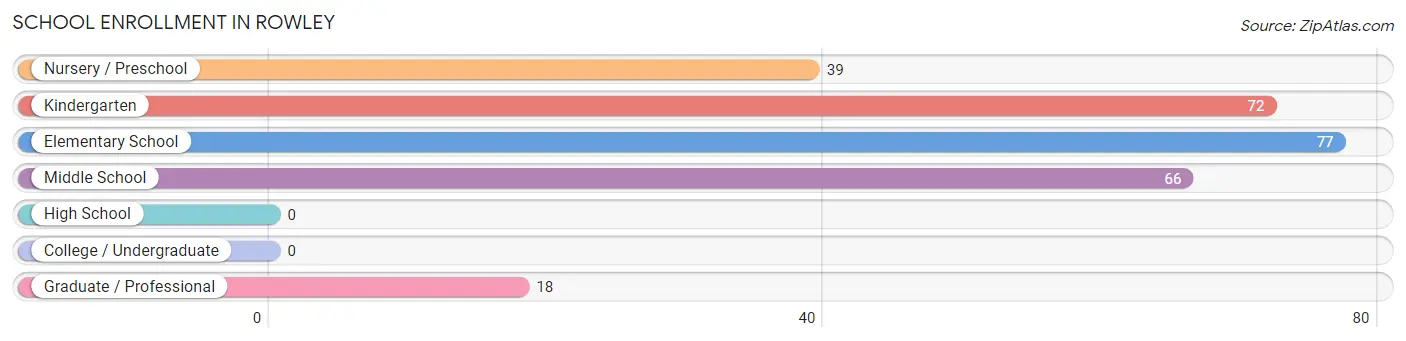
| School Level | # Students | % Students |
| Nursery / Preschool | 39 | 14.3% |
| Kindergarten | 72 | 26.5% |
| Elementary School | 77 | 28.3% |
| Middle School | 66 | 24.3% |
| High School | 0 | 0.0% |
| College / Undergraduate | 0 | 0.0% |
| Graduate / Professional | 18 | 6.6% |
| Total | 272 | 100.0% |
School Enrollment by Age by Funding Source in Rowley
Out of a total of 272 students who are enrolled in schools in Rowley, 80 (29.4%) attend a private institution, while the remaining 192 (70.6%) are enrolled in public schools. The age group of 3 to 4 year olds has the highest likelihood of being enrolled in private schools, with 19 (100.0% in the age bracket) enrolled. Conversely, the age group of 5 to 9 year old has the lowest likelihood of being enrolled in a private school, with 139 (82.3% in the age bracket) attending a public institution.
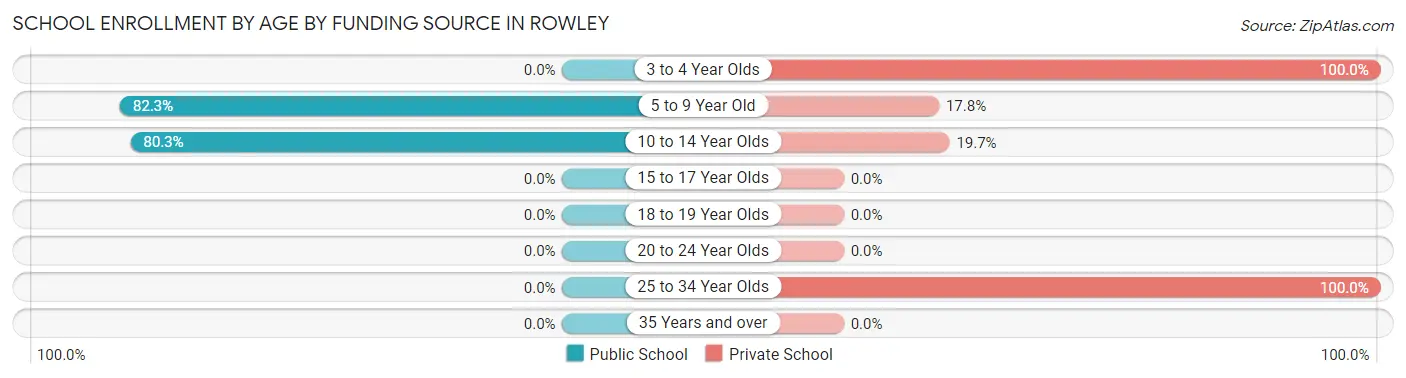
| Age Bracket | Public School | Private School |
| 3 to 4 Year Olds | 0 (0.0%) | 19 (100.0%) |
| 5 to 9 Year Old | 139 (82.3%) | 30 (17.7%) |
| 10 to 14 Year Olds | 53 (80.3%) | 13 (19.7%) |
| 15 to 17 Year Olds | 0 (0.0%) | 0 (0.0%) |
| 18 to 19 Year Olds | 0 (0.0%) | 0 (0.0%) |
| 20 to 24 Year Olds | 0 (0.0%) | 0 (0.0%) |
| 25 to 34 Year Olds | 0 (0.0%) | 18 (100.0%) |
| 35 Years and over | 0 (0.0%) | 0 (0.0%) |
| Total | 192 (70.6%) | 80 (29.4%) |
Educational Attainment by Field of Study in Rowley
Education (204 | 26.0%), social sciences (140 | 17.8%), business (85 | 10.8%), bio, nature & agricultural (81 | 10.3%), and literature & languages (70 | 8.9%) are the most common fields of study among 785 individuals in Rowley who have obtained a bachelor's degree or higher.
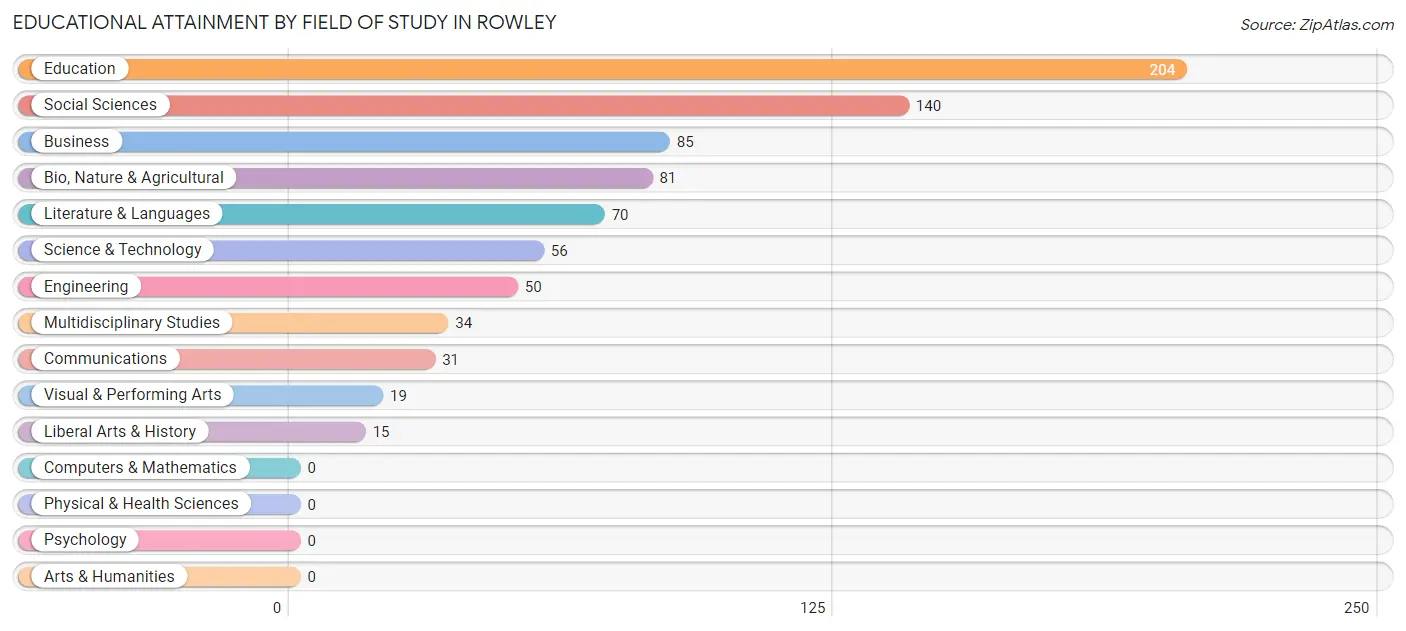
| Field of Study | # Graduates | % Graduates |
| Computers & Mathematics | 0 | 0.0% |
| Bio, Nature & Agricultural | 81 | 10.3% |
| Physical & Health Sciences | 0 | 0.0% |
| Psychology | 0 | 0.0% |
| Social Sciences | 140 | 17.8% |
| Engineering | 50 | 6.4% |
| Multidisciplinary Studies | 34 | 4.3% |
| Science & Technology | 56 | 7.1% |
| Business | 85 | 10.8% |
| Education | 204 | 26.0% |
| Literature & Languages | 70 | 8.9% |
| Liberal Arts & History | 15 | 1.9% |
| Visual & Performing Arts | 19 | 2.4% |
| Communications | 31 | 4.0% |
| Arts & Humanities | 0 | 0.0% |
| Total | 785 | 100.0% |
Transportation & Commute in Rowley
Vehicle Availability by Sex in Rowley
The most prevalent vehicle ownership categories in Rowley are males with 2 vehicles (248, accounting for 50.4%) and females with 2 vehicles (268, making up 47.1%).
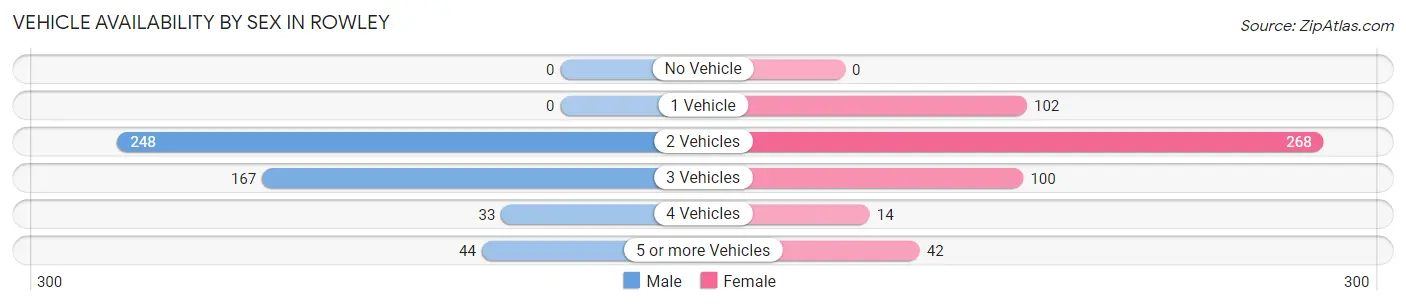
| Vehicles Available | Male | Female |
| No Vehicle | 0 (0.0%) | 0 (0.0%) |
| 1 Vehicle | 0 (0.0%) | 102 (19.4%) |
| 2 Vehicles | 248 (50.4%) | 268 (50.9%) |
| 3 Vehicles | 167 (33.9%) | 100 (19.0%) |
| 4 Vehicles | 33 (6.7%) | 14 (2.7%) |
| 5 or more Vehicles | 44 (8.9%) | 42 (8.0%) |
| Total | 492 (100.0%) | 526 (100.0%) |
Commute Time in Rowley
The most frequently occuring commute durations in Rowley are 45 to 59 minutes (187 commuters, 20.3%), 5 to 9 minutes (164 commuters, 17.8%), and 15 to 19 minutes (118 commuters, 12.8%).
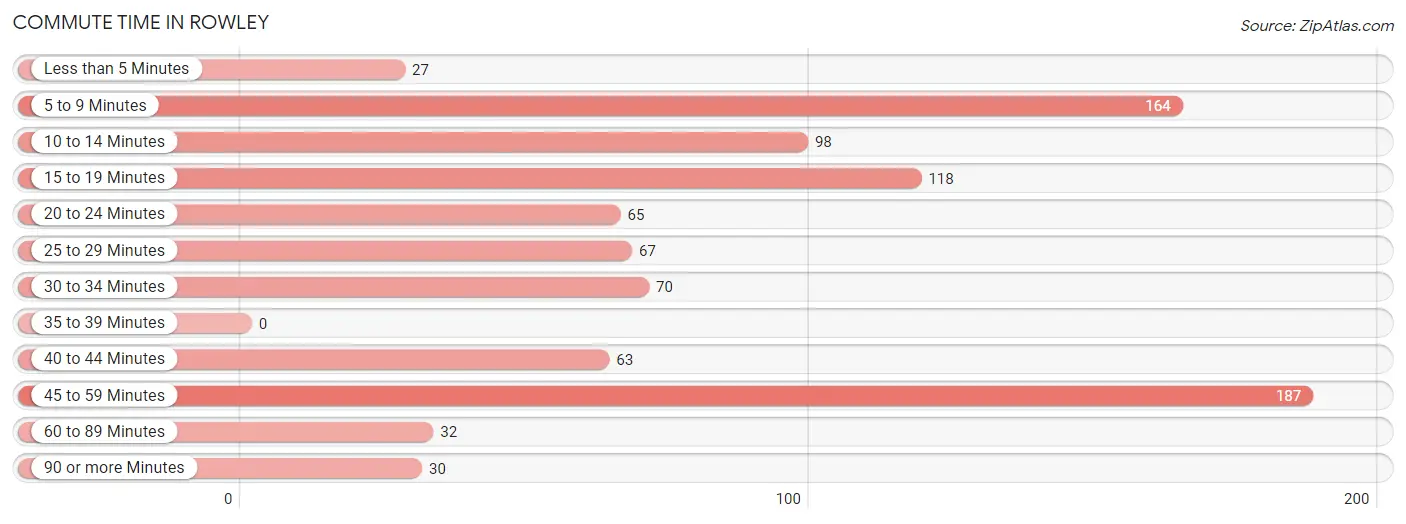
| Commute Time | # Commuters | % Commuters |
| Less than 5 Minutes | 27 | 2.9% |
| 5 to 9 Minutes | 164 | 17.8% |
| 10 to 14 Minutes | 98 | 10.6% |
| 15 to 19 Minutes | 118 | 12.8% |
| 20 to 24 Minutes | 65 | 7.1% |
| 25 to 29 Minutes | 67 | 7.3% |
| 30 to 34 Minutes | 70 | 7.6% |
| 35 to 39 Minutes | 0 | 0.0% |
| 40 to 44 Minutes | 63 | 6.8% |
| 45 to 59 Minutes | 187 | 20.3% |
| 60 to 89 Minutes | 32 | 3.5% |
| 90 or more Minutes | 30 | 3.3% |
Commute Time by Sex in Rowley
The most common commute times in Rowley are 45 to 59 minutes (156 commuters, 36.5%) for males and 15 to 19 minutes (100 commuters, 20.2%) for females.
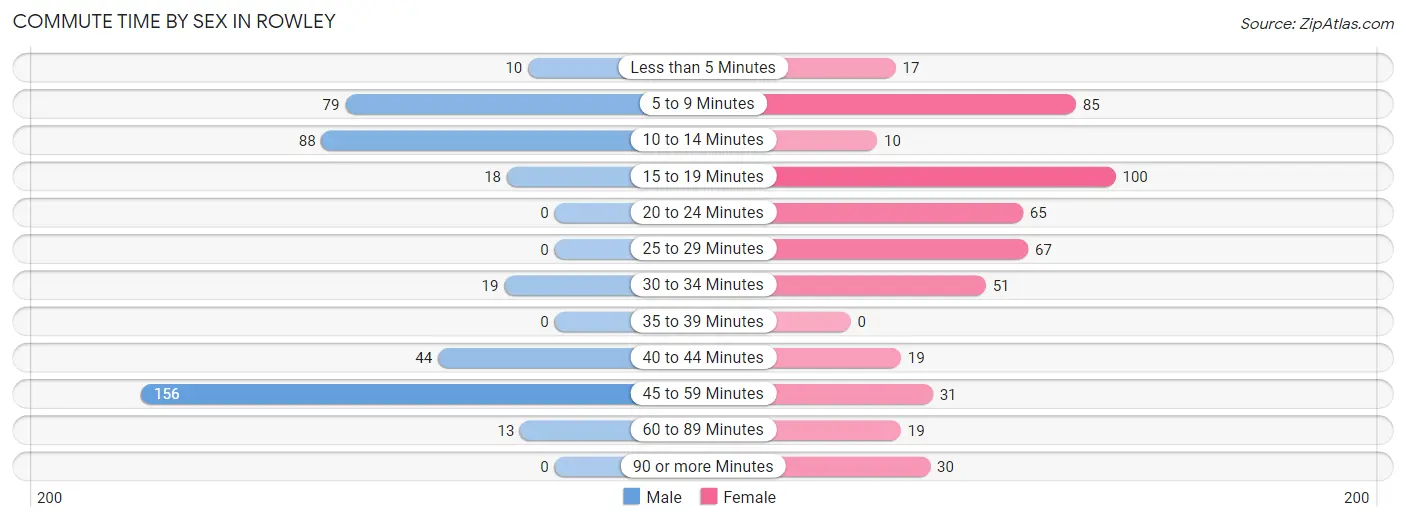
| Commute Time | Male | Female |
| Less than 5 Minutes | 10 (2.3%) | 17 (3.4%) |
| 5 to 9 Minutes | 79 (18.5%) | 85 (17.2%) |
| 10 to 14 Minutes | 88 (20.6%) | 10 (2.0%) |
| 15 to 19 Minutes | 18 (4.2%) | 100 (20.2%) |
| 20 to 24 Minutes | 0 (0.0%) | 65 (13.2%) |
| 25 to 29 Minutes | 0 (0.0%) | 67 (13.6%) |
| 30 to 34 Minutes | 19 (4.4%) | 51 (10.3%) |
| 35 to 39 Minutes | 0 (0.0%) | 0 (0.0%) |
| 40 to 44 Minutes | 44 (10.3%) | 19 (3.8%) |
| 45 to 59 Minutes | 156 (36.5%) | 31 (6.3%) |
| 60 to 89 Minutes | 13 (3.0%) | 19 (3.8%) |
| 90 or more Minutes | 0 (0.0%) | 30 (6.1%) |
Time of Departure to Work by Sex in Rowley
The most frequent times of departure to work in Rowley are 7:00 AM to 7:29 AM (137, 32.1%) for males and 4:00 PM to 11:59 PM (126, 25.5%) for females.
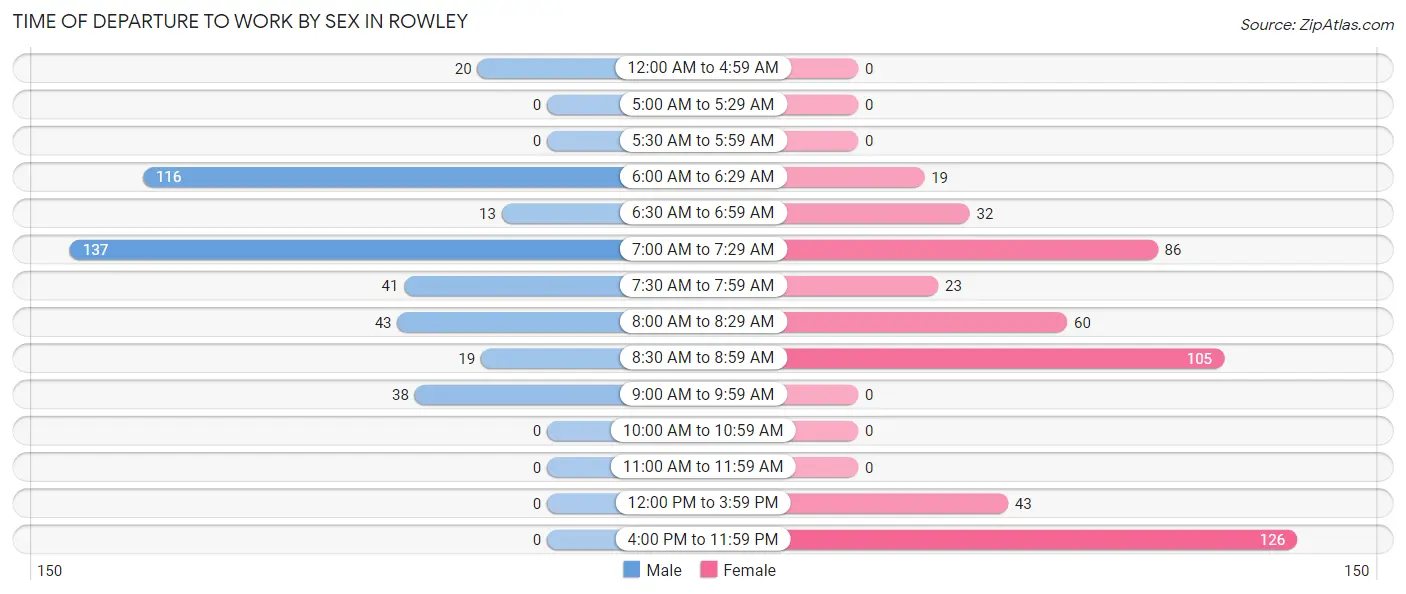
| Time of Departure | Male | Female |
| 12:00 AM to 4:59 AM | 20 (4.7%) | 0 (0.0%) |
| 5:00 AM to 5:29 AM | 0 (0.0%) | 0 (0.0%) |
| 5:30 AM to 5:59 AM | 0 (0.0%) | 0 (0.0%) |
| 6:00 AM to 6:29 AM | 116 (27.2%) | 19 (3.8%) |
| 6:30 AM to 6:59 AM | 13 (3.0%) | 32 (6.5%) |
| 7:00 AM to 7:29 AM | 137 (32.1%) | 86 (17.4%) |
| 7:30 AM to 7:59 AM | 41 (9.6%) | 23 (4.7%) |
| 8:00 AM to 8:29 AM | 43 (10.1%) | 60 (12.1%) |
| 8:30 AM to 8:59 AM | 19 (4.4%) | 105 (21.3%) |
| 9:00 AM to 9:59 AM | 38 (8.9%) | 0 (0.0%) |
| 10:00 AM to 10:59 AM | 0 (0.0%) | 0 (0.0%) |
| 11:00 AM to 11:59 AM | 0 (0.0%) | 0 (0.0%) |
| 12:00 PM to 3:59 PM | 0 (0.0%) | 43 (8.7%) |
| 4:00 PM to 11:59 PM | 0 (0.0%) | 126 (25.5%) |
| Total | 427 (100.0%) | 494 (100.0%) |
Housing Occupancy in Rowley
Occupancy by Ownership in Rowley
Of the total 675 dwellings in Rowley, owner-occupied units account for 524 (77.6%), while renter-occupied units make up 151 (22.4%).
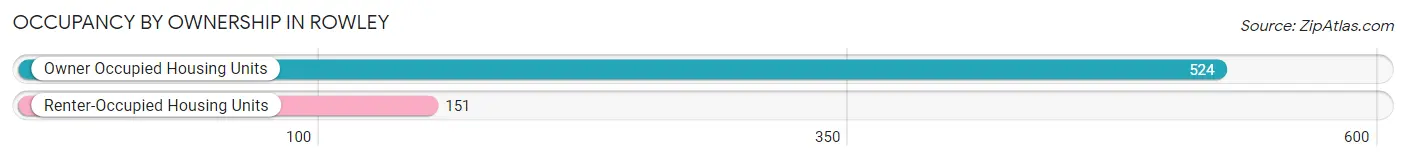
| Occupancy | # Housing Units | % Housing Units |
| Owner Occupied Housing Units | 524 | 77.6% |
| Renter-Occupied Housing Units | 151 | 22.4% |
| Total Occupied Housing Units | 675 | 100.0% |
Occupancy by Household Size in Rowley
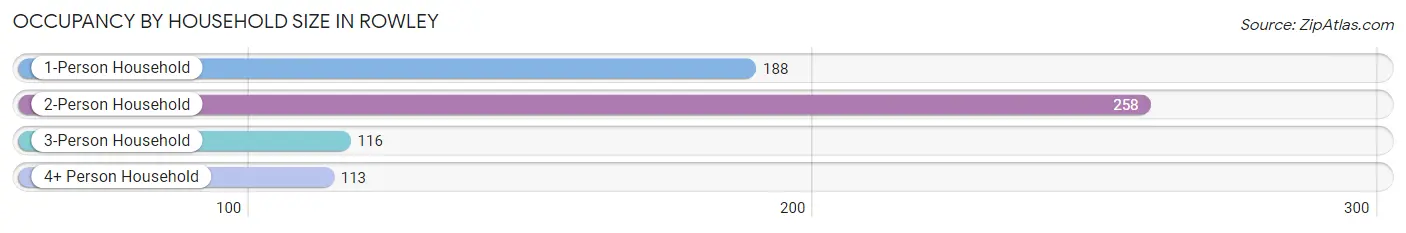
| Household Size | # Housing Units | % Housing Units |
| 1-Person Household | 188 | 27.9% |
| 2-Person Household | 258 | 38.2% |
| 3-Person Household | 116 | 17.2% |
| 4+ Person Household | 113 | 16.7% |
| Total Housing Units | 675 | 100.0% |
Occupancy by Ownership by Household Size in Rowley
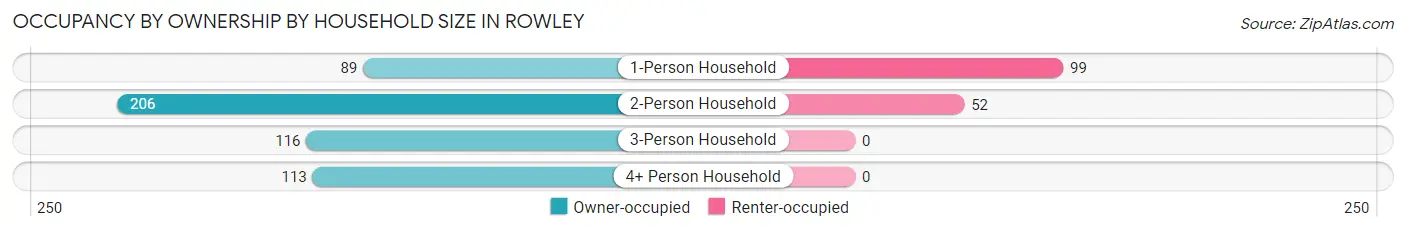
| Household Size | Owner-occupied | Renter-occupied |
| 1-Person Household | 89 (47.3%) | 99 (52.7%) |
| 2-Person Household | 206 (79.8%) | 52 (20.2%) |
| 3-Person Household | 116 (100.0%) | 0 (0.0%) |
| 4+ Person Household | 113 (100.0%) | 0 (0.0%) |
| Total Housing Units | 524 (77.6%) | 151 (22.4%) |
Occupancy by Educational Attainment in Rowley
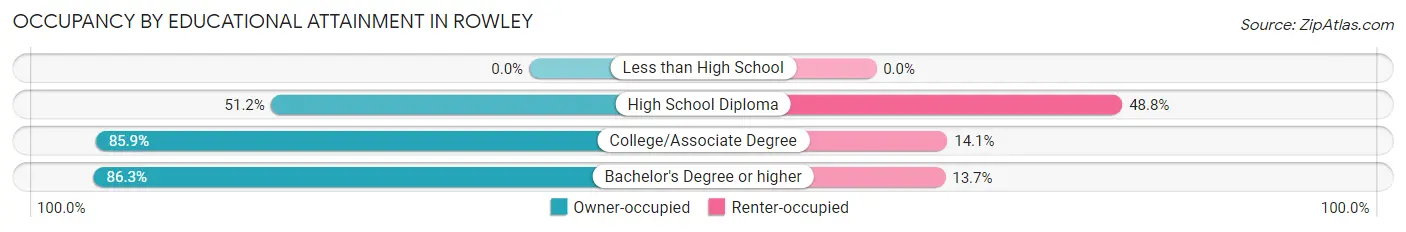
| Household Size | Owner-occupied | Renter-occupied |
| Less than High School | 0 (0.0%) | 0 (0.0%) |
| High School Diploma | 84 (51.2%) | 80 (48.8%) |
| College/Associate Degree | 207 (85.9%) | 34 (14.1%) |
| Bachelor's Degree or higher | 233 (86.3%) | 37 (13.7%) |
Occupancy by Age of Householder in Rowley
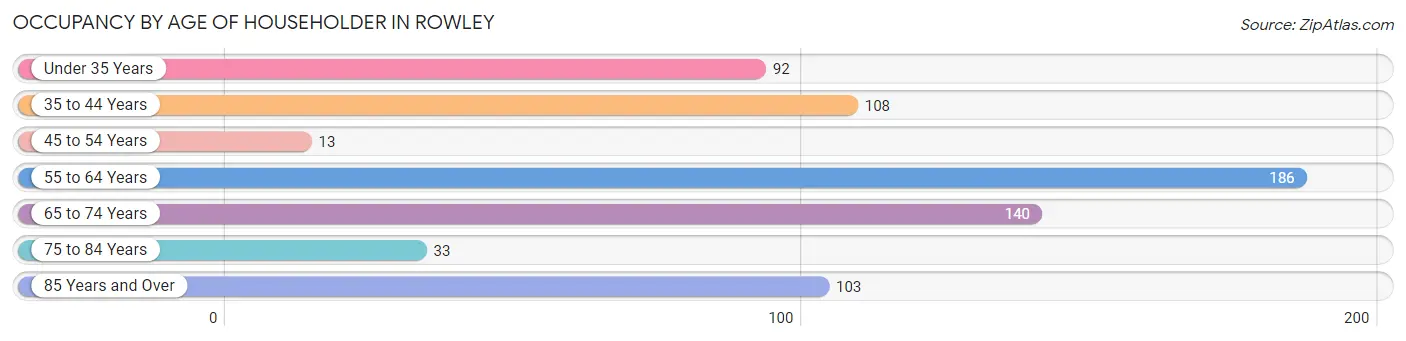
| Age Bracket | # Households | % Households |
| Under 35 Years | 92 | 13.6% |
| 35 to 44 Years | 108 | 16.0% |
| 45 to 54 Years | 13 | 1.9% |
| 55 to 64 Years | 186 | 27.6% |
| 65 to 74 Years | 140 | 20.7% |
| 75 to 84 Years | 33 | 4.9% |
| 85 Years and Over | 103 | 15.3% |
| Total | 675 | 100.0% |
Housing Finances in Rowley
Median Income by Occupancy in Rowley
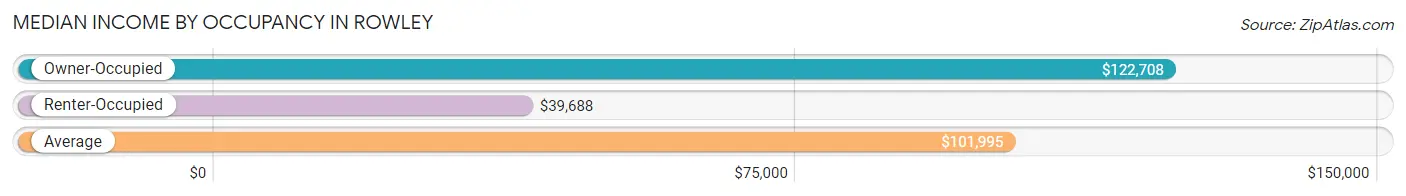
| Occupancy Type | # Households | Median Income |
| Owner-Occupied | 524 (77.6%) | $122,708 |
| Renter-Occupied | 151 (22.4%) | $39,688 |
| Average | 675 (100.0%) | $101,995 |
Occupancy by Householder Income Bracket in Rowley
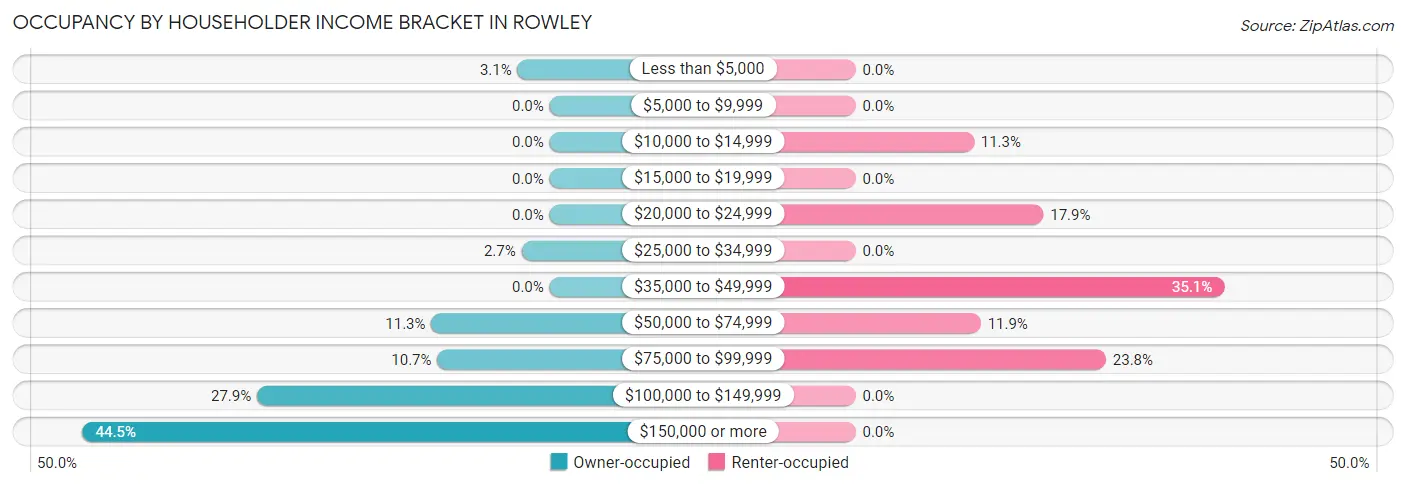
| Income Bracket | Owner-occupied | Renter-occupied |
| Less than $5,000 | 16 (3.0%) | 0 (0.0%) |
| $5,000 to $9,999 | 0 (0.0%) | 0 (0.0%) |
| $10,000 to $14,999 | 0 (0.0%) | 17 (11.3%) |
| $15,000 to $19,999 | 0 (0.0%) | 0 (0.0%) |
| $20,000 to $24,999 | 0 (0.0%) | 27 (17.9%) |
| $25,000 to $34,999 | 14 (2.7%) | 0 (0.0%) |
| $35,000 to $49,999 | 0 (0.0%) | 53 (35.1%) |
| $50,000 to $74,999 | 59 (11.3%) | 18 (11.9%) |
| $75,000 to $99,999 | 56 (10.7%) | 36 (23.8%) |
| $100,000 to $149,999 | 146 (27.9%) | 0 (0.0%) |
| $150,000 or more | 233 (44.5%) | 0 (0.0%) |
| Total | 524 (100.0%) | 151 (100.0%) |
Monthly Housing Cost Tiers in Rowley
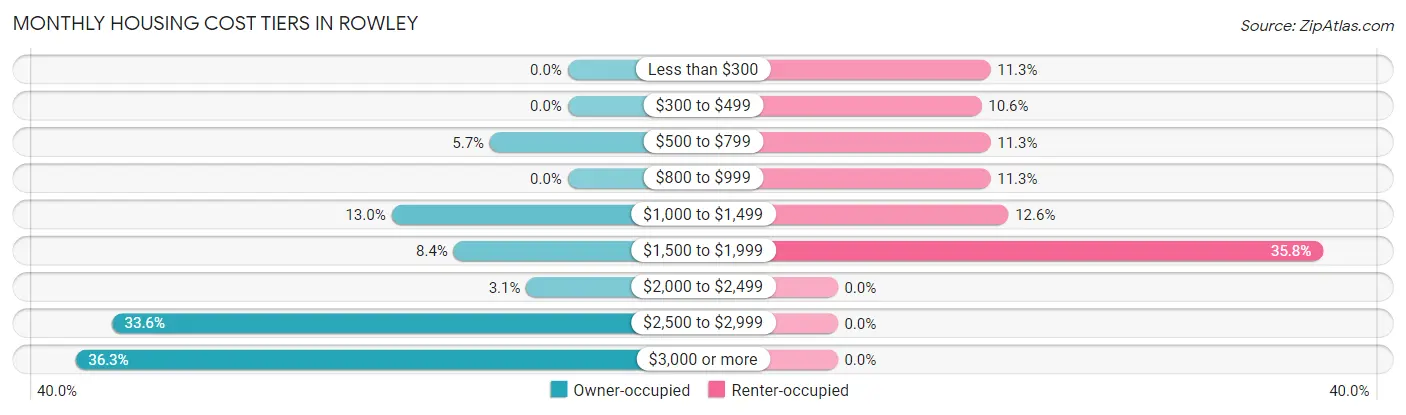
| Monthly Cost | Owner-occupied | Renter-occupied |
| Less than $300 | 0 (0.0%) | 17 (11.3%) |
| $300 to $499 | 0 (0.0%) | 16 (10.6%) |
| $500 to $799 | 30 (5.7%) | 17 (11.3%) |
| $800 to $999 | 0 (0.0%) | 17 (11.3%) |
| $1,000 to $1,499 | 68 (13.0%) | 19 (12.6%) |
| $1,500 to $1,999 | 44 (8.4%) | 54 (35.8%) |
| $2,000 to $2,499 | 16 (3.0%) | 0 (0.0%) |
| $2,500 to $2,999 | 176 (33.6%) | 0 (0.0%) |
| $3,000 or more | 190 (36.3%) | 0 (0.0%) |
| Total | 524 (100.0%) | 151 (100.0%) |
Physical Housing Characteristics in Rowley
Housing Structures in Rowley
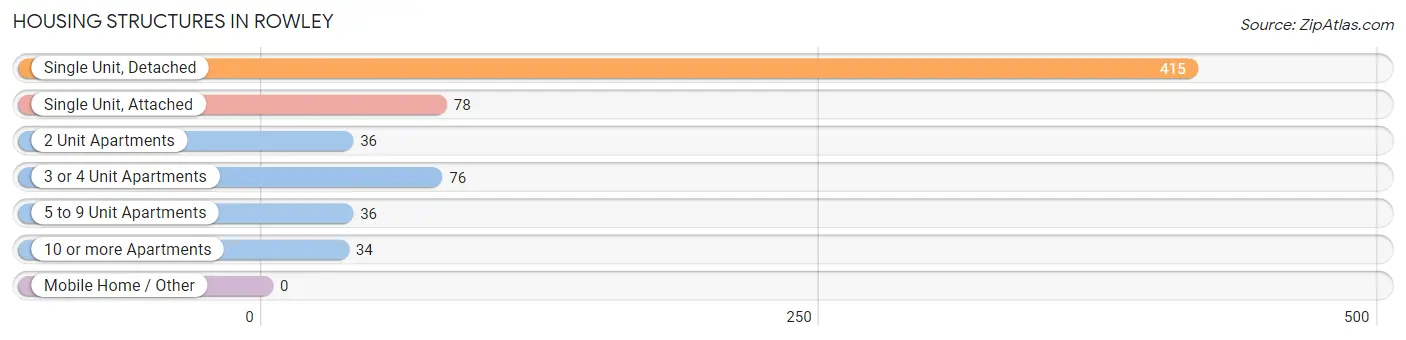
| Structure Type | # Housing Units | % Housing Units |
| Single Unit, Detached | 415 | 61.5% |
| Single Unit, Attached | 78 | 11.6% |
| 2 Unit Apartments | 36 | 5.3% |
| 3 or 4 Unit Apartments | 76 | 11.3% |
| 5 to 9 Unit Apartments | 36 | 5.3% |
| 10 or more Apartments | 34 | 5.0% |
| Mobile Home / Other | 0 | 0.0% |
| Total | 675 | 100.0% |
Housing Structures by Occupancy in Rowley
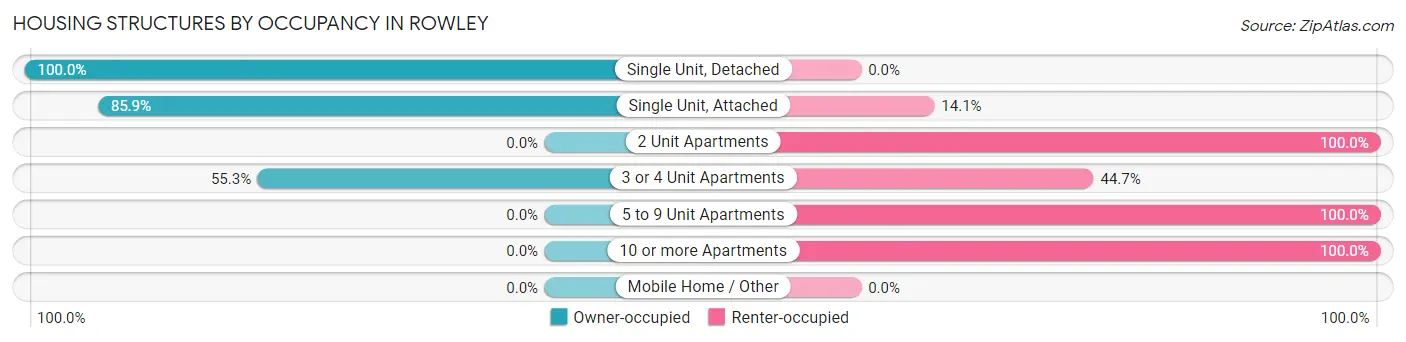
| Structure Type | Owner-occupied | Renter-occupied |
| Single Unit, Detached | 415 (100.0%) | 0 (0.0%) |
| Single Unit, Attached | 67 (85.9%) | 11 (14.1%) |
| 2 Unit Apartments | 0 (0.0%) | 36 (100.0%) |
| 3 or 4 Unit Apartments | 42 (55.3%) | 34 (44.7%) |
| 5 to 9 Unit Apartments | 0 (0.0%) | 36 (100.0%) |
| 10 or more Apartments | 0 (0.0%) | 34 (100.0%) |
| Mobile Home / Other | 0 (0.0%) | 0 (0.0%) |
| Total | 524 (77.6%) | 151 (22.4%) |
Housing Structures by Number of Rooms in Rowley
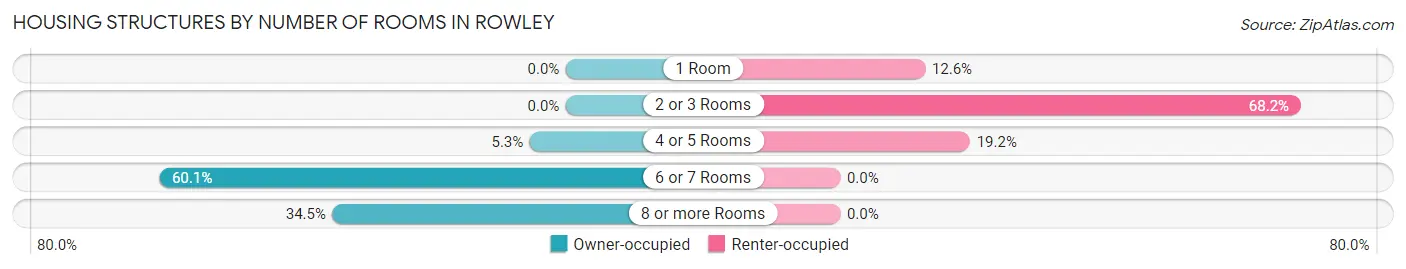
| Number of Rooms | Owner-occupied | Renter-occupied |
| 1 Room | 0 (0.0%) | 19 (12.6%) |
| 2 or 3 Rooms | 0 (0.0%) | 103 (68.2%) |
| 4 or 5 Rooms | 28 (5.3%) | 29 (19.2%) |
| 6 or 7 Rooms | 315 (60.1%) | 0 (0.0%) |
| 8 or more Rooms | 181 (34.5%) | 0 (0.0%) |
| Total | 524 (100.0%) | 151 (100.0%) |
Housing Structure by Heating Type in Rowley
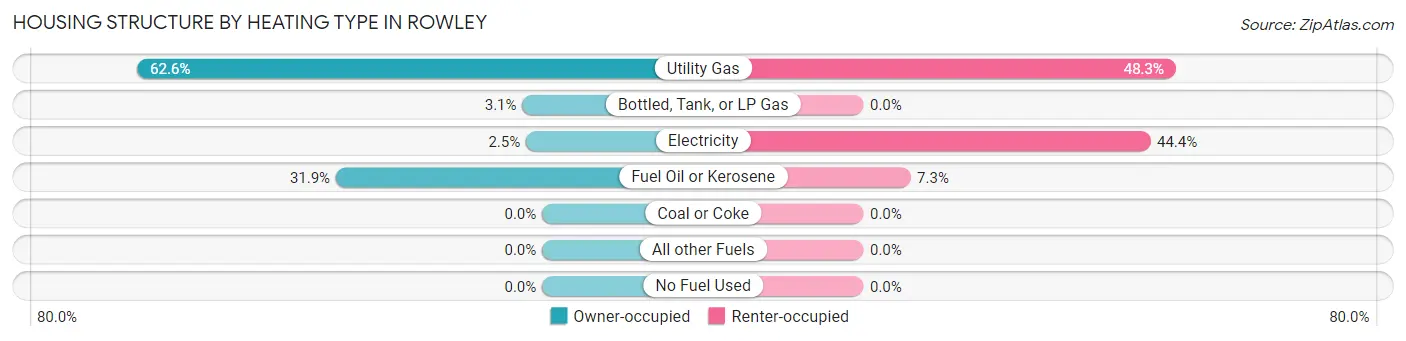
| Heating Type | Owner-occupied | Renter-occupied |
| Utility Gas | 328 (62.6%) | 73 (48.3%) |
| Bottled, Tank, or LP Gas | 16 (3.0%) | 0 (0.0%) |
| Electricity | 13 (2.5%) | 67 (44.4%) |
| Fuel Oil or Kerosene | 167 (31.9%) | 11 (7.3%) |
| Coal or Coke | 0 (0.0%) | 0 (0.0%) |
| All other Fuels | 0 (0.0%) | 0 (0.0%) |
| No Fuel Used | 0 (0.0%) | 0 (0.0%) |
| Total | 524 (100.0%) | 151 (100.0%) |
Household Vehicle Usage in Rowley
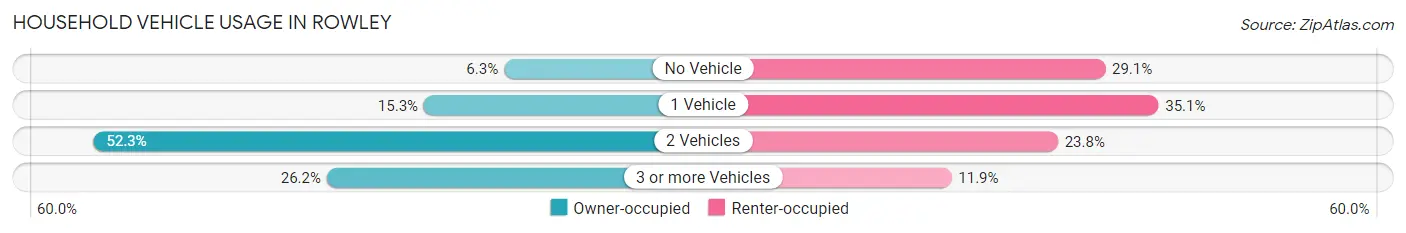
| Vehicles per Household | Owner-occupied | Renter-occupied |
| No Vehicle | 33 (6.3%) | 44 (29.1%) |
| 1 Vehicle | 80 (15.3%) | 53 (35.1%) |
| 2 Vehicles | 274 (52.3%) | 36 (23.8%) |
| 3 or more Vehicles | 137 (26.2%) | 18 (11.9%) |
| Total | 524 (100.0%) | 151 (100.0%) |
Real Estate & Mortgages in Rowley
Real Estate and Mortgage Overview in Rowley
| Characteristic | Without Mortgage | With Mortgage |
| Housing Units | 110 | 414 |
| Median Property Value | $578,100 | $616,200 |
| Median Household Income | $157,321 | $165 |
| Monthly Housing Costs | $1,196 | $190 |
| Real Estate Taxes | $8,433 | $0 |
Property Value by Mortgage Status in Rowley
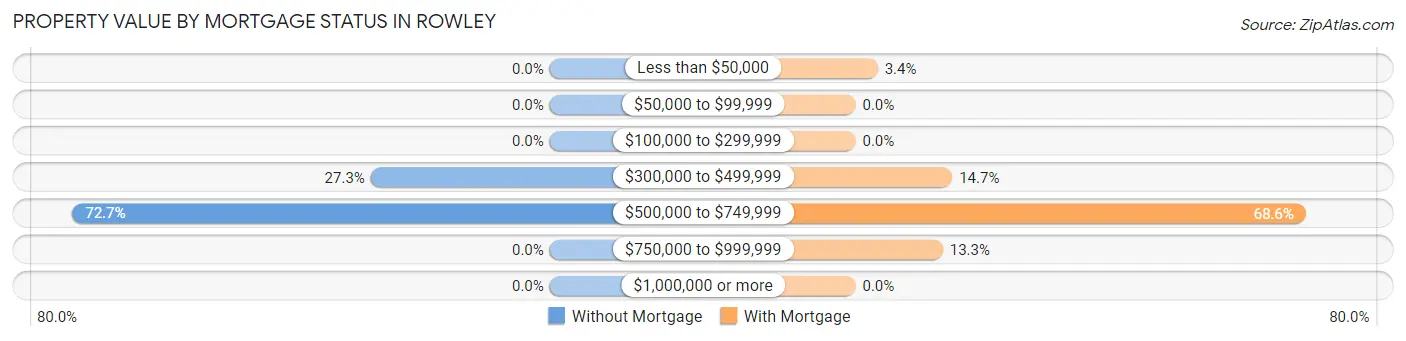
| Property Value | Without Mortgage | With Mortgage |
| Less than $50,000 | 0 (0.0%) | 14 (3.4%) |
| $50,000 to $99,999 | 0 (0.0%) | 0 (0.0%) |
| $100,000 to $299,999 | 0 (0.0%) | 0 (0.0%) |
| $300,000 to $499,999 | 30 (27.3%) | 61 (14.7%) |
| $500,000 to $749,999 | 80 (72.7%) | 284 (68.6%) |
| $750,000 to $999,999 | 0 (0.0%) | 55 (13.3%) |
| $1,000,000 or more | 0 (0.0%) | 0 (0.0%) |
| Total | 110 (100.0%) | 414 (100.0%) |
Household Income by Mortgage Status in Rowley
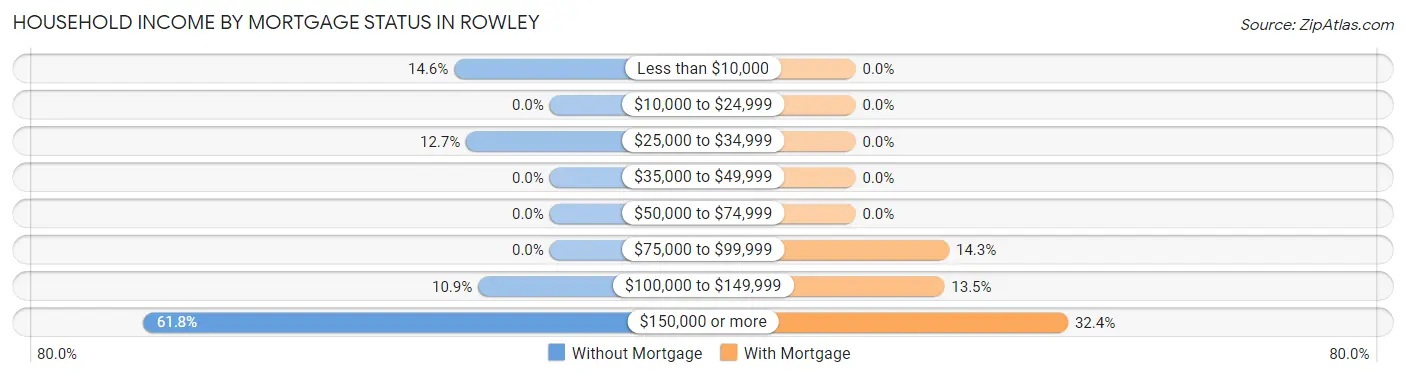
| Household Income | Without Mortgage | With Mortgage |
| Less than $10,000 | 16 (14.5%) | 0 (0.0%) |
| $10,000 to $24,999 | 0 (0.0%) | 0 (0.0%) |
| $25,000 to $34,999 | 14 (12.7%) | 0 (0.0%) |
| $35,000 to $49,999 | 0 (0.0%) | 0 (0.0%) |
| $50,000 to $74,999 | 0 (0.0%) | 0 (0.0%) |
| $75,000 to $99,999 | 0 (0.0%) | 59 (14.2%) |
| $100,000 to $149,999 | 12 (10.9%) | 56 (13.5%) |
| $150,000 or more | 68 (61.8%) | 134 (32.4%) |
| Total | 110 (100.0%) | 414 (100.0%) |
Property Value to Household Income Ratio in Rowley
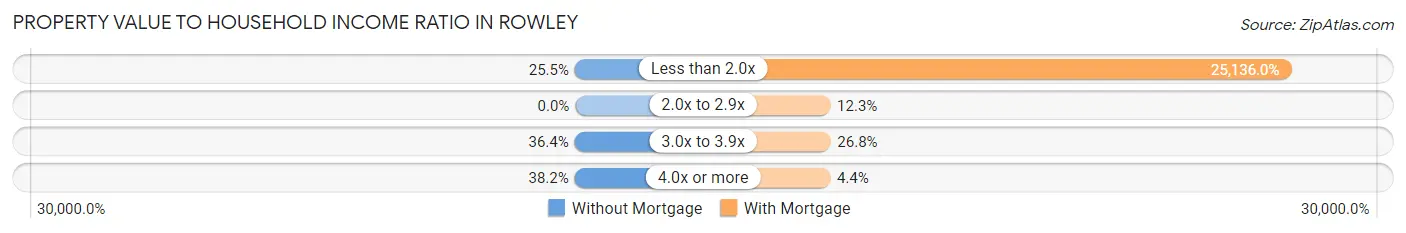
| Value-to-Income Ratio | Without Mortgage | With Mortgage |
| Less than 2.0x | 28 (25.5%) | 104,063 (25,136.0%) |
| 2.0x to 2.9x | 0 (0.0%) | 51 (12.3%) |
| 3.0x to 3.9x | 40 (36.4%) | 111 (26.8%) |
| 4.0x or more | 42 (38.2%) | 18 (4.3%) |
| Total | 110 (100.0%) | 414 (100.0%) |
Real Estate Taxes by Mortgage Status in Rowley
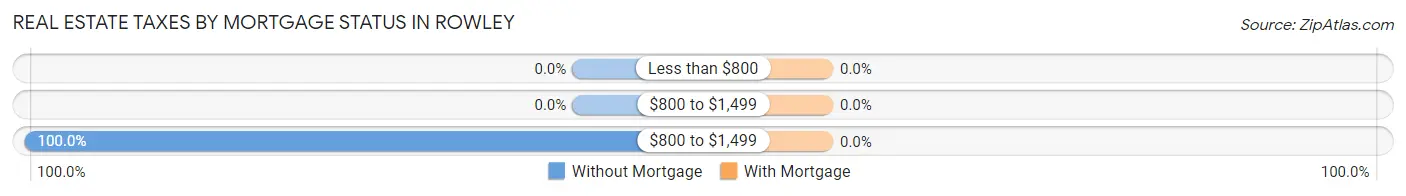
| Property Taxes | Without Mortgage | With Mortgage |
| Less than $800 | 0 (0.0%) | 0 (0.0%) |
| $800 to $1,499 | 0 (0.0%) | 0 (0.0%) |
| $800 to $1,499 | 110 (100.0%) | 0 (0.0%) |
| Total | 110 (100.0%) | 414 (100.0%) |
Health & Disability in Rowley
Health Insurance Coverage by Age in Rowley
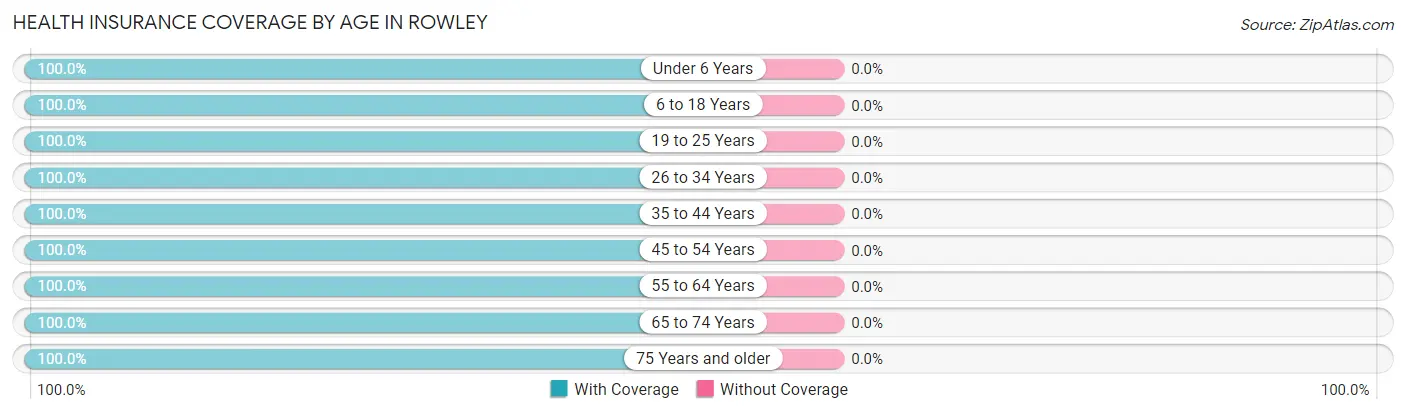
| Age Bracket | With Coverage | Without Coverage |
| Under 6 Years | 158 (100.0%) | 0 (0.0%) |
| 6 to 18 Years | 161 (100.0%) | 0 (0.0%) |
| 19 to 25 Years | 47 (100.0%) | 0 (0.0%) |
| 26 to 34 Years | 251 (100.0%) | 0 (0.0%) |
| 35 to 44 Years | 145 (100.0%) | 0 (0.0%) |
| 45 to 54 Years | 73 (100.0%) | 0 (0.0%) |
| 55 to 64 Years | 412 (100.0%) | 0 (0.0%) |
| 65 to 74 Years | 259 (100.0%) | 0 (0.0%) |
| 75 Years and older | 136 (100.0%) | 0 (0.0%) |
| Total | 1,642 (100.0%) | 0 (0.0%) |
Health Insurance Coverage by Citizenship Status in Rowley
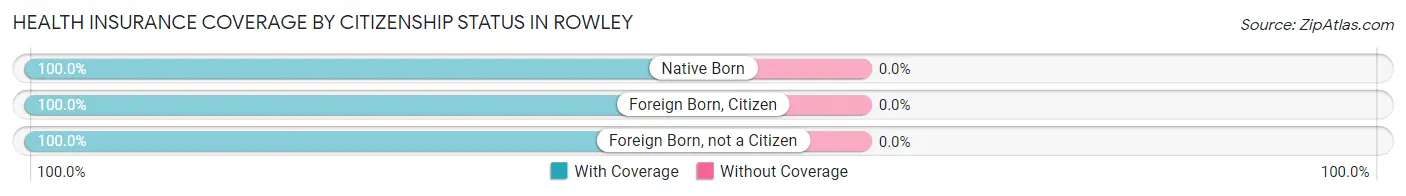
| Citizenship Status | With Coverage | Without Coverage |
| Native Born | 158 (100.0%) | 0 (0.0%) |
| Foreign Born, Citizen | 161 (100.0%) | 0 (0.0%) |
| Foreign Born, not a Citizen | 47 (100.0%) | 0 (0.0%) |
Health Insurance Coverage by Household Income in Rowley
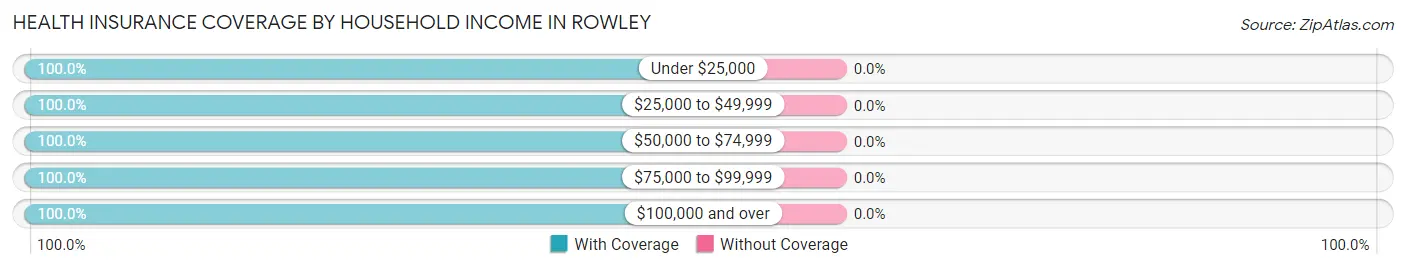
| Household Income | With Coverage | Without Coverage |
| Under $25,000 | 78 (100.0%) | 0 (0.0%) |
| $25,000 to $49,999 | 67 (100.0%) | 0 (0.0%) |
| $50,000 to $74,999 | 125 (100.0%) | 0 (0.0%) |
| $75,000 to $99,999 | 173 (100.0%) | 0 (0.0%) |
| $100,000 and over | 1,199 (100.0%) | 0 (0.0%) |
Public vs Private Health Insurance Coverage by Age in Rowley
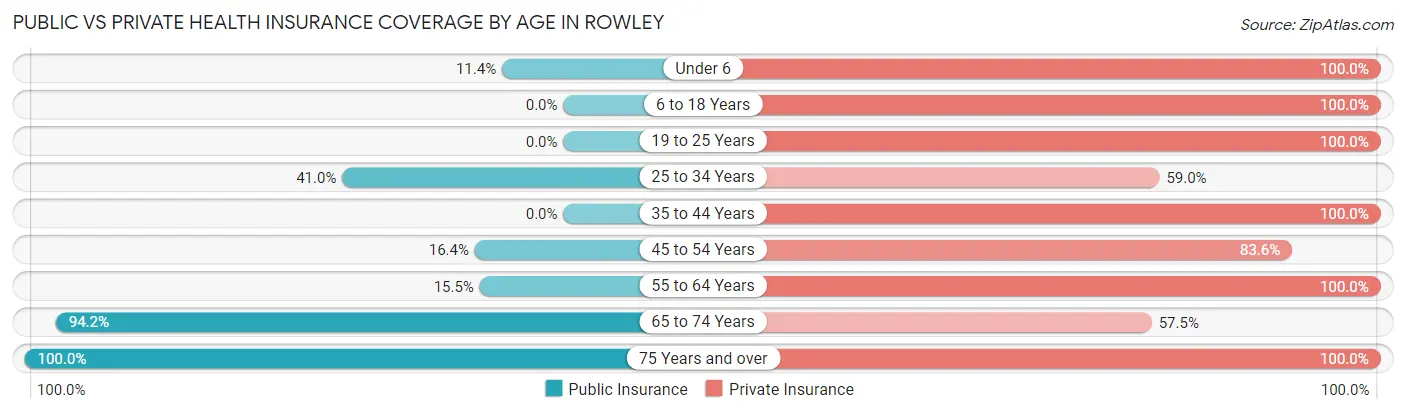
| Age Bracket | Public Insurance | Private Insurance |
| Under 6 | 18 (11.4%) | 158 (100.0%) |
| 6 to 18 Years | 0 (0.0%) | 161 (100.0%) |
| 19 to 25 Years | 0 (0.0%) | 47 (100.0%) |
| 25 to 34 Years | 103 (41.0%) | 148 (59.0%) |
| 35 to 44 Years | 0 (0.0%) | 145 (100.0%) |
| 45 to 54 Years | 12 (16.4%) | 61 (83.6%) |
| 55 to 64 Years | 64 (15.5%) | 412 (100.0%) |
| 65 to 74 Years | 244 (94.2%) | 149 (57.5%) |
| 75 Years and over | 136 (100.0%) | 136 (100.0%) |
| Total | 577 (35.1%) | 1,417 (86.3%) |
Disability Status by Sex by Age in Rowley
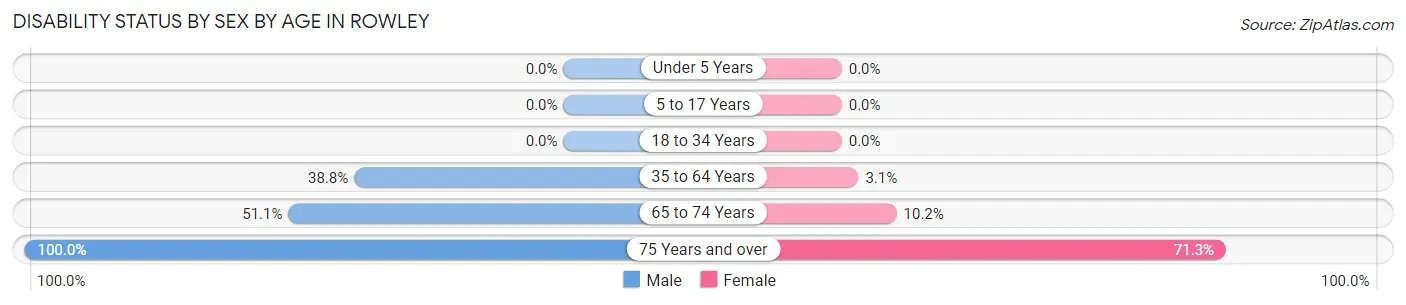
| Age Bracket | Male | Female |
| Under 5 Years | 0 (0.0%) | 0 (0.0%) |
| 5 to 17 Years | 0 (0.0%) | 0 (0.0%) |
| 18 to 34 Years | 0 (0.0%) | 0 (0.0%) |
| 35 to 64 Years | 94 (38.8%) | 12 (3.1%) |
| 65 to 74 Years | 72 (51.1%) | 12 (10.2%) |
| 75 Years and over | 28 (100.0%) | 77 (71.3%) |
Disability Class by Sex by Age in Rowley
Disability Class: Hearing Difficulty
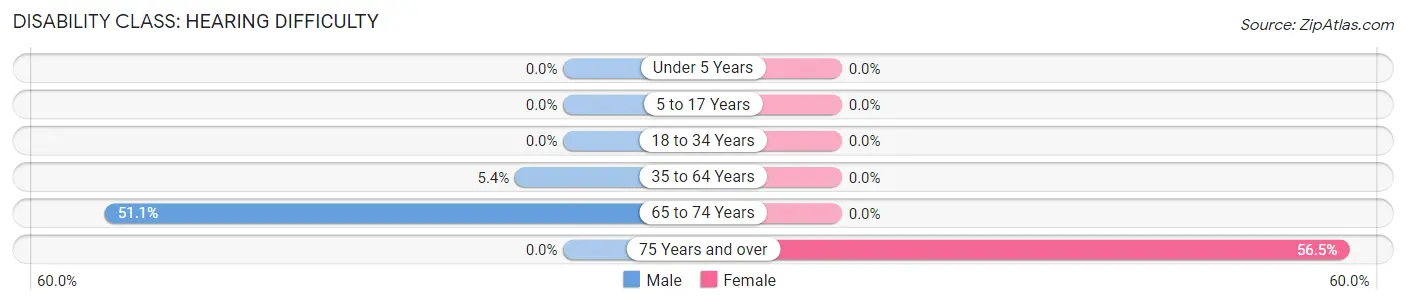
| Age Bracket | Male | Female |
| Under 5 Years | 0 (0.0%) | 0 (0.0%) |
| 5 to 17 Years | 0 (0.0%) | 0 (0.0%) |
| 18 to 34 Years | 0 (0.0%) | 0 (0.0%) |
| 35 to 64 Years | 13 (5.4%) | 0 (0.0%) |
| 65 to 74 Years | 72 (51.1%) | 0 (0.0%) |
| 75 Years and over | 0 (0.0%) | 61 (56.5%) |
Disability Class: Vision Difficulty
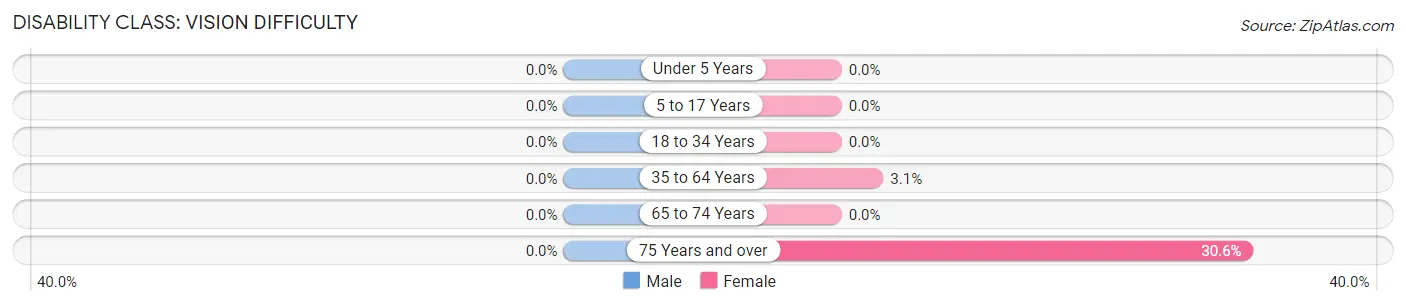
| Age Bracket | Male | Female |
| Under 5 Years | 0 (0.0%) | 0 (0.0%) |
| 5 to 17 Years | 0 (0.0%) | 0 (0.0%) |
| 18 to 34 Years | 0 (0.0%) | 0 (0.0%) |
| 35 to 64 Years | 0 (0.0%) | 12 (3.1%) |
| 65 to 74 Years | 0 (0.0%) | 0 (0.0%) |
| 75 Years and over | 0 (0.0%) | 33 (30.6%) |
Disability Class: Cognitive Difficulty
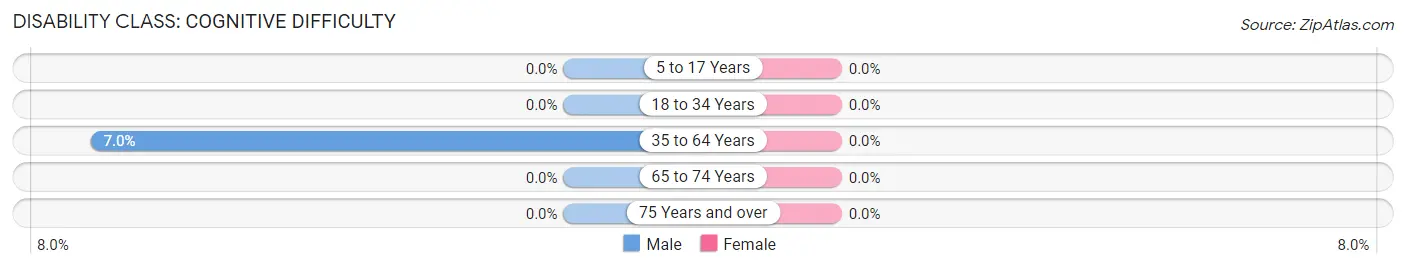
| Age Bracket | Male | Female |
| 5 to 17 Years | 0 (0.0%) | 0 (0.0%) |
| 18 to 34 Years | 0 (0.0%) | 0 (0.0%) |
| 35 to 64 Years | 17 (7.0%) | 0 (0.0%) |
| 65 to 74 Years | 0 (0.0%) | 0 (0.0%) |
| 75 Years and over | 0 (0.0%) | 0 (0.0%) |
Disability Class: Ambulatory Difficulty
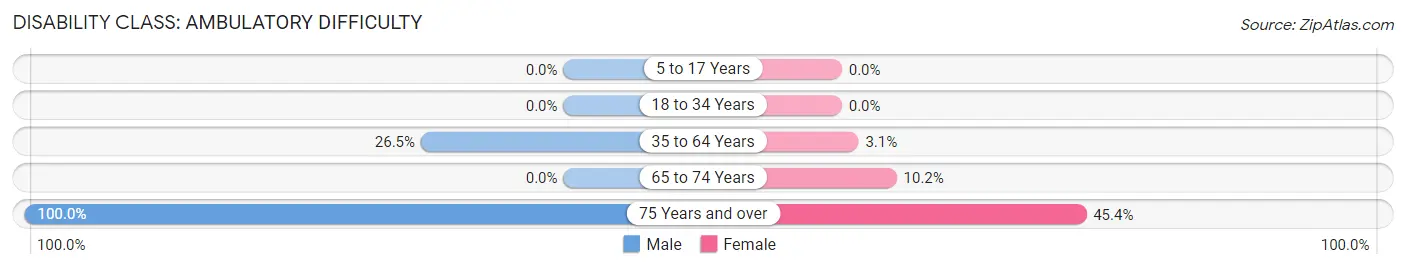
| Age Bracket | Male | Female |
| 5 to 17 Years | 0 (0.0%) | 0 (0.0%) |
| 18 to 34 Years | 0 (0.0%) | 0 (0.0%) |
| 35 to 64 Years | 64 (26.5%) | 12 (3.1%) |
| 65 to 74 Years | 0 (0.0%) | 12 (10.2%) |
| 75 Years and over | 28 (100.0%) | 49 (45.4%) |
Disability Class: Self-Care Difficulty
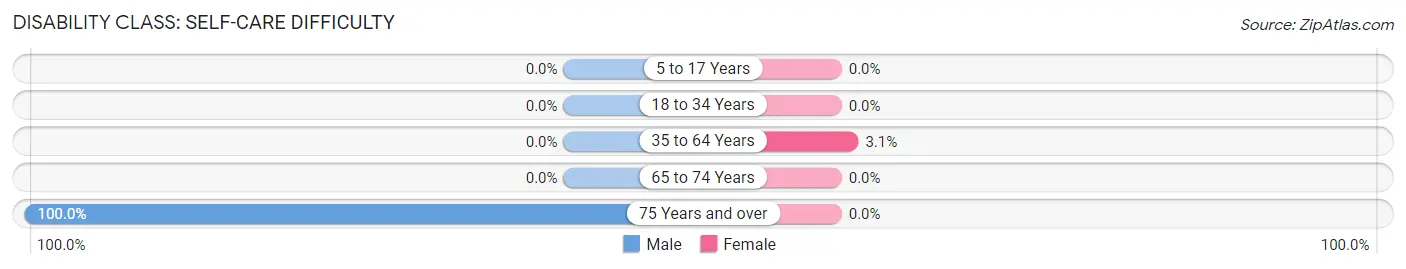
| Age Bracket | Male | Female |
| 5 to 17 Years | 0 (0.0%) | 0 (0.0%) |
| 18 to 34 Years | 0 (0.0%) | 0 (0.0%) |
| 35 to 64 Years | 0 (0.0%) | 12 (3.1%) |
| 65 to 74 Years | 0 (0.0%) | 0 (0.0%) |
| 75 Years and over | 28 (100.0%) | 0 (0.0%) |
Technology Access in Rowley
Computing Device Access in Rowley
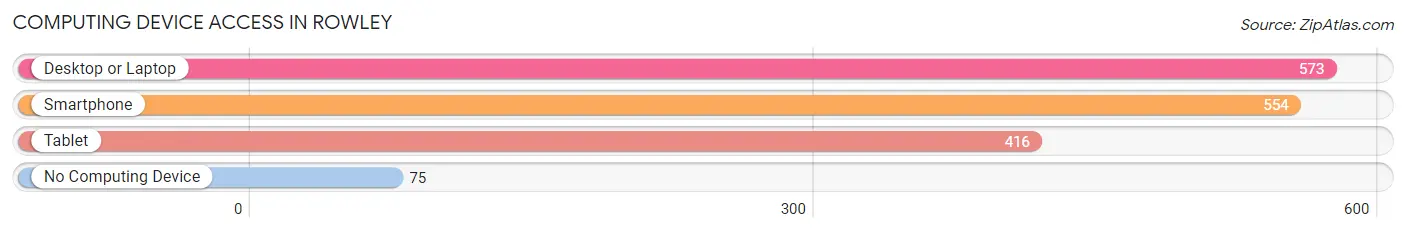
| Device Type | # Households | % Households |
| Desktop or Laptop | 573 | 84.9% |
| Smartphone | 554 | 82.1% |
| Tablet | 416 | 61.6% |
| No Computing Device | 75 | 11.1% |
| Total | 675 | 100.0% |
Internet Access in Rowley
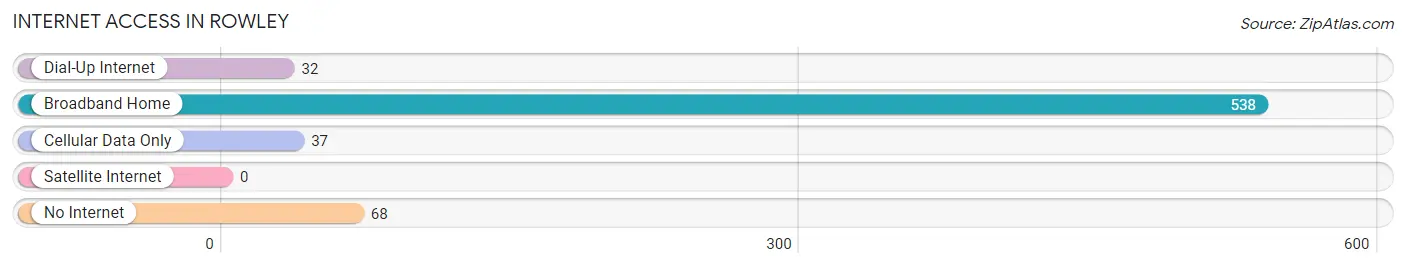
| Internet Type | # Households | % Households |
| Dial-Up Internet | 32 | 4.7% |
| Broadband Home | 538 | 79.7% |
| Cellular Data Only | 37 | 5.5% |
| Satellite Internet | 0 | 0.0% |
| No Internet | 68 | 10.1% |
| Total | 675 | 100.0% |
Rowley Summary
Rowley, Massachusetts is a small town located in the northeastern part of the state, about 25 miles north of Boston. It is part of Essex County and is bordered by Ipswich, Georgetown, and Boxford. The town has a population of about 5,000 people and covers an area of about 15 square miles.
History
Rowley was first settled in 1639 by a group of Puritans from nearby Ipswich. The town was originally part of Ipswich, but was incorporated as its own town in 1639. The town was named after Rowley Regis, a town in England. The town was primarily an agricultural community, with the main crops being corn, wheat, and hay. The town also had a thriving fishing industry, with the Ipswich River providing an abundance of fish.
In the late 19th century, the town began to industrialize, with the establishment of several mills and factories. The most notable of these was the Rowley Woolen Mill, which was established in 1876 and operated until the early 20th century. The town also had a thriving shoe industry, with several factories producing shoes for the local market.
Geography
Rowley is located in northeastern Massachusetts, about 25 miles north of Boston. It is part of Essex County and is bordered by Ipswich, Georgetown, and Boxford. The town has a total area of 15 square miles, of which 14.9 square miles is land and 0.1 square miles is water. The town is located on the Ipswich River, which flows through the town and provides a source of recreation for the town's residents.
The town is mostly rural, with a few small villages scattered throughout. The largest village is Rowley Village, which is located in the center of town. Other villages include East Rowley, West Rowley, and South Rowley.
Economy
Rowley's economy is primarily based on agriculture and tourism. The town is home to several farms, which produce a variety of crops, including corn, wheat, hay, and vegetables. The town also has a thriving tourism industry, with many visitors coming to the town to enjoy its rural beauty and historic sites.
The town also has a few small businesses, including a few restaurants, a grocery store, and a few retail stores. The town also has a few small manufacturing businesses, including a furniture factory and a printing company.
Demographics
As of the 2010 census, the town had a population of 5,095 people. The racial makeup of the town was 97.3% White, 0.7% African American, 0.3% Native American, 0.4% Asian, 0.1% Pacific Islander, 0.3% from other races, and 0.9% from two or more races. Hispanic or Latino of any race were 1.3% of the population.
The median household income in the town was $76,250, and the median family income was $86,250. The per capita income for the town was $32,845. About 4.3% of families and 5.2% of the population were below the poverty line, including 6.2% of those under age 18 and 4.2% of those age 65 or over.
Common Questions
What is the Total Population of Rowley?
Total Population of Rowley is 1,642.
What is the Total Male Population of Rowley?
Total Male Population of Rowley is 729.
What is the Total Female Population of Rowley?
Total Female Population of Rowley is 913.
What is the Ratio of Males per 100 Females in Rowley?
There are 79.85 Males per 100 Females in Rowley.
What is the Ratio of Females per 100 Males in Rowley?
There are 125.24 Females per 100 Males in Rowley.
What is the Median Population Age in Rowley?
Median Population Age in Rowley is 52.3 Years.
What is the Average Family Size in Rowley
Average Family Size in Rowley is 3.0 People.
What is the Average Household Size in Rowley
Average Household Size in Rowley is 2.4 People.
What is Per Capita Income in Rowley?
Per Capita income in Rowley is $70,283.
What is the Median Family Income in Rowley?
Median Family Income in Rowley is $104,316.
What is the Median Household income in Rowley?
Median Household Income in Rowley is $101,995.
What is Inequality or Gini Index in Rowley?
Inequality or Gini Index in Rowley is 0.50.
How Large is the Labor Force in Rowley?
There are 1,017 People in the Labor Forcein in Rowley.
What is the Percentage of People in the Labor Force in Rowley?
76.9% of People are in the Labor Force in Rowley.