Cities with the Highest Percentage of South American Population in New Jersey
RELATED REPORTS & OPTIONS
South American
New Jersey
Compare Cities
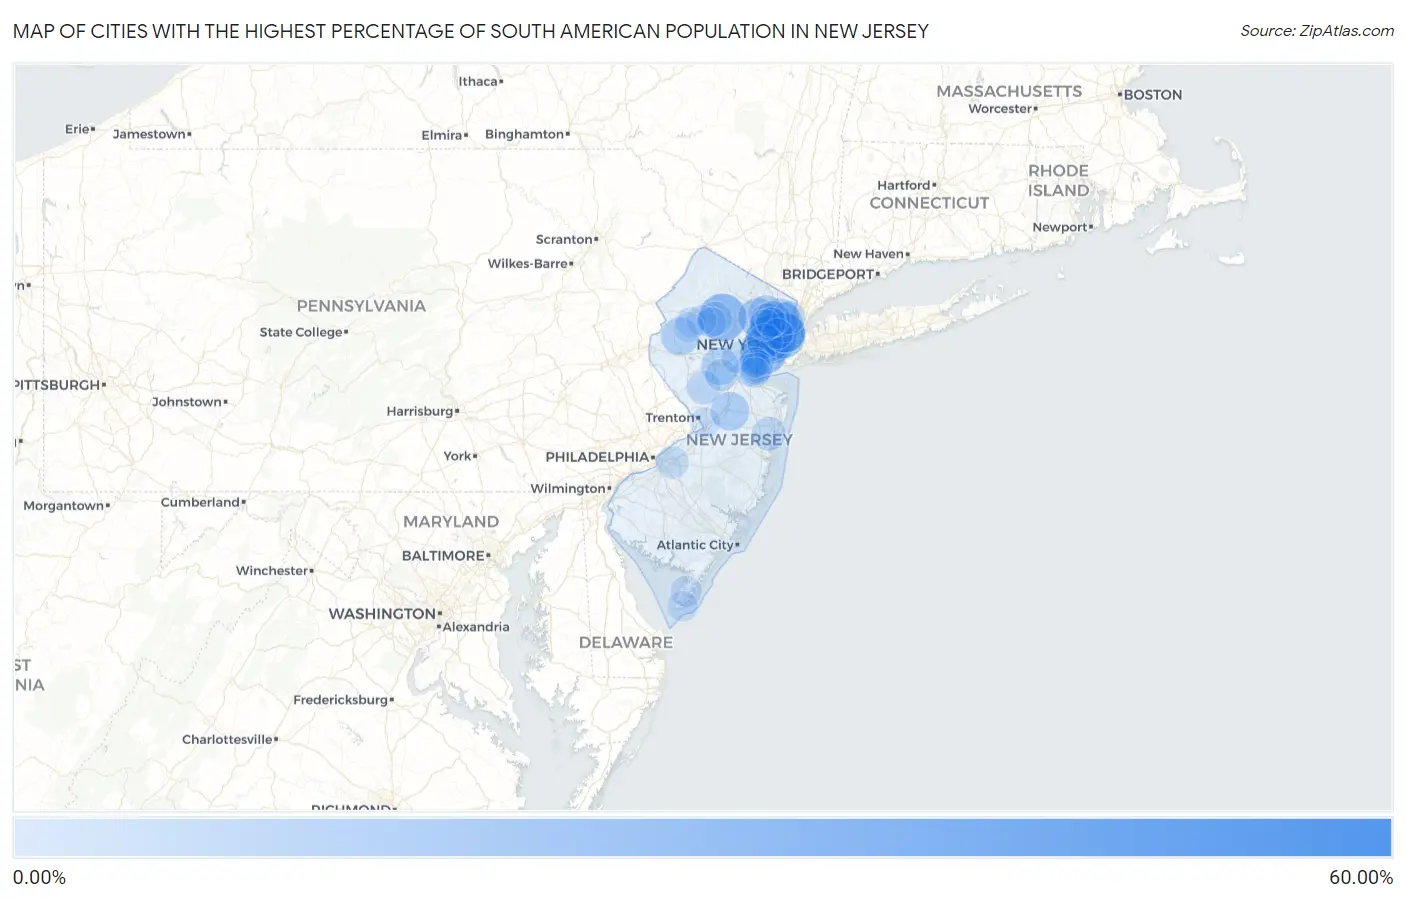
Map of Cities with the Highest Percentage of South American Population in New Jersey
0.00%
60.00%
Cities with the Highest Percentage of South American Population in New Jersey
| City | South American | vs State | vs National | |
| 1. | East Newark Borough | 50.63% | 4.79%(+45.8)#1 | 1.28%(+49.3)#3 |
| 2. | Moonachie Borough | 42.26% | 4.79%(+37.5)#2 | 1.28%(+41.0)#4 |
| 3. | Victory Gardens Borough | 38.73% | 4.79%(+33.9)#3 | 1.28%(+37.4)#8 |
| 4. | Silver Lake Cdp Essex County | 38.28% | 4.79%(+33.5)#4 | 1.28%(+37.0)#9 |
| 5. | Kearny | 26.90% | 4.79%(+22.1)#5 | 1.28%(+25.6)#26 |
| 6. | Wharton Borough | 26.69% | 4.79%(+21.9)#6 | 1.28%(+25.4)#28 |
| 7. | Ampere North | 25.23% | 4.79%(+20.4)#7 | 1.28%(+23.9)#31 |
| 8. | Dover | 24.97% | 4.79%(+20.2)#8 | 1.28%(+23.7)#32 |
| 9. | Prospect Park Borough | 24.19% | 4.79%(+19.4)#9 | 1.28%(+22.9)#35 |
| 10. | Elizabeth | 23.72% | 4.79%(+18.9)#10 | 1.28%(+22.4)#40 |
| 11. | Harrison | 23.08% | 4.79%(+18.3)#11 | 1.28%(+21.8)#44 |
| 12. | Hightstown Borough | 21.93% | 4.79%(+17.1)#12 | 1.28%(+20.6)#51 |
| 13. | Union City | 21.80% | 4.79%(+17.0)#13 | 1.28%(+20.5)#52 |
| 14. | Port Morris | 18.70% | 4.79%(+13.9)#14 | 1.28%(+17.4)#65 |
| 15. | West New York | 18.07% | 4.79%(+13.3)#15 | 1.28%(+16.8)#68 |
| 16. | Ridgefield Park | 16.69% | 4.79%(+11.9)#16 | 1.28%(+15.4)#77 |
| 17. | Guttenberg | 16.57% | 4.79%(+11.8)#17 | 1.28%(+15.3)#78 |
| 18. | Haledon Borough | 16.12% | 4.79%(+11.3)#18 | 1.28%(+14.8)#85 |
| 19. | North Plainfield Borough | 15.77% | 4.79%(+11.0)#19 | 1.28%(+14.5)#90 |
| 20. | Hopelawn | 15.57% | 4.79%(+10.8)#20 | 1.28%(+14.3)#92 |
| 21. | Singac | 15.33% | 4.79%(+10.5)#21 | 1.28%(+14.0)#96 |
| 22. | Twin Rivers | 15.25% | 4.79%(+10.5)#22 | 1.28%(+14.0)#98 |
| 23. | Lodi Borough | 14.92% | 4.79%(+10.1)#23 | 1.28%(+13.6)#100 |
| 24. | Bogota Borough | 14.91% | 4.79%(+10.1)#24 | 1.28%(+13.6)#101 |
| 25. | Hackensack | 14.68% | 4.79%(+9.89)#25 | 1.28%(+13.4)#104 |
| 26. | Anderson | 14.46% | 4.79%(+9.67)#26 | 1.28%(+13.2)#107 |
| 27. | Finderne | 14.10% | 4.79%(+9.31)#27 | 1.28%(+12.8)#115 |
| 28. | Roselle Park Borough | 13.74% | 4.79%(+8.96)#28 | 1.28%(+12.5)#122 |
| 29. | Dunellen Borough | 13.41% | 4.79%(+8.63)#29 | 1.28%(+12.1)#131 |
| 30. | Paterson | 13.29% | 4.79%(+8.50)#30 | 1.28%(+12.0)#132 |
| 31. | Leonia Borough | 12.97% | 4.79%(+8.19)#31 | 1.28%(+11.7)#138 |
| 32. | Totowa Borough | 12.96% | 4.79%(+8.17)#32 | 1.28%(+11.7)#139 |
| 33. | Linden | 12.79% | 4.79%(+8.00)#33 | 1.28%(+11.5)#143 |
| 34. | Little Ferry Borough | 12.74% | 4.79%(+7.96)#34 | 1.28%(+11.5)#145 |
| 35. | Fieldsboro Borough | 12.30% | 4.79%(+7.51)#35 | 1.28%(+11.0)#152 |
| 36. | Clifton | 12.03% | 4.79%(+7.24)#36 | 1.28%(+10.7)#156 |
| 37. | Menlo Park Terrace | 11.97% | 4.79%(+7.18)#37 | 1.28%(+10.7)#158 |
| 38. | Garfield | 11.81% | 4.79%(+7.02)#38 | 1.28%(+10.5)#163 |
| 39. | Newark | 11.13% | 4.79%(+6.35)#39 | 1.28%(+9.85)#174 |
| 40. | North Arlington Borough | 11.12% | 4.79%(+6.33)#40 | 1.28%(+9.83)#175 |
| 41. | Hasbrouck Heights Borough | 10.99% | 4.79%(+6.20)#41 | 1.28%(+9.70)#179 |
| 42. | Jamesburg Borough | 10.89% | 4.79%(+6.11)#42 | 1.28%(+9.61)#184 |
| 43. | Kenvil | 10.51% | 4.79%(+5.73)#43 | 1.28%(+9.23)#193 |
| 44. | Cliffside Park Borough | 10.48% | 4.79%(+5.70)#44 | 1.28%(+9.20)#194 |
| 45. | Roselle Borough | 10.40% | 4.79%(+5.61)#45 | 1.28%(+9.11)#197 |
| 46. | Raritan Borough | 10.18% | 4.79%(+5.39)#46 | 1.28%(+8.90)#203 |
| 47. | Skillman | 10.10% | 4.79%(+5.32)#47 | 1.28%(+8.82)#204 |
| 48. | Ramtown | 10.05% | 4.79%(+5.27)#48 | 1.28%(+8.77)#206 |
| 49. | Bloomingdale Borough | 10.04% | 4.79%(+5.26)#49 | 1.28%(+8.76)#207 |
| 50. | Hamburg Borough | 9.80% | 4.79%(+5.02)#50 | 1.28%(+8.52)#218 |
| 51. | Llewellyn Park | 9.69% | 4.79%(+4.91)#51 | 1.28%(+8.41)#221 |
| 52. | Englewood | 9.42% | 4.79%(+4.64)#52 | 1.28%(+8.14)#234 |
| 53. | Bound Brook Borough | 8.86% | 4.79%(+4.08)#53 | 1.28%(+7.58)#254 |
| 54. | Fords | 8.73% | 4.79%(+3.95)#54 | 1.28%(+7.45)#262 |
| 55. | Woodland Park Borough | 8.71% | 4.79%(+3.92)#55 | 1.28%(+7.42)#263 |
| 56. | Rutherford Borough | 8.57% | 4.79%(+3.79)#56 | 1.28%(+7.29)#268 |
| 57. | Essex Fells Borough | 8.47% | 4.79%(+3.69)#57 | 1.28%(+7.19)#272 |
| 58. | Port Reading | 8.37% | 4.79%(+3.58)#58 | 1.28%(+7.08)#278 |
| 59. | Kingston Estates | 8.34% | 4.79%(+3.56)#59 | 1.28%(+7.06)#279 |
| 60. | East Millstone | 8.32% | 4.79%(+3.53)#60 | 1.28%(+7.03)#280 |
| 61. | Plainfield | 8.22% | 4.79%(+3.44)#61 | 1.28%(+6.94)#288 |
| 62. | Sewaren | 8.20% | 4.79%(+3.41)#62 | 1.28%(+6.92)#289 |
| 63. | Fairview Borough | 8.14% | 4.79%(+3.35)#63 | 1.28%(+6.85)#295 |
| 64. | Elmwood Park Borough | 8.13% | 4.79%(+3.35)#64 | 1.28%(+6.85)#296 |
| 65. | North Haledon Borough | 8.09% | 4.79%(+3.30)#65 | 1.28%(+6.81)#299 |
| 66. | Seaside Heights Borough | 7.89% | 4.79%(+3.11)#66 | 1.28%(+6.61)#308 |
| 67. | Bergenfield Borough | 7.83% | 4.79%(+3.05)#67 | 1.28%(+6.55)#310 |
| 68. | Hi Nella Borough | 7.81% | 4.79%(+3.03)#68 | 1.28%(+6.53)#312 |
| 69. | Teterboro Borough | 7.69% | 4.79%(+2.91)#69 | 1.28%(+6.41)#323 |
| 70. | Watsessing | 7.51% | 4.79%(+2.73)#70 | 1.28%(+6.23)#331 |
| 71. | Brookdale | 7.47% | 4.79%(+2.68)#71 | 1.28%(+6.18)#335 |
| 72. | Far Hills Borough | 7.35% | 4.79%(+2.57)#72 | 1.28%(+6.07)#344 |
| 73. | Hawthorne Borough | 7.19% | 4.79%(+2.40)#73 | 1.28%(+5.91)#356 |
| 74. | Whitesboro | 7.13% | 4.79%(+2.34)#74 | 1.28%(+5.85)#360 |
| 75. | Dumont Borough | 7.07% | 4.79%(+2.28)#75 | 1.28%(+5.78)#363 |
| 76. | Somerville Borough | 6.98% | 4.79%(+2.19)#76 | 1.28%(+5.70)#369 |
| 77. | Kenilworth Borough | 6.93% | 4.79%(+2.14)#77 | 1.28%(+5.64)#373 |
| 78. | Lebanon Borough | 6.87% | 4.79%(+2.08)#78 | 1.28%(+5.58)#380 |
| 79. | Ridgefield Borough | 6.80% | 4.79%(+2.02)#79 | 1.28%(+5.52)#388 |
| 80. | Maywood Borough | 6.75% | 4.79%(+1.97)#80 | 1.28%(+5.47)#394 |
| 81. | Keyport Borough | 6.73% | 4.79%(+1.95)#81 | 1.28%(+5.45)#396 |
| 82. | Cape May | 6.68% | 4.79%(+1.89)#82 | 1.28%(+5.40)#400 |
| 83. | Peapack And Gladstone Borough | 6.68% | 4.79%(+1.89)#83 | 1.28%(+5.39)#401 |
| 84. | Hackettstown | 6.59% | 4.79%(+1.80)#84 | 1.28%(+5.30)#408 |
| 85. | Secaucus | 6.54% | 4.79%(+1.76)#85 | 1.28%(+5.26)#411 |
| 86. | New Milford Borough | 6.54% | 4.79%(+1.76)#86 | 1.28%(+5.26)#413 |
| 87. | White Horse | 6.52% | 4.79%(+1.73)#87 | 1.28%(+5.24)#415 |
| 88. | Waldwick Borough | 6.45% | 4.79%(+1.66)#88 | 1.28%(+5.16)#422 |
| 89. | Avenel | 6.37% | 4.79%(+1.59)#89 | 1.28%(+5.09)#428 |
| 90. | Perth Amboy | 6.34% | 4.79%(+1.56)#90 | 1.28%(+5.06)#432 |
| 91. | Budd Lake | 6.34% | 4.79%(+1.55)#91 | 1.28%(+5.06)#434 |
| 92. | Succasunna | 6.24% | 4.79%(+1.46)#92 | 1.28%(+4.96)#442 |
| 93. | Washington Borough | 6.23% | 4.79%(+1.44)#93 | 1.28%(+4.95)#444 |
| 94. | Oakland Borough | 6.17% | 4.79%(+1.39)#94 | 1.28%(+4.89)#452 |
| 95. | Beattystown | 6.15% | 4.79%(+1.36)#95 | 1.28%(+4.87)#453 |
| 96. | Passaic | 6.14% | 4.79%(+1.36)#96 | 1.28%(+4.86)#455 |
| 97. | Glen Ridge Borough | 6.04% | 4.79%(+1.25)#97 | 1.28%(+4.76)#467 |
| 98. | Rockaway Borough | 6.04% | 4.79%(+1.25)#98 | 1.28%(+4.76)#468 |
| 99. | Middlesex Borough | 6.02% | 4.79%(+1.24)#99 | 1.28%(+4.74)#472 |
| 100. | Wood Ridge Borough | 5.97% | 4.79%(+1.19)#100 | 1.28%(+4.69)#479 |
Common Questions
What are the Top 10 Cities with the Highest Percentage of South American Population in New Jersey?
Top 10 Cities with the Highest Percentage of South American Population in New Jersey are:
#1
26.90%
#2
24.97%
#3
23.72%
#4
23.08%
#5
21.80%
#6
18.07%
#7
16.69%
#8
16.57%
#9
15.33%
#10
15.25%
What city has the Highest Percentage of South American Population in New Jersey?
Kearny has the Highest Percentage of South American Population in New Jersey with 26.90%.
What is the Percentage of South American Population in the State of New Jersey?
Percentage of South American Population in New Jersey is 4.79%.
What is the Percentage of South American Population in the United States?
Percentage of South American Population in the United States is 1.28%.