Cities with the Highest Percentage of South American Population in Pennsylvania
RELATED REPORTS & OPTIONS
South American
Pennsylvania
Compare Cities
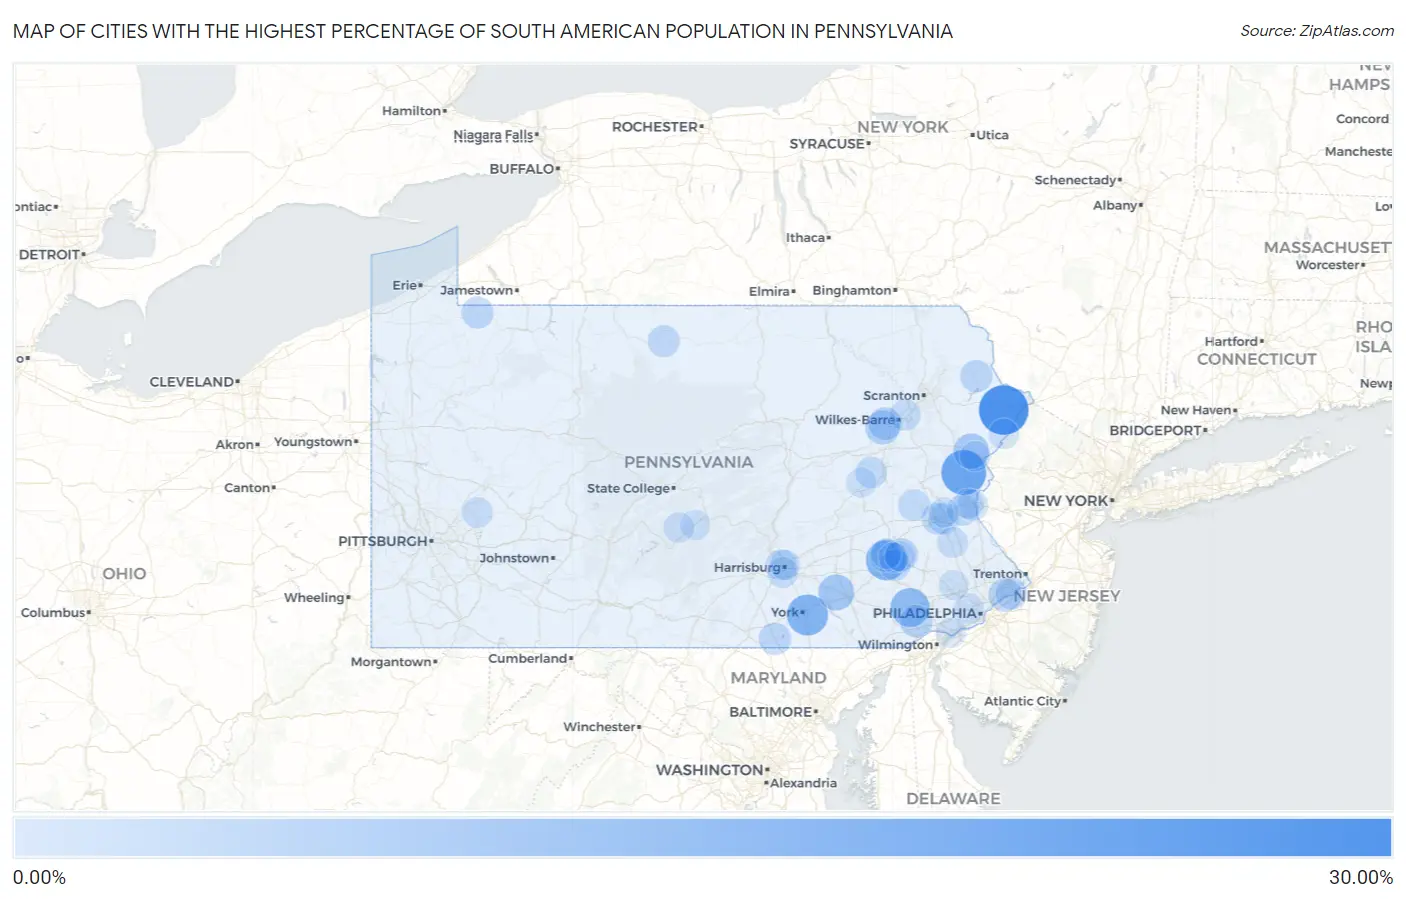
Map of Cities with the Highest Percentage of South American Population in Pennsylvania
0.00%
30.00%
Cities with the Highest Percentage of South American Population in Pennsylvania
| City | South American | vs State | vs National | |
| 1. | Sunrise Lake | 29.00% | 0.66%(+28.3)#1 | 1.28%(+27.7)#17 |
| 2. | Saylorsburg | 22.28% | 0.66%(+21.6)#2 | 1.28%(+21.0)#47 |
| 3. | Queens Gate | 16.84% | 0.66%(+16.2)#3 | 1.28%(+15.6)#74 |
| 4. | Lincoln Park | 16.39% | 0.66%(+15.7)#4 | 1.28%(+15.1)#83 |
| 5. | Caln | 13.94% | 0.66%(+13.3)#5 | 1.28%(+12.7)#119 |
| 6. | Coplay Borough | 10.32% | 0.66%(+9.66)#6 | 1.28%(+9.04)#199 |
| 7. | Salunga | 9.89% | 0.66%(+9.23)#7 | 1.28%(+8.61)#215 |
| 8. | Ashley Borough | 9.49% | 0.66%(+8.83)#8 | 1.28%(+8.21)#231 |
| 9. | Penn Estates | 9.10% | 0.66%(+8.44)#9 | 1.28%(+7.82)#246 |
| 10. | Fawn Grove Borough | 8.22% | 0.66%(+7.56)#10 | 1.28%(+6.94)#287 |
| 11. | Penbrook Borough | 7.99% | 0.66%(+7.32)#11 | 1.28%(+6.70)#304 |
| 12. | Le Raysville Borough | 7.61% | 0.66%(+6.95)#12 | 1.28%(+6.33)#327 |
| 13. | Sheatown | 7.31% | 0.66%(+6.65)#13 | 1.28%(+6.03)#351 |
| 14. | New Hope Borough | 6.67% | 0.66%(+6.01)#14 | 1.28%(+5.39)#402 |
| 15. | Shillington Borough | 6.60% | 0.66%(+5.93)#15 | 1.28%(+5.31)#407 |
| 16. | Catawissa Borough | 6.27% | 0.66%(+5.61)#16 | 1.28%(+4.99)#439 |
| 17. | Cornwells Heights | 6.20% | 0.66%(+5.54)#17 | 1.28%(+4.92)#449 |
| 18. | Freemansburg Borough | 6.08% | 0.66%(+5.42)#18 | 1.28%(+4.80)#460 |
| 19. | Stony Creek Mills | 5.90% | 0.66%(+5.23)#19 | 1.28%(+4.61)#490 |
| 20. | West Nanticoke | 5.68% | 0.66%(+5.02)#20 | 1.28%(+4.40)#515 |
| 21. | Roslyn | 5.65% | 0.66%(+4.99)#21 | 1.28%(+4.37)#518 |
| 22. | Unionville | 5.40% | 0.66%(+4.74)#22 | 1.28%(+4.12)#550 |
| 23. | Stroudsburg Borough | 5.27% | 0.66%(+4.61)#23 | 1.28%(+3.99)#565 |
| 24. | Lansford Borough | 5.23% | 0.66%(+4.57)#24 | 1.28%(+3.95)#573 |
| 25. | White Mills | 4.96% | 0.66%(+4.30)#25 | 1.28%(+3.68)#616 |
| 26. | Parkville | 4.95% | 0.66%(+4.28)#26 | 1.28%(+3.66)#617 |
| 27. | Wilson Borough | 4.92% | 0.66%(+4.26)#27 | 1.28%(+3.64)#620 |
| 28. | Telford Borough | 4.87% | 0.66%(+4.21)#28 | 1.28%(+3.58)#629 |
| 29. | North Catasauqua Borough | 4.77% | 0.66%(+4.11)#29 | 1.28%(+3.49)#652 |
| 30. | Columbus | 4.58% | 0.66%(+3.92)#30 | 1.28%(+3.30)#687 |
| 31. | Sweden Valley | 4.41% | 0.66%(+3.75)#31 | 1.28%(+3.13)#730 |
| 32. | Schellsburg Borough | 4.35% | 0.66%(+3.68)#32 | 1.28%(+3.06)#744 |
| 33. | Cetronia | 4.21% | 0.66%(+3.54)#33 | 1.28%(+2.92)#797 |
| 34. | Ambler Borough | 4.16% | 0.66%(+3.50)#34 | 1.28%(+2.88)#807 |
| 35. | Winterstown Borough | 4.16% | 0.66%(+3.50)#35 | 1.28%(+2.88)#809 |
| 36. | Mount Penn Borough | 4.10% | 0.66%(+3.43)#36 | 1.28%(+2.81)#823 |
| 37. | Croydon | 3.98% | 0.66%(+3.32)#37 | 1.28%(+2.70)#856 |
| 38. | New Tripoli | 3.82% | 0.66%(+3.16)#38 | 1.28%(+2.53)#904 |
| 39. | Laureldale Borough | 3.80% | 0.66%(+3.14)#39 | 1.28%(+2.52)#909 |
| 40. | Sheppton | 3.77% | 0.66%(+3.11)#40 | 1.28%(+2.49)#917 |
| 41. | West Grove Borough | 3.66% | 0.66%(+3.00)#41 | 1.28%(+2.38)#951 |
| 42. | Allentown | 3.65% | 0.66%(+2.99)#42 | 1.28%(+2.37)#959 |
| 43. | Shenandoah Borough | 3.61% | 0.66%(+2.95)#43 | 1.28%(+2.33)#972 |
| 44. | Elverson Borough | 3.52% | 0.66%(+2.85)#44 | 1.28%(+2.23)#999 |
| 45. | Hudson | 3.49% | 0.66%(+2.82)#45 | 1.28%(+2.20)#1,013 |
| 46. | Middletown | 3.48% | 0.66%(+2.82)#46 | 1.28%(+2.20)#1,014 |
| 47. | East Petersburg Borough | 3.44% | 0.66%(+2.78)#47 | 1.28%(+2.16)#1,027 |
| 48. | Flying Hills | 3.38% | 0.66%(+2.72)#48 | 1.28%(+2.10)#1,053 |
| 49. | Tatamy Borough | 3.28% | 0.66%(+2.62)#49 | 1.28%(+2.00)#1,084 |
| 50. | West Fairview | 3.28% | 0.66%(+2.62)#50 | 1.28%(+2.00)#1,085 |
| 51. | Baden Borough | 3.21% | 0.66%(+2.55)#51 | 1.28%(+1.93)#1,114 |
| 52. | Whitfield | 3.21% | 0.66%(+2.54)#52 | 1.28%(+1.92)#1,115 |
| 53. | Easton | 3.19% | 0.66%(+2.53)#53 | 1.28%(+1.91)#1,125 |
| 54. | Akron Borough | 3.17% | 0.66%(+2.51)#54 | 1.28%(+1.88)#1,129 |
| 55. | East Stroudsburg Borough | 3.17% | 0.66%(+2.50)#55 | 1.28%(+1.88)#1,131 |
| 56. | New Milford Borough | 3.10% | 0.66%(+2.44)#56 | 1.28%(+1.82)#1,165 |
| 57. | Mcadoo Borough | 3.06% | 0.66%(+2.40)#57 | 1.28%(+1.78)#1,192 |
| 58. | Mount Holly Springs Borough | 3.05% | 0.66%(+2.39)#58 | 1.28%(+1.77)#1,196 |
| 59. | Fountain Hill Borough | 3.03% | 0.66%(+2.37)#59 | 1.28%(+1.75)#1,206 |
| 60. | Macungie Borough | 2.99% | 0.66%(+2.32)#60 | 1.28%(+1.70)#1,228 |
| 61. | Lower Allen | 2.93% | 0.66%(+2.26)#61 | 1.28%(+1.64)#1,259 |
| 62. | Tamaqua Borough | 2.86% | 0.66%(+2.20)#62 | 1.28%(+1.58)#1,294 |
| 63. | Milford Square | 2.86% | 0.66%(+2.20)#63 | 1.28%(+1.58)#1,298 |
| 64. | Walnutport Borough | 2.82% | 0.66%(+2.15)#64 | 1.28%(+1.53)#1,315 |
| 65. | Pitcairn Borough | 2.79% | 0.66%(+2.13)#65 | 1.28%(+1.51)#1,338 |
| 66. | Jonestown Borough | 2.73% | 0.66%(+2.07)#66 | 1.28%(+1.45)#1,370 |
| 67. | Hyde Park | 2.70% | 0.66%(+2.04)#67 | 1.28%(+1.42)#1,384 |
| 68. | Kennett Square Borough | 2.66% | 0.66%(+2.00)#68 | 1.28%(+1.37)#1,401 |
| 69. | Mckees Rocks Borough | 2.65% | 0.66%(+1.98)#69 | 1.28%(+1.36)#1,409 |
| 70. | Alburtis Borough | 2.61% | 0.66%(+1.95)#70 | 1.28%(+1.32)#1,428 |
| 71. | Downingtown Borough | 2.60% | 0.66%(+1.93)#71 | 1.28%(+1.31)#1,436 |
| 72. | Clarion Borough | 2.59% | 0.66%(+1.93)#72 | 1.28%(+1.31)#1,438 |
| 73. | Spring Ridge | 2.56% | 0.66%(+1.90)#73 | 1.28%(+1.28)#1,457 |
| 74. | Allensville | 2.55% | 0.66%(+1.89)#74 | 1.28%(+1.27)#1,463 |
| 75. | West Easton Borough | 2.53% | 0.66%(+1.87)#75 | 1.28%(+1.25)#1,477 |
| 76. | Mifflintown Borough | 2.48% | 0.66%(+1.82)#76 | 1.28%(+1.20)#1,506 |
| 77. | Port Royal Borough | 2.47% | 0.66%(+1.81)#77 | 1.28%(+1.19)#1,517 |
| 78. | Penn Wynne | 2.38% | 0.66%(+1.72)#78 | 1.28%(+1.10)#1,583 |
| 79. | Chalfont Borough | 2.37% | 0.66%(+1.71)#79 | 1.28%(+1.09)#1,593 |
| 80. | Pocono Mountain Lake Estates | 2.36% | 0.66%(+1.70)#80 | 1.28%(+1.08)#1,597 |
| 81. | Palmer Heights | 2.36% | 0.66%(+1.70)#81 | 1.28%(+1.08)#1,599 |
| 82. | Swedeland | 2.30% | 0.66%(+1.64)#82 | 1.28%(+1.02)#1,635 |
| 83. | Bridgeport Borough | 2.30% | 0.66%(+1.64)#83 | 1.28%(+1.02)#1,636 |
| 84. | Hayti | 2.27% | 0.66%(+1.61)#84 | 1.28%(+0.989)#1,653 |
| 85. | Arlington Heights | 2.25% | 0.66%(+1.59)#85 | 1.28%(+0.967)#1,673 |
| 86. | Harrisburg | 2.23% | 0.66%(+1.57)#86 | 1.28%(+0.950)#1,688 |
| 87. | Pennside | 2.22% | 0.66%(+1.55)#87 | 1.28%(+0.933)#1,705 |
| 88. | Lansdowne Borough | 2.19% | 0.66%(+1.53)#88 | 1.28%(+0.907)#1,726 |
| 89. | Millerstown Borough | 2.19% | 0.66%(+1.52)#89 | 1.28%(+0.903)#1,730 |
| 90. | Mount Carmel Borough | 2.13% | 0.66%(+1.47)#90 | 1.28%(+0.849)#1,767 |
| 91. | East Bangor Borough | 2.11% | 0.66%(+1.45)#91 | 1.28%(+0.831)#1,790 |
| 92. | Chester Heights Borough | 2.11% | 0.66%(+1.44)#92 | 1.28%(+0.822)#1,800 |
| 93. | Strodes Mills | 2.10% | 0.66%(+1.43)#93 | 1.28%(+0.813)#1,805 |
| 94. | Reading | 2.08% | 0.66%(+1.42)#94 | 1.28%(+0.798)#1,819 |
| 95. | Fullerton | 2.08% | 0.66%(+1.42)#95 | 1.28%(+0.795)#1,824 |
| 96. | Shenandoah Heights | 2.02% | 0.66%(+1.36)#96 | 1.28%(+0.741)#1,875 |
| 97. | Linwood | 2.01% | 0.66%(+1.35)#97 | 1.28%(+0.725)#1,892 |
| 98. | Rosemont | 1.97% | 0.66%(+1.31)#98 | 1.28%(+0.685)#1,925 |
| 99. | Trooper | 1.97% | 0.66%(+1.30)#99 | 1.28%(+0.684)#1,928 |
| 100. | Milford Borough | 1.96% | 0.66%(+1.30)#100 | 1.28%(+0.676)#1,933 |
Common Questions
What are the Top 10 Cities with the Highest Percentage of South American Population in Pennsylvania?
Top 10 Cities with the Highest Percentage of South American Population in Pennsylvania are:
#1
29.00%
#2
22.28%
#3
16.84%
#4
16.39%
#5
13.94%
#6
9.89%
#7
9.10%
#8
7.31%
#9
6.20%
#10
5.90%
What city has the Highest Percentage of South American Population in Pennsylvania?
Sunrise Lake has the Highest Percentage of South American Population in Pennsylvania with 29.00%.
What is the Percentage of South American Population in the State of Pennsylvania?
Percentage of South American Population in Pennsylvania is 0.66%.
What is the Percentage of South American Population in the United States?
Percentage of South American Population in the United States is 1.28%.