Cities with the Highest Percentage of Immigrants from Brazil in Connecticut
RELATED REPORTS & OPTIONS
Brazil
Connecticut
Compare Cities
Map of Cities with the Highest Percentage of Immigrants from Brazil in Connecticut
0.00%
10.00%
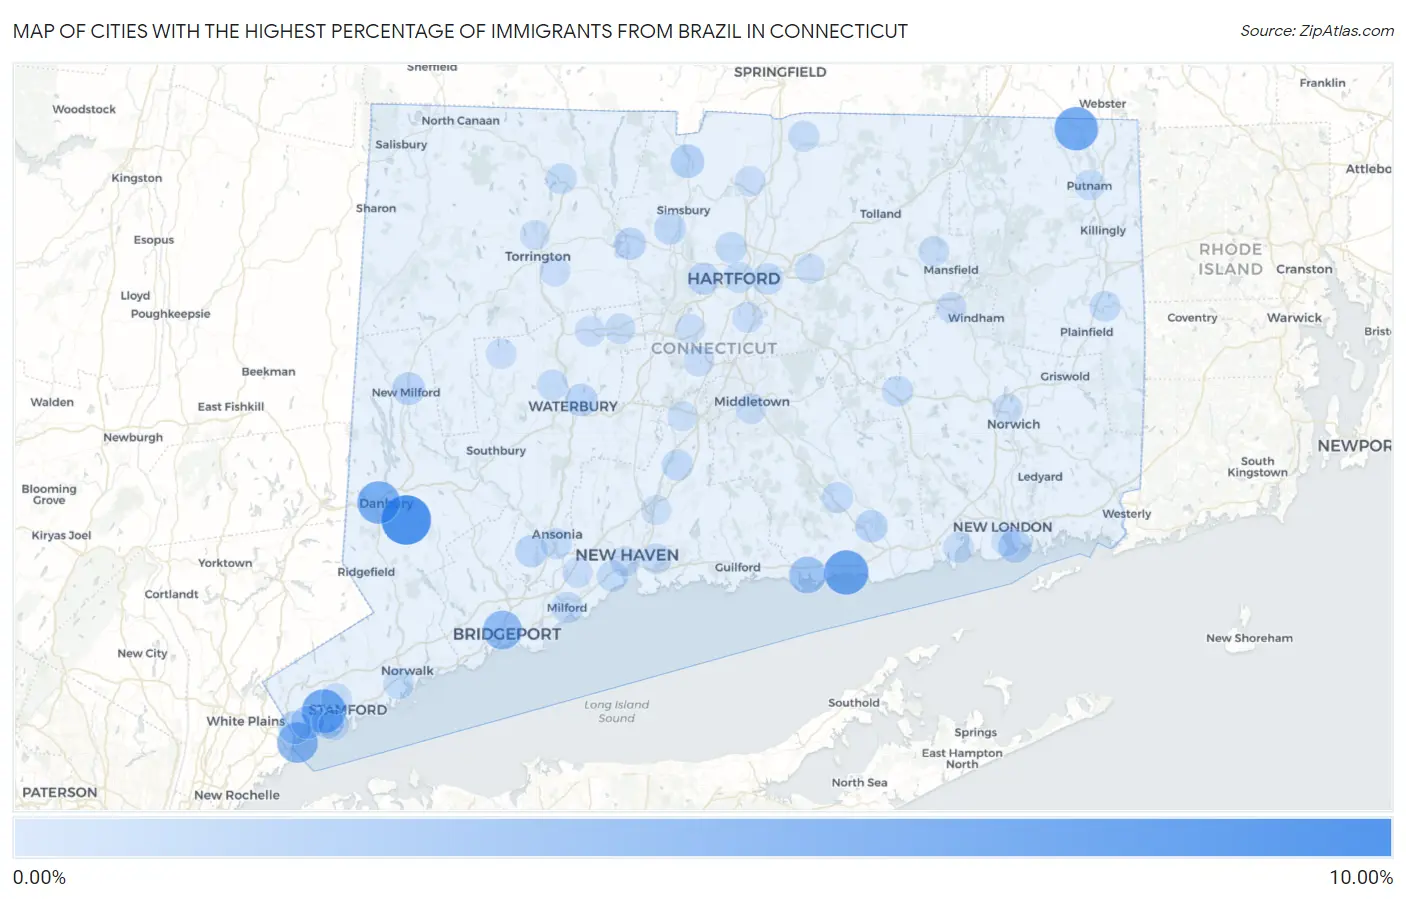
Cities with the Highest Percentage of Immigrants from Brazil in Connecticut
| City | Brazil | vs State | vs National | |
| 1. | Bethel | 9.02% | 0.71%(+8.32)#-1 | 0.17%(+8.85)#0 |
| 2. | Pleasant Valley | 7.49% | 0.71%(+6.79)#0 | 0.17%(+7.33)#1 |
| 3. | Westbrook Center | 6.56% | 0.71%(+5.86)#2 | 0.17%(+6.39)#101 |
| 4. | Cos Cob | 6.30% | 0.71%(+5.59)#3 | 0.17%(+6.13)#102 |
| 5. | Quinebaug | 6.13% | 0.71%(+5.43)#4 | 0.17%(+5.96)#103 |
| 6. | Danbury | 5.77% | 0.71%(+5.07)#10 | 0.17%(+5.60)#2,224 |
| 7. | Byram | 4.79% | 0.71%(+4.08)#11 | 0.17%(+4.62)#2,225 |
| 8. | Trumbull Center | 4.43% | 0.71%(+3.73)#12 | 0.17%(+4.26)#2,226 |
| 9. | Candlewood Orchards | 4.27% | 0.71%(+3.57)#13 | 0.17%(+4.11)#2,227 |
| 10. | Bridgeport | 3.95% | 0.71%(+3.25)#14 | 0.17%(+3.78)#2,228 |
| 11. | Lakes West | 3.46% | 0.71%(+2.76)#15 | 0.17%(+3.29)#2,229 |
| 12. | Route 7 Gateway | 3.27% | 0.71%(+2.57)#16 | 0.17%(+3.10)#2,230 |
| 13. | Murray | 3.11% | 0.71%(+2.41)#17 | 0.17%(+2.94)#2,231 |
| 14. | Clinton | 2.99% | 0.71%(+2.28)#18 | 0.17%(+2.82)#2,232 |
| 15. | Naugatuck Borough | 2.58% | 0.71%(+1.87)#19 | 0.17%(+2.41)#2,563 |
| 16. | Coleytown | 2.39% | 0.71%(+1.68)#20 | 0.17%(+2.22)#2,564 |
| 17. | South Wilton | 2.38% | 0.71%(+1.68)#21 | 0.17%(+2.21)#2,565 |
| 18. | Compo | 2.01% | 0.71%(+1.30)#22 | 0.17%(+1.84)#2,566 |
| 19. | Lakes East | 1.65% | 0.71%(+0.942)#23 | 0.17%(+1.48)#2,567 |
| 20. | Salmon Brook | 1.56% | 0.71%(+0.852)#24 | 0.17%(+1.39)#2,568 |
| 21. | Pemberwick | 1.46% | 0.71%(+0.758)#25 | 0.17%(+1.30)#2,569 |
| 22. | Greenwich | 1.40% | 0.71%(+0.697)#26 | 0.17%(+1.24)#2,570 |
| 23. | Groton | 1.35% | 0.71%(+0.641)#27 | 0.17%(+1.18)#2,571 |
| 24. | Tokeneke | 1.32% | 0.71%(+0.615)#28 | 0.17%(+1.15)#2,572 |
| 25. | New Milford | 1.21% | 0.71%(+0.507)#29 | 0.17%(+1.05)#2,573 |
| 26. | Lordship | 1.14% | 0.71%(+0.438)#30 | 0.17%(+0.976)#2,574 |
| 27. | Waterbury | 1.12% | 0.71%(+0.414)#31 | 0.17%(+0.952)#2,908 |
| 28. | Daniels Farm | 1.07% | 0.71%(+0.366)#32 | 0.17%(+0.905)#2,909 |
| 29. | Old Hill | 1.05% | 0.71%(+0.345)#33 | 0.17%(+0.884)#2,910 |
| 30. | Essex Village | 1.03% | 0.71%(+0.322)#34 | 0.17%(+0.861)#2,911 |
| 31. | Candlewood Shores | 1.01% | 0.71%(+0.305)#35 | 0.17%(+0.843)#2,912 |
| 32. | Collinsville | 0.96% | 0.71%(+0.255)#36 | 0.17%(+0.793)#2,913 |
| 33. | Riverside | 0.96% | 0.71%(+0.252)#37 | 0.17%(+0.790)#2,914 |
| 34. | Shelton | 0.93% | 0.71%(+0.229)#38 | 0.17%(+0.767)#2,915 |
| 35. | Stepney | 0.93% | 0.71%(+0.220)#39 | 0.17%(+0.759)#2,916 |
| 36. | West Hartford | 0.88% | 0.71%(+0.178)#40 | 0.17%(+0.716)#2,917 |
| 37. | Inglenook | 0.83% | 0.71%(+0.127)#41 | 0.17%(+0.665)#2,918 |
| 38. | Weatogue | 0.82% | 0.71%(+0.119)#42 | 0.17%(+0.657)#2,919 |
| 39. | Plattsville | 0.80% | 0.71%(+0.094)#43 | 0.17%(+0.632)#2,920 |
| 40. | Westport | 0.71% | 0.71%(+0.007)#44 | 0.17%(+0.545)#2,921 |
| 41. | East Hartford | 0.67% | 0.71%(-0.036)#45 | 0.17%(+0.503)#2,922 |
| 42. | Blue Hills | 0.63% | 0.71%(-0.076)#46 | 0.17%(+0.463)#2,923 |
| 43. | Wallingford Center | 0.57% | 0.71%(-0.139)#47 | 0.17%(+0.399)#2,924 |
| 44. | Milford City Balance | 0.54% | 0.71%(-0.166)#48 | 0.17%(+0.372)#3,701 |
| 45. | West Haven | 0.52% | 0.71%(-0.188)#49 | 0.17%(+0.350)#3,702 |
| 46. | Stamford | 0.47% | 0.71%(-0.232)#50 | 0.17%(+0.307)#3,703 |
| 47. | Hartford | 0.46% | 0.71%(-0.250)#51 | 0.17%(+0.288)#3,704 |
| 48. | Colchester | 0.43% | 0.71%(-0.274)#52 | 0.17%(+0.265)#3,705 |
| 49. | Moosup | 0.41% | 0.71%(-0.296)#53 | 0.17%(+0.243)#3,706 |
| 50. | Chester Center | 0.40% | 0.71%(-0.300)#54 | 0.17%(+0.238)#3,707 |
| 51. | Derby | 0.40% | 0.71%(-0.301)#55 | 0.17%(+0.237)#3,708 |
| 52. | Oakville | 0.39% | 0.71%(-0.311)#56 | 0.17%(+0.227)#3,709 |
| 53. | Winsted | 0.39% | 0.71%(-0.313)#57 | 0.17%(+0.226)#3,710 |
| 54. | Groton Long Point Borough | 0.39% | 0.71%(-0.318)#58 | 0.17%(+0.220)#3,711 |
| 55. | Norwalk | 0.38% | 0.71%(-0.323)#59 | 0.17%(+0.215)#3,712 |
| 56. | Hazardville | 0.38% | 0.71%(-0.329)#60 | 0.17%(+0.209)#3,713 |
| 57. | Niantic | 0.37% | 0.71%(-0.333)#61 | 0.17%(+0.205)#3,714 |
| 58. | East Haven | 0.31% | 0.71%(-0.393)#62 | 0.17%(+0.145)#3,715 |
| 59. | Bristol | 0.29% | 0.71%(-0.413)#63 | 0.17%(+0.125)#3,716 |
| 60. | Putnam | 0.29% | 0.71%(-0.414)#64 | 0.17%(+0.125)#3,717 |
| 61. | Storrs | 0.27% | 0.71%(-0.432)#65 | 0.17%(+0.106)#3,718 |
| 62. | Old Greenwich | 0.24% | 0.71%(-0.464)#66 | 0.17%(+0.074)#3,719 |
| 63. | Bethlehem Village | 0.19% | 0.71%(-0.515)#67 | 0.17%(+0.023)#3,720 |
| 64. | Kensington | 0.19% | 0.71%(-0.517)#68 | 0.17%(+0.021)#3,721 |
| 65. | Northwest Harwinton | 0.19% | 0.71%(-0.518)#69 | 0.17%(+0.021)#3,722 |
| 66. | Terryville | 0.18% | 0.71%(-0.525)#70 | 0.17%(+0.013)#3,723 |
| 67. | New Haven | 0.18% | 0.71%(-0.527)#71 | 0.17%(+0.011)#3,724 |
| 68. | Windsor Locks | 0.18% | 0.71%(-0.530)#72 | 0.17%(+0.008)#3,725 |
| 69. | Sandy Hook | 0.17% | 0.71%(-0.538)#73 | 0.17%(-0.000)#3,726 |
| 70. | Wethersfield | 0.16% | 0.71%(-0.543)#74 | 0.17%(-0.005)#3,727 |
| 71. | Willimantic | 0.15% | 0.71%(-0.553)#75 | 0.17%(-0.015)#3,728 |
| 72. | Middletown | 0.14% | 0.71%(-0.564)#76 | 0.17%(-0.026)#3,729 |
| 73. | Norwich | 0.12% | 0.71%(-0.580)#77 | 0.17%(-0.042)#3,730 |
| 74. | Woodmont Borough | 0.12% | 0.71%(-0.582)#78 | 0.17%(-0.043)#3,731 |
| 75. | Orange | 0.11% | 0.71%(-0.600)#79 | 0.17%(-0.061)#3,732 |
| 76. | North Haven | 0.062% | 0.71%(-0.643)#80 | 0.17%(-0.105)#3,733 |
| 77. | New London | 0.062% | 0.71%(-0.643)#81 | 0.17%(-0.105)#3,734 |
| 78. | Manchester | 0.049% | 0.71%(-0.656)#82 | 0.17%(-0.118)#3,735 |
| 79. | New Britain | 0.036% | 0.71%(-0.669)#83 | 0.17%(-0.130)#3,736 |
| 80. | Torrington | 0.028% | 0.71%(-0.677)#84 | 0.17%(-0.139)#3,737 |
| 81. | Meriden | 0.017% | 0.71%(-0.689)#85 | 0.17%(-0.150)#3,761 |
1
2Common Questions
What are the Top 10 Cities with the Highest Percentage of Immigrants from Brazil in Connecticut?
Top 10 Cities with the Highest Percentage of Immigrants from Brazil in Connecticut are:
#1
9.02%
#2
6.56%
#3
6.30%
#4
6.13%
#5
5.77%
#6
4.79%
#7
3.95%
#8
2.99%
#9
1.56%
#10
1.46%
What city has the Highest Percentage of Immigrants from Brazil in Connecticut?
Bethel has the Highest Percentage of Immigrants from Brazil in Connecticut with 9.02%.
What is the Percentage of Immigrants from Brazil in the State of Connecticut?
Percentage of Immigrants from Brazil in Connecticut is 0.71%.
What is the Percentage of Immigrants from Brazil in the United States?
Percentage of Immigrants from Brazil in the United States is 0.17%.