Cities with the Highest Percentage of Immigrants from Brazil in Indiana
RELATED REPORTS & OPTIONS
Brazil
Indiana
Compare Cities
Map of Cities with the Highest Percentage of Immigrants from Brazil in Indiana
0.00%
5.00%
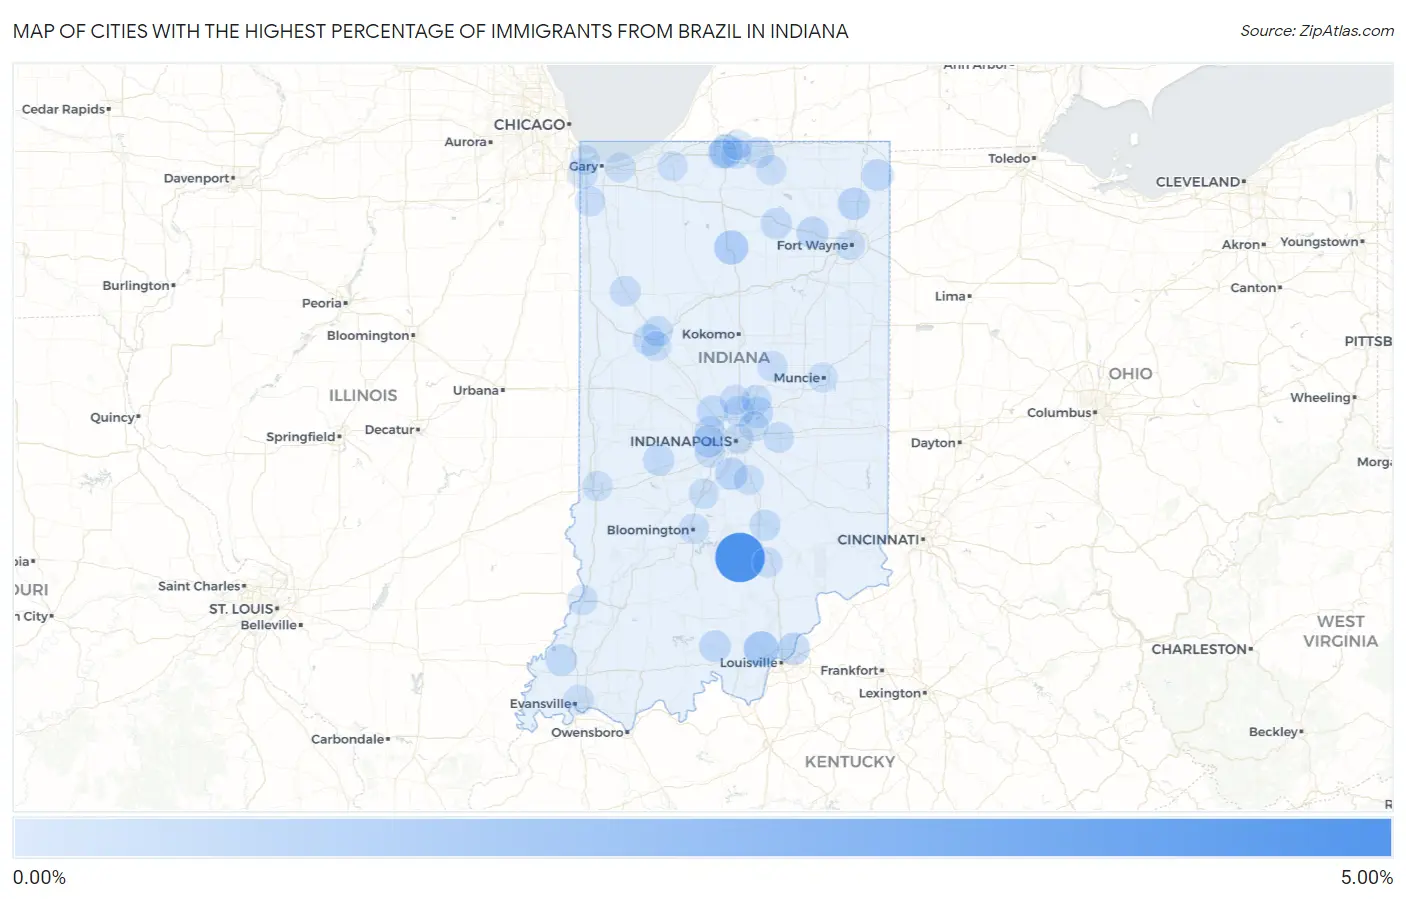
Cities with the Highest Percentage of Immigrants from Brazil in Indiana
| City | Brazil | vs State | vs National | |
| 1. | Freetown | 4.84% | 0.039%(+4.80)#-1 | 0.17%(+4.67)#0 |
| 2. | Galena | 1.18% | 0.039%(+1.14)#0 | 0.17%(+1.01)#1 |
| 3. | Rochester | 0.99% | 0.039%(+0.956)#1 | 0.17%(+0.827)#2 |
| 4. | Notre Dame | 0.86% | 0.039%(+0.826)#2 | 0.17%(+0.697)#3 |
| 5. | Utica | 0.54% | 0.039%(+0.498)#3 | 0.17%(+0.370)#4 |
| 6. | Garrett | 0.53% | 0.039%(+0.490)#4 | 0.17%(+0.362)#5 |
| 7. | Avon | 0.50% | 0.039%(+0.462)#5 | 0.17%(+0.334)#6 |
| 8. | Bargersville | 0.49% | 0.039%(+0.455)#6 | 0.17%(+0.327)#7 |
| 9. | Columbia City | 0.44% | 0.039%(+0.404)#7 | 0.17%(+0.276)#8 |
| 10. | Hamilton | 0.41% | 0.039%(+0.375)#8 | 0.17%(+0.247)#9 |
| 11. | Marengo | 0.38% | 0.039%(+0.338)#9 | 0.17%(+0.210)#10 |
| 12. | Owensville | 0.35% | 0.039%(+0.314)#10 | 0.17%(+0.186)#11 |
| 13. | Whitestown | 0.33% | 0.039%(+0.293)#11 | 0.17%(+0.165)#12 |
| 14. | West Lafayette | 0.32% | 0.039%(+0.280)#12 | 0.17%(+0.152)#13 |
| 15. | Fishers | 0.32% | 0.039%(+0.276)#13 | 0.17%(+0.148)#14 |
| 16. | Greencastle | 0.30% | 0.039%(+0.265)#14 | 0.17%(+0.137)#15 |
| 17. | Winona Lake | 0.28% | 0.039%(+0.237)#15 | 0.17%(+0.109)#16 |
| 18. | Columbus | 0.21% | 0.039%(+0.168)#16 | 0.17%(+0.039)#17 |
| 19. | Carmel | 0.17% | 0.039%(+0.128)#17 | 0.17%(+0.000)#18 |
| 20. | Greenfield | 0.16% | 0.039%(+0.122)#18 | 0.17%(-0.006)#19 |
| 21. | Elkhart | 0.15% | 0.039%(+0.110)#31 | 0.17%(-0.018)#2,137 |
| 22. | Battle Ground | 0.14% | 0.039%(+0.106)#32 | 0.17%(-0.022)#2,138 |
| 23. | Remington | 0.13% | 0.039%(+0.096)#33 | 0.17%(-0.032)#2,139 |
| 24. | Westfield | 0.10% | 0.039%(+0.063)#34 | 0.17%(-0.065)#2,140 |
| 25. | Elwood | 0.096% | 0.039%(+0.057)#35 | 0.17%(-0.071)#2,141 |
| 26. | Munster | 0.093% | 0.039%(+0.054)#36 | 0.17%(-0.074)#2,142 |
| 27. | Bloomington | 0.087% | 0.039%(+0.049)#59 | 0.17%(-0.079)#3,886 |
| 28. | Cedar Lake | 0.084% | 0.039%(+0.046)#60 | 0.17%(-0.082)#3,887 |
| 29. | Brownsburg | 0.075% | 0.039%(+0.036)#61 | 0.17%(-0.092)#3,888 |
| 30. | Noblesville | 0.074% | 0.039%(+0.035)#62 | 0.17%(-0.093)#3,889 |
| 31. | Plainfield | 0.063% | 0.039%(+0.024)#63 | 0.17%(-0.104)#3,890 |
| 32. | Martinsville | 0.059% | 0.039%(+0.020)#64 | 0.17%(-0.108)#3,891 |
| 33. | Mishawaka | 0.055% | 0.039%(+0.016)#65 | 0.17%(-0.112)#3,892 |
| 34. | Franklin | 0.054% | 0.039%(+0.015)#66 | 0.17%(-0.113)#3,893 |
| 35. | Seymour | 0.051% | 0.039%(+0.013)#67 | 0.17%(-0.115)#3,894 |
| 36. | Indianapolis | 0.046% | 0.039%(+0.007)#68 | 0.17%(-0.121)#3,895 |
| 37. | Vincennes | 0.042% | 0.039%(+0.003)#69 | 0.17%(-0.125)#3,896 |
| 38. | South Bend | 0.040% | 0.039%(+0.001)#70 | 0.17%(-0.127)#3,897 |
| 39. | Evansville | 0.033% | 0.039%(-0.006)#71 | 0.17%(-0.134)#3,898 |
| 40. | Terre Haute | 0.027% | 0.039%(-0.011)#72 | 0.17%(-0.140)#3,899 |
| 41. | Muncie | 0.026% | 0.039%(-0.013)#73 | 0.17%(-0.141)#3,900 |
| 42. | Lafayette | 0.023% | 0.039%(-0.016)#74 | 0.17%(-0.144)#3,901 |
| 43. | Lawrence | 0.020% | 0.039%(-0.018)#75 | 0.17%(-0.147)#3,902 |
| 44. | Hammond | 0.018% | 0.039%(-0.021)#76 | 0.17%(-0.149)#3,903 |
| 45. | La Porte | 0.018% | 0.039%(-0.021)#77 | 0.17%(-0.149)#3,904 |
| 46. | Fort Wayne | 0.015% | 0.039%(-0.023)#78 | 0.17%(-0.151)#3,905 |
| 47. | Granger | 0.013% | 0.039%(-0.025)#79 | 0.17%(-0.154)#3,906 |
| 48. | Goshen | 0.0086% | 0.039%(-0.030)#80 | 0.17%(-0.158)#3,907 |
| 49. | Portage | 0.0079% | 0.039%(-0.031)#81 | 0.17%(-0.159)#3,908 |
Common Questions
What are the Top 10 Cities with the Highest Percentage of Immigrants from Brazil in Indiana?
Top 10 Cities with the Highest Percentage of Immigrants from Brazil in Indiana are:
#1
4.84%
#2
1.18%
#3
0.99%
#4
0.86%
#5
0.54%
#6
0.53%
#7
0.50%
#8
0.49%
#9
0.44%
#10
0.41%
What city has the Highest Percentage of Immigrants from Brazil in Indiana?
Freetown has the Highest Percentage of Immigrants from Brazil in Indiana with 4.84%.
What is the Percentage of Immigrants from Brazil in the State of Indiana?
Percentage of Immigrants from Brazil in Indiana is 0.039%.
What is the Percentage of Immigrants from Brazil in the United States?
Percentage of Immigrants from Brazil in the United States is 0.17%.