Cities with the Highest Percentage of Immigrants from Brazil in Utah
RELATED REPORTS & OPTIONS
Brazil
Utah
Compare Cities
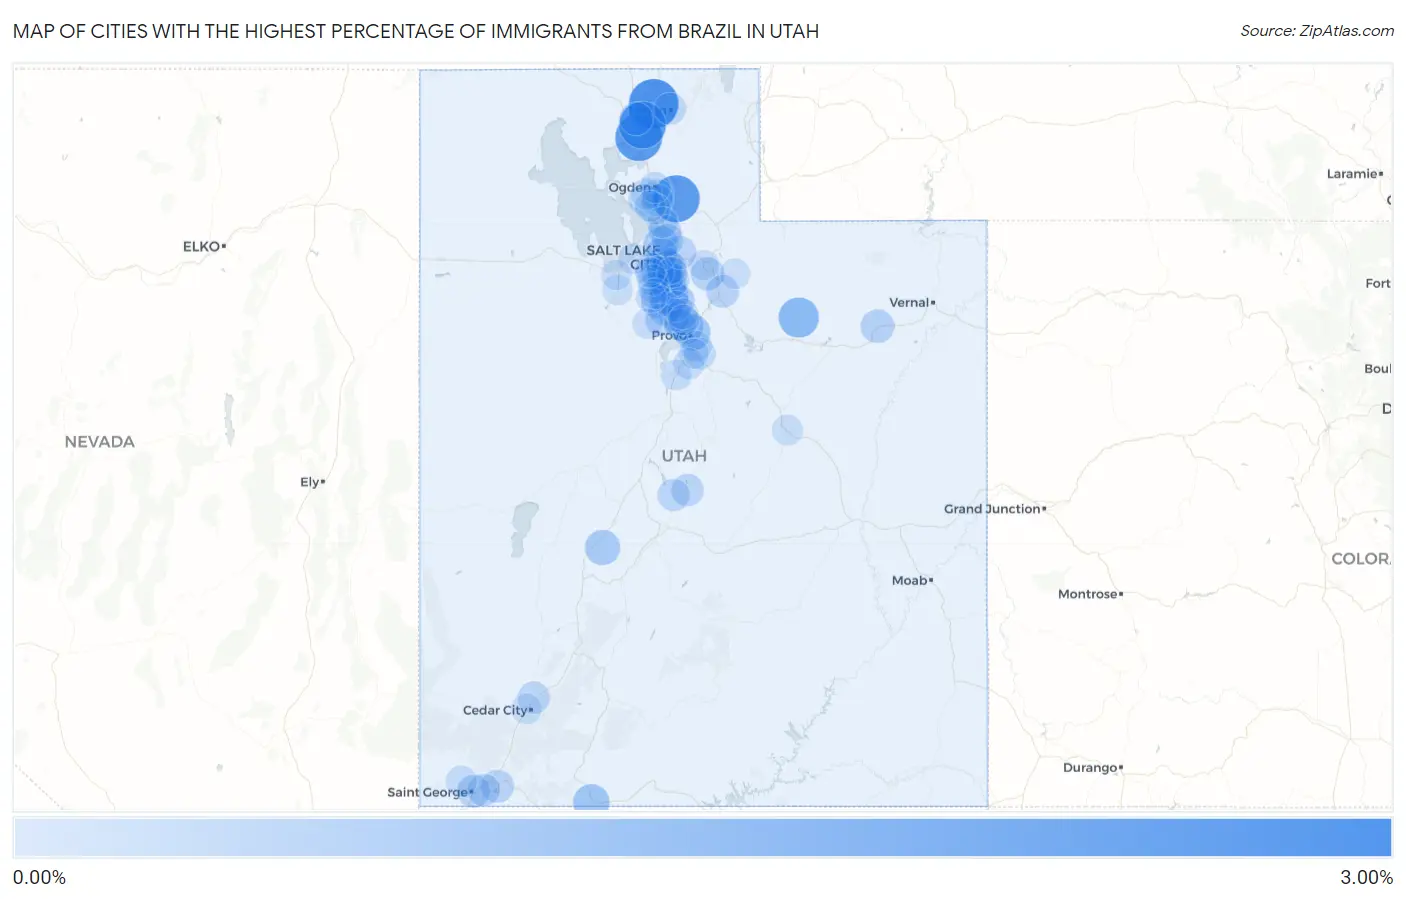
Map of Cities with the Highest Percentage of Immigrants from Brazil in Utah
0.00%
3.00%
Cities with the Highest Percentage of Immigrants from Brazil in Utah
| City | Brazil | vs State | vs National | |
| 1. | Peter | 2.54% | 0.23%(+2.30)#-1 | 0.17%(+2.37)#0 |
| 2. | Mountain Green | 2.19% | 0.23%(+1.96)#0 | 0.17%(+2.03)#1 |
| 3. | Corinne | 2.19% | 0.23%(+1.96)#1 | 0.17%(+2.02)#2 |
| 4. | Honeyville | 2.19% | 0.23%(+1.95)#2 | 0.17%(+2.02)#3 |
| 5. | Tabiona | 1.28% | 0.23%(+1.05)#3 | 0.17%(+1.12)#4 |
| 6. | Draper | 1.12% | 0.23%(+0.887)#4 | 0.17%(+0.953)#5 |
| 7. | Kanab | 0.81% | 0.23%(+0.577)#5 | 0.17%(+0.643)#6 |
| 8. | South Salt Lake | 0.78% | 0.23%(+0.546)#32 | 0.17%(+0.612)#2,437 |
| 9. | Provo | 0.74% | 0.23%(+0.503)#33 | 0.17%(+0.569)#2,449 |
| 10. | Kanosh | 0.64% | 0.23%(+0.411)#34 | 0.17%(+0.477)#2,450 |
| 11. | Midvale | 0.63% | 0.23%(+0.393)#35 | 0.17%(+0.459)#2,451 |
| 12. | Orem | 0.62% | 0.23%(+0.384)#48 | 0.17%(+0.450)#3,230 |
| 13. | Sandy | 0.60% | 0.23%(+0.365)#55 | 0.17%(+0.431)#3,700 |
| 14. | North Salt Lake | 0.55% | 0.23%(+0.320)#56 | 0.17%(+0.386)#3,701 |
| 15. | Murray | 0.55% | 0.23%(+0.315)#57 | 0.17%(+0.381)#3,702 |
| 16. | Millcreek | 0.52% | 0.23%(+0.290)#58 | 0.17%(+0.356)#3,703 |
| 17. | Alpine | 0.52% | 0.23%(+0.284)#59 | 0.17%(+0.350)#3,704 |
| 18. | Roosevelt | 0.44% | 0.23%(+0.203)#60 | 0.17%(+0.269)#3,705 |
| 19. | Park City | 0.42% | 0.23%(+0.185)#61 | 0.17%(+0.251)#3,706 |
| 20. | Cottonwood Heights | 0.41% | 0.23%(+0.182)#62 | 0.17%(+0.248)#3,707 |
| 21. | Bluffdale | 0.40% | 0.23%(+0.168)#63 | 0.17%(+0.234)#3,708 |
| 22. | Lehi | 0.40% | 0.23%(+0.168)#64 | 0.17%(+0.234)#3,709 |
| 23. | Elwood | 0.38% | 0.23%(+0.143)#65 | 0.17%(+0.209)#3,710 |
| 24. | Hurricane | 0.34% | 0.23%(+0.112)#66 | 0.17%(+0.178)#3,711 |
| 25. | Heber | 0.34% | 0.23%(+0.110)#67 | 0.17%(+0.175)#3,712 |
| 26. | Emigration Canyon | 0.33% | 0.23%(+0.100)#68 | 0.17%(+0.166)#3,713 |
| 27. | St George | 0.32% | 0.23%(+0.089)#69 | 0.17%(+0.154)#3,714 |
| 28. | American Fork | 0.32% | 0.23%(+0.085)#70 | 0.17%(+0.151)#3,881 |
| 29. | Centerville | 0.32% | 0.23%(+0.084)#71 | 0.17%(+0.150)#3,882 |
| 30. | Washington | 0.31% | 0.23%(+0.079)#72 | 0.17%(+0.145)#3,883 |
| 31. | Salt Lake City | 0.29% | 0.23%(+0.061)#73 | 0.17%(+0.127)#3,884 |
| 32. | Sterling | 0.28% | 0.23%(+0.049)#74 | 0.17%(+0.115)#3,885 |
| 33. | Taylorsville | 0.28% | 0.23%(+0.045)#75 | 0.17%(+0.111)#3,886 |
| 34. | Saratoga Springs | 0.27% | 0.23%(+0.042)#76 | 0.17%(+0.108)#3,887 |
| 35. | Enoch | 0.26% | 0.23%(+0.032)#77 | 0.17%(+0.098)#3,888 |
| 36. | Gunnison | 0.26% | 0.23%(+0.023)#78 | 0.17%(+0.089)#3,889 |
| 37. | Bountiful | 0.25% | 0.23%(+0.021)#79 | 0.17%(+0.087)#3,890 |
| 38. | Logan | 0.23% | 0.23%(-0.002)#80 | 0.17%(+0.064)#3,891 |
| 39. | Vineyard | 0.23% | 0.23%(-0.004)#81 | 0.17%(+0.062)#3,892 |
| 40. | South Ogden | 0.21% | 0.23%(-0.021)#82 | 0.17%(+0.045)#3,893 |
| 41. | Mapleton | 0.17% | 0.23%(-0.063)#83 | 0.17%(+0.003)#3,894 |
| 42. | South Weber | 0.16% | 0.23%(-0.069)#84 | 0.17%(-0.003)#3,895 |
| 43. | Ivins | 0.14% | 0.23%(-0.091)#85 | 0.17%(-0.025)#3,896 |
| 44. | Layton | 0.14% | 0.23%(-0.095)#86 | 0.17%(-0.029)#3,897 |
| 45. | West Valley City | 0.13% | 0.23%(-0.100)#87 | 0.17%(-0.034)#3,898 |
| 46. | Clinton | 0.13% | 0.23%(-0.105)#88 | 0.17%(-0.039)#3,899 |
| 47. | South Jordan | 0.13% | 0.23%(-0.106)#89 | 0.17%(-0.040)#3,900 |
| 48. | West Jordan | 0.12% | 0.23%(-0.109)#90 | 0.17%(-0.043)#3,901 |
| 49. | Roy | 0.12% | 0.23%(-0.118)#91 | 0.17%(-0.052)#3,902 |
| 50. | Farmington | 0.11% | 0.23%(-0.118)#92 | 0.17%(-0.052)#3,903 |
| 51. | Ogden | 0.11% | 0.23%(-0.121)#93 | 0.17%(-0.055)#3,904 |
| 52. | Springville | 0.11% | 0.23%(-0.122)#94 | 0.17%(-0.056)#3,905 |
| 53. | Clearfield | 0.11% | 0.23%(-0.125)#95 | 0.17%(-0.059)#3,906 |
| 54. | Salem | 0.11% | 0.23%(-0.127)#96 | 0.17%(-0.061)#3,907 |
| 55. | Magna | 0.10% | 0.23%(-0.130)#97 | 0.17%(-0.064)#3,908 |
| 56. | Highland | 0.099% | 0.23%(-0.134)#98 | 0.17%(-0.068)#3,909 |
| 57. | Price | 0.098% | 0.23%(-0.135)#99 | 0.17%(-0.069)#3,910 |
| 58. | Pleasant Grove | 0.093% | 0.23%(-0.139)#100 | 0.17%(-0.073)#3,911 |
| 59. | Santaquin | 0.090% | 0.23%(-0.143)#101 | 0.17%(-0.077)#3,912 |
| 60. | Holladay | 0.070% | 0.23%(-0.163)#102 | 0.17%(-0.097)#3,913 |
| 61. | Cedar City | 0.061% | 0.23%(-0.171)#103 | 0.17%(-0.105)#3,914 |
| 62. | Lindon | 0.061% | 0.23%(-0.172)#104 | 0.17%(-0.106)#3,915 |
| 63. | Tooele | 0.061% | 0.23%(-0.172)#105 | 0.17%(-0.106)#3,916 |
| 64. | Riverton | 0.056% | 0.23%(-0.177)#106 | 0.17%(-0.111)#3,917 |
| 65. | Kamas | 0.041% | 0.23%(-0.191)#107 | 0.17%(-0.125)#3,918 |
| 66. | Eagle Mountain | 0.039% | 0.23%(-0.194)#108 | 0.17%(-0.128)#3,919 |
| 67. | Stansbury Park | 0.038% | 0.23%(-0.195)#109 | 0.17%(-0.129)#3,920 |
| 68. | Herriman | 0.038% | 0.23%(-0.195)#110 | 0.17%(-0.129)#3,921 |
| 69. | Snyderville | 0.035% | 0.23%(-0.198)#111 | 0.17%(-0.132)#3,922 |
| 70. | Kearns | 0.016% | 0.23%(-0.217)#112 | 0.17%(-0.151)#3,923 |
| 71. | Spanish Fork | 0.0070% | 0.23%(-0.226)#113 | 0.17%(-0.160)#3,924 |
Common Questions
What are the Top 10 Cities with the Highest Percentage of Immigrants from Brazil in Utah?
Top 10 Cities with the Highest Percentage of Immigrants from Brazil in Utah are:
#1
2.54%
#2
2.19%
#3
2.19%
#4
2.19%
#5
1.28%
#6
1.12%
#7
0.81%
#8
0.78%
#9
0.74%
#10
0.64%
What city has the Highest Percentage of Immigrants from Brazil in Utah?
Peter has the Highest Percentage of Immigrants from Brazil in Utah with 2.54%.
What is the Percentage of Immigrants from Brazil in the State of Utah?
Percentage of Immigrants from Brazil in Utah is 0.23%.
What is the Percentage of Immigrants from Brazil in the United States?
Percentage of Immigrants from Brazil in the United States is 0.17%.