Cities with the Highest Percentage of Households with Income Below $10,000 in South Dakota
RELATED REPORTS & OPTIONS
Household Income | $0-10k
South Dakota
Compare Cities
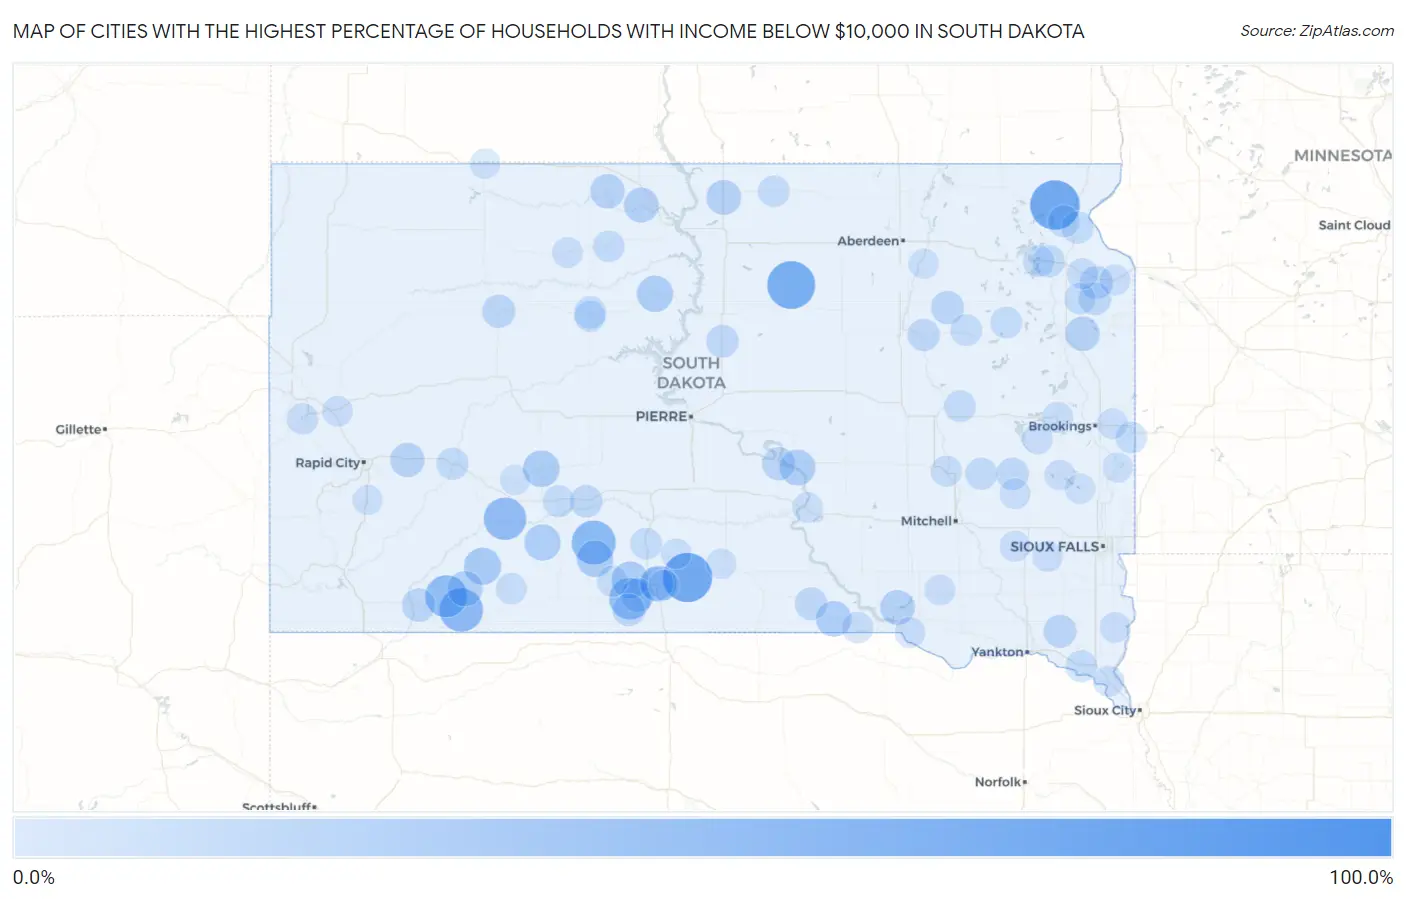
Map of Cities with the Highest Percentage of Households with Income Below $10,000 in South Dakota
0.0%
100.0%
Cities with the Highest Percentage of Households with Income Below $10,000 in South Dakota
| City | Households with Income < $10k | vs State | vs National | |
| 1. | Mayfield Colony | 100.0% | 4.2%(+95.8)#1 | 4.9%(+95.1)#12 |
| 2. | Shamrock Colony | 100.0% | 4.2%(+95.8)#2 | 4.9%(+95.1)#13 |
| 3. | Long Hollow | 72.4% | 4.2%(+68.2)#3 | 4.9%(+67.5)#63 |
| 4. | Okreek | 71.4% | 4.2%(+67.2)#4 | 4.9%(+66.5)#69 |
| 5. | Onaka | 66.7% | 4.2%(+62.5)#5 | 4.9%(+61.8)#80 |
| 6. | Corn Creek | 53.1% | 4.2%(+48.9)#6 | 4.9%(+48.2)#142 |
| 7. | Wounded Knee | 51.7% | 4.2%(+47.5)#7 | 4.9%(+46.8)#149 |
| 8. | Clark Colony | 50.0% | 4.2%(+45.8)#8 | 4.9%(+45.1)#168 |
| 9. | Interior | 48.0% | 4.2%(+43.8)#9 | 4.9%(+43.1)#187 |
| 10. | Sicangu | 47.5% | 4.2%(+43.3)#10 | 4.9%(+42.6)#193 |
| 11. | Bridger | 47.4% | 4.2%(+43.2)#11 | 4.9%(+42.5)#196 |
| 12. | Manderson White Horse Creek | 47.1% | 4.2%(+42.9)#12 | 4.9%(+42.2)#197 |
| 13. | Swift Bird | 46.7% | 4.2%(+42.5)#13 | 4.9%(+41.8)#205 |
| 14. | Two Strike | 45.2% | 4.2%(+41.0)#14 | 4.9%(+40.3)#219 |
| 15. | Kyle | 29.9% | 4.2%(+25.7)#15 | 4.9%(+25.0)#557 |
| 16. | Soldier Creek | 29.3% | 4.2%(+25.1)#16 | 4.9%(+24.4)#584 |
| 17. | Cherry Creek | 28.6% | 4.2%(+24.4)#17 | 4.9%(+23.7)#613 |
| 18. | Philip | 28.3% | 4.2%(+24.1)#18 | 4.9%(+23.4)#626 |
| 19. | Norris | 28.1% | 4.2%(+23.9)#19 | 4.9%(+23.2)#638 |
| 20. | La Plant | 27.0% | 4.2%(+22.8)#20 | 4.9%(+22.1)#684 |
| 21. | Wanblee | 26.9% | 4.2%(+22.7)#21 | 4.9%(+22.0)#691 |
| 22. | Antelope | 26.2% | 4.2%(+22.0)#22 | 4.9%(+21.3)#728 |
| 23. | Fort Thompson | 25.8% | 4.2%(+21.6)#23 | 4.9%(+20.9)#748 |
| 24. | Horse Creek | 25.0% | 4.2%(+20.8)#24 | 4.9%(+20.1)#788 |
| 25. | St Charles | 25.0% | 4.2%(+20.8)#25 | 4.9%(+20.1)#806 |
| 26. | Porcupine | 24.1% | 4.2%(+19.9)#26 | 4.9%(+19.2)#852 |
| 27. | Little Eagle | 22.9% | 4.2%(+18.7)#27 | 4.9%(+18.0)#949 |
| 28. | Lake Andes | 22.2% | 4.2%(+18.0)#28 | 4.9%(+17.3)#996 |
| 29. | Mound City | 22.2% | 4.2%(+18.0)#29 | 4.9%(+17.3)#1,002 |
| 30. | Wakpala | 21.8% | 4.2%(+17.6)#30 | 4.9%(+16.9)#1,027 |
| 31. | Kranzburg | 21.5% | 4.2%(+17.3)#31 | 4.9%(+16.6)#1,062 |
| 32. | Bullhead | 21.2% | 4.2%(+17.0)#32 | 4.9%(+16.3)#1,095 |
| 33. | New Underwood | 20.5% | 4.2%(+16.3)#33 | 4.9%(+15.6)#1,148 |
| 34. | Mission | 19.5% | 4.2%(+15.3)#34 | 4.9%(+14.6)#1,279 |
| 35. | Enemy Swim | 18.4% | 4.2%(+14.2)#35 | 4.9%(+13.5)#1,432 |
| 36. | Rosebud | 18.3% | 4.2%(+14.1)#36 | 4.9%(+13.4)#1,439 |
| 37. | Oglala | 17.6% | 4.2%(+13.4)#37 | 4.9%(+12.7)#1,540 |
| 38. | Faith | 17.1% | 4.2%(+12.9)#38 | 4.9%(+12.2)#1,633 |
| 39. | Lower Brule | 16.8% | 4.2%(+12.6)#39 | 4.9%(+11.9)#1,694 |
| 40. | Turton | 16.7% | 4.2%(+12.5)#40 | 4.9%(+11.8)#1,740 |
| 41. | Twin Brooks | 16.7% | 4.2%(+12.5)#41 | 4.9%(+11.8)#1,743 |
| 42. | Wakonda | 16.5% | 4.2%(+12.3)#42 | 4.9%(+11.6)#1,773 |
| 43. | Burke | 15.6% | 4.2%(+11.4)#43 | 4.9%(+10.7)#1,949 |
| 44. | Stockholm | 15.1% | 4.2%(+10.9)#44 | 4.9%(+10.2)#2,077 |
| 45. | Agar | 14.8% | 4.2%(+10.6)#45 | 4.9%(+9.90)#2,168 |
| 46. | St Francis | 14.5% | 4.2%(+10.3)#46 | 4.9%(+9.60)#2,236 |
| 47. | Kenel | 14.5% | 4.2%(+10.3)#47 | 4.9%(+9.60)#2,240 |
| 48. | Belvidere | 14.3% | 4.2%(+10.1)#48 | 4.9%(+9.40)#2,289 |
| 49. | Howard | 14.2% | 4.2%(+10.00)#49 | 4.9%(+9.30)#2,312 |
| 50. | Frankfort | 14.1% | 4.2%(+9.90)#50 | 4.9%(+9.20)#2,348 |
| 51. | Peever | 14.0% | 4.2%(+9.80)#51 | 4.9%(+9.10)#2,379 |
| 52. | North Eagle Butte | 13.8% | 4.2%(+9.60)#52 | 4.9%(+8.90)#2,429 |
| 53. | Ortley | 13.8% | 4.2%(+9.60)#53 | 4.9%(+8.90)#2,446 |
| 54. | Wasta | 13.5% | 4.2%(+9.30)#54 | 4.9%(+8.60)#2,534 |
| 55. | Fedora | 13.3% | 4.2%(+9.10)#55 | 4.9%(+8.40)#2,622 |
| 56. | Agency Village | 13.2% | 4.2%(+9.00)#56 | 4.9%(+8.30)#2,635 |
| 57. | West Brule | 13.1% | 4.2%(+8.90)#57 | 4.9%(+8.20)#2,679 |
| 58. | Vermillion | 12.4% | 4.2%(+8.20)#58 | 4.9%(+7.50)#2,954 |
| 59. | Kadoka | 12.3% | 4.2%(+8.10)#59 | 4.9%(+7.40)#3,034 |
| 60. | Yale | 12.2% | 4.2%(+8.00)#60 | 4.9%(+7.30)#3,082 |
| 61. | White River | 12.0% | 4.2%(+7.80)#61 | 4.9%(+7.10)#3,172 |
| 62. | Raymond | 11.8% | 4.2%(+7.60)#62 | 4.9%(+6.90)#3,314 |
| 63. | Elkton | 11.6% | 4.2%(+7.40)#63 | 4.9%(+6.70)#3,391 |
| 64. | Timber Lake | 11.5% | 4.2%(+7.30)#64 | 4.9%(+6.60)#3,450 |
| 65. | Garden City | 11.5% | 4.2%(+7.30)#65 | 4.9%(+6.60)#3,463 |
| 66. | South Shore | 11.3% | 4.2%(+7.10)#66 | 4.9%(+6.40)#3,597 |
| 67. | Eureka | 11.1% | 4.2%(+6.90)#67 | 4.9%(+6.20)#3,659 |
| 68. | Waubay | 11.0% | 4.2%(+6.80)#68 | 4.9%(+6.10)#3,746 |
| 69. | Lead | 10.9% | 4.2%(+6.70)#69 | 4.9%(+6.00)#3,773 |
| 70. | Fairfax | 10.3% | 4.2%(+6.10)#70 | 4.9%(+5.40)#4,222 |
| 71. | Parmelee | 10.2% | 4.2%(+6.00)#71 | 4.9%(+5.30)#4,283 |
| 72. | Eagle Butte | 10.1% | 4.2%(+5.90)#72 | 4.9%(+5.20)#4,333 |
| 73. | Allen | 10.1% | 4.2%(+5.90)#73 | 4.9%(+5.20)#4,342 |
| 74. | Forestburg | 10.0% | 4.2%(+5.80)#74 | 4.9%(+5.10)#4,427 |
| 75. | Marvin | 10.0% | 4.2%(+5.80)#75 | 4.9%(+5.10)#4,431 |
| 76. | Arlington | 9.9% | 4.2%(+5.70)#76 | 4.9%(+5.00)#4,476 |
| 77. | Marty | 9.1% | 4.2%(+4.90)#77 | 4.9%(+4.20)#5,177 |
| 78. | Isabel | 9.1% | 4.2%(+4.90)#78 | 4.9%(+4.20)#5,180 |
| 79. | Milbank | 8.9% | 4.2%(+4.70)#79 | 4.9%(+4.00)#5,338 |
| 80. | Elk Point | 8.8% | 4.2%(+4.60)#80 | 4.9%(+3.90)#5,454 |
| 81. | Canova | 8.8% | 4.2%(+4.60)#81 | 4.9%(+3.90)#5,520 |
| 82. | Monroe | 8.7% | 4.2%(+4.50)#82 | 4.9%(+3.80)#5,631 |
| 83. | Oldham | 8.7% | 4.2%(+4.50)#83 | 4.9%(+3.80)#5,638 |
| 84. | Bushnell | 8.7% | 4.2%(+4.50)#84 | 4.9%(+3.80)#5,644 |
| 85. | Sturgis | 8.6% | 4.2%(+4.40)#85 | 4.9%(+3.70)#5,663 |
| 86. | Madison | 8.5% | 4.2%(+4.30)#86 | 4.9%(+3.60)#5,773 |
| 87. | Alcester | 8.5% | 4.2%(+4.30)#87 | 4.9%(+3.60)#5,816 |
| 88. | Delmont | 8.5% | 4.2%(+4.30)#88 | 4.9%(+3.60)#5,860 |
| 89. | Bridgewater | 8.3% | 4.2%(+4.10)#89 | 4.9%(+3.40)#6,068 |
| 90. | White Horse | 8.3% | 4.2%(+4.10)#90 | 4.9%(+3.40)#6,086 |
| 91. | Ideal | 8.3% | 4.2%(+4.10)#91 | 4.9%(+3.40)#6,096 |
| 92. | Wood | 7.9% | 4.2%(+3.70)#92 | 4.9%(+3.00)#6,582 |
| 93. | Chamberlain | 7.8% | 4.2%(+3.60)#93 | 4.9%(+2.90)#6,618 |
| 94. | Brant Lake South | 7.7% | 4.2%(+3.50)#94 | 4.9%(+2.80)#6,809 |
| 95. | Cottonwood | 7.7% | 4.2%(+3.50)#95 | 4.9%(+2.80)#6,833 |
| 96. | New Witten | 7.5% | 4.2%(+3.30)#96 | 4.9%(+2.60)#7,144 |
| 97. | Hermosa | 7.4% | 4.2%(+3.20)#97 | 4.9%(+2.50)#7,258 |
| 98. | Stratford | 7.4% | 4.2%(+3.20)#98 | 4.9%(+2.50)#7,291 |
| 99. | Lemmon | 7.2% | 4.2%(+3.00)#99 | 4.9%(+2.30)#7,532 |
| 100. | Flandreau | 7.1% | 4.2%(+2.90)#100 | 4.9%(+2.20)#7,652 |
Common Questions
What are the Top 10 Cities with the Highest Percentage of Households with Income Below $10,000 in South Dakota?
Top 10 Cities with the Highest Percentage of Households with Income Below $10,000 in South Dakota are:
#1
72.4%
#2
71.4%
#3
66.7%
#4
53.1%
#5
51.7%
#6
48.0%
#7
47.1%
#8
45.2%
#9
29.9%
#10
29.3%
What city has the Highest Percentage of Households with Income Below $10,000 in South Dakota?
Long Hollow has the Highest Percentage of Households with Income Below $10,000 in South Dakota with 72.4%.
What is the Percentage of Households with Income Below $10,000 in the State of South Dakota?
Percentage of Households with Income Below $10,000 in South Dakota is 4.2%.
What is the Percentage of Households with Income Below $10,000 in the United States?
Percentage of Households with Income Below $10,000 in the United States is 4.9%.