Warren, MA
Warren Map
Warren Overview
567
TOTAL POPULATION
283
MALE POPULATION
284
FEMALE POPULATION
99.65
MALES / 100 FEMALES
100.35
FEMALES / 100 MALES
29.9
MEDIAN AGE
3.1
AVG FAMILY SIZE
1.7
AVG HOUSEHOLD SIZE
$16,772
PER CAPITA INCOME
0.54
INEQUALITY / GINI INDEX
331
LABOR FORCE [ PEOPLE ]
70.4%
PERCENT IN LABOR FORCE
30.2%
UNEMPLOYMENT RATE
Warren Zip Codes
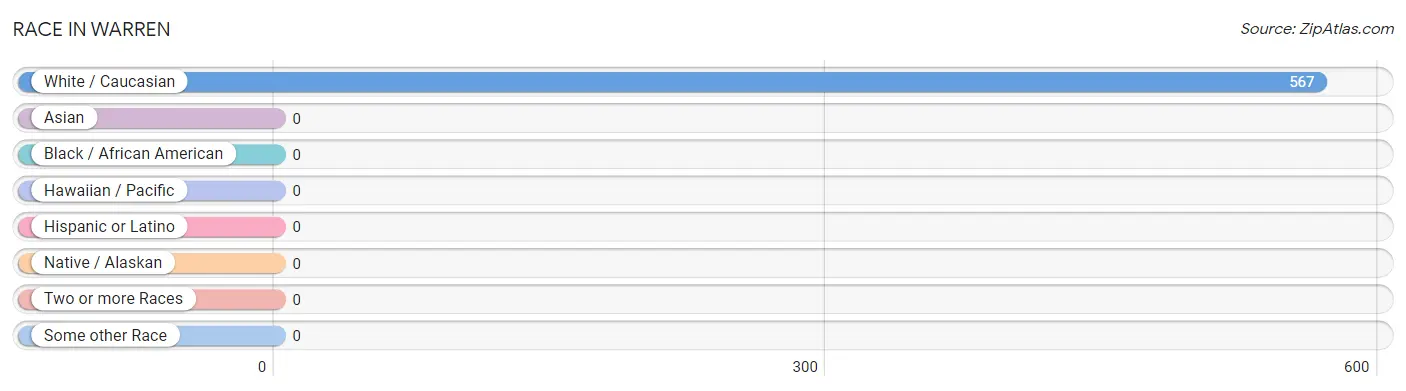
Race in Warren
The most populous races in Warren are , and White / Caucasian (567 | 100.0%).
| Race | # Population | % Population |
| Asian | 0 | 0.0% |
| Black / African American | 0 | 0.0% |
| Hawaiian / Pacific | 0 | 0.0% |
| Hispanic or Latino | 0 | 0.0% |
| Native / Alaskan | 0 | 0.0% |
| White / Caucasian | 567 | 100.0% |
| Two or more Races | 0 | 0.0% |
| Some other Race | 0 | 0.0% |
| Total | 567 | 100.0% |
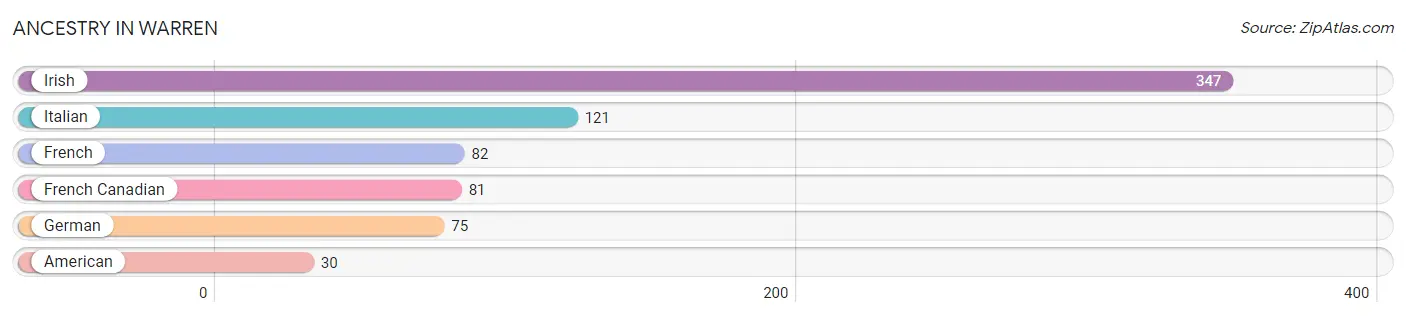
Ancestry in Warren
The most populous ancestries reported in Warren are Irish (347 | 61.2%), Italian (121 | 21.3%), French (82 | 14.5%), French Canadian (81 | 14.3%), and German (75 | 13.2%), together accounting for 124.5% of all Warren residents.
| Ancestry | # Population | % Population |
| American | 30 | 5.3% |
| French | 82 | 14.5% |
| French Canadian | 81 | 14.3% |
| German | 75 | 13.2% |
| Irish | 347 | 61.2% |
| Italian | 121 | 21.3% | View All 6 Rows |
Immigrants in Warren

| Immigration Origin | # Population | % Population | View All 0 Rows |
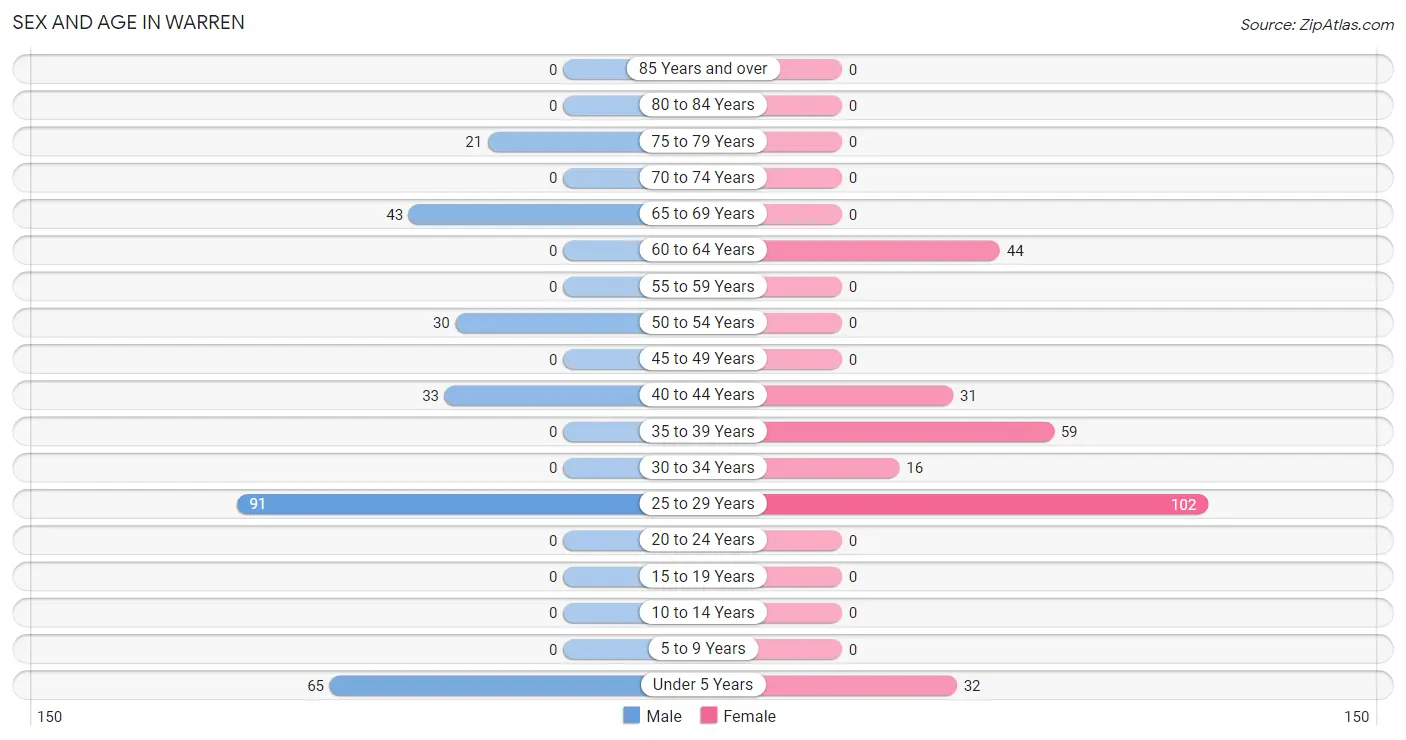
Sex and Age in Warren
Sex and Age in Warren
The most populous age groups in Warren are 25 to 29 Years (91 | 32.2%) for men and 25 to 29 Years (102 | 35.9%) for women.
| Age Bracket | Male | Female |
| Under 5 Years | 65 (23.0%) | 32 (11.3%) |
| 5 to 9 Years | 0 (0.0%) | 0 (0.0%) |
| 10 to 14 Years | 0 (0.0%) | 0 (0.0%) |
| 15 to 19 Years | 0 (0.0%) | 0 (0.0%) |
| 20 to 24 Years | 0 (0.0%) | 0 (0.0%) |
| 25 to 29 Years | 91 (32.2%) | 102 (35.9%) |
| 30 to 34 Years | 0 (0.0%) | 16 (5.6%) |
| 35 to 39 Years | 0 (0.0%) | 59 (20.8%) |
| 40 to 44 Years | 33 (11.7%) | 31 (10.9%) |
| 45 to 49 Years | 0 (0.0%) | 0 (0.0%) |
| 50 to 54 Years | 30 (10.6%) | 0 (0.0%) |
| 55 to 59 Years | 0 (0.0%) | 0 (0.0%) |
| 60 to 64 Years | 0 (0.0%) | 44 (15.5%) |
| 65 to 69 Years | 43 (15.2%) | 0 (0.0%) |
| 70 to 74 Years | 0 (0.0%) | 0 (0.0%) |
| 75 to 79 Years | 21 (7.4%) | 0 (0.0%) |
| 80 to 84 Years | 0 (0.0%) | 0 (0.0%) |
| 85 Years and over | 0 (0.0%) | 0 (0.0%) |
| Total | 283 (100.0%) | 284 (100.0%) |
Families and Households in Warren
Median Family Size in Warren
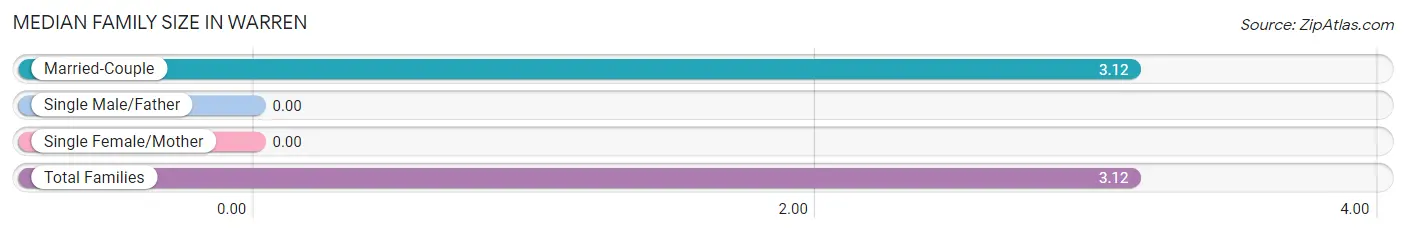
| Family Type | # Families | Family Size |
| Married-Couple | 89 (100.0%) | 3.12 |
| Single Male/Father | 0 (0.0%) | - |
| Single Female/Mother | 0 (0.0%) | - |
| Total Families | 89 (100.0%) | 3.12 |
Median Household Size in Warren
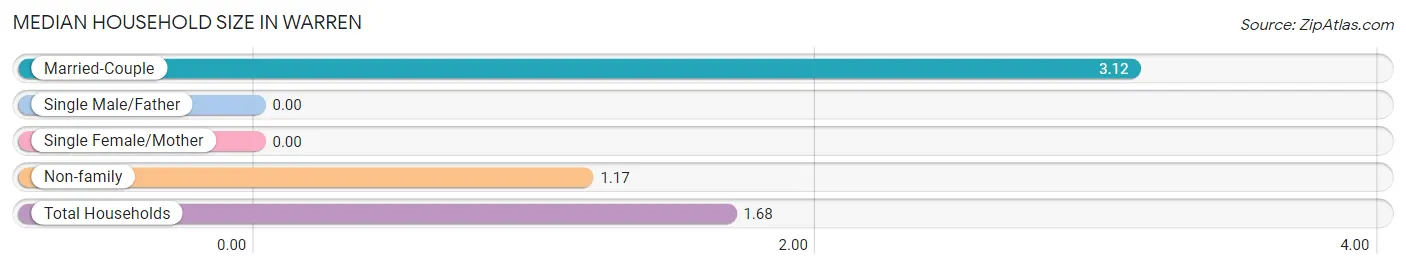
| Household Type | # Households | Household Size |
| Married-Couple | 89 (26.4%) | 3.12 |
| Single Male/Father | 0 (0.0%) | - |
| Single Female/Mother | 0 (0.0%) | - |
| Non-family | 248 (73.6%) | 1.17 |
| Total Households | 337 (100.0%) | 1.68 |
Household Size by Marriage Status in Warren
Out of a total of 337 households in Warren, 89 (26.4%) are family households, while 248 (73.6%) are nonfamily households. The most numerous type of family households are 3-person households, comprising 89, and the most common type of nonfamily households are 1-person households, comprising 213.
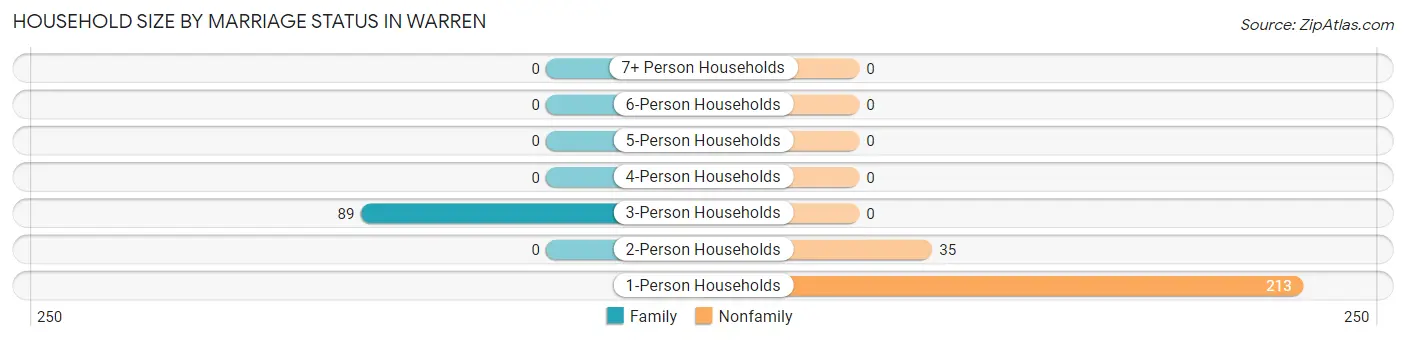
| Household Size | Family Households | Nonfamily Households |
| 1-Person Households | - | 213 (63.2%) |
| 2-Person Households | 0 (0.0%) | 35 (10.4%) |
| 3-Person Households | 89 (26.4%) | 0 (0.0%) |
| 4-Person Households | 0 (0.0%) | 0 (0.0%) |
| 5-Person Households | 0 (0.0%) | 0 (0.0%) |
| 6-Person Households | 0 (0.0%) | 0 (0.0%) |
| 7+ Person Households | 0 (0.0%) | 0 (0.0%) |
| Total | 89 (26.4%) | 248 (73.6%) |
Female Fertility in Warren
Fertility by Age in Warren
| Age Bracket | Women with Births | Births / 1,000 Women |
| 15 to 19 years | 0 (0.0%) | 0.0 |
| 20 to 34 years | 0 (0.0%) | 0.0 |
| 35 to 50 years | 0 (0.0%) | 0.0 |
| Total | 0 (0.0%) | 0.0 |
Fertility by Age by Marriage Status in Warren
| Age Bracket | Married | Unmarried |
| 15 to 19 years | 0 (0.0%) | 0 (0.0%) |
| 20 to 34 years | 0 (0.0%) | 0 (0.0%) |
| 35 to 50 years | 0 (0.0%) | 0 (0.0%) |
| Total | 0 (0.0%) | 0 (0.0%) |
Fertility by Education in Warren
| Educational Attainment | Women with Births | Births / 1,000 Women |
| Less than High School | 0 (0.0%) | 0.0 |
| High School Diploma | 0 (0.0%) | 0.0 |
| College or Associate's Degree | 0 (0.0%) | 0.0 |
| Bachelor's Degree | 0 (0.0%) | 0.0 |
| Graduate Degree | 0 (0.0%) | 0.0 |
| Total | 0 (0.0%) | 0.0 |
Fertility by Education by Marriage Status in Warren
| Educational Attainment | Married | Unmarried |
| Less than High School | 0 (0.0%) | 0 (0.0%) |
| High School Diploma | 0 (0.0%) | 0 (0.0%) |
| College or Associate's Degree | 0 (0.0%) | 0 (0.0%) |
| Bachelor's Degree | 0 (0.0%) | 0 (0.0%) |
| Graduate Degree | 0 (0.0%) | 0 (0.0%) |
| Total | 0 (0.0%) | 0 (0.0%) |
Income in Warren
Income Overview in Warren
| Characteristic | Number | Measure |
| Per Capita Income | 567 | $16,772 |
| Median Family Income | 89 | $0 |
| Mean Family Income | 89 | $0 |
| Median Household Income | 337 | $0 |
| Mean Household Income | 337 | $27,511 |
| Income Deficit | 89 | $0 |
| Wage / Income Gap (%) | 567 | 0.00% |
| Wage / Income Gap ($) | 567 | 100.00¢ per $1 |
| Gini / Inequality Index | 567 | 0.54 |
Earnings by Sex in Warren
| Sex | Number | Average Earnings |
| Male | 154 (53.1%) | $0 |
| Female | 136 (46.9%) | $0 |
| Total | 290 (100.0%) | $0 |
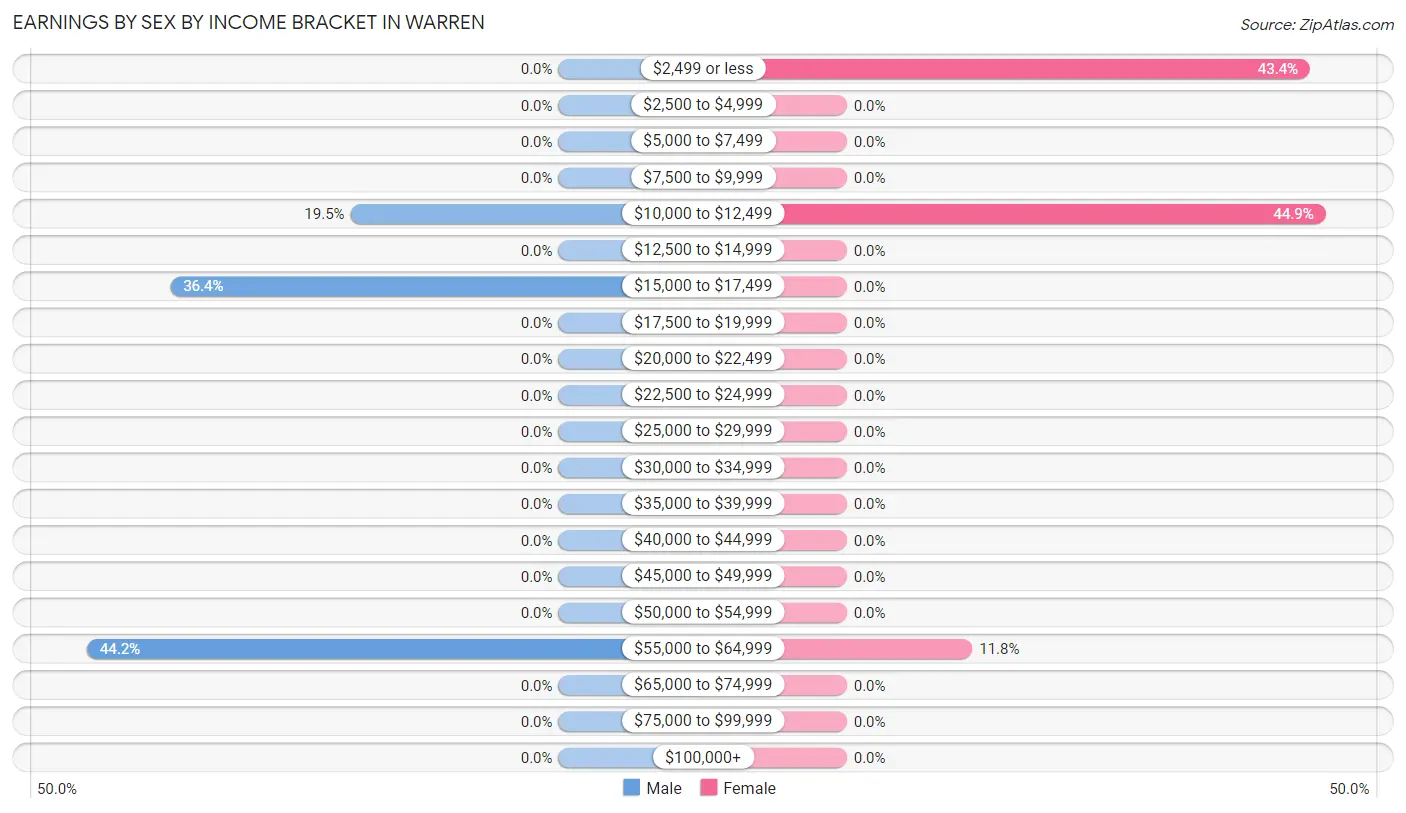
Earnings by Sex by Income Bracket in Warren
The most common earnings brackets in Warren are $55,000 to $64,999 for men (68 | 44.2%) and $10,000 to $12,499 for women (61 | 44.9%).
| Income | Male | Female |
| $2,499 or less | 0 (0.0%) | 59 (43.4%) |
| $2,500 to $4,999 | 0 (0.0%) | 0 (0.0%) |
| $5,000 to $7,499 | 0 (0.0%) | 0 (0.0%) |
| $7,500 to $9,999 | 0 (0.0%) | 0 (0.0%) |
| $10,000 to $12,499 | 30 (19.5%) | 61 (44.9%) |
| $12,500 to $14,999 | 0 (0.0%) | 0 (0.0%) |
| $15,000 to $17,499 | 56 (36.4%) | 0 (0.0%) |
| $17,500 to $19,999 | 0 (0.0%) | 0 (0.0%) |
| $20,000 to $22,499 | 0 (0.0%) | 0 (0.0%) |
| $22,500 to $24,999 | 0 (0.0%) | 0 (0.0%) |
| $25,000 to $29,999 | 0 (0.0%) | 0 (0.0%) |
| $30,000 to $34,999 | 0 (0.0%) | 0 (0.0%) |
| $35,000 to $39,999 | 0 (0.0%) | 0 (0.0%) |
| $40,000 to $44,999 | 0 (0.0%) | 0 (0.0%) |
| $45,000 to $49,999 | 0 (0.0%) | 0 (0.0%) |
| $50,000 to $54,999 | 0 (0.0%) | 0 (0.0%) |
| $55,000 to $64,999 | 68 (44.2%) | 16 (11.8%) |
| $65,000 to $74,999 | 0 (0.0%) | 0 (0.0%) |
| $75,000 to $99,999 | 0 (0.0%) | 0 (0.0%) |
| $100,000+ | 0 (0.0%) | 0 (0.0%) |
| Total | 154 (100.0%) | 136 (100.0%) |
Earnings by Sex by Educational Attainment in Warren
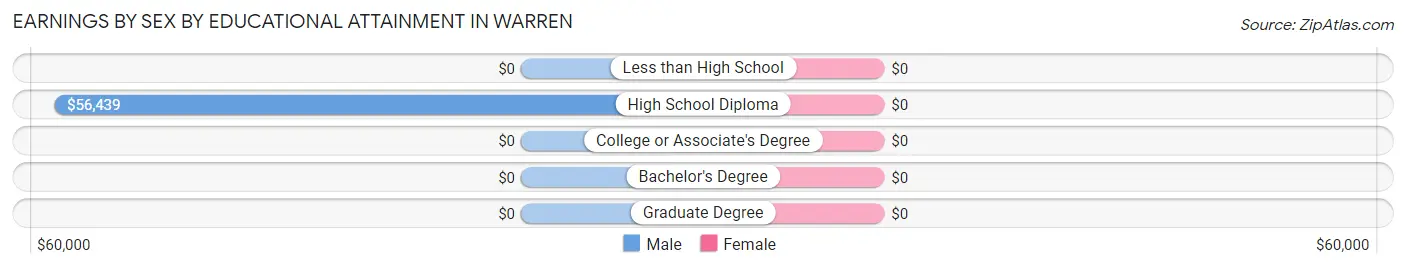
| Educational Attainment | Male Income | Female Income |
| Less than High School | - | - |
| High School Diploma | $56,439 | $0 |
| College or Associate's Degree | - | - |
| Bachelor's Degree | - | - |
| Graduate Degree | - | - |
| Total | - | - |
Family Income in Warren
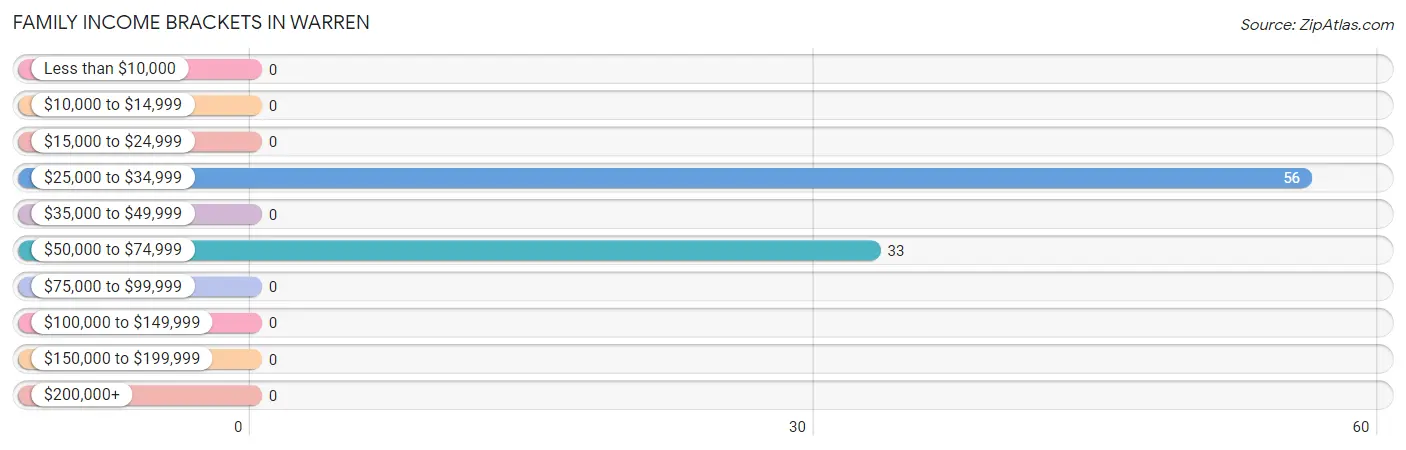
Family Income Brackets in Warren
According to the Warren family income data, there are 56 families falling into the $25,000 to $34,999 income range, which is the most common income bracket and makes up 62.9% of all families.
| Income Bracket | # Families | % Families |
| Less than $10,000 | 0 | 0.0% |
| $10,000 to $14,999 | 0 | 0.0% |
| $15,000 to $24,999 | 0 | 0.0% |
| $25,000 to $34,999 | 56 | 62.9% |
| $35,000 to $49,999 | 0 | 0.0% |
| $50,000 to $74,999 | 33 | 37.1% |
| $75,000 to $99,999 | 0 | 0.0% |
| $100,000 to $149,999 | 0 | 0.0% |
| $150,000 to $199,999 | 0 | 0.0% |
| $200,000+ | 0 | 0.0% |
Family Income by Famaliy Size in Warren
| Income Bracket | # Families | Median Income |
| 2-Person Families | 0 (0.0%) | $0 |
| 3-Person Families | 89 (100.0%) | $0 |
| 4-Person Families | 0 (0.0%) | $0 |
| 5-Person Families | 0 (0.0%) | $0 |
| 6-Person Families | 0 (0.0%) | $0 |
| 7+ Person Families | 0 (0.0%) | $0 |
| Total | 89 (100.0%) | $0 |
Family Income by Number of Earners in Warren
| Number of Earners | # Families | Median Income |
| No Earners | 0 (0.0%) | $0 |
| 1 Earner | 33 (37.1%) | $0 |
| 2 Earners | 56 (62.9%) | $0 |
| 3+ Earners | 0 (0.0%) | $0 |
| Total | 89 (100.0%) | $0 |
Household Income in Warren
Household Income Brackets in Warren
With 103 households falling in the category, the less than $10,000 income range is the most frequent in Warren, accounting for 30.6% of all households.
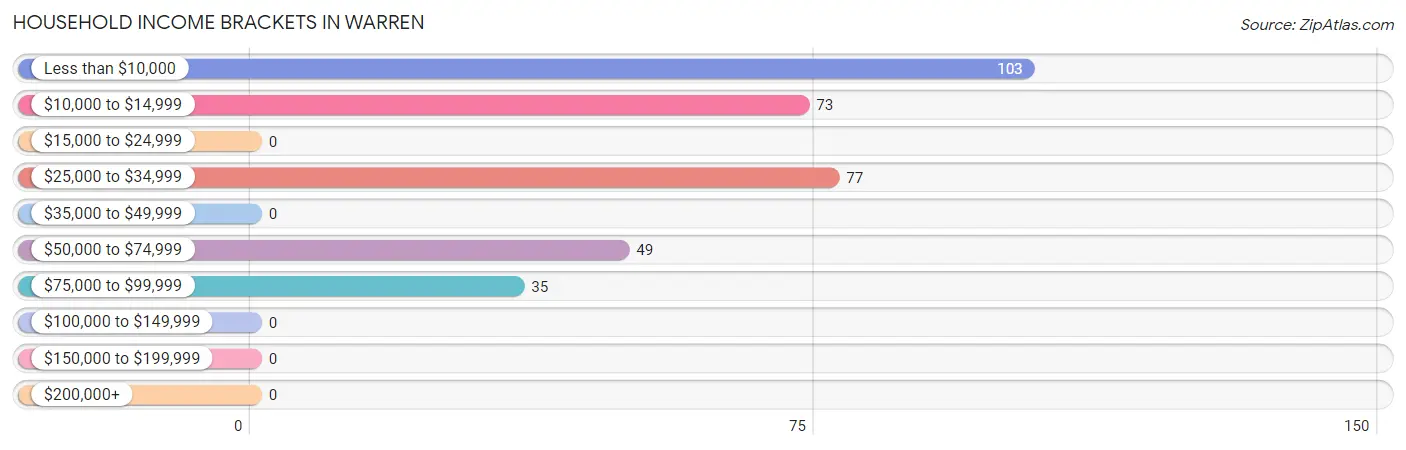
| Income Bracket | # Households | % Households |
| Less than $10,000 | 103 | 30.6% |
| $10,000 to $14,999 | 73 | 21.7% |
| $15,000 to $24,999 | 0 | 0.0% |
| $25,000 to $34,999 | 77 | 22.8% |
| $35,000 to $49,999 | 0 | 0.0% |
| $50,000 to $74,999 | 49 | 14.5% |
| $75,000 to $99,999 | 35 | 10.4% |
| $100,000 to $149,999 | 0 | 0.0% |
| $150,000 to $199,999 | 0 | 0.0% |
| $200,000+ | 0 | 0.0% |
Household Income by Householder Age in Warren

| Income Bracket | # Households | Median Income |
| 15 to 24 Years | 0 (0.0%) | $0 |
| 25 to 44 Years | 199 (59.1%) | $0 |
| 45 to 64 Years | 74 (22.0%) | $0 |
| 65+ Years | 64 (19.0%) | $0 |
| Total | 337 (100.0%) | $0 |
Poverty in Warren
Income Below Poverty by Sex and Age in Warren
With 10.6% poverty level for males and 36.3% for females among the residents of Warren, 45 to 54 year old males and 55 to 64 year old females are the most vulnerable to poverty, with 30 males (100.0%) and 44 females (100.0%) in their respective age groups living below the poverty level.
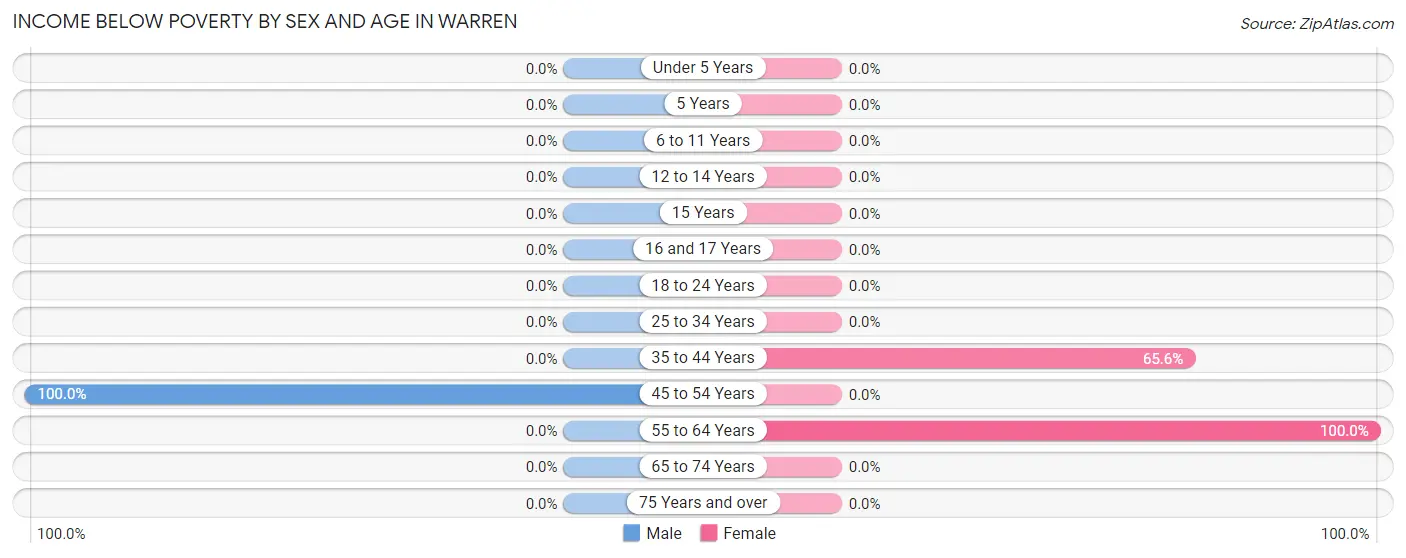
| Age Bracket | Male | Female |
| Under 5 Years | 0 (0.0%) | 0 (0.0%) |
| 5 Years | 0 (0.0%) | 0 (0.0%) |
| 6 to 11 Years | 0 (0.0%) | 0 (0.0%) |
| 12 to 14 Years | 0 (0.0%) | 0 (0.0%) |
| 15 Years | 0 (0.0%) | 0 (0.0%) |
| 16 and 17 Years | 0 (0.0%) | 0 (0.0%) |
| 18 to 24 Years | 0 (0.0%) | 0 (0.0%) |
| 25 to 34 Years | 0 (0.0%) | 0 (0.0%) |
| 35 to 44 Years | 0 (0.0%) | 59 (65.6%) |
| 45 to 54 Years | 30 (100.0%) | 0 (0.0%) |
| 55 to 64 Years | 0 (0.0%) | 44 (100.0%) |
| 65 to 74 Years | 0 (0.0%) | 0 (0.0%) |
| 75 Years and over | 0 (0.0%) | 0 (0.0%) |
| Total | 30 (10.6%) | 103 (36.3%) |
Income Above Poverty by Sex and Age in Warren
According to the poverty statistics in Warren, males aged under 5 years and females aged under 5 years are the age groups that are most secure financially, with 100.0% of males and 100.0% of females in these age groups living above the poverty line.
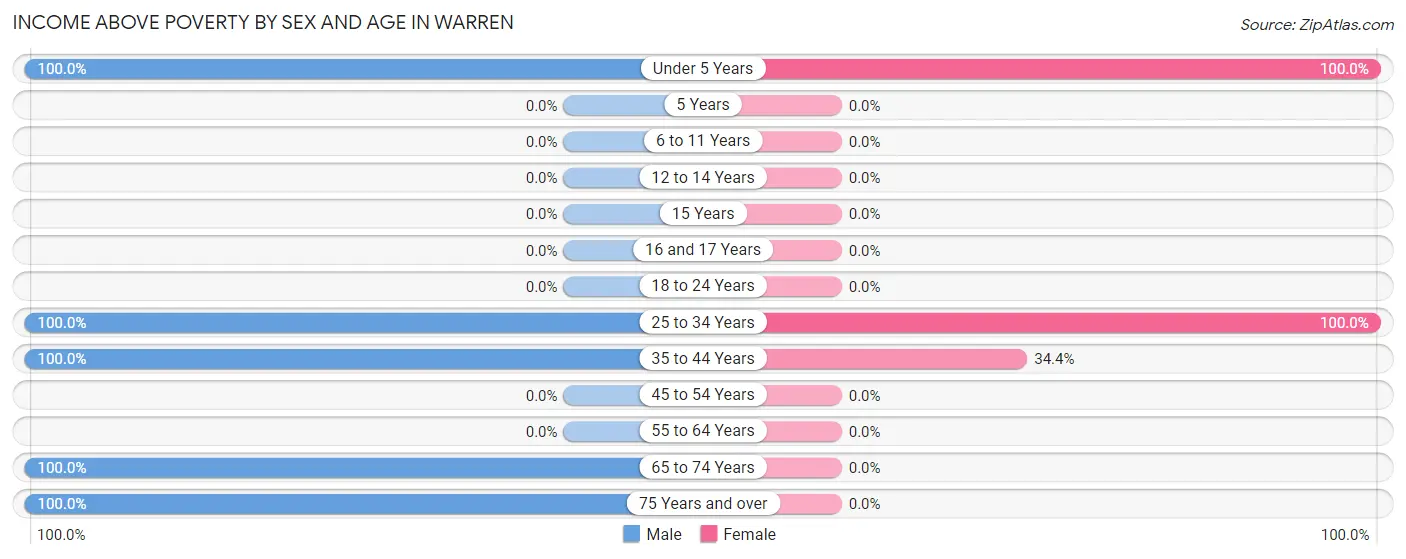
| Age Bracket | Male | Female |
| Under 5 Years | 65 (100.0%) | 32 (100.0%) |
| 5 Years | 0 (0.0%) | 0 (0.0%) |
| 6 to 11 Years | 0 (0.0%) | 0 (0.0%) |
| 12 to 14 Years | 0 (0.0%) | 0 (0.0%) |
| 15 Years | 0 (0.0%) | 0 (0.0%) |
| 16 and 17 Years | 0 (0.0%) | 0 (0.0%) |
| 18 to 24 Years | 0 (0.0%) | 0 (0.0%) |
| 25 to 34 Years | 91 (100.0%) | 118 (100.0%) |
| 35 to 44 Years | 33 (100.0%) | 31 (34.4%) |
| 45 to 54 Years | 0 (0.0%) | 0 (0.0%) |
| 55 to 64 Years | 0 (0.0%) | 0 (0.0%) |
| 65 to 74 Years | 43 (100.0%) | 0 (0.0%) |
| 75 Years and over | 21 (100.0%) | 0 (0.0%) |
| Total | 253 (89.4%) | 181 (63.7%) |
Income Below Poverty Among Married-Couple Families in Warren
| Children | Above Poverty | Below Poverty |
| No Children | 0 (0.0%) | 0 (0.0%) |
| 1 or 2 Children | 89 (100.0%) | 0 (0.0%) |
| 3 or 4 Children | 0 (0.0%) | 0 (0.0%) |
| 5 or more Children | 0 (0.0%) | 0 (0.0%) |
| Total | 89 (100.0%) | 0 (0.0%) |
Income Below Poverty Among Single-Parent Households in Warren
| Children | Single Father | Single Mother |
| No Children | 0 (0.0%) | 0 (0.0%) |
| 1 or 2 Children | 0 (0.0%) | 0 (0.0%) |
| 3 or 4 Children | 0 (0.0%) | 0 (0.0%) |
| 5 or more Children | 0 (0.0%) | 0 (0.0%) |
| Total | 0 (0.0%) | 0 (0.0%) |
Income Below Poverty Among Married-Couple vs Single-Parent Households in Warren
| Children | Married-Couple Families | Single-Parent Households |
| No Children | 0 (0.0%) | 0 (0.0%) |
| 1 or 2 Children | 0 (0.0%) | 0 (0.0%) |
| 3 or 4 Children | 0 (0.0%) | 0 (0.0%) |
| 5 or more Children | 0 (0.0%) | 0 (0.0%) |
| Total | 0 (0.0%) | 0 (0.0%) |
Employment Characteristics in Warren
Employment by Class of Employer in Warren
Among the 170 employed individuals in Warren, private company employees (107 | 62.9%), federal government employees (33 | 19.4%), and self-employed (not incorporated) (30 | 17.6%) make up the most common classes of employment.
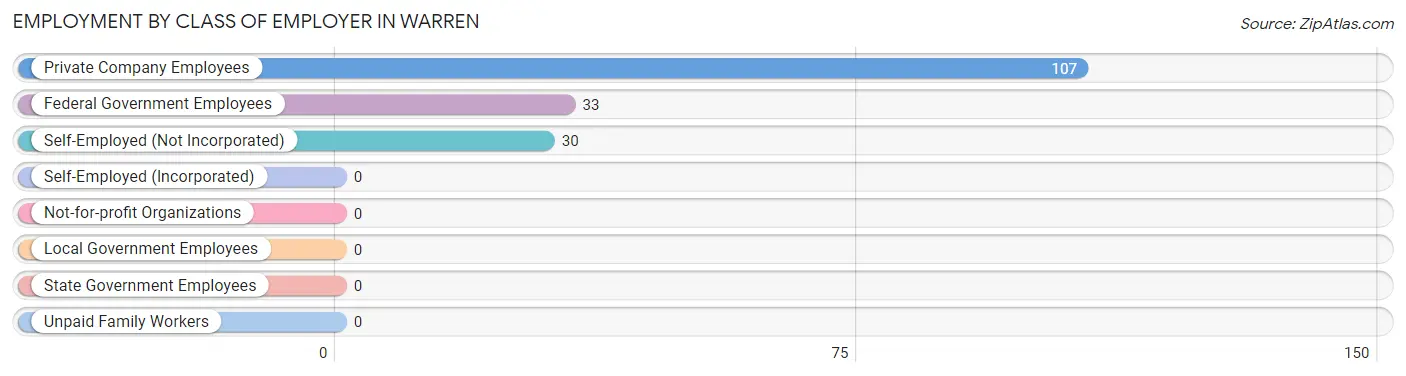
| Employer Class | # Employees | % Employees |
| Private Company Employees | 107 | 62.9% |
| Self-Employed (Incorporated) | 0 | 0.0% |
| Self-Employed (Not Incorporated) | 30 | 17.6% |
| Not-for-profit Organizations | 0 | 0.0% |
| Local Government Employees | 0 | 0.0% |
| State Government Employees | 0 | 0.0% |
| Federal Government Employees | 33 | 19.4% |
| Unpaid Family Workers | 0 | 0.0% |
| Total | 170 | 100.0% |
Employment Status by Age in Warren
According to the labor force statistics for Warren, out of the total population over 16 years of age (470), 70.4% or 331 individuals are in the labor force, with 30.2% or 100 of them unemployed. The age group with the highest labor force participation rate is 25 to 29 years, with 100.0% or 193 individuals in the labor force. Within the labor force, the 35 to 44 years age range has the highest percentage of unemployed individuals, with 64.1% or 59 of them being unemployed.
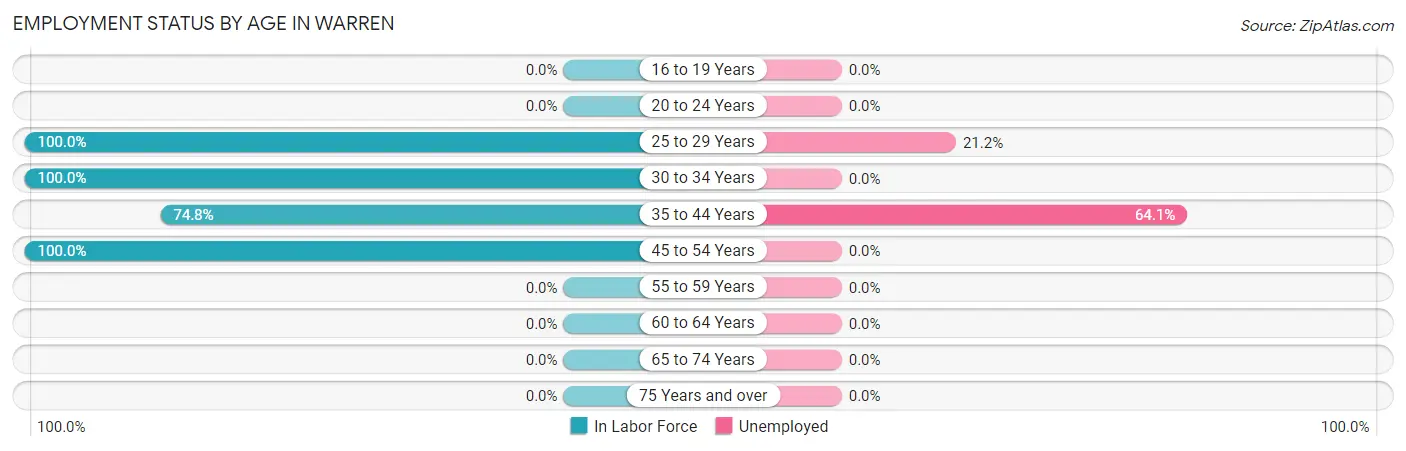
| Age Bracket | In Labor Force | Unemployed |
| 16 to 19 Years | 0 (0.0%) | 0 (0.0%) |
| 20 to 24 Years | 0 (0.0%) | 0 (0.0%) |
| 25 to 29 Years | 193 (100.0%) | 41 (21.2%) |
| 30 to 34 Years | 16 (100.0%) | 0 (0.0%) |
| 35 to 44 Years | 92 (74.8%) | 59 (64.1%) |
| 45 to 54 Years | 30 (100.0%) | 0 (0.0%) |
| 55 to 59 Years | 0 (0.0%) | 0 (0.0%) |
| 60 to 64 Years | 0 (0.0%) | 0 (0.0%) |
| 65 to 74 Years | 0 (0.0%) | 0 (0.0%) |
| 75 Years and over | 0 (0.0%) | 0 (0.0%) |
| Total | 331 (70.4%) | 100 (30.2%) |
Employment Status by Educational Attainment in Warren
According to labor force statistics for Warren, 81.5% of individuals (331) out of the total population between 25 and 64 years of age (406) are in the labor force, with 30.2% or 100 of them being unemployed. The group with the highest labor force participation rate are those with the educational attainment of bachelor's degree or higher, with 100.0% or 117 individuals in the labor force. Within the labor force, individuals with college / associate degree education have the highest percentage of unemployment, with 78.7% or 59 of them being unemployed.
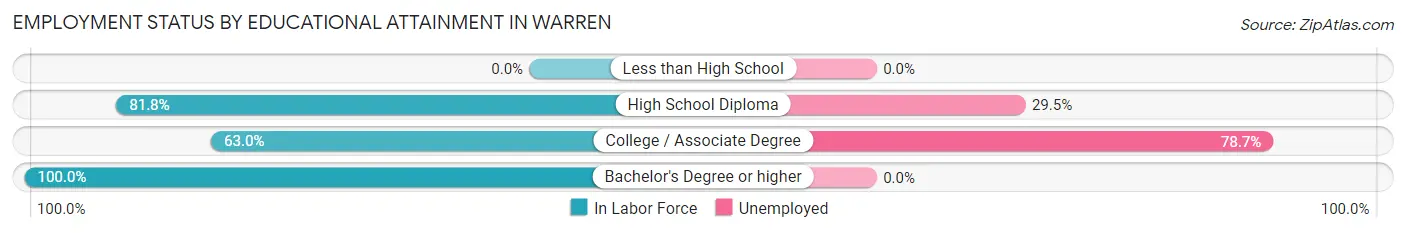
| Educational Attainment | In Labor Force | Unemployed |
| Less than High School | 0 (0.0%) | 0 (0.0%) |
| High School Diploma | 139 (81.8%) | 50 (29.5%) |
| College / Associate Degree | 75 (63.0%) | 94 (78.7%) |
| Bachelor's Degree or higher | 117 (100.0%) | 0 (0.0%) |
| Total | 331 (81.5%) | 123 (30.2%) |
Employment Occupations by Sex in Warren
Management, Business, Science and Arts Occupations
The most common Management, Business, Science and Arts occupations in Warren are , and Business & Financial (56 | 24.2%).
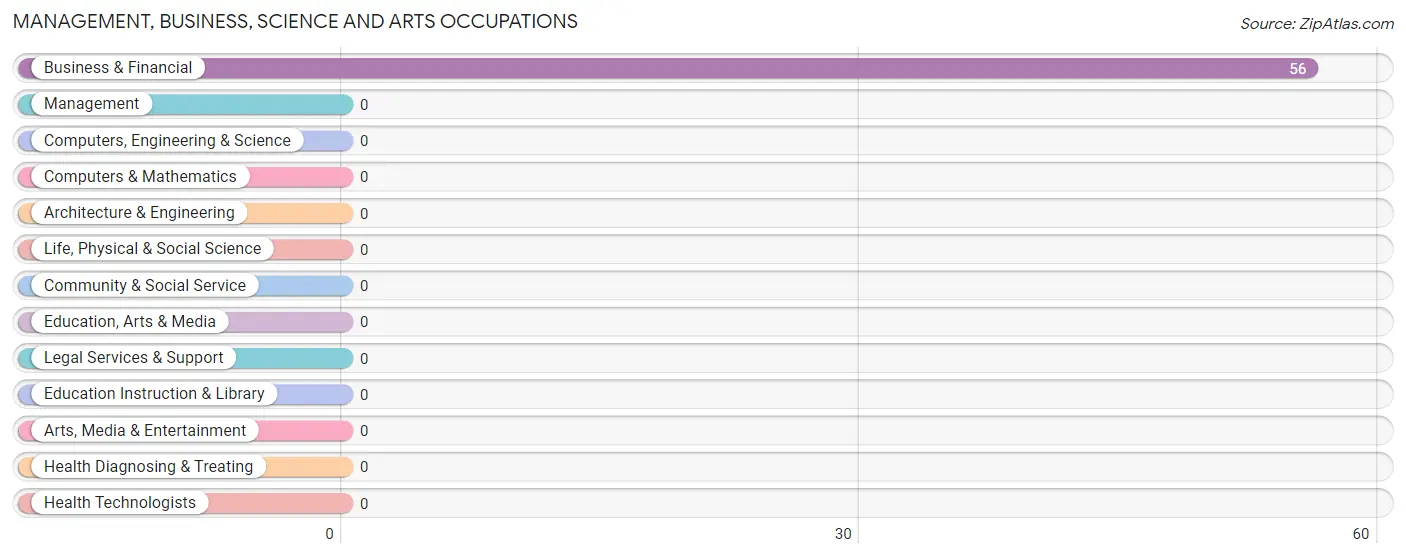
Management, Business, Science and Arts Occupations by Sex
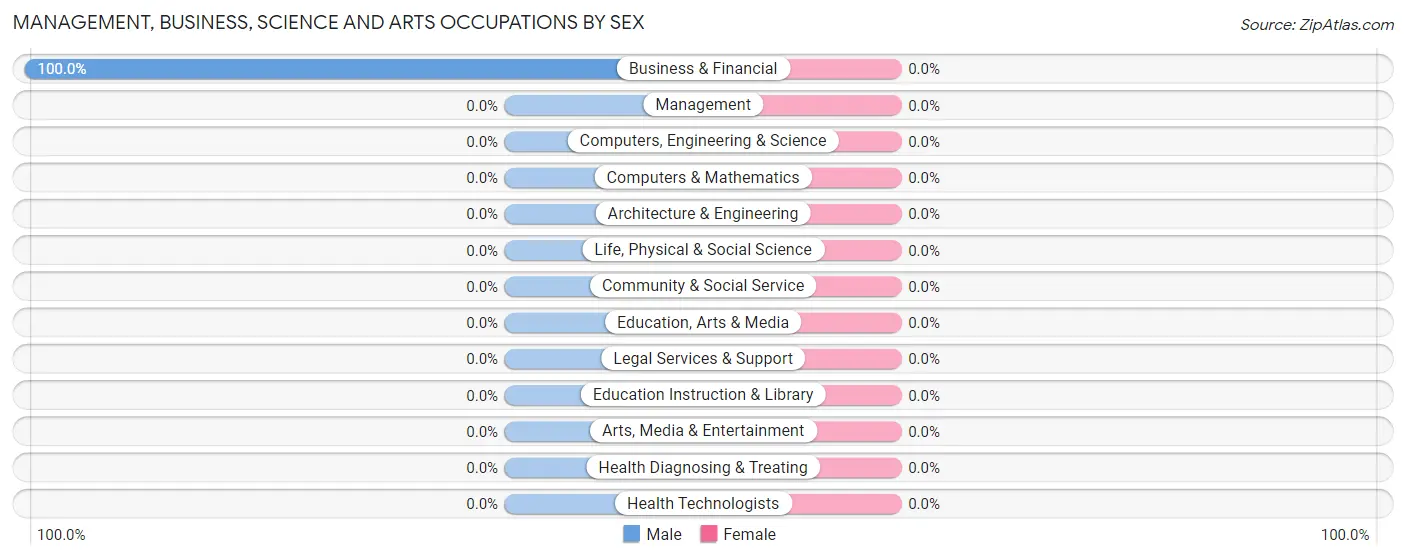
| Occupation | Male | Female |
| Management | 0 (0.0%) | 0 (0.0%) |
| Business & Financial | 56 (100.0%) | 0 (0.0%) |
| Computers, Engineering & Science | 0 (0.0%) | 0 (0.0%) |
| Computers & Mathematics | 0 (0.0%) | 0 (0.0%) |
| Architecture & Engineering | 0 (0.0%) | 0 (0.0%) |
| Life, Physical & Social Science | 0 (0.0%) | 0 (0.0%) |
| Community & Social Service | 0 (0.0%) | 0 (0.0%) |
| Education, Arts & Media | 0 (0.0%) | 0 (0.0%) |
| Legal Services & Support | 0 (0.0%) | 0 (0.0%) |
| Education Instruction & Library | 0 (0.0%) | 0 (0.0%) |
| Arts, Media & Entertainment | 0 (0.0%) | 0 (0.0%) |
| Health Diagnosing & Treating | 0 (0.0%) | 0 (0.0%) |
| Health Technologists | 0 (0.0%) | 0 (0.0%) |
| Total (Category) | 56 (100.0%) | 0 (0.0%) |
| Total (Overall) | 154 (66.7%) | 77 (33.3%) |
Services Occupations
The most common Services occupations in Warren are , and Food Preparation & Serving (61 | 26.4%).
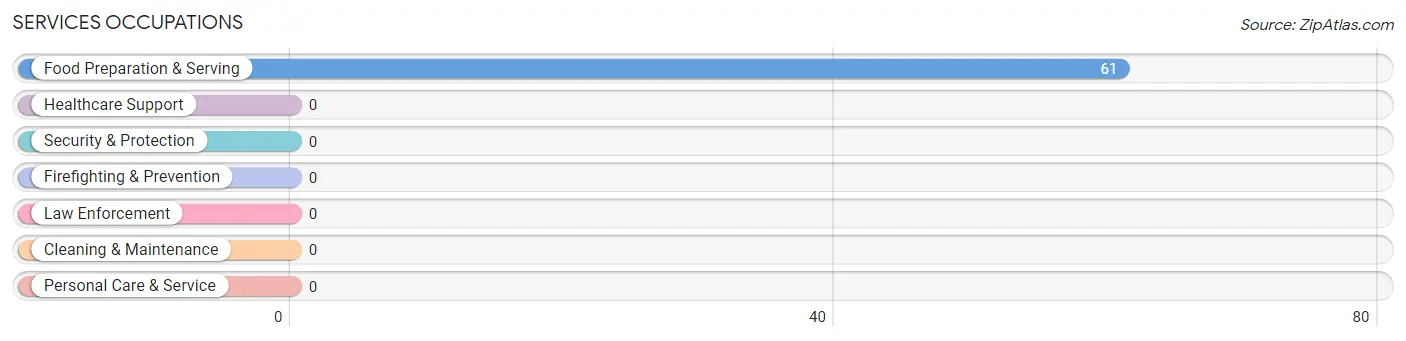
Services Occupations by Sex
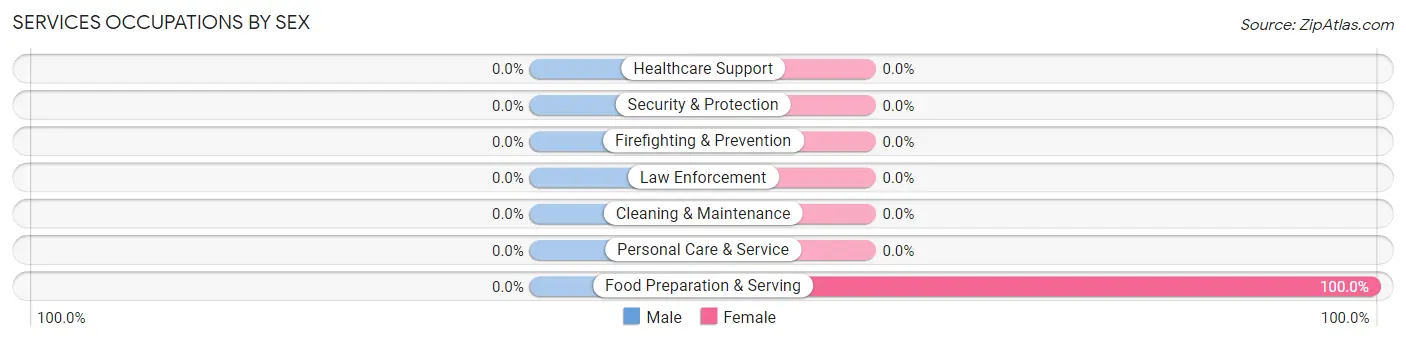
| Occupation | Male | Female |
| Healthcare Support | 0 (0.0%) | 0 (0.0%) |
| Security & Protection | 0 (0.0%) | 0 (0.0%) |
| Firefighting & Prevention | 0 (0.0%) | 0 (0.0%) |
| Law Enforcement | 0 (0.0%) | 0 (0.0%) |
| Food Preparation & Serving | 0 (0.0%) | 61 (100.0%) |
| Cleaning & Maintenance | 0 (0.0%) | 0 (0.0%) |
| Personal Care & Service | 0 (0.0%) | 0 (0.0%) |
| Total (Category) | 0 (0.0%) | 61 (100.0%) |
| Total (Overall) | 154 (66.7%) | 77 (33.3%) |
Sales and Office Occupations
The most common Sales and Office occupations in Warren are Office & Administration (33 | 14.3%), and Sales & Related (16 | 6.9%).
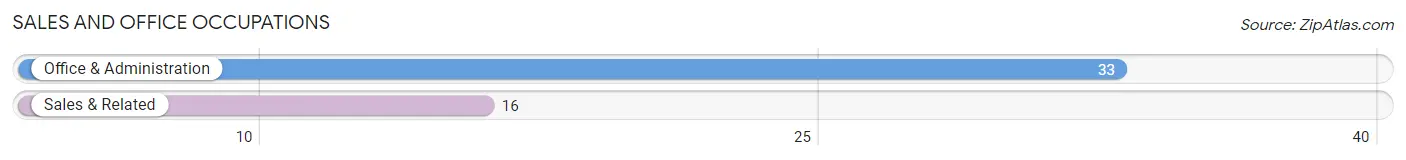
Sales and Office Occupations by Sex
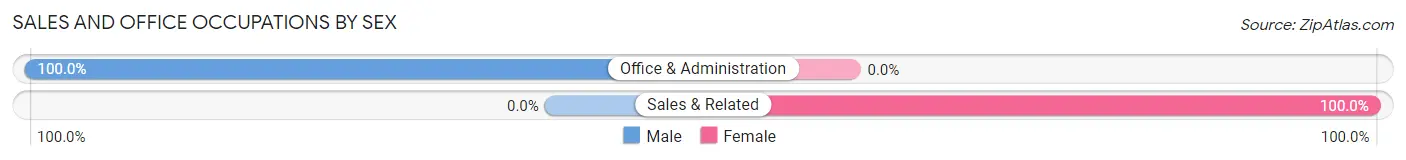
| Occupation | Male | Female |
| Sales & Related | 0 (0.0%) | 16 (100.0%) |
| Office & Administration | 33 (100.0%) | 0 (0.0%) |
| Total (Category) | 33 (67.3%) | 16 (32.7%) |
| Total (Overall) | 154 (66.7%) | 77 (33.3%) |
Natural Resources, Construction and Maintenance Occupations
The most common Natural Resources, Construction and Maintenance occupations in Warren are , and Installation, Maintenance & Repair (30 | 13.0%).
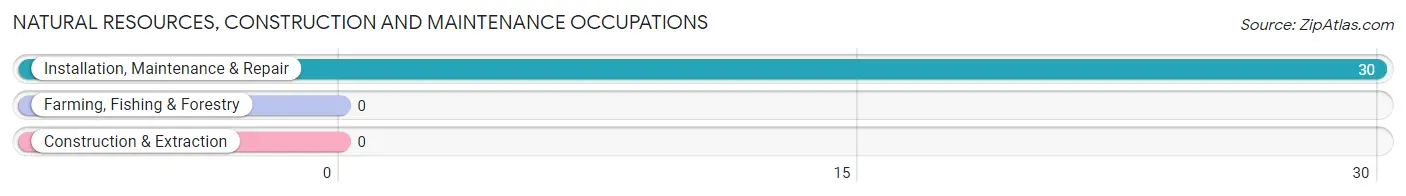
Natural Resources, Construction and Maintenance Occupations by Sex
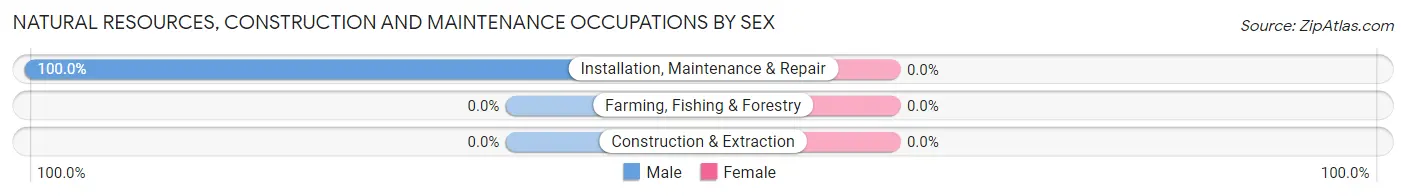
| Occupation | Male | Female |
| Farming, Fishing & Forestry | 0 (0.0%) | 0 (0.0%) |
| Construction & Extraction | 0 (0.0%) | 0 (0.0%) |
| Installation, Maintenance & Repair | 30 (100.0%) | 0 (0.0%) |
| Total (Category) | 30 (100.0%) | 0 (0.0%) |
| Total (Overall) | 154 (66.7%) | 77 (33.3%) |
Production, Transportation and Moving Occupations
The most common Production, Transportation and Moving occupations in Warren are , and Transportation (35 | 15.1%).
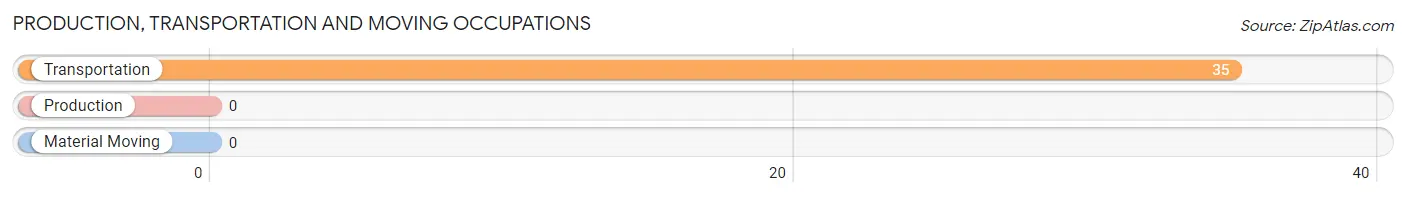
Production, Transportation and Moving Occupations by Sex
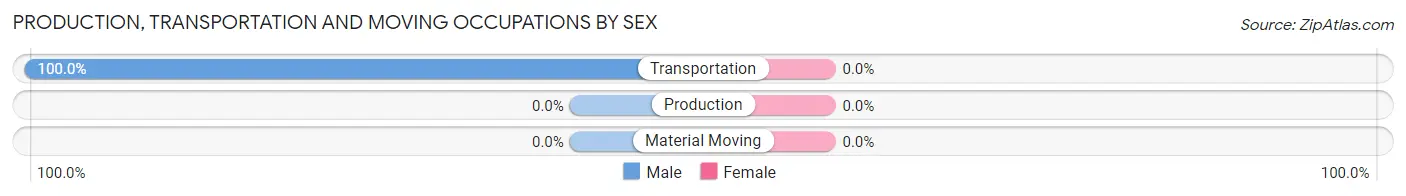
| Occupation | Male | Female |
| Production | 0 (0.0%) | 0 (0.0%) |
| Transportation | 35 (100.0%) | 0 (0.0%) |
| Material Moving | 0 (0.0%) | 0 (0.0%) |
| Total (Category) | 35 (100.0%) | 0 (0.0%) |
| Total (Overall) | 154 (66.7%) | 77 (33.3%) |
Employment Industries by Sex in Warren
Employment Industries in Warren
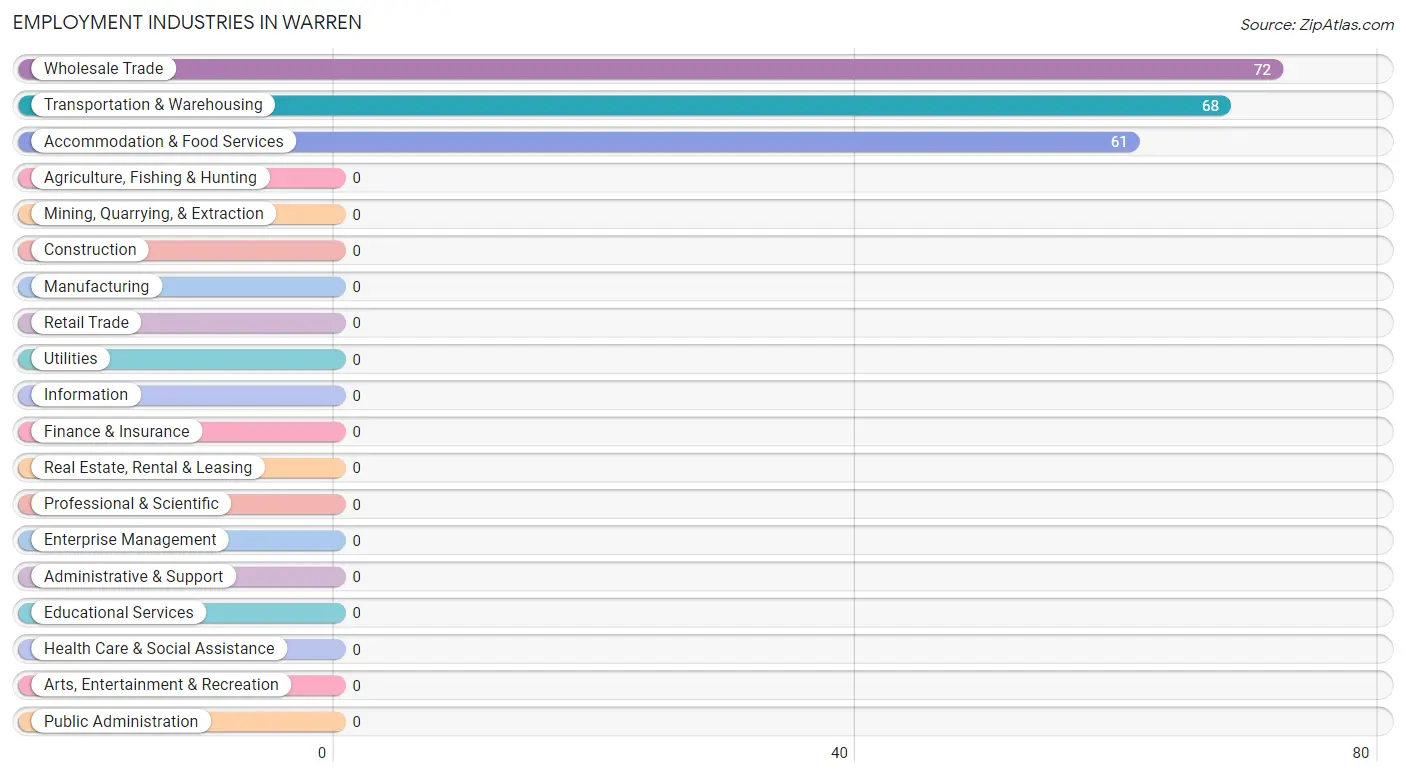
The major employment industries in Warren include Wholesale Trade (72 | 31.2%), Transportation & Warehousing (68 | 29.4%), and Accommodation & Food Services (61 | 26.4%).
Employment Industries by Sex in Warren
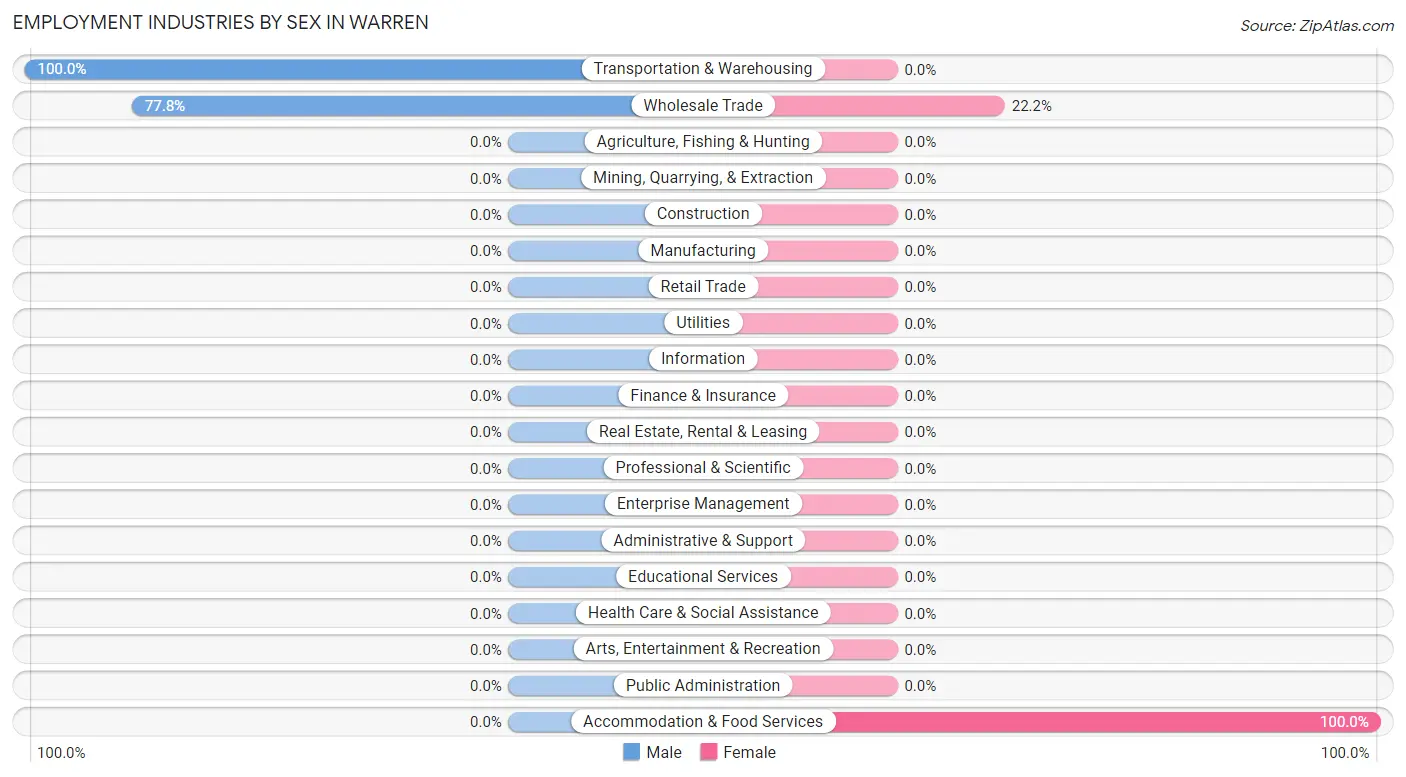
The Warren industries that see more men than women are Transportation & Warehousing (100.0%), and Wholesale Trade (77.8%), whereas the industries that tend to have a higher number of women are Accommodation & Food Services (100.0%), and Wholesale Trade (22.2%).
| Industry | Male | Female |
| Agriculture, Fishing & Hunting | 0 (0.0%) | 0 (0.0%) |
| Mining, Quarrying, & Extraction | 0 (0.0%) | 0 (0.0%) |
| Construction | 0 (0.0%) | 0 (0.0%) |
| Manufacturing | 0 (0.0%) | 0 (0.0%) |
| Wholesale Trade | 56 (77.8%) | 16 (22.2%) |
| Retail Trade | 0 (0.0%) | 0 (0.0%) |
| Transportation & Warehousing | 68 (100.0%) | 0 (0.0%) |
| Utilities | 0 (0.0%) | 0 (0.0%) |
| Information | 0 (0.0%) | 0 (0.0%) |
| Finance & Insurance | 0 (0.0%) | 0 (0.0%) |
| Real Estate, Rental & Leasing | 0 (0.0%) | 0 (0.0%) |
| Professional & Scientific | 0 (0.0%) | 0 (0.0%) |
| Enterprise Management | 0 (0.0%) | 0 (0.0%) |
| Administrative & Support | 0 (0.0%) | 0 (0.0%) |
| Educational Services | 0 (0.0%) | 0 (0.0%) |
| Health Care & Social Assistance | 0 (0.0%) | 0 (0.0%) |
| Arts, Entertainment & Recreation | 0 (0.0%) | 0 (0.0%) |
| Accommodation & Food Services | 0 (0.0%) | 61 (100.0%) |
| Public Administration | 0 (0.0%) | 0 (0.0%) |
| Total | 154 (66.7%) | 77 (33.3%) |
Education in Warren
School Enrollment in Warren
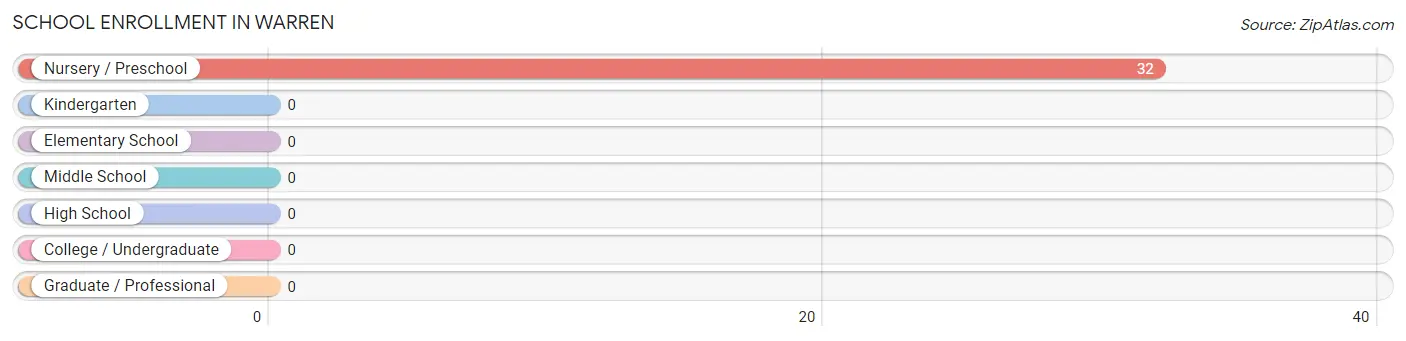
| School Level | # Students | % Students |
| Nursery / Preschool | 32 | 100.0% |
| Kindergarten | 0 | 0.0% |
| Elementary School | 0 | 0.0% |
| Middle School | 0 | 0.0% |
| High School | 0 | 0.0% |
| College / Undergraduate | 0 | 0.0% |
| Graduate / Professional | 0 | 0.0% |
| Total | 32 | 100.0% |
School Enrollment by Age by Funding Source in Warren
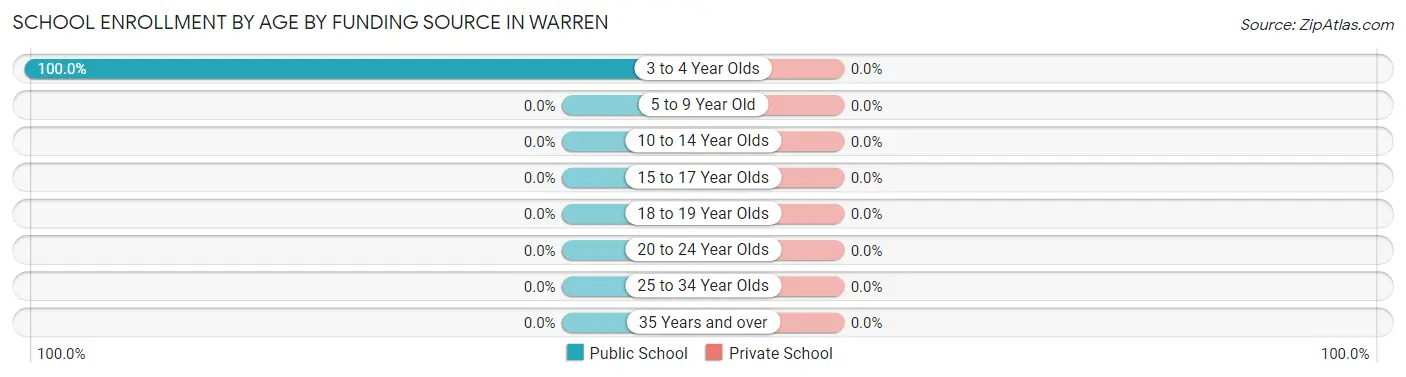
| Age Bracket | Public School | Private School |
| 3 to 4 Year Olds | 32 (100.0%) | 0 (0.0%) |
| 5 to 9 Year Old | 0 (0.0%) | 0 (0.0%) |
| 10 to 14 Year Olds | 0 (0.0%) | 0 (0.0%) |
| 15 to 17 Year Olds | 0 (0.0%) | 0 (0.0%) |
| 18 to 19 Year Olds | 0 (0.0%) | 0 (0.0%) |
| 20 to 24 Year Olds | 0 (0.0%) | 0 (0.0%) |
| 25 to 34 Year Olds | 0 (0.0%) | 0 (0.0%) |
| 35 Years and over | 0 (0.0%) | 0 (0.0%) |
| Total | 32 (100.0%) | 0 (0.0%) |
Educational Attainment by Field of Study in Warren
Science & technology (61 | 52.1%), and bio, nature & agricultural (56 | 47.9%) are the most common fields of study among 117 individuals in Warren who have obtained a bachelor's degree or higher.
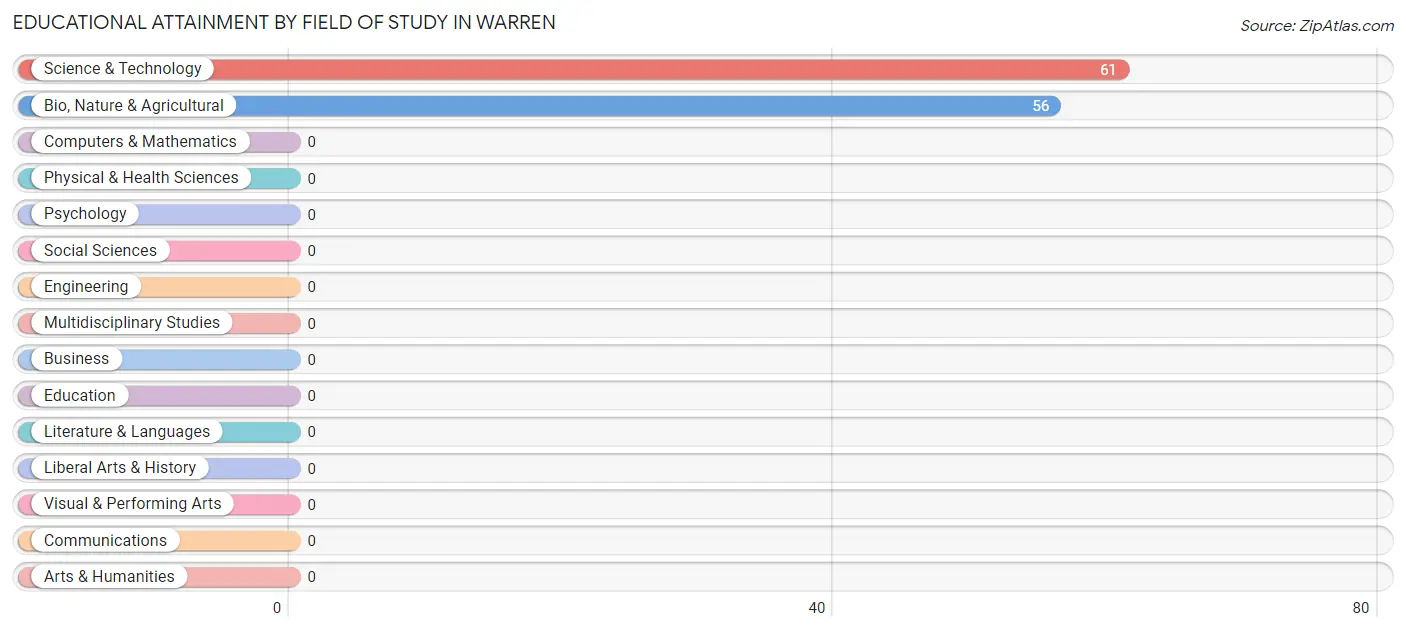
| Field of Study | # Graduates | % Graduates |
| Computers & Mathematics | 0 | 0.0% |
| Bio, Nature & Agricultural | 56 | 47.9% |
| Physical & Health Sciences | 0 | 0.0% |
| Psychology | 0 | 0.0% |
| Social Sciences | 0 | 0.0% |
| Engineering | 0 | 0.0% |
| Multidisciplinary Studies | 0 | 0.0% |
| Science & Technology | 61 | 52.1% |
| Business | 0 | 0.0% |
| Education | 0 | 0.0% |
| Literature & Languages | 0 | 0.0% |
| Liberal Arts & History | 0 | 0.0% |
| Visual & Performing Arts | 0 | 0.0% |
| Communications | 0 | 0.0% |
| Arts & Humanities | 0 | 0.0% |
| Total | 117 | 100.0% |
Transportation & Commute in Warren
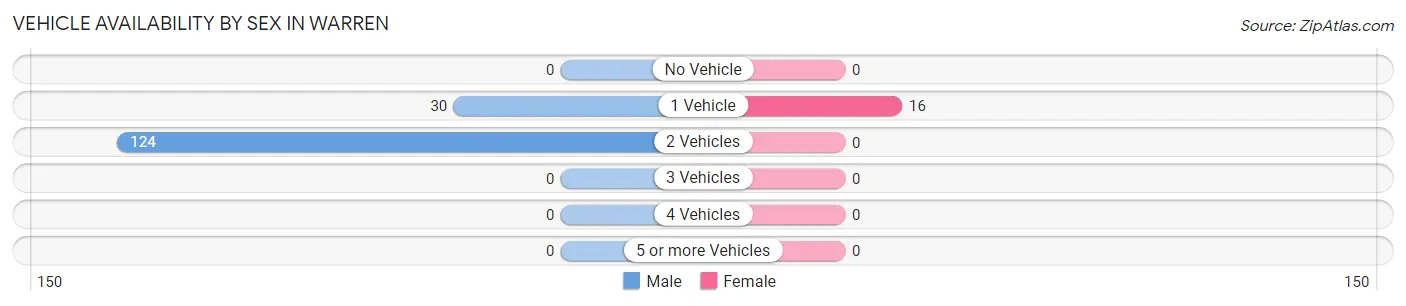
Vehicle Availability by Sex in Warren
The most prevalent vehicle ownership categories in Warren are males with 2 vehicles (124, accounting for 80.5%) and females with 2 vehicles (0, making up 775.0%).
| Vehicles Available | Male | Female |
| No Vehicle | 0 (0.0%) | 0 (0.0%) |
| 1 Vehicle | 30 (19.5%) | 16 (100.0%) |
| 2 Vehicles | 124 (80.5%) | 0 (0.0%) |
| 3 Vehicles | 0 (0.0%) | 0 (0.0%) |
| 4 Vehicles | 0 (0.0%) | 0 (0.0%) |
| 5 or more Vehicles | 0 (0.0%) | 0 (0.0%) |
| Total | 154 (100.0%) | 16 (100.0%) |
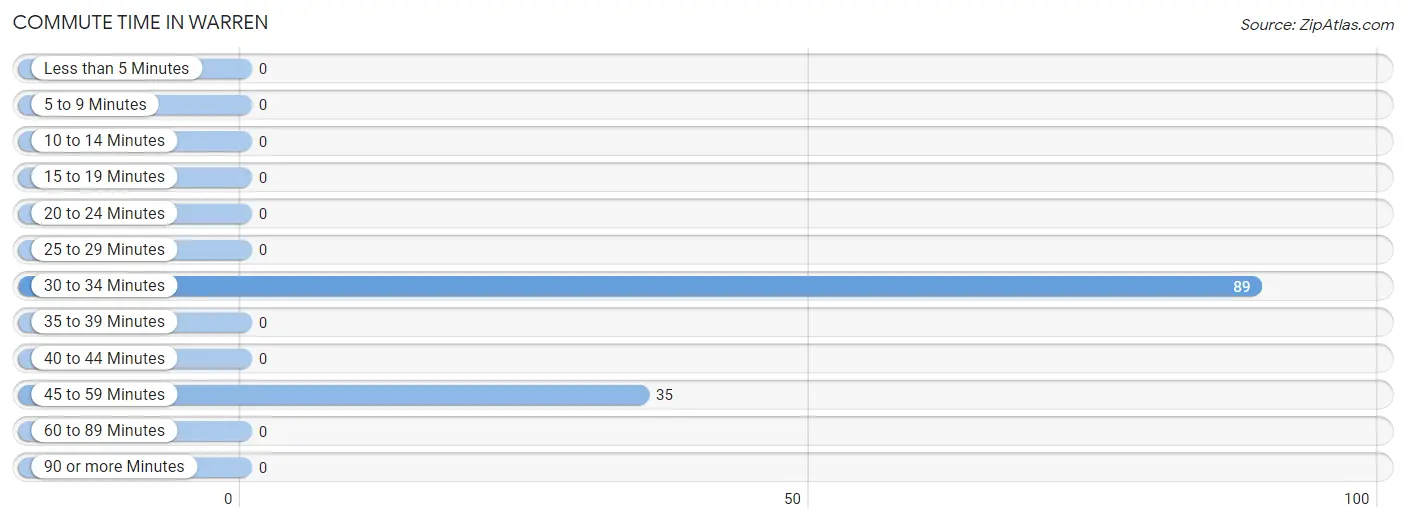
Commute Time in Warren
The most frequently occuring commute durations in Warren are 30 to 34 minutes (89 commuters, 71.8%), 45 to 59 minutes (35 commuters, 28.2%), and less than 5 minutes (0 commuters, 0.0%).
| Commute Time | # Commuters | % Commuters |
| Less than 5 Minutes | 0 | 0.0% |
| 5 to 9 Minutes | 0 | 0.0% |
| 10 to 14 Minutes | 0 | 0.0% |
| 15 to 19 Minutes | 0 | 0.0% |
| 20 to 24 Minutes | 0 | 0.0% |
| 25 to 29 Minutes | 0 | 0.0% |
| 30 to 34 Minutes | 89 | 71.8% |
| 35 to 39 Minutes | 0 | 0.0% |
| 40 to 44 Minutes | 0 | 0.0% |
| 45 to 59 Minutes | 35 | 28.2% |
| 60 to 89 Minutes | 0 | 0.0% |
| 90 or more Minutes | 0 | 0.0% |
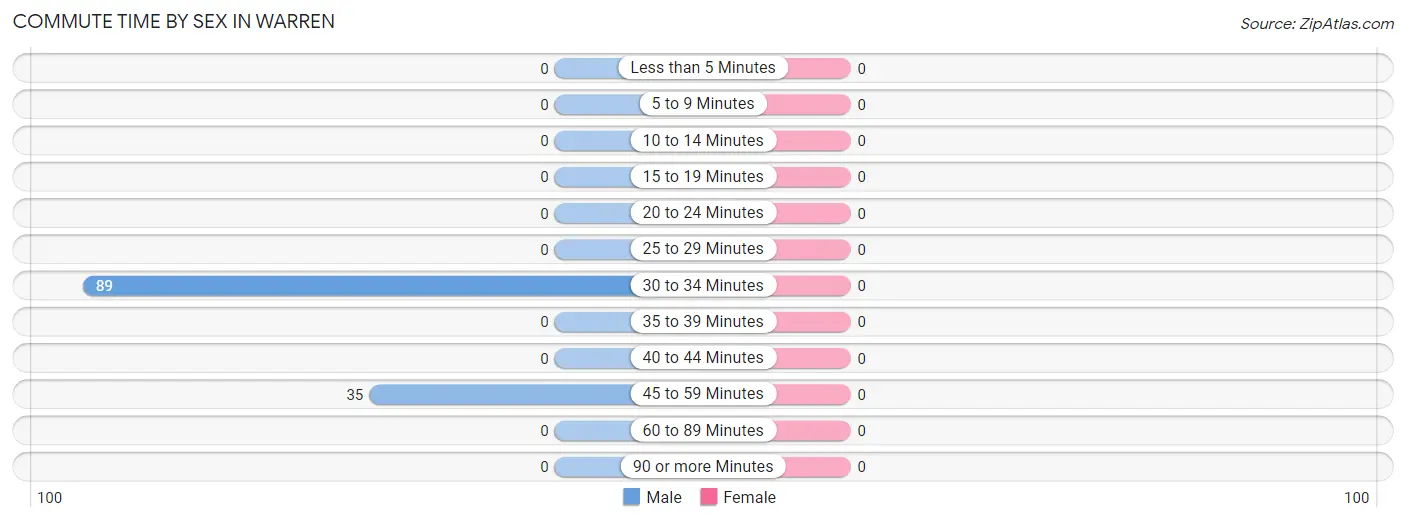
Commute Time by Sex in Warren
| Commute Time | Male | Female |
| Less than 5 Minutes | 0 (0.0%) | 0 (0.0%) |
| 5 to 9 Minutes | 0 (0.0%) | 0 (0.0%) |
| 10 to 14 Minutes | 0 (0.0%) | 0 (0.0%) |
| 15 to 19 Minutes | 0 (0.0%) | 0 (0.0%) |
| 20 to 24 Minutes | 0 (0.0%) | 0 (0.0%) |
| 25 to 29 Minutes | 0 (0.0%) | 0 (0.0%) |
| 30 to 34 Minutes | 89 (71.8%) | 0 (0.0%) |
| 35 to 39 Minutes | 0 (0.0%) | 0 (0.0%) |
| 40 to 44 Minutes | 0 (0.0%) | 0 (0.0%) |
| 45 to 59 Minutes | 35 (28.2%) | 0 (0.0%) |
| 60 to 89 Minutes | 0 (0.0%) | 0 (0.0%) |
| 90 or more Minutes | 0 (0.0%) | 0 (0.0%) |
Time of Departure to Work by Sex in Warren
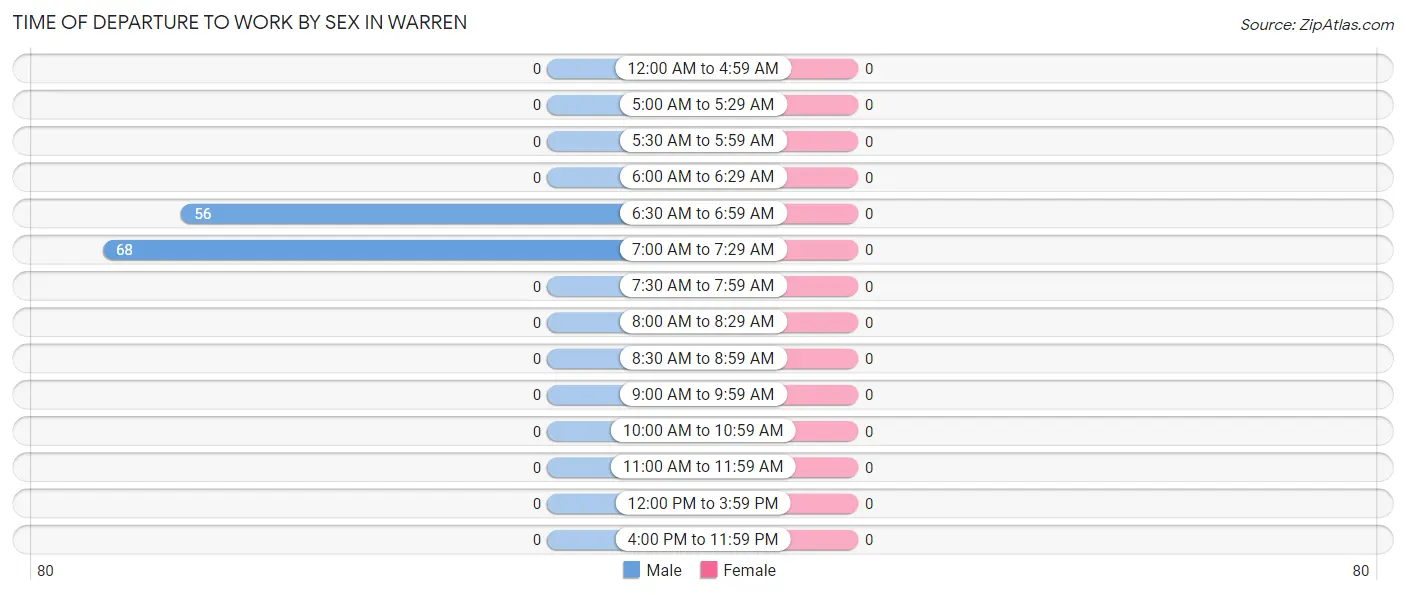
| Time of Departure | Male | Female |
| 12:00 AM to 4:59 AM | 0 (0.0%) | 0 (0.0%) |
| 5:00 AM to 5:29 AM | 0 (0.0%) | 0 (0.0%) |
| 5:30 AM to 5:59 AM | 0 (0.0%) | 0 (0.0%) |
| 6:00 AM to 6:29 AM | 0 (0.0%) | 0 (0.0%) |
| 6:30 AM to 6:59 AM | 56 (45.2%) | 0 (0.0%) |
| 7:00 AM to 7:29 AM | 68 (54.8%) | 0 (0.0%) |
| 7:30 AM to 7:59 AM | 0 (0.0%) | 0 (0.0%) |
| 8:00 AM to 8:29 AM | 0 (0.0%) | 0 (0.0%) |
| 8:30 AM to 8:59 AM | 0 (0.0%) | 0 (0.0%) |
| 9:00 AM to 9:59 AM | 0 (0.0%) | 0 (0.0%) |
| 10:00 AM to 10:59 AM | 0 (0.0%) | 0 (0.0%) |
| 11:00 AM to 11:59 AM | 0 (0.0%) | 0 (0.0%) |
| 12:00 PM to 3:59 PM | 0 (0.0%) | 0 (0.0%) |
| 4:00 PM to 11:59 PM | 0 (0.0%) | 0 (0.0%) |
| Total | 124 (100.0%) | 0 (0.0%) |
Housing Occupancy in Warren
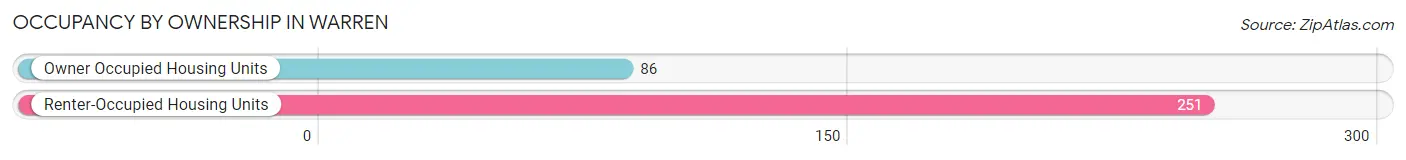
Occupancy by Ownership in Warren
Of the total 337 dwellings in Warren, owner-occupied units account for 86 (25.5%), while renter-occupied units make up 251 (74.5%).
| Occupancy | # Housing Units | % Housing Units |
| Owner Occupied Housing Units | 86 | 25.5% |
| Renter-Occupied Housing Units | 251 | 74.5% |
| Total Occupied Housing Units | 337 | 100.0% |
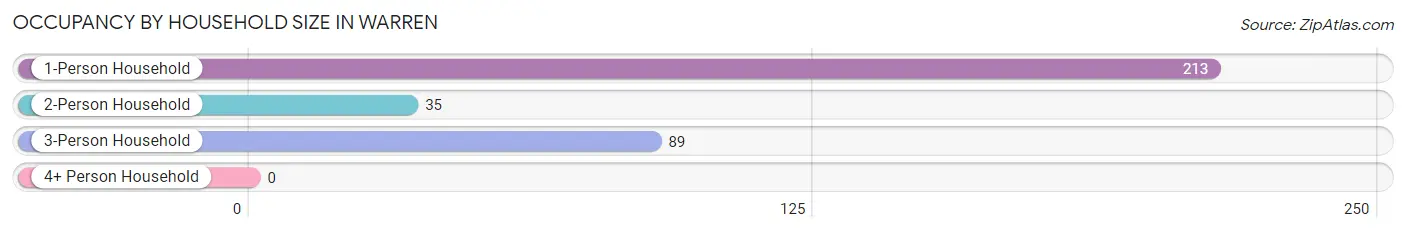
Occupancy by Household Size in Warren
| Household Size | # Housing Units | % Housing Units |
| 1-Person Household | 213 | 63.2% |
| 2-Person Household | 35 | 10.4% |
| 3-Person Household | 89 | 26.4% |
| 4+ Person Household | 0 | 0.0% |
| Total Housing Units | 337 | 100.0% |
Occupancy by Ownership by Household Size in Warren
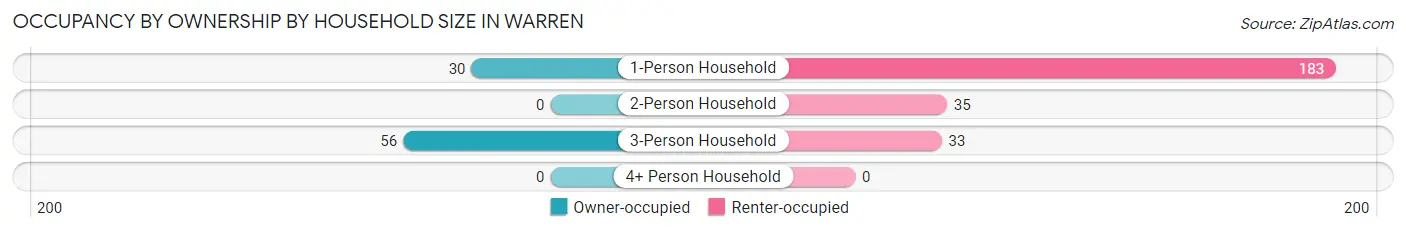
| Household Size | Owner-occupied | Renter-occupied |
| 1-Person Household | 30 (14.1%) | 183 (85.9%) |
| 2-Person Household | 0 (0.0%) | 35 (100.0%) |
| 3-Person Household | 56 (62.9%) | 33 (37.1%) |
| 4+ Person Household | 0 (0.0%) | 0 (0.0%) |
| Total Housing Units | 86 (25.5%) | 251 (74.5%) |
Occupancy by Educational Attainment in Warren
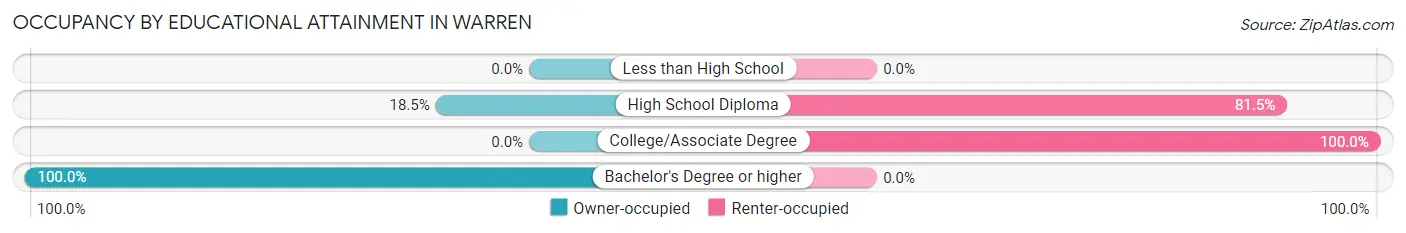
| Household Size | Owner-occupied | Renter-occupied |
| Less than High School | 0 (0.0%) | 0 (0.0%) |
| High School Diploma | 30 (18.5%) | 132 (81.5%) |
| College/Associate Degree | 0 (0.0%) | 119 (100.0%) |
| Bachelor's Degree or higher | 56 (100.0%) | 0 (0.0%) |
Occupancy by Age of Householder in Warren
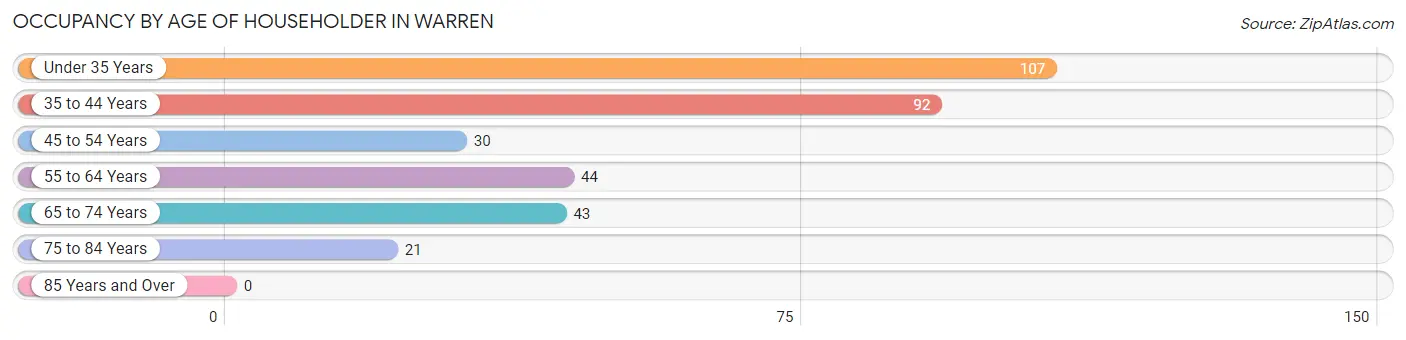
| Age Bracket | # Households | % Households |
| Under 35 Years | 107 | 31.8% |
| 35 to 44 Years | 92 | 27.3% |
| 45 to 54 Years | 30 | 8.9% |
| 55 to 64 Years | 44 | 13.1% |
| 65 to 74 Years | 43 | 12.8% |
| 75 to 84 Years | 21 | 6.2% |
| 85 Years and Over | 0 | 0.0% |
| Total | 337 | 100.0% |
Housing Finances in Warren
Median Income by Occupancy in Warren
| Occupancy Type | # Households | Median Income |
| Owner-Occupied | 86 (25.5%) | $0 |
| Renter-Occupied | 251 (74.5%) | $0 |
| Average | 337 (100.0%) | $0 |
Occupancy by Householder Income Bracket in Warren
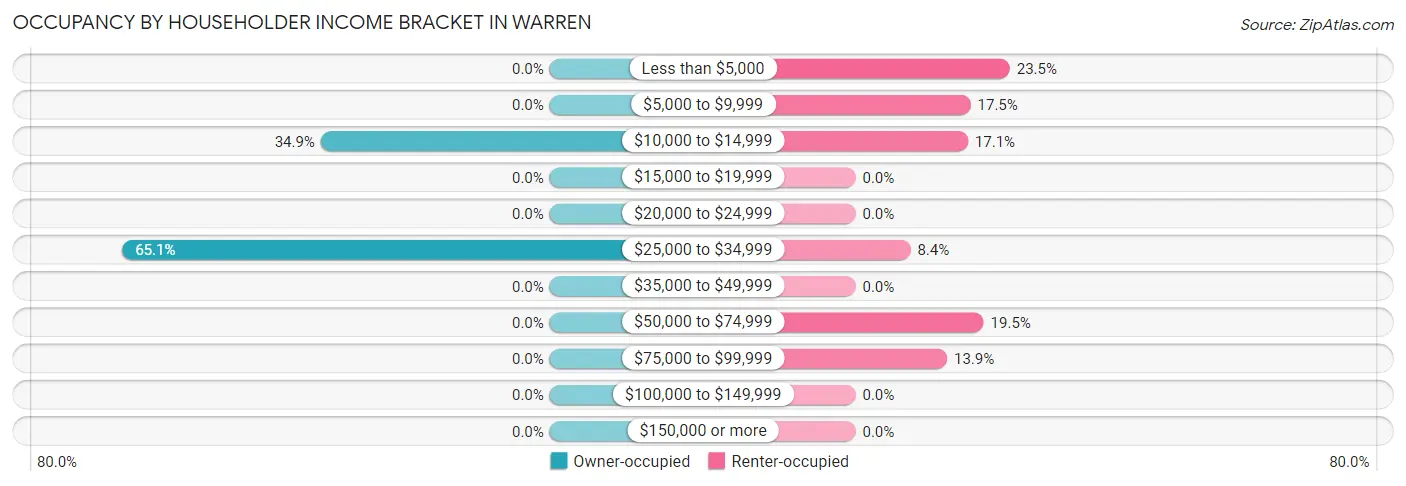
| Income Bracket | Owner-occupied | Renter-occupied |
| Less than $5,000 | 0 (0.0%) | 59 (23.5%) |
| $5,000 to $9,999 | 0 (0.0%) | 44 (17.5%) |
| $10,000 to $14,999 | 30 (34.9%) | 43 (17.1%) |
| $15,000 to $19,999 | 0 (0.0%) | 0 (0.0%) |
| $20,000 to $24,999 | 0 (0.0%) | 0 (0.0%) |
| $25,000 to $34,999 | 56 (65.1%) | 21 (8.4%) |
| $35,000 to $49,999 | 0 (0.0%) | 0 (0.0%) |
| $50,000 to $74,999 | 0 (0.0%) | 49 (19.5%) |
| $75,000 to $99,999 | 0 (0.0%) | 35 (13.9%) |
| $100,000 to $149,999 | 0 (0.0%) | 0 (0.0%) |
| $150,000 or more | 0 (0.0%) | 0 (0.0%) |
| Total | 86 (100.0%) | 251 (100.0%) |
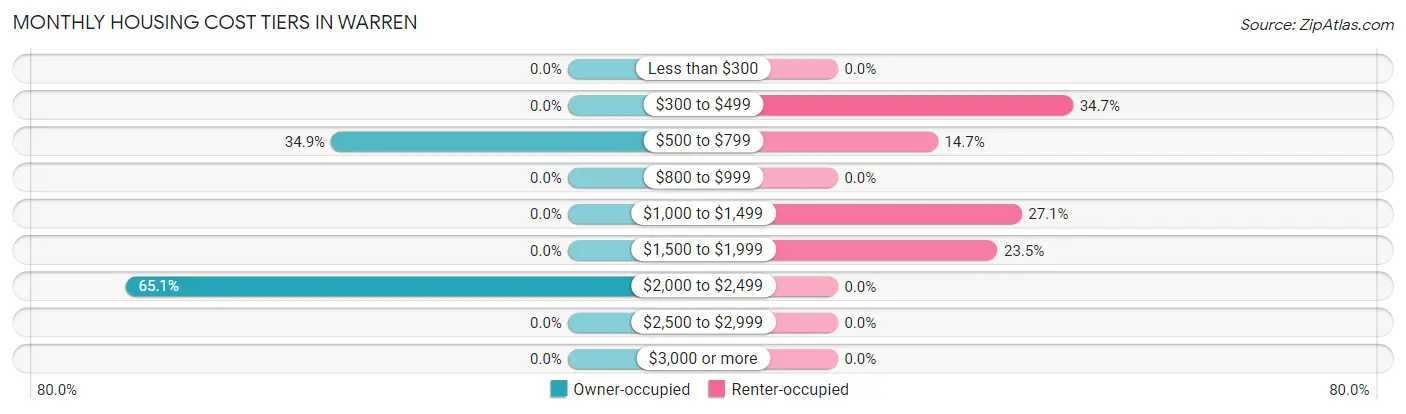
Monthly Housing Cost Tiers in Warren
| Monthly Cost | Owner-occupied | Renter-occupied |
| Less than $300 | 0 (0.0%) | 0 (0.0%) |
| $300 to $499 | 0 (0.0%) | 87 (34.7%) |
| $500 to $799 | 30 (34.9%) | 37 (14.7%) |
| $800 to $999 | 0 (0.0%) | 0 (0.0%) |
| $1,000 to $1,499 | 0 (0.0%) | 68 (27.1%) |
| $1,500 to $1,999 | 0 (0.0%) | 59 (23.5%) |
| $2,000 to $2,499 | 56 (65.1%) | 0 (0.0%) |
| $2,500 to $2,999 | 0 (0.0%) | 0 (0.0%) |
| $3,000 or more | 0 (0.0%) | 0 (0.0%) |
| Total | 86 (100.0%) | 251 (100.0%) |
Physical Housing Characteristics in Warren
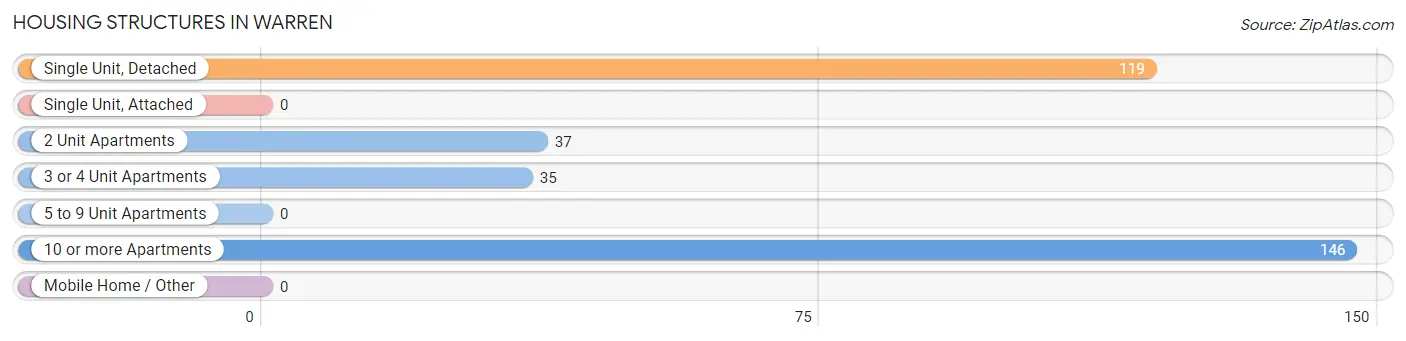
Housing Structures in Warren
| Structure Type | # Housing Units | % Housing Units |
| Single Unit, Detached | 119 | 35.3% |
| Single Unit, Attached | 0 | 0.0% |
| 2 Unit Apartments | 37 | 11.0% |
| 3 or 4 Unit Apartments | 35 | 10.4% |
| 5 to 9 Unit Apartments | 0 | 0.0% |
| 10 or more Apartments | 146 | 43.3% |
| Mobile Home / Other | 0 | 0.0% |
| Total | 337 | 100.0% |
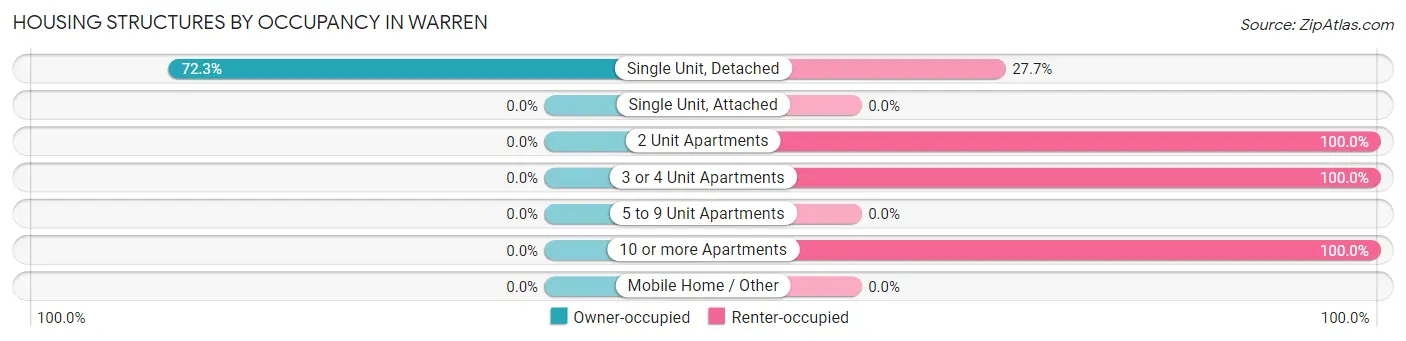
Housing Structures by Occupancy in Warren
| Structure Type | Owner-occupied | Renter-occupied |
| Single Unit, Detached | 86 (72.3%) | 33 (27.7%) |
| Single Unit, Attached | 0 (0.0%) | 0 (0.0%) |
| 2 Unit Apartments | 0 (0.0%) | 37 (100.0%) |
| 3 or 4 Unit Apartments | 0 (0.0%) | 35 (100.0%) |
| 5 to 9 Unit Apartments | 0 (0.0%) | 0 (0.0%) |
| 10 or more Apartments | 0 (0.0%) | 146 (100.0%) |
| Mobile Home / Other | 0 (0.0%) | 0 (0.0%) |
| Total | 86 (25.5%) | 251 (74.5%) |
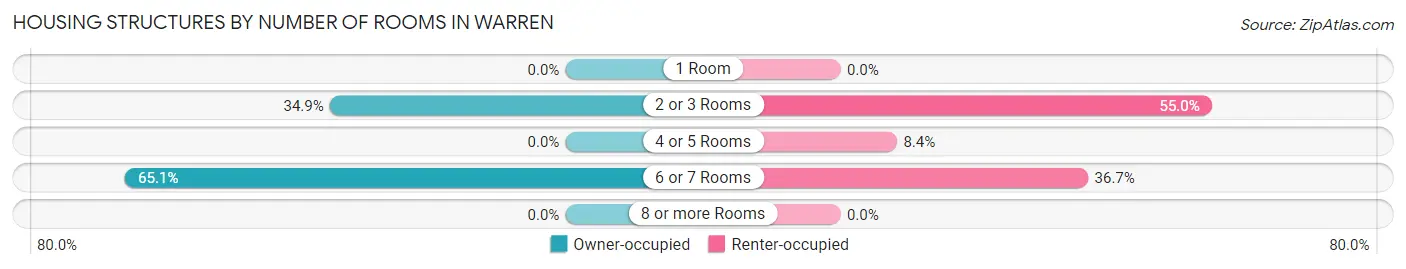
Housing Structures by Number of Rooms in Warren
| Number of Rooms | Owner-occupied | Renter-occupied |
| 1 Room | 0 (0.0%) | 0 (0.0%) |
| 2 or 3 Rooms | 30 (34.9%) | 138 (55.0%) |
| 4 or 5 Rooms | 0 (0.0%) | 21 (8.4%) |
| 6 or 7 Rooms | 56 (65.1%) | 92 (36.6%) |
| 8 or more Rooms | 0 (0.0%) | 0 (0.0%) |
| Total | 86 (100.0%) | 251 (100.0%) |
Housing Structure by Heating Type in Warren
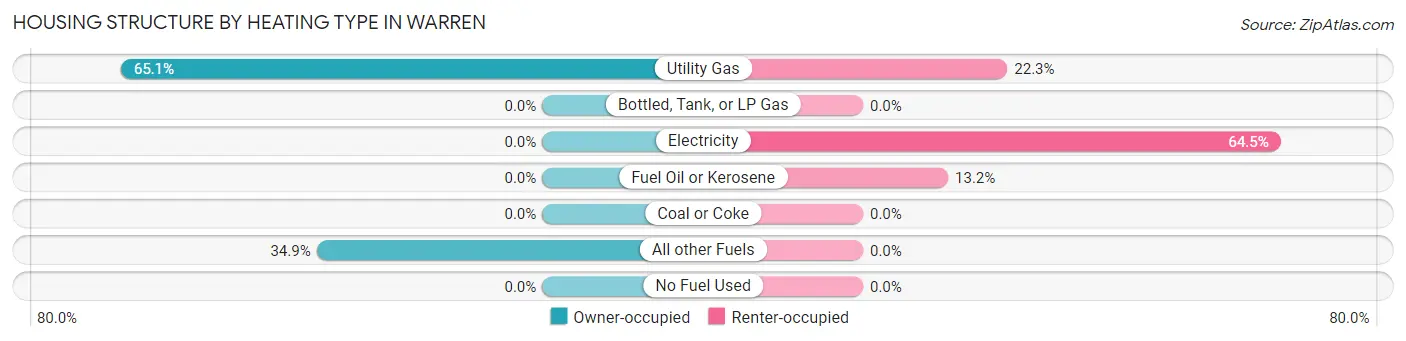
| Heating Type | Owner-occupied | Renter-occupied |
| Utility Gas | 56 (65.1%) | 56 (22.3%) |
| Bottled, Tank, or LP Gas | 0 (0.0%) | 0 (0.0%) |
| Electricity | 0 (0.0%) | 162 (64.5%) |
| Fuel Oil or Kerosene | 0 (0.0%) | 33 (13.2%) |
| Coal or Coke | 0 (0.0%) | 0 (0.0%) |
| All other Fuels | 30 (34.9%) | 0 (0.0%) |
| No Fuel Used | 0 (0.0%) | 0 (0.0%) |
| Total | 86 (100.0%) | 251 (100.0%) |
Household Vehicle Usage in Warren
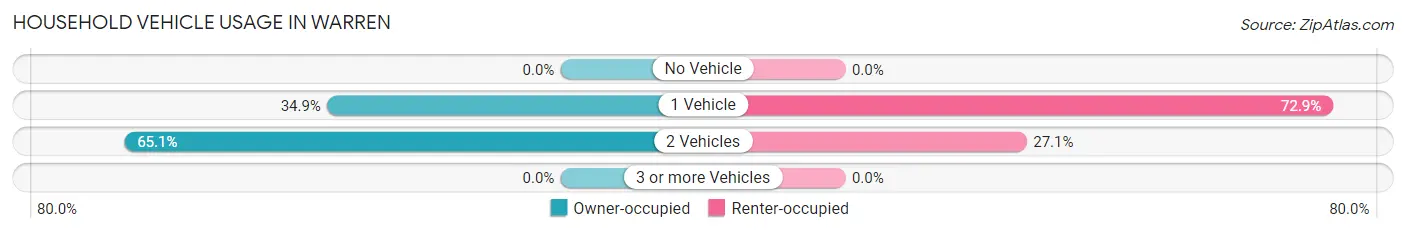
| Vehicles per Household | Owner-occupied | Renter-occupied |
| No Vehicle | 0 (0.0%) | 0 (0.0%) |
| 1 Vehicle | 30 (34.9%) | 183 (72.9%) |
| 2 Vehicles | 56 (65.1%) | 68 (27.1%) |
| 3 or more Vehicles | 0 (0.0%) | 0 (0.0%) |
| Total | 86 (100.0%) | 251 (100.0%) |
Real Estate & Mortgages in Warren
Real Estate and Mortgage Overview in Warren
| Characteristic | Without Mortgage | With Mortgage |
| Housing Units | 30 | 56 |
| Median Property Value | - | - |
| Median Household Income | - | - |
| Monthly Housing Costs | - | - |
| Real Estate Taxes | - | - |
Property Value by Mortgage Status in Warren
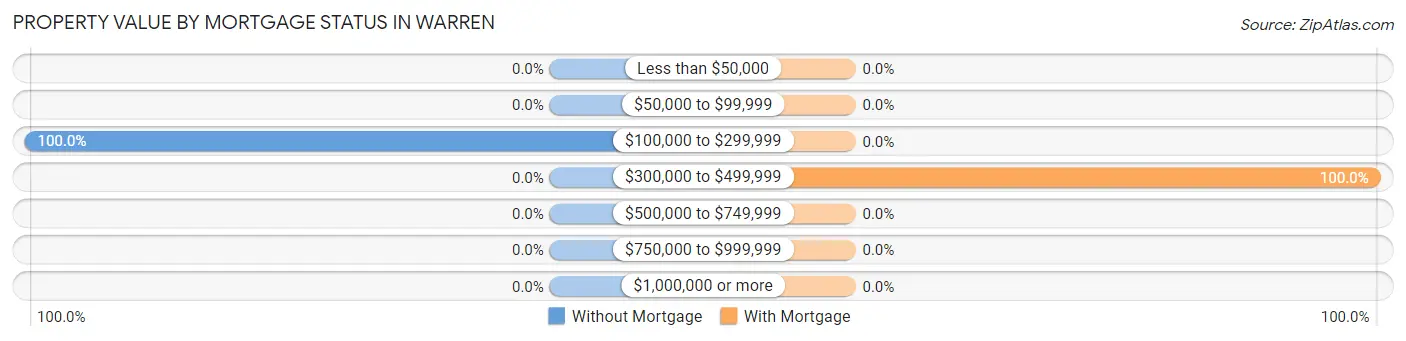
| Property Value | Without Mortgage | With Mortgage |
| Less than $50,000 | 0 (0.0%) | 0 (0.0%) |
| $50,000 to $99,999 | 0 (0.0%) | 0 (0.0%) |
| $100,000 to $299,999 | 30 (100.0%) | 0 (0.0%) |
| $300,000 to $499,999 | 0 (0.0%) | 56 (100.0%) |
| $500,000 to $749,999 | 0 (0.0%) | 0 (0.0%) |
| $750,000 to $999,999 | 0 (0.0%) | 0 (0.0%) |
| $1,000,000 or more | 0 (0.0%) | 0 (0.0%) |
| Total | 30 (100.0%) | 56 (100.0%) |
Household Income by Mortgage Status in Warren
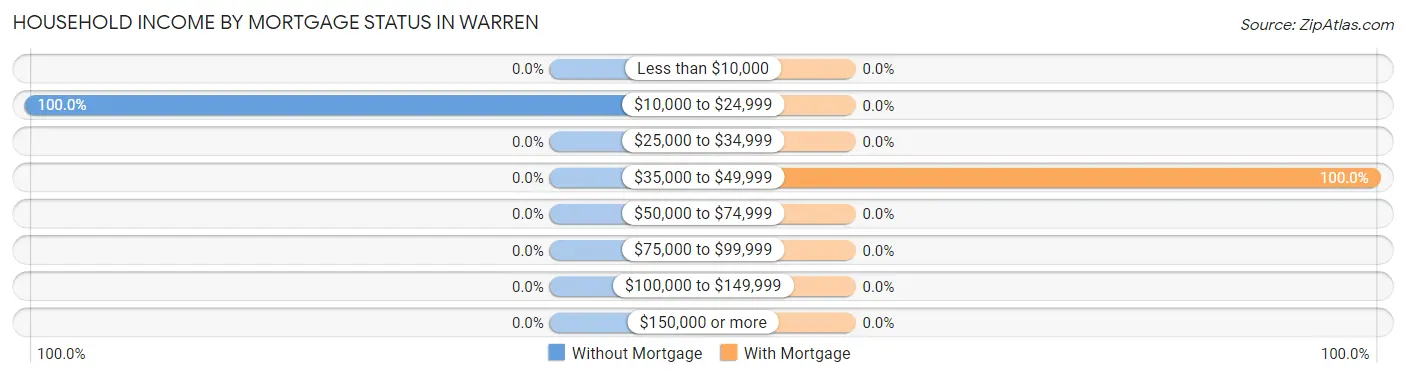
| Household Income | Without Mortgage | With Mortgage |
| Less than $10,000 | 0 (0.0%) | 0 (0.0%) |
| $10,000 to $24,999 | 30 (100.0%) | 0 (0.0%) |
| $25,000 to $34,999 | 0 (0.0%) | 0 (0.0%) |
| $35,000 to $49,999 | 0 (0.0%) | 56 (100.0%) |
| $50,000 to $74,999 | 0 (0.0%) | 0 (0.0%) |
| $75,000 to $99,999 | 0 (0.0%) | 0 (0.0%) |
| $100,000 to $149,999 | 0 (0.0%) | 0 (0.0%) |
| $150,000 or more | 0 (0.0%) | 0 (0.0%) |
| Total | 30 (100.0%) | 56 (100.0%) |
Property Value to Household Income Ratio in Warren
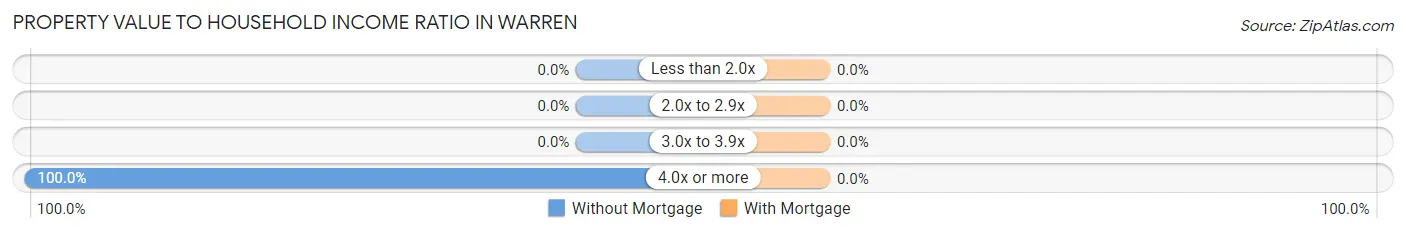
| Value-to-Income Ratio | Without Mortgage | With Mortgage |
| Less than 2.0x | 0 (0.0%) | 0 (0.0%) |
| 2.0x to 2.9x | 0 (0.0%) | 0 (0.0%) |
| 3.0x to 3.9x | 0 (0.0%) | 0 (0.0%) |
| 4.0x or more | 30 (100.0%) | 0 (0.0%) |
| Total | 30 (100.0%) | 56 (100.0%) |
Real Estate Taxes by Mortgage Status in Warren
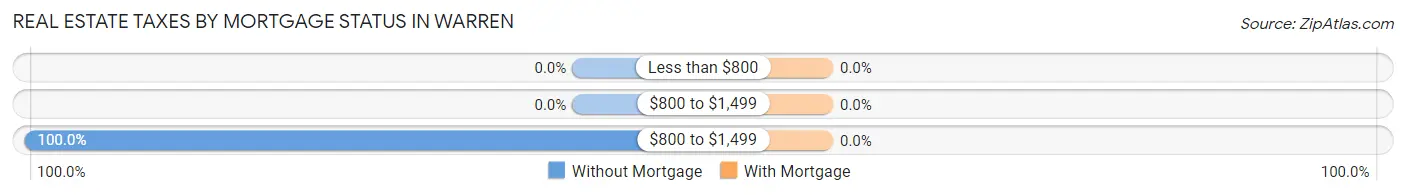
| Property Taxes | Without Mortgage | With Mortgage |
| Less than $800 | 0 (0.0%) | 0 (0.0%) |
| $800 to $1,499 | 0 (0.0%) | 0 (0.0%) |
| $800 to $1,499 | 30 (100.0%) | 0 (0.0%) |
| Total | 30 (100.0%) | 56 (100.0%) |
Health & Disability in Warren
Health Insurance Coverage by Age in Warren
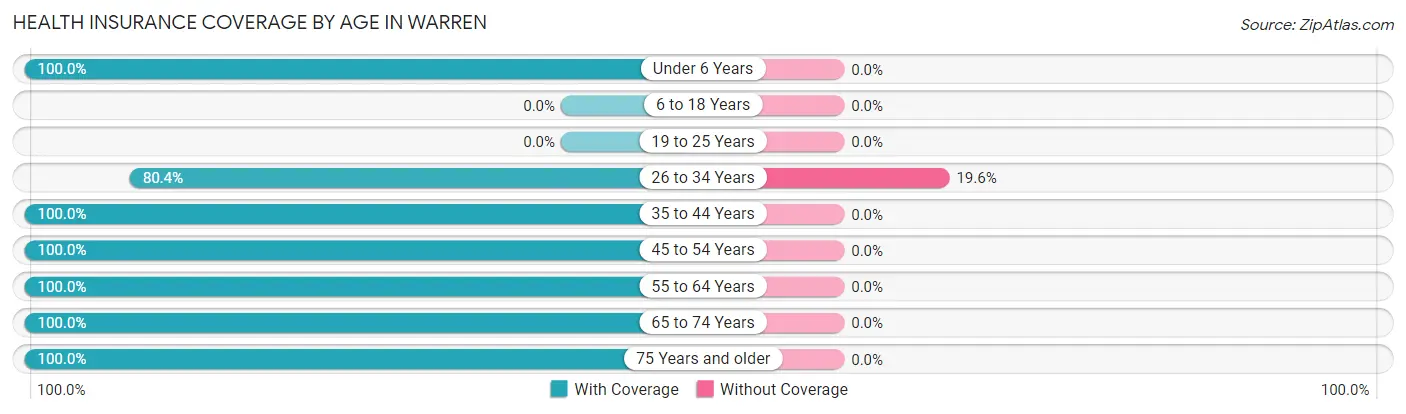
| Age Bracket | With Coverage | Without Coverage |
| Under 6 Years | 97 (100.0%) | 0 (0.0%) |
| 6 to 18 Years | 0 (0.0%) | 0 (0.0%) |
| 19 to 25 Years | 0 (0.0%) | 0 (0.0%) |
| 26 to 34 Years | 168 (80.4%) | 41 (19.6%) |
| 35 to 44 Years | 123 (100.0%) | 0 (0.0%) |
| 45 to 54 Years | 30 (100.0%) | 0 (0.0%) |
| 55 to 64 Years | 44 (100.0%) | 0 (0.0%) |
| 65 to 74 Years | 43 (100.0%) | 0 (0.0%) |
| 75 Years and older | 21 (100.0%) | 0 (0.0%) |
| Total | 526 (92.8%) | 41 (7.2%) |
Health Insurance Coverage by Citizenship Status in Warren
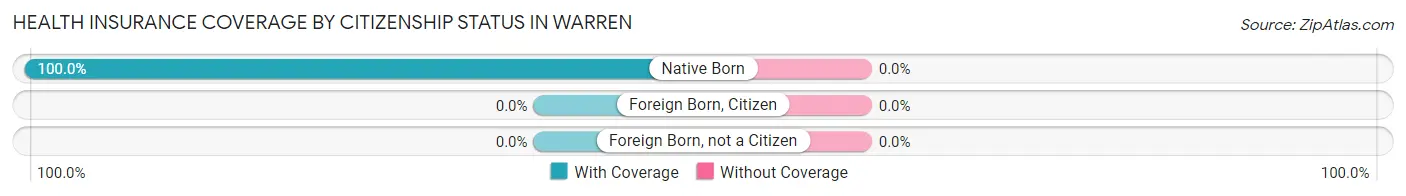
| Citizenship Status | With Coverage | Without Coverage |
| Native Born | 97 (100.0%) | 0 (0.0%) |
| Foreign Born, Citizen | 0 (0.0%) | 0 (0.0%) |
| Foreign Born, not a Citizen | 0 (0.0%) | 0 (0.0%) |
Health Insurance Coverage by Household Income in Warren
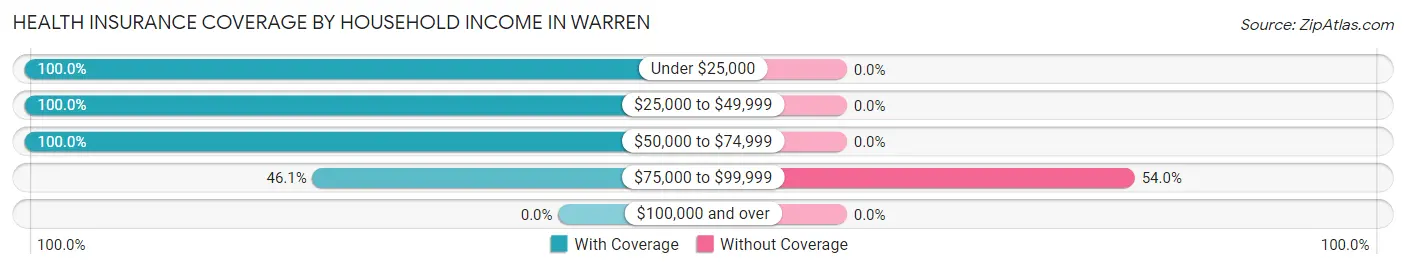
| Household Income | With Coverage | Without Coverage |
| Under $25,000 | 176 (100.0%) | 0 (0.0%) |
| $25,000 to $49,999 | 203 (100.0%) | 0 (0.0%) |
| $50,000 to $74,999 | 112 (100.0%) | 0 (0.0%) |
| $75,000 to $99,999 | 35 (46.1%) | 41 (53.9%) |
| $100,000 and over | 0 (0.0%) | 0 (0.0%) |
Public vs Private Health Insurance Coverage by Age in Warren
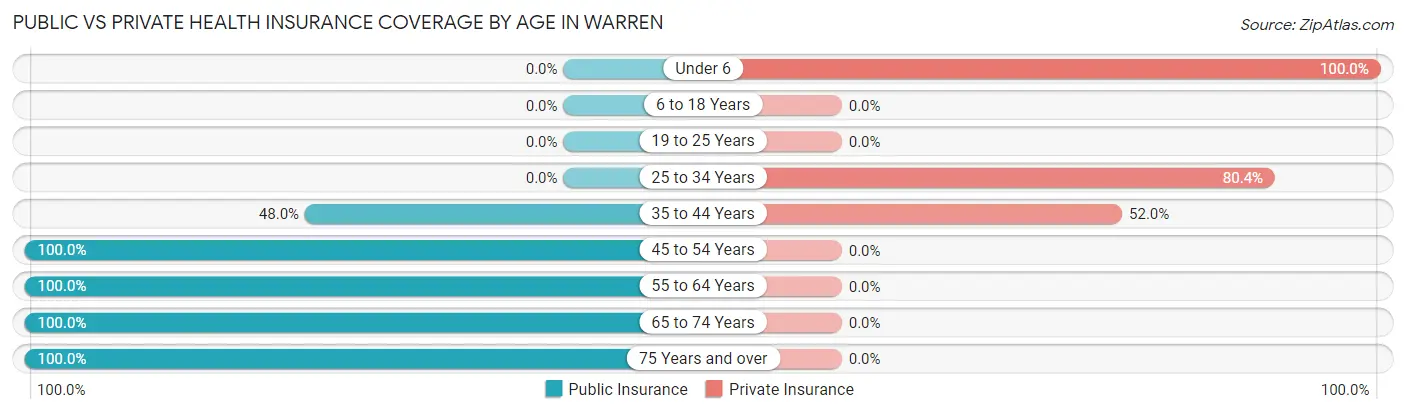
| Age Bracket | Public Insurance | Private Insurance |
| Under 6 | 0 (0.0%) | 97 (100.0%) |
| 6 to 18 Years | 0 (0.0%) | 0 (0.0%) |
| 19 to 25 Years | 0 (0.0%) | 0 (0.0%) |
| 25 to 34 Years | 0 (0.0%) | 168 (80.4%) |
| 35 to 44 Years | 59 (48.0%) | 64 (52.0%) |
| 45 to 54 Years | 30 (100.0%) | 0 (0.0%) |
| 55 to 64 Years | 44 (100.0%) | 0 (0.0%) |
| 65 to 74 Years | 43 (100.0%) | 0 (0.0%) |
| 75 Years and over | 21 (100.0%) | 0 (0.0%) |
| Total | 197 (34.7%) | 329 (58.0%) |
Disability Status by Sex by Age in Warren
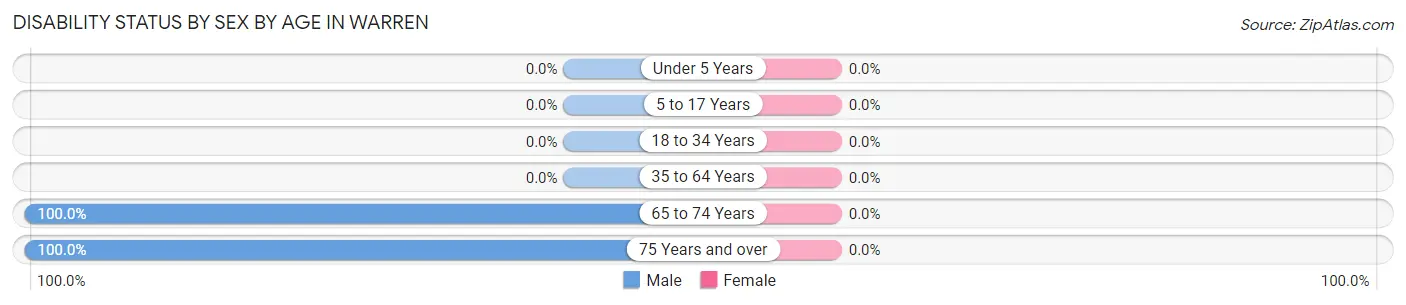
| Age Bracket | Male | Female |
| Under 5 Years | 0 (0.0%) | 0 (0.0%) |
| 5 to 17 Years | 0 (0.0%) | 0 (0.0%) |
| 18 to 34 Years | 0 (0.0%) | 0 (0.0%) |
| 35 to 64 Years | 0 (0.0%) | 0 (0.0%) |
| 65 to 74 Years | 43 (100.0%) | 0 (0.0%) |
| 75 Years and over | 21 (100.0%) | 0 (0.0%) |
Disability Class by Sex by Age in Warren
Disability Class: Hearing Difficulty
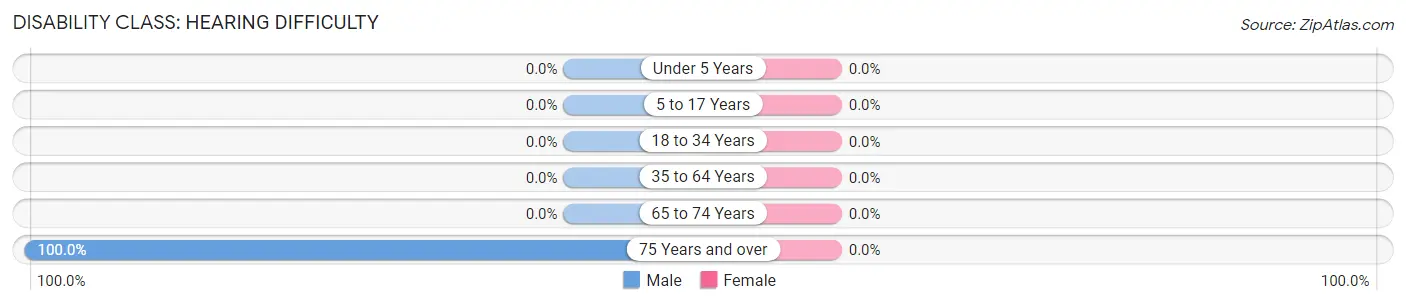
| Age Bracket | Male | Female |
| Under 5 Years | 0 (0.0%) | 0 (0.0%) |
| 5 to 17 Years | 0 (0.0%) | 0 (0.0%) |
| 18 to 34 Years | 0 (0.0%) | 0 (0.0%) |
| 35 to 64 Years | 0 (0.0%) | 0 (0.0%) |
| 65 to 74 Years | 0 (0.0%) | 0 (0.0%) |
| 75 Years and over | 21 (100.0%) | 0 (0.0%) |
Disability Class: Vision Difficulty
| Age Bracket | Male | Female |
| Under 5 Years | 0 (0.0%) | 0 (0.0%) |
| 5 to 17 Years | 0 (0.0%) | 0 (0.0%) |
| 18 to 34 Years | 0 (0.0%) | 0 (0.0%) |
| 35 to 64 Years | 0 (0.0%) | 0 (0.0%) |
| 65 to 74 Years | 0 (0.0%) | 0 (0.0%) |
| 75 Years and over | 0 (0.0%) | 0 (0.0%) |
Disability Class: Cognitive Difficulty
| Age Bracket | Male | Female |
| 5 to 17 Years | 0 (0.0%) | 0 (0.0%) |
| 18 to 34 Years | 0 (0.0%) | 0 (0.0%) |
| 35 to 64 Years | 0 (0.0%) | 0 (0.0%) |
| 65 to 74 Years | 43 (100.0%) | 0 (0.0%) |
| 75 Years and over | 0 (0.0%) | 0 (0.0%) |
Disability Class: Ambulatory Difficulty
| Age Bracket | Male | Female |
| 5 to 17 Years | 0 (0.0%) | 0 (0.0%) |
| 18 to 34 Years | 0 (0.0%) | 0 (0.0%) |
| 35 to 64 Years | 0 (0.0%) | 0 (0.0%) |
| 65 to 74 Years | 0 (0.0%) | 0 (0.0%) |
| 75 Years and over | 0 (0.0%) | 0 (0.0%) |
Disability Class: Self-Care Difficulty
| Age Bracket | Male | Female |
| 5 to 17 Years | 0 (0.0%) | 0 (0.0%) |
| 18 to 34 Years | 0 (0.0%) | 0 (0.0%) |
| 35 to 64 Years | 0 (0.0%) | 0 (0.0%) |
| 65 to 74 Years | 0 (0.0%) | 0 (0.0%) |
| 75 Years and over | 0 (0.0%) | 0 (0.0%) |
Technology Access in Warren
Computing Device Access in Warren
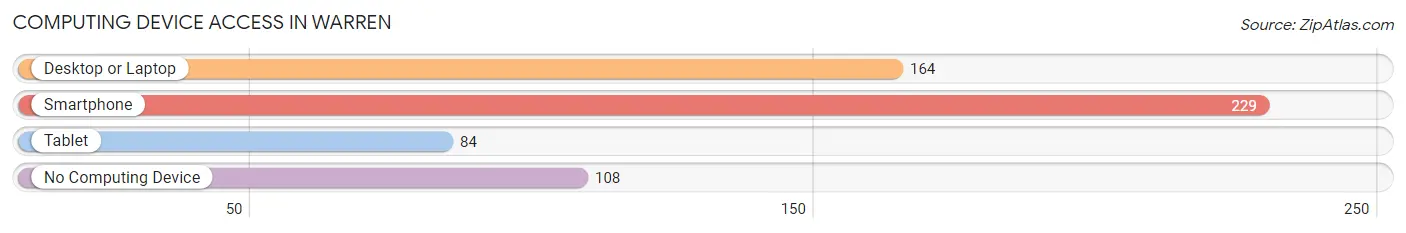
| Device Type | # Households | % Households |
| Desktop or Laptop | 164 | 48.7% |
| Smartphone | 229 | 67.9% |
| Tablet | 84 | 24.9% |
| No Computing Device | 108 | 32.1% |
| Total | 337 | 100.0% |
Internet Access in Warren
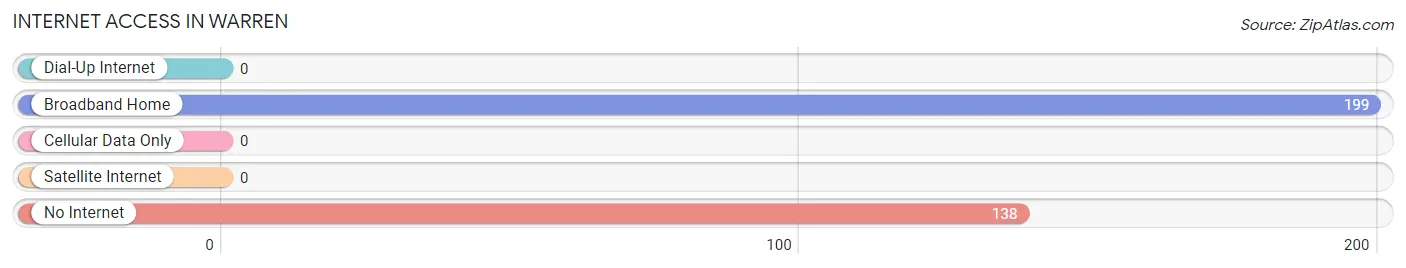
| Internet Type | # Households | % Households |
| Dial-Up Internet | 0 | 0.0% |
| Broadband Home | 199 | 59.1% |
| Cellular Data Only | 0 | 0.0% |
| Satellite Internet | 0 | 0.0% |
| No Internet | 138 | 40.9% |
| Total | 337 | 100.0% |
Warren Summary
Warren, Massachusetts is a small town located in the southeastern part of the state, in the county of Bristol. It is bordered by the towns of Swansea, Rehoboth, and Dighton. The town has a population of approximately 8,000 people, and is located about 40 miles south of Boston.
History
The area that is now Warren was originally inhabited by the Wampanoag tribe, who called the area “Sowams”. The first European settlers arrived in the area in 1653, and the town was officially incorporated in 1747. The town was named after General Joseph Warren, a hero of the American Revolution.
In the 19th century, Warren was a thriving agricultural community, with many farms and orchards. The town was also home to several mills, including a grist mill, a saw mill, and a paper mill. The town also had a thriving shipbuilding industry, and several ships were built in Warren during this time.
Geography
Warren is located in southeastern Massachusetts, in the county of Bristol. It is bordered by the towns of Swansea, Rehoboth, and Dighton. The town is located on the eastern shore of the Taunton River, and is about 40 miles south of Boston.
The town has a total area of 16.3 square miles, of which 15.9 square miles is land and 0.4 square miles is water. The town is mostly flat, with some rolling hills in the northern part of town. The highest point in Warren is located at the intersection of Main Street and Warren Avenue, at an elevation of about 200 feet.
Economy
The economy of Warren is largely based on agriculture and tourism. The town is home to several farms, which produce a variety of fruits and vegetables. The town also has several wineries, which attract tourists from all over the region.
In addition to agriculture and tourism, Warren is also home to several small businesses, including restaurants, retail stores, and professional services. The town is also home to several manufacturing companies, which produce a variety of products, including furniture, clothing, and electronics.
Demographics
As of the 2010 census, Warren had a population of 8,000 people. The racial makeup of the town was 94.3% White, 1.7% African American, 0.3% Native American, 1.2% Asian, 0.1% Pacific Islander, 0.7% from other races, and 1.9% from two or more races. Hispanic or Latino of any race were 2.2% of the population.
The median household income in Warren was $60,000, and the median family income was $68,000. The per capita income for the town was $25,000. About 8.5% of families and 10.2% of the population were below the poverty line, including 14.2% of those under age 18 and 5.2% of those age 65 or over.
Common Questions
What is the Total Population of Warren?
Total Population of Warren is 567.
What is the Total Male Population of Warren?
Total Male Population of Warren is 283.
What is the Total Female Population of Warren?
Total Female Population of Warren is 284.
What is the Ratio of Males per 100 Females in Warren?
There are 99.65 Males per 100 Females in Warren.
What is the Ratio of Females per 100 Males in Warren?
There are 100.35 Females per 100 Males in Warren.
What is the Median Population Age in Warren?
Median Population Age in Warren is 29.9 Years.
What is the Average Family Size in Warren
Average Family Size in Warren is 3.1 People.
What is the Average Household Size in Warren
Average Household Size in Warren is 1.7 People.
What is Per Capita Income in Warren?
Per Capita income in Warren is $16,772.
What is Inequality or Gini Index in Warren?
Inequality or Gini Index in Warren is 0.54.
How Large is the Labor Force in Warren?
There are 331 People in the Labor Forcein in Warren.
What is the Percentage of People in the Labor Force in Warren?
70.4% of People are in the Labor Force in Warren.
What is the Unemployment Rate in Warren?
Unemployment Rate in Warren is 30.2%.