Cities with the Highest Percentage of Households with Income Below $10,000 in Ohio
RELATED REPORTS & OPTIONS
Household Income | $0-10k
Ohio
Compare Cities
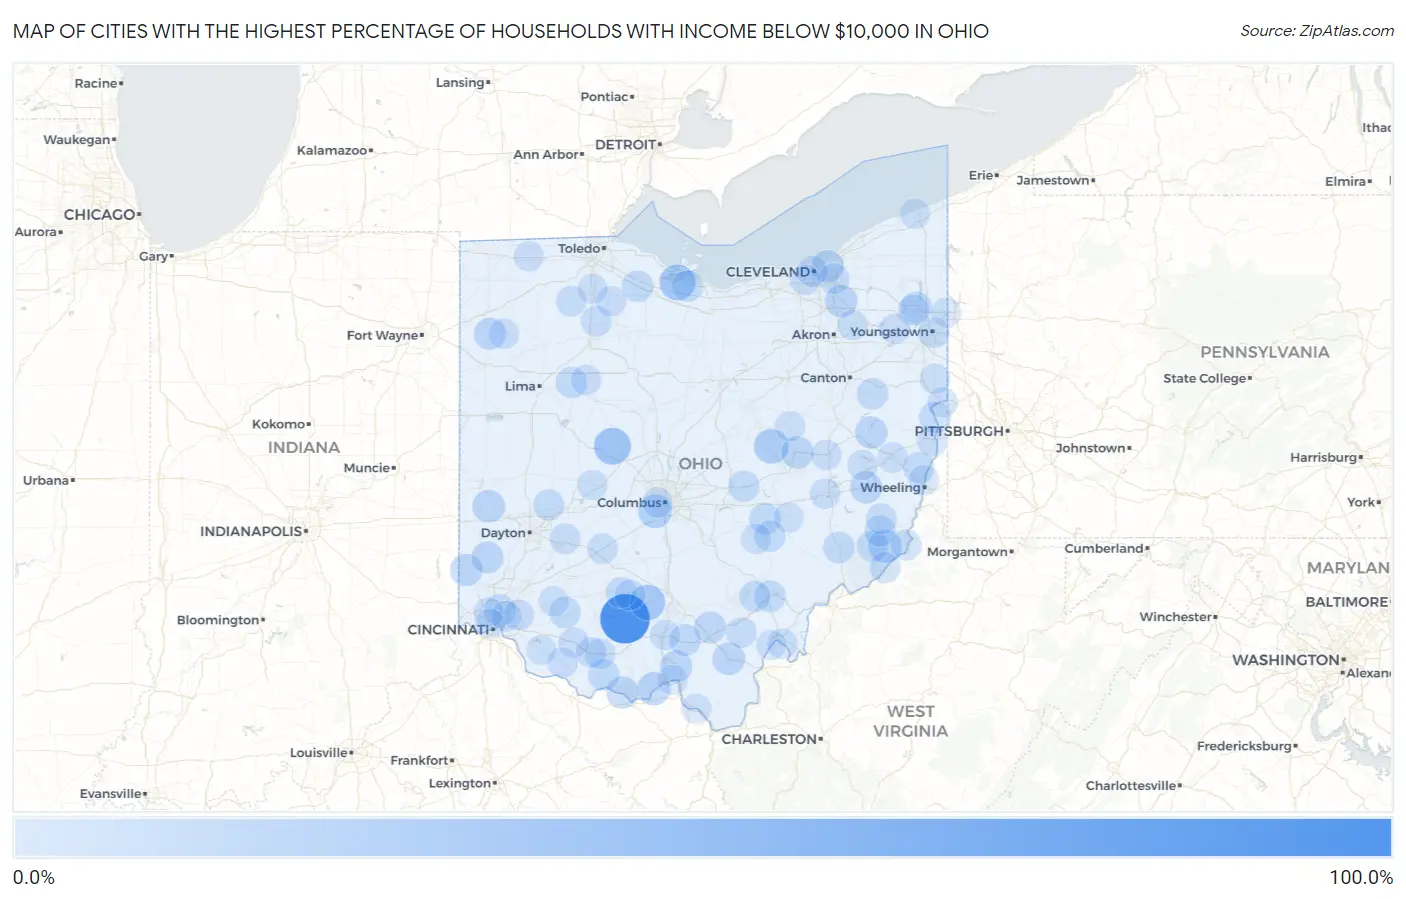
Map of Cities with the Highest Percentage of Households with Income Below $10,000 in Ohio
0.0%
100.0%
Cities with the Highest Percentage of Households with Income Below $10,000 in Ohio
| City | Households with Income < $10k | vs State | vs National | |
| 1. | Cynthiana | 100.0% | 5.2%(+94.8)#1 | 4.9%(+95.1)#25 |
| 2. | East Alliance | 42.0% | 5.2%(+36.8)#2 | 4.9%(+37.1)#265 |
| 3. | Raymond | 40.8% | 5.2%(+35.6)#3 | 4.9%(+35.9)#283 |
| 4. | Whites Landing | 35.8% | 5.2%(+30.6)#4 | 4.9%(+30.9)#379 |
| 5. | Bourneville | 34.5% | 5.2%(+29.3)#5 | 4.9%(+29.6)#417 |
| 6. | Nellie | 30.2% | 5.2%(+25.0)#6 | 4.9%(+25.3)#545 |
| 7. | Urbancrest | 26.4% | 5.2%(+21.2)#7 | 4.9%(+21.5)#714 |
| 8. | Madison Place | 25.2% | 5.2%(+20.0)#8 | 4.9%(+20.3)#776 |
| 9. | Friendship | 24.5% | 5.2%(+19.3)#9 | 4.9%(+19.6)#828 |
| 10. | Antioch | 24.1% | 5.2%(+18.9)#10 | 4.9%(+19.2)#859 |
| 11. | Bidwell | 22.5% | 5.2%(+17.3)#11 | 4.9%(+17.6)#970 |
| 12. | Ithaca | 21.8% | 5.2%(+16.6)#12 | 4.9%(+16.9)#1,030 |
| 13. | Centerville Thurman | 21.7% | 5.2%(+16.5)#13 | 4.9%(+16.8)#1,040 |
| 14. | Twinsburg Heights | 20.7% | 5.2%(+15.5)#14 | 4.9%(+15.8)#1,132 |
| 15. | East Cleveland | 20.2% | 5.2%(+15.0)#15 | 4.9%(+15.3)#1,168 |
| 16. | Oxford | 20.0% | 5.2%(+14.8)#16 | 4.9%(+15.1)#1,188 |
| 17. | Canal Lewisville | 19.7% | 5.2%(+14.5)#17 | 4.9%(+14.8)#1,255 |
| 18. | Bowerston | 19.6% | 5.2%(+14.4)#18 | 4.9%(+14.7)#1,270 |
| 19. | Clarktown | 19.2% | 5.2%(+14.0)#19 | 4.9%(+14.3)#1,316 |
| 20. | Fairview | 19.2% | 5.2%(+14.0)#20 | 4.9%(+14.3)#1,324 |
| 21. | Broughton | 19.0% | 5.2%(+13.8)#21 | 4.9%(+14.1)#1,351 |
| 22. | Rome Stout | 19.0% | 5.2%(+13.8)#22 | 4.9%(+14.1)#1,352 |
| 23. | West Elkton | 18.9% | 5.2%(+13.7)#23 | 4.9%(+14.0)#1,366 |
| 24. | Coalton | 18.7% | 5.2%(+13.5)#24 | 4.9%(+13.8)#1,397 |
| 25. | Beaver | 18.1% | 5.2%(+12.9)#25 | 4.9%(+13.2)#1,478 |
| 26. | Morgandale | 17.8% | 5.2%(+12.6)#26 | 4.9%(+12.9)#1,521 |
| 27. | Lockland | 17.3% | 5.2%(+12.1)#27 | 4.9%(+12.4)#1,586 |
| 28. | Athens | 17.2% | 5.2%(+12.0)#28 | 4.9%(+12.3)#1,604 |
| 29. | East Fultonham | 17.2% | 5.2%(+12.0)#29 | 4.9%(+12.3)#1,616 |
| 30. | St Martin | 17.2% | 5.2%(+12.0)#30 | 4.9%(+12.3)#1,617 |
| 31. | Malvern | 17.0% | 5.2%(+11.8)#31 | 4.9%(+12.1)#1,639 |
| 32. | Stratton | 16.8% | 5.2%(+11.6)#32 | 4.9%(+11.9)#1,705 |
| 33. | Dexter City | 16.7% | 5.2%(+11.5)#33 | 4.9%(+11.8)#1,725 |
| 34. | Hessville | 16.7% | 5.2%(+11.5)#34 | 4.9%(+11.8)#1,738 |
| 35. | West Union | 16.2% | 5.2%(+11.0)#35 | 4.9%(+11.3)#1,817 |
| 36. | Marne | 16.2% | 5.2%(+11.0)#36 | 4.9%(+11.3)#1,827 |
| 37. | Ada | 16.1% | 5.2%(+10.9)#37 | 4.9%(+11.2)#1,836 |
| 38. | Dillonvale | 15.8% | 5.2%(+10.6)#38 | 4.9%(+10.9)#1,905 |
| 39. | Rose Farm | 15.6% | 5.2%(+10.4)#39 | 4.9%(+10.7)#1,961 |
| 40. | Graysville | 15.6% | 5.2%(+10.4)#40 | 4.9%(+10.7)#1,963 |
| 41. | Castalia | 15.5% | 5.2%(+10.3)#41 | 4.9%(+10.6)#1,977 |
| 42. | New Carlisle | 15.2% | 5.2%(+10.00)#42 | 4.9%(+10.3)#2,042 |
| 43. | Woodsfield | 15.2% | 5.2%(+10.00)#43 | 4.9%(+10.3)#2,043 |
| 44. | New Marshfield | 14.9% | 5.2%(+9.70)#44 | 4.9%(+10.00)#2,136 |
| 45. | Greenfield | 14.8% | 5.2%(+9.60)#45 | 4.9%(+9.90)#2,143 |
| 46. | Matamoras | 14.3% | 5.2%(+9.10)#46 | 4.9%(+9.40)#2,270 |
| 47. | Jerusalem | 14.3% | 5.2%(+9.10)#47 | 4.9%(+9.40)#2,287 |
| 48. | Highland Hills | 14.2% | 5.2%(+9.00)#48 | 4.9%(+9.30)#2,313 |
| 49. | Warren | 13.9% | 5.2%(+8.70)#49 | 4.9%(+9.00)#2,382 |
| 50. | Youngstown | 13.8% | 5.2%(+8.60)#50 | 4.9%(+8.90)#2,409 |
| 51. | Seaman | 13.8% | 5.2%(+8.60)#51 | 4.9%(+8.90)#2,431 |
| 52. | Wilberforce | 13.7% | 5.2%(+8.50)#52 | 4.9%(+8.80)#2,452 |
| 53. | Wilkesville | 13.6% | 5.2%(+8.40)#53 | 4.9%(+8.70)#2,493 |
| 54. | Winchester | 13.4% | 5.2%(+8.20)#54 | 4.9%(+8.50)#2,544 |
| 55. | Hannibal | 13.4% | 5.2%(+8.20)#55 | 4.9%(+8.50)#2,563 |
| 56. | Cleveland | 13.2% | 5.2%(+8.00)#56 | 4.9%(+8.30)#2,623 |
| 57. | Petersburg | 13.2% | 5.2%(+8.00)#57 | 4.9%(+8.30)#2,644 |
| 58. | South Salem | 13.2% | 5.2%(+8.00)#58 | 4.9%(+8.30)#2,645 |
| 59. | Bairdstown | 13.2% | 5.2%(+8.00)#59 | 4.9%(+8.30)#2,650 |
| 60. | Jeffersonville | 13.1% | 5.2%(+7.90)#60 | 4.9%(+8.20)#2,673 |
| 61. | Milton Center | 13.1% | 5.2%(+7.90)#61 | 4.9%(+8.20)#2,688 |
| 62. | Oakwood Village Cuyahoga County | 13.0% | 5.2%(+7.80)#62 | 4.9%(+8.10)#2,696 |
| 63. | Piketon | 12.8% | 5.2%(+7.60)#63 | 4.9%(+7.90)#2,784 |
| 64. | South Mount Vernon | 12.8% | 5.2%(+7.60)#64 | 4.9%(+7.90)#2,793 |
| 65. | Camp Dennison | 12.8% | 5.2%(+7.60)#65 | 4.9%(+7.90)#2,801 |
| 66. | Steubenville | 12.6% | 5.2%(+7.40)#66 | 4.9%(+7.70)#2,846 |
| 67. | Kent | 12.5% | 5.2%(+7.30)#67 | 4.9%(+7.60)#2,888 |
| 68. | New Lexington | 12.4% | 5.2%(+7.20)#68 | 4.9%(+7.50)#2,961 |
| 69. | Sardinia | 12.4% | 5.2%(+7.20)#69 | 4.9%(+7.50)#2,974 |
| 70. | Wayne | 12.4% | 5.2%(+7.20)#70 | 4.9%(+7.50)#2,979 |
| 71. | Valleyview | 12.4% | 5.2%(+7.20)#71 | 4.9%(+7.50)#2,986 |
| 72. | Silverton | 12.3% | 5.2%(+7.10)#72 | 4.9%(+7.40)#3,008 |
| 73. | Newcomerstown | 12.3% | 5.2%(+7.10)#73 | 4.9%(+7.40)#3,011 |
| 74. | Cadiz | 12.3% | 5.2%(+7.10)#74 | 4.9%(+7.40)#3,012 |
| 75. | Martins Ferry | 12.2% | 5.2%(+7.00)#75 | 4.9%(+7.30)#3,049 |
| 76. | Cambridge | 12.1% | 5.2%(+6.90)#76 | 4.9%(+7.20)#3,098 |
| 77. | Craig Beach | 12.1% | 5.2%(+6.90)#77 | 4.9%(+7.20)#3,115 |
| 78. | Mutual | 12.1% | 5.2%(+6.90)#78 | 4.9%(+7.20)#3,140 |
| 79. | Melrose | 12.0% | 5.2%(+6.80)#79 | 4.9%(+7.10)#3,180 |
| 80. | Freeport | 11.9% | 5.2%(+6.70)#80 | 4.9%(+7.00)#3,237 |
| 81. | Tedrow | 11.9% | 5.2%(+6.70)#81 | 4.9%(+7.00)#3,246 |
| 82. | Dola | 11.9% | 5.2%(+6.70)#82 | 4.9%(+7.00)#3,253 |
| 83. | Linndale | 11.8% | 5.2%(+6.60)#83 | 4.9%(+6.90)#3,301 |
| 84. | Georgetown | 11.7% | 5.2%(+6.50)#84 | 4.9%(+6.80)#3,321 |
| 85. | North College Hill | 11.6% | 5.2%(+6.40)#85 | 4.9%(+6.70)#3,367 |
| 86. | Syracuse | 11.6% | 5.2%(+6.40)#86 | 4.9%(+6.70)#3,402 |
| 87. | East Liverpool | 11.5% | 5.2%(+6.30)#87 | 4.9%(+6.60)#3,426 |
| 88. | Miller | 11.5% | 5.2%(+6.30)#88 | 4.9%(+6.60)#3,454 |
| 89. | Rogers | 11.4% | 5.2%(+6.20)#89 | 4.9%(+6.50)#3,524 |
| 90. | Bethel | 11.3% | 5.2%(+6.10)#90 | 4.9%(+6.40)#3,557 |
| 91. | Lake Buckhorn | 11.3% | 5.2%(+6.10)#91 | 4.9%(+6.40)#3,581 |
| 92. | Portsmouth | 11.1% | 5.2%(+5.90)#92 | 4.9%(+6.20)#3,637 |
| 93. | Hanging Rock | 11.1% | 5.2%(+5.90)#93 | 4.9%(+6.20)#3,679 |
| 94. | Blanchester | 11.0% | 5.2%(+5.80)#94 | 4.9%(+6.10)#3,712 |
| 95. | Bowling Green | 10.9% | 5.2%(+5.70)#95 | 4.9%(+6.00)#3,761 |
| 96. | Ashtabula | 10.9% | 5.2%(+5.70)#96 | 4.9%(+6.00)#3,762 |
| 97. | West Hill | 10.9% | 5.2%(+5.70)#97 | 4.9%(+6.00)#3,778 |
| 98. | Philo | 10.8% | 5.2%(+5.60)#98 | 4.9%(+5.90)#3,876 |
| 99. | Cincinnati | 10.7% | 5.2%(+5.50)#99 | 4.9%(+5.80)#3,904 |
| 100. | Middleport | 10.7% | 5.2%(+5.50)#100 | 4.9%(+5.80)#3,924 |
Common Questions
What are the Top 10 Cities with the Highest Percentage of Households with Income Below $10,000 in Ohio?
Top 10 Cities with the Highest Percentage of Households with Income Below $10,000 in Ohio are:
#1
100.0%
#2
40.8%
#3
35.8%
#4
34.5%
#5
30.2%
#6
26.4%
#7
24.5%
#8
24.1%
#9
21.8%
#10
21.7%
What city has the Highest Percentage of Households with Income Below $10,000 in Ohio?
Cynthiana has the Highest Percentage of Households with Income Below $10,000 in Ohio with 100.0%.
What is the Percentage of Households with Income Below $10,000 in the State of Ohio?
Percentage of Households with Income Below $10,000 in Ohio is 5.2%.
What is the Percentage of Households with Income Below $10,000 in the United States?
Percentage of Households with Income Below $10,000 in the United States is 4.9%.