Cities with the Highest Percentage of Households with Income Below $10,000 in Georgia
RELATED REPORTS & OPTIONS
Household Income | $0-10k
Georgia
Compare Cities
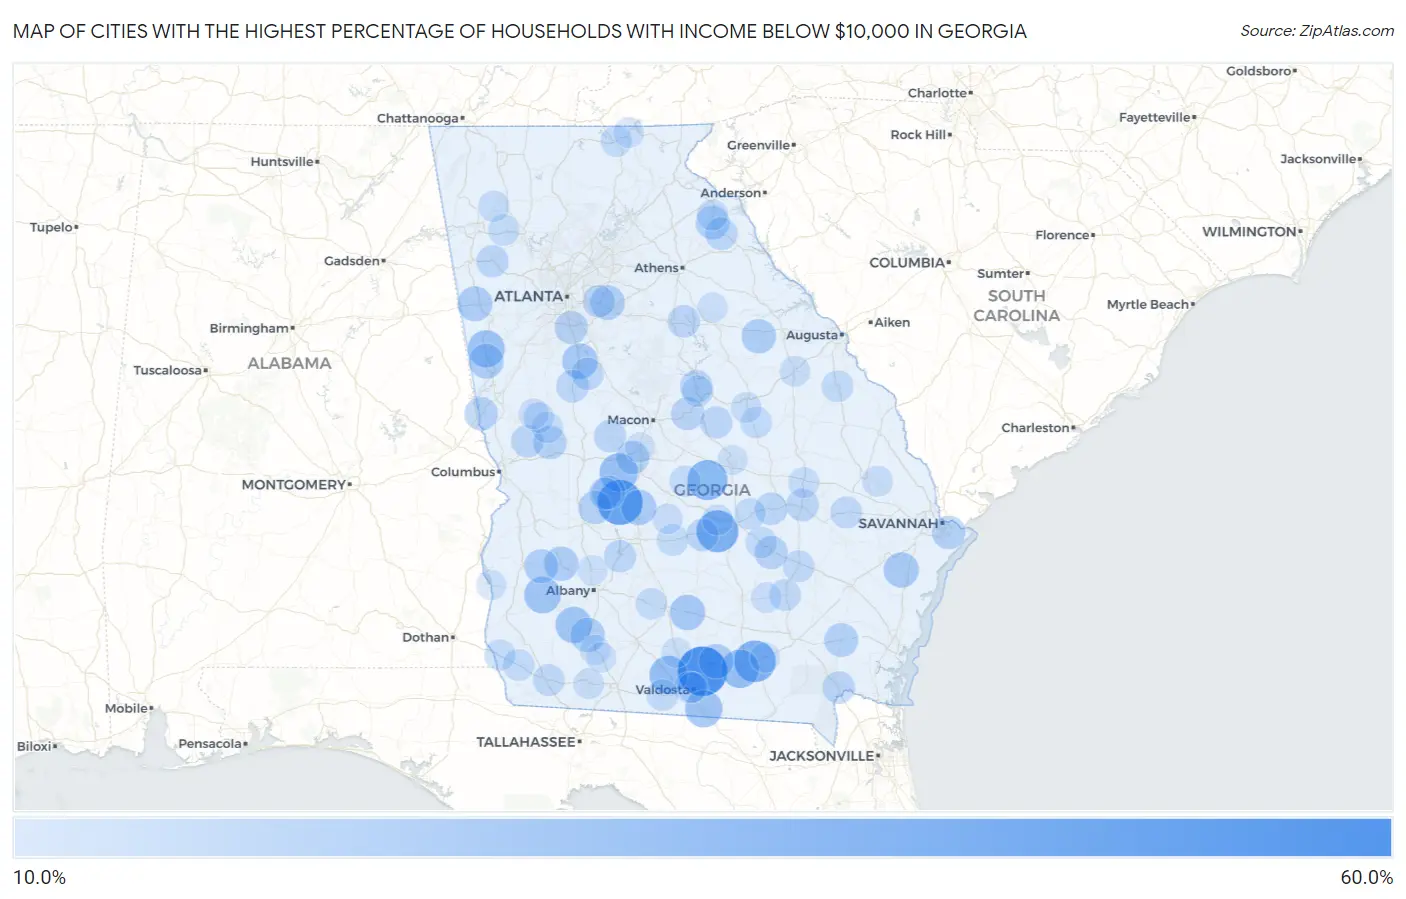
Map of Cities with the Highest Percentage of Households with Income Below $10,000 in Georgia
0.0%
60.0%
Cities with the Highest Percentage of Households with Income Below $10,000 in Georgia
| City | Households with Income < $10k | vs State | vs National | |
| 1. | Moody Afb | 51.4% | 5.4%(+46.0)#1 | 4.9%(+46.5)#151 |
| 2. | Juliette | 50.6% | 5.4%(+45.2)#2 | 4.9%(+45.7)#159 |
| 3. | Dooling | 42.3% | 5.4%(+36.9)#3 | 4.9%(+37.4)#262 |
| 4. | Milan | 35.9% | 5.4%(+30.5)#4 | 4.9%(+31.0)#376 |
| 5. | Homerville | 35.4% | 5.4%(+30.0)#5 | 4.9%(+30.5)#388 |
| 6. | Chester | 32.2% | 5.4%(+26.8)#6 | 4.9%(+27.3)#482 |
| 7. | Morven | 28.9% | 5.4%(+23.5)#7 | 4.9%(+24.0)#595 |
| 8. | Du Pont | 28.9% | 5.4%(+23.5)#8 | 4.9%(+24.0)#601 |
| 9. | Marshallville | 28.5% | 5.4%(+23.1)#9 | 4.9%(+23.6)#621 |
| 10. | Lake Park | 26.4% | 5.4%(+21.0)#10 | 4.9%(+21.5)#715 |
| 11. | Centralhatchee | 26.1% | 5.4%(+20.7)#11 | 4.9%(+21.2)#730 |
| 12. | Morgan | 25.3% | 5.4%(+19.9)#12 | 4.9%(+20.4)#767 |
| 13. | Newton | 24.8% | 5.4%(+19.4)#13 | 4.9%(+19.9)#814 |
| 14. | Experiment | 23.3% | 5.4%(+17.9)#14 | 4.9%(+18.4)#905 |
| 15. | Enigma | 22.7% | 5.4%(+17.3)#15 | 4.9%(+17.8)#956 |
| 16. | Pinehurst | 22.6% | 5.4%(+17.2)#16 | 4.9%(+17.7)#964 |
| 17. | Riceboro | 22.3% | 5.4%(+16.9)#17 | 4.9%(+17.4)#991 |
| 18. | Waco | 21.8% | 5.4%(+16.4)#18 | 4.9%(+16.9)#1,026 |
| 19. | Franklin | 21.6% | 5.4%(+16.2)#19 | 4.9%(+16.7)#1,042 |
| 20. | Lakeland | 21.4% | 5.4%(+16.0)#20 | 4.9%(+16.5)#1,066 |
| 21. | Lakeview Estates | 21.4% | 5.4%(+16.0)#21 | 4.9%(+16.5)#1,067 |
| 22. | Dawson | 21.0% | 5.4%(+15.6)#22 | 4.9%(+16.1)#1,106 |
| 23. | Camilla | 20.9% | 5.4%(+15.5)#23 | 4.9%(+16.0)#1,113 |
| 24. | Norwood | 20.8% | 5.4%(+15.4)#24 | 4.9%(+15.9)#1,125 |
| 25. | Shellman | 20.4% | 5.4%(+15.0)#25 | 4.9%(+15.5)#1,155 |
| 26. | Nahunta | 19.8% | 5.4%(+14.4)#26 | 4.9%(+14.9)#1,240 |
| 27. | Royston | 19.6% | 5.4%(+14.2)#27 | 4.9%(+14.7)#1,263 |
| 28. | Waynesville | 19.6% | 5.4%(+14.2)#28 | 4.9%(+14.7)#1,268 |
| 29. | Montezuma | 19.4% | 5.4%(+14.0)#29 | 4.9%(+14.5)#1,282 |
| 30. | West Point | 19.0% | 5.4%(+13.6)#30 | 4.9%(+14.1)#1,333 |
| 31. | Talbotton | 19.0% | 5.4%(+13.6)#31 | 4.9%(+14.1)#1,335 |
| 32. | Hortense | 19.0% | 5.4%(+13.6)#32 | 4.9%(+14.1)#1,340 |
| 33. | Andersonville | 19.0% | 5.4%(+13.6)#33 | 4.9%(+14.1)#1,343 |
| 34. | Fort Valley | 18.9% | 5.4%(+13.5)#34 | 4.9%(+14.0)#1,354 |
| 35. | Dutch Island | 18.9% | 5.4%(+13.5)#35 | 4.9%(+14.0)#1,359 |
| 36. | Jonesboro | 18.6% | 5.4%(+13.2)#36 | 4.9%(+13.7)#1,400 |
| 37. | Hazlehurst | 18.6% | 5.4%(+13.2)#37 | 4.9%(+13.7)#1,401 |
| 38. | Gordon | 18.0% | 5.4%(+12.6)#38 | 4.9%(+13.1)#1,484 |
| 39. | Lyons | 17.5% | 5.4%(+12.1)#39 | 4.9%(+12.6)#1,560 |
| 40. | Waverly Hall | 17.5% | 5.4%(+12.1)#40 | 4.9%(+12.6)#1,565 |
| 41. | Bowman | 17.4% | 5.4%(+12.0)#41 | 4.9%(+12.5)#1,577 |
| 42. | Mount Vernon | 17.3% | 5.4%(+11.9)#42 | 4.9%(+12.4)#1,588 |
| 43. | Zebulon | 17.3% | 5.4%(+11.9)#43 | 4.9%(+12.4)#1,590 |
| 44. | Milledgeville | 17.2% | 5.4%(+11.8)#44 | 4.9%(+12.3)#1,605 |
| 45. | Folkston | 17.2% | 5.4%(+11.8)#45 | 4.9%(+12.3)#1,606 |
| 46. | Rhine | 17.0% | 5.4%(+11.6)#46 | 4.9%(+12.1)#1,646 |
| 47. | Rockmart | 16.9% | 5.4%(+11.5)#47 | 4.9%(+12.0)#1,659 |
| 48. | Buckhead | 16.9% | 5.4%(+11.5)#48 | 4.9%(+12.0)#1,680 |
| 49. | Roberta | 16.8% | 5.4%(+11.4)#49 | 4.9%(+11.9)#1,690 |
| 50. | Warwick | 16.8% | 5.4%(+11.4)#50 | 4.9%(+11.9)#1,698 |
| 51. | Lithonia | 16.7% | 5.4%(+11.3)#51 | 4.9%(+11.8)#1,707 |
| 52. | Orchard Hill | 16.7% | 5.4%(+11.3)#52 | 4.9%(+11.8)#1,723 |
| 53. | Toomsboro | 16.5% | 5.4%(+11.1)#53 | 4.9%(+11.6)#1,772 |
| 54. | Oglethorpe | 16.3% | 5.4%(+10.9)#54 | 4.9%(+11.4)#1,803 |
| 55. | Bainbridge | 16.2% | 5.4%(+10.8)#55 | 4.9%(+11.3)#1,812 |
| 56. | Remerton | 16.1% | 5.4%(+10.7)#56 | 4.9%(+11.2)#1,842 |
| 57. | Hagan | 16.0% | 5.4%(+10.6)#57 | 4.9%(+11.1)#1,863 |
| 58. | Alma | 15.8% | 5.4%(+10.4)#58 | 4.9%(+10.9)#1,896 |
| 59. | Baxley | 15.7% | 5.4%(+10.3)#59 | 4.9%(+10.8)#1,921 |
| 60. | Quitman | 15.6% | 5.4%(+10.2)#60 | 4.9%(+10.7)#1,945 |
| 61. | Waynesboro | 15.4% | 5.4%(+10.00)#61 | 4.9%(+10.5)#1,991 |
| 62. | Rochelle | 15.4% | 5.4%(+10.00)#62 | 4.9%(+10.5)#1,999 |
| 63. | Iron City | 15.4% | 5.4%(+10.00)#63 | 4.9%(+10.5)#2,008 |
| 64. | Harrison | 15.3% | 5.4%(+9.90)#64 | 4.9%(+10.4)#2,035 |
| 65. | Lumber City | 15.2% | 5.4%(+9.80)#65 | 4.9%(+10.3)#2,051 |
| 66. | Alamo | 15.1% | 5.4%(+9.70)#66 | 4.9%(+10.2)#2,063 |
| 67. | Hardwick | 15.0% | 5.4%(+9.60)#67 | 4.9%(+10.1)#2,081 |
| 68. | Ty Ty | 15.0% | 5.4%(+9.60)#68 | 4.9%(+10.1)#2,096 |
| 69. | Kingston | 14.9% | 5.4%(+9.50)#69 | 4.9%(+10.00)#2,122 |
| 70. | Jakin | 14.9% | 5.4%(+9.50)#70 | 4.9%(+10.00)#2,131 |
| 71. | Cochran | 14.8% | 5.4%(+9.40)#71 | 4.9%(+9.90)#2,142 |
| 72. | Blairsville | 14.7% | 5.4%(+9.30)#72 | 4.9%(+9.80)#2,186 |
| 73. | Georgetown Quitman County Unified Government | 14.6% | 5.4%(+9.20)#73 | 4.9%(+9.70)#2,207 |
| 74. | Canon | 14.6% | 5.4%(+9.20)#74 | 4.9%(+9.70)#2,212 |
| 75. | Plainville | 14.6% | 5.4%(+9.20)#75 | 4.9%(+9.70)#2,215 |
| 76. | Woodland | 14.6% | 5.4%(+9.20)#76 | 4.9%(+9.70)#2,216 |
| 77. | Bristol | 14.6% | 5.4%(+9.20)#77 | 4.9%(+9.70)#2,222 |
| 78. | Oak Park | 14.2% | 5.4%(+8.80)#78 | 4.9%(+9.30)#2,315 |
| 79. | Cairo | 14.0% | 5.4%(+8.60)#79 | 4.9%(+9.10)#2,350 |
| 80. | Chauncey | 14.0% | 5.4%(+8.60)#80 | 4.9%(+9.10)#2,371 |
| 81. | Brooklet | 13.9% | 5.4%(+8.50)#81 | 4.9%(+9.00)#2,389 |
| 82. | Tennille | 13.9% | 5.4%(+8.50)#82 | 4.9%(+9.00)#2,390 |
| 83. | Wrens | 13.8% | 5.4%(+8.40)#83 | 4.9%(+8.90)#2,425 |
| 84. | Crescent | 13.8% | 5.4%(+8.40)#84 | 4.9%(+8.90)#2,432 |
| 85. | Manchester | 13.7% | 5.4%(+8.30)#85 | 4.9%(+8.80)#2,449 |
| 86. | Valdosta | 13.6% | 5.4%(+8.20)#86 | 4.9%(+8.70)#2,469 |
| 87. | Nicholls | 13.6% | 5.4%(+8.20)#87 | 4.9%(+8.70)#2,477 |
| 88. | Young Harris | 13.5% | 5.4%(+8.10)#88 | 4.9%(+8.60)#2,519 |
| 89. | Pineview | 13.3% | 5.4%(+7.90)#89 | 4.9%(+8.40)#2,593 |
| 90. | Warm Springs | 13.3% | 5.4%(+7.90)#90 | 4.9%(+8.40)#2,596 |
| 91. | Box Springs | 13.3% | 5.4%(+7.90)#91 | 4.9%(+8.40)#2,603 |
| 92. | Adel | 13.0% | 5.4%(+7.60)#92 | 4.9%(+8.10)#2,694 |
| 93. | Argyle | 13.0% | 5.4%(+7.60)#93 | 4.9%(+8.10)#2,712 |
| 94. | Woodville | 13.0% | 5.4%(+7.60)#94 | 4.9%(+8.10)#2,720 |
| 95. | Leesburg | 12.9% | 5.4%(+7.50)#95 | 4.9%(+8.00)#2,742 |
| 96. | Pelham | 12.8% | 5.4%(+7.40)#96 | 4.9%(+7.90)#2,782 |
| 97. | Dublin | 12.7% | 5.4%(+7.30)#97 | 4.9%(+7.80)#2,813 |
| 98. | Byron | 12.7% | 5.4%(+7.30)#98 | 4.9%(+7.80)#2,815 |
| 99. | Fort Gaines | 12.7% | 5.4%(+7.30)#99 | 4.9%(+7.80)#2,827 |
| 100. | Meigs | 12.7% | 5.4%(+7.30)#100 | 4.9%(+7.80)#2,829 |
Common Questions
What are the Top 10 Cities with the Highest Percentage of Households with Income Below $10,000 in Georgia?
Top 10 Cities with the Highest Percentage of Households with Income Below $10,000 in Georgia are:
#1
51.4%
#2
42.3%
#3
35.9%
#4
35.4%
#5
32.2%
#6
28.9%
#7
28.9%
#8
28.5%
#9
26.4%
#10
26.1%
What city has the Highest Percentage of Households with Income Below $10,000 in Georgia?
Moody AFB has the Highest Percentage of Households with Income Below $10,000 in Georgia with 51.4%.
What is the Percentage of Households with Income Below $10,000 in the State of Georgia?
Percentage of Households with Income Below $10,000 in Georgia is 5.4%.
What is the Percentage of Households with Income Below $10,000 in the United States?
Percentage of Households with Income Below $10,000 in the United States is 4.9%.