Cities with the Highest Percentage of Households with Income Above $200,000 in Pennsylvania
RELATED REPORTS & OPTIONS
Household Income | $200k+
Pennsylvania
Compare Cities
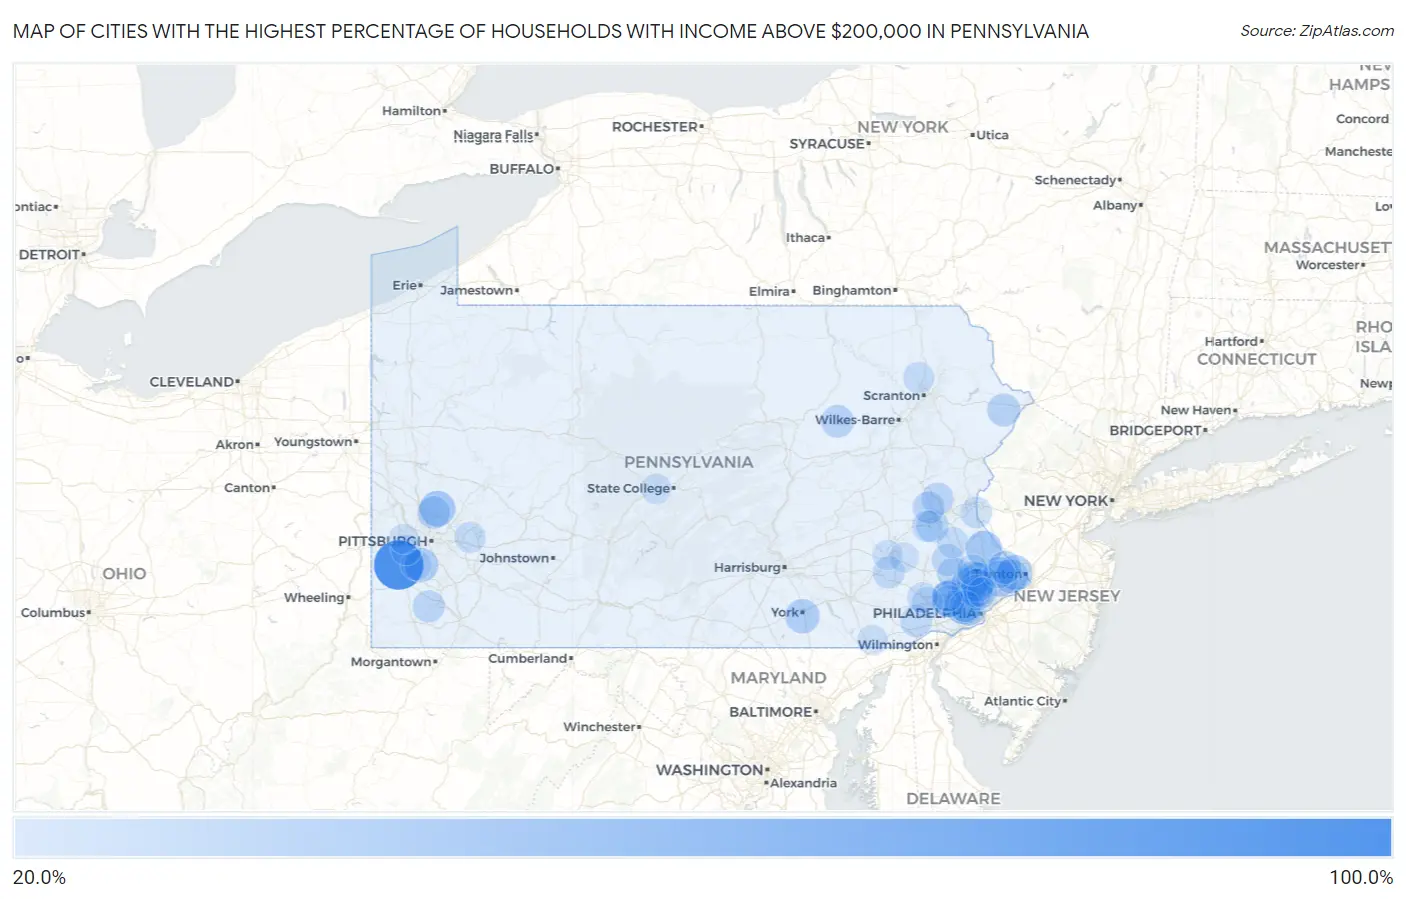
Map of Cities with the Highest Percentage of Households with Income Above $200,000 in Pennsylvania
0.0%
100.0%
Cities with the Highest Percentage of Households with Income Above $200,000 in Pennsylvania
| City | Households with Income > $200k | vs State | vs National | |
| 1. | Westland | 100.0% | 10.2%(+89.8)#1 | 11.4%(+88.6)#11 |
| 2. | Villanova | 72.6% | 10.2%(+62.4)#2 | 11.4%(+61.2)#61 |
| 3. | Merion Station | 60.8% | 10.2%(+50.6)#3 | 11.4%(+49.4)#170 |
| 4. | Fox Chapel Borough | 59.6% | 10.2%(+49.4)#4 | 11.4%(+48.2)#197 |
| 5. | Ben Avon Heights Borough | 57.7% | 10.2%(+47.5)#5 | 11.4%(+46.3)#236 |
| 6. | Rose Valley Borough | 56.1% | 10.2%(+45.9)#6 | 11.4%(+44.7)#270 |
| 7. | Thornburg Borough | 55.9% | 10.2%(+45.7)#7 | 11.4%(+44.5)#275 |
| 8. | Haverford College | 55.1% | 10.2%(+44.9)#8 | 11.4%(+43.7)#290 |
| 9. | Devon | 51.6% | 10.2%(+41.4)#9 | 11.4%(+40.2)#403 |
| 10. | Edgeworth Borough | 50.9% | 10.2%(+40.7)#10 | 11.4%(+39.5)#423 |
| 11. | St. Davids | 47.0% | 10.2%(+36.8)#11 | 11.4%(+35.6)#535 |
| 12. | Sewickley Heights Borough | 47.0% | 10.2%(+36.8)#12 | 11.4%(+35.6)#536 |
| 13. | Gray | 46.9% | 10.2%(+36.7)#13 | 11.4%(+35.5)#541 |
| 14. | Plumsteadville | 44.7% | 10.2%(+34.5)#14 | 11.4%(+33.3)#626 |
| 15. | Bakerstown | 43.8% | 10.2%(+33.6)#15 | 11.4%(+32.4)#661 |
| 16. | Blue Bell | 43.2% | 10.2%(+33.0)#16 | 11.4%(+31.8)#683 |
| 17. | Churchville | 43.2% | 10.2%(+33.0)#17 | 11.4%(+31.8)#684 |
| 18. | Dilworthtown | 42.1% | 10.2%(+31.9)#18 | 11.4%(+30.7)#733 |
| 19. | Woodside | 41.1% | 10.2%(+30.9)#19 | 11.4%(+29.7)#776 |
| 20. | Chadds Ford | 41.1% | 10.2%(+30.9)#20 | 11.4%(+29.7)#779 |
| 21. | Maple Glen | 40.6% | 10.2%(+30.4)#21 | 11.4%(+29.2)#793 |
| 22. | Sewickley Hills Borough | 40.2% | 10.2%(+30.0)#22 | 11.4%(+28.8)#820 |
| 23. | Bear Creek Village Borough | 39.4% | 10.2%(+29.2)#23 | 11.4%(+28.0)#876 |
| 24. | New Hope Borough | 39.0% | 10.2%(+28.8)#24 | 11.4%(+27.6)#903 |
| 25. | Spring House | 38.8% | 10.2%(+28.6)#25 | 11.4%(+27.4)#908 |
| 26. | Franklin Park Borough | 38.6% | 10.2%(+28.4)#26 | 11.4%(+27.2)#919 |
| 27. | Grantley | 38.0% | 10.2%(+27.8)#27 | 11.4%(+26.6)#961 |
| 28. | Woodbourne | 37.9% | 10.2%(+27.7)#28 | 11.4%(+26.5)#964 |
| 29. | Mcmurray | 37.3% | 10.2%(+27.1)#29 | 11.4%(+25.9)#993 |
| 30. | Fort Fetter | 37.2% | 10.2%(+27.0)#30 | 11.4%(+25.8)#1,007 |
| 31. | Glenmoore | 35.8% | 10.2%(+25.6)#31 | 11.4%(+24.4)#1,100 |
| 32. | Bell Acres Borough | 35.7% | 10.2%(+25.5)#32 | 11.4%(+24.3)#1,108 |
| 33. | Morgan Hill | 35.7% | 10.2%(+25.5)#33 | 11.4%(+24.3)#1,110 |
| 34. | Penn Wynne | 35.4% | 10.2%(+25.2)#34 | 11.4%(+24.0)#1,137 |
| 35. | Maxatawny | 34.8% | 10.2%(+24.6)#35 | 11.4%(+23.4)#1,194 |
| 36. | Swarthmore Borough | 34.5% | 10.2%(+24.3)#36 | 11.4%(+23.1)#1,208 |
| 37. | Wyndmoor | 34.0% | 10.2%(+23.8)#37 | 11.4%(+22.6)#1,244 |
| 38. | Sunrise Lake | 33.8% | 10.2%(+23.6)#38 | 11.4%(+22.4)#1,267 |
| 39. | Fort Washington | 33.6% | 10.2%(+23.4)#39 | 11.4%(+22.2)#1,278 |
| 40. | Newtown Grant | 33.6% | 10.2%(+23.4)#40 | 11.4%(+22.2)#1,279 |
| 41. | Bala Cynwyd | 33.5% | 10.2%(+23.3)#41 | 11.4%(+22.1)#1,285 |
| 42. | Newtown Borough | 33.1% | 10.2%(+22.9)#42 | 11.4%(+21.7)#1,331 |
| 43. | Waller | 32.5% | 10.2%(+22.3)#43 | 11.4%(+21.1)#1,383 |
| 44. | Narberth Borough | 32.4% | 10.2%(+22.2)#44 | 11.4%(+21.0)#1,385 |
| 45. | Potters Mills | 32.4% | 10.2%(+22.2)#45 | 11.4%(+21.0)#1,390 |
| 46. | Gibsonia | 32.2% | 10.2%(+22.0)#46 | 11.4%(+20.8)#1,413 |
| 47. | Pughtown | 32.0% | 10.2%(+21.8)#47 | 11.4%(+20.6)#1,432 |
| 48. | Skippack | 31.8% | 10.2%(+21.6)#48 | 11.4%(+20.4)#1,449 |
| 49. | Flourtown | 31.7% | 10.2%(+21.5)#49 | 11.4%(+20.3)#1,460 |
| 50. | Ancient Oaks | 31.1% | 10.2%(+20.9)#50 | 11.4%(+19.7)#1,510 |
| 51. | Bradford Woods Borough | 31.1% | 10.2%(+20.9)#51 | 11.4%(+19.7)#1,512 |
| 52. | Wayne | 30.7% | 10.2%(+20.5)#52 | 11.4%(+19.3)#1,547 |
| 53. | Fredericktown | 30.4% | 10.2%(+20.2)#53 | 11.4%(+19.0)#1,576 |
| 54. | Laurys Station | 30.2% | 10.2%(+20.0)#54 | 11.4%(+18.8)#1,598 |
| 55. | Schnecksville | 30.1% | 10.2%(+19.9)#55 | 11.4%(+18.7)#1,608 |
| 56. | Elkins Park | 30.0% | 10.2%(+19.8)#56 | 11.4%(+18.6)#1,617 |
| 57. | West Conshohocken Borough | 29.6% | 10.2%(+19.4)#57 | 11.4%(+18.2)#1,657 |
| 58. | Woxall | 29.4% | 10.2%(+19.2)#58 | 11.4%(+18.0)#1,675 |
| 59. | Alleghenyville | 29.2% | 10.2%(+19.0)#59 | 11.4%(+17.8)#1,690 |
| 60. | Berwyn | 28.7% | 10.2%(+18.5)#60 | 11.4%(+17.3)#1,746 |
| 61. | Unionville | 28.6% | 10.2%(+18.4)#61 | 11.4%(+17.2)#1,762 |
| 62. | Carlisle Barracks | 28.3% | 10.2%(+18.1)#62 | 11.4%(+16.9)#1,796 |
| 63. | Malvern Borough | 27.9% | 10.2%(+17.7)#63 | 11.4%(+16.5)#1,830 |
| 64. | Raubsville | 27.9% | 10.2%(+17.7)#64 | 11.4%(+16.5)#1,831 |
| 65. | Ardmore | 27.8% | 10.2%(+17.6)#65 | 11.4%(+16.4)#1,839 |
| 66. | Richboro | 27.6% | 10.2%(+17.4)#66 | 11.4%(+16.2)#1,861 |
| 67. | Aspinwall Borough | 27.1% | 10.2%(+16.9)#67 | 11.4%(+15.7)#1,926 |
| 68. | Breinigsville | 27.0% | 10.2%(+16.8)#68 | 11.4%(+15.6)#1,937 |
| 69. | Murrysville | 26.6% | 10.2%(+16.4)#69 | 11.4%(+15.2)#1,976 |
| 70. | Bryn Athyn Borough | 26.6% | 10.2%(+16.4)#70 | 11.4%(+15.2)#1,986 |
| 71. | Waverly | 26.5% | 10.2%(+16.3)#71 | 11.4%(+15.1)#1,999 |
| 72. | Glen Osborne Borough | 26.5% | 10.2%(+16.3)#72 | 11.4%(+15.1)#2,000 |
| 73. | Haysville Borough | 26.2% | 10.2%(+16.0)#73 | 11.4%(+14.8)#2,039 |
| 74. | Montgomeryville | 26.1% | 10.2%(+15.9)#74 | 11.4%(+14.7)#2,043 |
| 75. | Rosemont | 26.0% | 10.2%(+15.8)#75 | 11.4%(+14.6)#2,055 |
| 76. | Milford Square | 25.9% | 10.2%(+15.7)#76 | 11.4%(+14.5)#2,068 |
| 77. | Ivyland Borough | 25.8% | 10.2%(+15.6)#77 | 11.4%(+14.4)#2,083 |
| 78. | Rosslyn Farms Borough | 25.6% | 10.2%(+15.4)#78 | 11.4%(+14.2)#2,107 |
| 79. | Exton | 25.5% | 10.2%(+15.3)#79 | 11.4%(+14.1)#2,115 |
| 80. | Collegeville Borough | 25.3% | 10.2%(+15.1)#80 | 11.4%(+13.9)#2,134 |
| 81. | Sewickley Borough | 24.7% | 10.2%(+14.5)#81 | 11.4%(+13.3)#2,202 |
| 82. | Eagleview | 24.7% | 10.2%(+14.5)#82 | 11.4%(+13.3)#2,204 |
| 83. | Jefferson Hills Borough | 24.6% | 10.2%(+14.4)#83 | 11.4%(+13.2)#2,214 |
| 84. | Langhorne Manor Borough | 24.6% | 10.2%(+14.4)#84 | 11.4%(+13.2)#2,220 |
| 85. | Rutledge Borough | 24.6% | 10.2%(+14.4)#85 | 11.4%(+13.2)#2,222 |
| 86. | Freemansburg Borough | 24.3% | 10.2%(+14.1)#86 | 11.4%(+12.9)#2,264 |
| 87. | Mckinley | 23.9% | 10.2%(+13.7)#87 | 11.4%(+12.5)#2,332 |
| 88. | Trappe Borough | 23.8% | 10.2%(+13.6)#88 | 11.4%(+12.4)#2,350 |
| 89. | Thompsonville | 23.8% | 10.2%(+13.6)#89 | 11.4%(+12.4)#2,352 |
| 90. | Chesterbrook | 23.6% | 10.2%(+13.4)#90 | 11.4%(+12.2)#2,377 |
| 91. | Sturgeon | 23.6% | 10.2%(+13.4)#91 | 11.4%(+12.2)#2,384 |
| 92. | Stormstown | 23.3% | 10.2%(+13.1)#92 | 11.4%(+11.9)#2,428 |
| 93. | Little Britain | 23.3% | 10.2%(+13.1)#93 | 11.4%(+11.9)#2,432 |
| 94. | Jenkintown Borough | 23.2% | 10.2%(+13.0)#94 | 11.4%(+11.8)#2,448 |
| 95. | Chalfont Borough | 23.1% | 10.2%(+12.9)#95 | 11.4%(+11.7)#2,467 |
| 96. | Wyncote | 22.9% | 10.2%(+12.7)#96 | 11.4%(+11.5)#2,493 |
| 97. | Seven Fields Borough | 22.7% | 10.2%(+12.5)#97 | 11.4%(+11.3)#2,526 |
| 98. | Colony Park | 22.6% | 10.2%(+12.4)#98 | 11.4%(+11.2)#2,550 |
| 99. | Jacksonwald | 22.5% | 10.2%(+12.3)#99 | 11.4%(+11.1)#2,566 |
| 100. | Enlow | 22.3% | 10.2%(+12.1)#100 | 11.4%(+10.9)#2,608 |
Common Questions
What are the Top 10 Cities with the Highest Percentage of Households with Income Above $200,000 in Pennsylvania?
Top 10 Cities with the Highest Percentage of Households with Income Above $200,000 in Pennsylvania are:
#1
100.0%
#2
55.1%
#3
51.6%
#4
44.7%
#5
43.8%
#6
43.2%
#7
43.2%
#8
41.1%
#9
40.6%
#10
38.8%
What city has the Highest Percentage of Households with Income Above $200,000 in Pennsylvania?
Westland has the Highest Percentage of Households with Income Above $200,000 in Pennsylvania with 100.0%.
What is the Percentage of Households with Income Above $200,000 in the State of Pennsylvania?
Percentage of Households with Income Above $200,000 in Pennsylvania is 10.2%.
What is the Percentage of Households with Income Above $200,000 in the United States?
Percentage of Households with Income Above $200,000 in the United States is 11.4%.