Cities with the Highest Percentage of Households with Income Above $200,000 in New Jersey
RELATED REPORTS & OPTIONS
Household Income | $200k+
New Jersey
Compare Cities
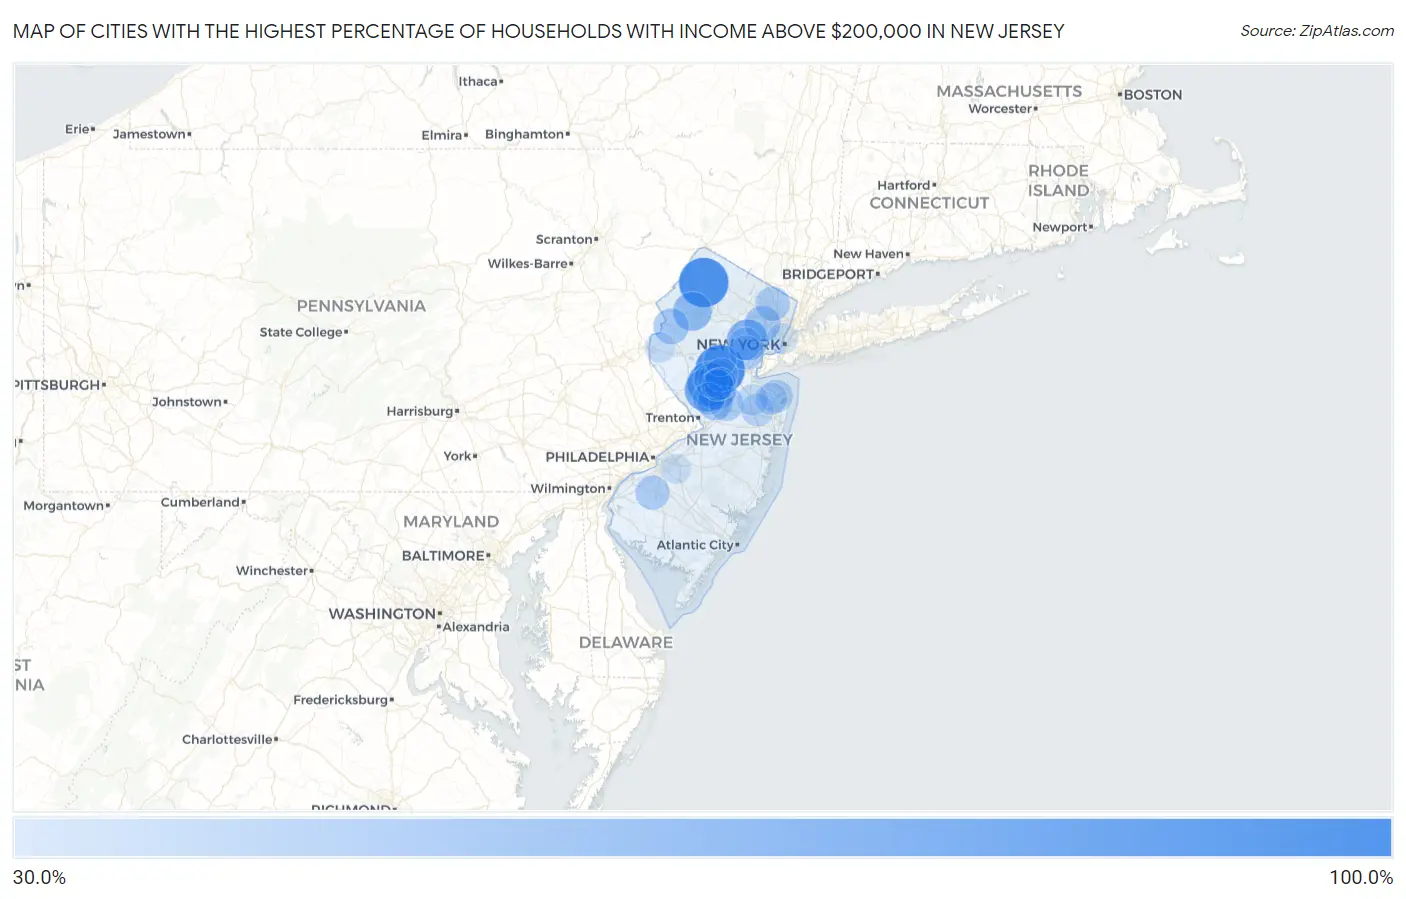
Map of Cities with the Highest Percentage of Households with Income Above $200,000 in New Jersey
0.0%
100.0%
Cities with the Highest Percentage of Households with Income Above $200,000 in New Jersey
| City | Households with Income > $200k | vs State | vs National | |
| 1. | Zarephath | 100.0% | 19.2%(+80.8)#1 | 11.4%(+88.6)#7 |
| 2. | Ross Corner | 100.0% | 19.2%(+80.8)#2 | 11.4%(+88.6)#8 |
| 3. | Tavistock Borough | 100.0% | 19.2%(+80.8)#3 | 11.4%(+88.6)#19 |
| 4. | Harlingen | 85.0% | 19.2%(+65.8)#4 | 11.4%(+73.6)#27 |
| 5. | Blawenburg | 79.6% | 19.2%(+60.4)#5 | 11.4%(+68.2)#33 |
| 6. | Short Hills | 72.9% | 19.2%(+53.7)#6 | 11.4%(+61.5)#59 |
| 7. | East Rocky Hill | 67.9% | 19.2%(+48.7)#7 | 11.4%(+56.5)#93 |
| 8. | Allamuchy | 65.9% | 19.2%(+46.7)#8 | 11.4%(+54.5)#106 |
| 9. | Ho Ho Kus Borough | 65.2% | 19.2%(+46.0)#9 | 11.4%(+53.8)#111 |
| 10. | Essex Fells Borough | 63.5% | 19.2%(+44.3)#10 | 11.4%(+52.1)#129 |
| 11. | Mountain Lakes Borough | 63.3% | 19.2%(+44.1)#11 | 11.4%(+51.9)#134 |
| 12. | Forsgate | 63.2% | 19.2%(+44.0)#12 | 11.4%(+51.8)#135 |
| 13. | Blackwells Mills | 61.0% | 19.2%(+41.8)#13 | 11.4%(+49.6)#164 |
| 14. | Lyons | 61.0% | 19.2%(+41.8)#14 | 11.4%(+49.6)#165 |
| 15. | Glen Ridge Borough | 60.9% | 19.2%(+41.7)#15 | 11.4%(+49.5)#166 |
| 16. | Rumson Borough | 59.4% | 19.2%(+40.2)#16 | 11.4%(+48.0)#203 |
| 17. | Chatham Borough | 59.3% | 19.2%(+40.1)#17 | 11.4%(+47.9)#206 |
| 18. | Liberty Corner | 58.7% | 19.2%(+39.5)#18 | 11.4%(+47.3)#215 |
| 19. | Upper Montclair | 57.2% | 19.2%(+38.0)#19 | 11.4%(+45.8)#245 |
| 20. | Upper Saddle River Borough | 56.5% | 19.2%(+37.3)#20 | 11.4%(+45.1)#256 |
| 21. | Mantoloking Borough | 56.5% | 19.2%(+37.3)#21 | 11.4%(+45.1)#259 |
| 22. | Fair Haven Borough | 56.3% | 19.2%(+37.1)#22 | 11.4%(+44.9)#263 |
| 23. | Buttzville | 56.3% | 19.2%(+37.1)#23 | 11.4%(+44.9)#266 |
| 24. | Princeton Junction | 55.2% | 19.2%(+36.0)#24 | 11.4%(+43.8)#284 |
| 25. | Little Silver Borough | 55.1% | 19.2%(+35.9)#25 | 11.4%(+43.7)#288 |
| 26. | Woodcliff Lake Borough | 55.0% | 19.2%(+35.8)#26 | 11.4%(+43.6)#293 |
| 27. | Saddle River Borough | 54.8% | 19.2%(+35.6)#27 | 11.4%(+43.4)#301 |
| 28. | Englewood Cliffs Borough | 54.6% | 19.2%(+35.4)#28 | 11.4%(+43.2)#310 |
| 29. | Haworth Borough | 54.3% | 19.2%(+35.1)#29 | 11.4%(+42.9)#320 |
| 30. | Deans | 54.3% | 19.2%(+35.1)#30 | 11.4%(+42.9)#323 |
| 31. | Alpine Borough | 53.0% | 19.2%(+33.8)#31 | 11.4%(+41.6)#365 |
| 32. | Cranbury | 52.7% | 19.2%(+33.5)#32 | 11.4%(+41.3)#371 |
| 33. | Ridgewood | 52.6% | 19.2%(+33.4)#33 | 11.4%(+41.2)#374 |
| 34. | Neshanic Station | 52.4% | 19.2%(+33.2)#34 | 11.4%(+41.0)#380 |
| 35. | Franklin Lakes Borough | 52.1% | 19.2%(+32.9)#35 | 11.4%(+40.7)#384 |
| 36. | Belle Mead | 52.0% | 19.2%(+32.8)#36 | 11.4%(+40.6)#388 |
| 37. | Bernardsville Borough | 51.9% | 19.2%(+32.7)#37 | 11.4%(+40.5)#391 |
| 38. | Tenafly Borough | 51.8% | 19.2%(+32.6)#38 | 11.4%(+40.4)#394 |
| 39. | Richwood | 51.7% | 19.2%(+32.5)#39 | 11.4%(+40.3)#397 |
| 40. | Mendham Borough | 51.6% | 19.2%(+32.4)#40 | 11.4%(+40.2)#401 |
| 41. | Sea Girt Borough | 51.3% | 19.2%(+32.1)#41 | 11.4%(+39.9)#410 |
| 42. | Westfield | 50.8% | 19.2%(+31.6)#42 | 11.4%(+39.4)#425 |
| 43. | North Caldwell Borough | 50.7% | 19.2%(+31.5)#43 | 11.4%(+39.3)#429 |
| 44. | Glen Rock Borough | 50.2% | 19.2%(+31.0)#44 | 11.4%(+38.8)#437 |
| 45. | Rockleigh Borough | 50.0% | 19.2%(+30.8)#45 | 11.4%(+38.6)#447 |
| 46. | Brookside | 49.9% | 19.2%(+30.7)#46 | 11.4%(+38.5)#458 |
| 47. | Millington | 49.5% | 19.2%(+30.3)#47 | 11.4%(+38.1)#470 |
| 48. | Oradell Borough | 49.0% | 19.2%(+29.8)#48 | 11.4%(+37.6)#481 |
| 49. | Packanack Lake | 48.8% | 19.2%(+29.6)#49 | 11.4%(+37.4)#485 |
| 50. | Bridgewater Center | 48.7% | 19.2%(+29.5)#50 | 11.4%(+37.3)#487 |
| 51. | Old Tappan Borough | 48.7% | 19.2%(+29.5)#51 | 11.4%(+37.3)#488 |
| 52. | East Millstone | 48.7% | 19.2%(+29.5)#52 | 11.4%(+37.3)#491 |
| 53. | Fairview | 48.6% | 19.2%(+29.4)#53 | 11.4%(+37.2)#492 |
| 54. | Llewellyn Park | 47.8% | 19.2%(+28.6)#54 | 11.4%(+36.4)#512 |
| 55. | Peapack And Gladstone Borough | 47.4% | 19.2%(+28.2)#55 | 11.4%(+36.0)#520 |
| 56. | Summit | 47.2% | 19.2%(+28.0)#56 | 11.4%(+35.8)#528 |
| 57. | East Freehold | 46.8% | 19.2%(+27.6)#57 | 11.4%(+35.4)#545 |
| 58. | Martinsville | 46.7% | 19.2%(+27.5)#58 | 11.4%(+35.3)#550 |
| 59. | Nesco | 46.2% | 19.2%(+27.0)#59 | 11.4%(+34.8)#570 |
| 60. | Mizpah | 46.2% | 19.2%(+27.0)#60 | 11.4%(+34.8)#571 |
| 61. | Mountainside Borough | 46.0% | 19.2%(+26.8)#61 | 11.4%(+34.6)#577 |
| 62. | Pines Lake | 45.9% | 19.2%(+26.7)#62 | 11.4%(+34.5)#581 |
| 63. | Basking Ridge | 45.8% | 19.2%(+26.6)#63 | 11.4%(+34.4)#583 |
| 64. | Princeton | 45.3% | 19.2%(+26.1)#64 | 11.4%(+33.9)#598 |
| 65. | Closter Borough | 45.1% | 19.2%(+25.9)#65 | 11.4%(+33.7)#605 |
| 66. | Towaco | 45.0% | 19.2%(+25.8)#66 | 11.4%(+33.6)#609 |
| 67. | Demarest Borough | 44.9% | 19.2%(+25.7)#67 | 11.4%(+33.5)#615 |
| 68. | Pleasant Plains | 44.9% | 19.2%(+25.7)#68 | 11.4%(+33.5)#616 |
| 69. | Lincroft | 44.8% | 19.2%(+25.6)#69 | 11.4%(+33.4)#617 |
| 70. | Cream Ridge | 44.8% | 19.2%(+25.6)#70 | 11.4%(+33.4)#622 |
| 71. | Haddonfield Borough | 44.4% | 19.2%(+25.2)#71 | 11.4%(+33.0)#636 |
| 72. | Monroe Manor | 44.2% | 19.2%(+25.0)#72 | 11.4%(+32.8)#643 |
| 73. | Troy Hills | 44.1% | 19.2%(+24.9)#73 | 11.4%(+32.7)#651 |
| 74. | Flagtown | 44.1% | 19.2%(+24.9)#74 | 11.4%(+32.7)#652 |
| 75. | Griggstown | 43.8% | 19.2%(+24.6)#75 | 11.4%(+32.4)#663 |
| 76. | Montvale Borough | 43.1% | 19.2%(+23.9)#76 | 11.4%(+31.7)#688 |
| 77. | Spring Lake Borough | 43.1% | 19.2%(+23.9)#77 | 11.4%(+31.7)#690 |
| 78. | Robertsville | 43.0% | 19.2%(+23.8)#78 | 11.4%(+31.6)#693 |
| 79. | Harrington Park Borough | 42.5% | 19.2%(+23.3)#79 | 11.4%(+31.1)#709 |
| 80. | Allendale Borough | 42.4% | 19.2%(+23.2)#80 | 11.4%(+31.0)#714 |
| 81. | Stirling | 42.4% | 19.2%(+23.2)#81 | 11.4%(+31.0)#716 |
| 82. | Hillsdale Borough | 42.1% | 19.2%(+22.9)#82 | 11.4%(+30.7)#729 |
| 83. | Fanwood Borough | 41.8% | 19.2%(+22.6)#83 | 11.4%(+30.4)#743 |
| 84. | Hewitt | 41.2% | 19.2%(+22.0)#84 | 11.4%(+29.8)#774 |
| 85. | Hoboken | 40.8% | 19.2%(+21.6)#85 | 11.4%(+29.4)#784 |
| 86. | Madison Borough | 40.5% | 19.2%(+21.3)#86 | 11.4%(+29.1)#796 |
| 87. | Kinnelon Borough | 40.3% | 19.2%(+21.1)#87 | 11.4%(+28.9)#808 |
| 88. | Stewartsville | 40.2% | 19.2%(+21.0)#88 | 11.4%(+28.8)#821 |
| 89. | Shrewsbury Borough | 40.1% | 19.2%(+20.9)#89 | 11.4%(+28.7)#825 |
| 90. | Gillette | 40.1% | 19.2%(+20.9)#90 | 11.4%(+28.7)#826 |
| 91. | Goshen | 39.7% | 19.2%(+20.5)#91 | 11.4%(+28.3)#855 |
| 92. | Port Elizabeth | 39.6% | 19.2%(+20.4)#92 | 11.4%(+28.2)#865 |
| 93. | Oldwick | 39.5% | 19.2%(+20.3)#93 | 11.4%(+28.1)#871 |
| 94. | New Providence Borough | 39.3% | 19.2%(+20.1)#94 | 11.4%(+27.9)#880 |
| 95. | Pennington Borough | 39.3% | 19.2%(+20.1)#95 | 11.4%(+27.9)#881 |
| 96. | Springdale | 39.2% | 19.2%(+20.0)#96 | 11.4%(+27.8)#887 |
| 97. | Watchung Borough | 39.2% | 19.2%(+20.0)#97 | 11.4%(+27.8)#889 |
| 98. | Monmouth Beach Borough | 39.1% | 19.2%(+19.9)#98 | 11.4%(+27.7)#896 |
| 99. | Pleasantdale | 38.6% | 19.2%(+19.4)#99 | 11.4%(+27.2)#923 |
| 100. | The Hills | 38.4% | 19.2%(+19.2)#100 | 11.4%(+27.0)#933 |
Common Questions
What are the Top 10 Cities with the Highest Percentage of Households with Income Above $200,000 in New Jersey?
Top 10 Cities with the Highest Percentage of Households with Income Above $200,000 in New Jersey are:
#1
100.0%
#2
100.0%
#3
85.0%
#4
79.6%
#5
72.9%
#6
67.9%
#7
65.9%
#8
61.0%
#9
57.2%
#10
56.3%
What city has the Highest Percentage of Households with Income Above $200,000 in New Jersey?
Zarephath has the Highest Percentage of Households with Income Above $200,000 in New Jersey with 100.0%.
What is the Percentage of Households with Income Above $200,000 in the State of New Jersey?
Percentage of Households with Income Above $200,000 in New Jersey is 19.2%.
What is the Percentage of Households with Income Above $200,000 in the United States?
Percentage of Households with Income Above $200,000 in the United States is 11.4%.