Zip Codes with the Highest Percentage of Households with Income Above $200,000 in Lynn, MA
RELATED REPORTS & OPTIONS
Household Income | $200k+
Lynn
Compare Zip Codes
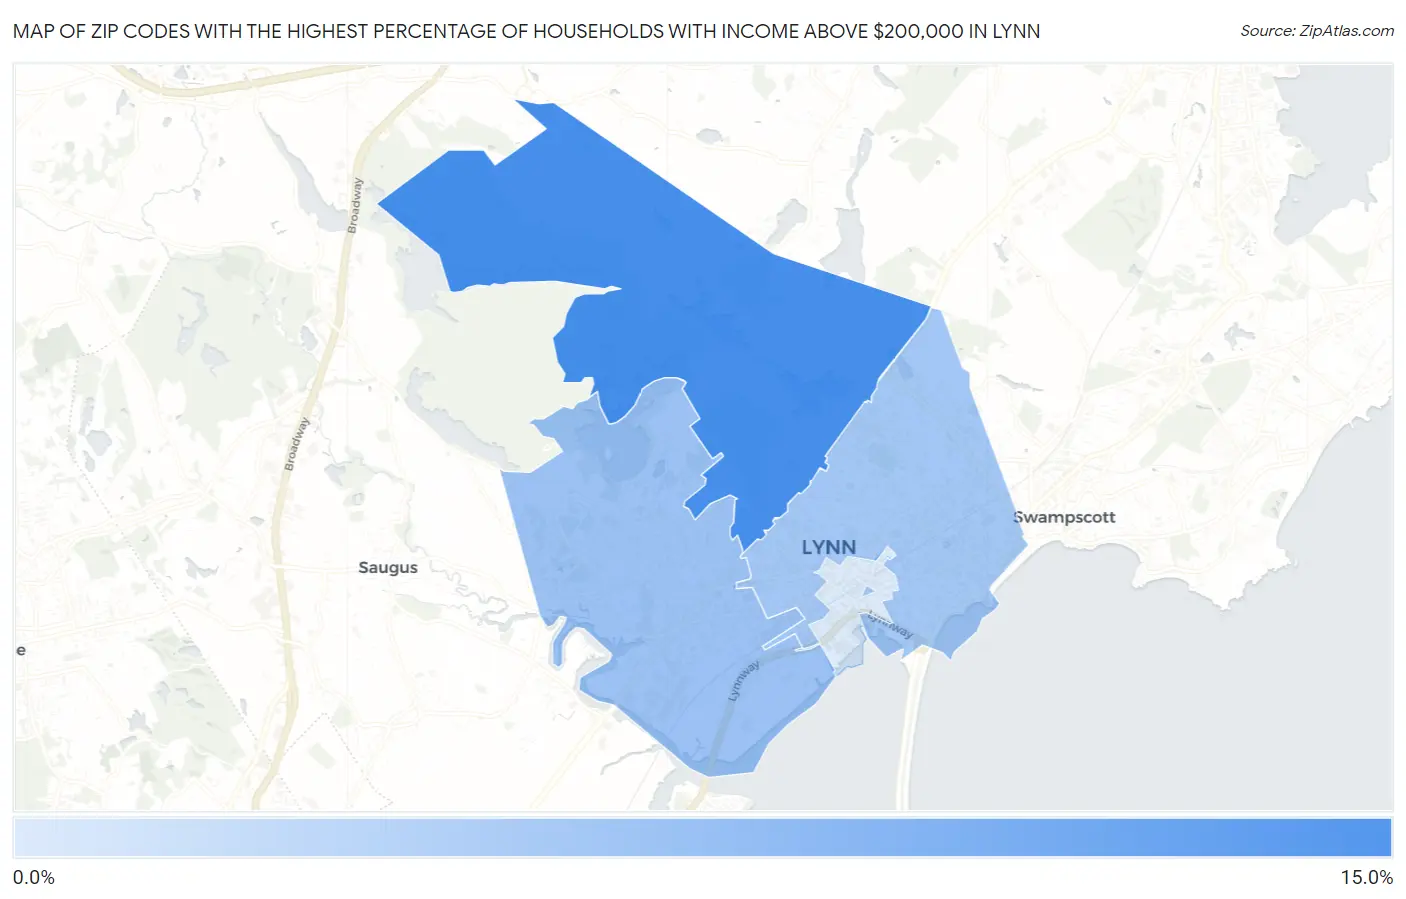
Map of Zip Codes with the Highest Percentage of Households with Income Above $200,000 in Lynn
0.0%
15.0%
Zip Codes with the Highest Percentage of Households with Income Above $200,000 in Lynn, MA
| Zip Code | Households with Income > $200k | vs State | vs National | |
| 1. | 01904 | 14.7% | 19.3%(-4.60)#292 | 11.4%(+3.30)#5,130 |
| 2. | 01905 | 6.5% | 19.3%(-12.8)#440 | 11.4%(-4.90)#12,569 |
| 3. | 01902 | 5.8% | 19.3%(-13.5)#451 | 11.4%(-5.60)#13,823 |
| 4. | 01901 | 0.60% | 19.3%(-18.7)#509 | 11.4%(-10.8)#27,006 |
1
Common Questions
What are the Top 3 Zip Codes with the Highest Percentage of Households with Income Above $200,000 in Lynn, MA?
Top 3 Zip Codes with the Highest Percentage of Households with Income Above $200,000 in Lynn, MA are:
What zip code has the Highest Percentage of Households with Income Above $200,000 in Lynn, MA?
01904 has the Highest Percentage of Households with Income Above $200,000 in Lynn, MA with 14.7%.
What is the Percentage of Households with Income Above $200,000 in Lynn, MA?
Percentage of Households with Income Above $200,000 in Lynn is 7.6%.
What is the Percentage of Households with Income Above $200,000 in Massachusetts?
Percentage of Households with Income Above $200,000 in Massachusetts is 19.3%.
What is the Percentage of Households with Income Above $200,000 in the United States?
Percentage of Households with Income Above $200,000 in the United States is 11.4%.