Cities with the Most Immigrants from Japan in Georgia
RELATED REPORTS & OPTIONS
Japan
Georgia
Compare Cities
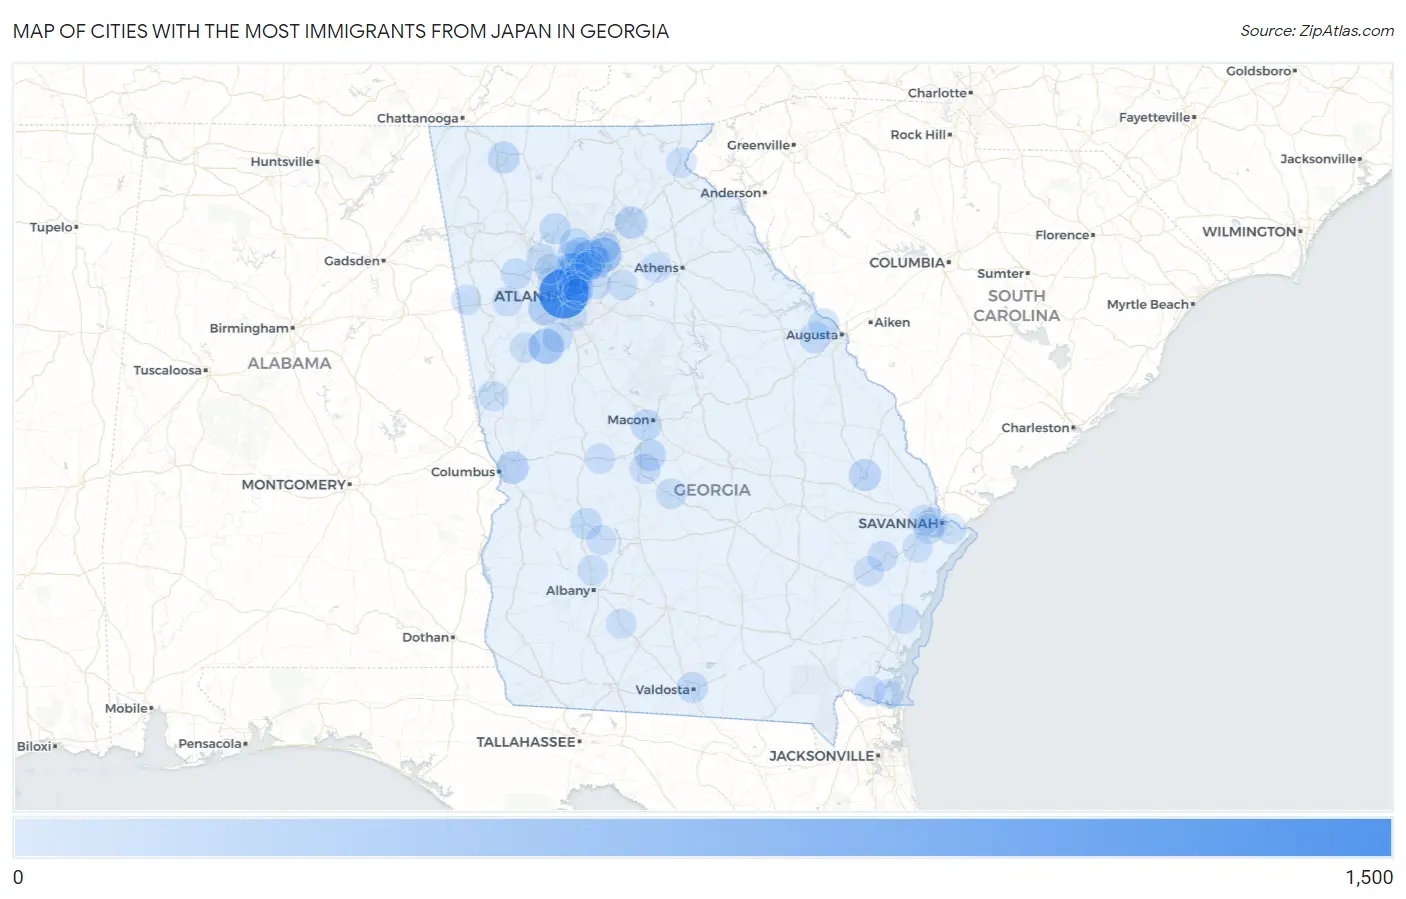
Map of Cities with the Most Immigrants from Japan in Georgia
0
1,500
Cities with the Most Immigrants from Japan in Georgia
| City | Japan | vs State | vs National | |
| 1. | Atlanta | 1,147 | 7,969(14.39%)#1 | 342,380(0.34%)#21 |
| 2. | Johns Creek | 300 | 7,969(3.76%)#2 | 342,380(0.09%)#162 |
| 3. | Suwanee | 299 | 7,969(3.75%)#3 | 342,380(0.09%)#164 |
| 4. | Peachtree City | 289 | 7,969(3.63%)#4 | 342,380(0.08%)#174 |
| 5. | Dunwoody | 282 | 7,969(3.54%)#5 | 342,380(0.08%)#180 |
| 6. | Sandy Springs | 228 | 7,969(2.86%)#6 | 342,380(0.07%)#237 |
| 7. | South Fulton | 192 | 7,969(2.41%)#7 | 342,380(0.06%)#281 |
| 8. | Brookhaven | 188 | 7,969(2.36%)#8 | 342,380(0.05%)#291 |
| 9. | Columbus | 148 | 7,969(1.86%)#9 | 342,380(0.04%)#377 |
| 10. | Duluth | 139 | 7,969(1.74%)#10 | 342,380(0.04%)#400 |
| 11. | Gainesville | 129 | 7,969(1.62%)#11 | 342,380(0.04%)#427 |
| 12. | Statesboro | 108 | 7,969(1.36%)#12 | 342,380(0.03%)#505 |
| 13. | Dalton | 105 | 7,969(1.32%)#13 | 342,380(0.03%)#519 |
| 14. | Warner Robins | 93 | 7,969(1.17%)#14 | 342,380(0.03%)#574 |
| 15. | Americus | 86 | 7,969(1.08%)#15 | 342,380(0.03%)#618 |
| 16. | Macon Bibb County | 75 | 7,969(0.94%)#16 | 342,380(0.02%)#682 |
| 17. | Roswell | 73 | 7,969(0.92%)#17 | 342,380(0.02%)#694 |
| 18. | Canton | 73 | 7,969(0.92%)#18 | 342,380(0.02%)#697 |
| 19. | Grovetown | 73 | 7,969(0.92%)#19 | 342,380(0.02%)#699 |
| 20. | Milton | 66 | 7,969(0.83%)#20 | 342,380(0.02%)#756 |
| 21. | Alpharetta | 64 | 7,969(0.80%)#21 | 342,380(0.02%)#773 |
| 22. | Peachtree Corners | 59 | 7,969(0.74%)#22 | 342,380(0.02%)#817 |
| 23. | Augusta-Richmond County Consolidated Government (Balance) | 56 | 7,969(0.70%)#23 | 342,380(0.02%)#864 |
| 24. | Athens-Clarke County Unified Government (Balance) | 56 | 7,969(0.70%)#24 | 342,380(0.02%)#865 |
| 25. | Valdosta | 51 | 7,969(0.64%)#25 | 342,380(0.01%)#932 |
| 26. | Chamblee | 49 | 7,969(0.61%)#26 | 342,380(0.01%)#963 |
| 27. | Dallas | 49 | 7,969(0.61%)#27 | 342,380(0.01%)#966 |
| 28. | Evans | 46 | 7,969(0.58%)#28 | 342,380(0.01%)#1,007 |
| 29. | Perry | 46 | 7,969(0.58%)#29 | 342,380(0.01%)#1,012 |
| 30. | Sugar Hill | 45 | 7,969(0.56%)#30 | 342,380(0.01%)#1,031 |
| 31. | North Druid Hills | 45 | 7,969(0.56%)#31 | 342,380(0.01%)#1,034 |
| 32. | Druid Hills | 43 | 7,969(0.54%)#32 | 342,380(0.01%)#1,065 |
| 33. | Hinesville | 41 | 7,969(0.51%)#33 | 342,380(0.01%)#1,089 |
| 34. | Bemiss | 41 | 7,969(0.51%)#34 | 342,380(0.01%)#1,100 |
| 35. | Hawkinsville | 31 | 7,969(0.39%)#35 | 342,380(0.01%)#1,336 |
| 36. | Newnan | 27 | 7,969(0.34%)#36 | 342,380(0.01%)#1,444 |
| 37. | Garden City | 27 | 7,969(0.34%)#37 | 342,380(0.01%)#1,458 |
| 38. | Reynolds | 24 | 7,969(0.30%)#38 | 342,380(0.01%)#1,588 |
| 39. | Smyrna | 23 | 7,969(0.29%)#39 | 342,380(0.01%)#1,595 |
| 40. | Loganville | 22 | 7,969(0.28%)#40 | 342,380(0.01%)#1,659 |
| 41. | Kennesaw | 21 | 7,969(0.26%)#41 | 342,380(0.01%)#1,686 |
| 42. | Mountain Park | 21 | 7,969(0.26%)#42 | 342,380(0.01%)#1,708 |
| 43. | Pooler | 19 | 7,969(0.24%)#43 | 342,380(0.01%)#1,796 |
| 44. | Fayetteville | 19 | 7,969(0.24%)#44 | 342,380(0.01%)#1,803 |
| 45. | Leesburg | 17 | 7,969(0.21%)#45 | 342,380(0.00%)#1,942 |
| 46. | Decatur | 14 | 7,969(0.18%)#46 | 342,380(0.00%)#2,109 |
| 47. | Lagrange | 13 | 7,969(0.16%)#47 | 342,380(0.00%)#2,178 |
| 48. | Kingsland | 12 | 7,969(0.15%)#48 | 342,380(0.00%)#2,290 |
| 49. | North Decatur | 11 | 7,969(0.14%)#49 | 342,380(0.00%)#2,388 |
| 50. | Savannah | 10 | 7,969(0.13%)#50 | 342,380(0.00%)#2,453 |
| 51. | Tallapoosa | 10 | 7,969(0.13%)#51 | 342,380(0.00%)#2,547 |
| 52. | Whitemarsh Island | 8 | 7,969(0.10%)#52 | 342,380(0.00%)#2,732 |
| 53. | Kings Bay Base | 8 | 7,969(0.10%)#53 | 342,380(0.00%)#2,764 |
| 54. | Darien | 7 | 7,969(0.09%)#54 | 342,380(0.00%)#2,895 |
| 55. | Richmond Hill | 6 | 7,969(0.08%)#55 | 342,380(0.00%)#2,925 |
| 56. | Berkeley Lake | 6 | 7,969(0.08%)#56 | 342,380(0.00%)#2,987 |
| 57. | Marietta | 5 | 7,969(0.06%)#57 | 342,380(0.00%)#3,020 |
| 58. | Villa Rica | 5 | 7,969(0.06%)#58 | 342,380(0.00%)#3,036 |
| 59. | Ludowici | 5 | 7,969(0.06%)#59 | 342,380(0.00%)#3,071 |
| 60. | Tallulah Falls | 5 | 7,969(0.06%)#60 | 342,380(0.00%)#3,115 |
| 61. | Lake City | 3 | 7,969(0.04%)#61 | 342,380(0.00%)#3,278 |
| 62. | Statham | 3 | 7,969(0.04%)#62 | 342,380(0.00%)#3,279 |
| 63. | Doerun | 2 | 7,969(0.03%)#63 | 342,380(0.00%)#3,413 |
| 64. | Leslie | 1 | 7,969(0.01%)#64 | 342,380(0.00%)#3,530 |
Common Questions
What are the Top 10 Cities with the Most Immigrants from Japan in Georgia?
Top 10 Cities with the Most Immigrants from Japan in Georgia are:
#1
1,147
#2
300
#3
299
#4
289
#5
282
#6
228
#7
192
#8
188
#9
148
#10
139
What city has the Most Immigrants from Japan in Georgia?
Atlanta has the Most Immigrants from Japan in Georgia with 1,147.
What is the Total Immigrants from Japan in the State of Georgia?
Total Immigrants from Japan in Georgia is 7,969.
What is the Total Immigrants from Japan in the United States?
Total Immigrants from Japan in the United States is 342,380.