Cities with the Most Immigrants from Japan in Kansas
RELATED REPORTS & OPTIONS
Japan
Kansas
Compare Cities
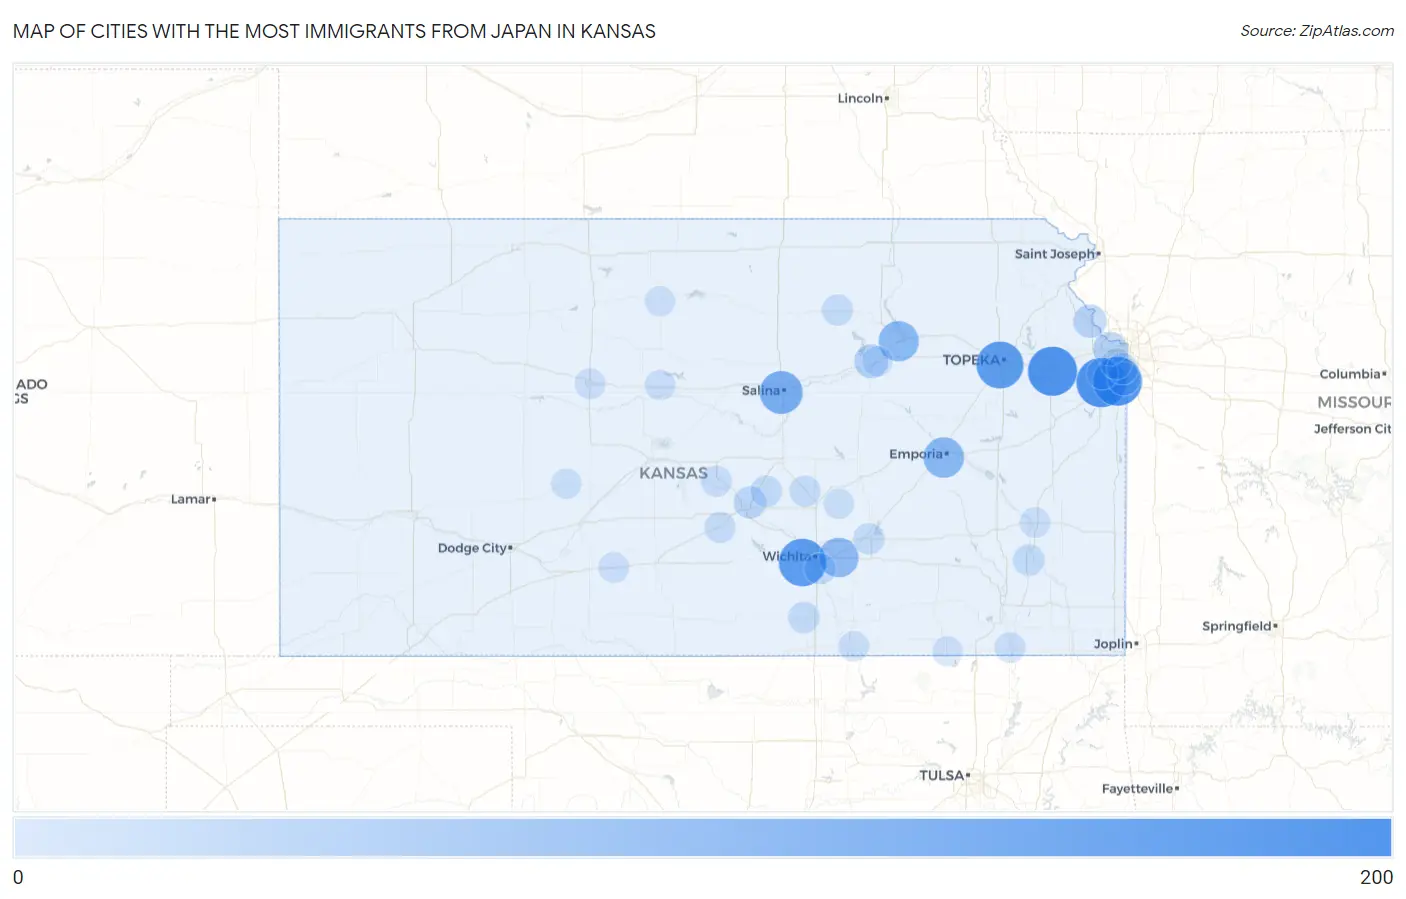
Map of Cities with the Most Immigrants from Japan in Kansas
0
200
Cities with the Most Immigrants from Japan in Kansas
| City | Japan | vs State | vs National | |
| 1. | Olathe | 174 | 1,520(11.45%)#1 | 342,380(0.05%)#317 |
| 2. | Lawrence | 171 | 1,520(11.25%)#2 | 342,380(0.05%)#327 |
| 3. | Overland Park | 169 | 1,520(11.12%)#3 | 342,380(0.05%)#332 |
| 4. | Wichita | 154 | 1,520(10.13%)#4 | 342,380(0.04%)#362 |
| 5. | Topeka | 150 | 1,520(9.87%)#5 | 342,380(0.04%)#370 |
| 6. | Salina | 113 | 1,520(7.43%)#6 | 342,380(0.03%)#476 |
| 7. | Emporia | 91 | 1,520(5.99%)#7 | 342,380(0.03%)#590 |
| 8. | Manhattan | 88 | 1,520(5.79%)#8 | 342,380(0.03%)#605 |
| 9. | Andover | 83 | 1,520(5.46%)#9 | 342,380(0.02%)#639 |
| 10. | Junction City | 32 | 1,520(2.11%)#10 | 342,380(0.01%)#1,290 |
| 11. | Kansas City | 30 | 1,520(1.97%)#11 | 342,380(0.01%)#1,340 |
| 12. | Leavenworth | 27 | 1,520(1.78%)#12 | 342,380(0.01%)#1,446 |
| 13. | Leawood | 26 | 1,520(1.71%)#13 | 342,380(0.01%)#1,479 |
| 14. | Hutchinson | 20 | 1,520(1.32%)#14 | 342,380(0.01%)#1,744 |
| 15. | Buhler | 13 | 1,520(0.86%)#15 | 342,380(0.00%)#2,247 |
| 16. | Chanute | 12 | 1,520(0.79%)#16 | 342,380(0.00%)#2,321 |
| 17. | Lenexa | 11 | 1,520(0.72%)#17 | 342,380(0.00%)#2,365 |
| 18. | Wellington | 11 | 1,520(0.72%)#18 | 342,380(0.00%)#2,412 |
| 19. | Oaklawn Sunview | 11 | 1,520(0.72%)#19 | 342,380(0.00%)#2,434 |
| 20. | Prairie Village | 10 | 1,520(0.66%)#20 | 342,380(0.00%)#2,482 |
| 21. | El Dorado | 10 | 1,520(0.66%)#21 | 342,380(0.00%)#2,501 |
| 22. | Clay Center | 9 | 1,520(0.59%)#22 | 342,380(0.00%)#2,645 |
| 23. | Hesston | 9 | 1,520(0.59%)#23 | 342,380(0.00%)#2,647 |
| 24. | Arlington | 8 | 1,520(0.53%)#24 | 342,380(0.00%)#2,778 |
| 25. | Merriam | 6 | 1,520(0.39%)#25 | 342,380(0.00%)#2,940 |
| 26. | Sterling | 6 | 1,520(0.39%)#26 | 342,380(0.00%)#2,988 |
| 27. | Hays | 4 | 1,520(0.26%)#27 | 342,380(0.00%)#3,145 |
| 28. | Haviland | 4 | 1,520(0.26%)#28 | 342,380(0.00%)#3,224 |
| 29. | Coffeyville | 3 | 1,520(0.20%)#29 | 342,380(0.00%)#3,257 |
| 30. | Iola | 3 | 1,520(0.20%)#30 | 342,380(0.00%)#3,265 |
| 31. | Grandview Plaza | 3 | 1,520(0.20%)#31 | 342,380(0.00%)#3,298 |
| 32. | Parkerfield | 2 | 1,520(0.13%)#32 | 342,380(0.00%)#3,422 |
| 33. | Burdett | 2 | 1,520(0.13%)#33 | 342,380(0.00%)#3,434 |
| 34. | Elbing | 2 | 1,520(0.13%)#34 | 342,380(0.00%)#3,438 |
| 35. | Bunker Hill | 2 | 1,520(0.13%)#35 | 342,380(0.00%)#3,445 |
| 36. | Osborne | 1 | 1,520(0.07%)#36 | 342,380(0.00%)#3,502 |
| 37. | Chautauqua | 1 | 1,520(0.07%)#37 | 342,380(0.00%)#3,555 |
Common Questions
What are the Top 10 Cities with the Most Immigrants from Japan in Kansas?
Top 10 Cities with the Most Immigrants from Japan in Kansas are:
#1
174
#2
171
#3
169
#4
154
#5
150
#6
113
#7
91
#8
88
#9
83
#10
32
What city has the Most Immigrants from Japan in Kansas?
Olathe has the Most Immigrants from Japan in Kansas with 174.
What is the Total Immigrants from Japan in the State of Kansas?
Total Immigrants from Japan in Kansas is 1,520.
What is the Total Immigrants from Japan in the United States?
Total Immigrants from Japan in the United States is 342,380.