Cities with the Most Immigrants from Africa in Delaware
RELATED REPORTS & OPTIONS
Africa
Delaware
Compare Cities
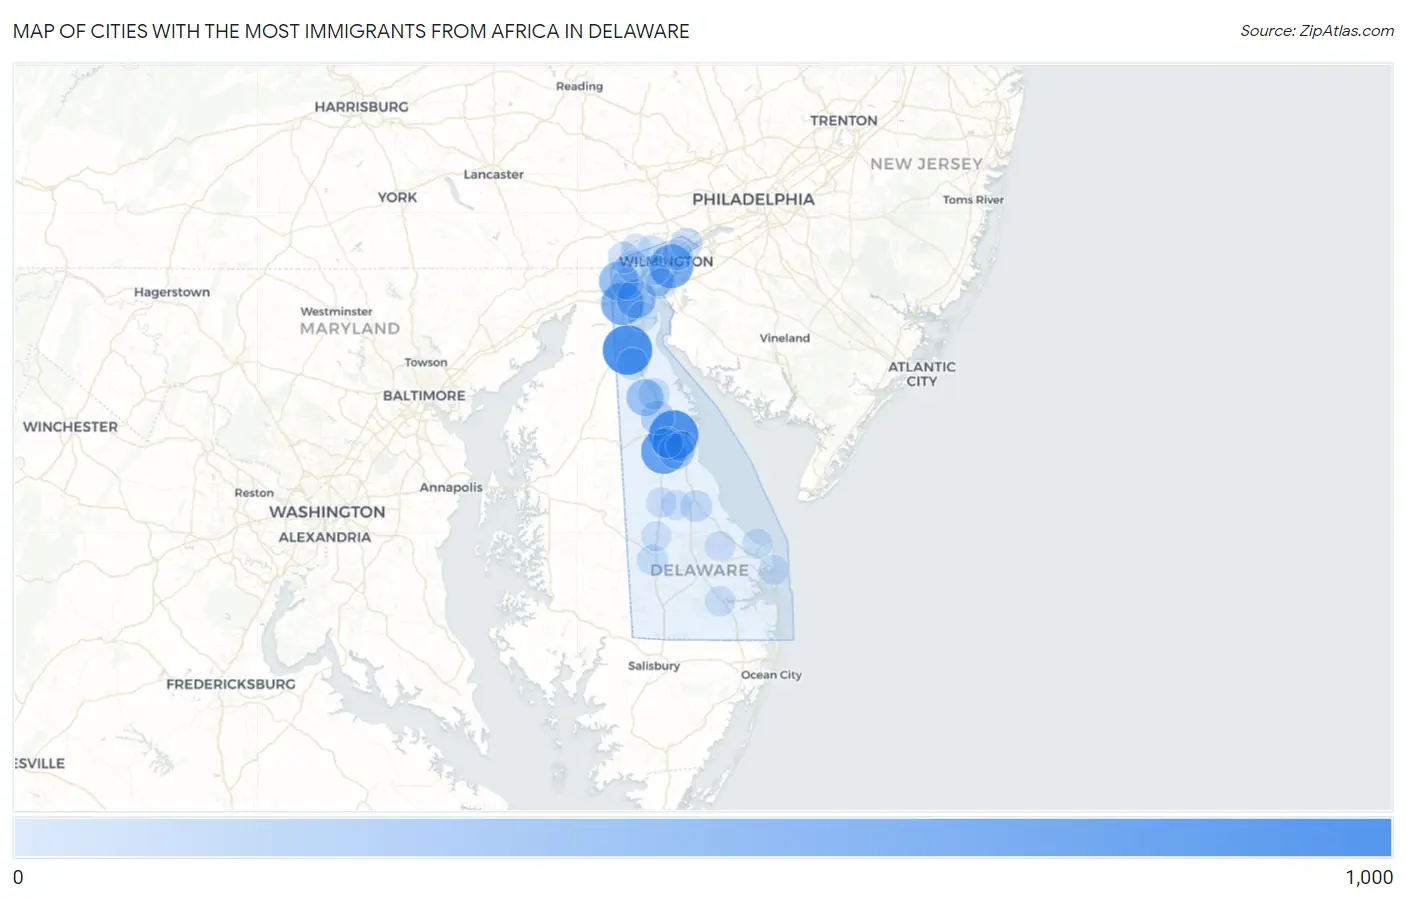
Map of Cities with the Most Immigrants from Africa in Delaware
0
1,000
Cities with the Most Immigrants from Africa in Delaware
| City | Africa | vs State | vs National | |
| 1. | Middletown | 801 | 12,342(6.49%)#1 | 2,580,172(0.03%)#496 |
| 2. | Dover | 791 | 12,342(6.41%)#2 | 2,580,172(0.03%)#505 |
| 3. | Camden | 626 | 12,342(5.07%)#3 | 2,580,172(0.02%)#618 |
| 4. | Wilmington | 566 | 12,342(4.59%)#4 | 2,580,172(0.02%)#675 |
| 5. | Glasgow | 512 | 12,342(4.15%)#5 | 2,580,172(0.02%)#722 |
| 6. | Newark | 379 | 12,342(3.07%)#6 | 2,580,172(0.01%)#931 |
| 7. | Bear | 373 | 12,342(3.02%)#7 | 2,580,172(0.01%)#945 |
| 8. | Clayton | 276 | 12,342(2.24%)#8 | 2,580,172(0.01%)#1,178 |
| 9. | Rising Sun Lebanon | 223 | 12,342(1.81%)#9 | 2,580,172(0.01%)#1,377 |
| 10. | Cheswold | 143 | 12,342(1.16%)#10 | 2,580,172(0.01%)#1,816 |
| 11. | Wilmington Manor | 96 | 12,342(0.78%)#11 | 2,580,172(0.00%)#2,288 |
| 12. | Brookside | 85 | 12,342(0.69%)#12 | 2,580,172(0.00%)#2,422 |
| 13. | Pike Creek Valley | 72 | 12,342(0.58%)#13 | 2,580,172(0.00%)#2,635 |
| 14. | Claymont | 70 | 12,342(0.57%)#14 | 2,580,172(0.00%)#2,674 |
| 15. | Townsend | 68 | 12,342(0.55%)#15 | 2,580,172(0.00%)#2,728 |
| 16. | Milford | 63 | 12,342(0.51%)#16 | 2,580,172(0.00%)#2,821 |
| 17. | North Star | 61 | 12,342(0.49%)#17 | 2,580,172(0.00%)#2,871 |
| 18. | Smyrna | 59 | 12,342(0.48%)#18 | 2,580,172(0.00%)#2,910 |
| 19. | Greenville | 39 | 12,342(0.32%)#19 | 2,580,172(0.00%)#3,492 |
| 20. | Bridgeville | 37 | 12,342(0.30%)#20 | 2,580,172(0.00%)#3,570 |
| 21. | Bellefonte | 34 | 12,342(0.28%)#21 | 2,580,172(0.00%)#3,692 |
| 22. | Rodney Village | 30 | 12,342(0.24%)#22 | 2,580,172(0.00%)#3,853 |
| 23. | New Castle | 29 | 12,342(0.23%)#23 | 2,580,172(0.00%)#3,887 |
| 24. | Hockessin | 16 | 12,342(0.13%)#24 | 2,580,172(0.00%)#4,664 |
| 25. | Harrington | 15 | 12,342(0.12%)#25 | 2,580,172(0.00%)#4,810 |
| 26. | Millsboro | 12 | 12,342(0.10%)#26 | 2,580,172(0.00%)#5,081 |
| 27. | Milton | 12 | 12,342(0.10%)#27 | 2,580,172(0.00%)#5,111 |
| 28. | Lewes | 10 | 12,342(0.08%)#28 | 2,580,172(0.00%)#5,309 |
| 29. | St Georges | 10 | 12,342(0.08%)#29 | 2,580,172(0.00%)#5,339 |
| 30. | Dover Base Housing | 7 | 12,342(0.06%)#30 | 2,580,172(0.00%)#5,671 |
| 31. | Newport | 4 | 12,342(0.03%)#31 | 2,580,172(0.00%)#6,185 |
| 32. | Greenwood | 3 | 12,342(0.02%)#32 | 2,580,172(0.00%)#6,330 |
| 33. | Houston | 3 | 12,342(0.02%)#33 | 2,580,172(0.00%)#6,400 |
| 34. | Dewey Beach | 2 | 12,342(0.02%)#34 | 2,580,172(0.00%)#6,590 |
1
Common Questions
What are the Top 10 Cities with the Most Immigrants from Africa in Delaware?
Top 10 Cities with the Most Immigrants from Africa in Delaware are:
#1
801
#2
791
#3
626
#4
566
#5
512
#6
379
#7
373
#8
276
#9
223
#10
143
What city has the Most Immigrants from Africa in Delaware?
Middletown has the Most Immigrants from Africa in Delaware with 801.
What is the Total Immigrants from Africa in the State of Delaware?
Total Immigrants from Africa in Delaware is 12,342.
What is the Total Immigrants from Africa in the United States?
Total Immigrants from Africa in the United States is 2,580,172.