Cities with the Most Immigrants from Africa in New Jersey
RELATED REPORTS & OPTIONS
Africa
New Jersey
Compare Cities
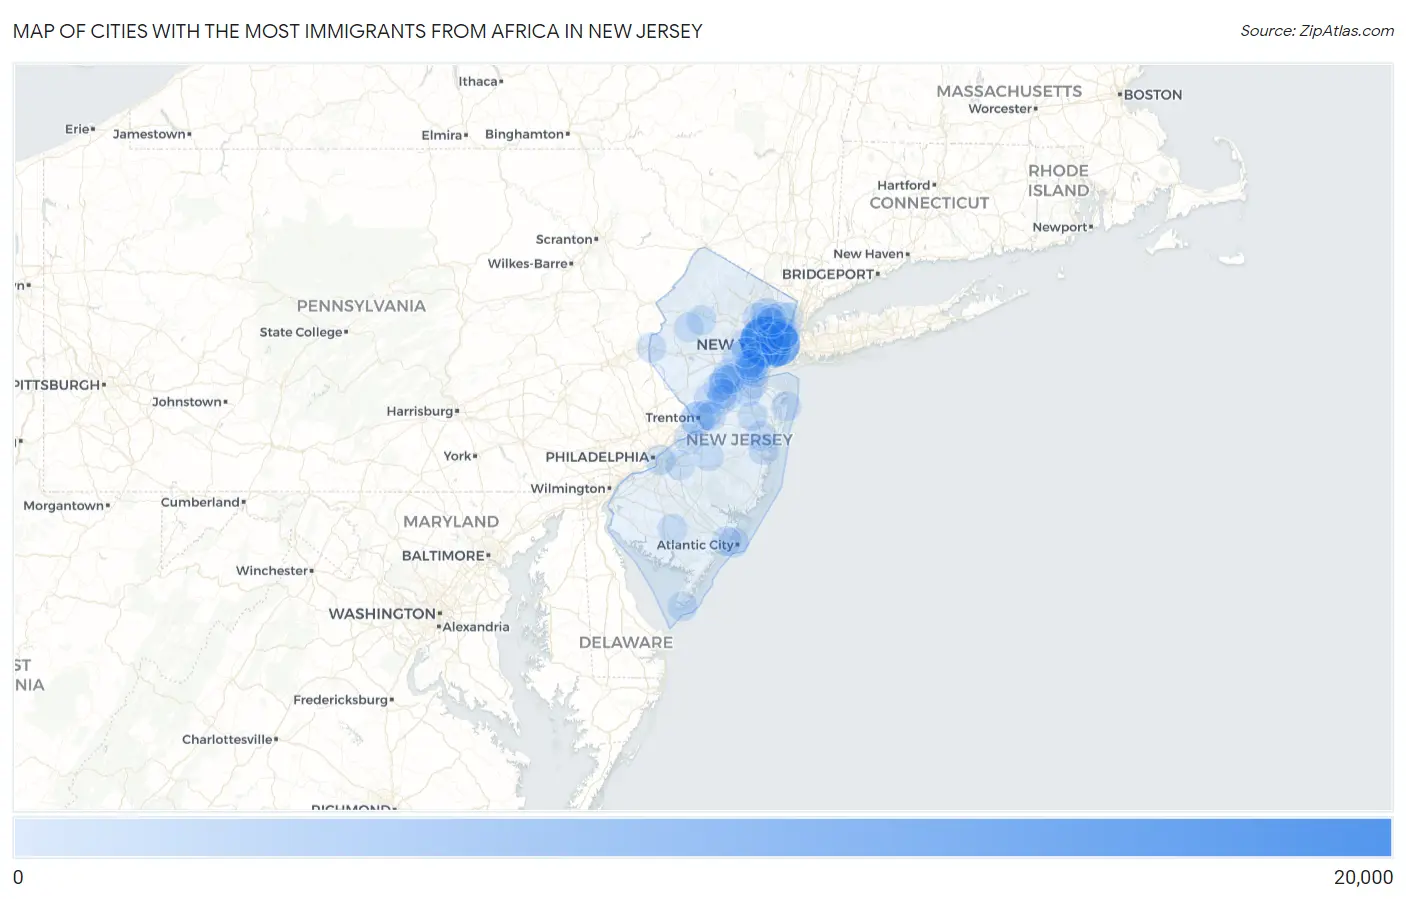
Map of Cities with the Most Immigrants from Africa in New Jersey
0
20,000
Cities with the Most Immigrants from Africa in New Jersey
| City | Africa | vs State | vs National | |
| 1. | Newark | 17,039 | 131,068(13.00%)#1 | 2,580,172(0.66%)#13 |
| 2. | Jersey City | 12,768 | 131,068(9.74%)#2 | 2,580,172(0.49%)#23 |
| 3. | Bayonne | 4,838 | 131,068(3.69%)#3 | 2,580,172(0.19%)#61 |
| 4. | East Orange | 3,506 | 131,068(2.67%)#4 | 2,580,172(0.14%)#86 |
| 5. | Trenton | 3,317 | 131,068(2.53%)#5 | 2,580,172(0.13%)#90 |
| 6. | Sayreville Borough | 2,300 | 131,068(1.75%)#6 | 2,580,172(0.09%)#147 |
| 7. | Elizabeth | 2,285 | 131,068(1.74%)#7 | 2,580,172(0.09%)#149 |
| 8. | Paterson | 1,506 | 131,068(1.15%)#8 | 2,580,172(0.06%)#253 |
| 9. | Clifton | 1,243 | 131,068(0.95%)#9 | 2,580,172(0.05%)#323 |
| 10. | Hackensack | 1,073 | 131,068(0.82%)#10 | 2,580,172(0.04%)#378 |
| 11. | Lodi Borough | 903 | 131,068(0.69%)#11 | 2,580,172(0.03%)#444 |
| 12. | Sicklerville | 890 | 131,068(0.68%)#12 | 2,580,172(0.03%)#450 |
| 13. | Franklin Park | 682 | 131,068(0.52%)#13 | 2,580,172(0.03%)#573 |
| 14. | Kearny | 649 | 131,068(0.50%)#14 | 2,580,172(0.03%)#599 |
| 15. | Somerset | 646 | 131,068(0.49%)#15 | 2,580,172(0.03%)#601 |
| 16. | Fords | 644 | 131,068(0.49%)#16 | 2,580,172(0.02%)#603 |
| 17. | Madison Park | 621 | 131,068(0.47%)#17 | 2,580,172(0.02%)#626 |
| 18. | Linden | 593 | 131,068(0.45%)#18 | 2,580,172(0.02%)#651 |
| 19. | North Plainfield Borough | 579 | 131,068(0.44%)#19 | 2,580,172(0.02%)#666 |
| 20. | Vauxhall | 579 | 131,068(0.44%)#20 | 2,580,172(0.02%)#667 |
| 21. | Union Beach Borough | 576 | 131,068(0.44%)#21 | 2,580,172(0.02%)#671 |
| 22. | Plainfield | 547 | 131,068(0.42%)#22 | 2,580,172(0.02%)#693 |
| 23. | Secaucus | 525 | 131,068(0.40%)#23 | 2,580,172(0.02%)#705 |
| 24. | Roselle Borough | 513 | 131,068(0.39%)#24 | 2,580,172(0.02%)#719 |
| 25. | Camden | 509 | 131,068(0.39%)#25 | 2,580,172(0.02%)#725 |
| 26. | Old Bridge | 481 | 131,068(0.37%)#26 | 2,580,172(0.02%)#757 |
| 27. | Tinton Falls Borough | 480 | 131,068(0.37%)#27 | 2,580,172(0.02%)#761 |
| 28. | New Brunswick | 470 | 131,068(0.36%)#28 | 2,580,172(0.02%)#776 |
| 29. | Hoboken | 462 | 131,068(0.35%)#29 | 2,580,172(0.02%)#786 |
| 30. | Union City | 444 | 131,068(0.34%)#30 | 2,580,172(0.02%)#817 |
| 31. | Milltown Borough | 438 | 131,068(0.33%)#31 | 2,580,172(0.02%)#826 |
| 32. | Parsippany | 437 | 131,068(0.33%)#32 | 2,580,172(0.02%)#830 |
| 33. | Toms River | 436 | 131,068(0.33%)#33 | 2,580,172(0.02%)#831 |
| 34. | Avenel | 436 | 131,068(0.33%)#34 | 2,580,172(0.02%)#833 |
| 35. | Atlantic City | 429 | 131,068(0.33%)#35 | 2,580,172(0.02%)#842 |
| 36. | Edgewater Borough | 407 | 131,068(0.31%)#36 | 2,580,172(0.02%)#878 |
| 37. | Carteret Borough | 398 | 131,068(0.30%)#37 | 2,580,172(0.02%)#893 |
| 38. | Lindenwold Borough | 368 | 131,068(0.28%)#38 | 2,580,172(0.01%)#956 |
| 39. | Woodbridge | 360 | 131,068(0.27%)#39 | 2,580,172(0.01%)#973 |
| 40. | Princeton | 342 | 131,068(0.26%)#40 | 2,580,172(0.01%)#1,013 |
| 41. | Cliffside Park Borough | 336 | 131,068(0.26%)#41 | 2,580,172(0.01%)#1,031 |
| 42. | Englewood | 333 | 131,068(0.25%)#42 | 2,580,172(0.01%)#1,036 |
| 43. | Preakness | 325 | 131,068(0.25%)#43 | 2,580,172(0.01%)#1,061 |
| 44. | Vineland | 321 | 131,068(0.24%)#44 | 2,580,172(0.01%)#1,069 |
| 45. | Bergenfield Borough | 320 | 131,068(0.24%)#45 | 2,580,172(0.01%)#1,072 |
| 46. | West New York | 314 | 131,068(0.24%)#46 | 2,580,172(0.01%)#1,084 |
| 47. | Burlington | 311 | 131,068(0.24%)#47 | 2,580,172(0.01%)#1,097 |
| 48. | Dayton | 294 | 131,068(0.22%)#48 | 2,580,172(0.01%)#1,138 |
| 49. | Lakewood | 292 | 131,068(0.22%)#49 | 2,580,172(0.01%)#1,142 |
| 50. | Hillsborough | 290 | 131,068(0.22%)#50 | 2,580,172(0.01%)#1,146 |
| 51. | Middlesex Borough | 289 | 131,068(0.22%)#51 | 2,580,172(0.01%)#1,154 |
| 52. | Woodland Park Borough | 285 | 131,068(0.22%)#52 | 2,580,172(0.01%)#1,162 |
| 53. | South River Borough | 267 | 131,068(0.20%)#53 | 2,580,172(0.01%)#1,201 |
| 54. | Fair Lawn Borough | 266 | 131,068(0.20%)#54 | 2,580,172(0.01%)#1,202 |
| 55. | Budd Lake | 261 | 131,068(0.20%)#55 | 2,580,172(0.01%)#1,224 |
| 56. | Fort Lee Borough | 260 | 131,068(0.20%)#56 | 2,580,172(0.01%)#1,226 |
| 57. | Six Mile Run | 257 | 131,068(0.20%)#57 | 2,580,172(0.01%)#1,242 |
| 58. | Harrison | 254 | 131,068(0.19%)#58 | 2,580,172(0.01%)#1,257 |
| 59. | Perth Amboy | 246 | 131,068(0.19%)#59 | 2,580,172(0.01%)#1,279 |
| 60. | Princeton Meadows | 246 | 131,068(0.19%)#60 | 2,580,172(0.01%)#1,284 |
| 61. | North Arlington Borough | 242 | 131,068(0.18%)#61 | 2,580,172(0.01%)#1,296 |
| 62. | Highland Park Borough | 239 | 131,068(0.18%)#62 | 2,580,172(0.01%)#1,305 |
| 63. | Garfield | 238 | 131,068(0.18%)#63 | 2,580,172(0.01%)#1,309 |
| 64. | Fairview Borough | 236 | 131,068(0.18%)#64 | 2,580,172(0.01%)#1,317 |
| 65. | Colonia | 221 | 131,068(0.17%)#65 | 2,580,172(0.01%)#1,387 |
| 66. | Collingswood Borough | 216 | 131,068(0.16%)#66 | 2,580,172(0.01%)#1,408 |
| 67. | Phillipsburg | 214 | 131,068(0.16%)#67 | 2,580,172(0.01%)#1,415 |
| 68. | Watsessing | 214 | 131,068(0.16%)#68 | 2,580,172(0.01%)#1,416 |
| 69. | Tenafly Borough | 213 | 131,068(0.16%)#69 | 2,580,172(0.01%)#1,419 |
| 70. | Roselle Park Borough | 211 | 131,068(0.16%)#70 | 2,580,172(0.01%)#1,428 |
| 71. | Singac | 209 | 131,068(0.16%)#71 | 2,580,172(0.01%)#1,439 |
| 72. | Voorhees | 204 | 131,068(0.16%)#72 | 2,580,172(0.01%)#1,455 |
| 73. | Summit | 195 | 131,068(0.15%)#73 | 2,580,172(0.01%)#1,494 |
| 74. | Mercerville | 191 | 131,068(0.15%)#74 | 2,580,172(0.01%)#1,520 |
| 75. | West Freehold | 187 | 131,068(0.14%)#75 | 2,580,172(0.01%)#1,541 |
| 76. | Cape May | 179 | 131,068(0.14%)#76 | 2,580,172(0.01%)#1,583 |
| 77. | Passaic | 172 | 131,068(0.13%)#77 | 2,580,172(0.01%)#1,607 |
| 78. | North Caldwell Borough | 170 | 131,068(0.13%)#78 | 2,580,172(0.01%)#1,615 |
| 79. | Little Ferry Borough | 166 | 131,068(0.13%)#79 | 2,580,172(0.01%)#1,636 |
| 80. | Ampere North | 165 | 131,068(0.13%)#80 | 2,580,172(0.01%)#1,652 |
| 81. | Long Branch | 164 | 131,068(0.13%)#81 | 2,580,172(0.01%)#1,656 |
| 82. | Pleasantville | 164 | 131,068(0.13%)#82 | 2,580,172(0.01%)#1,659 |
| 83. | Iselin | 163 | 131,068(0.12%)#83 | 2,580,172(0.01%)#1,671 |
| 84. | Hamilton Square | 159 | 131,068(0.12%)#84 | 2,580,172(0.01%)#1,706 |
| 85. | Paramus Borough | 156 | 131,068(0.12%)#85 | 2,580,172(0.01%)#1,725 |
| 86. | New Milford Borough | 155 | 131,068(0.12%)#86 | 2,580,172(0.01%)#1,737 |
| 87. | Monmouth Junction | 150 | 131,068(0.11%)#87 | 2,580,172(0.01%)#1,766 |
| 88. | Franklin Lakes Borough | 149 | 131,068(0.11%)#88 | 2,580,172(0.01%)#1,770 |
| 89. | Pompton Plains | 149 | 131,068(0.11%)#89 | 2,580,172(0.01%)#1,771 |
| 90. | Bargaintown | 148 | 131,068(0.11%)#90 | 2,580,172(0.01%)#1,782 |
| 91. | Pemberton Heights | 145 | 131,068(0.11%)#91 | 2,580,172(0.01%)#1,800 |
| 92. | South Plainfield Borough | 142 | 131,068(0.11%)#92 | 2,580,172(0.01%)#1,823 |
| 93. | Marlton | 142 | 131,068(0.11%)#93 | 2,580,172(0.01%)#1,825 |
| 94. | Ten Mile Run | 141 | 131,068(0.11%)#94 | 2,580,172(0.01%)#1,842 |
| 95. | Hightstown Borough | 140 | 131,068(0.11%)#95 | 2,580,172(0.01%)#1,848 |
| 96. | Montvale Borough | 138 | 131,068(0.11%)#96 | 2,580,172(0.01%)#1,862 |
| 97. | Mount Arlington Borough | 136 | 131,068(0.10%)#97 | 2,580,172(0.01%)#1,879 |
| 98. | Beattystown | 136 | 131,068(0.10%)#98 | 2,580,172(0.01%)#1,880 |
| 99. | Glassboro Borough | 133 | 131,068(0.10%)#99 | 2,580,172(0.01%)#1,906 |
| 100. | Westfield | 121 | 131,068(0.09%)#100 | 2,580,172(0.00%)#2,000 |
Common Questions
What are the Top 10 Cities with the Most Immigrants from Africa in New Jersey?
Top 10 Cities with the Most Immigrants from Africa in New Jersey are:
#1
17,039
#2
12,768
#3
4,838
#4
3,506
#5
3,317
#6
2,285
#7
1,506
#8
1,243
#9
1,073
#10
682
What city has the Most Immigrants from Africa in New Jersey?
Newark has the Most Immigrants from Africa in New Jersey with 17,039.
What is the Total Immigrants from Africa in the State of New Jersey?
Total Immigrants from Africa in New Jersey is 131,068.
What is the Total Immigrants from Africa in the United States?
Total Immigrants from Africa in the United States is 2,580,172.