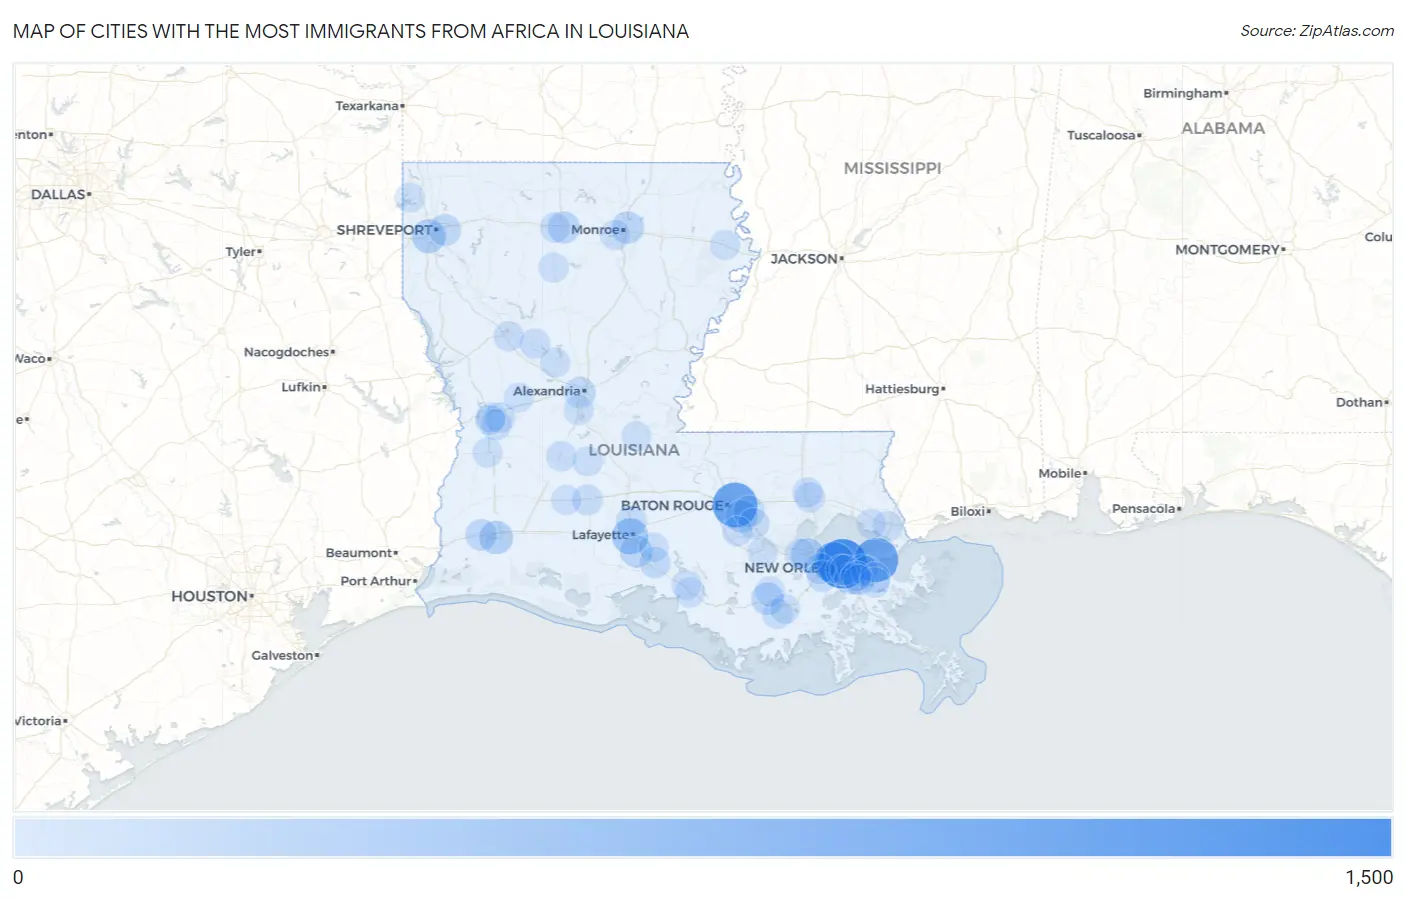
Cities with the Most Immigrants from Africa in Louisiana
RELATED REPORTS & OPTIONS
Africa
Louisiana
Compare Cities
Map of Cities with the Most Immigrants from Africa in Louisiana
0
1,500
Cities with the Most Immigrants from Africa in Louisiana
| City | Africa | vs State | vs National | |
| 1. | Metairie | 1,341 | 9,194(14.59%)#1 | 2,580,172(0.05%)#297 |
| 2. | Baton Rouge | 1,009 | 9,194(10.97%)#2 | 2,580,172(0.04%)#400 |
| 3. | New Orleans | 953 | 9,194(10.37%)#3 | 2,580,172(0.04%)#423 |
| 4. | Kenner | 723 | 9,194(7.86%)#4 | 2,580,172(0.03%)#550 |
| 5. | Lafayette | 402 | 9,194(4.37%)#5 | 2,580,172(0.02%)#886 |
| 6. | Shreveport | 263 | 9,194(2.86%)#6 | 2,580,172(0.01%)#1,212 |
| 7. | Laplace | 233 | 9,194(2.53%)#7 | 2,580,172(0.01%)#1,332 |
| 8. | Lake Charles | 219 | 9,194(2.38%)#8 | 2,580,172(0.01%)#1,395 |
| 9. | Schriever | 163 | 9,194(1.77%)#9 | 2,580,172(0.01%)#1,677 |
| 10. | Village St George | 161 | 9,194(1.75%)#10 | 2,580,172(0.01%)#1,696 |
| 11. | Youngsville | 147 | 9,194(1.60%)#11 | 2,580,172(0.01%)#1,786 |
| 12. | Monroe | 135 | 9,194(1.47%)#12 | 2,580,172(0.01%)#1,884 |
| 13. | Ruston | 134 | 9,194(1.46%)#13 | 2,580,172(0.01%)#1,899 |
| 14. | Bossier City | 120 | 9,194(1.31%)#14 | 2,580,172(0.00%)#2,008 |
| 15. | Sulphur | 110 | 9,194(1.20%)#15 | 2,580,172(0.00%)#2,119 |
| 16. | New Orleans Station | 105 | 9,194(1.14%)#16 | 2,580,172(0.00%)#2,178 |
| 17. | Alexandria | 95 | 9,194(1.03%)#17 | 2,580,172(0.00%)#2,297 |
| 18. | New Iberia | 93 | 9,194(1.01%)#18 | 2,580,172(0.00%)#2,317 |
| 19. | Shenandoah | 90 | 9,194(0.98%)#19 | 2,580,172(0.00%)#2,360 |
| 20. | Marrero | 74 | 9,194(0.80%)#20 | 2,580,172(0.00%)#2,587 |
| 21. | Luling | 72 | 9,194(0.78%)#21 | 2,580,172(0.00%)#2,629 |
| 22. | Prairieville | 71 | 9,194(0.77%)#22 | 2,580,172(0.00%)#2,650 |
| 23. | Arabi | 64 | 9,194(0.70%)#23 | 2,580,172(0.00%)#2,804 |
| 24. | Carencro | 58 | 9,194(0.63%)#24 | 2,580,172(0.00%)#2,938 |
| 25. | Destrehan | 47 | 9,194(0.51%)#25 | 2,580,172(0.00%)#3,205 |
| 26. | Eunice | 46 | 9,194(0.50%)#26 | 2,580,172(0.00%)#3,244 |
| 27. | Harvey | 44 | 9,194(0.48%)#27 | 2,580,172(0.00%)#3,289 |
| 28. | Fort Polk South | 38 | 9,194(0.41%)#28 | 2,580,172(0.00%)#3,514 |
| 29. | Elmwood | 34 | 9,194(0.37%)#29 | 2,580,172(0.00%)#3,680 |
| 30. | Oakdale | 31 | 9,194(0.34%)#30 | 2,580,172(0.00%)#3,797 |
| 31. | Fort Polk North | 28 | 9,194(0.30%)#31 | 2,580,172(0.00%)#3,951 |
| 32. | Jefferson | 24 | 9,194(0.26%)#32 | 2,580,172(0.00%)#4,124 |
| 33. | Slidell | 23 | 9,194(0.25%)#33 | 2,580,172(0.00%)#4,165 |
| 34. | Chalmette | 23 | 9,194(0.25%)#34 | 2,580,172(0.00%)#4,169 |
| 35. | Bayou Cane | 23 | 9,194(0.25%)#35 | 2,580,172(0.00%)#4,170 |
| 36. | Violet | 23 | 9,194(0.25%)#36 | 2,580,172(0.00%)#4,204 |
| 37. | Timberlane | 20 | 9,194(0.22%)#37 | 2,580,172(0.00%)#4,382 |
| 38. | Grambling | 20 | 9,194(0.22%)#38 | 2,580,172(0.00%)#4,401 |
| 39. | Montgomery | 20 | 9,194(0.22%)#39 | 2,580,172(0.00%)#4,434 |
| 40. | St Gabriel | 18 | 9,194(0.20%)#40 | 2,580,172(0.00%)#4,530 |
| 41. | Bawcomville | 18 | 9,194(0.20%)#41 | 2,580,172(0.00%)#4,557 |
| 42. | Natchitoches | 17 | 9,194(0.18%)#42 | 2,580,172(0.00%)#4,583 |
| 43. | Hammond | 16 | 9,194(0.17%)#43 | 2,580,172(0.00%)#4,656 |
| 44. | Reserve | 16 | 9,194(0.17%)#44 | 2,580,172(0.00%)#4,679 |
| 45. | Natalbany | 15 | 9,194(0.16%)#45 | 2,580,172(0.00%)#4,821 |
| 46. | Basile | 9 | 9,194(0.10%)#46 | 2,580,172(0.00%)#5,449 |
| 47. | Pine Prairie | 9 | 9,194(0.10%)#47 | 2,580,172(0.00%)#5,465 |
| 48. | Jonesboro | 8 | 9,194(0.09%)#48 | 2,580,172(0.00%)#5,537 |
| 49. | Poydras | 8 | 9,194(0.09%)#49 | 2,580,172(0.00%)#5,557 |
| 50. | Lacombe | 7 | 9,194(0.08%)#50 | 2,580,172(0.00%)#5,644 |
| 51. | Tallulah | 7 | 9,194(0.08%)#51 | 2,580,172(0.00%)#5,651 |
| 52. | Woodworth | 7 | 9,194(0.08%)#52 | 2,580,172(0.00%)#5,688 |
| 53. | Gretna | 6 | 9,194(0.07%)#53 | 2,580,172(0.00%)#5,735 |
| 54. | Deridder | 6 | 9,194(0.07%)#54 | 2,580,172(0.00%)#5,752 |
| 55. | Thibodaux | 5 | 9,194(0.05%)#55 | 2,580,172(0.00%)#5,905 |
| 56. | Leesville | 5 | 9,194(0.05%)#56 | 2,580,172(0.00%)#5,935 |
| 57. | Union | 4 | 9,194(0.04%)#57 | 2,580,172(0.00%)#6,226 |
| 58. | New Llano | 3 | 9,194(0.03%)#58 | 2,580,172(0.00%)#6,310 |
| 59. | Colfax | 3 | 9,194(0.03%)#59 | 2,580,172(0.00%)#6,328 |
| 60. | Franklin | 2 | 9,194(0.02%)#60 | 2,580,172(0.00%)#6,451 |
| 61. | Oil City | 2 | 9,194(0.02%)#61 | 2,580,172(0.00%)#6,513 |
| 62. | Bayou Blue | 1 | 9,194(0.01%)#62 | 2,580,172(0.00%)#6,635 |
| 63. | St Martinville | 1 | 9,194(0.01%)#63 | 2,580,172(0.00%)#6,657 |
| 64. | Baldwin | 1 | 9,194(0.01%)#64 | 2,580,172(0.00%)#6,694 |
| 65. | Simpson | 1 | 9,194(0.01%)#65 | 2,580,172(0.00%)#6,783 |
| 66. | Plaucheville | 1 | 9,194(0.01%)#66 | 2,580,172(0.00%)#6,799 |
Common Questions
What are the Top 10 Cities with the Most Immigrants from Africa in Louisiana?
Top 10 Cities with the Most Immigrants from Africa in Louisiana are:
#1
1,341
#2
1,009
#3
953
#4
723
#5
402
#6
263
#7
233
#8
219
#9
163
#10
161
What city has the Most Immigrants from Africa in Louisiana?
Metairie has the Most Immigrants from Africa in Louisiana with 1,341.
What is the Total Immigrants from Africa in the State of Louisiana?
Total Immigrants from Africa in Louisiana is 9,194.
What is the Total Immigrants from Africa in the United States?
Total Immigrants from Africa in the United States is 2,580,172.