Cities with the Most Immigrants from Africa in Tennessee
RELATED REPORTS & OPTIONS
Africa
Tennessee
Compare Cities
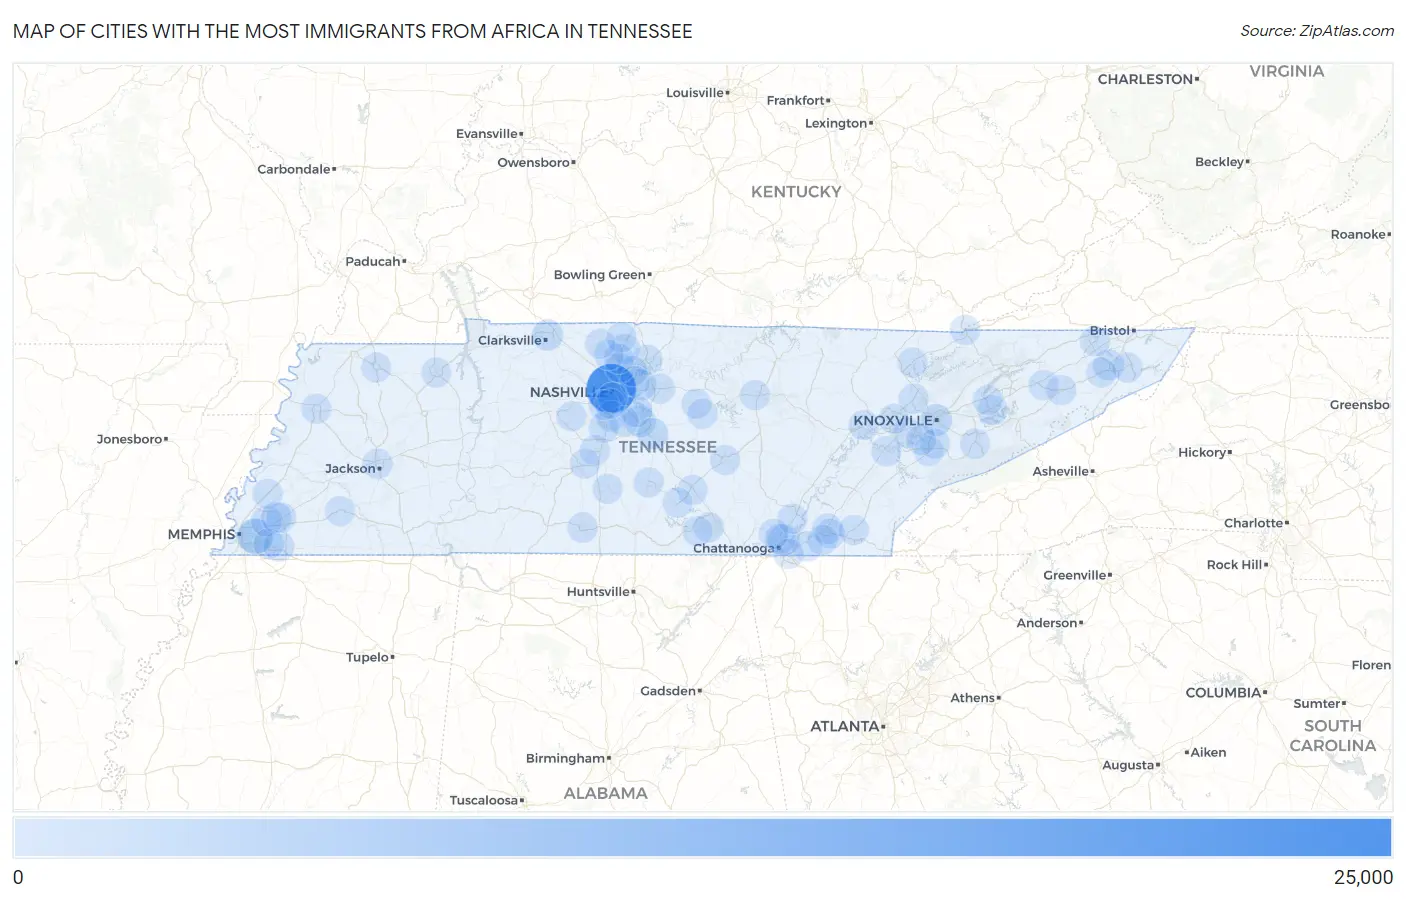
Map of Cities with the Most Immigrants from Africa in Tennessee
0
25,000
Cities with the Most Immigrants from Africa in Tennessee
| City | Africa | vs State | vs National | |
| 1. | Nashville | 20,130 | 43,212(46.58%)#1 | 2,580,172(0.78%)#10 |
| 2. | Memphis | 4,962 | 43,212(11.48%)#2 | 2,580,172(0.19%)#58 |
| 3. | Knoxville | 1,576 | 43,212(3.65%)#3 | 2,580,172(0.06%)#238 |
| 4. | Smyrna | 1,376 | 43,212(3.18%)#4 | 2,580,172(0.05%)#288 |
| 5. | La Vergne | 1,245 | 43,212(2.88%)#5 | 2,580,172(0.05%)#322 |
| 6. | Murfreesboro | 1,190 | 43,212(2.75%)#6 | 2,580,172(0.05%)#342 |
| 7. | Chattanooga | 1,130 | 43,212(2.62%)#7 | 2,580,172(0.04%)#362 |
| 8. | Clarksville | 891 | 43,212(2.06%)#8 | 2,580,172(0.03%)#449 |
| 9. | Johnson City | 766 | 43,212(1.77%)#9 | 2,580,172(0.03%)#516 |
| 10. | Mount Juliet | 655 | 43,212(1.52%)#10 | 2,580,172(0.03%)#593 |
| 11. | Collierville | 542 | 43,212(1.25%)#11 | 2,580,172(0.02%)#695 |
| 12. | Cleveland | 430 | 43,212(1.00%)#12 | 2,580,172(0.02%)#840 |
| 13. | Brentwood | 379 | 43,212(0.88%)#13 | 2,580,172(0.01%)#930 |
| 14. | Bartlett | 376 | 43,212(0.87%)#14 | 2,580,172(0.01%)#936 |
| 15. | Lakeland | 324 | 43,212(0.75%)#15 | 2,580,172(0.01%)#1,063 |
| 16. | Gallatin | 236 | 43,212(0.55%)#16 | 2,580,172(0.01%)#1,316 |
| 17. | Germantown | 188 | 43,212(0.44%)#17 | 2,580,172(0.01%)#1,529 |
| 18. | Hendersonville | 182 | 43,212(0.42%)#18 | 2,580,172(0.01%)#1,566 |
| 19. | Jackson | 160 | 43,212(0.37%)#19 | 2,580,172(0.01%)#1,699 |
| 20. | Nolensville | 159 | 43,212(0.37%)#20 | 2,580,172(0.01%)#1,705 |
| 21. | Franklin | 143 | 43,212(0.33%)#21 | 2,580,172(0.01%)#1,808 |
| 22. | Paris | 123 | 43,212(0.28%)#22 | 2,580,172(0.00%)#1,987 |
| 23. | Cookeville | 116 | 43,212(0.27%)#23 | 2,580,172(0.00%)#2,042 |
| 24. | Elizabethton | 115 | 43,212(0.27%)#24 | 2,580,172(0.00%)#2,060 |
| 25. | Spring Hill | 106 | 43,212(0.25%)#25 | 2,580,172(0.00%)#2,158 |
| 26. | Farragut | 102 | 43,212(0.24%)#26 | 2,580,172(0.00%)#2,206 |
| 27. | Lebanon | 99 | 43,212(0.23%)#27 | 2,580,172(0.00%)#2,243 |
| 28. | Clinton | 83 | 43,212(0.19%)#28 | 2,580,172(0.00%)#2,447 |
| 29. | Dyersburg | 80 | 43,212(0.19%)#29 | 2,580,172(0.00%)#2,493 |
| 30. | Atoka | 77 | 43,212(0.18%)#30 | 2,580,172(0.00%)#2,542 |
| 31. | Kingsport | 71 | 43,212(0.16%)#31 | 2,580,172(0.00%)#2,647 |
| 32. | Maryville | 68 | 43,212(0.16%)#32 | 2,580,172(0.00%)#2,713 |
| 33. | White House | 52 | 43,212(0.12%)#33 | 2,580,172(0.00%)#3,074 |
| 34. | South Cleveland | 52 | 43,212(0.12%)#34 | 2,580,172(0.00%)#3,082 |
| 35. | Shelbyville | 49 | 43,212(0.11%)#35 | 2,580,172(0.00%)#3,141 |
| 36. | Manchester | 46 | 43,212(0.11%)#36 | 2,580,172(0.00%)#3,241 |
| 37. | Collegedale | 46 | 43,212(0.11%)#37 | 2,580,172(0.00%)#3,242 |
| 38. | Arlington | 45 | 43,212(0.10%)#38 | 2,580,172(0.00%)#3,273 |
| 39. | Goodlettsville | 42 | 43,212(0.10%)#39 | 2,580,172(0.00%)#3,358 |
| 40. | Red Bank | 42 | 43,212(0.10%)#40 | 2,580,172(0.00%)#3,368 |
| 41. | Soddy Daisy | 41 | 43,212(0.09%)#41 | 2,580,172(0.00%)#3,410 |
| 42. | Oak Ridge | 40 | 43,212(0.09%)#42 | 2,580,172(0.00%)#3,432 |
| 43. | Eagleton Village | 38 | 43,212(0.09%)#43 | 2,580,172(0.00%)#3,521 |
| 44. | Forest Hills | 35 | 43,212(0.08%)#44 | 2,580,172(0.00%)#3,645 |
| 45. | Tullahoma | 34 | 43,212(0.08%)#45 | 2,580,172(0.00%)#3,662 |
| 46. | Green Hill | 34 | 43,212(0.08%)#46 | 2,580,172(0.00%)#3,678 |
| 47. | Greeneville | 33 | 43,212(0.08%)#47 | 2,580,172(0.00%)#3,708 |
| 48. | East Ridge | 32 | 43,212(0.07%)#48 | 2,580,172(0.00%)#3,743 |
| 49. | Signal Mountain | 27 | 43,212(0.06%)#49 | 2,580,172(0.00%)#3,977 |
| 50. | Columbia | 25 | 43,212(0.06%)#50 | 2,580,172(0.00%)#4,050 |
| 51. | Pulaski | 25 | 43,212(0.06%)#51 | 2,580,172(0.00%)#4,069 |
| 52. | East Cleveland | 25 | 43,212(0.06%)#52 | 2,580,172(0.00%)#4,090 |
| 53. | Pigeon Forge | 23 | 43,212(0.05%)#53 | 2,580,172(0.00%)#4,198 |
| 54. | Millersville | 18 | 43,212(0.04%)#54 | 2,580,172(0.00%)#4,534 |
| 55. | Louisville | 18 | 43,212(0.04%)#55 | 2,580,172(0.00%)#4,544 |
| 56. | Mosheim | 16 | 43,212(0.04%)#56 | 2,580,172(0.00%)#4,720 |
| 57. | Loudon | 15 | 43,212(0.03%)#57 | 2,580,172(0.00%)#4,792 |
| 58. | Powell | 14 | 43,212(0.03%)#58 | 2,580,172(0.00%)#4,859 |
| 59. | Fairview | 14 | 43,212(0.03%)#59 | 2,580,172(0.00%)#4,878 |
| 60. | Greenbrier | 14 | 43,212(0.03%)#60 | 2,580,172(0.00%)#4,885 |
| 61. | Whiteville | 13 | 43,212(0.03%)#61 | 2,580,172(0.00%)#4,995 |
| 62. | Jonesborough | 12 | 43,212(0.03%)#62 | 2,580,172(0.00%)#5,087 |
| 63. | Springfield | 10 | 43,212(0.02%)#63 | 2,580,172(0.00%)#5,261 |
| 64. | Lynchburg | 8 | 43,212(0.02%)#64 | 2,580,172(0.00%)#5,521 |
| 65. | Mcminnville | 7 | 43,212(0.02%)#65 | 2,580,172(0.00%)#5,620 |
| 66. | La Follette | 7 | 43,212(0.02%)#66 | 2,580,172(0.00%)#5,643 |
| 67. | Sewanee | 7 | 43,212(0.02%)#67 | 2,580,172(0.00%)#5,679 |
| 68. | Martin | 6 | 43,212(0.01%)#68 | 2,580,172(0.00%)#5,746 |
| 69. | Dandridge | 6 | 43,212(0.01%)#69 | 2,580,172(0.00%)#5,786 |
| 70. | Oak Hill | 5 | 43,212(0.01%)#70 | 2,580,172(0.00%)#5,947 |
| 71. | Benton | 5 | 43,212(0.01%)#71 | 2,580,172(0.00%)#6,004 |
| 72. | Jefferson City | 4 | 43,212(0.01%)#72 | 2,580,172(0.00%)#6,080 |
| 73. | Cowan | 4 | 43,212(0.01%)#73 | 2,580,172(0.00%)#6,147 |
| 74. | Cross Plains | 4 | 43,212(0.01%)#74 | 2,580,172(0.00%)#6,148 |
| 75. | Alexandria | 4 | 43,212(0.01%)#75 | 2,580,172(0.00%)#6,183 |
| 76. | Berry Hill | 3 | 43,212(0.01%)#76 | 2,580,172(0.00%)#6,322 |
| 77. | Lewisburg | 2 | 43,212(0.00%)#77 | 2,580,172(0.00%)#6,441 |
| 78. | Liberty | 2 | 43,212(0.00%)#78 | 2,580,172(0.00%)#6,587 |
| 79. | Harriman | 1 | 43,212(0.00%)#79 | 2,580,172(0.00%)#6,655 |
| 80. | Cumberland Gap | 1 | 43,212(0.00%)#80 | 2,580,172(0.00%)#6,786 |
Common Questions
What are the Top 10 Cities with the Most Immigrants from Africa in Tennessee?
Top 10 Cities with the Most Immigrants from Africa in Tennessee are:
#1
20,130
#2
4,962
#3
1,576
#4
1,376
#5
1,245
#6
1,190
#7
1,130
#8
891
#9
766
#10
655
What city has the Most Immigrants from Africa in Tennessee?
Nashville has the Most Immigrants from Africa in Tennessee with 20,130.
What is the Total Immigrants from Africa in the State of Tennessee?
Total Immigrants from Africa in Tennessee is 43,212.
What is the Total Immigrants from Africa in the United States?
Total Immigrants from Africa in the United States is 2,580,172.