Cities with the Most Immigrants from Africa in Arizona
RELATED REPORTS & OPTIONS
Africa
Arizona
Compare Cities
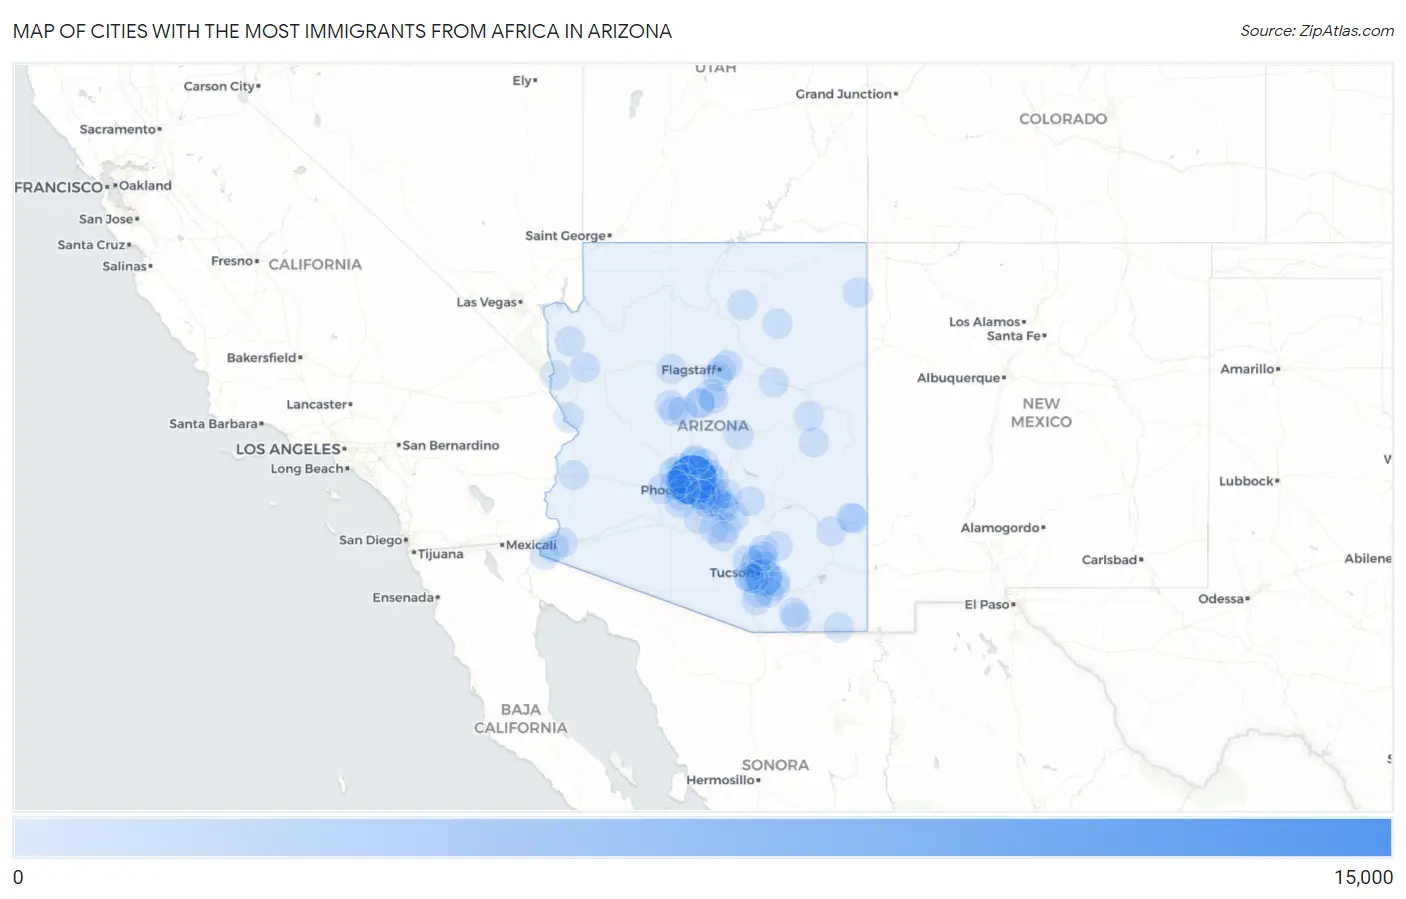
Map of Cities with the Most Immigrants from Africa in Arizona
0
15,000
Cities with the Most Immigrants from Africa in Arizona
| City | Africa | vs State | vs National | |
| 1. | Phoenix | 14,377 | 36,308(39.60%)#1 | 2,580,172(0.56%)#18 |
| 2. | Tucson | 4,789 | 36,308(13.19%)#2 | 2,580,172(0.19%)#63 |
| 3. | Glendale | 2,170 | 36,308(5.98%)#3 | 2,580,172(0.08%)#163 |
| 4. | Tempe | 1,785 | 36,308(4.92%)#4 | 2,580,172(0.07%)#206 |
| 5. | Chandler | 1,761 | 36,308(4.85%)#5 | 2,580,172(0.07%)#210 |
| 6. | Gilbert | 1,708 | 36,308(4.70%)#6 | 2,580,172(0.07%)#215 |
| 7. | Scottsdale | 1,475 | 36,308(4.06%)#7 | 2,580,172(0.06%)#265 |
| 8. | Mesa | 1,281 | 36,308(3.53%)#8 | 2,580,172(0.05%)#313 |
| 9. | Peoria | 627 | 36,308(1.73%)#9 | 2,580,172(0.02%)#615 |
| 10. | Avondale | 535 | 36,308(1.47%)#10 | 2,580,172(0.02%)#698 |
| 11. | Goodyear | 498 | 36,308(1.37%)#11 | 2,580,172(0.02%)#735 |
| 12. | Catalina Foothills | 491 | 36,308(1.35%)#12 | 2,580,172(0.02%)#745 |
| 13. | San Tan Valley | 314 | 36,308(0.86%)#13 | 2,580,172(0.01%)#1,082 |
| 14. | Buckeye | 233 | 36,308(0.64%)#14 | 2,580,172(0.01%)#1,327 |
| 15. | Surprise | 197 | 36,308(0.54%)#15 | 2,580,172(0.01%)#1,480 |
| 16. | El Mirage | 169 | 36,308(0.47%)#16 | 2,580,172(0.01%)#1,619 |
| 17. | Queen Creek | 158 | 36,308(0.44%)#17 | 2,580,172(0.01%)#1,708 |
| 18. | Oro Valley | 148 | 36,308(0.41%)#18 | 2,580,172(0.01%)#1,776 |
| 19. | Maricopa | 136 | 36,308(0.37%)#19 | 2,580,172(0.01%)#1,873 |
| 20. | Marana | 134 | 36,308(0.37%)#20 | 2,580,172(0.01%)#1,896 |
| 21. | Kingman | 128 | 36,308(0.35%)#21 | 2,580,172(0.00%)#1,939 |
| 22. | Yuma | 111 | 36,308(0.31%)#22 | 2,580,172(0.00%)#2,108 |
| 23. | Sierra Vista | 111 | 36,308(0.31%)#23 | 2,580,172(0.00%)#2,110 |
| 24. | Sahuarita | 103 | 36,308(0.28%)#24 | 2,580,172(0.00%)#2,192 |
| 25. | Flagstaff | 96 | 36,308(0.26%)#25 | 2,580,172(0.00%)#2,280 |
| 26. | Valencia West | 96 | 36,308(0.26%)#26 | 2,580,172(0.00%)#2,284 |
| 27. | Casas Adobes | 94 | 36,308(0.26%)#27 | 2,580,172(0.00%)#2,304 |
| 28. | Anthem | 89 | 36,308(0.25%)#28 | 2,580,172(0.00%)#2,371 |
| 29. | Florence | 87 | 36,308(0.24%)#29 | 2,580,172(0.00%)#2,394 |
| 30. | Fountain Hills | 78 | 36,308(0.21%)#30 | 2,580,172(0.00%)#2,522 |
| 31. | Green Valley | 76 | 36,308(0.21%)#31 | 2,580,172(0.00%)#2,555 |
| 32. | Kachina Village | 76 | 36,308(0.21%)#32 | 2,580,172(0.00%)#2,566 |
| 33. | Coolidge | 75 | 36,308(0.21%)#33 | 2,580,172(0.00%)#2,578 |
| 34. | South Tucson | 73 | 36,308(0.20%)#34 | 2,580,172(0.00%)#2,615 |
| 35. | Bullhead City | 71 | 36,308(0.20%)#35 | 2,580,172(0.00%)#2,649 |
| 36. | Vail | 70 | 36,308(0.19%)#36 | 2,580,172(0.00%)#2,669 |
| 37. | Corona De Tucson | 66 | 36,308(0.18%)#37 | 2,580,172(0.00%)#2,760 |
| 38. | Tuba City | 66 | 36,308(0.18%)#38 | 2,580,172(0.00%)#2,761 |
| 39. | Saddlebrooke | 63 | 36,308(0.17%)#39 | 2,580,172(0.00%)#2,820 |
| 40. | Paradise Valley | 59 | 36,308(0.16%)#40 | 2,580,172(0.00%)#2,911 |
| 41. | Rincon Valley | 50 | 36,308(0.14%)#41 | 2,580,172(0.00%)#3,130 |
| 42. | Apache Junction | 48 | 36,308(0.13%)#42 | 2,580,172(0.00%)#3,168 |
| 43. | Sedona | 46 | 36,308(0.13%)#43 | 2,580,172(0.00%)#3,243 |
| 44. | Williamson | 45 | 36,308(0.12%)#44 | 2,580,172(0.00%)#3,279 |
| 45. | Cottonwood | 39 | 36,308(0.11%)#45 | 2,580,172(0.00%)#3,471 |
| 46. | Tsaile | 38 | 36,308(0.10%)#46 | 2,580,172(0.00%)#3,529 |
| 47. | Tolleson | 37 | 36,308(0.10%)#47 | 2,580,172(0.00%)#3,553 |
| 48. | Verde Village | 31 | 36,308(0.09%)#48 | 2,580,172(0.00%)#3,786 |
| 49. | Payson | 29 | 36,308(0.08%)#49 | 2,580,172(0.00%)#3,871 |
| 50. | Tucson Mountains | 29 | 36,308(0.08%)#50 | 2,580,172(0.00%)#3,875 |
| 51. | Casa Grande | 28 | 36,308(0.08%)#51 | 2,580,172(0.00%)#3,910 |
| 52. | Sun City | 28 | 36,308(0.08%)#52 | 2,580,172(0.00%)#3,911 |
| 53. | Fortuna Foothills | 28 | 36,308(0.08%)#53 | 2,580,172(0.00%)#3,915 |
| 54. | Safford | 28 | 36,308(0.08%)#54 | 2,580,172(0.00%)#3,930 |
| 55. | Clifton | 28 | 36,308(0.08%)#55 | 2,580,172(0.00%)#3,942 |
| 56. | New River | 27 | 36,308(0.07%)#56 | 2,580,172(0.00%)#3,967 |
| 57. | Eloy | 26 | 36,308(0.07%)#57 | 2,580,172(0.00%)#4,004 |
| 58. | Prescott | 25 | 36,308(0.07%)#58 | 2,580,172(0.00%)#4,048 |
| 59. | Kaibab Estates West | 25 | 36,308(0.07%)#59 | 2,580,172(0.00%)#4,094 |
| 60. | San Luis | 23 | 36,308(0.06%)#60 | 2,580,172(0.00%)#4,163 |
| 61. | Drexel Heights | 23 | 36,308(0.06%)#61 | 2,580,172(0.00%)#4,164 |
| 62. | San Manuel | 23 | 36,308(0.06%)#62 | 2,580,172(0.00%)#4,209 |
| 63. | Lake Havasu City | 21 | 36,308(0.06%)#63 | 2,580,172(0.00%)#4,298 |
| 64. | Village Of Oak Creek Big Park | 13 | 36,308(0.04%)#64 | 2,580,172(0.00%)#4,987 |
| 65. | Carefree | 13 | 36,308(0.04%)#65 | 2,580,172(0.00%)#5,003 |
| 66. | Ash Fork | 13 | 36,308(0.04%)#66 | 2,580,172(0.00%)#5,047 |
| 67. | Prescott Valley | 12 | 36,308(0.03%)#67 | 2,580,172(0.00%)#5,052 |
| 68. | Catalina | 12 | 36,308(0.03%)#68 | 2,580,172(0.00%)#5,085 |
| 69. | Citrus Park | 12 | 36,308(0.03%)#69 | 2,580,172(0.00%)#5,089 |
| 70. | Lake Of The Woods | 12 | 36,308(0.03%)#70 | 2,580,172(0.00%)#5,110 |
| 71. | Doney Park | 11 | 36,308(0.03%)#71 | 2,580,172(0.00%)#5,192 |
| 72. | Quartzsite | 10 | 36,308(0.03%)#72 | 2,580,172(0.00%)#5,323 |
| 73. | Tucson Estates | 8 | 36,308(0.02%)#73 | 2,580,172(0.00%)#5,505 |
| 74. | Guadalupe | 8 | 36,308(0.02%)#74 | 2,580,172(0.00%)#5,525 |
| 75. | Winslow | 7 | 36,308(0.02%)#75 | 2,580,172(0.00%)#5,632 |
| 76. | Superior | 7 | 36,308(0.02%)#76 | 2,580,172(0.00%)#5,682 |
| 77. | Huachuca City | 7 | 36,308(0.02%)#77 | 2,580,172(0.00%)#5,700 |
| 78. | Kykotsmovi Village | 6 | 36,308(0.02%)#78 | 2,580,172(0.00%)#5,856 |
| 79. | Sunsites | 6 | 36,308(0.02%)#79 | 2,580,172(0.00%)#5,868 |
| 80. | Snowflake | 4 | 36,308(0.01%)#80 | 2,580,172(0.00%)#6,092 |
| 81. | Dolan Springs | 4 | 36,308(0.01%)#81 | 2,580,172(0.00%)#6,171 |
| 82. | Douglas | 3 | 36,308(0.01%)#82 | 2,580,172(0.00%)#6,258 |
| 83. | Morenci | 1 | 36,308(0.00%)#83 | 2,580,172(0.00%)#6,710 |
Common Questions
What are the Top 10 Cities with the Most Immigrants from Africa in Arizona?
Top 10 Cities with the Most Immigrants from Africa in Arizona are:
What city has the Most Immigrants from Africa in Arizona?
Phoenix has the Most Immigrants from Africa in Arizona with 14,377.
What is the Total Immigrants from Africa in the State of Arizona?
Total Immigrants from Africa in Arizona is 36,308.
What is the Total Immigrants from Africa in the United States?
Total Immigrants from Africa in the United States is 2,580,172.