Moscow, MD
Moscow Map
Moscow Overview
229
TOTAL POPULATION
86
MALE POPULATION
143
FEMALE POPULATION
60.14
MALES / 100 FEMALES
166.28
FEMALES / 100 MALES
55.4
MEDIAN AGE
2.2
AVG FAMILY SIZE
1.9
AVG HOUSEHOLD SIZE
$37,155
PER CAPITA INCOME
$91,705
AVG FAMILY INCOME
0.28
INEQUALITY / GINI INDEX
145
LABOR FORCE [ PEOPLE ]
70.0%
PERCENT IN LABOR FORCE
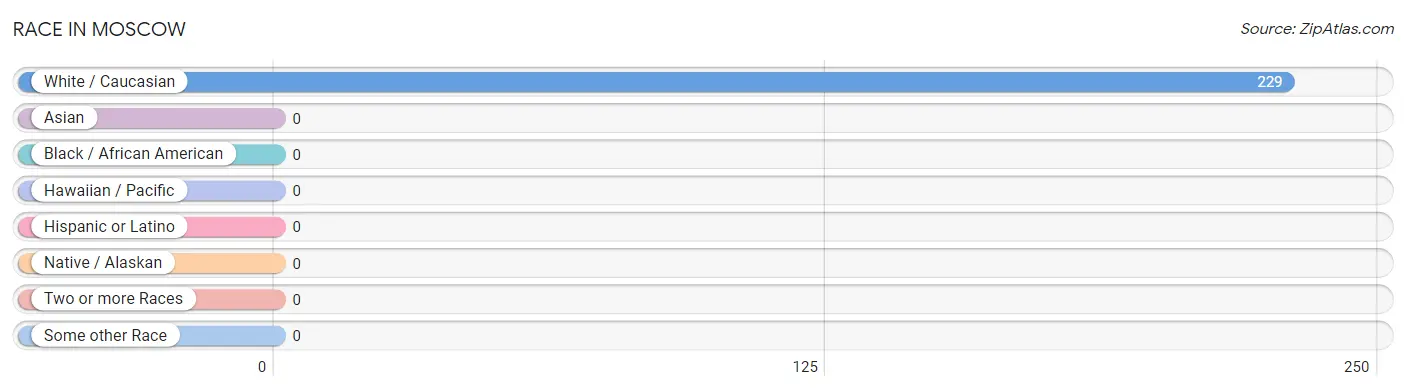
Race in Moscow
The most populous races in Moscow are , and White / Caucasian (229 | 100.0%).
| Race | # Population | % Population |
| Asian | 0 | 0.0% |
| Black / African American | 0 | 0.0% |
| Hawaiian / Pacific | 0 | 0.0% |
| Hispanic or Latino | 0 | 0.0% |
| Native / Alaskan | 0 | 0.0% |
| White / Caucasian | 229 | 100.0% |
| Two or more Races | 0 | 0.0% |
| Some other Race | 0 | 0.0% |
| Total | 229 | 100.0% |
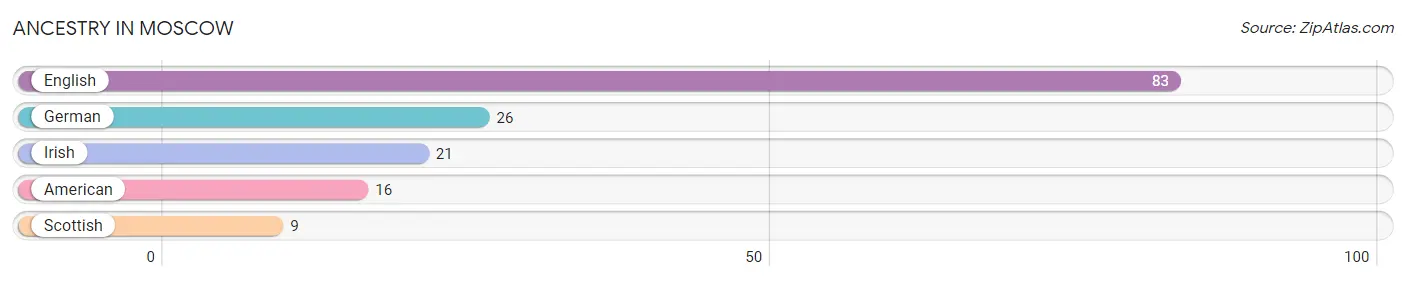
Ancestry in Moscow
The most populous ancestries reported in Moscow are English (83 | 36.2%), German (26 | 11.4%), Irish (21 | 9.2%), American (16 | 7.0%), and Scottish (9 | 3.9%), together accounting for 67.7% of all Moscow residents.
| Ancestry | # Population | % Population |
| American | 16 | 7.0% |
| English | 83 | 36.2% |
| German | 26 | 11.4% |
| Irish | 21 | 9.2% |
| Scottish | 9 | 3.9% | View All 5 Rows |
Immigrants in Moscow

| Immigration Origin | # Population | % Population | View All 0 Rows |
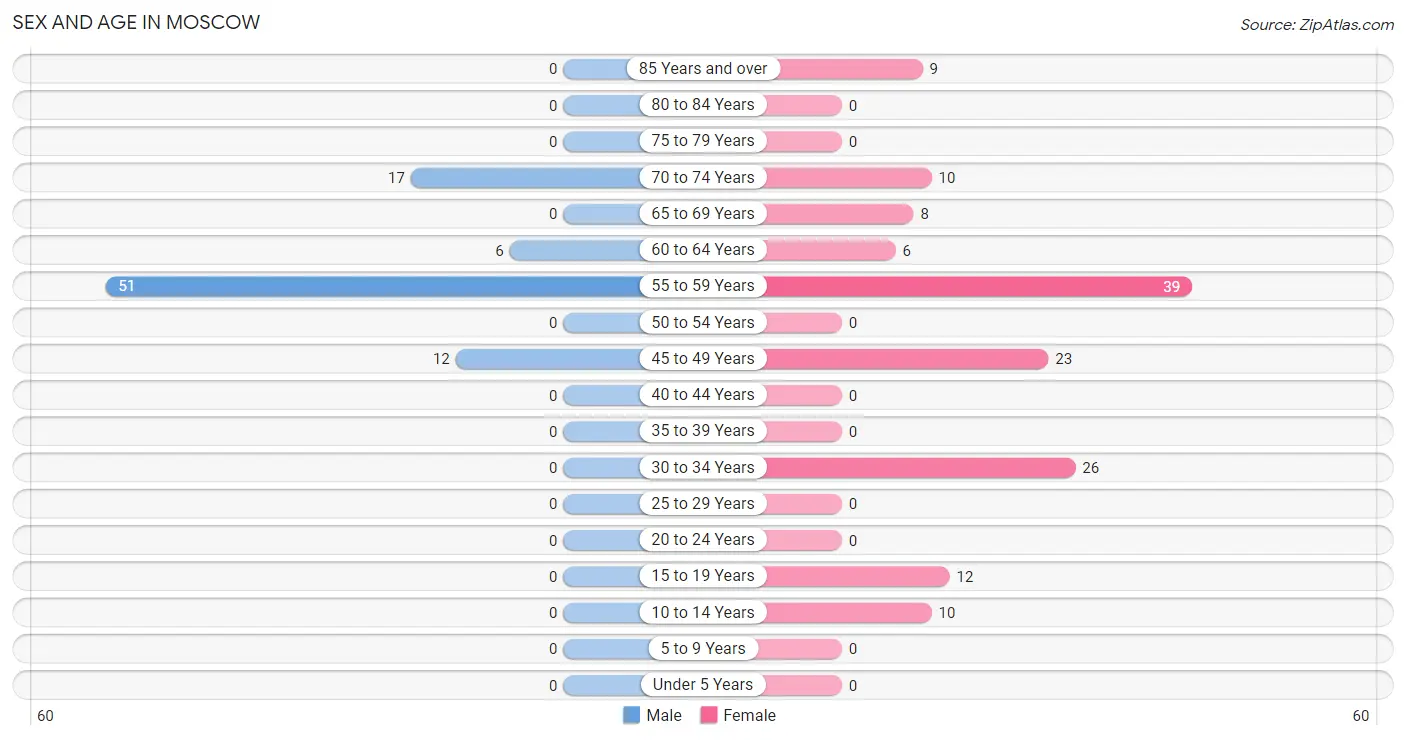
Sex and Age in Moscow
Sex and Age in Moscow
The most populous age groups in Moscow are 55 to 59 Years (51 | 59.3%) for men and 55 to 59 Years (39 | 27.3%) for women.
| Age Bracket | Male | Female |
| Under 5 Years | 0 (0.0%) | 0 (0.0%) |
| 5 to 9 Years | 0 (0.0%) | 0 (0.0%) |
| 10 to 14 Years | 0 (0.0%) | 10 (7.0%) |
| 15 to 19 Years | 0 (0.0%) | 12 (8.4%) |
| 20 to 24 Years | 0 (0.0%) | 0 (0.0%) |
| 25 to 29 Years | 0 (0.0%) | 0 (0.0%) |
| 30 to 34 Years | 0 (0.0%) | 26 (18.2%) |
| 35 to 39 Years | 0 (0.0%) | 0 (0.0%) |
| 40 to 44 Years | 0 (0.0%) | 0 (0.0%) |
| 45 to 49 Years | 12 (14.0%) | 23 (16.1%) |
| 50 to 54 Years | 0 (0.0%) | 0 (0.0%) |
| 55 to 59 Years | 51 (59.3%) | 39 (27.3%) |
| 60 to 64 Years | 6 (7.0%) | 6 (4.2%) |
| 65 to 69 Years | 0 (0.0%) | 8 (5.6%) |
| 70 to 74 Years | 17 (19.8%) | 10 (7.0%) |
| 75 to 79 Years | 0 (0.0%) | 0 (0.0%) |
| 80 to 84 Years | 0 (0.0%) | 0 (0.0%) |
| 85 Years and over | 0 (0.0%) | 9 (6.3%) |
| Total | 86 (100.0%) | 143 (100.0%) |
Families and Households in Moscow
Median Family Size in Moscow
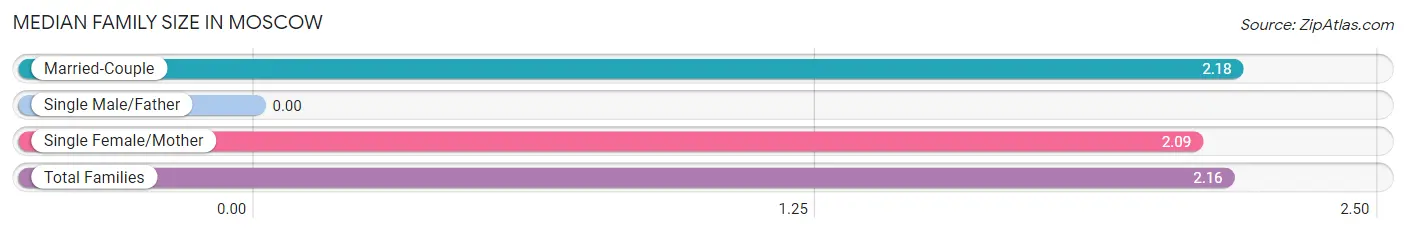
| Family Type | # Families | Family Size |
| Married-Couple | 74 (87.1%) | 2.18 |
| Single Male/Father | 0 (0.0%) | - |
| Single Female/Mother | 11 (12.9%) | 2.09 |
| Total Families | 85 (100.0%) | 2.16 |
Median Household Size in Moscow
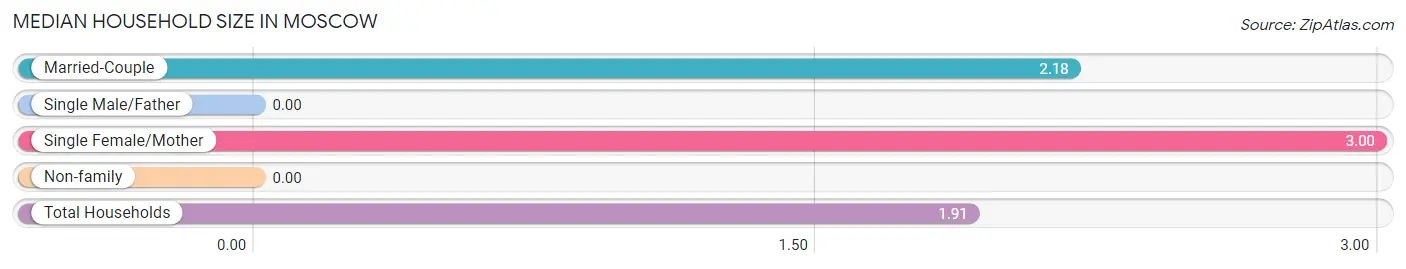
| Household Type | # Households | Household Size |
| Married-Couple | 74 (61.7%) | 2.18 |
| Single Male/Father | 0 (0.0%) | - |
| Single Female/Mother | 11 (9.2%) | 3.00 |
| Non-family | 35 (29.2%) | - |
| Total Households | 120 (100.0%) | 1.91 |
Household Size by Marriage Status in Moscow
Out of a total of 120 households in Moscow, 85 (70.8%) are family households, while 35 (29.2%) are nonfamily households. The most numerous type of family households are 2-person households, comprising 62, and the most common type of nonfamily households are 1-person households, comprising 35.
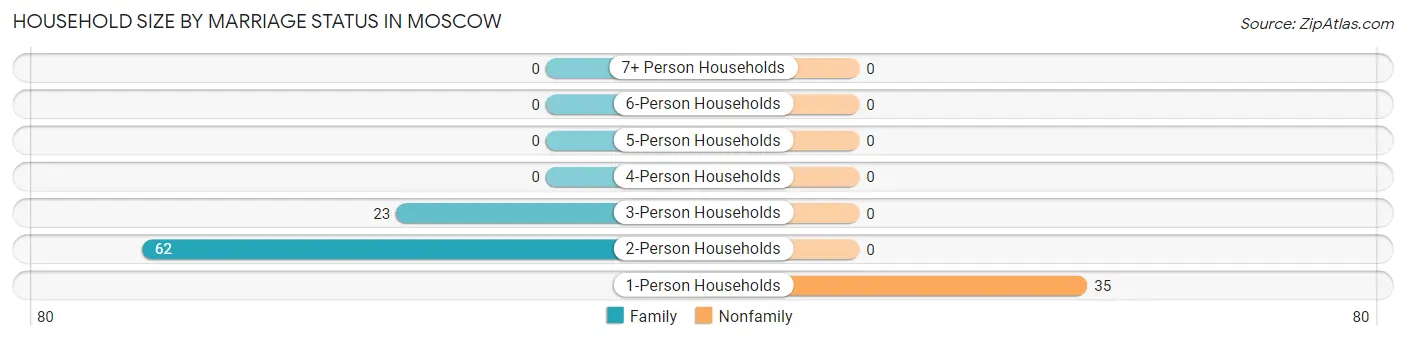
| Household Size | Family Households | Nonfamily Households |
| 1-Person Households | - | 35 (29.2%) |
| 2-Person Households | 62 (51.7%) | 0 (0.0%) |
| 3-Person Households | 23 (19.2%) | 0 (0.0%) |
| 4-Person Households | 0 (0.0%) | 0 (0.0%) |
| 5-Person Households | 0 (0.0%) | 0 (0.0%) |
| 6-Person Households | 0 (0.0%) | 0 (0.0%) |
| 7+ Person Households | 0 (0.0%) | 0 (0.0%) |
| Total | 85 (70.8%) | 35 (29.2%) |
Female Fertility in Moscow
Fertility by Age in Moscow
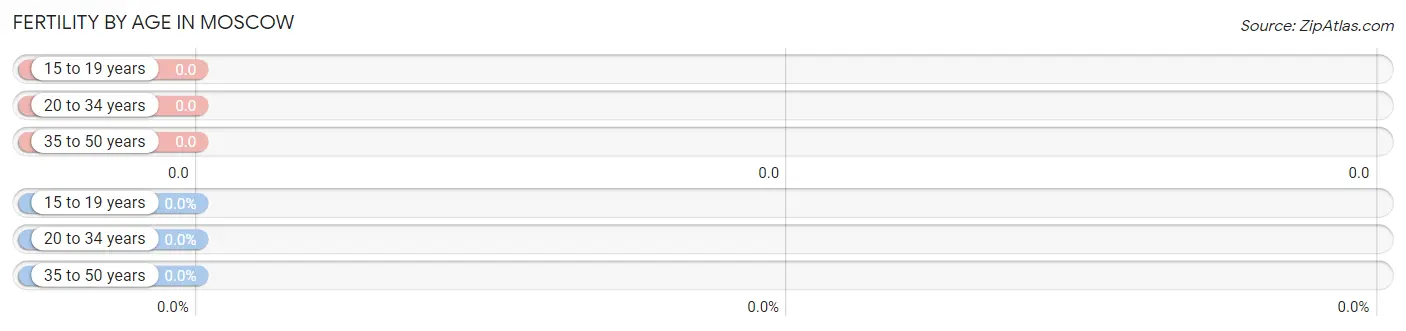
| Age Bracket | Women with Births | Births / 1,000 Women |
| 15 to 19 years | 0 (0.0%) | 0.0 |
| 20 to 34 years | 0 (0.0%) | 0.0 |
| 35 to 50 years | 0 (0.0%) | 0.0 |
| Total | 0 (0.0%) | 0.0 |
Fertility by Age by Marriage Status in Moscow
| Age Bracket | Married | Unmarried |
| 15 to 19 years | 0 (0.0%) | 0 (0.0%) |
| 20 to 34 years | 0 (0.0%) | 0 (0.0%) |
| 35 to 50 years | 0 (0.0%) | 0 (0.0%) |
| Total | 0 (0.0%) | 0 (0.0%) |
Fertility by Education in Moscow
| Educational Attainment | Women with Births | Births / 1,000 Women |
| Less than High School | 0 (0.0%) | 0.0 |
| High School Diploma | 0 (0.0%) | 0.0 |
| College or Associate's Degree | 0 (0.0%) | 0.0 |
| Bachelor's Degree | 0 (0.0%) | 0.0 |
| Graduate Degree | 0 (0.0%) | 0.0 |
| Total | 0 (0.0%) | 0.0 |
Fertility by Education by Marriage Status in Moscow
| Educational Attainment | Married | Unmarried |
| Less than High School | 0 (0.0%) | 0 (0.0%) |
| High School Diploma | 0 (0.0%) | 0 (0.0%) |
| College or Associate's Degree | 0 (0.0%) | 0 (0.0%) |
| Bachelor's Degree | 0 (0.0%) | 0 (0.0%) |
| Graduate Degree | 0 (0.0%) | 0 (0.0%) |
| Total | 0 (0.0%) | 0 (0.0%) |
Income in Moscow
Income Overview in Moscow
| Characteristic | Number | Measure |
| Per Capita Income | 229 | $37,155 |
| Median Family Income | 85 | $91,705 |
| Mean Family Income | 85 | $84,207 |
| Median Household Income | 120 | $0 |
| Mean Household Income | 120 | $68,954 |
| Income Deficit | 85 | $0 |
| Wage / Income Gap (%) | 229 | 0.00% |
| Wage / Income Gap ($) | 229 | 100.00¢ per $1 |
| Gini / Inequality Index | 229 | 0.28 |
Earnings by Sex in Moscow
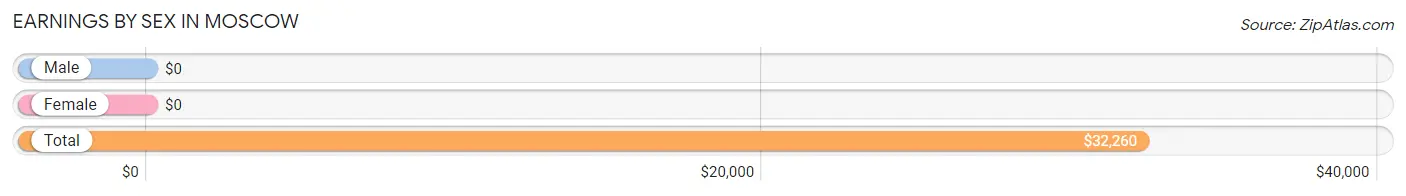
| Sex | Number | Average Earnings |
| Male | 51 (35.2%) | $0 |
| Female | 94 (64.8%) | $0 |
| Total | 145 (100.0%) | $32,260 |
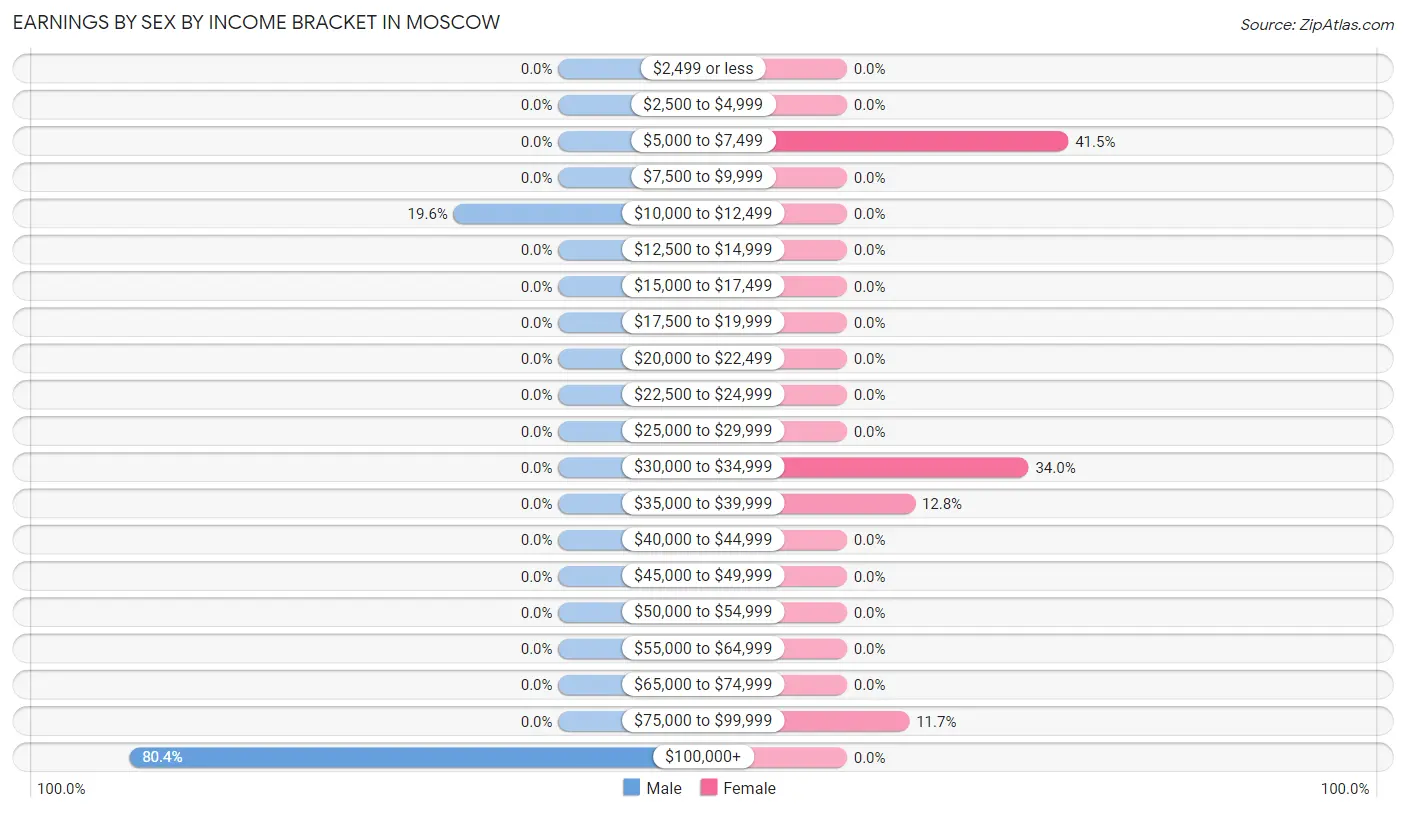
Earnings by Sex by Income Bracket in Moscow
The most common earnings brackets in Moscow are $100,000+ for men (41 | 80.4%) and $5,000 to $7,499 for women (39 | 41.5%).
| Income | Male | Female |
| $2,499 or less | 0 (0.0%) | 0 (0.0%) |
| $2,500 to $4,999 | 0 (0.0%) | 0 (0.0%) |
| $5,000 to $7,499 | 0 (0.0%) | 39 (41.5%) |
| $7,500 to $9,999 | 0 (0.0%) | 0 (0.0%) |
| $10,000 to $12,499 | 10 (19.6%) | 0 (0.0%) |
| $12,500 to $14,999 | 0 (0.0%) | 0 (0.0%) |
| $15,000 to $17,499 | 0 (0.0%) | 0 (0.0%) |
| $17,500 to $19,999 | 0 (0.0%) | 0 (0.0%) |
| $20,000 to $22,499 | 0 (0.0%) | 0 (0.0%) |
| $22,500 to $24,999 | 0 (0.0%) | 0 (0.0%) |
| $25,000 to $29,999 | 0 (0.0%) | 0 (0.0%) |
| $30,000 to $34,999 | 0 (0.0%) | 32 (34.0%) |
| $35,000 to $39,999 | 0 (0.0%) | 12 (12.8%) |
| $40,000 to $44,999 | 0 (0.0%) | 0 (0.0%) |
| $45,000 to $49,999 | 0 (0.0%) | 0 (0.0%) |
| $50,000 to $54,999 | 0 (0.0%) | 0 (0.0%) |
| $55,000 to $64,999 | 0 (0.0%) | 0 (0.0%) |
| $65,000 to $74,999 | 0 (0.0%) | 0 (0.0%) |
| $75,000 to $99,999 | 0 (0.0%) | 11 (11.7%) |
| $100,000+ | 41 (80.4%) | 0 (0.0%) |
| Total | 51 (100.0%) | 94 (100.0%) |
Earnings by Sex by Educational Attainment in Moscow
| Educational Attainment | Male Income | Female Income |
| Less than High School | - | - |
| High School Diploma | - | - |
| College or Associate's Degree | - | - |
| Bachelor's Degree | - | - |
| Graduate Degree | - | - |
| Total | - | - |
Family Income in Moscow
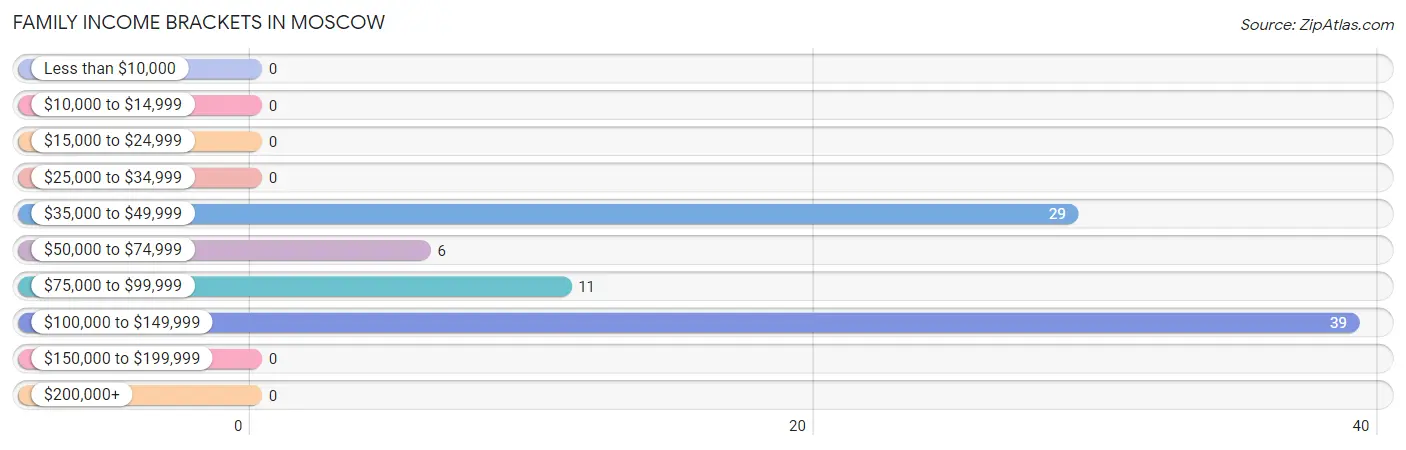
Family Income Brackets in Moscow
According to the Moscow family income data, there are 39 families falling into the $100,000 to $149,999 income range, which is the most common income bracket and makes up 45.9% of all families.
| Income Bracket | # Families | % Families |
| Less than $10,000 | 0 | 0.0% |
| $10,000 to $14,999 | 0 | 0.0% |
| $15,000 to $24,999 | 0 | 0.0% |
| $25,000 to $34,999 | 0 | 0.0% |
| $35,000 to $49,999 | 29 | 34.1% |
| $50,000 to $74,999 | 6 | 7.1% |
| $75,000 to $99,999 | 11 | 12.9% |
| $100,000 to $149,999 | 39 | 45.9% |
| $150,000 to $199,999 | 0 | 0.0% |
| $200,000+ | 0 | 0.0% |
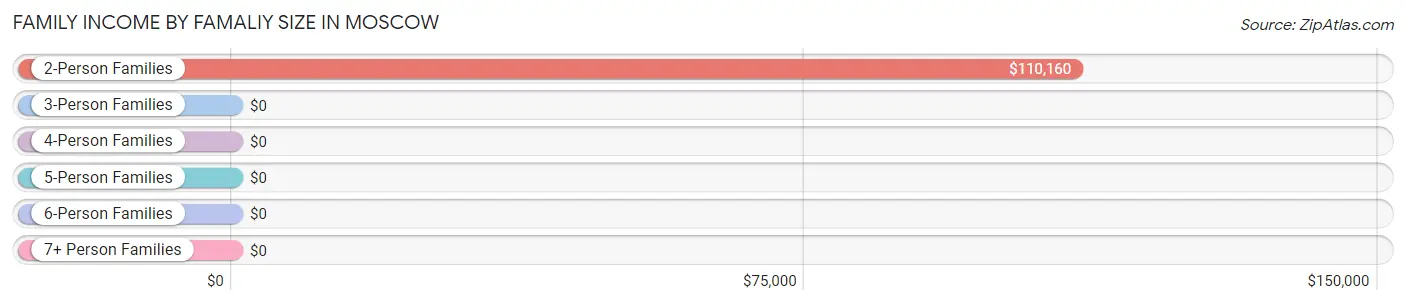
Family Income by Famaliy Size in Moscow
2-person families (73 | 85.9%) account for the highest median family income in Moscow with $110,160 per family, while 2-person families (73 | 85.9%) have the highest median income of $55,080 per family member.
| Income Bracket | # Families | Median Income |
| 2-Person Families | 73 (85.9%) | $110,160 |
| 3-Person Families | 12 (14.1%) | $0 |
| 4-Person Families | 0 (0.0%) | $0 |
| 5-Person Families | 0 (0.0%) | $0 |
| 6-Person Families | 0 (0.0%) | $0 |
| 7+ Person Families | 0 (0.0%) | $0 |
| Total | 85 (100.0%) | $91,705 |
Family Income by Number of Earners in Moscow
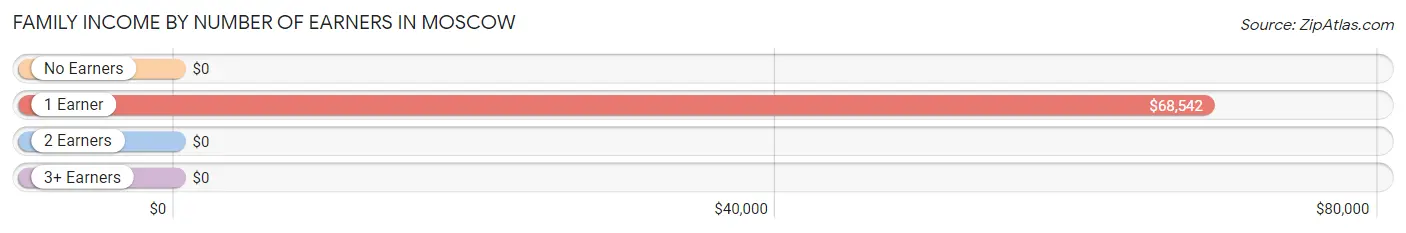
| Number of Earners | # Families | Median Income |
| No Earners | 17 (20.0%) | $0 |
| 1 Earner | 29 (34.1%) | $68,542 |
| 2 Earners | 39 (45.9%) | $0 |
| 3+ Earners | 0 (0.0%) | $0 |
| Total | 85 (100.0%) | $91,705 |
Household Income in Moscow
Household Income Brackets in Moscow
With 50 households falling in the category, the $100,000 to $149,999 income range is the most frequent in Moscow, accounting for 41.7% of all households.
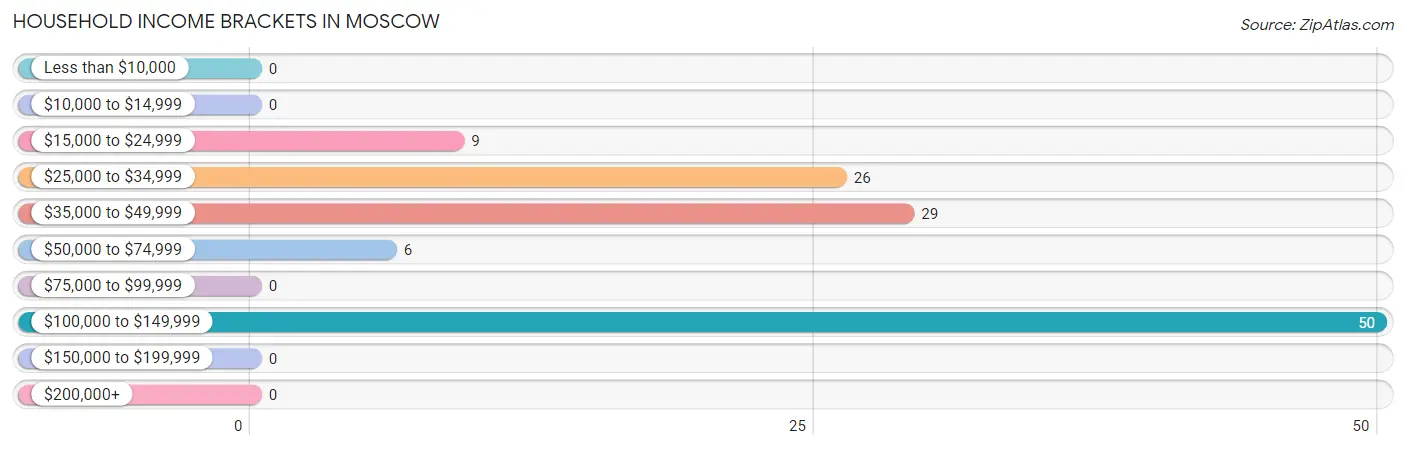
| Income Bracket | # Households | % Households |
| Less than $10,000 | 0 | 0.0% |
| $10,000 to $14,999 | 0 | 0.0% |
| $15,000 to $24,999 | 9 | 7.5% |
| $25,000 to $34,999 | 26 | 21.7% |
| $35,000 to $49,999 | 29 | 24.2% |
| $50,000 to $74,999 | 6 | 5.0% |
| $75,000 to $99,999 | 0 | 0.0% |
| $100,000 to $149,999 | 50 | 41.7% |
| $150,000 to $199,999 | 0 | 0.0% |
| $200,000+ | 0 | 0.0% |
Household Income by Householder Age in Moscow
The median household income in Moscow is $0, with the highest median household income of $110,321 found in the 45 to 64 years age bracket for the primary householder. A total of 68 households (56.7%) fall into this category.
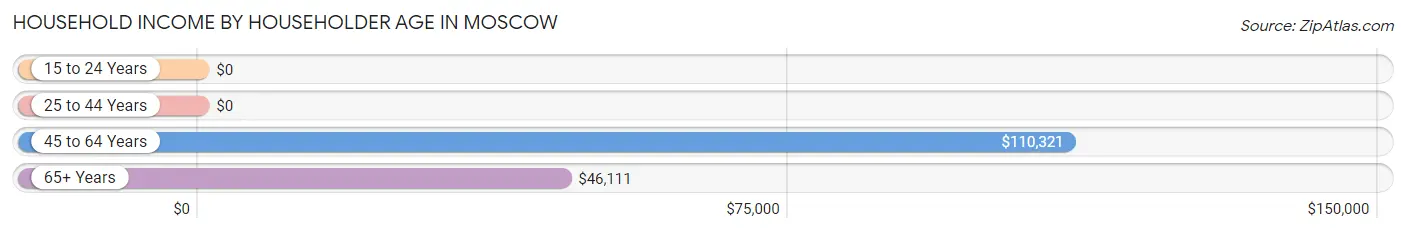
| Income Bracket | # Households | Median Income |
| 15 to 24 Years | 0 (0.0%) | $0 |
| 25 to 44 Years | 26 (21.7%) | $0 |
| 45 to 64 Years | 68 (56.7%) | $110,321 |
| 65+ Years | 26 (21.7%) | $46,111 |
| Total | 120 (100.0%) | $0 |
Poverty in Moscow
Income Below Poverty by Sex and Age in Moscow
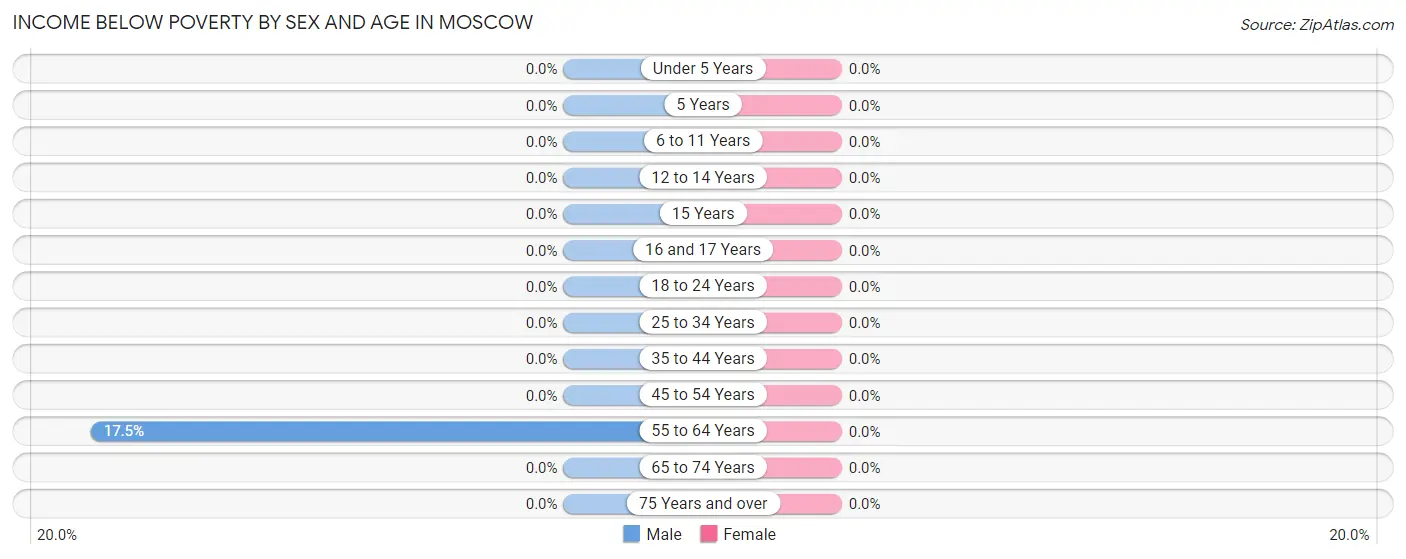
| Age Bracket | Male | Female |
| Under 5 Years | 0 (0.0%) | 0 (0.0%) |
| 5 Years | 0 (0.0%) | 0 (0.0%) |
| 6 to 11 Years | 0 (0.0%) | 0 (0.0%) |
| 12 to 14 Years | 0 (0.0%) | 0 (0.0%) |
| 15 Years | 0 (0.0%) | 0 (0.0%) |
| 16 and 17 Years | 0 (0.0%) | 0 (0.0%) |
| 18 to 24 Years | 0 (0.0%) | 0 (0.0%) |
| 25 to 34 Years | 0 (0.0%) | 0 (0.0%) |
| 35 to 44 Years | 0 (0.0%) | 0 (0.0%) |
| 45 to 54 Years | 0 (0.0%) | 0 (0.0%) |
| 55 to 64 Years | 10 (17.5%) | 0 (0.0%) |
| 65 to 74 Years | 0 (0.0%) | 0 (0.0%) |
| 75 Years and over | 0 (0.0%) | 0 (0.0%) |
| Total | 10 (11.6%) | 0 (0.0%) |
Income Above Poverty by Sex and Age in Moscow
According to the poverty statistics in Moscow, males aged 45 to 54 years and females aged 12 to 14 years are the age groups that are most secure financially, with 100.0% of males and 100.0% of females in these age groups living above the poverty line.
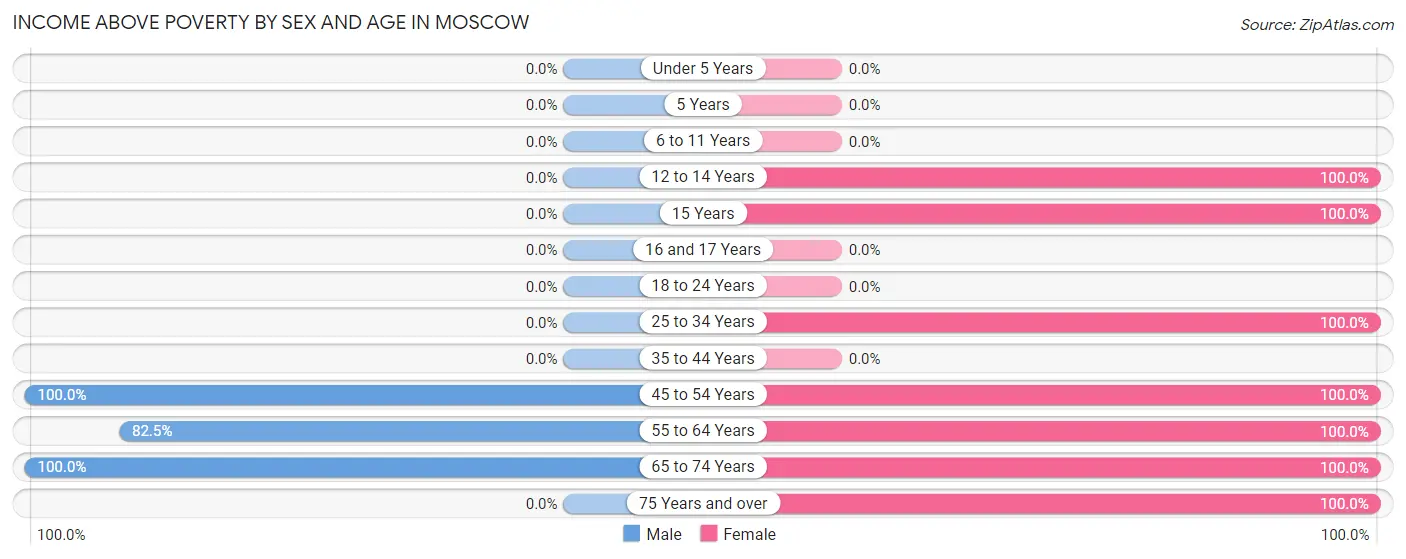
| Age Bracket | Male | Female |
| Under 5 Years | 0 (0.0%) | 0 (0.0%) |
| 5 Years | 0 (0.0%) | 0 (0.0%) |
| 6 to 11 Years | 0 (0.0%) | 0 (0.0%) |
| 12 to 14 Years | 0 (0.0%) | 10 (100.0%) |
| 15 Years | 0 (0.0%) | 12 (100.0%) |
| 16 and 17 Years | 0 (0.0%) | 0 (0.0%) |
| 18 to 24 Years | 0 (0.0%) | 0 (0.0%) |
| 25 to 34 Years | 0 (0.0%) | 26 (100.0%) |
| 35 to 44 Years | 0 (0.0%) | 0 (0.0%) |
| 45 to 54 Years | 12 (100.0%) | 23 (100.0%) |
| 55 to 64 Years | 47 (82.5%) | 45 (100.0%) |
| 65 to 74 Years | 17 (100.0%) | 18 (100.0%) |
| 75 Years and over | 0 (0.0%) | 9 (100.0%) |
| Total | 76 (88.4%) | 143 (100.0%) |
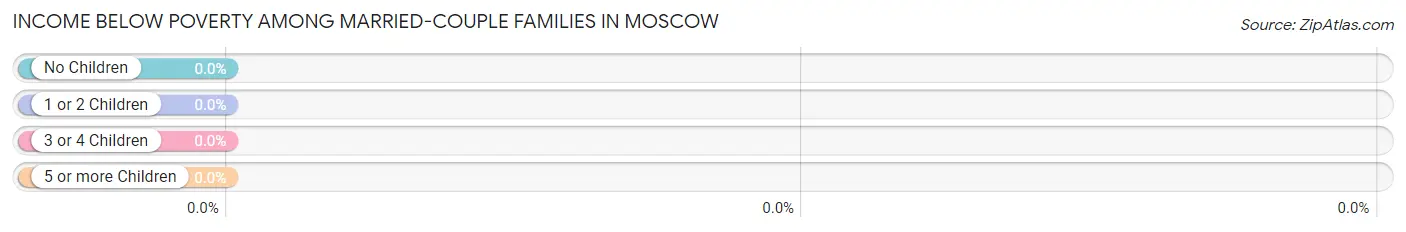
Income Below Poverty Among Married-Couple Families in Moscow
| Children | Above Poverty | Below Poverty |
| No Children | 62 (100.0%) | 0 (0.0%) |
| 1 or 2 Children | 12 (100.0%) | 0 (0.0%) |
| 3 or 4 Children | 0 (0.0%) | 0 (0.0%) |
| 5 or more Children | 0 (0.0%) | 0 (0.0%) |
| Total | 74 (100.0%) | 0 (0.0%) |
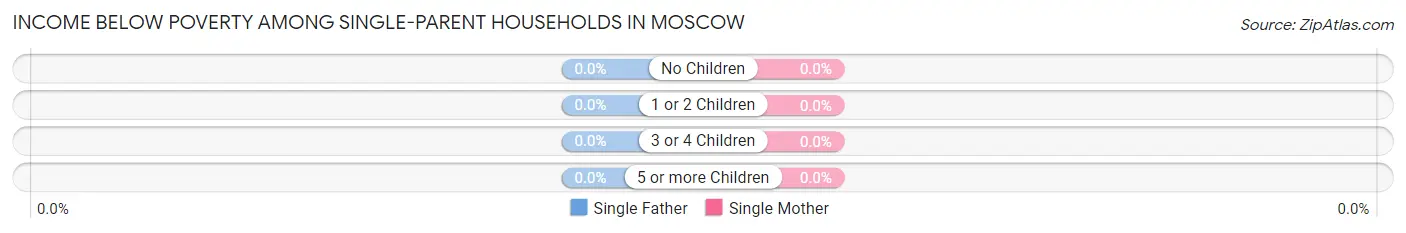
Income Below Poverty Among Single-Parent Households in Moscow
| Children | Single Father | Single Mother |
| No Children | 0 (0.0%) | 0 (0.0%) |
| 1 or 2 Children | 0 (0.0%) | 0 (0.0%) |
| 3 or 4 Children | 0 (0.0%) | 0 (0.0%) |
| 5 or more Children | 0 (0.0%) | 0 (0.0%) |
| Total | 0 (0.0%) | 0 (0.0%) |
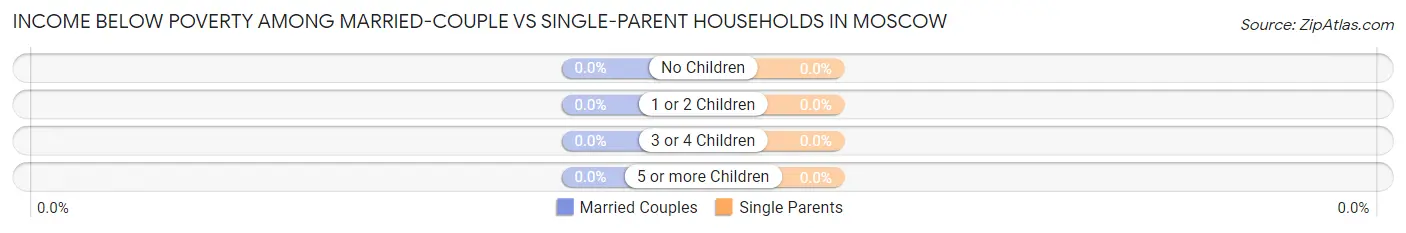
Income Below Poverty Among Married-Couple vs Single-Parent Households in Moscow
| Children | Married-Couple Families | Single-Parent Households |
| No Children | 0 (0.0%) | 0 (0.0%) |
| 1 or 2 Children | 0 (0.0%) | 0 (0.0%) |
| 3 or 4 Children | 0 (0.0%) | 0 (0.0%) |
| 5 or more Children | 0 (0.0%) | 0 (0.0%) |
| Total | 0 (0.0%) | 0 (0.0%) |
Employment Characteristics in Moscow
Employment by Class of Employer in Moscow
Among the 145 employed individuals in Moscow, private company employees (67 | 46.2%), not-for-profit organizations (56 | 38.6%), and self-employed (not incorporated) (22 | 15.2%) make up the most common classes of employment.
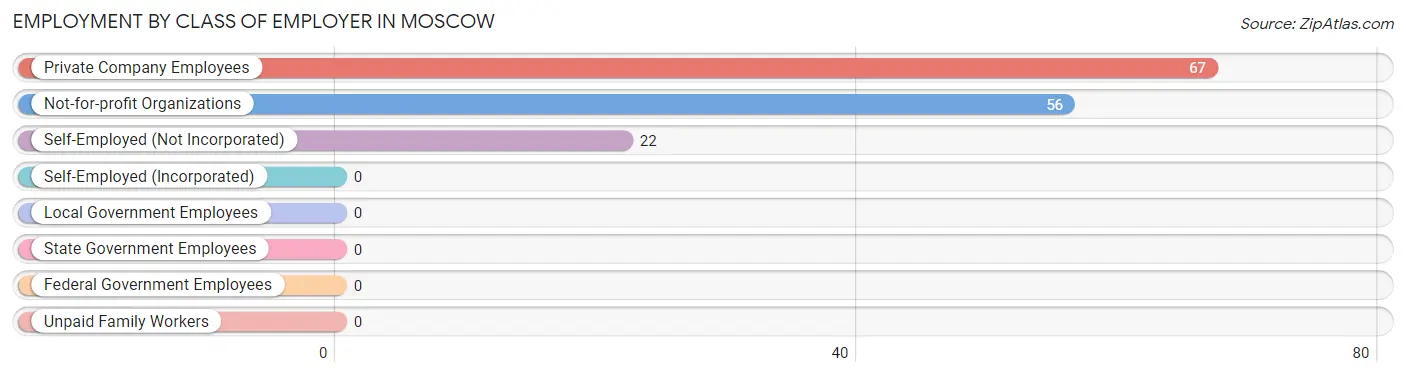
| Employer Class | # Employees | % Employees |
| Private Company Employees | 67 | 46.2% |
| Self-Employed (Incorporated) | 0 | 0.0% |
| Self-Employed (Not Incorporated) | 22 | 15.2% |
| Not-for-profit Organizations | 56 | 38.6% |
| Local Government Employees | 0 | 0.0% |
| State Government Employees | 0 | 0.0% |
| Federal Government Employees | 0 | 0.0% |
| Unpaid Family Workers | 0 | 0.0% |
| Total | 145 | 100.0% |
Employment Status by Age in Moscow
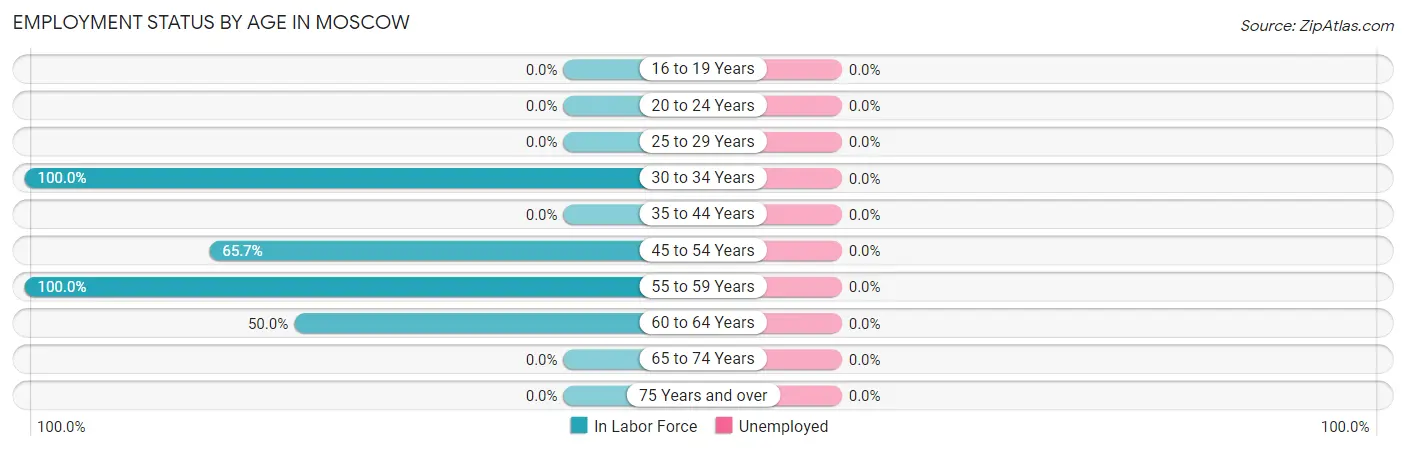
| Age Bracket | In Labor Force | Unemployed |
| 16 to 19 Years | 0 (0.0%) | 0 (0.0%) |
| 20 to 24 Years | 0 (0.0%) | 0 (0.0%) |
| 25 to 29 Years | 0 (0.0%) | 0 (0.0%) |
| 30 to 34 Years | 26 (100.0%) | 0 (0.0%) |
| 35 to 44 Years | 0 (0.0%) | 0 (0.0%) |
| 45 to 54 Years | 23 (65.7%) | 0 (0.0%) |
| 55 to 59 Years | 90 (100.0%) | 0 (0.0%) |
| 60 to 64 Years | 6 (50.0%) | 0 (0.0%) |
| 65 to 74 Years | 0 (0.0%) | 0 (0.0%) |
| 75 Years and over | 0 (0.0%) | 0 (0.0%) |
| Total | 145 (70.0%) | 0 (0.0%) |
Employment Status by Educational Attainment in Moscow
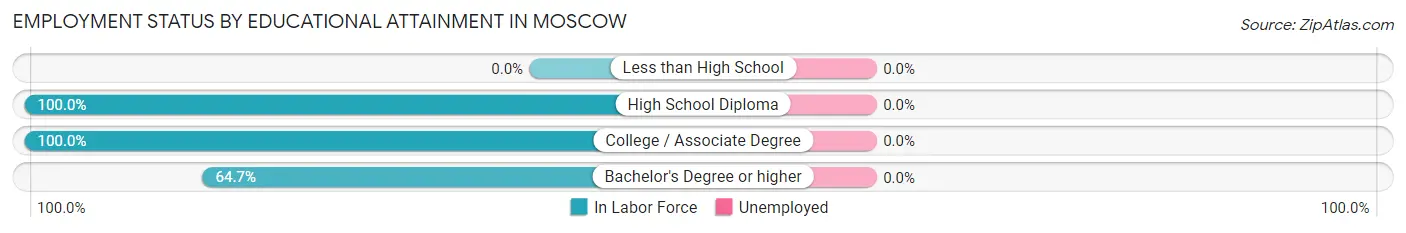
| Educational Attainment | In Labor Force | Unemployed |
| Less than High School | 0 (0.0%) | 0 (0.0%) |
| High School Diploma | 67 (100.0%) | 0 (0.0%) |
| College / Associate Degree | 67 (100.0%) | 0 (0.0%) |
| Bachelor's Degree or higher | 11 (64.7%) | 0 (0.0%) |
| Total | 145 (89.0%) | 0 (0.0%) |
Employment Occupations by Sex in Moscow
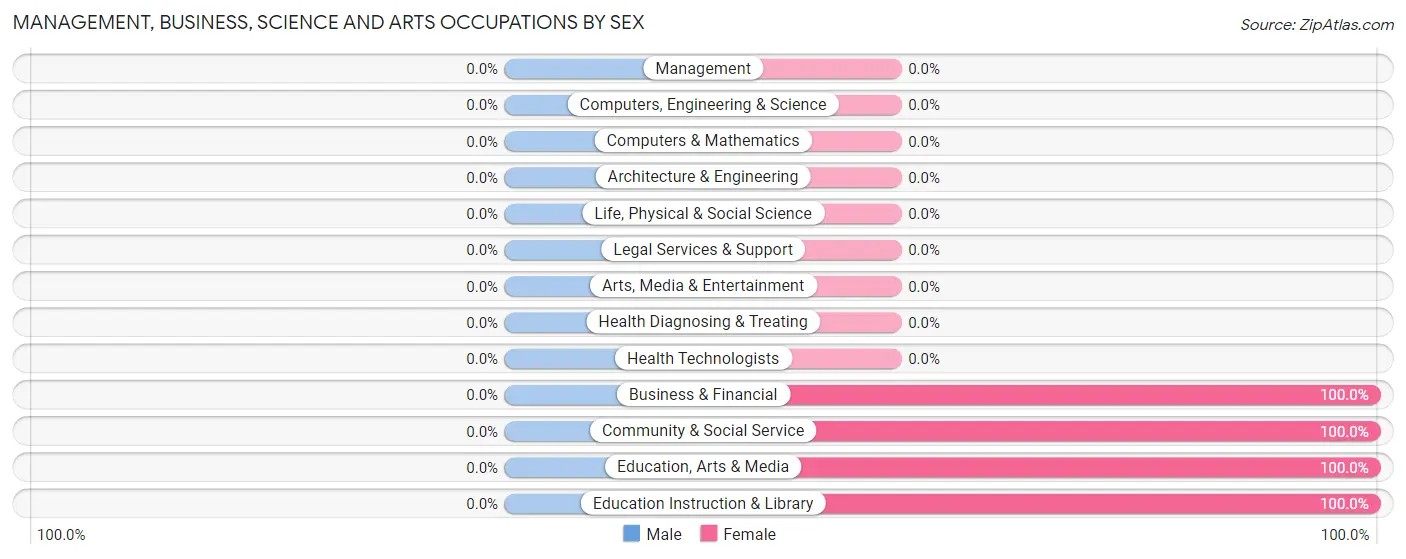
Management, Business, Science and Arts Occupations
The most common Management, Business, Science and Arts occupations in Moscow are Community & Social Service (50 | 34.5%), Education Instruction & Library (39 | 26.9%), Business & Financial (12 | 8.3%), and Education, Arts & Media (11 | 7.6%).
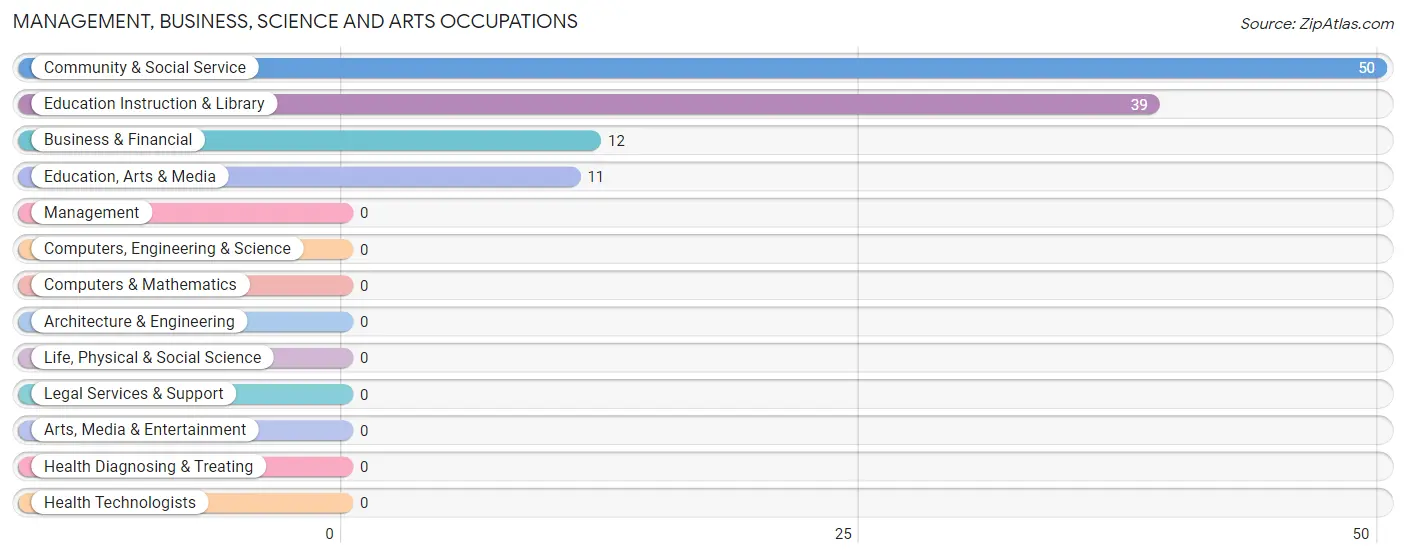
Management, Business, Science and Arts Occupations by Sex
| Occupation | Male | Female |
| Management | 0 (0.0%) | 0 (0.0%) |
| Business & Financial | 0 (0.0%) | 12 (100.0%) |
| Computers, Engineering & Science | 0 (0.0%) | 0 (0.0%) |
| Computers & Mathematics | 0 (0.0%) | 0 (0.0%) |
| Architecture & Engineering | 0 (0.0%) | 0 (0.0%) |
| Life, Physical & Social Science | 0 (0.0%) | 0 (0.0%) |
| Community & Social Service | 0 (0.0%) | 50 (100.0%) |
| Education, Arts & Media | 0 (0.0%) | 11 (100.0%) |
| Legal Services & Support | 0 (0.0%) | 0 (0.0%) |
| Education Instruction & Library | 0 (0.0%) | 39 (100.0%) |
| Arts, Media & Entertainment | 0 (0.0%) | 0 (0.0%) |
| Health Diagnosing & Treating | 0 (0.0%) | 0 (0.0%) |
| Health Technologists | 0 (0.0%) | 0 (0.0%) |
| Total (Category) | 0 (0.0%) | 62 (100.0%) |
| Total (Overall) | 51 (35.2%) | 94 (64.8%) |
Services Occupations
Services Occupations by Sex
| Occupation | Male | Female |
| Healthcare Support | 0 (0.0%) | 0 (0.0%) |
| Security & Protection | 0 (0.0%) | 0 (0.0%) |
| Firefighting & Prevention | 0 (0.0%) | 0 (0.0%) |
| Law Enforcement | 0 (0.0%) | 0 (0.0%) |
| Food Preparation & Serving | 0 (0.0%) | 0 (0.0%) |
| Cleaning & Maintenance | 0 (0.0%) | 0 (0.0%) |
| Personal Care & Service | 0 (0.0%) | 0 (0.0%) |
| Total (Category) | 0 (0.0%) | 0 (0.0%) |
| Total (Overall) | 51 (35.2%) | 94 (64.8%) |
Sales and Office Occupations
The most common Sales and Office occupations in Moscow are , and Office & Administration (32 | 22.1%).
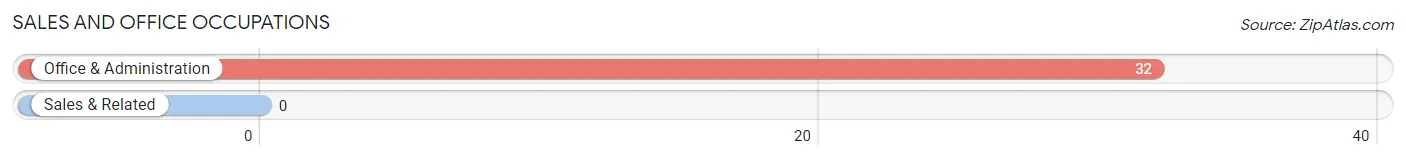
Sales and Office Occupations by Sex

| Occupation | Male | Female |
| Sales & Related | 0 (0.0%) | 0 (0.0%) |
| Office & Administration | 0 (0.0%) | 32 (100.0%) |
| Total (Category) | 0 (0.0%) | 32 (100.0%) |
| Total (Overall) | 51 (35.2%) | 94 (64.8%) |
Natural Resources, Construction and Maintenance Occupations
The most common Natural Resources, Construction and Maintenance occupations in Moscow are , and Construction & Extraction (10 | 6.9%).
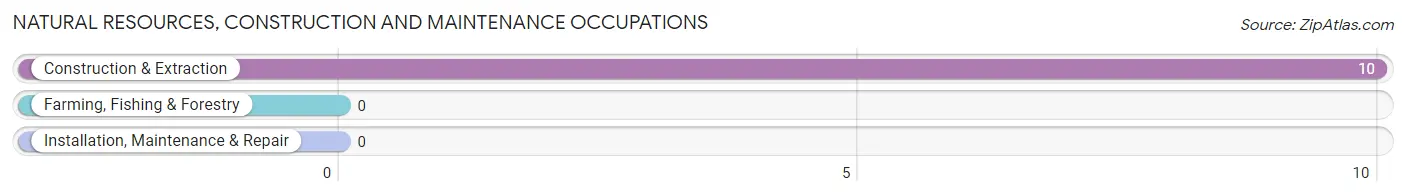
Natural Resources, Construction and Maintenance Occupations by Sex
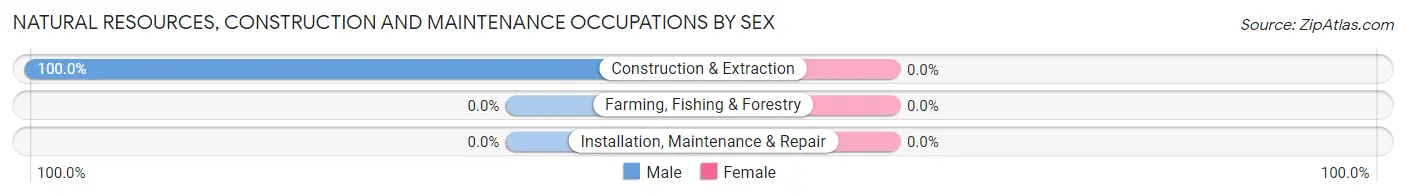
| Occupation | Male | Female |
| Farming, Fishing & Forestry | 0 (0.0%) | 0 (0.0%) |
| Construction & Extraction | 10 (100.0%) | 0 (0.0%) |
| Installation, Maintenance & Repair | 0 (0.0%) | 0 (0.0%) |
| Total (Category) | 10 (100.0%) | 0 (0.0%) |
| Total (Overall) | 51 (35.2%) | 94 (64.8%) |
Production, Transportation and Moving Occupations
The most common Production, Transportation and Moving occupations in Moscow are , and Production (41 | 28.3%).
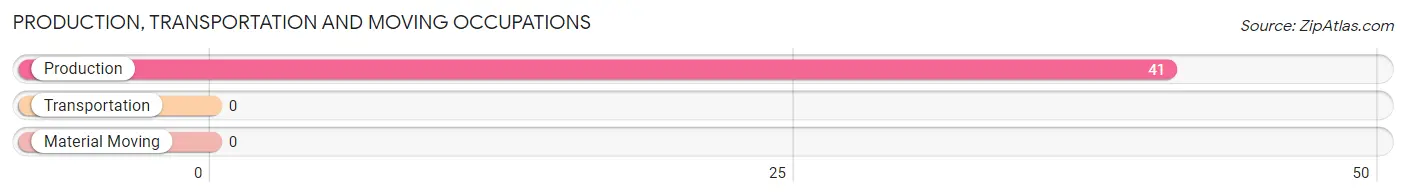
Production, Transportation and Moving Occupations by Sex
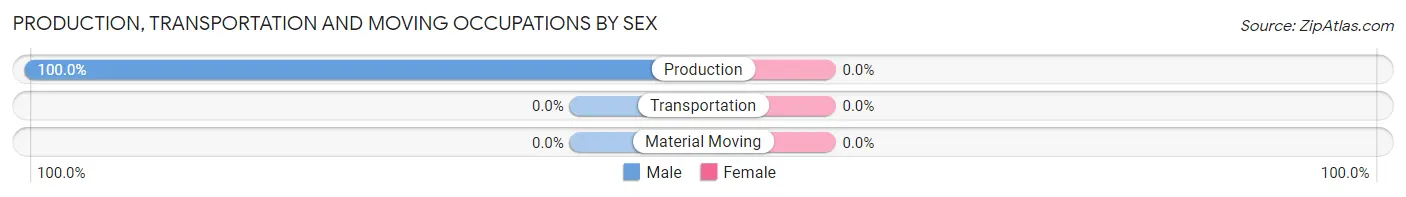
| Occupation | Male | Female |
| Production | 41 (100.0%) | 0 (0.0%) |
| Transportation | 0 (0.0%) | 0 (0.0%) |
| Material Moving | 0 (0.0%) | 0 (0.0%) |
| Total (Category) | 41 (100.0%) | 0 (0.0%) |
| Total (Overall) | 51 (35.2%) | 94 (64.8%) |
Employment Industries by Sex in Moscow
Employment Industries in Moscow
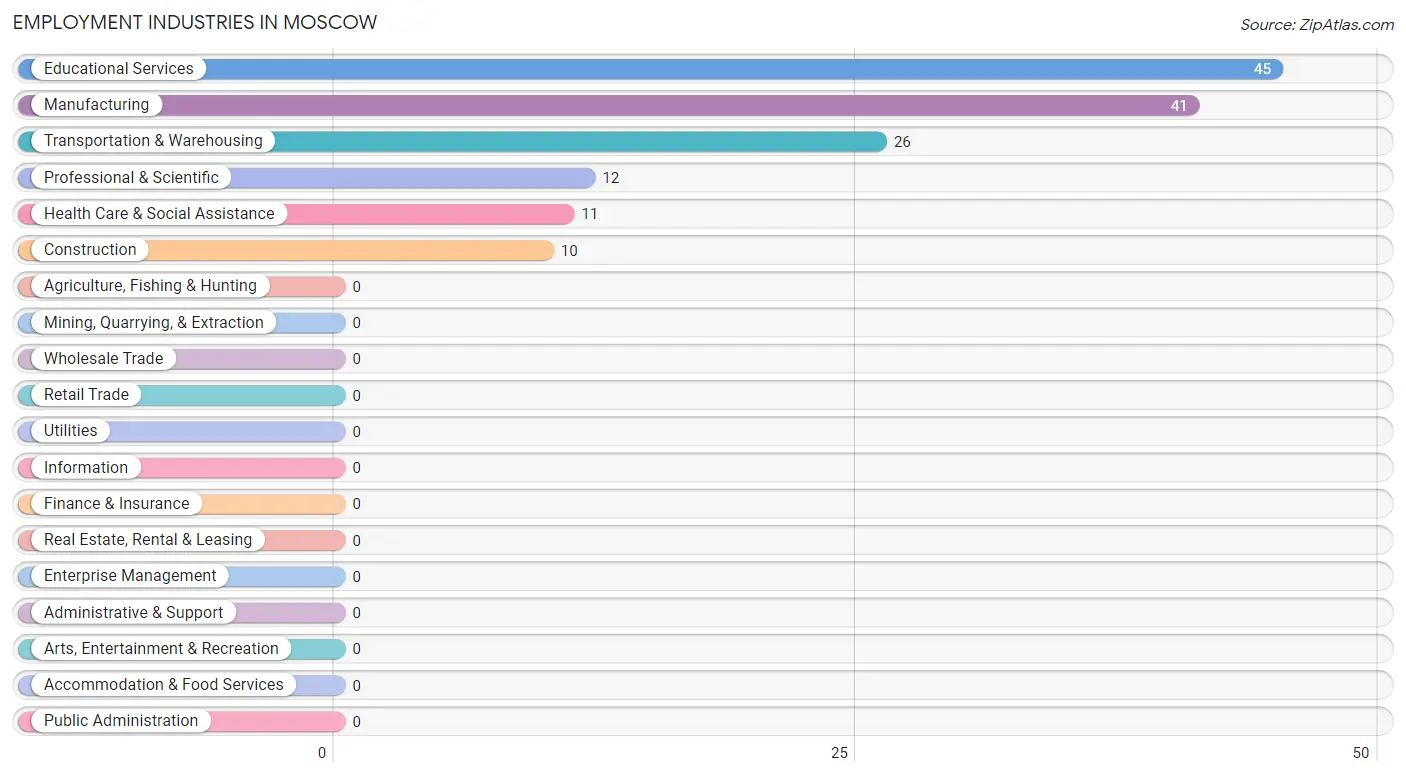
The major employment industries in Moscow include Educational Services (45 | 31.0%), Manufacturing (41 | 28.3%), Transportation & Warehousing (26 | 17.9%), Professional & Scientific (12 | 8.3%), and Health Care & Social Assistance (11 | 7.6%).
Employment Industries by Sex in Moscow
The Moscow industries that see more men than women are Construction (100.0%), and Manufacturing (100.0%), whereas the industries that tend to have a higher number of women are Transportation & Warehousing (100.0%), Professional & Scientific (100.0%), and Educational Services (100.0%).
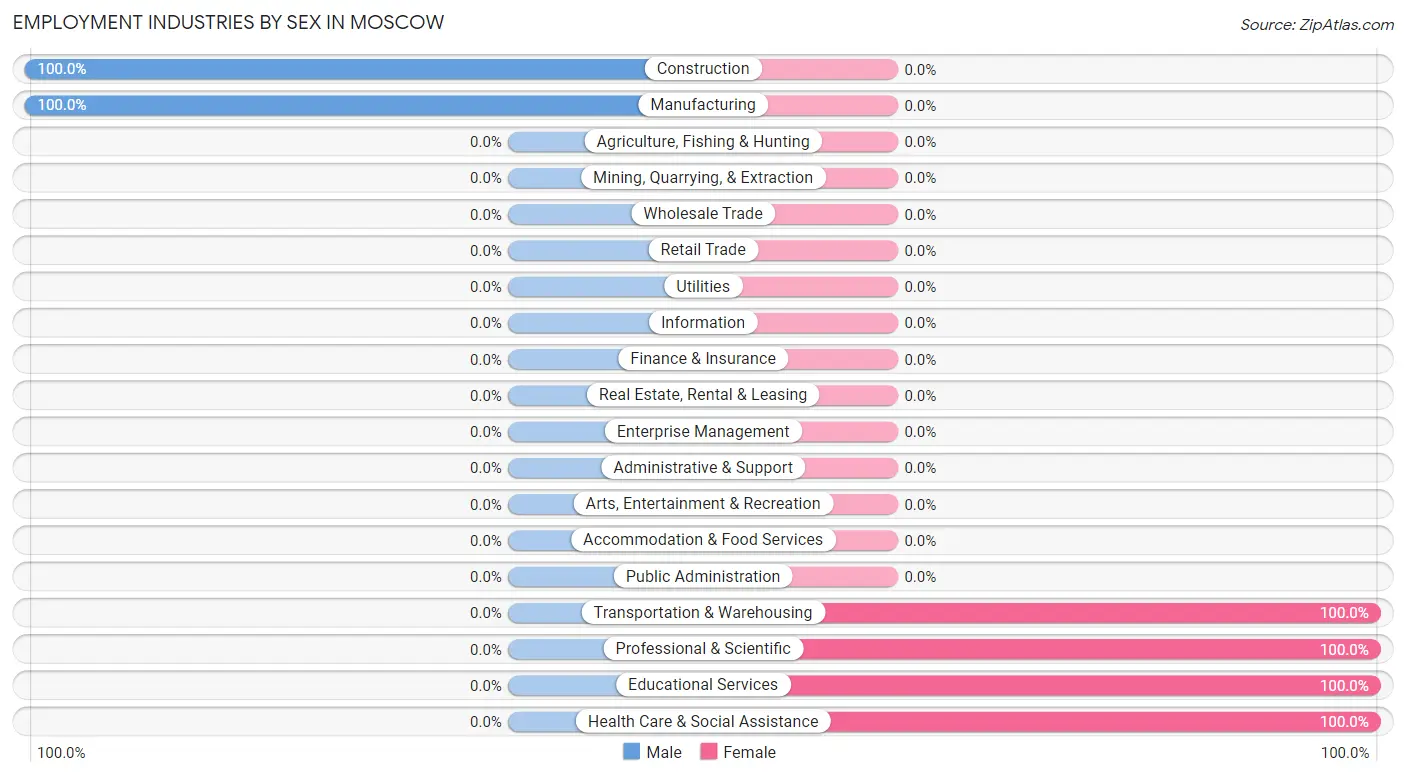
| Industry | Male | Female |
| Agriculture, Fishing & Hunting | 0 (0.0%) | 0 (0.0%) |
| Mining, Quarrying, & Extraction | 0 (0.0%) | 0 (0.0%) |
| Construction | 10 (100.0%) | 0 (0.0%) |
| Manufacturing | 41 (100.0%) | 0 (0.0%) |
| Wholesale Trade | 0 (0.0%) | 0 (0.0%) |
| Retail Trade | 0 (0.0%) | 0 (0.0%) |
| Transportation & Warehousing | 0 (0.0%) | 26 (100.0%) |
| Utilities | 0 (0.0%) | 0 (0.0%) |
| Information | 0 (0.0%) | 0 (0.0%) |
| Finance & Insurance | 0 (0.0%) | 0 (0.0%) |
| Real Estate, Rental & Leasing | 0 (0.0%) | 0 (0.0%) |
| Professional & Scientific | 0 (0.0%) | 12 (100.0%) |
| Enterprise Management | 0 (0.0%) | 0 (0.0%) |
| Administrative & Support | 0 (0.0%) | 0 (0.0%) |
| Educational Services | 0 (0.0%) | 45 (100.0%) |
| Health Care & Social Assistance | 0 (0.0%) | 11 (100.0%) |
| Arts, Entertainment & Recreation | 0 (0.0%) | 0 (0.0%) |
| Accommodation & Food Services | 0 (0.0%) | 0 (0.0%) |
| Public Administration | 0 (0.0%) | 0 (0.0%) |
| Total | 51 (35.2%) | 94 (64.8%) |
Education in Moscow
School Enrollment in Moscow
The most common levels of schooling among the 22 students in Moscow are high school (12 | 54.5%), and middle school (10 | 45.5%).
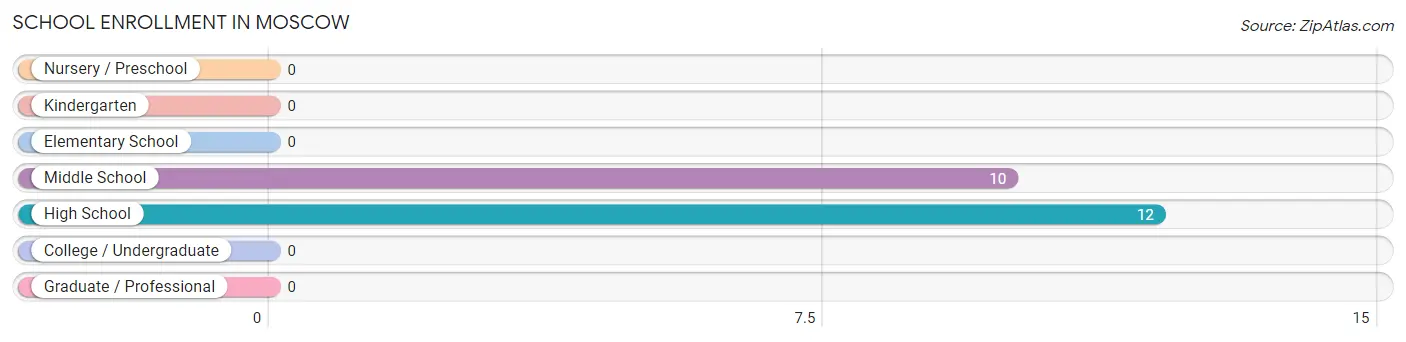
| School Level | # Students | % Students |
| Nursery / Preschool | 0 | 0.0% |
| Kindergarten | 0 | 0.0% |
| Elementary School | 0 | 0.0% |
| Middle School | 10 | 45.5% |
| High School | 12 | 54.5% |
| College / Undergraduate | 0 | 0.0% |
| Graduate / Professional | 0 | 0.0% |
| Total | 22 | 100.0% |
School Enrollment by Age by Funding Source in Moscow
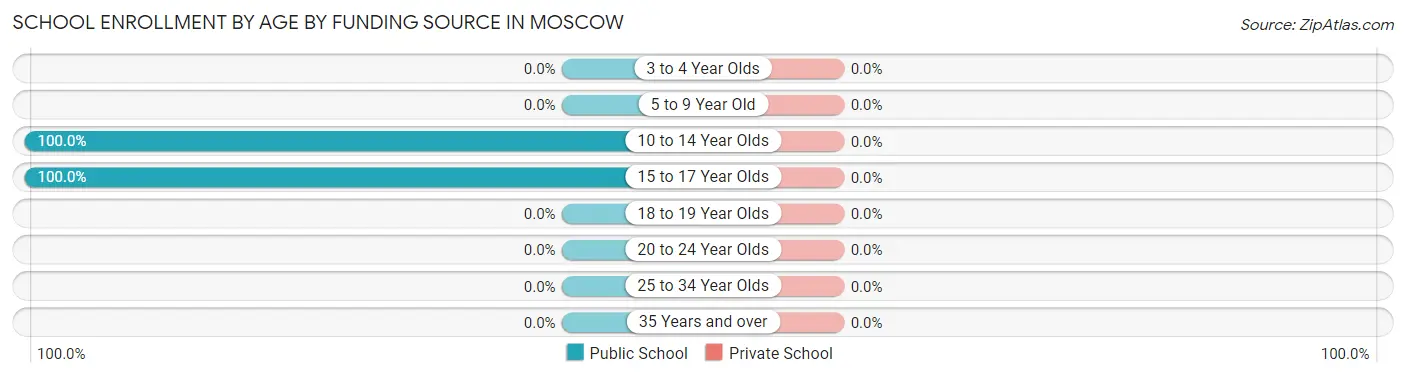
| Age Bracket | Public School | Private School |
| 3 to 4 Year Olds | 0 (0.0%) | 0 (0.0%) |
| 5 to 9 Year Old | 0 (0.0%) | 0 (0.0%) |
| 10 to 14 Year Olds | 10 (100.0%) | 0 (0.0%) |
| 15 to 17 Year Olds | 12 (100.0%) | 0 (0.0%) |
| 18 to 19 Year Olds | 0 (0.0%) | 0 (0.0%) |
| 20 to 24 Year Olds | 0 (0.0%) | 0 (0.0%) |
| 25 to 34 Year Olds | 0 (0.0%) | 0 (0.0%) |
| 35 Years and over | 0 (0.0%) | 0 (0.0%) |
| Total | 22 (100.0%) | 0 (0.0%) |
Educational Attainment by Field of Study in Moscow
Bio, nature & agricultural (11 | 64.7%), and visual & performing arts (6 | 35.3%) are the most common fields of study among 17 individuals in Moscow who have obtained a bachelor's degree or higher.
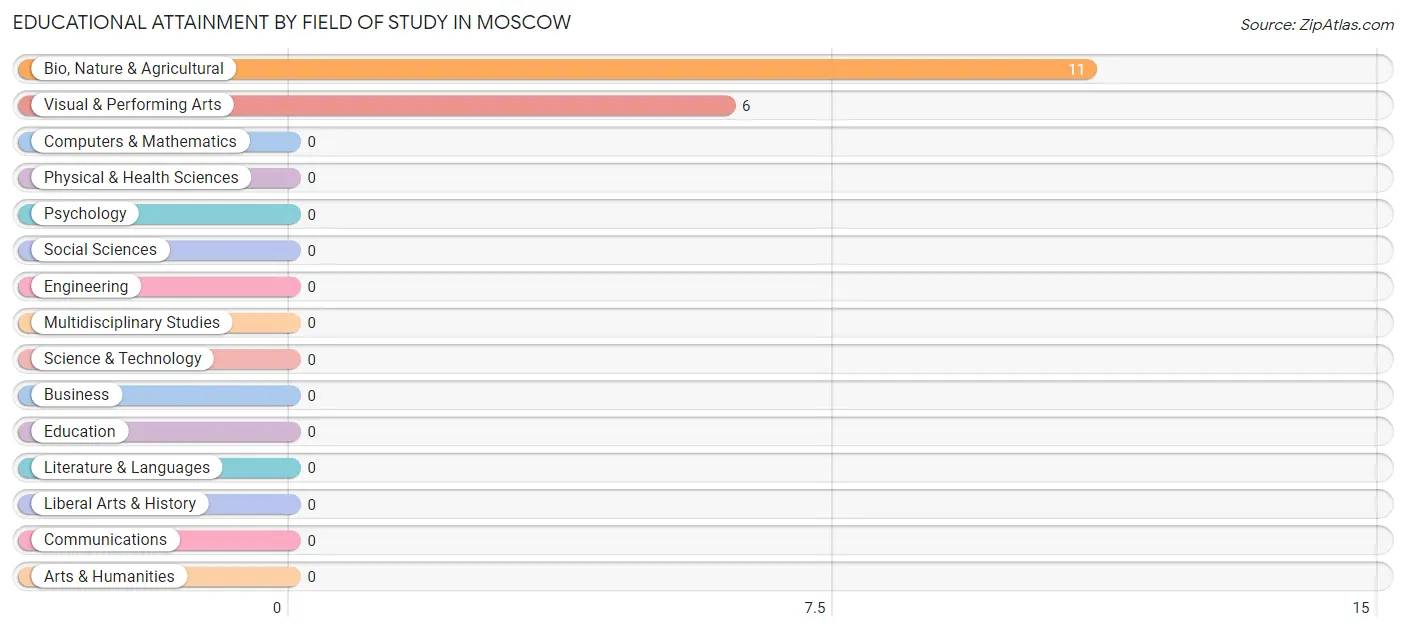
| Field of Study | # Graduates | % Graduates |
| Computers & Mathematics | 0 | 0.0% |
| Bio, Nature & Agricultural | 11 | 64.7% |
| Physical & Health Sciences | 0 | 0.0% |
| Psychology | 0 | 0.0% |
| Social Sciences | 0 | 0.0% |
| Engineering | 0 | 0.0% |
| Multidisciplinary Studies | 0 | 0.0% |
| Science & Technology | 0 | 0.0% |
| Business | 0 | 0.0% |
| Education | 0 | 0.0% |
| Literature & Languages | 0 | 0.0% |
| Liberal Arts & History | 0 | 0.0% |
| Visual & Performing Arts | 6 | 35.3% |
| Communications | 0 | 0.0% |
| Arts & Humanities | 0 | 0.0% |
| Total | 17 | 100.0% |
Transportation & Commute in Moscow
Vehicle Availability by Sex in Moscow
The most prevalent vehicle ownership categories in Moscow are males with 2 vehicles (51, accounting for 100.0%) and females with 2 vehicles (56, making up 54.3%).
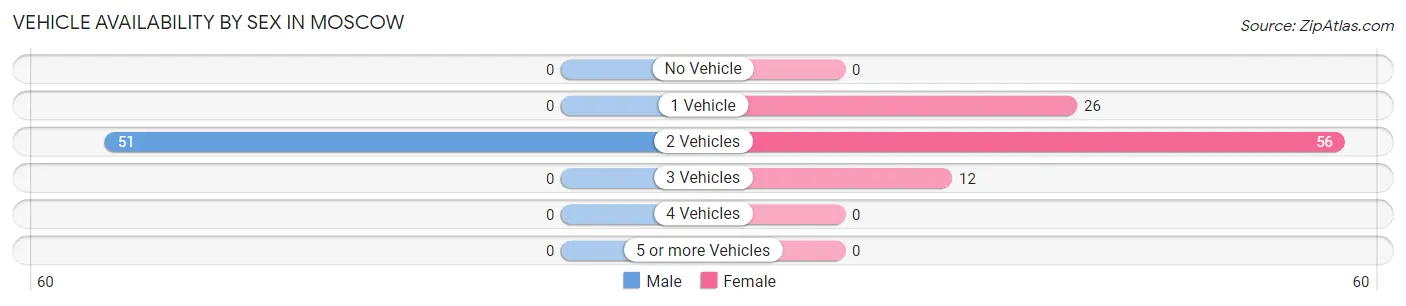
| Vehicles Available | Male | Female |
| No Vehicle | 0 (0.0%) | 0 (0.0%) |
| 1 Vehicle | 0 (0.0%) | 26 (27.7%) |
| 2 Vehicles | 51 (100.0%) | 56 (59.6%) |
| 3 Vehicles | 0 (0.0%) | 12 (12.8%) |
| 4 Vehicles | 0 (0.0%) | 0 (0.0%) |
| 5 or more Vehicles | 0 (0.0%) | 0 (0.0%) |
| Total | 51 (100.0%) | 94 (100.0%) |
Commute Time in Moscow
The most frequently occuring commute durations in Moscow are 30 to 34 minutes (50 commuters, 34.5%), 15 to 19 minutes (41 commuters, 28.3%), and 45 to 59 minutes (26 commuters, 17.9%).
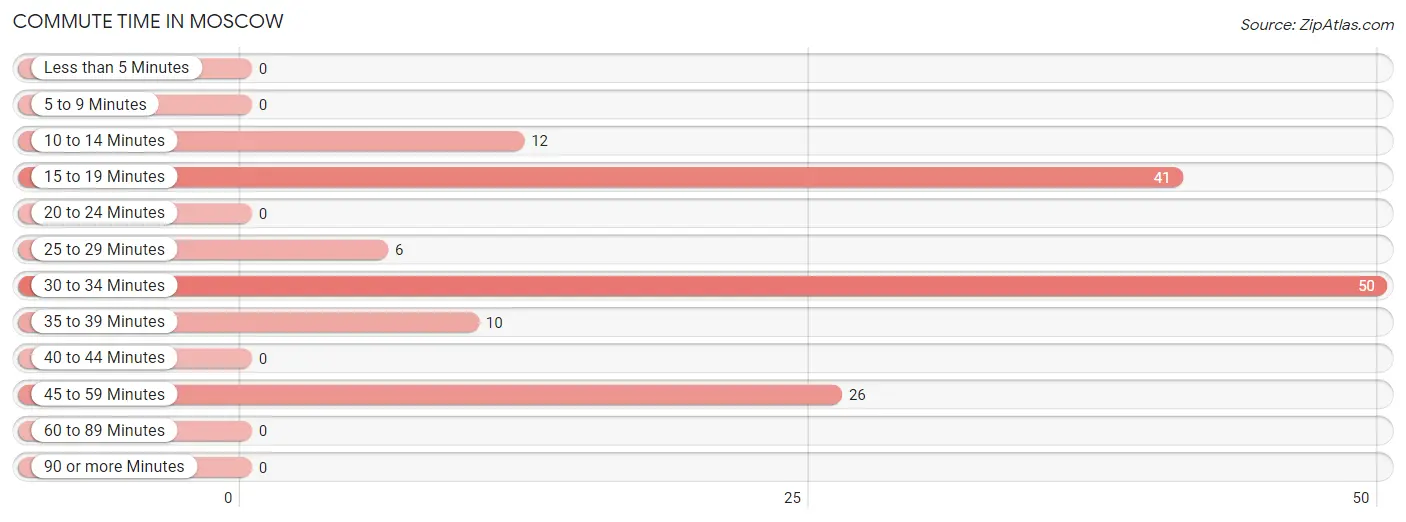
| Commute Time | # Commuters | % Commuters |
| Less than 5 Minutes | 0 | 0.0% |
| 5 to 9 Minutes | 0 | 0.0% |
| 10 to 14 Minutes | 12 | 8.3% |
| 15 to 19 Minutes | 41 | 28.3% |
| 20 to 24 Minutes | 0 | 0.0% |
| 25 to 29 Minutes | 6 | 4.1% |
| 30 to 34 Minutes | 50 | 34.5% |
| 35 to 39 Minutes | 10 | 6.9% |
| 40 to 44 Minutes | 0 | 0.0% |
| 45 to 59 Minutes | 26 | 17.9% |
| 60 to 89 Minutes | 0 | 0.0% |
| 90 or more Minutes | 0 | 0.0% |
Commute Time by Sex in Moscow
The most common commute times in Moscow are 15 to 19 minutes (41 commuters, 80.4%) for males and 30 to 34 minutes (50 commuters, 53.2%) for females.
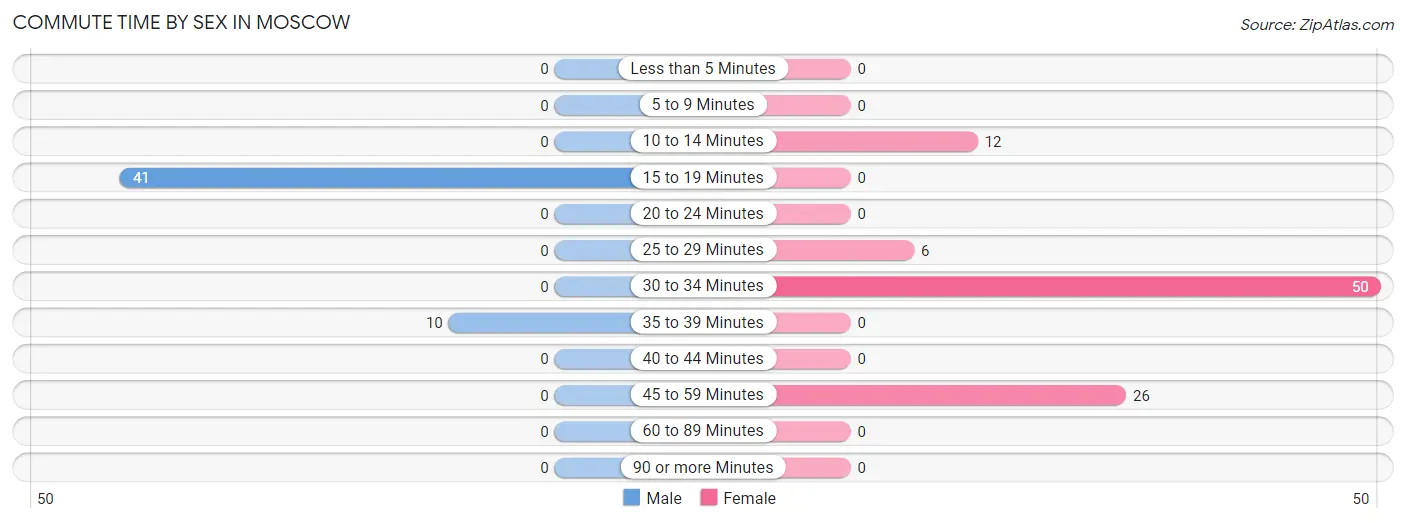
| Commute Time | Male | Female |
| Less than 5 Minutes | 0 (0.0%) | 0 (0.0%) |
| 5 to 9 Minutes | 0 (0.0%) | 0 (0.0%) |
| 10 to 14 Minutes | 0 (0.0%) | 12 (12.8%) |
| 15 to 19 Minutes | 41 (80.4%) | 0 (0.0%) |
| 20 to 24 Minutes | 0 (0.0%) | 0 (0.0%) |
| 25 to 29 Minutes | 0 (0.0%) | 6 (6.4%) |
| 30 to 34 Minutes | 0 (0.0%) | 50 (53.2%) |
| 35 to 39 Minutes | 10 (19.6%) | 0 (0.0%) |
| 40 to 44 Minutes | 0 (0.0%) | 0 (0.0%) |
| 45 to 59 Minutes | 0 (0.0%) | 26 (27.7%) |
| 60 to 89 Minutes | 0 (0.0%) | 0 (0.0%) |
| 90 or more Minutes | 0 (0.0%) | 0 (0.0%) |
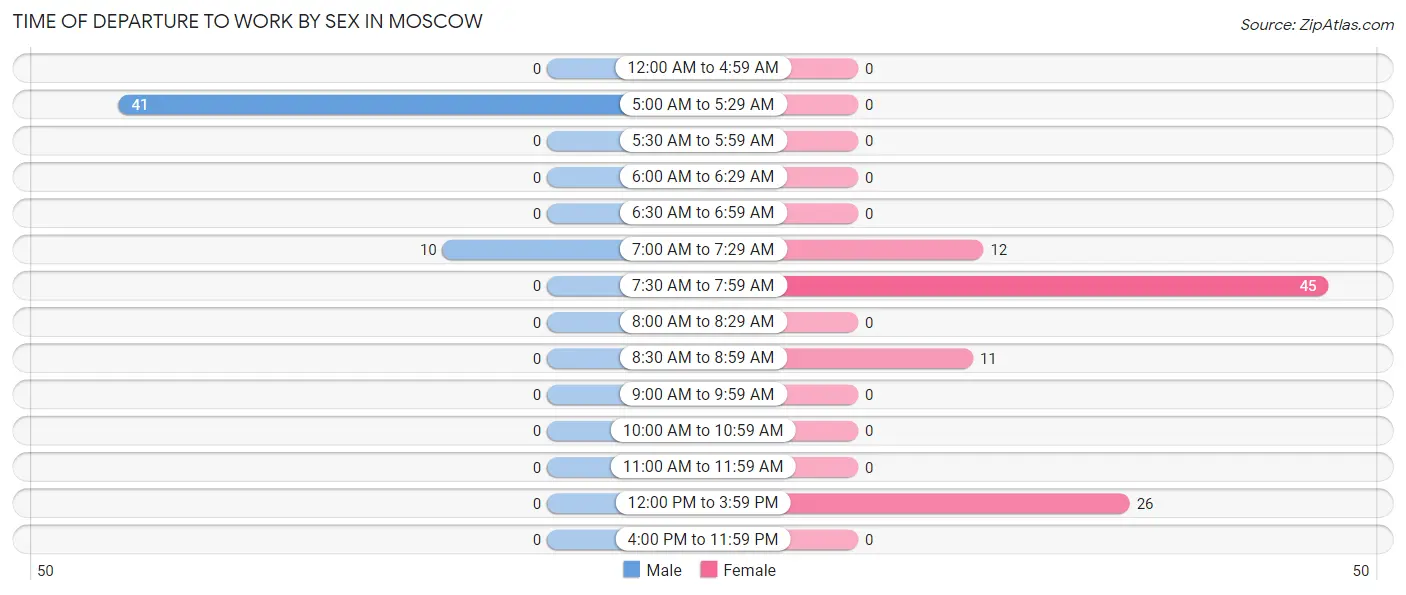
Time of Departure to Work by Sex in Moscow
The most frequent times of departure to work in Moscow are 5:00 AM to 5:29 AM (41, 80.4%) for males and 7:30 AM to 7:59 AM (45, 47.9%) for females.
| Time of Departure | Male | Female |
| 12:00 AM to 4:59 AM | 0 (0.0%) | 0 (0.0%) |
| 5:00 AM to 5:29 AM | 41 (80.4%) | 0 (0.0%) |
| 5:30 AM to 5:59 AM | 0 (0.0%) | 0 (0.0%) |
| 6:00 AM to 6:29 AM | 0 (0.0%) | 0 (0.0%) |
| 6:30 AM to 6:59 AM | 0 (0.0%) | 0 (0.0%) |
| 7:00 AM to 7:29 AM | 10 (19.6%) | 12 (12.8%) |
| 7:30 AM to 7:59 AM | 0 (0.0%) | 45 (47.9%) |
| 8:00 AM to 8:29 AM | 0 (0.0%) | 0 (0.0%) |
| 8:30 AM to 8:59 AM | 0 (0.0%) | 11 (11.7%) |
| 9:00 AM to 9:59 AM | 0 (0.0%) | 0 (0.0%) |
| 10:00 AM to 10:59 AM | 0 (0.0%) | 0 (0.0%) |
| 11:00 AM to 11:59 AM | 0 (0.0%) | 0 (0.0%) |
| 12:00 PM to 3:59 PM | 0 (0.0%) | 26 (27.7%) |
| 4:00 PM to 11:59 PM | 0 (0.0%) | 0 (0.0%) |
| Total | 51 (100.0%) | 94 (100.0%) |
Housing Occupancy in Moscow
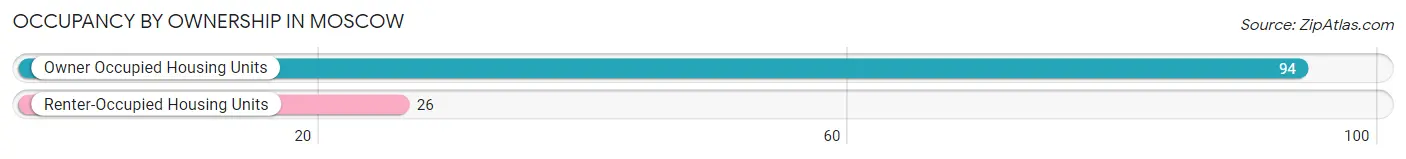
Occupancy by Ownership in Moscow
Of the total 120 dwellings in Moscow, owner-occupied units account for 94 (78.3%), while renter-occupied units make up 26 (21.7%).
| Occupancy | # Housing Units | % Housing Units |
| Owner Occupied Housing Units | 94 | 78.3% |
| Renter-Occupied Housing Units | 26 | 21.7% |
| Total Occupied Housing Units | 120 | 100.0% |
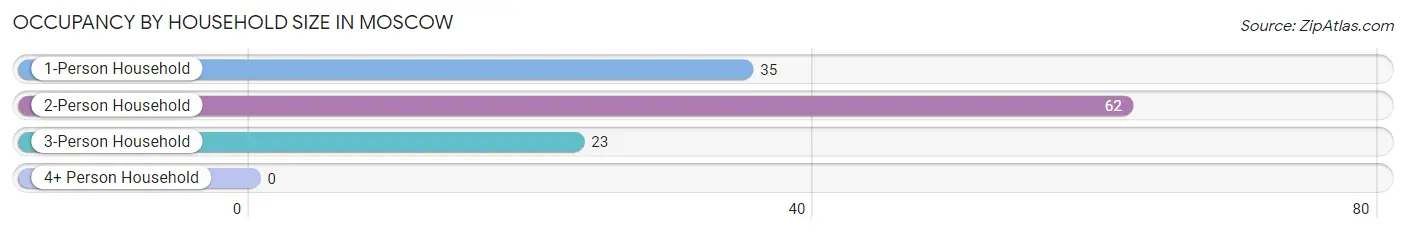
Occupancy by Household Size in Moscow
| Household Size | # Housing Units | % Housing Units |
| 1-Person Household | 35 | 29.2% |
| 2-Person Household | 62 | 51.7% |
| 3-Person Household | 23 | 19.2% |
| 4+ Person Household | 0 | 0.0% |
| Total Housing Units | 120 | 100.0% |
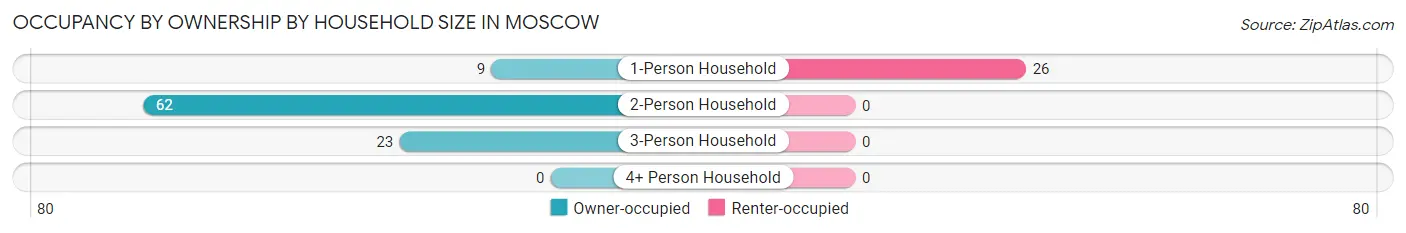
Occupancy by Ownership by Household Size in Moscow
| Household Size | Owner-occupied | Renter-occupied |
| 1-Person Household | 9 (25.7%) | 26 (74.3%) |
| 2-Person Household | 62 (100.0%) | 0 (0.0%) |
| 3-Person Household | 23 (100.0%) | 0 (0.0%) |
| 4+ Person Household | 0 (0.0%) | 0 (0.0%) |
| Total Housing Units | 94 (78.3%) | 26 (21.7%) |
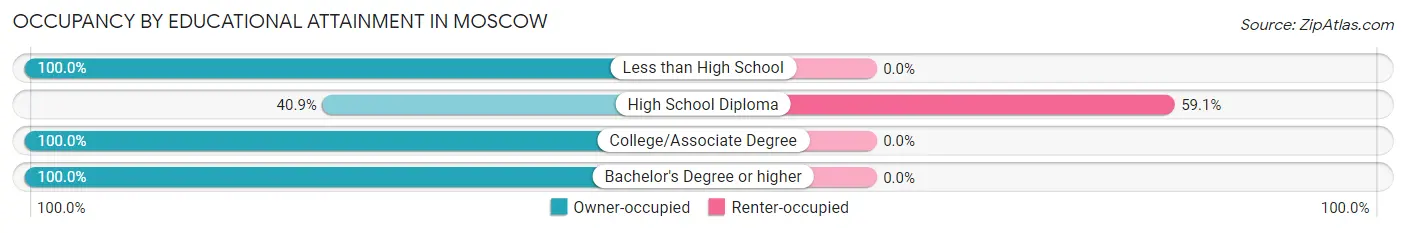
Occupancy by Educational Attainment in Moscow
| Household Size | Owner-occupied | Renter-occupied |
| Less than High School | 8 (100.0%) | 0 (0.0%) |
| High School Diploma | 18 (40.9%) | 26 (59.1%) |
| College/Associate Degree | 51 (100.0%) | 0 (0.0%) |
| Bachelor's Degree or higher | 17 (100.0%) | 0 (0.0%) |
Occupancy by Age of Householder in Moscow
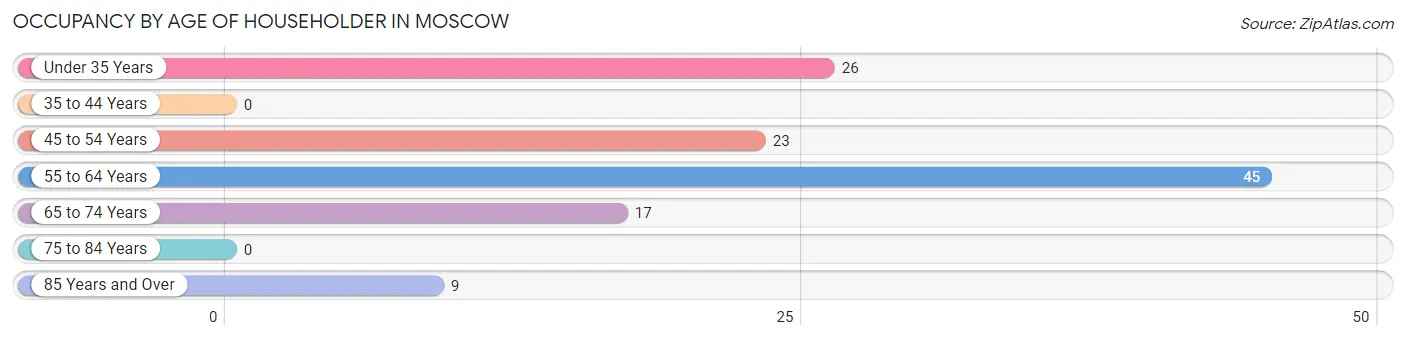
| Age Bracket | # Households | % Households |
| Under 35 Years | 26 | 21.7% |
| 35 to 44 Years | 0 | 0.0% |
| 45 to 54 Years | 23 | 19.2% |
| 55 to 64 Years | 45 | 37.5% |
| 65 to 74 Years | 17 | 14.2% |
| 75 to 84 Years | 0 | 0.0% |
| 85 Years and Over | 9 | 7.5% |
| Total | 120 | 100.0% |
Housing Finances in Moscow
Median Income by Occupancy in Moscow
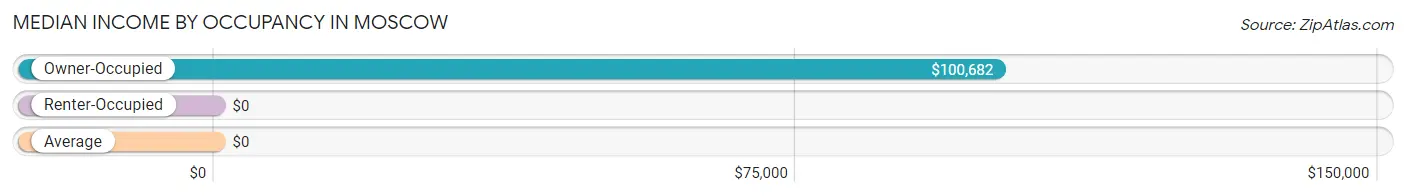
| Occupancy Type | # Households | Median Income |
| Owner-Occupied | 94 (78.3%) | $100,682 |
| Renter-Occupied | 26 (21.7%) | $0 |
| Average | 120 (100.0%) | $0 |
Occupancy by Householder Income Bracket in Moscow
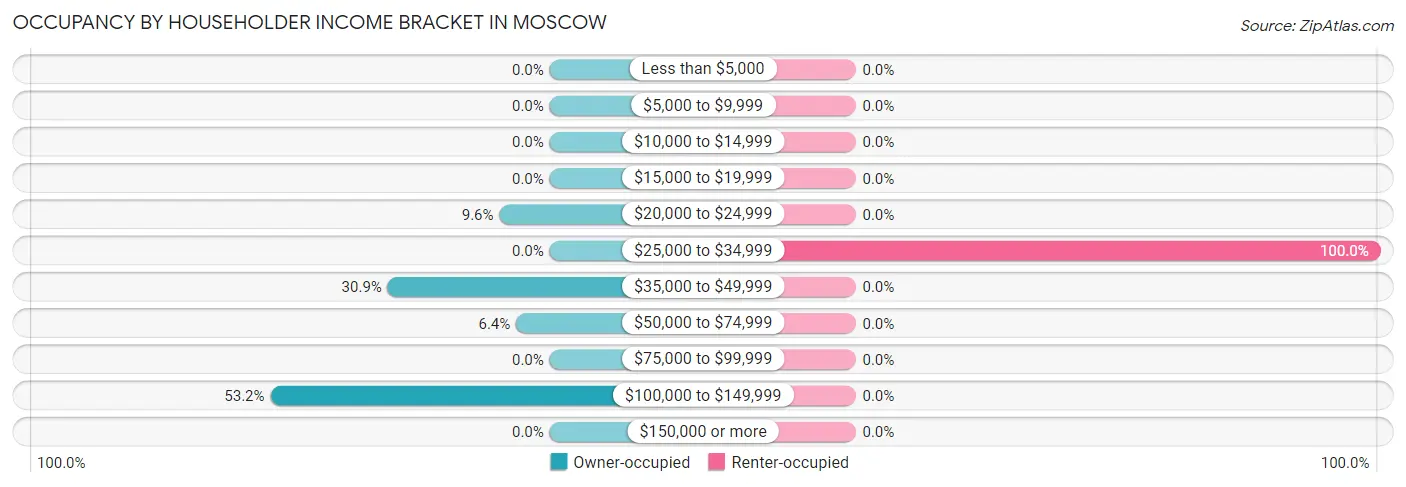
| Income Bracket | Owner-occupied | Renter-occupied |
| Less than $5,000 | 0 (0.0%) | 0 (0.0%) |
| $5,000 to $9,999 | 0 (0.0%) | 0 (0.0%) |
| $10,000 to $14,999 | 0 (0.0%) | 0 (0.0%) |
| $15,000 to $19,999 | 0 (0.0%) | 0 (0.0%) |
| $20,000 to $24,999 | 9 (9.6%) | 0 (0.0%) |
| $25,000 to $34,999 | 0 (0.0%) | 26 (100.0%) |
| $35,000 to $49,999 | 29 (30.8%) | 0 (0.0%) |
| $50,000 to $74,999 | 6 (6.4%) | 0 (0.0%) |
| $75,000 to $99,999 | 0 (0.0%) | 0 (0.0%) |
| $100,000 to $149,999 | 50 (53.2%) | 0 (0.0%) |
| $150,000 or more | 0 (0.0%) | 0 (0.0%) |
| Total | 94 (100.0%) | 26 (100.0%) |
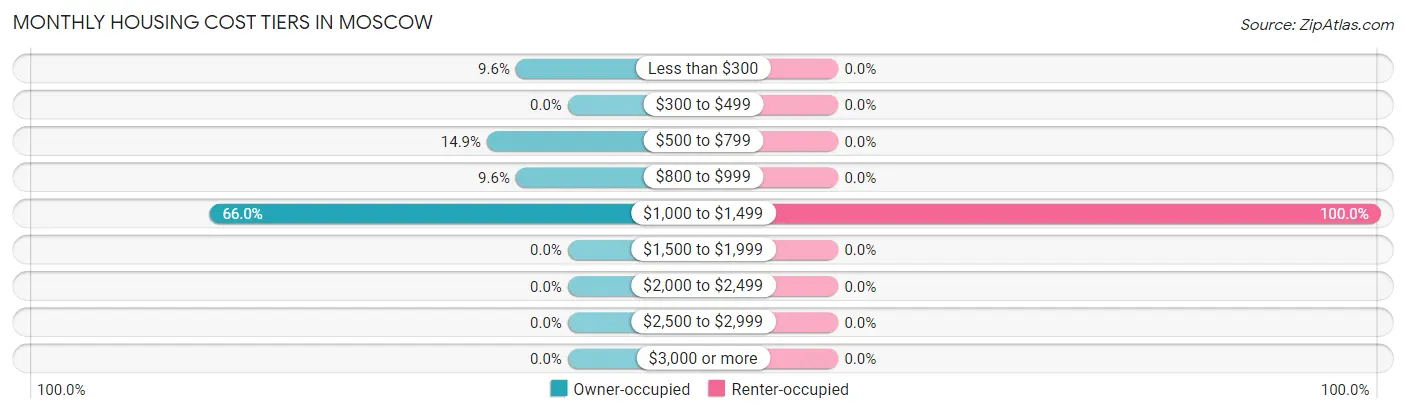
Monthly Housing Cost Tiers in Moscow
| Monthly Cost | Owner-occupied | Renter-occupied |
| Less than $300 | 9 (9.6%) | 0 (0.0%) |
| $300 to $499 | 0 (0.0%) | 0 (0.0%) |
| $500 to $799 | 14 (14.9%) | 0 (0.0%) |
| $800 to $999 | 9 (9.6%) | 0 (0.0%) |
| $1,000 to $1,499 | 62 (66.0%) | 26 (100.0%) |
| $1,500 to $1,999 | 0 (0.0%) | 0 (0.0%) |
| $2,000 to $2,499 | 0 (0.0%) | 0 (0.0%) |
| $2,500 to $2,999 | 0 (0.0%) | 0 (0.0%) |
| $3,000 or more | 0 (0.0%) | 0 (0.0%) |
| Total | 94 (100.0%) | 26 (100.0%) |
Physical Housing Characteristics in Moscow
Housing Structures in Moscow
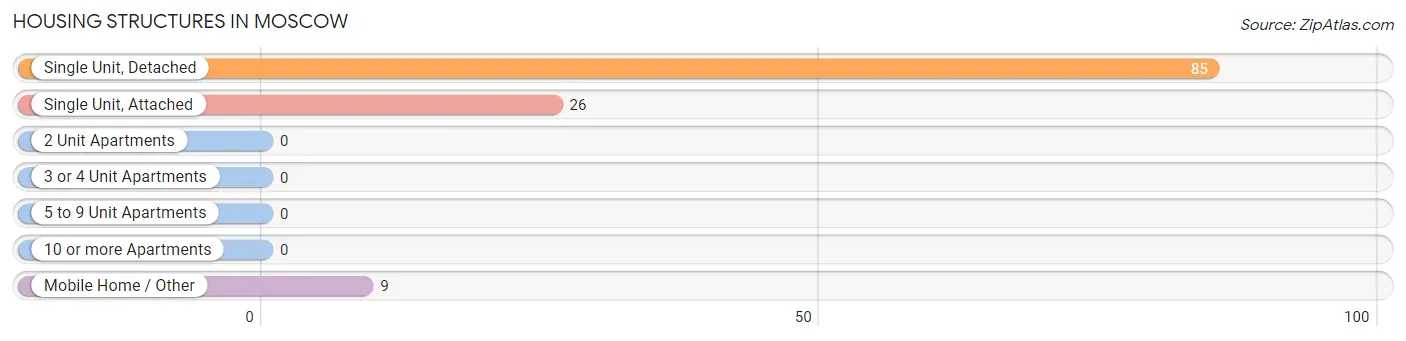
| Structure Type | # Housing Units | % Housing Units |
| Single Unit, Detached | 85 | 70.8% |
| Single Unit, Attached | 26 | 21.7% |
| 2 Unit Apartments | 0 | 0.0% |
| 3 or 4 Unit Apartments | 0 | 0.0% |
| 5 to 9 Unit Apartments | 0 | 0.0% |
| 10 or more Apartments | 0 | 0.0% |
| Mobile Home / Other | 9 | 7.5% |
| Total | 120 | 100.0% |
Housing Structures by Occupancy in Moscow
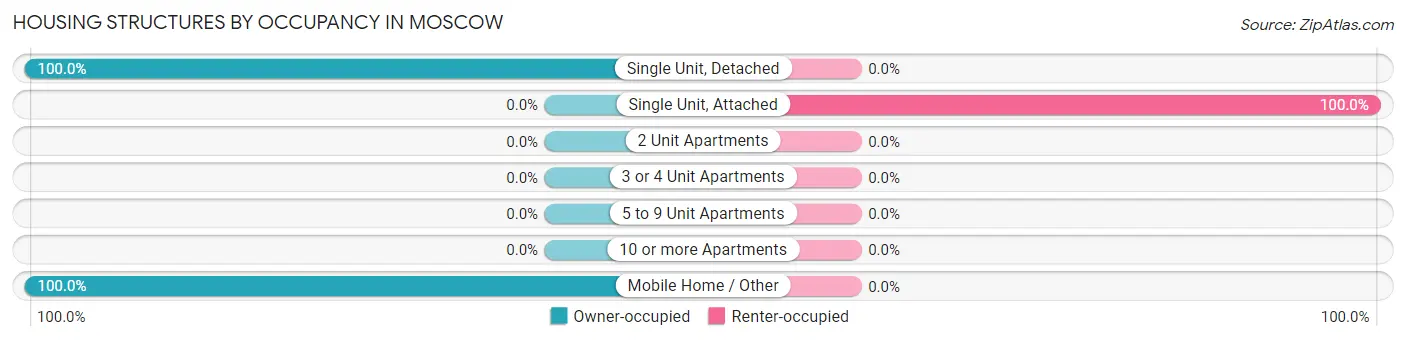
| Structure Type | Owner-occupied | Renter-occupied |
| Single Unit, Detached | 85 (100.0%) | 0 (0.0%) |
| Single Unit, Attached | 0 (0.0%) | 26 (100.0%) |
| 2 Unit Apartments | 0 (0.0%) | 0 (0.0%) |
| 3 or 4 Unit Apartments | 0 (0.0%) | 0 (0.0%) |
| 5 to 9 Unit Apartments | 0 (0.0%) | 0 (0.0%) |
| 10 or more Apartments | 0 (0.0%) | 0 (0.0%) |
| Mobile Home / Other | 9 (100.0%) | 0 (0.0%) |
| Total | 94 (78.3%) | 26 (21.7%) |
Housing Structures by Number of Rooms in Moscow
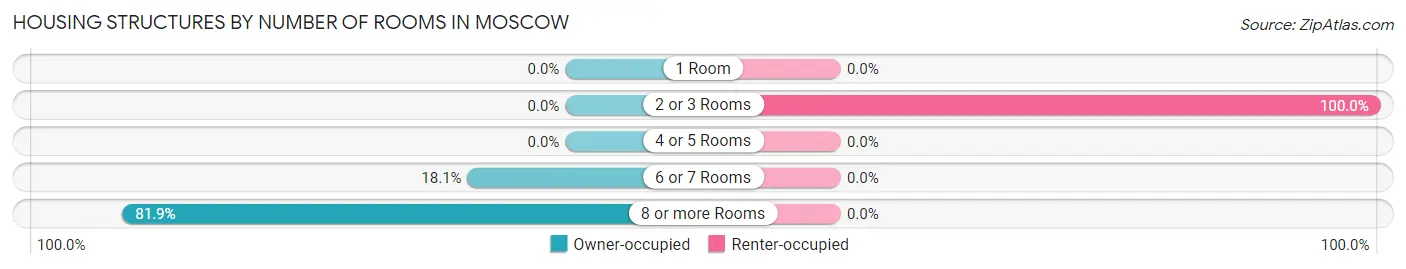
| Number of Rooms | Owner-occupied | Renter-occupied |
| 1 Room | 0 (0.0%) | 0 (0.0%) |
| 2 or 3 Rooms | 0 (0.0%) | 26 (100.0%) |
| 4 or 5 Rooms | 0 (0.0%) | 0 (0.0%) |
| 6 or 7 Rooms | 17 (18.1%) | 0 (0.0%) |
| 8 or more Rooms | 77 (81.9%) | 0 (0.0%) |
| Total | 94 (100.0%) | 26 (100.0%) |
Housing Structure by Heating Type in Moscow
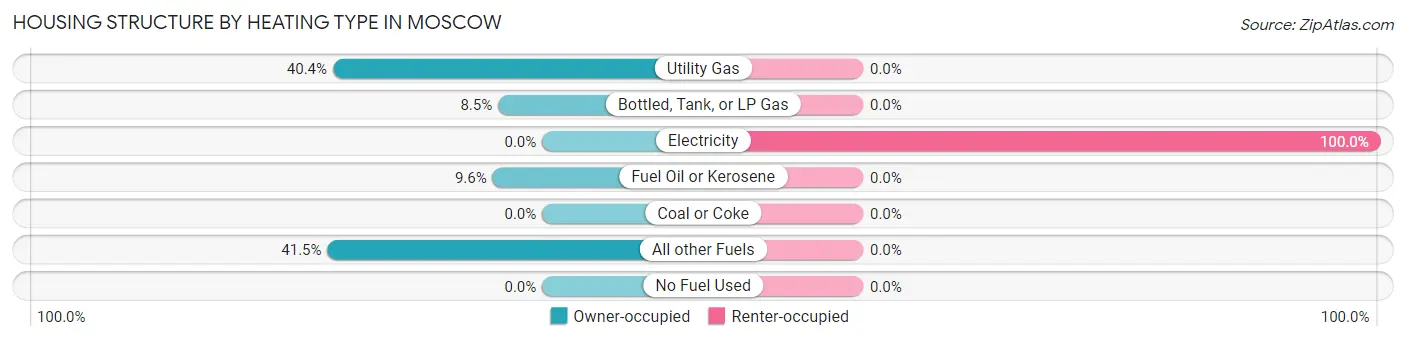
| Heating Type | Owner-occupied | Renter-occupied |
| Utility Gas | 38 (40.4%) | 0 (0.0%) |
| Bottled, Tank, or LP Gas | 8 (8.5%) | 0 (0.0%) |
| Electricity | 0 (0.0%) | 26 (100.0%) |
| Fuel Oil or Kerosene | 9 (9.6%) | 0 (0.0%) |
| Coal or Coke | 0 (0.0%) | 0 (0.0%) |
| All other Fuels | 39 (41.5%) | 0 (0.0%) |
| No Fuel Used | 0 (0.0%) | 0 (0.0%) |
| Total | 94 (100.0%) | 26 (100.0%) |
Household Vehicle Usage in Moscow
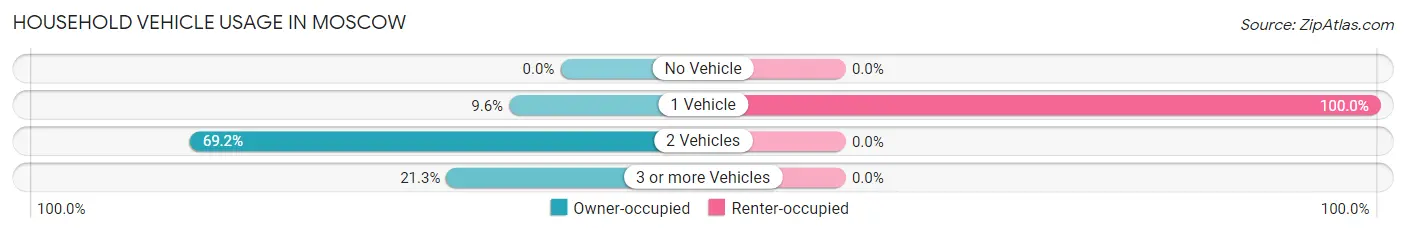
| Vehicles per Household | Owner-occupied | Renter-occupied |
| No Vehicle | 0 (0.0%) | 0 (0.0%) |
| 1 Vehicle | 9 (9.6%) | 26 (100.0%) |
| 2 Vehicles | 65 (69.2%) | 0 (0.0%) |
| 3 or more Vehicles | 20 (21.3%) | 0 (0.0%) |
| Total | 94 (100.0%) | 26 (100.0%) |
Real Estate & Mortgages in Moscow
Real Estate and Mortgage Overview in Moscow
| Characteristic | Without Mortgage | With Mortgage |
| Housing Units | 23 | 71 |
| Median Property Value | $83,100 | $152,200 |
| Median Household Income | $48,281 | $0 |
| Monthly Housing Costs | $642 | $0 |
| Real Estate Taxes | - | - |
Property Value by Mortgage Status in Moscow
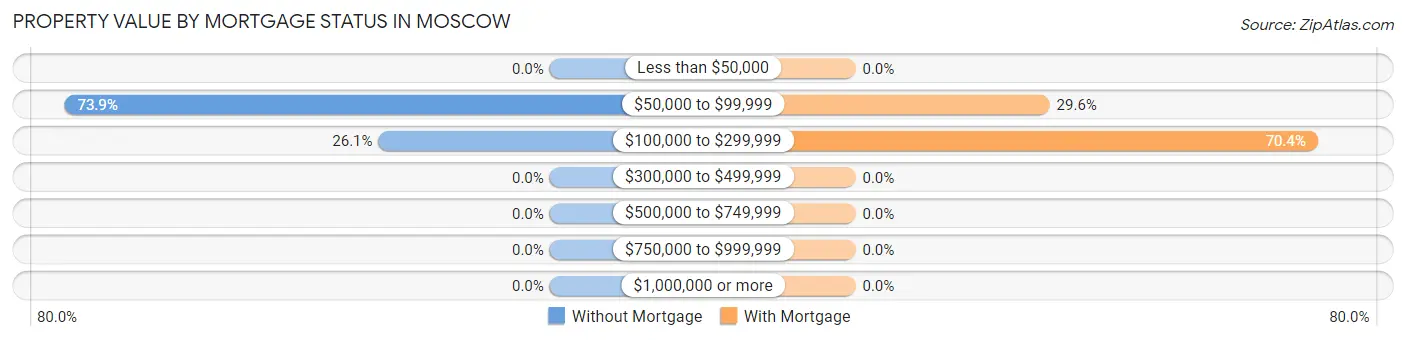
| Property Value | Without Mortgage | With Mortgage |
| Less than $50,000 | 0 (0.0%) | 0 (0.0%) |
| $50,000 to $99,999 | 17 (73.9%) | 21 (29.6%) |
| $100,000 to $299,999 | 6 (26.1%) | 50 (70.4%) |
| $300,000 to $499,999 | 0 (0.0%) | 0 (0.0%) |
| $500,000 to $749,999 | 0 (0.0%) | 0 (0.0%) |
| $750,000 to $999,999 | 0 (0.0%) | 0 (0.0%) |
| $1,000,000 or more | 0 (0.0%) | 0 (0.0%) |
| Total | 23 (100.0%) | 71 (100.0%) |
Household Income by Mortgage Status in Moscow
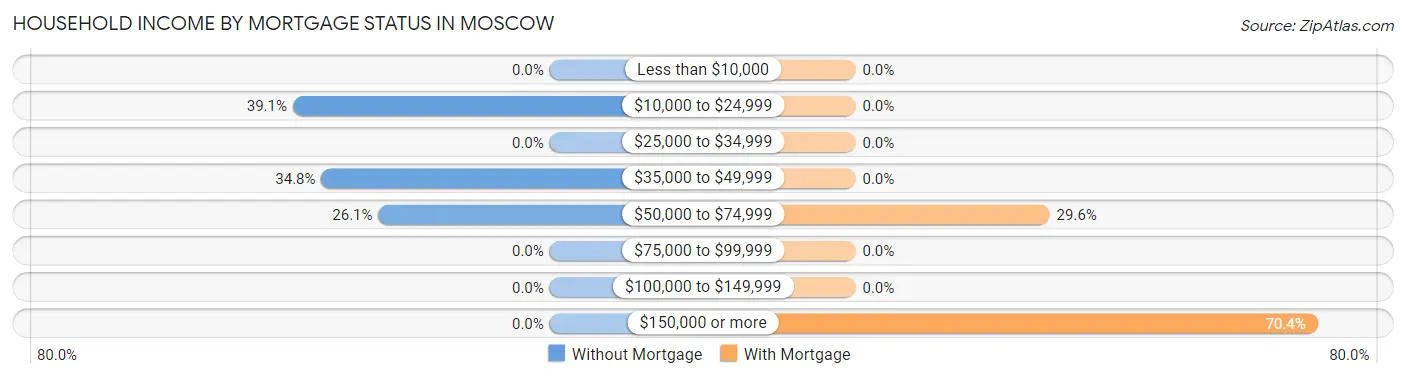
| Household Income | Without Mortgage | With Mortgage |
| Less than $10,000 | 0 (0.0%) | 0 (0.0%) |
| $10,000 to $24,999 | 9 (39.1%) | 0 (0.0%) |
| $25,000 to $34,999 | 0 (0.0%) | 0 (0.0%) |
| $35,000 to $49,999 | 8 (34.8%) | 0 (0.0%) |
| $50,000 to $74,999 | 6 (26.1%) | 21 (29.6%) |
| $75,000 to $99,999 | 0 (0.0%) | 0 (0.0%) |
| $100,000 to $149,999 | 0 (0.0%) | 0 (0.0%) |
| $150,000 or more | 0 (0.0%) | 50 (70.4%) |
| Total | 23 (100.0%) | 71 (100.0%) |
Property Value to Household Income Ratio in Moscow
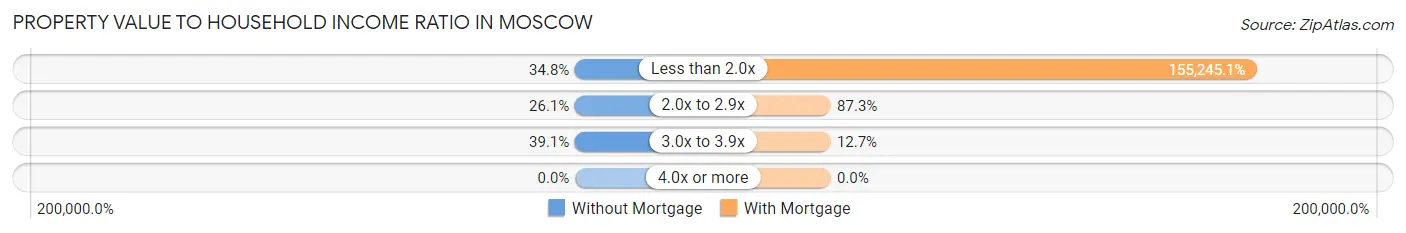
| Value-to-Income Ratio | Without Mortgage | With Mortgage |
| Less than 2.0x | 8 (34.8%) | 110,224 (155,245.1%) |
| 2.0x to 2.9x | 6 (26.1%) | 62 (87.3%) |
| 3.0x to 3.9x | 9 (39.1%) | 9 (12.7%) |
| 4.0x or more | 0 (0.0%) | 0 (0.0%) |
| Total | 23 (100.0%) | 71 (100.0%) |
Real Estate Taxes by Mortgage Status in Moscow
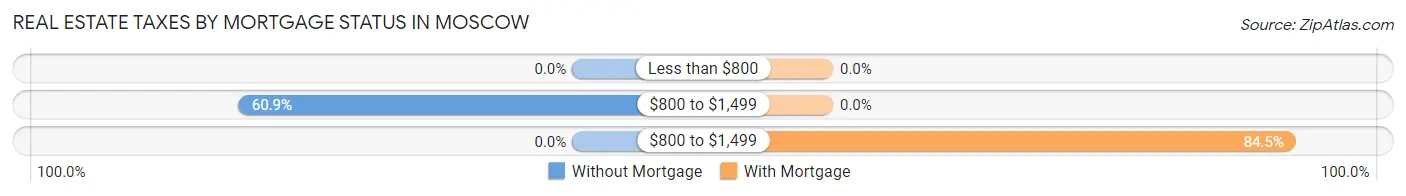
| Property Taxes | Without Mortgage | With Mortgage |
| Less than $800 | 0 (0.0%) | 0 (0.0%) |
| $800 to $1,499 | 14 (60.9%) | 0 (0.0%) |
| $800 to $1,499 | 0 (0.0%) | 60 (84.5%) |
| Total | 23 (100.0%) | 71 (100.0%) |
Health & Disability in Moscow
Health Insurance Coverage by Age in Moscow
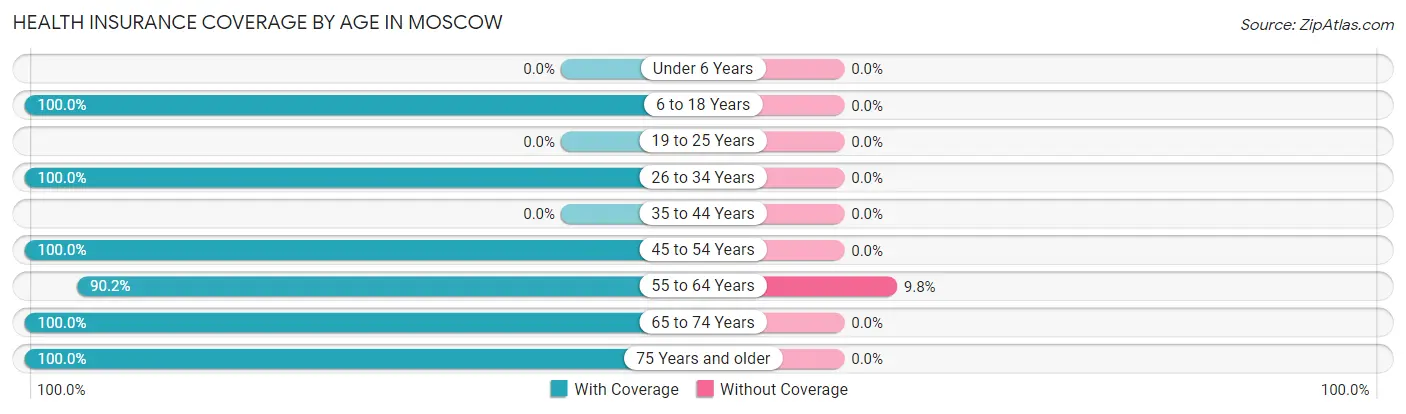
| Age Bracket | With Coverage | Without Coverage |
| Under 6 Years | 0 (0.0%) | 0 (0.0%) |
| 6 to 18 Years | 22 (100.0%) | 0 (0.0%) |
| 19 to 25 Years | 0 (0.0%) | 0 (0.0%) |
| 26 to 34 Years | 26 (100.0%) | 0 (0.0%) |
| 35 to 44 Years | 0 (0.0%) | 0 (0.0%) |
| 45 to 54 Years | 35 (100.0%) | 0 (0.0%) |
| 55 to 64 Years | 92 (90.2%) | 10 (9.8%) |
| 65 to 74 Years | 35 (100.0%) | 0 (0.0%) |
| 75 Years and older | 9 (100.0%) | 0 (0.0%) |
| Total | 219 (95.6%) | 10 (4.4%) |
Health Insurance Coverage by Citizenship Status in Moscow
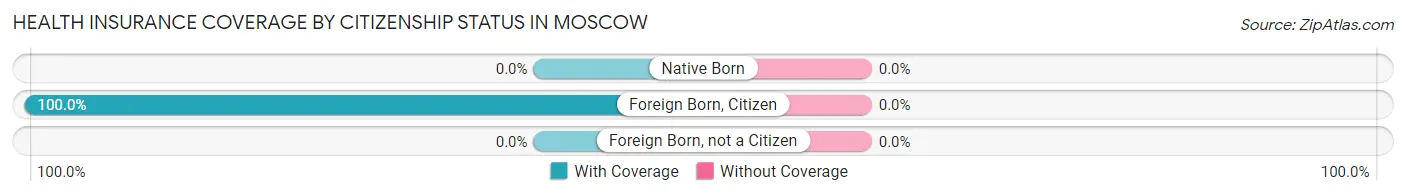
| Citizenship Status | With Coverage | Without Coverage |
| Native Born | 0 (0.0%) | 0 (0.0%) |
| Foreign Born, Citizen | 22 (100.0%) | 0 (0.0%) |
| Foreign Born, not a Citizen | 0 (0.0%) | 0 (0.0%) |
Health Insurance Coverage by Household Income in Moscow
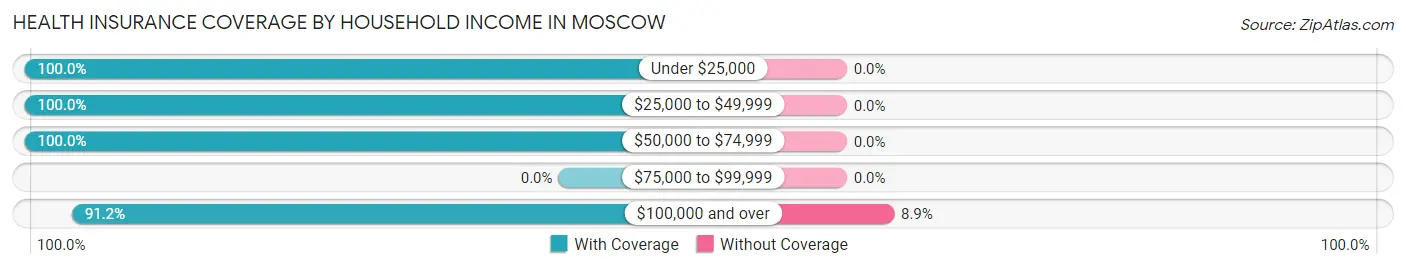
| Household Income | With Coverage | Without Coverage |
| Under $25,000 | 9 (100.0%) | 0 (0.0%) |
| $25,000 to $49,999 | 95 (100.0%) | 0 (0.0%) |
| $50,000 to $74,999 | 12 (100.0%) | 0 (0.0%) |
| $75,000 to $99,999 | 0 (0.0%) | 0 (0.0%) |
| $100,000 and over | 103 (91.1%) | 10 (8.8%) |
Public vs Private Health Insurance Coverage by Age in Moscow
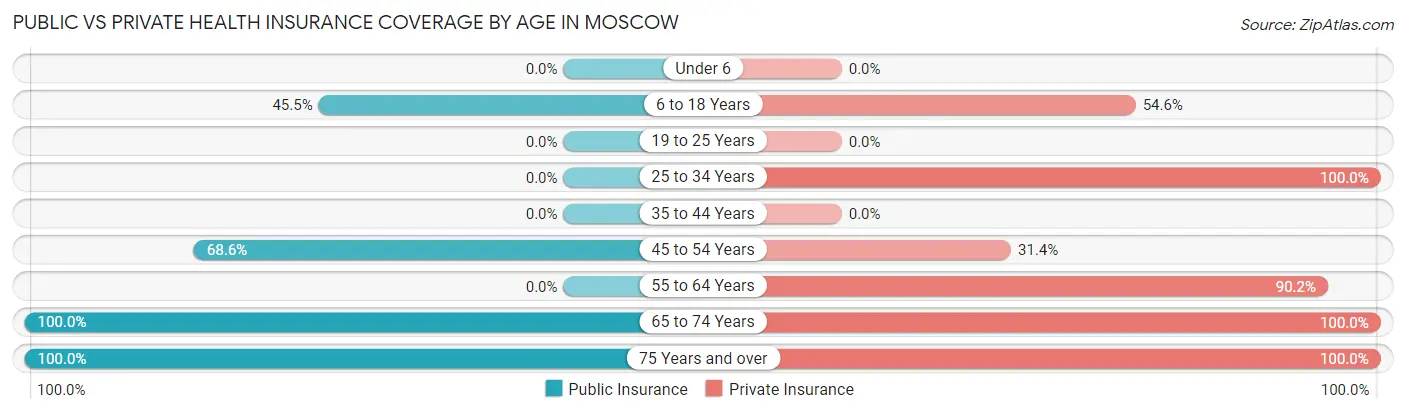
| Age Bracket | Public Insurance | Private Insurance |
| Under 6 | 0 (0.0%) | 0 (0.0%) |
| 6 to 18 Years | 10 (45.5%) | 12 (54.5%) |
| 19 to 25 Years | 0 (0.0%) | 0 (0.0%) |
| 25 to 34 Years | 0 (0.0%) | 26 (100.0%) |
| 35 to 44 Years | 0 (0.0%) | 0 (0.0%) |
| 45 to 54 Years | 24 (68.6%) | 11 (31.4%) |
| 55 to 64 Years | 0 (0.0%) | 92 (90.2%) |
| 65 to 74 Years | 35 (100.0%) | 35 (100.0%) |
| 75 Years and over | 9 (100.0%) | 9 (100.0%) |
| Total | 78 (34.1%) | 185 (80.8%) |
Disability Status by Sex by Age in Moscow
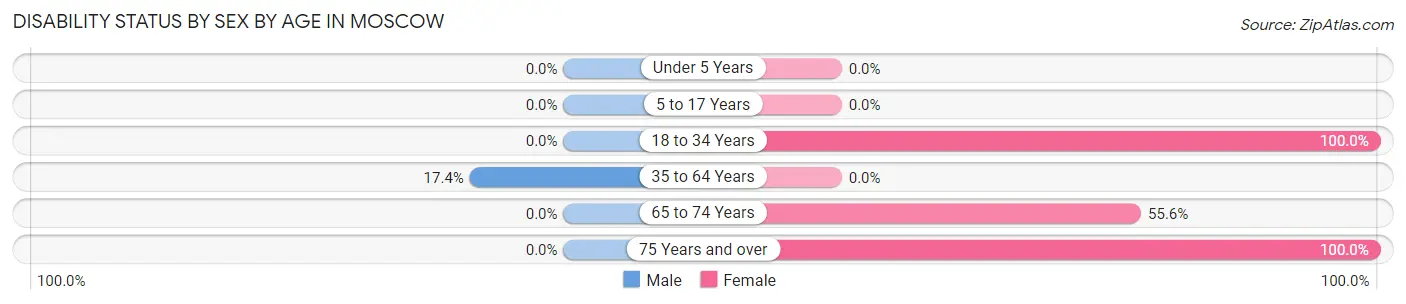
| Age Bracket | Male | Female |
| Under 5 Years | 0 (0.0%) | 0 (0.0%) |
| 5 to 17 Years | 0 (0.0%) | 0 (0.0%) |
| 18 to 34 Years | 0 (0.0%) | 26 (100.0%) |
| 35 to 64 Years | 12 (17.4%) | 0 (0.0%) |
| 65 to 74 Years | 0 (0.0%) | 10 (55.6%) |
| 75 Years and over | 0 (0.0%) | 9 (100.0%) |
Disability Class by Sex by Age in Moscow
Disability Class: Hearing Difficulty
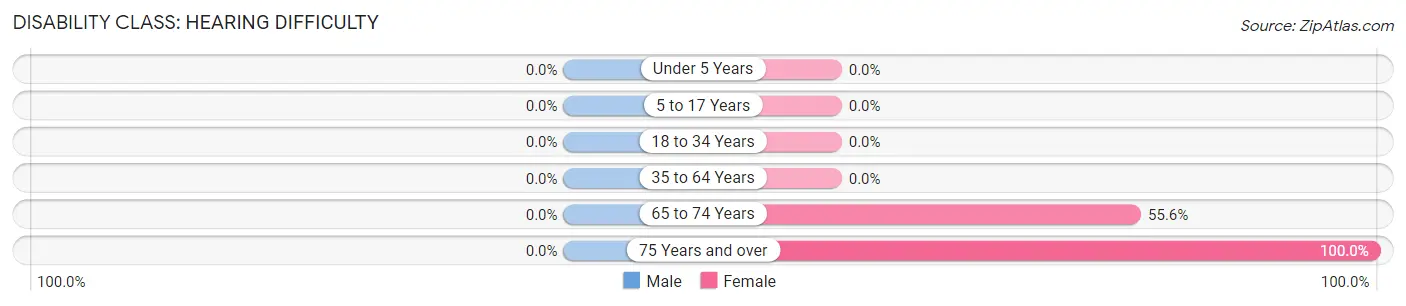
| Age Bracket | Male | Female |
| Under 5 Years | 0 (0.0%) | 0 (0.0%) |
| 5 to 17 Years | 0 (0.0%) | 0 (0.0%) |
| 18 to 34 Years | 0 (0.0%) | 0 (0.0%) |
| 35 to 64 Years | 0 (0.0%) | 0 (0.0%) |
| 65 to 74 Years | 0 (0.0%) | 10 (55.6%) |
| 75 Years and over | 0 (0.0%) | 9 (100.0%) |
Disability Class: Vision Difficulty
| Age Bracket | Male | Female |
| Under 5 Years | 0 (0.0%) | 0 (0.0%) |
| 5 to 17 Years | 0 (0.0%) | 0 (0.0%) |
| 18 to 34 Years | 0 (0.0%) | 0 (0.0%) |
| 35 to 64 Years | 0 (0.0%) | 0 (0.0%) |
| 65 to 74 Years | 0 (0.0%) | 0 (0.0%) |
| 75 Years and over | 0 (0.0%) | 0 (0.0%) |
Disability Class: Cognitive Difficulty
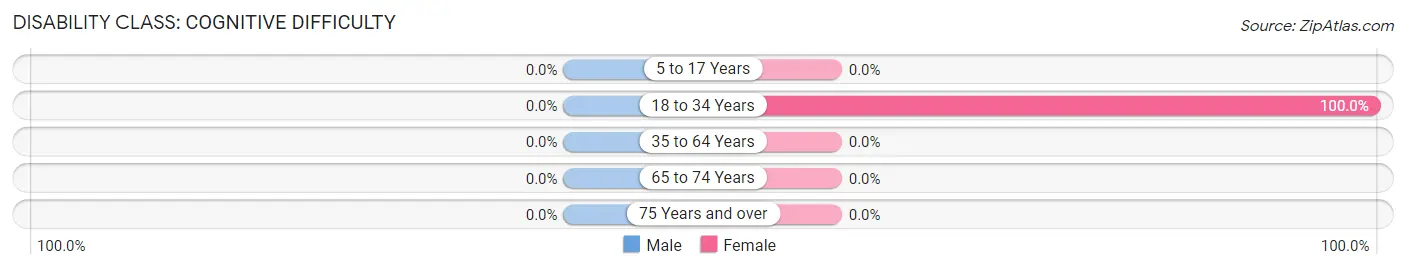
| Age Bracket | Male | Female |
| 5 to 17 Years | 0 (0.0%) | 0 (0.0%) |
| 18 to 34 Years | 0 (0.0%) | 26 (100.0%) |
| 35 to 64 Years | 0 (0.0%) | 0 (0.0%) |
| 65 to 74 Years | 0 (0.0%) | 0 (0.0%) |
| 75 Years and over | 0 (0.0%) | 0 (0.0%) |
Disability Class: Ambulatory Difficulty
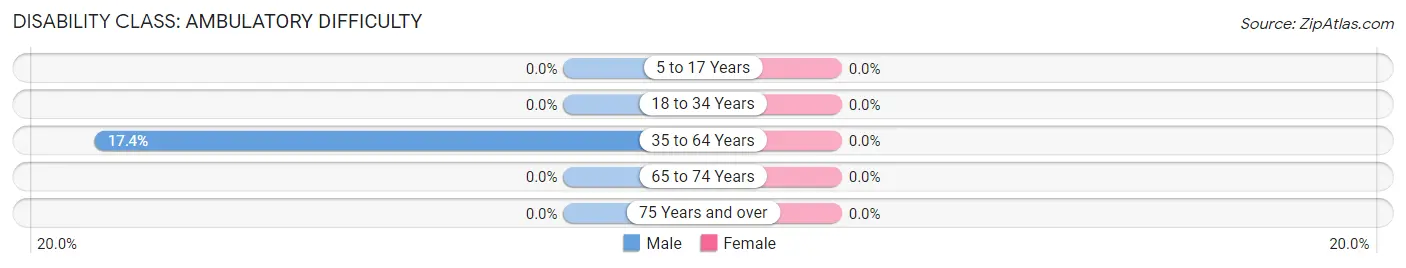
| Age Bracket | Male | Female |
| 5 to 17 Years | 0 (0.0%) | 0 (0.0%) |
| 18 to 34 Years | 0 (0.0%) | 0 (0.0%) |
| 35 to 64 Years | 12 (17.4%) | 0 (0.0%) |
| 65 to 74 Years | 0 (0.0%) | 0 (0.0%) |
| 75 Years and over | 0 (0.0%) | 0 (0.0%) |
Disability Class: Self-Care Difficulty
| Age Bracket | Male | Female |
| 5 to 17 Years | 0 (0.0%) | 0 (0.0%) |
| 18 to 34 Years | 0 (0.0%) | 0 (0.0%) |
| 35 to 64 Years | 0 (0.0%) | 0 (0.0%) |
| 65 to 74 Years | 0 (0.0%) | 0 (0.0%) |
| 75 Years and over | 0 (0.0%) | 0 (0.0%) |
Technology Access in Moscow
Computing Device Access in Moscow
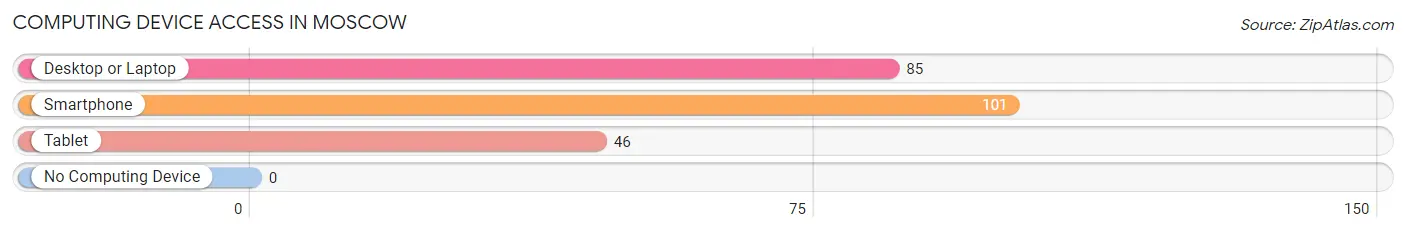
| Device Type | # Households | % Households |
| Desktop or Laptop | 85 | 70.8% |
| Smartphone | 101 | 84.2% |
| Tablet | 46 | 38.3% |
| No Computing Device | 0 | 0.0% |
| Total | 120 | 100.0% |
Internet Access in Moscow
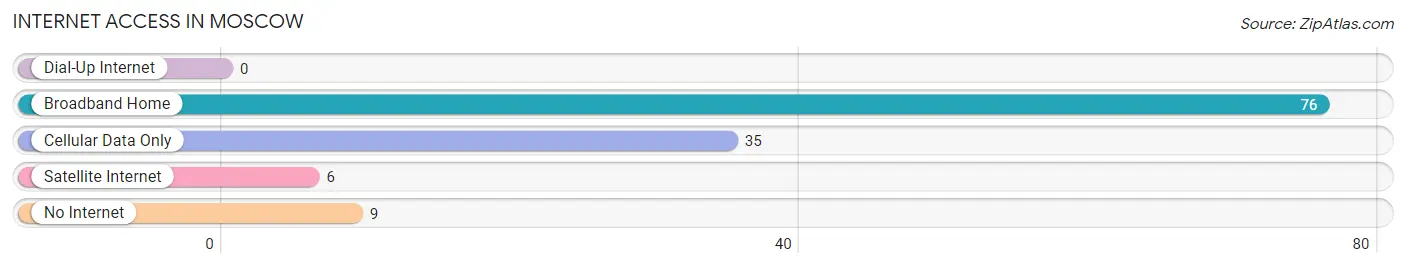
| Internet Type | # Households | % Households |
| Dial-Up Internet | 0 | 0.0% |
| Broadband Home | 76 | 63.3% |
| Cellular Data Only | 35 | 29.2% |
| Satellite Internet | 6 | 5.0% |
| No Internet | 9 | 7.5% |
| Total | 120 | 100.0% |
Moscow Summary
Moscow, Maryland is a small town located in Montgomery County, Maryland, United States. It is situated approximately 20 miles northwest of Washington, D.C. and is part of the Washington Metropolitan Area. The town was founded in 1763 and incorporated in 1874. As of the 2010 census, the population of Moscow was 1,811.
History
The area that is now Moscow was originally inhabited by the Piscataway Indians. The first European settlers arrived in the area in the late 17th century. The town was originally known as “Moscow Crossroads” due to its location at the intersection of two major roads. The town was officially incorporated in 1874 and was named after the Russian city of Moscow.
Geography
Moscow is located at 39°10'25"N 77°14'17"W (39.173611, -77.238056). According to the United States Census Bureau, the town has a total area of 0.7 square miles, all of it land.
Economy
The economy of Moscow is largely based on agriculture and small businesses. The town is home to several farms, including the historic Moscow Farm, which has been in operation since the late 1700s. The town is also home to several small businesses, including a grocery store, a hardware store, and a few restaurants.
Demographics
As of the 2010 census, there were 1,811 people, 690 households, and 486 families residing in the town. The population density was 2,543.3 people per square mile. The racial makeup of the town was 87.2% White, 8.2% African American, 0.2% Native American, 0.7% Asian, 0.1% Pacific Islander, 1.2% from other races, and 2.6% from two or more races. Hispanic or Latino of any race were 3.3% of the population.
The median income for a household in the town was $76,250, and the median income for a family was $90,000. The per capita income for the town was $31,945. About 4.2% of families and 5.3% of the population were below the poverty line, including 6.2% of those under age 18 and 4.2% of those age 65 or over.
Conclusion
Moscow, Maryland is a small town located in Montgomery County, Maryland, United States. It is situated approximately 20 miles northwest of Washington, D.C. and is part of the Washington Metropolitan Area. The town was founded in 1763 and incorporated in 1874. As of the 2010 census, the population of Moscow was 1,811. The economy of Moscow is largely based on agriculture and small businesses. The town is home to several farms, including the historic Moscow Farm, which has been in operation since the late 1700s. The town is also home to several small businesses, including a grocery store, a hardware store, and a few restaurants. The racial makeup of the town was 87.2% White, 8.2% African American, 0.2% Native American, 0.7% Asian, 0.1% Pacific Islander, 1.2% from other races, and 2.6% from two or more races. The median income for a household in the town was $76,250, and the median income for a family was $90,000. Moscow is a small town with a rich history and a vibrant economy.
Common Questions
What is the Total Population of Moscow?
Total Population of Moscow is 229.
What is the Total Male Population of Moscow?
Total Male Population of Moscow is 86.
What is the Total Female Population of Moscow?
Total Female Population of Moscow is 143.
What is the Ratio of Males per 100 Females in Moscow?
There are 60.14 Males per 100 Females in Moscow.
What is the Ratio of Females per 100 Males in Moscow?
There are 166.28 Females per 100 Males in Moscow.
What is the Median Population Age in Moscow?
Median Population Age in Moscow is 55.4 Years.
What is the Average Family Size in Moscow
Average Family Size in Moscow is 2.2 People.
What is the Average Household Size in Moscow
Average Household Size in Moscow is 1.9 People.
What is Per Capita Income in Moscow?
Per Capita income in Moscow is $37,155.
What is the Median Family Income in Moscow?
Median Family Income in Moscow is $91,705.
What is Inequality or Gini Index in Moscow?
Inequality or Gini Index in Moscow is 0.28.
How Large is the Labor Force in Moscow?
There are 145 People in the Labor Forcein in Moscow.
What is the Percentage of People in the Labor Force in Moscow?
70.0% of People are in the Labor Force in Moscow.