Mapleville, MD
Mapleville Map
Mapleville Overview
256
TOTAL POPULATION
117
MALE POPULATION
139
FEMALE POPULATION
84.17
MALES / 100 FEMALES
118.80
FEMALES / 100 MALES
53.7
MEDIAN AGE
2.0
AVG FAMILY SIZE
1.9
AVG HOUSEHOLD SIZE
$65,811
PER CAPITA INCOME
0.31
INEQUALITY / GINI INDEX
168
LABOR FORCE [ PEOPLE ]
65.6%
PERCENT IN LABOR FORCE
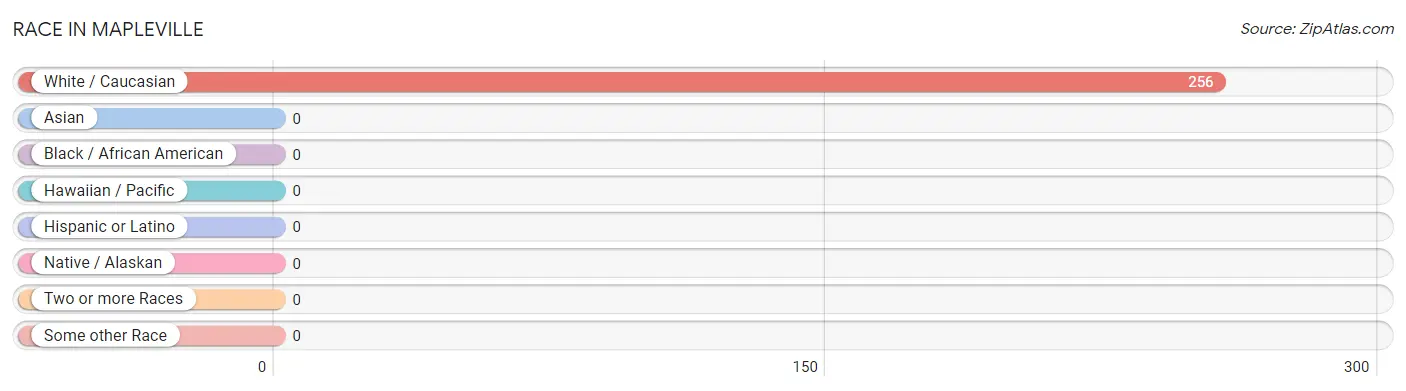
Race in Mapleville
The most populous races in Mapleville are , and White / Caucasian (256 | 100.0%).
| Race | # Population | % Population |
| Asian | 0 | 0.0% |
| Black / African American | 0 | 0.0% |
| Hawaiian / Pacific | 0 | 0.0% |
| Hispanic or Latino | 0 | 0.0% |
| Native / Alaskan | 0 | 0.0% |
| White / Caucasian | 256 | 100.0% |
| Two or more Races | 0 | 0.0% |
| Some other Race | 0 | 0.0% |
| Total | 256 | 100.0% |
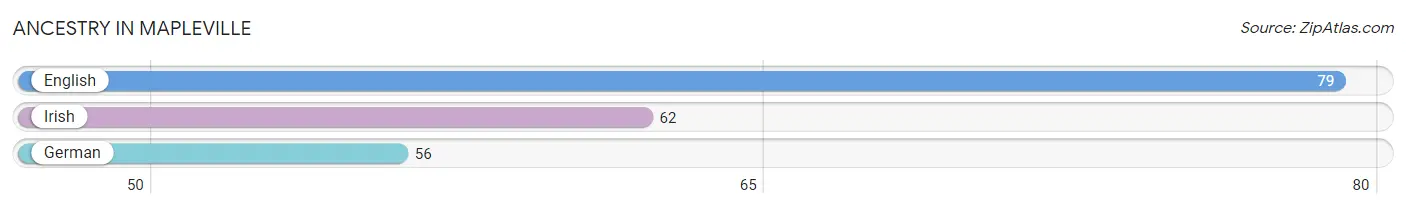
Ancestry in Mapleville
The most populous ancestries reported in Mapleville are English (79 | 30.9%), Irish (62 | 24.2%), and German (56 | 21.9%), together accounting for 77.0% of all Mapleville residents.
| Ancestry | # Population | % Population |
| English | 79 | 30.9% |
| German | 56 | 21.9% |
| Irish | 62 | 24.2% | View All 3 Rows |
Immigrants in Mapleville

| Immigration Origin | # Population | % Population | View All 0 Rows |
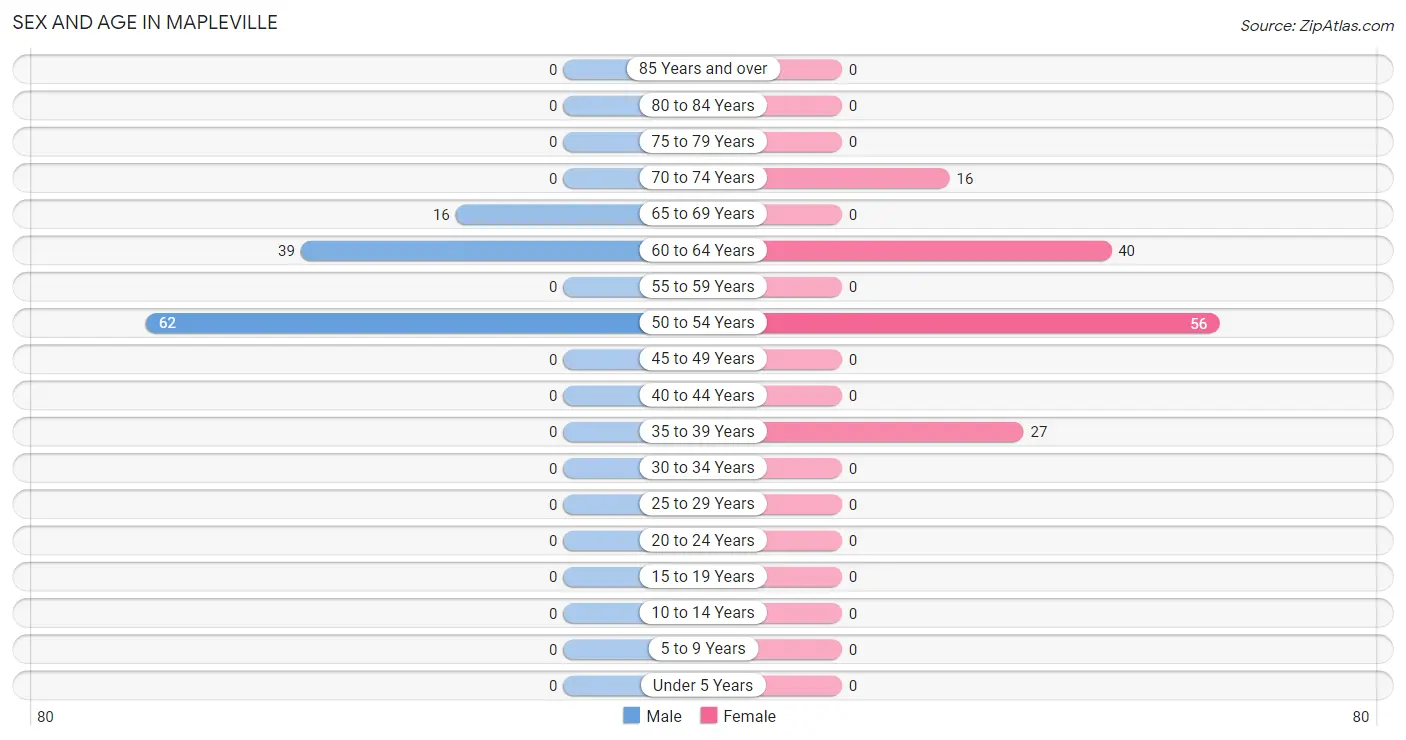
Sex and Age in Mapleville
Sex and Age in Mapleville
The most populous age groups in Mapleville are 50 to 54 Years (62 | 53.0%) for men and 50 to 54 Years (56 | 40.3%) for women.
| Age Bracket | Male | Female |
| Under 5 Years | 0 (0.0%) | 0 (0.0%) |
| 5 to 9 Years | 0 (0.0%) | 0 (0.0%) |
| 10 to 14 Years | 0 (0.0%) | 0 (0.0%) |
| 15 to 19 Years | 0 (0.0%) | 0 (0.0%) |
| 20 to 24 Years | 0 (0.0%) | 0 (0.0%) |
| 25 to 29 Years | 0 (0.0%) | 0 (0.0%) |
| 30 to 34 Years | 0 (0.0%) | 0 (0.0%) |
| 35 to 39 Years | 0 (0.0%) | 27 (19.4%) |
| 40 to 44 Years | 0 (0.0%) | 0 (0.0%) |
| 45 to 49 Years | 0 (0.0%) | 0 (0.0%) |
| 50 to 54 Years | 62 (53.0%) | 56 (40.3%) |
| 55 to 59 Years | 0 (0.0%) | 0 (0.0%) |
| 60 to 64 Years | 39 (33.3%) | 40 (28.8%) |
| 65 to 69 Years | 16 (13.7%) | 0 (0.0%) |
| 70 to 74 Years | 0 (0.0%) | 16 (11.5%) |
| 75 to 79 Years | 0 (0.0%) | 0 (0.0%) |
| 80 to 84 Years | 0 (0.0%) | 0 (0.0%) |
| 85 Years and over | 0 (0.0%) | 0 (0.0%) |
| Total | 117 (100.0%) | 139 (100.0%) |
Families and Households in Mapleville
Median Family Size in Mapleville
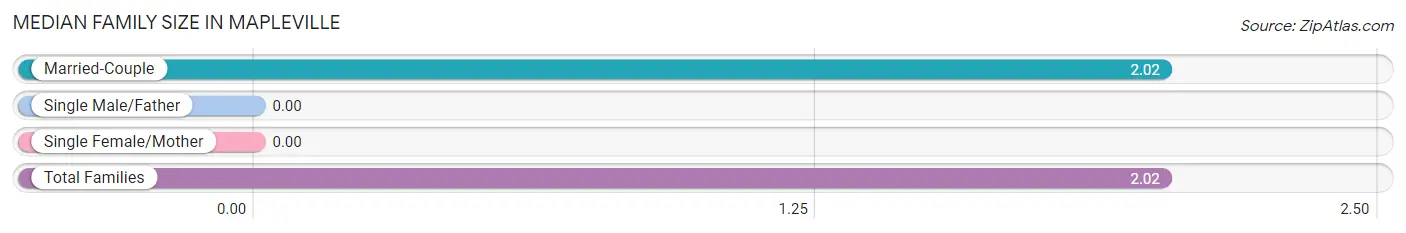
| Family Type | # Families | Family Size |
| Married-Couple | 55 (100.0%) | 2.02 |
| Single Male/Father | 0 (0.0%) | - |
| Single Female/Mother | 0 (0.0%) | - |
| Total Families | 55 (100.0%) | 2.02 |
Median Household Size in Mapleville
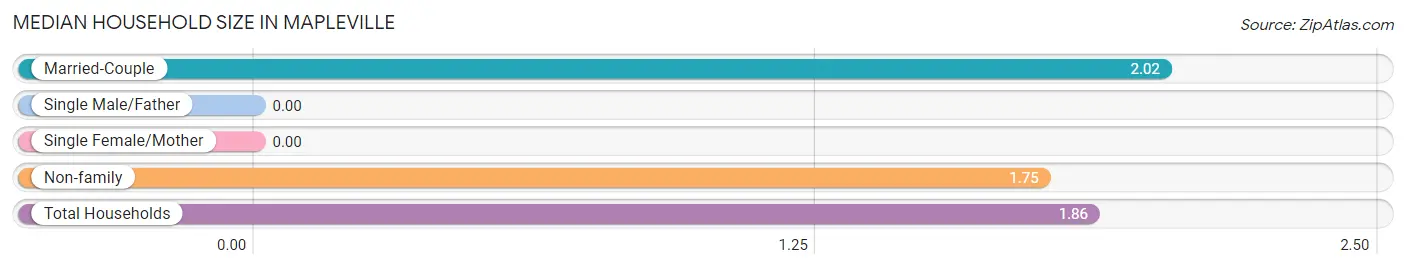
| Household Type | # Households | Household Size |
| Married-Couple | 55 (39.9%) | 2.02 |
| Single Male/Father | 0 (0.0%) | - |
| Single Female/Mother | 0 (0.0%) | - |
| Non-family | 83 (60.1%) | 1.75 |
| Total Households | 138 (100.0%) | 1.86 |
Household Size by Marriage Status in Mapleville
Out of a total of 138 households in Mapleville, 55 (39.9%) are family households, while 83 (60.1%) are nonfamily households. The most numerous type of family households are 2-person households, comprising 55, and the most common type of nonfamily households are 2-person households, comprising 56.
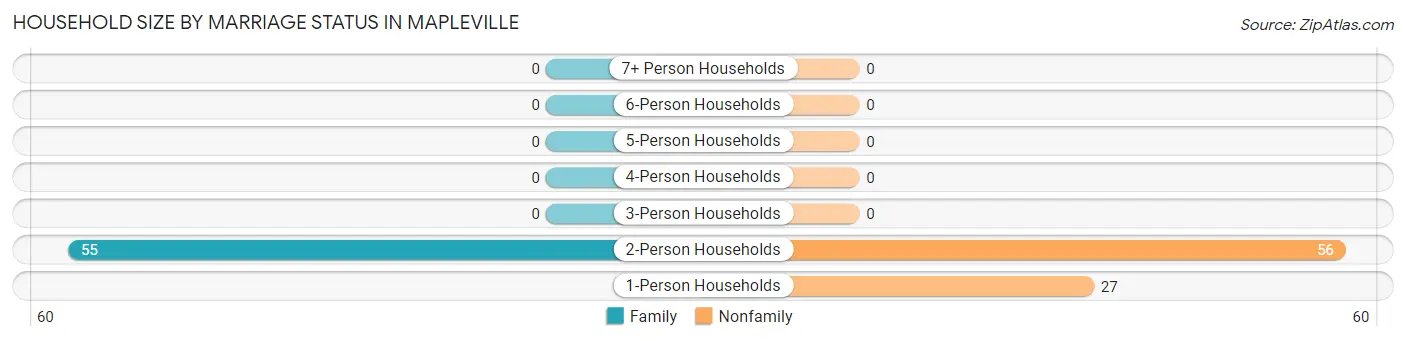
| Household Size | Family Households | Nonfamily Households |
| 1-Person Households | - | 27 (19.6%) |
| 2-Person Households | 55 (39.9%) | 56 (40.6%) |
| 3-Person Households | 0 (0.0%) | 0 (0.0%) |
| 4-Person Households | 0 (0.0%) | 0 (0.0%) |
| 5-Person Households | 0 (0.0%) | 0 (0.0%) |
| 6-Person Households | 0 (0.0%) | 0 (0.0%) |
| 7+ Person Households | 0 (0.0%) | 0 (0.0%) |
| Total | 55 (39.9%) | 83 (60.1%) |
Female Fertility in Mapleville
Fertility by Age in Mapleville
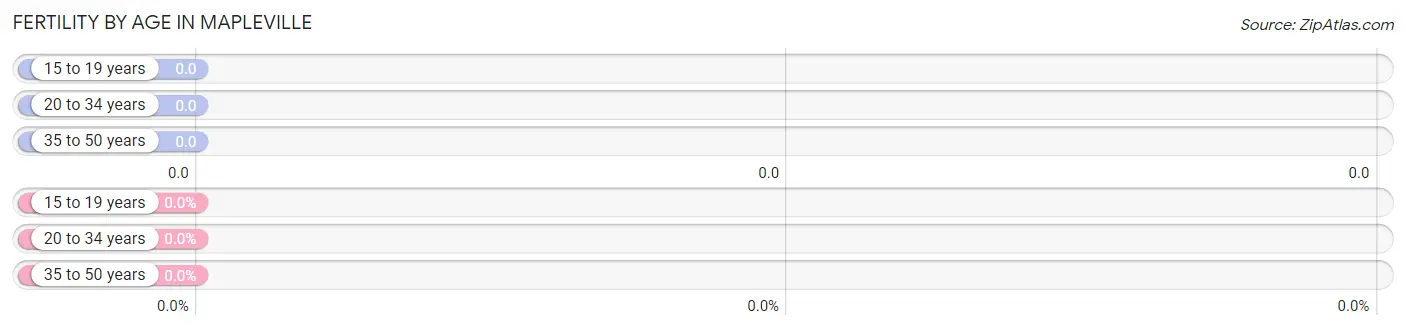
| Age Bracket | Women with Births | Births / 1,000 Women |
| 15 to 19 years | 0 (0.0%) | 0.0 |
| 20 to 34 years | 0 (0.0%) | 0.0 |
| 35 to 50 years | 0 (0.0%) | 0.0 |
| Total | 0 (0.0%) | 0.0 |
Fertility by Age by Marriage Status in Mapleville
| Age Bracket | Married | Unmarried |
| 15 to 19 years | 0 (0.0%) | 0 (0.0%) |
| 20 to 34 years | 0 (0.0%) | 0 (0.0%) |
| 35 to 50 years | 0 (0.0%) | 0 (0.0%) |
| Total | 0 (0.0%) | 0 (0.0%) |
Fertility by Education in Mapleville
| Educational Attainment | Women with Births | Births / 1,000 Women |
| Less than High School | 0 (0.0%) | 0.0 |
| High School Diploma | 0 (0.0%) | 0.0 |
| College or Associate's Degree | 0 (0.0%) | 0.0 |
| Bachelor's Degree | 0 (0.0%) | 0.0 |
| Graduate Degree | 0 (0.0%) | 0.0 |
| Total | 0 (0.0%) | 0.0 |
Fertility by Education by Marriage Status in Mapleville
| Educational Attainment | Married | Unmarried |
| Less than High School | 0 (0.0%) | 0 (0.0%) |
| High School Diploma | 0 (0.0%) | 0 (0.0%) |
| College or Associate's Degree | 0 (0.0%) | 0 (0.0%) |
| Bachelor's Degree | 0 (0.0%) | 0 (0.0%) |
| Graduate Degree | 0 (0.0%) | 0 (0.0%) |
| Total | 0 (0.0%) | 0 (0.0%) |
Income in Mapleville
Income Overview in Mapleville
| Characteristic | Number | Measure |
| Per Capita Income | 256 | $65,811 |
| Median Family Income | 55 | $0 |
| Mean Family Income | 55 | $0 |
| Median Household Income | 138 | $0 |
| Mean Household Income | 138 | $118,420 |
| Income Deficit | 55 | $0 |
| Wage / Income Gap (%) | 256 | 0.00% |
| Wage / Income Gap ($) | 256 | 100.00¢ per $1 |
| Gini / Inequality Index | 256 | 0.31 |
Earnings by Sex in Mapleville
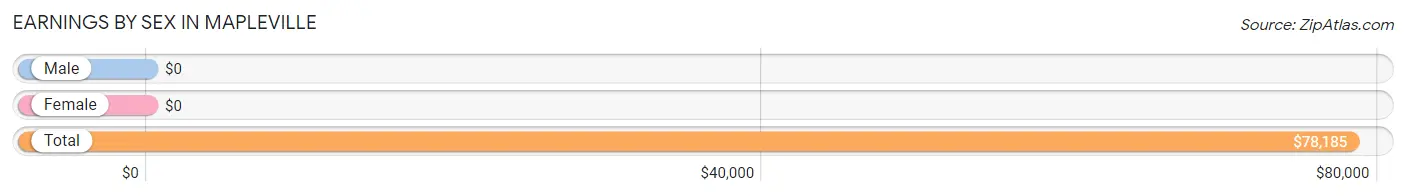
| Sex | Number | Average Earnings |
| Male | 101 (60.1%) | $0 |
| Female | 67 (39.9%) | $0 |
| Total | 168 (100.0%) | $78,185 |
Earnings by Sex by Income Bracket in Mapleville
The most common earnings brackets in Mapleville are $75,000 to $99,999 for men (62 | 61.4%) and $30,000 to $34,999 for women (40 | 59.7%).
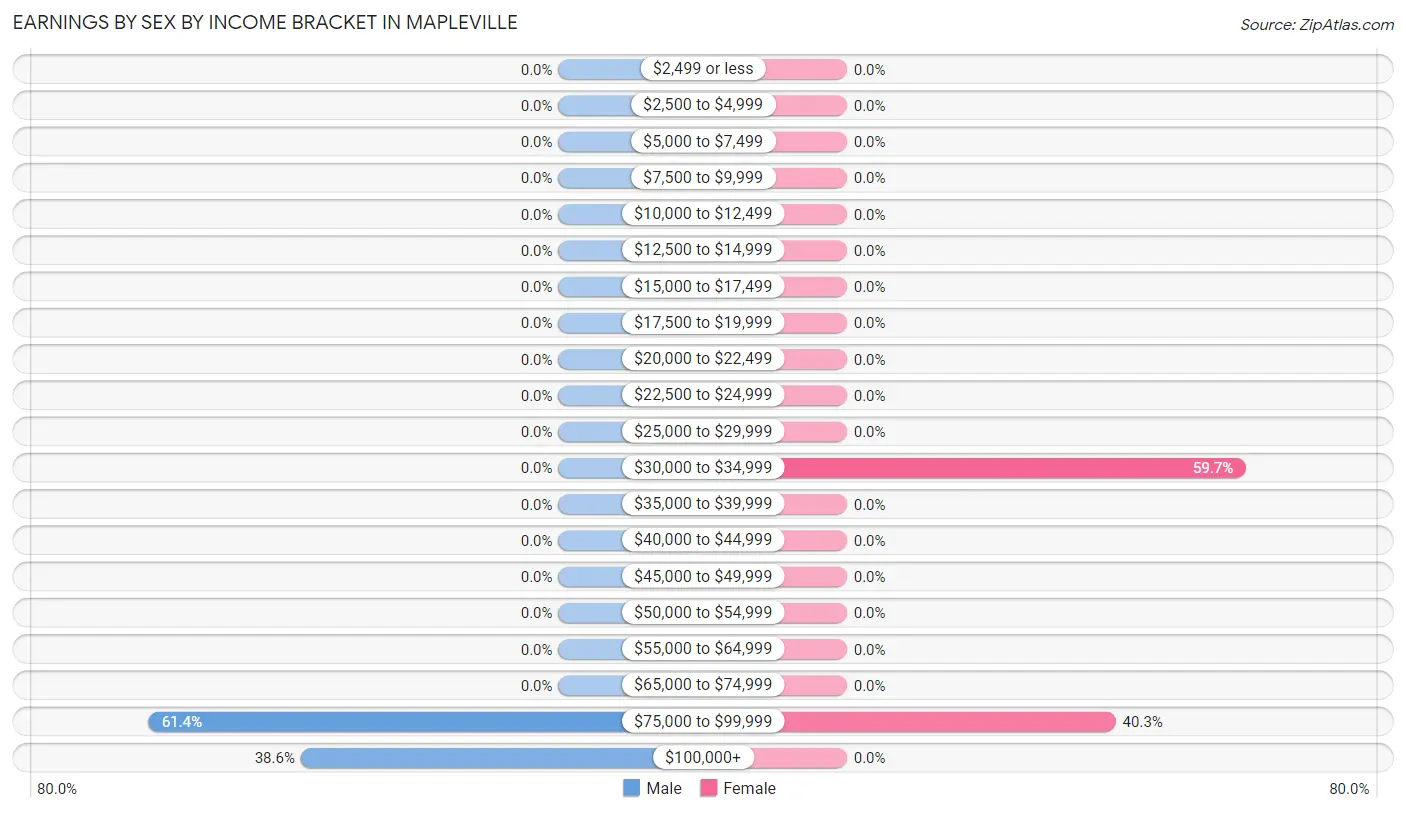
| Income | Male | Female |
| $2,499 or less | 0 (0.0%) | 0 (0.0%) |
| $2,500 to $4,999 | 0 (0.0%) | 0 (0.0%) |
| $5,000 to $7,499 | 0 (0.0%) | 0 (0.0%) |
| $7,500 to $9,999 | 0 (0.0%) | 0 (0.0%) |
| $10,000 to $12,499 | 0 (0.0%) | 0 (0.0%) |
| $12,500 to $14,999 | 0 (0.0%) | 0 (0.0%) |
| $15,000 to $17,499 | 0 (0.0%) | 0 (0.0%) |
| $17,500 to $19,999 | 0 (0.0%) | 0 (0.0%) |
| $20,000 to $22,499 | 0 (0.0%) | 0 (0.0%) |
| $22,500 to $24,999 | 0 (0.0%) | 0 (0.0%) |
| $25,000 to $29,999 | 0 (0.0%) | 0 (0.0%) |
| $30,000 to $34,999 | 0 (0.0%) | 40 (59.7%) |
| $35,000 to $39,999 | 0 (0.0%) | 0 (0.0%) |
| $40,000 to $44,999 | 0 (0.0%) | 0 (0.0%) |
| $45,000 to $49,999 | 0 (0.0%) | 0 (0.0%) |
| $50,000 to $54,999 | 0 (0.0%) | 0 (0.0%) |
| $55,000 to $64,999 | 0 (0.0%) | 0 (0.0%) |
| $65,000 to $74,999 | 0 (0.0%) | 0 (0.0%) |
| $75,000 to $99,999 | 62 (61.4%) | 27 (40.3%) |
| $100,000+ | 39 (38.6%) | 0 (0.0%) |
| Total | 101 (100.0%) | 67 (100.0%) |
Earnings by Sex by Educational Attainment in Mapleville
| Educational Attainment | Male Income | Female Income |
| Less than High School | - | - |
| High School Diploma | - | - |
| College or Associate's Degree | - | - |
| Bachelor's Degree | - | - |
| Graduate Degree | - | - |
| Total | - | - |
Family Income in Mapleville
Family Income Brackets in Mapleville
According to the Mapleville family income data, there are 39 families falling into the $200,000+ income range, which is the most common income bracket and makes up 70.9% of all families.
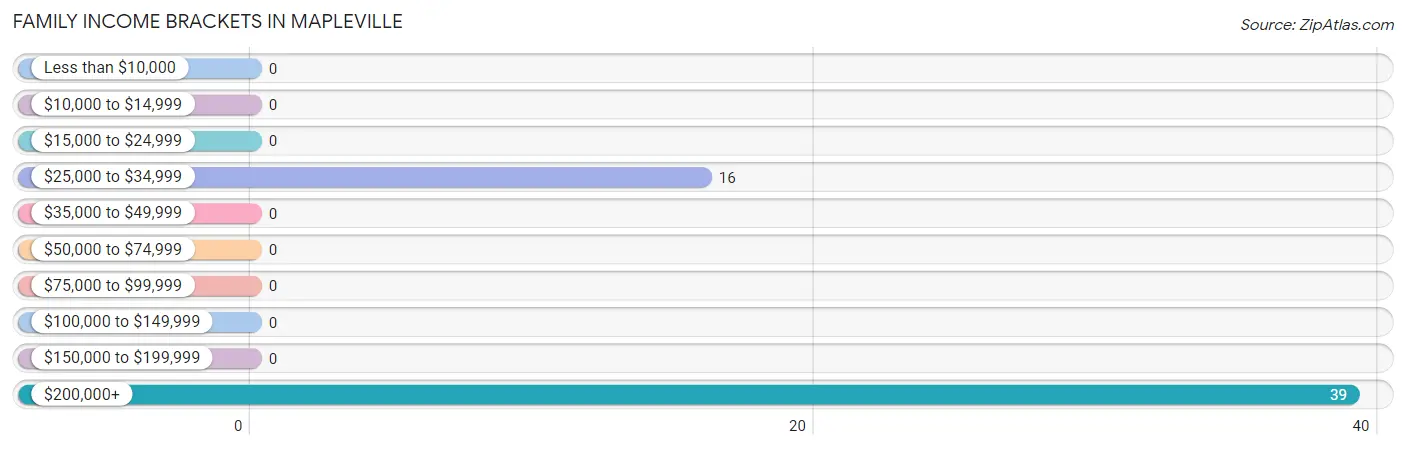
| Income Bracket | # Families | % Families |
| Less than $10,000 | 0 | 0.0% |
| $10,000 to $14,999 | 0 | 0.0% |
| $15,000 to $24,999 | 0 | 0.0% |
| $25,000 to $34,999 | 16 | 29.1% |
| $35,000 to $49,999 | 0 | 0.0% |
| $50,000 to $74,999 | 0 | 0.0% |
| $75,000 to $99,999 | 0 | 0.0% |
| $100,000 to $149,999 | 0 | 0.0% |
| $150,000 to $199,999 | 0 | 0.0% |
| $200,000+ | 39 | 70.9% |
Family Income by Famaliy Size in Mapleville
| Income Bracket | # Families | Median Income |
| 2-Person Families | 55 (100.0%) | $0 |
| 3-Person Families | 0 (0.0%) | $0 |
| 4-Person Families | 0 (0.0%) | $0 |
| 5-Person Families | 0 (0.0%) | $0 |
| 6-Person Families | 0 (0.0%) | $0 |
| 7+ Person Families | 0 (0.0%) | $0 |
| Total | 55 (100.0%) | $0 |
Family Income by Number of Earners in Mapleville
| Number of Earners | # Families | Median Income |
| No Earners | 16 (29.1%) | $0 |
| 1 Earner | 0 (0.0%) | $0 |
| 2 Earners | 39 (70.9%) | $0 |
| 3+ Earners | 0 (0.0%) | $0 |
| Total | 55 (100.0%) | $0 |
Household Income in Mapleville
Household Income Brackets in Mapleville
With 83 households falling in the category, the $75,000 to $99,999 income range is the most frequent in Mapleville, accounting for 60.1% of all households.
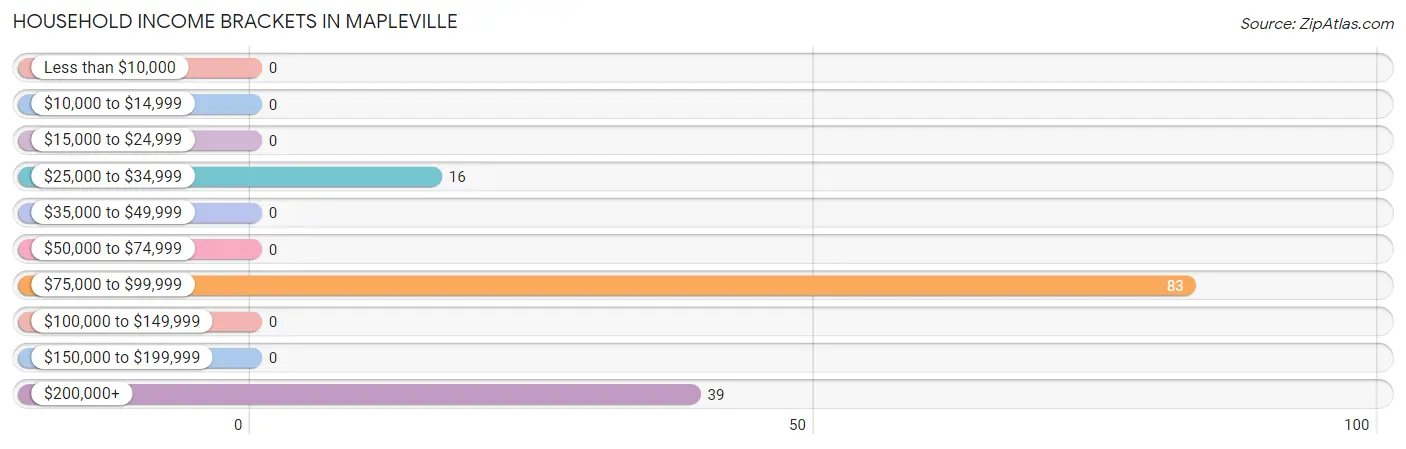
| Income Bracket | # Households | % Households |
| Less than $10,000 | 0 | 0.0% |
| $10,000 to $14,999 | 0 | 0.0% |
| $15,000 to $24,999 | 0 | 0.0% |
| $25,000 to $34,999 | 16 | 11.6% |
| $35,000 to $49,999 | 0 | 0.0% |
| $50,000 to $74,999 | 0 | 0.0% |
| $75,000 to $99,999 | 83 | 60.1% |
| $100,000 to $149,999 | 0 | 0.0% |
| $150,000 to $199,999 | 0 | 0.0% |
| $200,000+ | 39 | 28.3% |
Household Income by Householder Age in Mapleville
| Income Bracket | # Households | Median Income |
| 15 to 24 Years | 0 (0.0%) | $0 |
| 25 to 44 Years | 27 (19.6%) | $0 |
| 45 to 64 Years | 95 (68.8%) | $0 |
| 65+ Years | 16 (11.6%) | $0 |
| Total | 138 (100.0%) | $0 |
Poverty in Mapleville
Income Below Poverty by Sex and Age in Mapleville
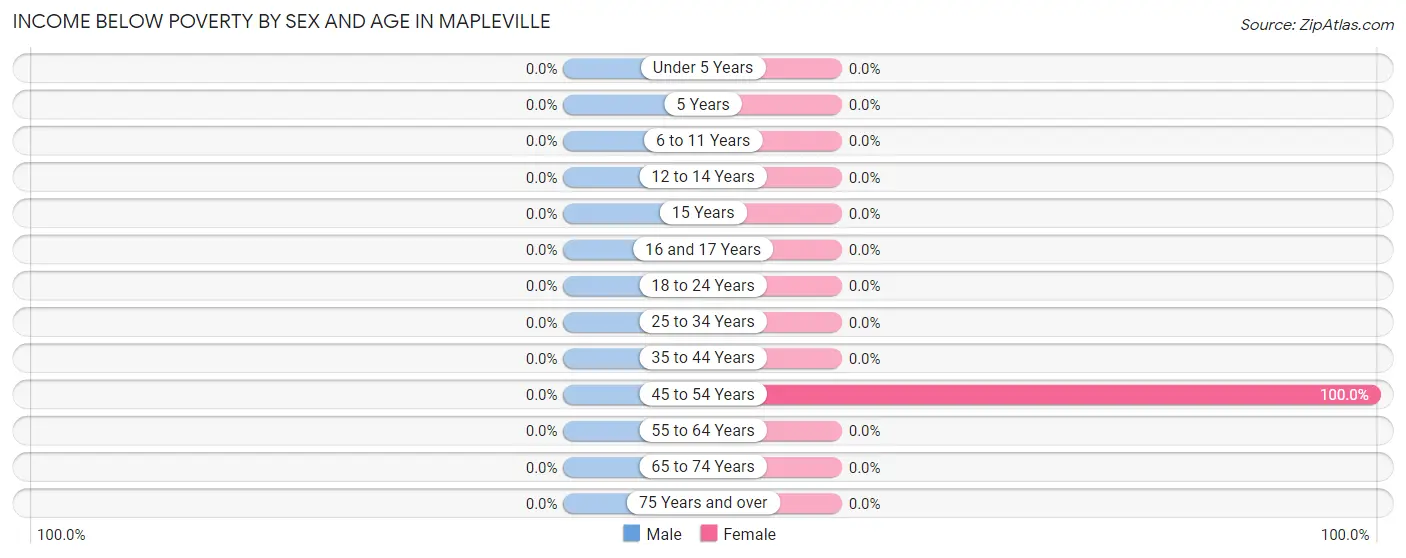
| Age Bracket | Male | Female |
| Under 5 Years | 0 (0.0%) | 0 (0.0%) |
| 5 Years | 0 (0.0%) | 0 (0.0%) |
| 6 to 11 Years | 0 (0.0%) | 0 (0.0%) |
| 12 to 14 Years | 0 (0.0%) | 0 (0.0%) |
| 15 Years | 0 (0.0%) | 0 (0.0%) |
| 16 and 17 Years | 0 (0.0%) | 0 (0.0%) |
| 18 to 24 Years | 0 (0.0%) | 0 (0.0%) |
| 25 to 34 Years | 0 (0.0%) | 0 (0.0%) |
| 35 to 44 Years | 0 (0.0%) | 0 (0.0%) |
| 45 to 54 Years | 0 (0.0%) | 56 (100.0%) |
| 55 to 64 Years | 0 (0.0%) | 0 (0.0%) |
| 65 to 74 Years | 0 (0.0%) | 0 (0.0%) |
| 75 Years and over | 0 (0.0%) | 0 (0.0%) |
| Total | 0 (0.0%) | 56 (40.3%) |
Income Above Poverty by Sex and Age in Mapleville
According to the poverty statistics in Mapleville, males aged 45 to 54 years and females aged 35 to 44 years are the age groups that are most secure financially, with 100.0% of males and 100.0% of females in these age groups living above the poverty line.
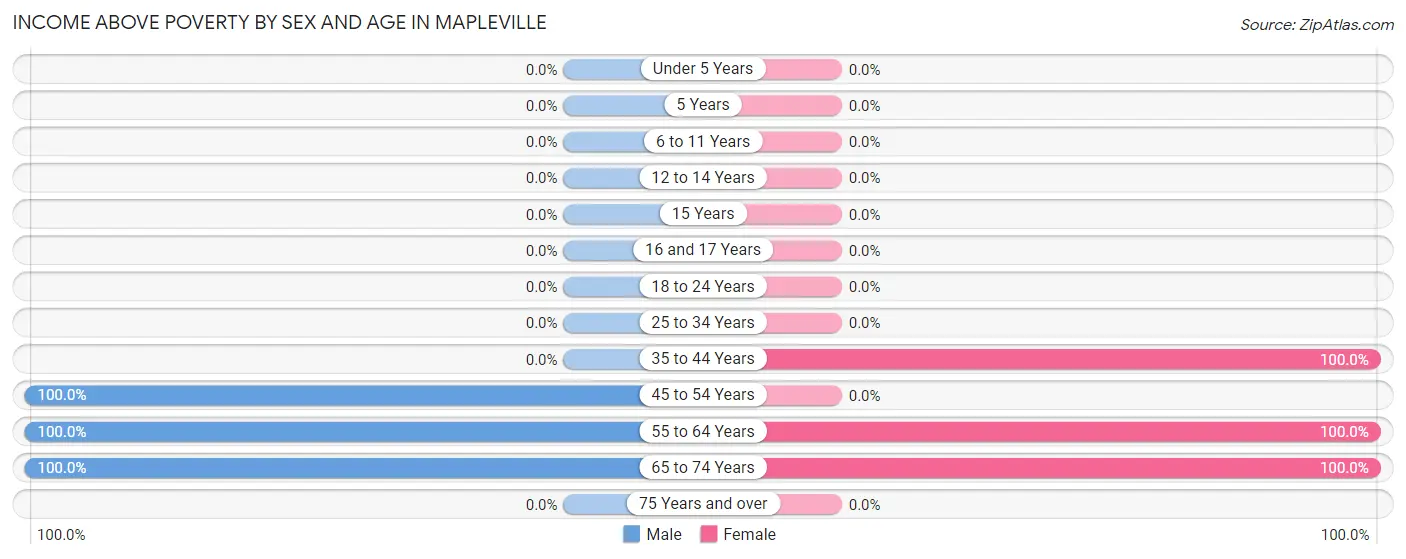
| Age Bracket | Male | Female |
| Under 5 Years | 0 (0.0%) | 0 (0.0%) |
| 5 Years | 0 (0.0%) | 0 (0.0%) |
| 6 to 11 Years | 0 (0.0%) | 0 (0.0%) |
| 12 to 14 Years | 0 (0.0%) | 0 (0.0%) |
| 15 Years | 0 (0.0%) | 0 (0.0%) |
| 16 and 17 Years | 0 (0.0%) | 0 (0.0%) |
| 18 to 24 Years | 0 (0.0%) | 0 (0.0%) |
| 25 to 34 Years | 0 (0.0%) | 0 (0.0%) |
| 35 to 44 Years | 0 (0.0%) | 27 (100.0%) |
| 45 to 54 Years | 62 (100.0%) | 0 (0.0%) |
| 55 to 64 Years | 39 (100.0%) | 40 (100.0%) |
| 65 to 74 Years | 16 (100.0%) | 16 (100.0%) |
| 75 Years and over | 0 (0.0%) | 0 (0.0%) |
| Total | 117 (100.0%) | 83 (59.7%) |
Income Below Poverty Among Married-Couple Families in Mapleville
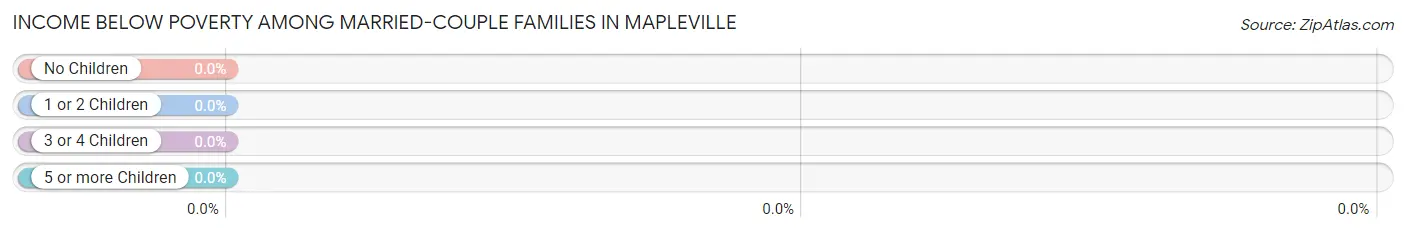
| Children | Above Poverty | Below Poverty |
| No Children | 55 (100.0%) | 0 (0.0%) |
| 1 or 2 Children | 0 (0.0%) | 0 (0.0%) |
| 3 or 4 Children | 0 (0.0%) | 0 (0.0%) |
| 5 or more Children | 0 (0.0%) | 0 (0.0%) |
| Total | 55 (100.0%) | 0 (0.0%) |
Income Below Poverty Among Single-Parent Households in Mapleville
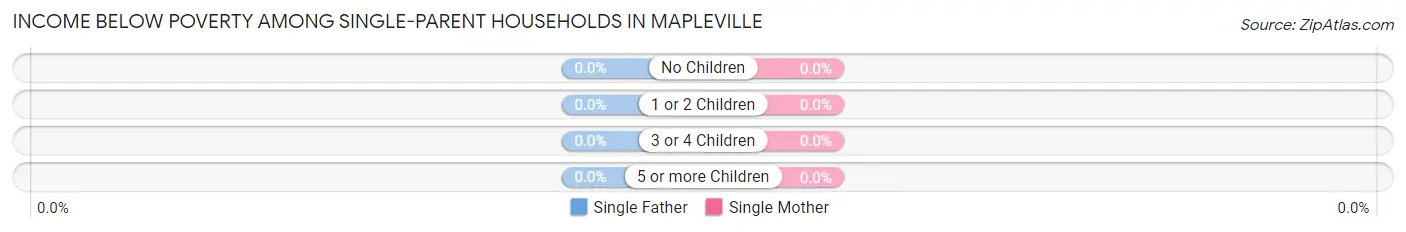
| Children | Single Father | Single Mother |
| No Children | 0 (0.0%) | 0 (0.0%) |
| 1 or 2 Children | 0 (0.0%) | 0 (0.0%) |
| 3 or 4 Children | 0 (0.0%) | 0 (0.0%) |
| 5 or more Children | 0 (0.0%) | 0 (0.0%) |
| Total | 0 (0.0%) | 0 (0.0%) |
Income Below Poverty Among Married-Couple vs Single-Parent Households in Mapleville
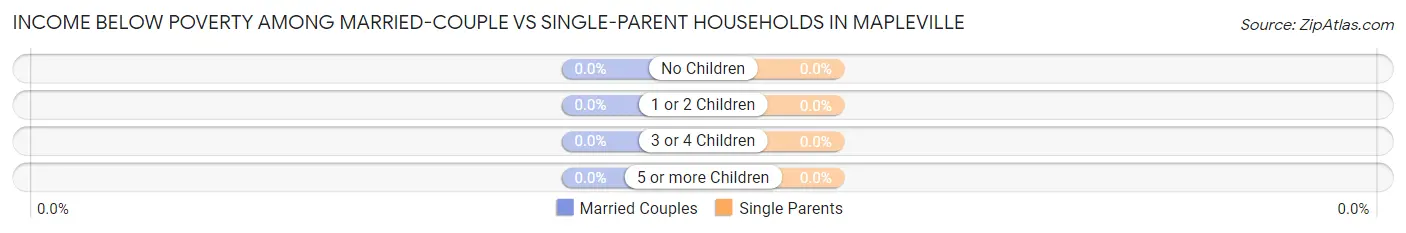
| Children | Married-Couple Families | Single-Parent Households |
| No Children | 0 (0.0%) | 0 (0.0%) |
| 1 or 2 Children | 0 (0.0%) | 0 (0.0%) |
| 3 or 4 Children | 0 (0.0%) | 0 (0.0%) |
| 5 or more Children | 0 (0.0%) | 0 (0.0%) |
| Total | 0 (0.0%) | 0 (0.0%) |
Employment Characteristics in Mapleville
Employment by Class of Employer in Mapleville
Among the 168 employed individuals in Mapleville, private company employees (101 | 60.1%), and not-for-profit organizations (67 | 39.9%) make up the most common classes of employment.
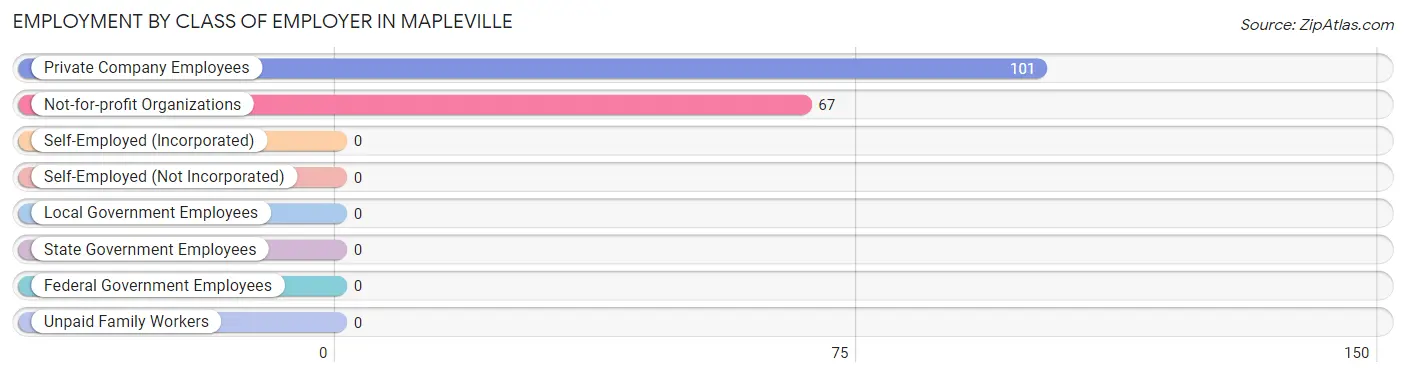
| Employer Class | # Employees | % Employees |
| Private Company Employees | 101 | 60.1% |
| Self-Employed (Incorporated) | 0 | 0.0% |
| Self-Employed (Not Incorporated) | 0 | 0.0% |
| Not-for-profit Organizations | 67 | 39.9% |
| Local Government Employees | 0 | 0.0% |
| State Government Employees | 0 | 0.0% |
| Federal Government Employees | 0 | 0.0% |
| Unpaid Family Workers | 0 | 0.0% |
| Total | 168 | 100.0% |
Employment Status by Age in Mapleville
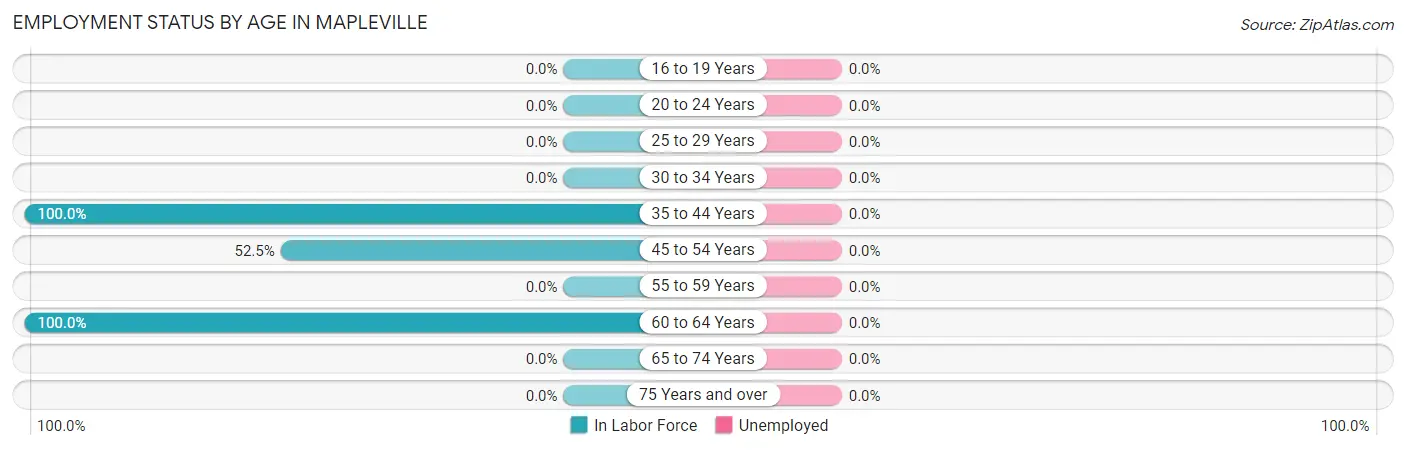
| Age Bracket | In Labor Force | Unemployed |
| 16 to 19 Years | 0 (0.0%) | 0 (0.0%) |
| 20 to 24 Years | 0 (0.0%) | 0 (0.0%) |
| 25 to 29 Years | 0 (0.0%) | 0 (0.0%) |
| 30 to 34 Years | 0 (0.0%) | 0 (0.0%) |
| 35 to 44 Years | 27 (100.0%) | 0 (0.0%) |
| 45 to 54 Years | 62 (52.5%) | 0 (0.0%) |
| 55 to 59 Years | 0 (0.0%) | 0 (0.0%) |
| 60 to 64 Years | 79 (100.0%) | 0 (0.0%) |
| 65 to 74 Years | 0 (0.0%) | 0 (0.0%) |
| 75 Years and over | 0 (0.0%) | 0 (0.0%) |
| Total | 168 (65.6%) | 0 (0.0%) |
Employment Status by Educational Attainment in Mapleville
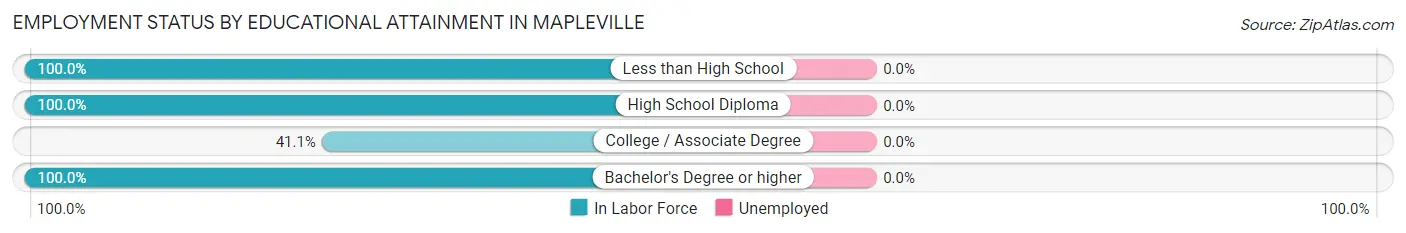
| Educational Attainment | In Labor Force | Unemployed |
| Less than High School | 62 (100.0%) | 0 (0.0%) |
| High School Diploma | 40 (100.0%) | 0 (0.0%) |
| College / Associate Degree | 39 (41.1%) | 0 (0.0%) |
| Bachelor's Degree or higher | 27 (100.0%) | 0 (0.0%) |
| Total | 168 (75.0%) | 0 (0.0%) |
Employment Occupations by Sex in Mapleville
Management, Business, Science and Arts Occupations
The most common Management, Business, Science and Arts occupations in Mapleville are Community & Social Service (27 | 16.1%), and Education, Arts & Media (27 | 16.1%).
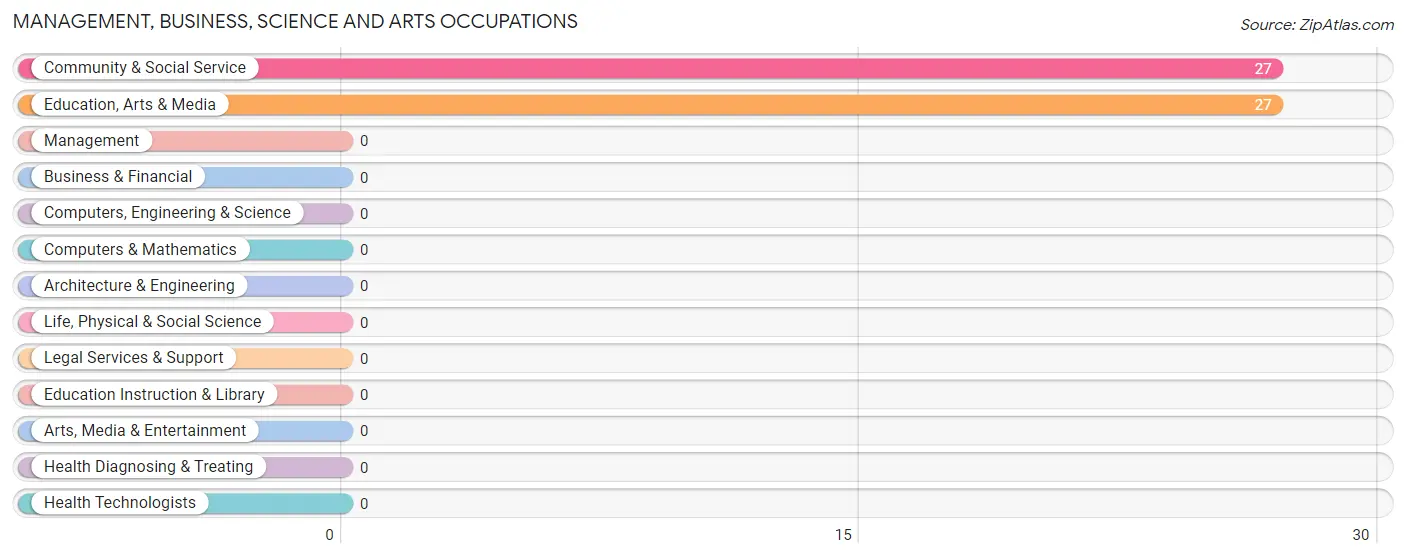
Management, Business, Science and Arts Occupations by Sex
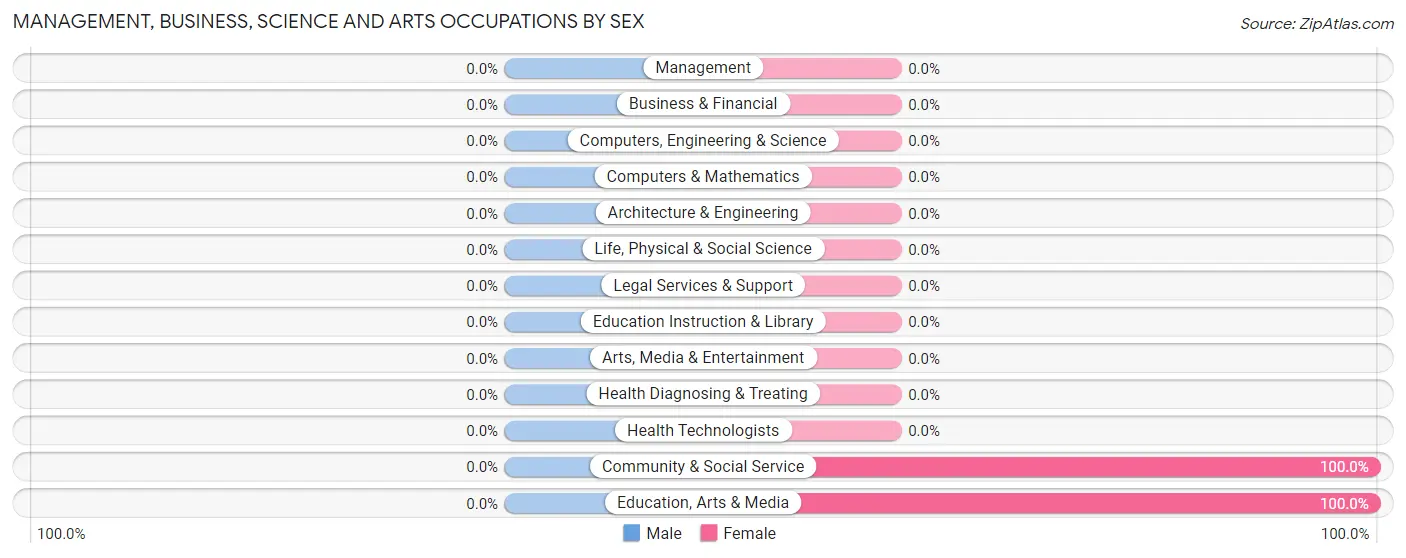
| Occupation | Male | Female |
| Management | 0 (0.0%) | 0 (0.0%) |
| Business & Financial | 0 (0.0%) | 0 (0.0%) |
| Computers, Engineering & Science | 0 (0.0%) | 0 (0.0%) |
| Computers & Mathematics | 0 (0.0%) | 0 (0.0%) |
| Architecture & Engineering | 0 (0.0%) | 0 (0.0%) |
| Life, Physical & Social Science | 0 (0.0%) | 0 (0.0%) |
| Community & Social Service | 0 (0.0%) | 27 (100.0%) |
| Education, Arts & Media | 0 (0.0%) | 27 (100.0%) |
| Legal Services & Support | 0 (0.0%) | 0 (0.0%) |
| Education Instruction & Library | 0 (0.0%) | 0 (0.0%) |
| Arts, Media & Entertainment | 0 (0.0%) | 0 (0.0%) |
| Health Diagnosing & Treating | 0 (0.0%) | 0 (0.0%) |
| Health Technologists | 0 (0.0%) | 0 (0.0%) |
| Total (Category) | 0 (0.0%) | 27 (100.0%) |
| Total (Overall) | 101 (60.1%) | 67 (39.9%) |
Services Occupations
Services Occupations by Sex
| Occupation | Male | Female |
| Healthcare Support | 0 (0.0%) | 0 (0.0%) |
| Security & Protection | 0 (0.0%) | 0 (0.0%) |
| Firefighting & Prevention | 0 (0.0%) | 0 (0.0%) |
| Law Enforcement | 0 (0.0%) | 0 (0.0%) |
| Food Preparation & Serving | 0 (0.0%) | 0 (0.0%) |
| Cleaning & Maintenance | 0 (0.0%) | 0 (0.0%) |
| Personal Care & Service | 0 (0.0%) | 0 (0.0%) |
| Total (Category) | 0 (0.0%) | 0 (0.0%) |
| Total (Overall) | 101 (60.1%) | 67 (39.9%) |
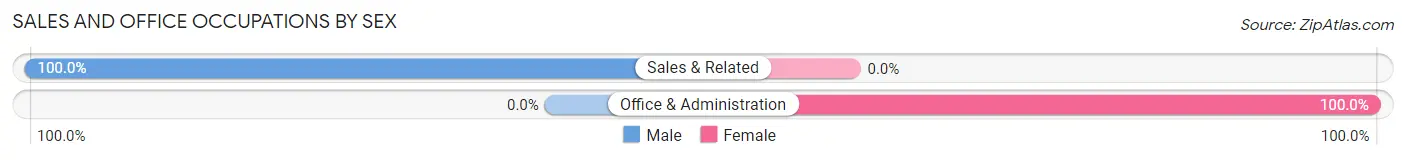
Sales and Office Occupations
The most common Sales and Office occupations in Mapleville are Office & Administration (40 | 23.8%), and Sales & Related (39 | 23.2%).
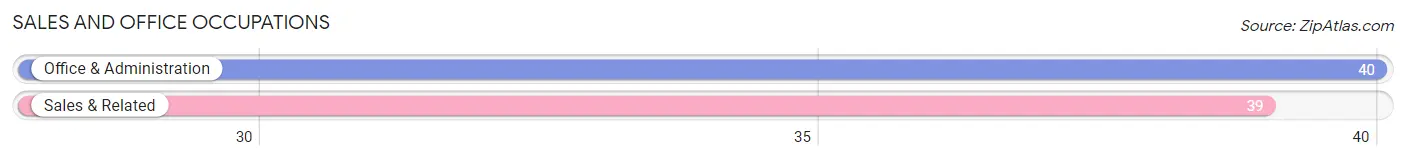
Sales and Office Occupations by Sex
| Occupation | Male | Female |
| Sales & Related | 39 (100.0%) | 0 (0.0%) |
| Office & Administration | 0 (0.0%) | 40 (100.0%) |
| Total (Category) | 39 (49.4%) | 40 (50.6%) |
| Total (Overall) | 101 (60.1%) | 67 (39.9%) |
Natural Resources, Construction and Maintenance Occupations
The most common Natural Resources, Construction and Maintenance occupations in Mapleville are , and Construction & Extraction (62 | 36.9%).
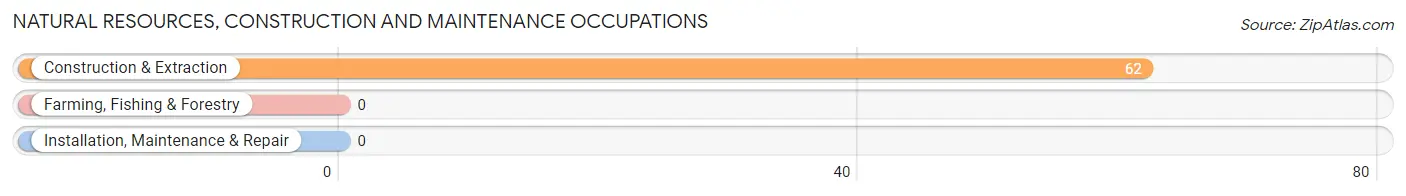
Natural Resources, Construction and Maintenance Occupations by Sex
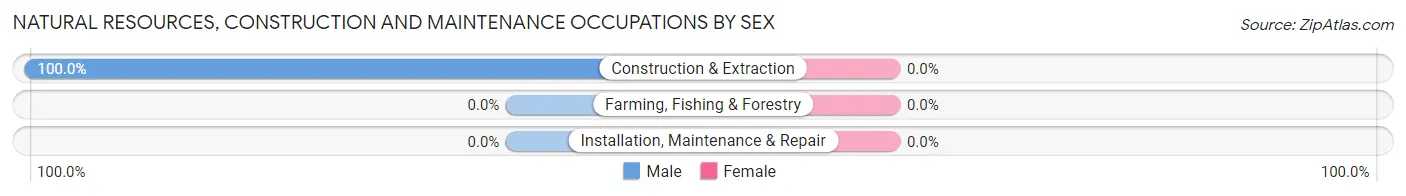
| Occupation | Male | Female |
| Farming, Fishing & Forestry | 0 (0.0%) | 0 (0.0%) |
| Construction & Extraction | 62 (100.0%) | 0 (0.0%) |
| Installation, Maintenance & Repair | 0 (0.0%) | 0 (0.0%) |
| Total (Category) | 62 (100.0%) | 0 (0.0%) |
| Total (Overall) | 101 (60.1%) | 67 (39.9%) |
Production, Transportation and Moving Occupations
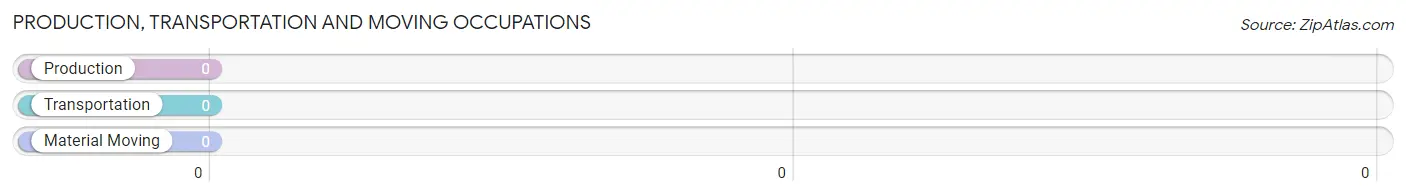
Production, Transportation and Moving Occupations by Sex
| Occupation | Male | Female |
| Production | 0 (0.0%) | 0 (0.0%) |
| Transportation | 0 (0.0%) | 0 (0.0%) |
| Material Moving | 0 (0.0%) | 0 (0.0%) |
| Total (Category) | 0 (0.0%) | 0 (0.0%) |
| Total (Overall) | 101 (60.1%) | 67 (39.9%) |
Employment Industries by Sex in Mapleville
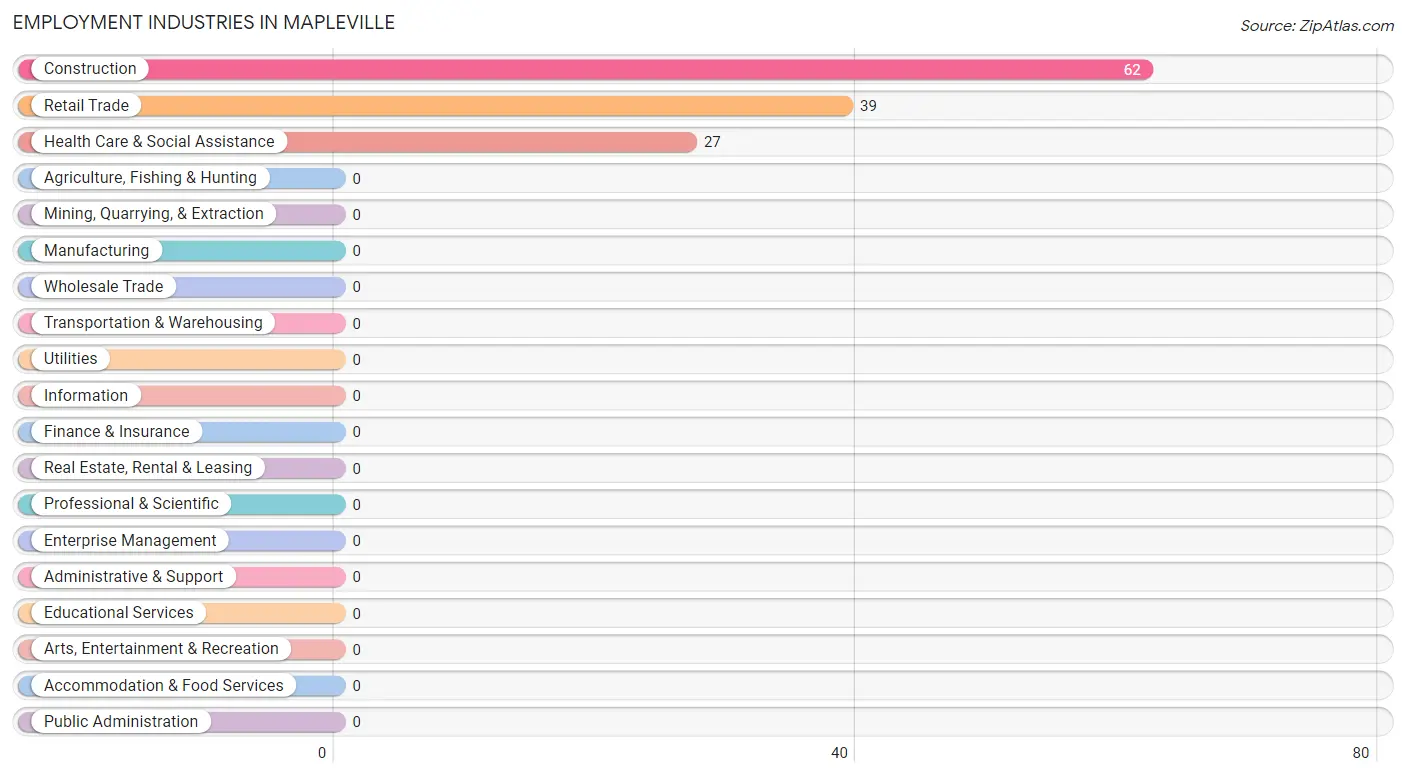
Employment Industries in Mapleville
The major employment industries in Mapleville include Construction (62 | 36.9%), Retail Trade (39 | 23.2%), and Health Care & Social Assistance (27 | 16.1%).
Employment Industries by Sex in Mapleville
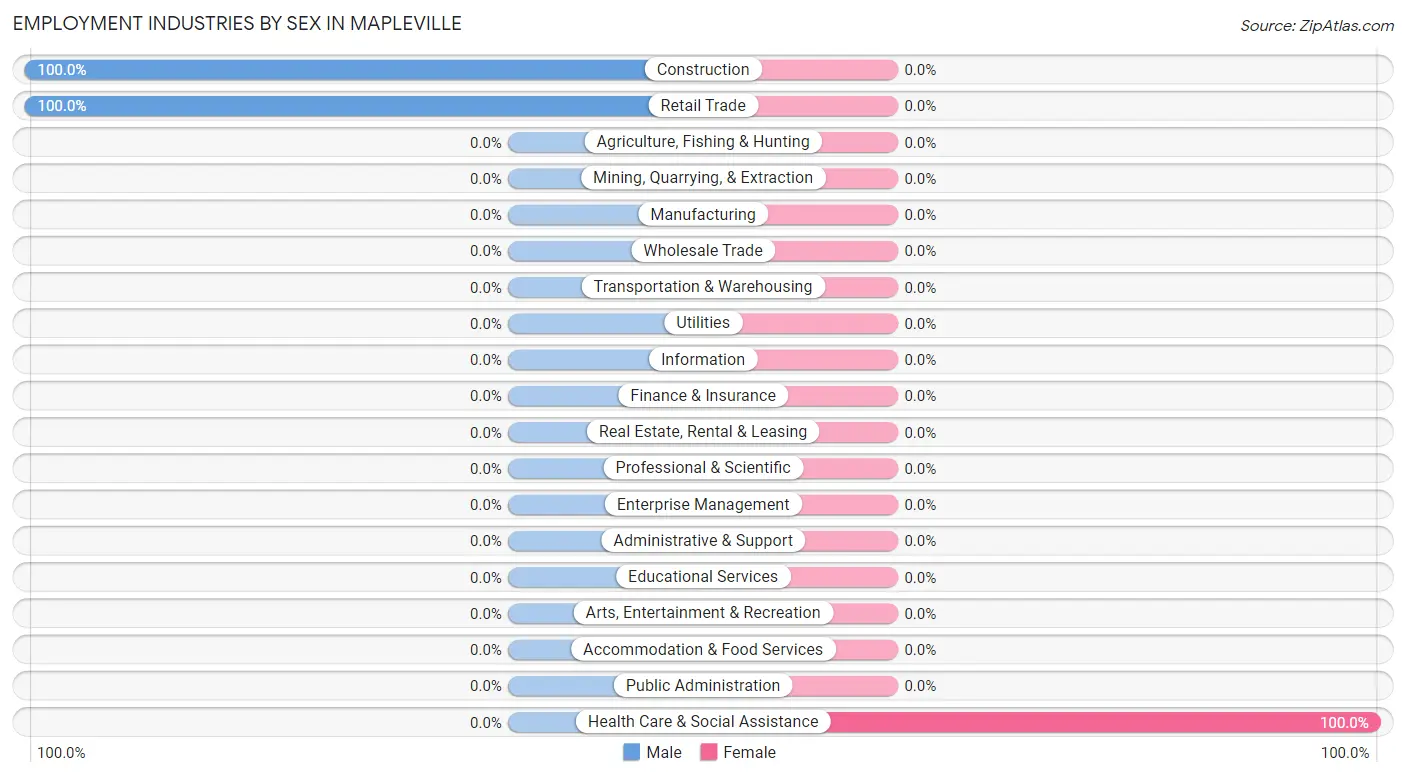
| Industry | Male | Female |
| Agriculture, Fishing & Hunting | 0 (0.0%) | 0 (0.0%) |
| Mining, Quarrying, & Extraction | 0 (0.0%) | 0 (0.0%) |
| Construction | 62 (100.0%) | 0 (0.0%) |
| Manufacturing | 0 (0.0%) | 0 (0.0%) |
| Wholesale Trade | 0 (0.0%) | 0 (0.0%) |
| Retail Trade | 39 (100.0%) | 0 (0.0%) |
| Transportation & Warehousing | 0 (0.0%) | 0 (0.0%) |
| Utilities | 0 (0.0%) | 0 (0.0%) |
| Information | 0 (0.0%) | 0 (0.0%) |
| Finance & Insurance | 0 (0.0%) | 0 (0.0%) |
| Real Estate, Rental & Leasing | 0 (0.0%) | 0 (0.0%) |
| Professional & Scientific | 0 (0.0%) | 0 (0.0%) |
| Enterprise Management | 0 (0.0%) | 0 (0.0%) |
| Administrative & Support | 0 (0.0%) | 0 (0.0%) |
| Educational Services | 0 (0.0%) | 0 (0.0%) |
| Health Care & Social Assistance | 0 (0.0%) | 27 (100.0%) |
| Arts, Entertainment & Recreation | 0 (0.0%) | 0 (0.0%) |
| Accommodation & Food Services | 0 (0.0%) | 0 (0.0%) |
| Public Administration | 0 (0.0%) | 0 (0.0%) |
| Total | 101 (60.1%) | 67 (39.9%) |
Education in Mapleville
School Enrollment in Mapleville
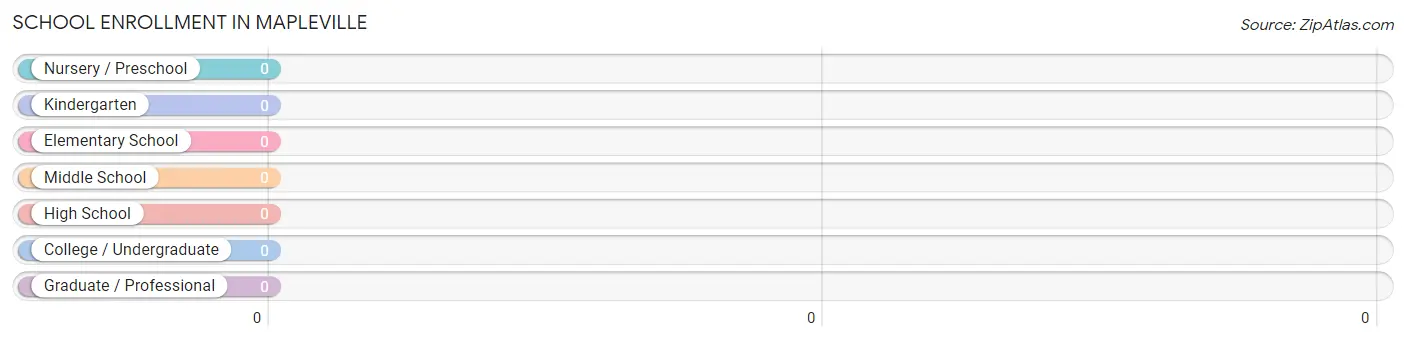
| School Level | # Students | % Students |
| Nursery / Preschool | 0 | 0.0% |
| Kindergarten | 0 | 0.0% |
| Elementary School | 0 | 0.0% |
| Middle School | 0 | 0.0% |
| High School | 0 | 0.0% |
| College / Undergraduate | 0 | 0.0% |
| Graduate / Professional | 0 | 0.0% |
| Total | 0 | 0.0% |
School Enrollment by Age by Funding Source in Mapleville
| Age Bracket | Public School | Private School |
| 3 to 4 Year Olds | 0 (0.0%) | 0 (0.0%) |
| 5 to 9 Year Old | 0 (0.0%) | 0 (0.0%) |
| 10 to 14 Year Olds | 0 (0.0%) | 0 (0.0%) |
| 15 to 17 Year Olds | 0 (0.0%) | 0 (0.0%) |
| 18 to 19 Year Olds | 0 (0.0%) | 0 (0.0%) |
| 20 to 24 Year Olds | 0 (0.0%) | 0 (0.0%) |
| 25 to 34 Year Olds | 0 (0.0%) | 0 (0.0%) |
| 35 Years and over | 0 (0.0%) | 0 (0.0%) |
| Total | 0 (0.0%) | 0 (0.0%) |
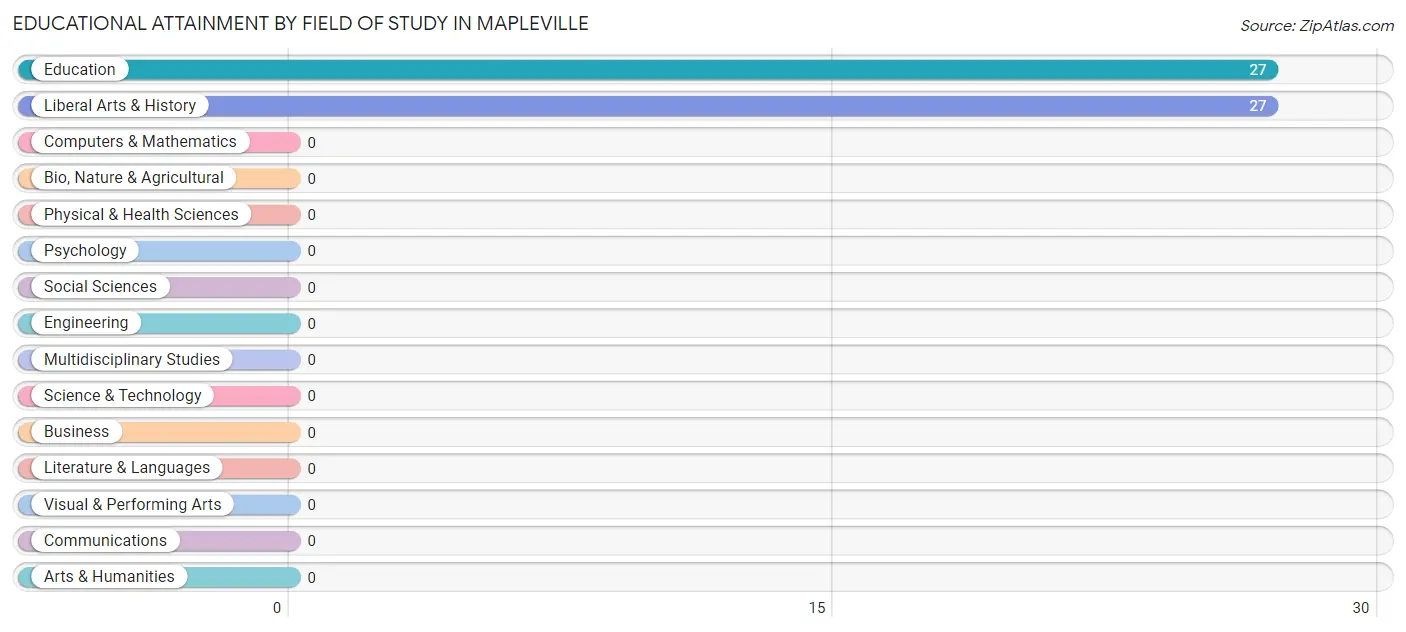
Educational Attainment by Field of Study in Mapleville
Education (27 | 50.0%), and liberal arts & history (27 | 50.0%) are the most common fields of study among 54 individuals in Mapleville who have obtained a bachelor's degree or higher.
| Field of Study | # Graduates | % Graduates |
| Computers & Mathematics | 0 | 0.0% |
| Bio, Nature & Agricultural | 0 | 0.0% |
| Physical & Health Sciences | 0 | 0.0% |
| Psychology | 0 | 0.0% |
| Social Sciences | 0 | 0.0% |
| Engineering | 0 | 0.0% |
| Multidisciplinary Studies | 0 | 0.0% |
| Science & Technology | 0 | 0.0% |
| Business | 0 | 0.0% |
| Education | 27 | 50.0% |
| Literature & Languages | 0 | 0.0% |
| Liberal Arts & History | 27 | 50.0% |
| Visual & Performing Arts | 0 | 0.0% |
| Communications | 0 | 0.0% |
| Arts & Humanities | 0 | 0.0% |
| Total | 54 | 100.0% |
Transportation & Commute in Mapleville
Vehicle Availability by Sex in Mapleville
The most prevalent vehicle ownership categories in Mapleville are males with 2 vehicles (101, accounting for 100.0%) and females with 2 vehicles (40, making up 150.8%).
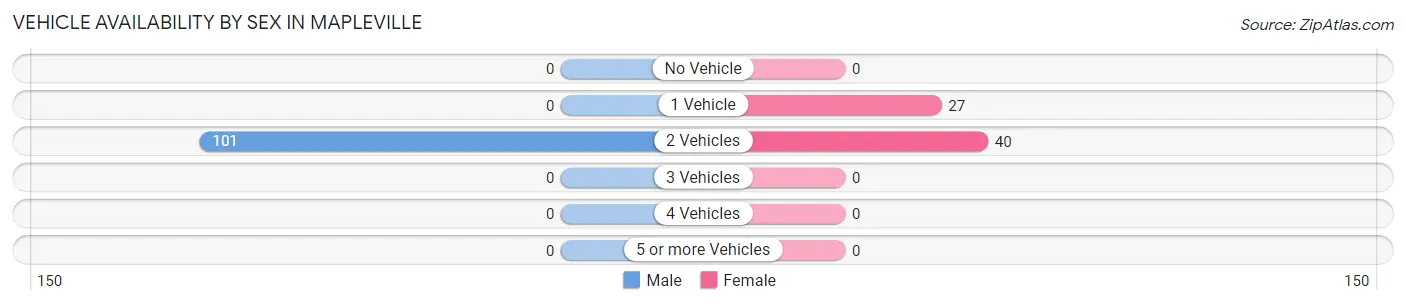
| Vehicles Available | Male | Female |
| No Vehicle | 0 (0.0%) | 0 (0.0%) |
| 1 Vehicle | 0 (0.0%) | 27 (40.3%) |
| 2 Vehicles | 101 (100.0%) | 40 (59.7%) |
| 3 Vehicles | 0 (0.0%) | 0 (0.0%) |
| 4 Vehicles | 0 (0.0%) | 0 (0.0%) |
| 5 or more Vehicles | 0 (0.0%) | 0 (0.0%) |
| Total | 101 (100.0%) | 67 (100.0%) |
Commute Time in Mapleville
The most frequently occuring commute durations in Mapleville are 10 to 14 minutes (79 commuters, 56.0%), 30 to 34 minutes (62 commuters, 44.0%), and less than 5 minutes (0 commuters, 0.0%).
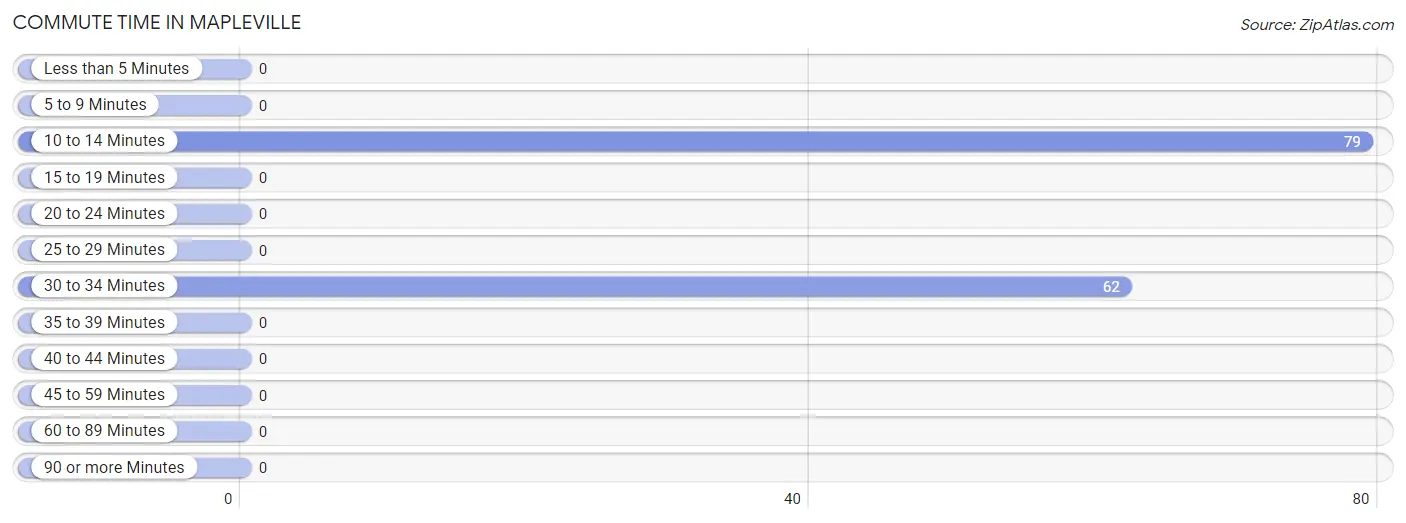
| Commute Time | # Commuters | % Commuters |
| Less than 5 Minutes | 0 | 0.0% |
| 5 to 9 Minutes | 0 | 0.0% |
| 10 to 14 Minutes | 79 | 56.0% |
| 15 to 19 Minutes | 0 | 0.0% |
| 20 to 24 Minutes | 0 | 0.0% |
| 25 to 29 Minutes | 0 | 0.0% |
| 30 to 34 Minutes | 62 | 44.0% |
| 35 to 39 Minutes | 0 | 0.0% |
| 40 to 44 Minutes | 0 | 0.0% |
| 45 to 59 Minutes | 0 | 0.0% |
| 60 to 89 Minutes | 0 | 0.0% |
| 90 or more Minutes | 0 | 0.0% |
Commute Time by Sex in Mapleville
The most common commute times in Mapleville are 30 to 34 minutes (62 commuters, 61.4%) for males and 10 to 14 minutes (40 commuters, 100.0%) for females.
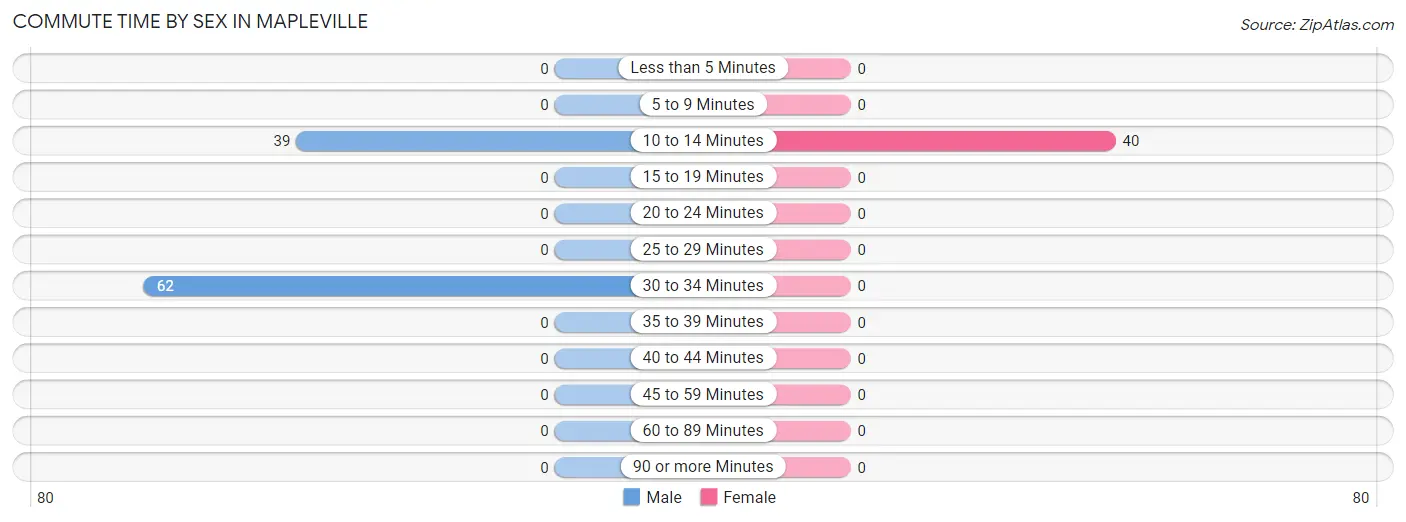
| Commute Time | Male | Female |
| Less than 5 Minutes | 0 (0.0%) | 0 (0.0%) |
| 5 to 9 Minutes | 0 (0.0%) | 0 (0.0%) |
| 10 to 14 Minutes | 39 (38.6%) | 40 (100.0%) |
| 15 to 19 Minutes | 0 (0.0%) | 0 (0.0%) |
| 20 to 24 Minutes | 0 (0.0%) | 0 (0.0%) |
| 25 to 29 Minutes | 0 (0.0%) | 0 (0.0%) |
| 30 to 34 Minutes | 62 (61.4%) | 0 (0.0%) |
| 35 to 39 Minutes | 0 (0.0%) | 0 (0.0%) |
| 40 to 44 Minutes | 0 (0.0%) | 0 (0.0%) |
| 45 to 59 Minutes | 0 (0.0%) | 0 (0.0%) |
| 60 to 89 Minutes | 0 (0.0%) | 0 (0.0%) |
| 90 or more Minutes | 0 (0.0%) | 0 (0.0%) |
Time of Departure to Work by Sex in Mapleville
The most frequent times of departure to work in Mapleville are 6:00 AM to 6:29 AM (62, 61.4%) for males and 8:00 AM to 8:29 AM (40, 100.0%) for females.
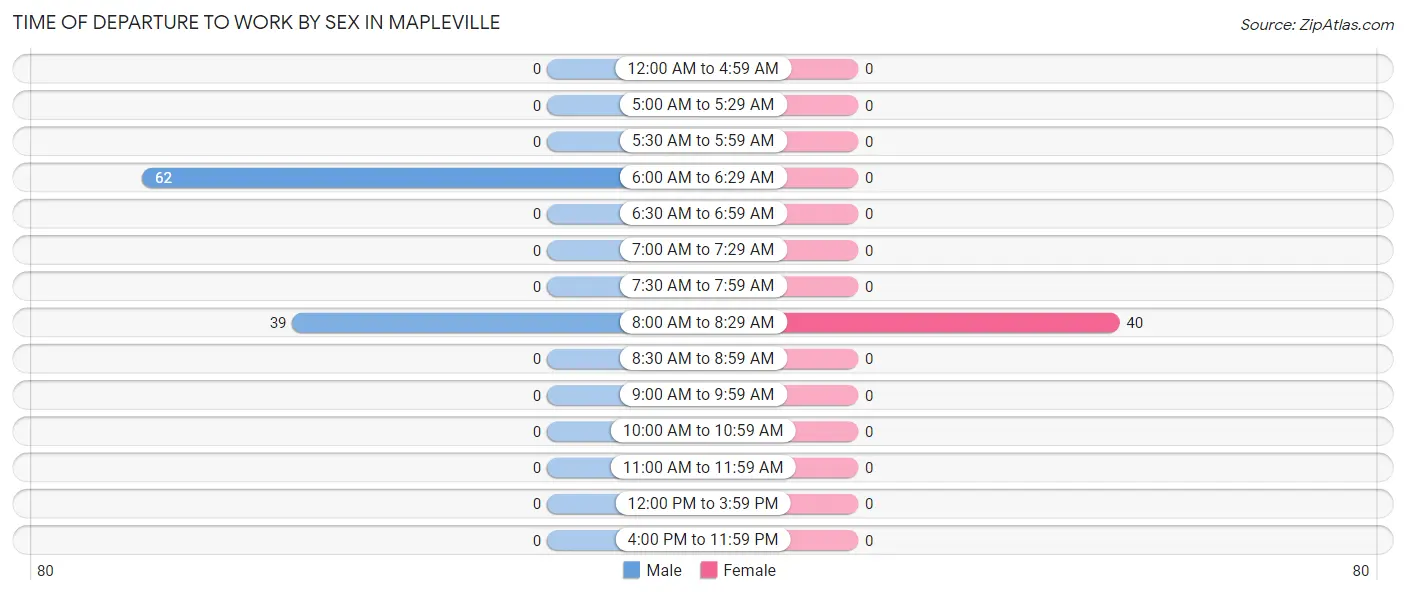
| Time of Departure | Male | Female |
| 12:00 AM to 4:59 AM | 0 (0.0%) | 0 (0.0%) |
| 5:00 AM to 5:29 AM | 0 (0.0%) | 0 (0.0%) |
| 5:30 AM to 5:59 AM | 0 (0.0%) | 0 (0.0%) |
| 6:00 AM to 6:29 AM | 62 (61.4%) | 0 (0.0%) |
| 6:30 AM to 6:59 AM | 0 (0.0%) | 0 (0.0%) |
| 7:00 AM to 7:29 AM | 0 (0.0%) | 0 (0.0%) |
| 7:30 AM to 7:59 AM | 0 (0.0%) | 0 (0.0%) |
| 8:00 AM to 8:29 AM | 39 (38.6%) | 40 (100.0%) |
| 8:30 AM to 8:59 AM | 0 (0.0%) | 0 (0.0%) |
| 9:00 AM to 9:59 AM | 0 (0.0%) | 0 (0.0%) |
| 10:00 AM to 10:59 AM | 0 (0.0%) | 0 (0.0%) |
| 11:00 AM to 11:59 AM | 0 (0.0%) | 0 (0.0%) |
| 12:00 PM to 3:59 PM | 0 (0.0%) | 0 (0.0%) |
| 4:00 PM to 11:59 PM | 0 (0.0%) | 0 (0.0%) |
| Total | 101 (100.0%) | 40 (100.0%) |
Housing Occupancy in Mapleville
Occupancy by Ownership in Mapleville
Of the total 138 dwellings in Mapleville, owner-occupied units account for 55 (39.9%), while renter-occupied units make up 83 (60.1%).
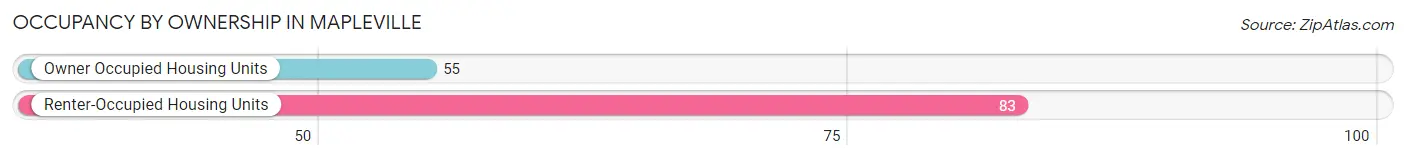
| Occupancy | # Housing Units | % Housing Units |
| Owner Occupied Housing Units | 55 | 39.9% |
| Renter-Occupied Housing Units | 83 | 60.1% |
| Total Occupied Housing Units | 138 | 100.0% |
Occupancy by Household Size in Mapleville
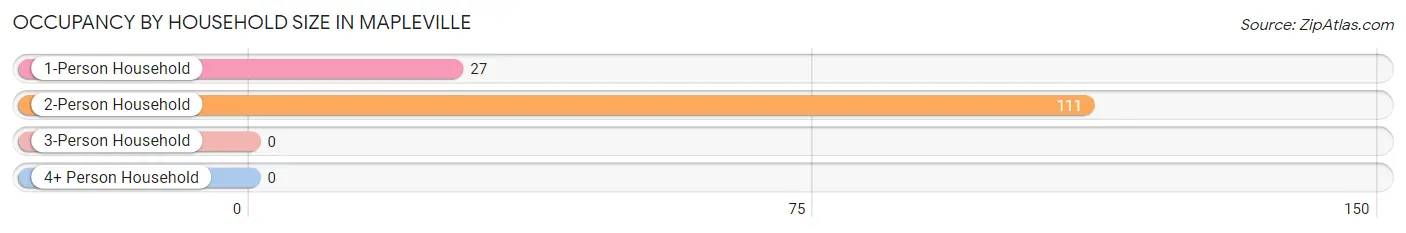
| Household Size | # Housing Units | % Housing Units |
| 1-Person Household | 27 | 19.6% |
| 2-Person Household | 111 | 80.4% |
| 3-Person Household | 0 | 0.0% |
| 4+ Person Household | 0 | 0.0% |
| Total Housing Units | 138 | 100.0% |
Occupancy by Ownership by Household Size in Mapleville
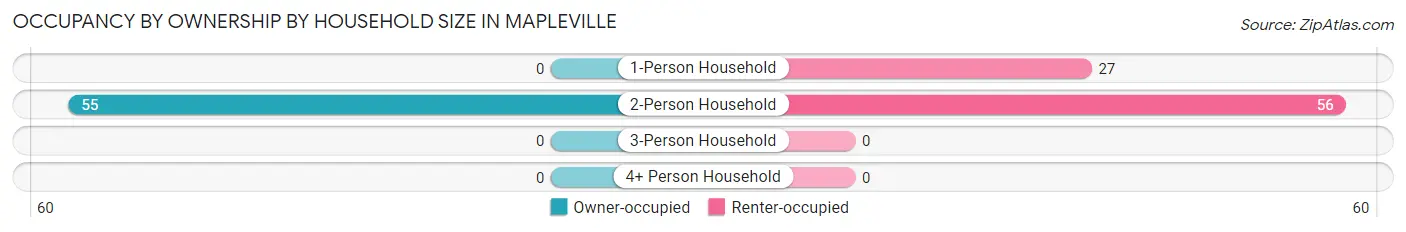
| Household Size | Owner-occupied | Renter-occupied |
| 1-Person Household | 0 (0.0%) | 27 (100.0%) |
| 2-Person Household | 55 (49.5%) | 56 (50.4%) |
| 3-Person Household | 0 (0.0%) | 0 (0.0%) |
| 4+ Person Household | 0 (0.0%) | 0 (0.0%) |
| Total Housing Units | 55 (39.9%) | 83 (60.1%) |
Occupancy by Educational Attainment in Mapleville
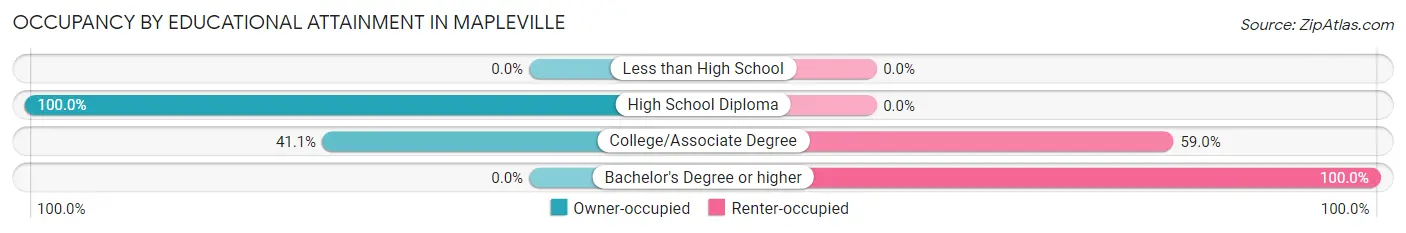
| Household Size | Owner-occupied | Renter-occupied |
| Less than High School | 0 (0.0%) | 0 (0.0%) |
| High School Diploma | 16 (100.0%) | 0 (0.0%) |
| College/Associate Degree | 39 (41.0%) | 56 (59.0%) |
| Bachelor's Degree or higher | 0 (0.0%) | 27 (100.0%) |
Occupancy by Age of Householder in Mapleville
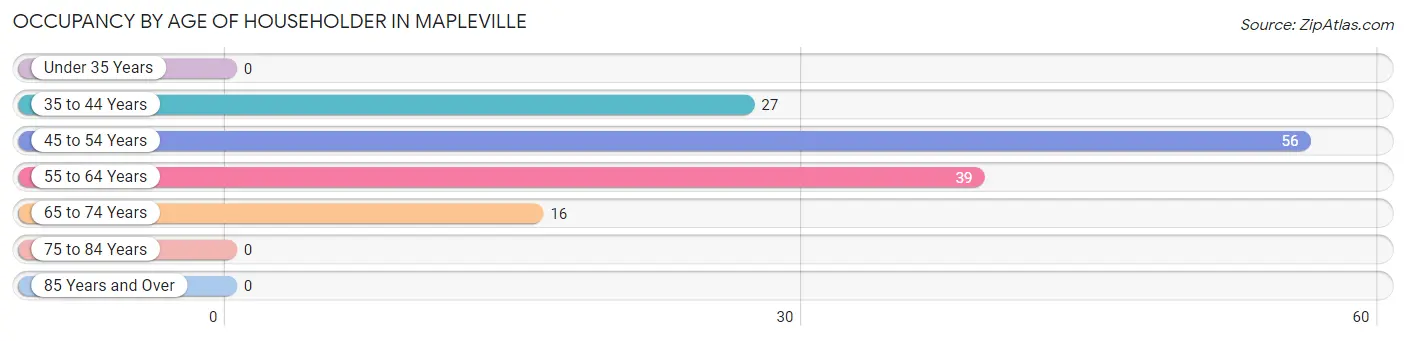
| Age Bracket | # Households | % Households |
| Under 35 Years | 0 | 0.0% |
| 35 to 44 Years | 27 | 19.6% |
| 45 to 54 Years | 56 | 40.6% |
| 55 to 64 Years | 39 | 28.3% |
| 65 to 74 Years | 16 | 11.6% |
| 75 to 84 Years | 0 | 0.0% |
| 85 Years and Over | 0 | 0.0% |
| Total | 138 | 100.0% |
Housing Finances in Mapleville
Median Income by Occupancy in Mapleville
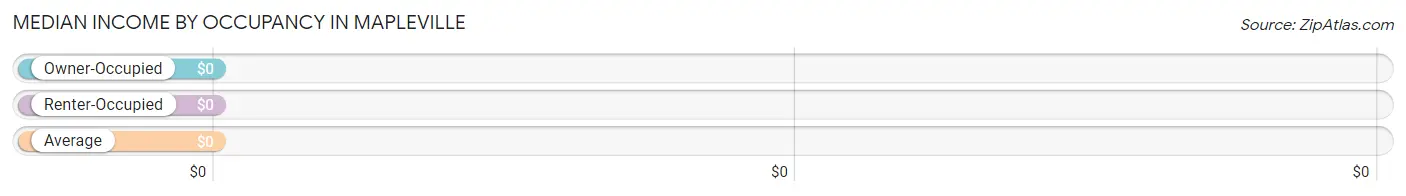
| Occupancy Type | # Households | Median Income |
| Owner-Occupied | 55 (39.9%) | $0 |
| Renter-Occupied | 83 (60.1%) | $0 |
| Average | 138 (100.0%) | $0 |
Occupancy by Householder Income Bracket in Mapleville
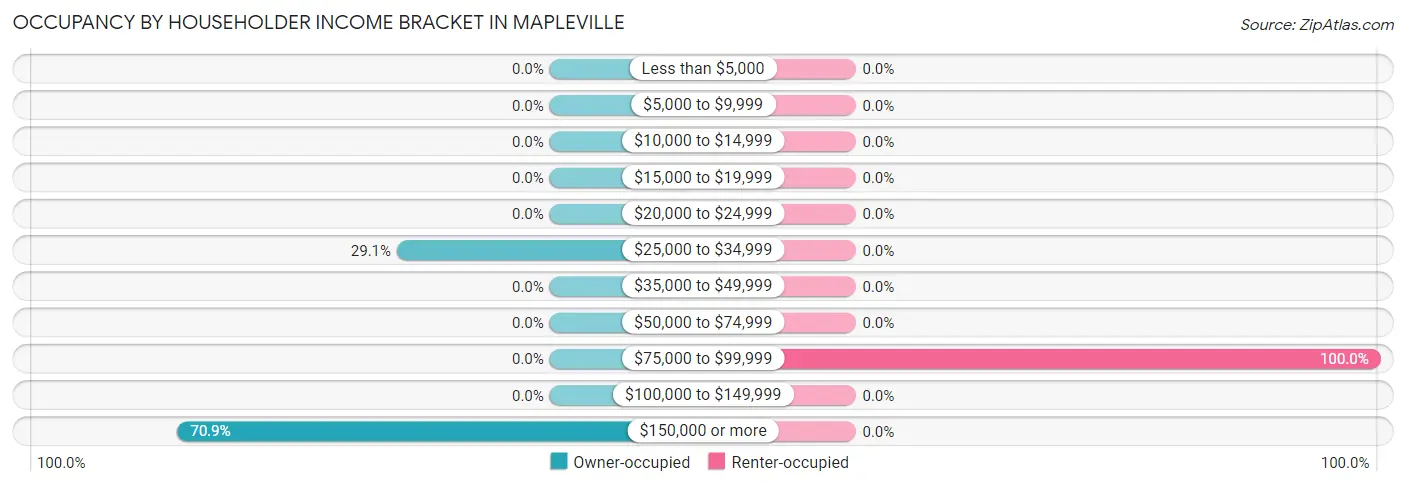
| Income Bracket | Owner-occupied | Renter-occupied |
| Less than $5,000 | 0 (0.0%) | 0 (0.0%) |
| $5,000 to $9,999 | 0 (0.0%) | 0 (0.0%) |
| $10,000 to $14,999 | 0 (0.0%) | 0 (0.0%) |
| $15,000 to $19,999 | 0 (0.0%) | 0 (0.0%) |
| $20,000 to $24,999 | 0 (0.0%) | 0 (0.0%) |
| $25,000 to $34,999 | 16 (29.1%) | 0 (0.0%) |
| $35,000 to $49,999 | 0 (0.0%) | 0 (0.0%) |
| $50,000 to $74,999 | 0 (0.0%) | 0 (0.0%) |
| $75,000 to $99,999 | 0 (0.0%) | 83 (100.0%) |
| $100,000 to $149,999 | 0 (0.0%) | 0 (0.0%) |
| $150,000 or more | 39 (70.9%) | 0 (0.0%) |
| Total | 55 (100.0%) | 83 (100.0%) |
Monthly Housing Cost Tiers in Mapleville
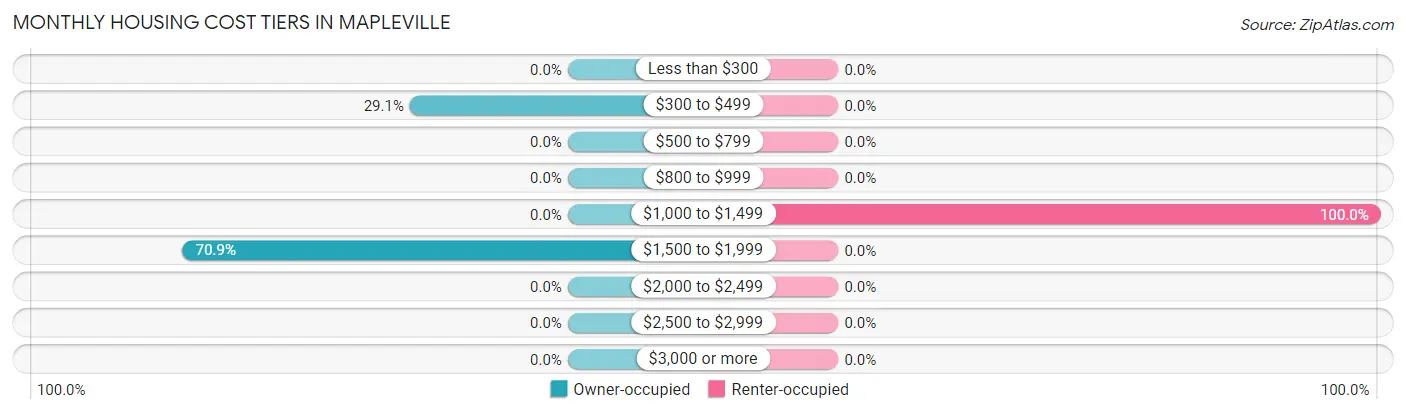
| Monthly Cost | Owner-occupied | Renter-occupied |
| Less than $300 | 0 (0.0%) | 0 (0.0%) |
| $300 to $499 | 16 (29.1%) | 0 (0.0%) |
| $500 to $799 | 0 (0.0%) | 0 (0.0%) |
| $800 to $999 | 0 (0.0%) | 0 (0.0%) |
| $1,000 to $1,499 | 0 (0.0%) | 83 (100.0%) |
| $1,500 to $1,999 | 39 (70.9%) | 0 (0.0%) |
| $2,000 to $2,499 | 0 (0.0%) | 0 (0.0%) |
| $2,500 to $2,999 | 0 (0.0%) | 0 (0.0%) |
| $3,000 or more | 0 (0.0%) | 0 (0.0%) |
| Total | 55 (100.0%) | 83 (100.0%) |
Physical Housing Characteristics in Mapleville
Housing Structures in Mapleville
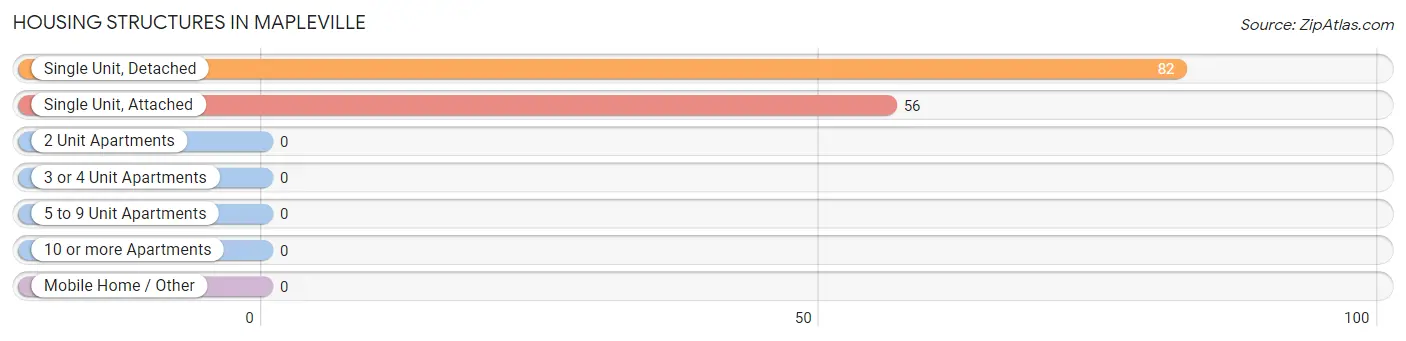
| Structure Type | # Housing Units | % Housing Units |
| Single Unit, Detached | 82 | 59.4% |
| Single Unit, Attached | 56 | 40.6% |
| 2 Unit Apartments | 0 | 0.0% |
| 3 or 4 Unit Apartments | 0 | 0.0% |
| 5 to 9 Unit Apartments | 0 | 0.0% |
| 10 or more Apartments | 0 | 0.0% |
| Mobile Home / Other | 0 | 0.0% |
| Total | 138 | 100.0% |
Housing Structures by Occupancy in Mapleville
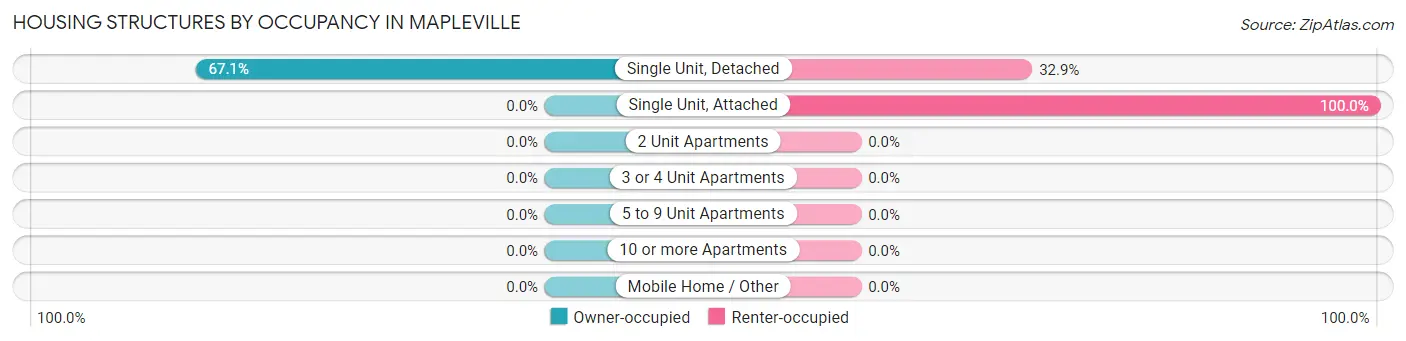
| Structure Type | Owner-occupied | Renter-occupied |
| Single Unit, Detached | 55 (67.1%) | 27 (32.9%) |
| Single Unit, Attached | 0 (0.0%) | 56 (100.0%) |
| 2 Unit Apartments | 0 (0.0%) | 0 (0.0%) |
| 3 or 4 Unit Apartments | 0 (0.0%) | 0 (0.0%) |
| 5 to 9 Unit Apartments | 0 (0.0%) | 0 (0.0%) |
| 10 or more Apartments | 0 (0.0%) | 0 (0.0%) |
| Mobile Home / Other | 0 (0.0%) | 0 (0.0%) |
| Total | 55 (39.9%) | 83 (60.1%) |
Housing Structures by Number of Rooms in Mapleville
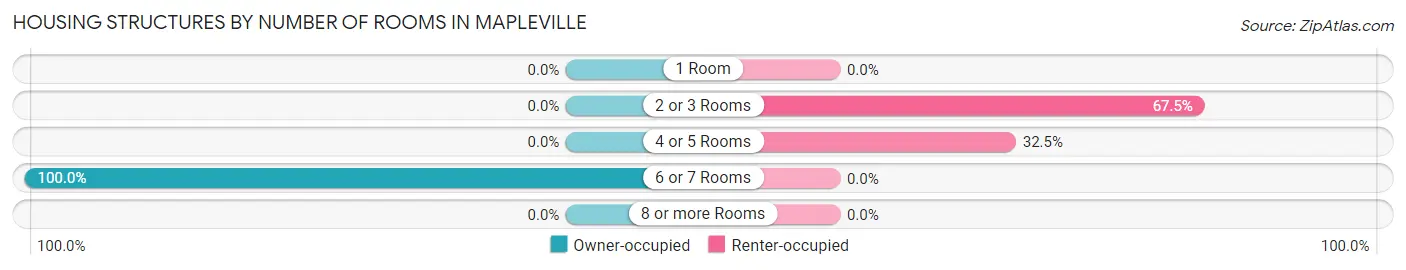
| Number of Rooms | Owner-occupied | Renter-occupied |
| 1 Room | 0 (0.0%) | 0 (0.0%) |
| 2 or 3 Rooms | 0 (0.0%) | 56 (67.5%) |
| 4 or 5 Rooms | 0 (0.0%) | 27 (32.5%) |
| 6 or 7 Rooms | 55 (100.0%) | 0 (0.0%) |
| 8 or more Rooms | 0 (0.0%) | 0 (0.0%) |
| Total | 55 (100.0%) | 83 (100.0%) |
Housing Structure by Heating Type in Mapleville
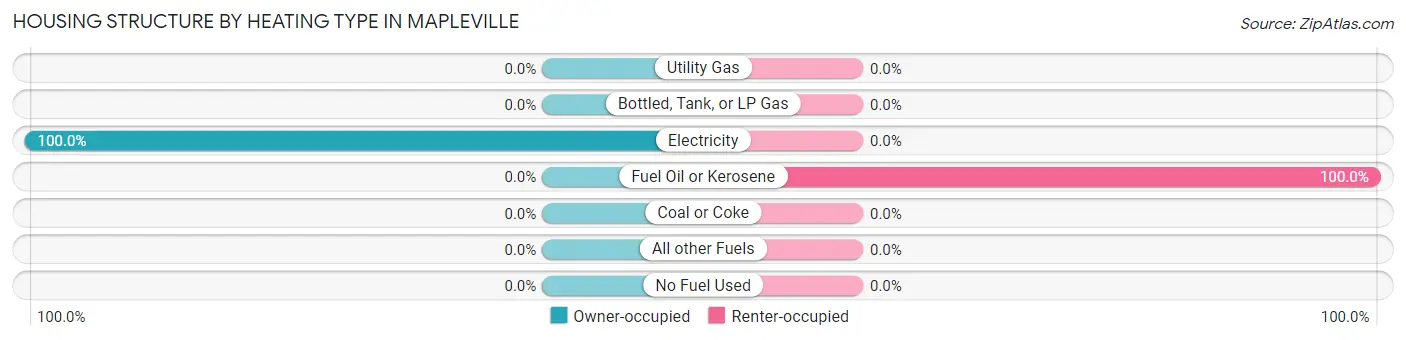
| Heating Type | Owner-occupied | Renter-occupied |
| Utility Gas | 0 (0.0%) | 0 (0.0%) |
| Bottled, Tank, or LP Gas | 0 (0.0%) | 0 (0.0%) |
| Electricity | 55 (100.0%) | 0 (0.0%) |
| Fuel Oil or Kerosene | 0 (0.0%) | 83 (100.0%) |
| Coal or Coke | 0 (0.0%) | 0 (0.0%) |
| All other Fuels | 0 (0.0%) | 0 (0.0%) |
| No Fuel Used | 0 (0.0%) | 0 (0.0%) |
| Total | 55 (100.0%) | 83 (100.0%) |
Household Vehicle Usage in Mapleville
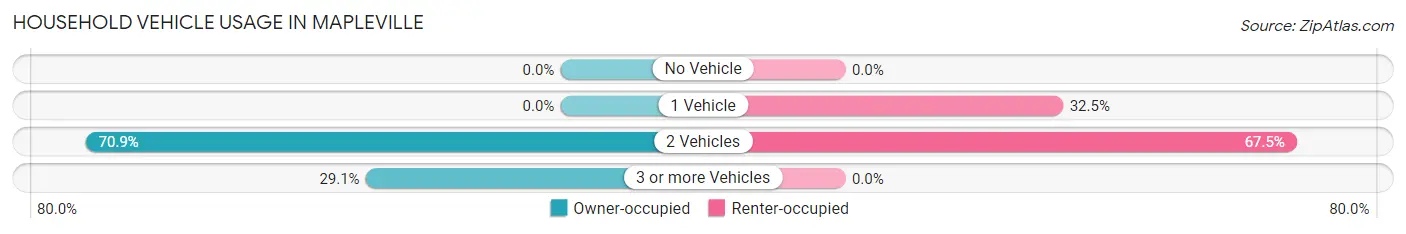
| Vehicles per Household | Owner-occupied | Renter-occupied |
| No Vehicle | 0 (0.0%) | 0 (0.0%) |
| 1 Vehicle | 0 (0.0%) | 27 (32.5%) |
| 2 Vehicles | 39 (70.9%) | 56 (67.5%) |
| 3 or more Vehicles | 16 (29.1%) | 0 (0.0%) |
| Total | 55 (100.0%) | 83 (100.0%) |
Real Estate & Mortgages in Mapleville
Real Estate and Mortgage Overview in Mapleville
| Characteristic | Without Mortgage | With Mortgage |
| Housing Units | 0 | 55 |
| Median Property Value | - | - |
| Median Household Income | - | - |
| Monthly Housing Costs | - | - |
| Real Estate Taxes | - | - |
Property Value by Mortgage Status in Mapleville
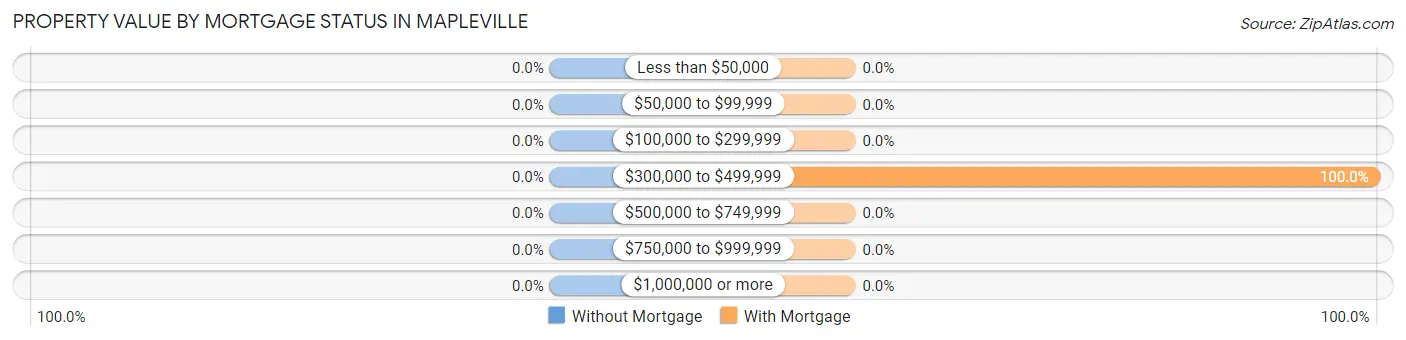
| Property Value | Without Mortgage | With Mortgage |
| Less than $50,000 | 0 (0.0%) | 0 (0.0%) |
| $50,000 to $99,999 | 0 (0.0%) | 0 (0.0%) |
| $100,000 to $299,999 | 0 (0.0%) | 0 (0.0%) |
| $300,000 to $499,999 | 0 (0.0%) | 55 (100.0%) |
| $500,000 to $749,999 | 0 (0.0%) | 0 (0.0%) |
| $750,000 to $999,999 | 0 (0.0%) | 0 (0.0%) |
| $1,000,000 or more | 0 (0.0%) | 0 (0.0%) |
| Total | 0 (0.0%) | 55 (100.0%) |
Household Income by Mortgage Status in Mapleville
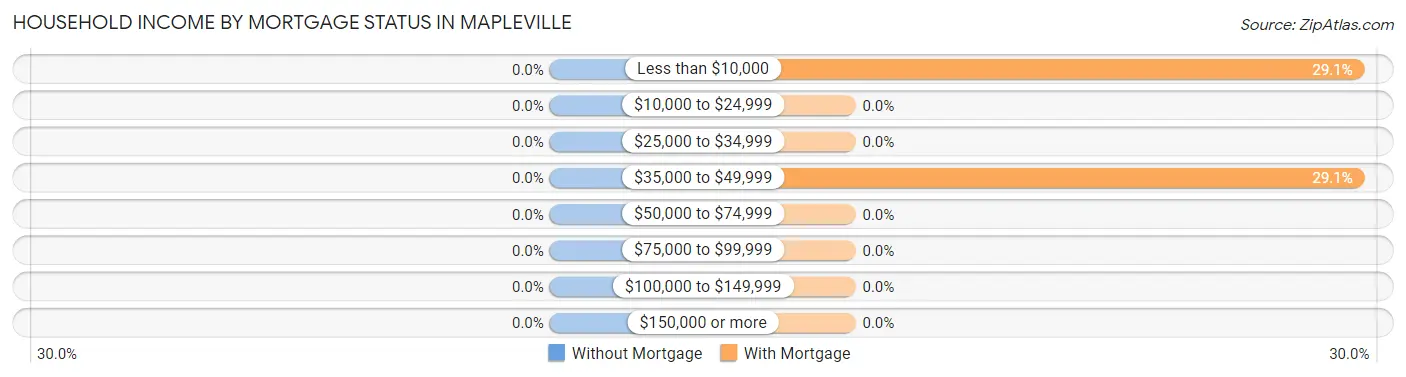
| Household Income | Without Mortgage | With Mortgage |
| Less than $10,000 | 0 (0.0%) | 16 (29.1%) |
| $10,000 to $24,999 | 0 (0.0%) | 0 (0.0%) |
| $25,000 to $34,999 | 0 (0.0%) | 0 (0.0%) |
| $35,000 to $49,999 | 0 (0.0%) | 16 (29.1%) |
| $50,000 to $74,999 | 0 (0.0%) | 0 (0.0%) |
| $75,000 to $99,999 | 0 (0.0%) | 0 (0.0%) |
| $100,000 to $149,999 | 0 (0.0%) | 0 (0.0%) |
| $150,000 or more | 0 (0.0%) | 0 (0.0%) |
| Total | 0 (0.0%) | 55 (100.0%) |
Property Value to Household Income Ratio in Mapleville
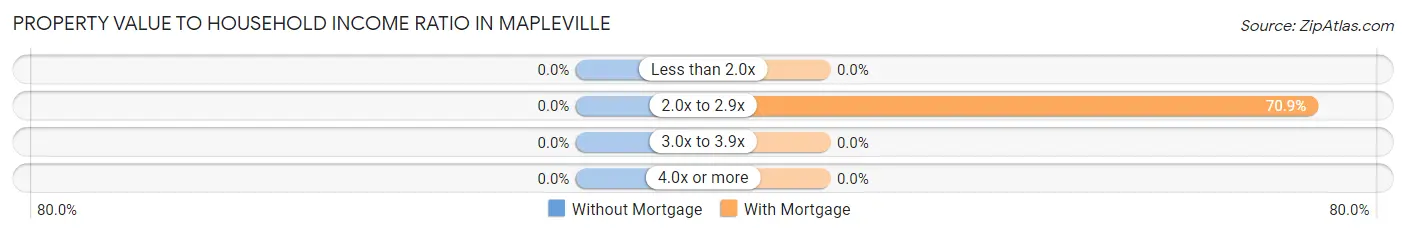
| Value-to-Income Ratio | Without Mortgage | With Mortgage |
| Less than 2.0x | 0 (0.0%) | 0 (0.0%) |
| 2.0x to 2.9x | 0 (0.0%) | 39 (70.9%) |
| 3.0x to 3.9x | 0 (0.0%) | 0 (0.0%) |
| 4.0x or more | 0 (0.0%) | 0 (0.0%) |
| Total | 0 (0.0%) | 55 (100.0%) |
Real Estate Taxes by Mortgage Status in Mapleville
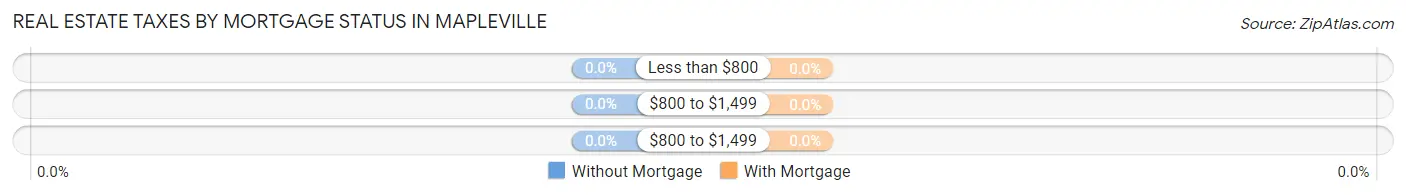
| Property Taxes | Without Mortgage | With Mortgage |
| Less than $800 | 0 (0.0%) | 0 (0.0%) |
| $800 to $1,499 | 0 (0.0%) | 0 (0.0%) |
| $800 to $1,499 | 0 (0.0%) | 0 (0.0%) |
| Total | 0 (0.0%) | 55 (100.0%) |
Health & Disability in Mapleville
Health Insurance Coverage by Age in Mapleville
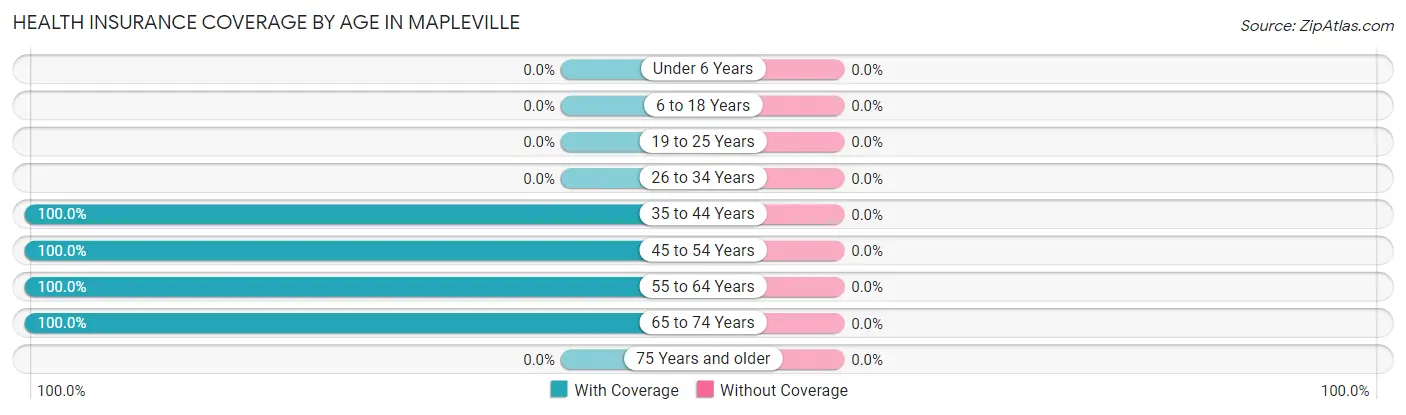
| Age Bracket | With Coverage | Without Coverage |
| Under 6 Years | 0 (0.0%) | 0 (0.0%) |
| 6 to 18 Years | 0 (0.0%) | 0 (0.0%) |
| 19 to 25 Years | 0 (0.0%) | 0 (0.0%) |
| 26 to 34 Years | 0 (0.0%) | 0 (0.0%) |
| 35 to 44 Years | 27 (100.0%) | 0 (0.0%) |
| 45 to 54 Years | 118 (100.0%) | 0 (0.0%) |
| 55 to 64 Years | 79 (100.0%) | 0 (0.0%) |
| 65 to 74 Years | 32 (100.0%) | 0 (0.0%) |
| 75 Years and older | 0 (0.0%) | 0 (0.0%) |
| Total | 256 (100.0%) | 0 (0.0%) |
Health Insurance Coverage by Citizenship Status in Mapleville
| Citizenship Status | With Coverage | Without Coverage |
| Native Born | 0 (0.0%) | 0 (0.0%) |
| Foreign Born, Citizen | 0 (0.0%) | 0 (0.0%) |
| Foreign Born, not a Citizen | 0 (0.0%) | 0 (0.0%) |
Health Insurance Coverage by Household Income in Mapleville
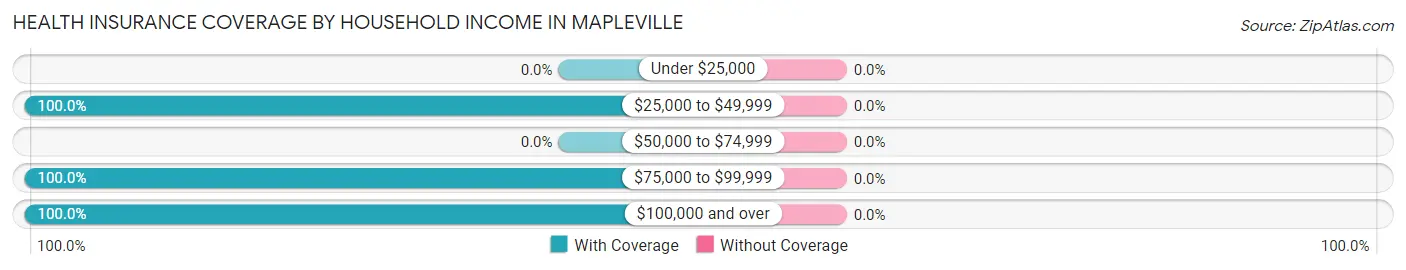
| Household Income | With Coverage | Without Coverage |
| Under $25,000 | 0 (0.0%) | 0 (0.0%) |
| $25,000 to $49,999 | 32 (100.0%) | 0 (0.0%) |
| $50,000 to $74,999 | 0 (0.0%) | 0 (0.0%) |
| $75,000 to $99,999 | 145 (100.0%) | 0 (0.0%) |
| $100,000 and over | 79 (100.0%) | 0 (0.0%) |
Public vs Private Health Insurance Coverage by Age in Mapleville
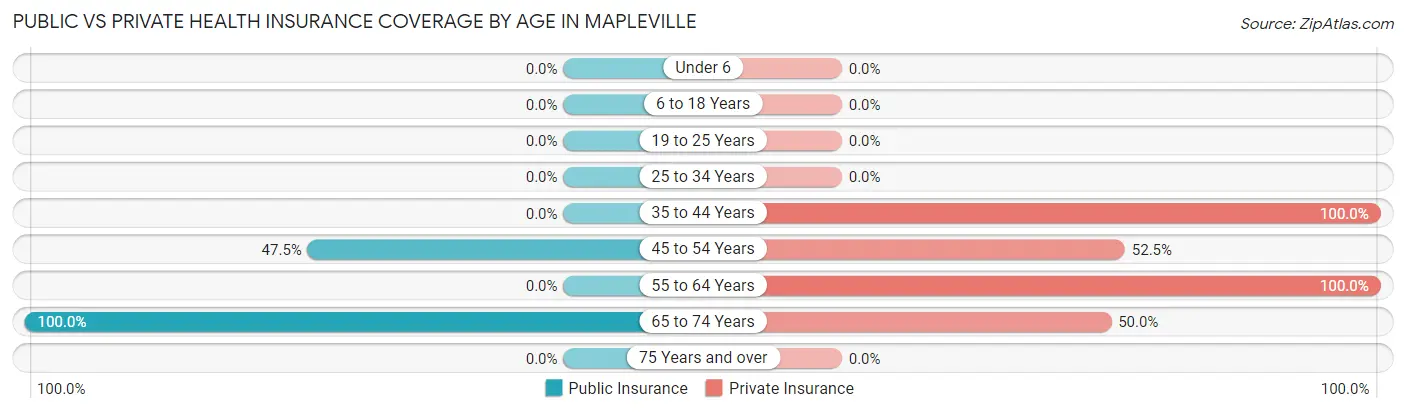
| Age Bracket | Public Insurance | Private Insurance |
| Under 6 | 0 (0.0%) | 0 (0.0%) |
| 6 to 18 Years | 0 (0.0%) | 0 (0.0%) |
| 19 to 25 Years | 0 (0.0%) | 0 (0.0%) |
| 25 to 34 Years | 0 (0.0%) | 0 (0.0%) |
| 35 to 44 Years | 0 (0.0%) | 27 (100.0%) |
| 45 to 54 Years | 56 (47.5%) | 62 (52.5%) |
| 55 to 64 Years | 0 (0.0%) | 79 (100.0%) |
| 65 to 74 Years | 32 (100.0%) | 16 (50.0%) |
| 75 Years and over | 0 (0.0%) | 0 (0.0%) |
| Total | 88 (34.4%) | 184 (71.9%) |
Disability Status by Sex by Age in Mapleville
| Age Bracket | Male | Female |
| Under 5 Years | 0 (0.0%) | 0 (0.0%) |
| 5 to 17 Years | 0 (0.0%) | 0 (0.0%) |
| 18 to 34 Years | 0 (0.0%) | 0 (0.0%) |
| 35 to 64 Years | 0 (0.0%) | 0 (0.0%) |
| 65 to 74 Years | 0 (0.0%) | 0 (0.0%) |
| 75 Years and over | 0 (0.0%) | 0 (0.0%) |
Disability Class by Sex by Age in Mapleville
Disability Class: Hearing Difficulty
| Age Bracket | Male | Female |
| Under 5 Years | 0 (0.0%) | 0 (0.0%) |
| 5 to 17 Years | 0 (0.0%) | 0 (0.0%) |
| 18 to 34 Years | 0 (0.0%) | 0 (0.0%) |
| 35 to 64 Years | 0 (0.0%) | 0 (0.0%) |
| 65 to 74 Years | 0 (0.0%) | 0 (0.0%) |
| 75 Years and over | 0 (0.0%) | 0 (0.0%) |
Disability Class: Vision Difficulty
| Age Bracket | Male | Female |
| Under 5 Years | 0 (0.0%) | 0 (0.0%) |
| 5 to 17 Years | 0 (0.0%) | 0 (0.0%) |
| 18 to 34 Years | 0 (0.0%) | 0 (0.0%) |
| 35 to 64 Years | 0 (0.0%) | 0 (0.0%) |
| 65 to 74 Years | 0 (0.0%) | 0 (0.0%) |
| 75 Years and over | 0 (0.0%) | 0 (0.0%) |
Disability Class: Cognitive Difficulty
| Age Bracket | Male | Female |
| 5 to 17 Years | 0 (0.0%) | 0 (0.0%) |
| 18 to 34 Years | 0 (0.0%) | 0 (0.0%) |
| 35 to 64 Years | 0 (0.0%) | 0 (0.0%) |
| 65 to 74 Years | 0 (0.0%) | 0 (0.0%) |
| 75 Years and over | 0 (0.0%) | 0 (0.0%) |
Disability Class: Ambulatory Difficulty
| Age Bracket | Male | Female |
| 5 to 17 Years | 0 (0.0%) | 0 (0.0%) |
| 18 to 34 Years | 0 (0.0%) | 0 (0.0%) |
| 35 to 64 Years | 0 (0.0%) | 0 (0.0%) |
| 65 to 74 Years | 0 (0.0%) | 0 (0.0%) |
| 75 Years and over | 0 (0.0%) | 0 (0.0%) |
Disability Class: Self-Care Difficulty
| Age Bracket | Male | Female |
| 5 to 17 Years | 0 (0.0%) | 0 (0.0%) |
| 18 to 34 Years | 0 (0.0%) | 0 (0.0%) |
| 35 to 64 Years | 0 (0.0%) | 0 (0.0%) |
| 65 to 74 Years | 0 (0.0%) | 0 (0.0%) |
| 75 Years and over | 0 (0.0%) | 0 (0.0%) |
Technology Access in Mapleville
Computing Device Access in Mapleville
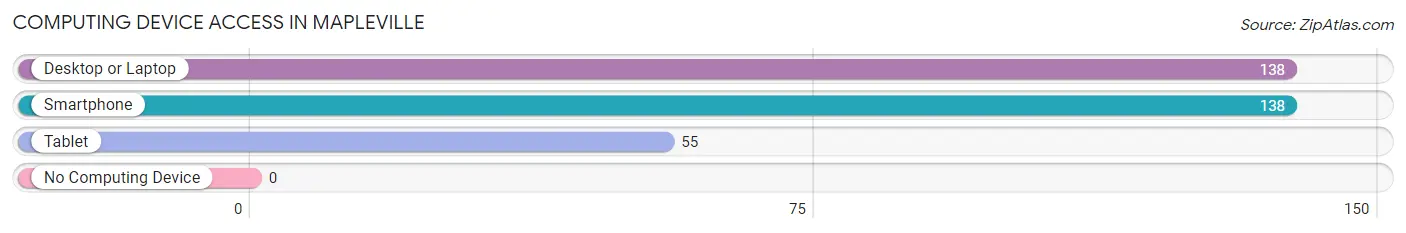
| Device Type | # Households | % Households |
| Desktop or Laptop | 138 | 100.0% |
| Smartphone | 138 | 100.0% |
| Tablet | 55 | 39.9% |
| No Computing Device | 0 | 0.0% |
| Total | 138 | 100.0% |
Internet Access in Mapleville
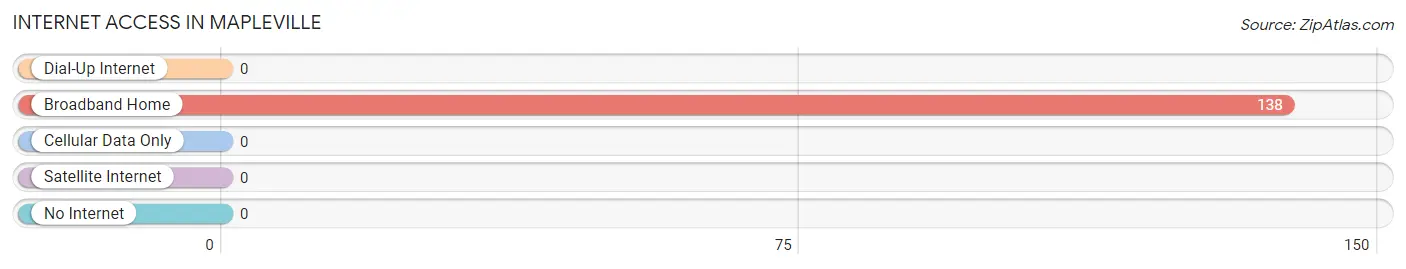
| Internet Type | # Households | % Households |
| Dial-Up Internet | 0 | 0.0% |
| Broadband Home | 138 | 100.0% |
| Cellular Data Only | 0 | 0.0% |
| Satellite Internet | 0 | 0.0% |
| No Internet | 0 | 0.0% |
| Total | 138 | 100.0% |
Mapleville Summary
Mapleville, MD is a small town located in Washington County, Maryland. It is situated in the Appalachian Mountains, approximately 30 miles west of Hagerstown. The town has a population of approximately 1,000 people and is part of the Hagerstown-Martinsburg Metropolitan Statistical Area.
History
Mapleville was founded in 1790 by a group of settlers from Pennsylvania. The town was named after the abundance of maple trees in the area. The town was originally a farming community, with the main crops being wheat, corn, and oats. In the late 19th century, the town began to grow as a result of the railroad being built through the area. This allowed for the transportation of goods and people to and from the town.
In the early 20th century, Mapleville began to experience a decline in population as people moved away to larger cities. This trend continued until the 1950s when the town began to experience a resurgence in population growth. This was due to the development of the nearby Interstate 81, which allowed for easier access to the town.
Geography
Mapleville is located in the Appalachian Mountains of western Maryland. The town is situated in a valley, surrounded by rolling hills and mountains. The town is located approximately 30 miles west of Hagerstown and is part of the Hagerstown-Martinsburg Metropolitan Statistical Area.
The town is located at an elevation of 1,000 feet above sea level and has a total area of 0.7 square miles. The town is located in a humid continental climate zone, with hot summers and cold winters. The average annual temperature is 54 degrees Fahrenheit and the average annual precipitation is 40 inches.
Economy
Mapleville’s economy is largely based on agriculture and tourism. The town is home to several farms, which produce a variety of crops, including wheat, corn, and oats. The town is also home to several small businesses, including restaurants, shops, and a few manufacturing companies.
The town is also a popular tourist destination, due to its proximity to the Appalachian Mountains. The town is home to several outdoor recreation areas, including hiking trails, fishing spots, and camping sites. The town also hosts several festivals and events throughout the year, which attract visitors from all over the region.
Demographics
As of the 2010 census, Mapleville had a population of 1,000 people. The town is predominantly white, with approximately 95% of the population being white. The remaining 5% of the population is made up of African Americans, Hispanics, and other races. The median household income in the town is $45,000 and the median home value is $150,000.
The town is served by the Washington County Public Schools system. The town is home to one elementary school, one middle school, and one high school. The town also has several private schools, including a Catholic school and a Christian school.
Conclusion
Mapleville, MD is a small town located in Washington County, Maryland. It is situated in the Appalachian Mountains, approximately 30 miles west of Hagerstown. The town has a population of approximately 1,000 people and is part of the Hagerstown-Martinsburg Metropolitan Statistical Area. The town was founded in 1790 and has a long history of farming and tourism. The town’s economy is largely based on agriculture and tourism, and the town is home to several small businesses. The town is predominantly white, with a median household income of $45,000 and a median home value of $150,000. The town is served by the Washington County Public Schools system and is home to several private schools.
Common Questions
What is the Total Population of Mapleville?
Total Population of Mapleville is 256.
What is the Total Male Population of Mapleville?
Total Male Population of Mapleville is 117.
What is the Total Female Population of Mapleville?
Total Female Population of Mapleville is 139.
What is the Ratio of Males per 100 Females in Mapleville?
There are 84.17 Males per 100 Females in Mapleville.
What is the Ratio of Females per 100 Males in Mapleville?
There are 118.80 Females per 100 Males in Mapleville.
What is the Median Population Age in Mapleville?
Median Population Age in Mapleville is 53.7 Years.
What is the Average Family Size in Mapleville
Average Family Size in Mapleville is 2.0 People.
What is the Average Household Size in Mapleville
Average Household Size in Mapleville is 1.9 People.
What is Per Capita Income in Mapleville?
Per Capita income in Mapleville is $65,811.
What is Inequality or Gini Index in Mapleville?
Inequality or Gini Index in Mapleville is 0.31.
How Large is the Labor Force in Mapleville?
There are 168 People in the Labor Forcein in Mapleville.
What is the Percentage of People in the Labor Force in Mapleville?
65.6% of People are in the Labor Force in Mapleville.