Eldorado, MD
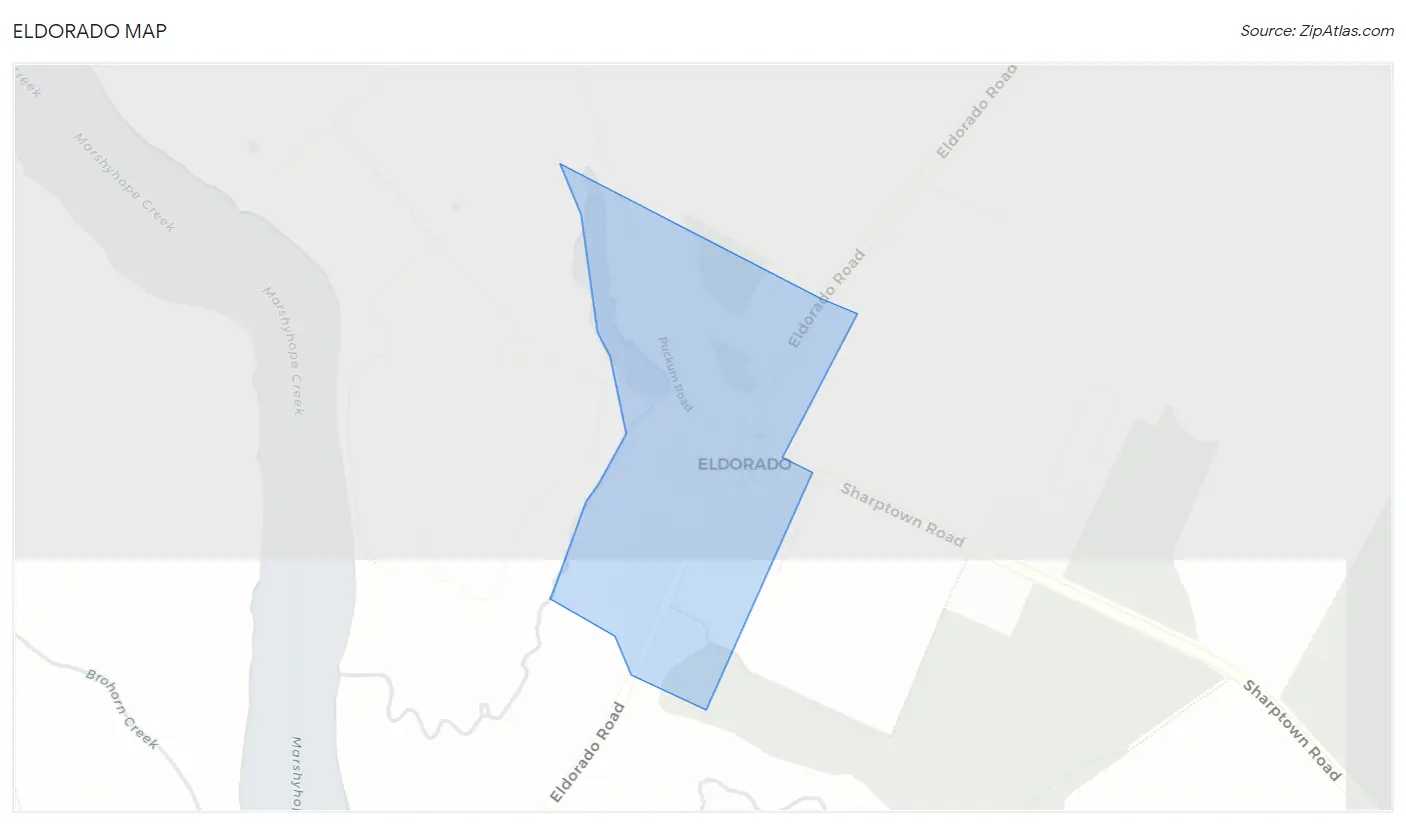
Eldorado Map
Eldorado Overview
50
TOTAL POPULATION
26
MALE POPULATION
24
FEMALE POPULATION
108.33
MALES / 100 FEMALES
92.31
FEMALES / 100 MALES
47.0
MEDIAN AGE
2.8
AVG FAMILY SIZE
2.1
AVG HOUSEHOLD SIZE
$31,278
PER CAPITA INCOME
$45,750
AVG FAMILY INCOME
$45,500
AVG HOUSEHOLD INCOME
0.34
INEQUALITY / GINI INDEX
25
LABOR FORCE [ PEOPLE ]
54.3%
PERCENT IN LABOR FORCE
8.0%
UNEMPLOYMENT RATE
Race in Eldorado
The most populous races in Eldorado are White / Caucasian (46 | 92.0%), and Two or more Races (4 | 8.0%).
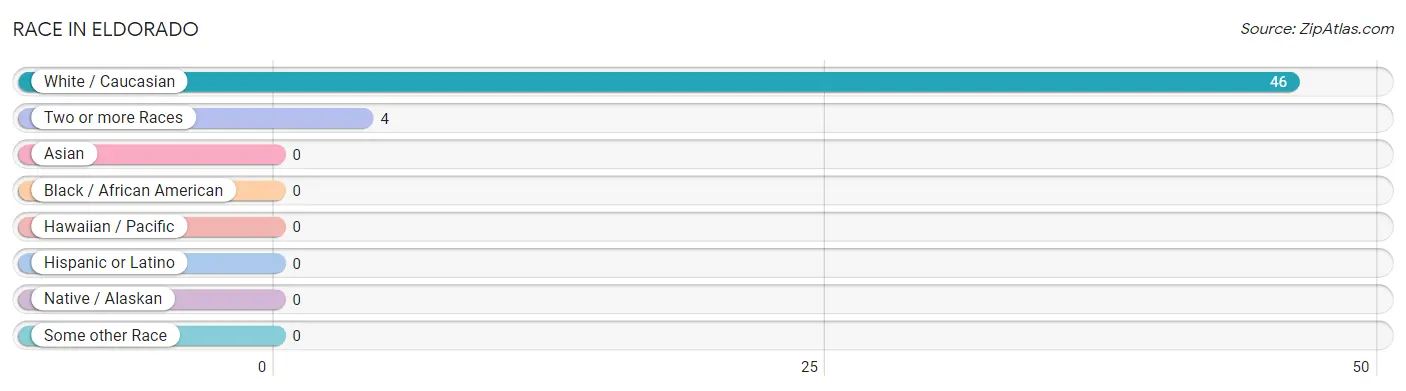
| Race | # Population | % Population |
| Asian | 0 | 0.0% |
| Black / African American | 0 | 0.0% |
| Hawaiian / Pacific | 0 | 0.0% |
| Hispanic or Latino | 0 | 0.0% |
| Native / Alaskan | 0 | 0.0% |
| White / Caucasian | 46 | 92.0% |
| Two or more Races | 4 | 8.0% |
| Some other Race | 0 | 0.0% |
| Total | 50 | 100.0% |
Ancestry in Eldorado
The most populous ancestries reported in Eldorado are American (9 | 18.0%), German (8 | 16.0%), English (7 | 14.0%), Jamaican (4 | 8.0%), and European (3 | 6.0%), together accounting for 62.0% of all Eldorado residents.
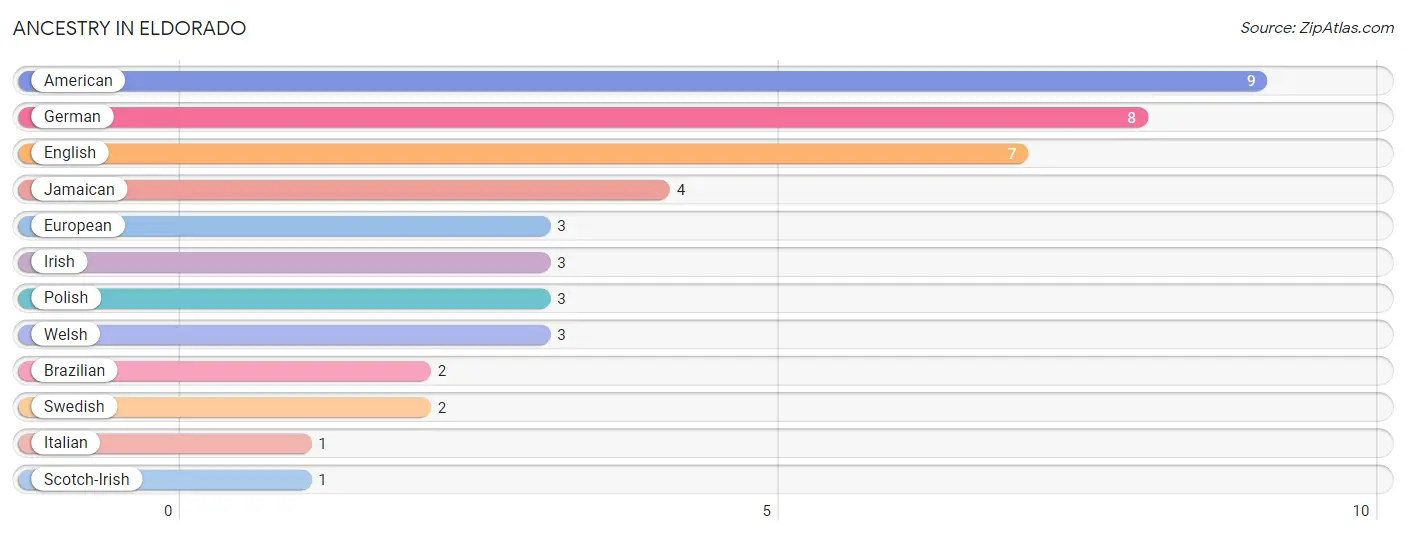
| Ancestry | # Population | % Population |
| American | 9 | 18.0% |
| Brazilian | 2 | 4.0% |
| English | 7 | 14.0% |
| European | 3 | 6.0% |
| German | 8 | 16.0% |
| Irish | 3 | 6.0% |
| Italian | 1 | 2.0% |
| Jamaican | 4 | 8.0% |
| Polish | 3 | 6.0% |
| Scotch-Irish | 1 | 2.0% |
| Swedish | 2 | 4.0% |
| Welsh | 3 | 6.0% | View All 12 Rows |
Immigrants in Eldorado
The most numerous immigrant groups reported in Eldorado came from Caribbean (2 | 4.0%), Jamaica (2 | 4.0%), and Latin America (2 | 4.0%), together accounting for 12.0% of all Eldorado residents.
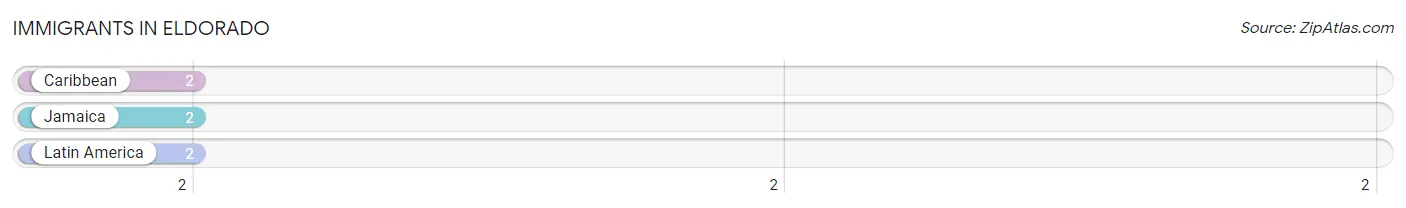
| Immigration Origin | # Population | % Population |
| Caribbean | 2 | 4.0% |
| Jamaica | 2 | 4.0% |
| Latin America | 2 | 4.0% | View All 3 Rows |
Sex and Age in Eldorado
Sex and Age in Eldorado
The most populous age groups in Eldorado are 60 to 64 Years (9 | 34.6%) for men and 80 to 84 Years (4 | 16.7%) for women.
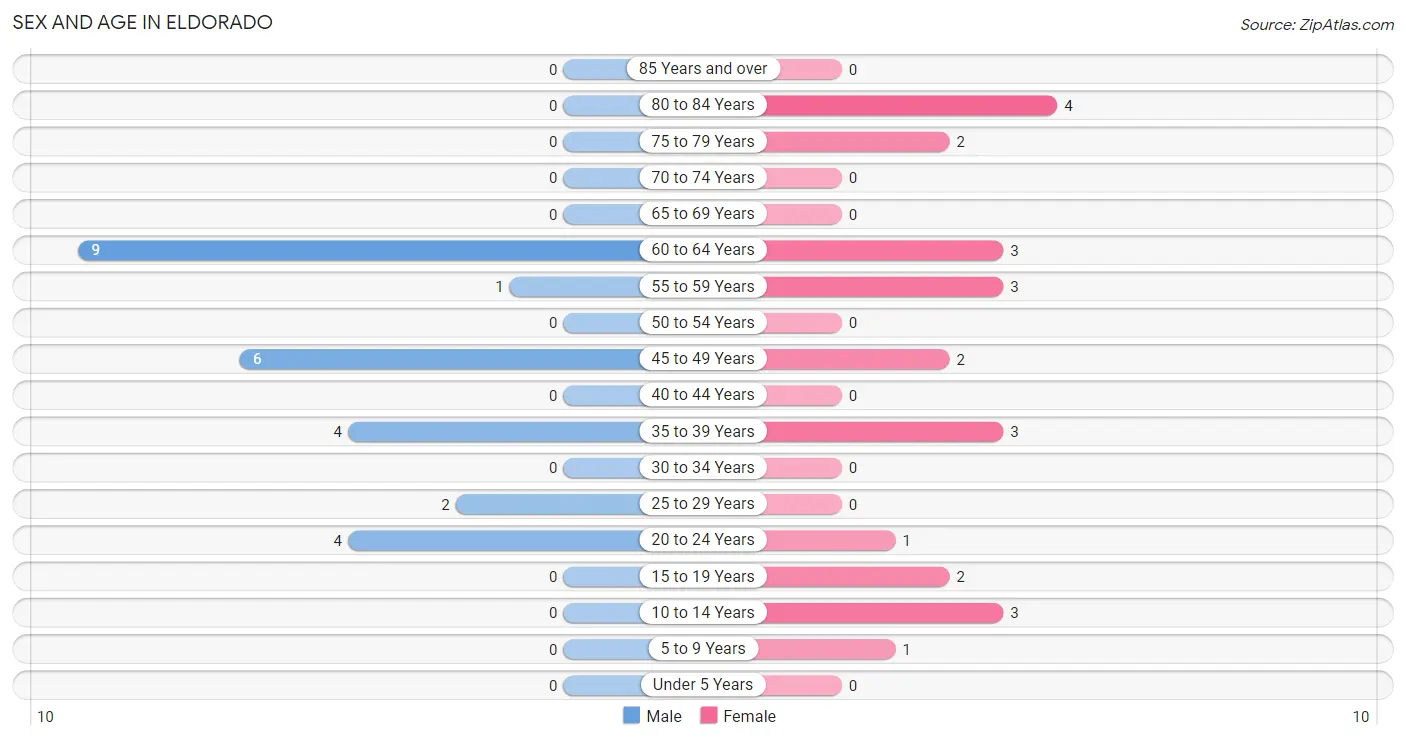
| Age Bracket | Male | Female |
| Under 5 Years | 0 (0.0%) | 0 (0.0%) |
| 5 to 9 Years | 0 (0.0%) | 1 (4.2%) |
| 10 to 14 Years | 0 (0.0%) | 3 (12.5%) |
| 15 to 19 Years | 0 (0.0%) | 2 (8.3%) |
| 20 to 24 Years | 4 (15.4%) | 1 (4.2%) |
| 25 to 29 Years | 2 (7.7%) | 0 (0.0%) |
| 30 to 34 Years | 0 (0.0%) | 0 (0.0%) |
| 35 to 39 Years | 4 (15.4%) | 3 (12.5%) |
| 40 to 44 Years | 0 (0.0%) | 0 (0.0%) |
| 45 to 49 Years | 6 (23.1%) | 2 (8.3%) |
| 50 to 54 Years | 0 (0.0%) | 0 (0.0%) |
| 55 to 59 Years | 1 (3.8%) | 3 (12.5%) |
| 60 to 64 Years | 9 (34.6%) | 3 (12.5%) |
| 65 to 69 Years | 0 (0.0%) | 0 (0.0%) |
| 70 to 74 Years | 0 (0.0%) | 0 (0.0%) |
| 75 to 79 Years | 0 (0.0%) | 2 (8.3%) |
| 80 to 84 Years | 0 (0.0%) | 4 (16.7%) |
| 85 Years and over | 0 (0.0%) | 0 (0.0%) |
| Total | 26 (100.0%) | 24 (100.0%) |
Families and Households in Eldorado
Median Family Size in Eldorado
The median family size in Eldorado is 2.77 persons per family, with single female/mother families (4 | 30.8%) accounting for the largest median family size of 3.5 persons per family. On the other hand, single male/father families (2 | 15.4%) represent the smallest median family size with 1.50 persons per family.
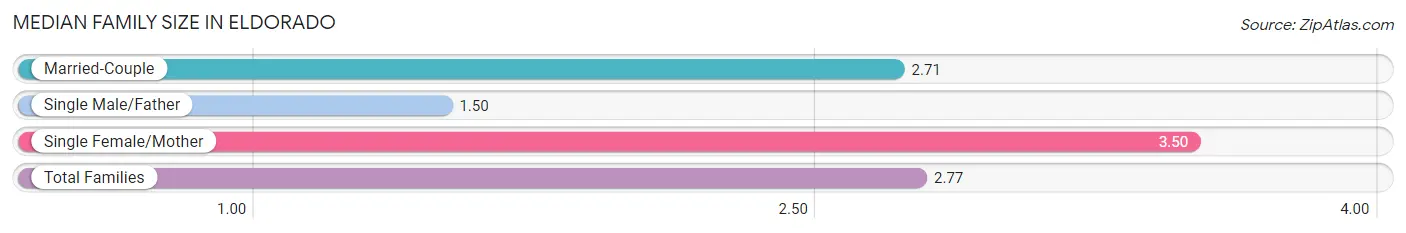
| Family Type | # Families | Family Size |
| Married-Couple | 7 (53.8%) | 2.71 |
| Single Male/Father | 2 (15.4%) | 1.50 |
| Single Female/Mother | 4 (30.8%) | 3.50 |
| Total Families | 13 (100.0%) | 2.77 |
Median Household Size in Eldorado
The median household size in Eldorado is 2.08 persons per household, with single female/mother households (4 | 16.7%) accounting for the largest median household size of 3.5 persons per household. non-family households (11 | 45.8%) represent the smallest median household size with 1.27 persons per household.
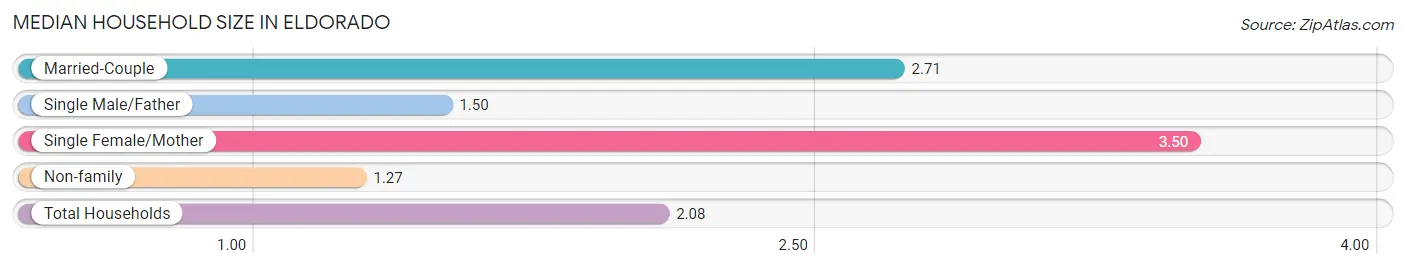
| Household Type | # Households | Household Size |
| Married-Couple | 7 (29.2%) | 2.71 |
| Single Male/Father | 2 (8.3%) | 1.50 |
| Single Female/Mother | 4 (16.7%) | 3.50 |
| Non-family | 11 (45.8%) | 1.27 |
| Total Households | 24 (100.0%) | 2.08 |
Household Size by Marriage Status in Eldorado
Out of a total of 24 households in Eldorado, 13 (54.2%) are family households, while 11 (45.8%) are nonfamily households. The most numerous type of family households are 3-person households, comprising 8, and the most common type of nonfamily households are 1-person households, comprising 9.
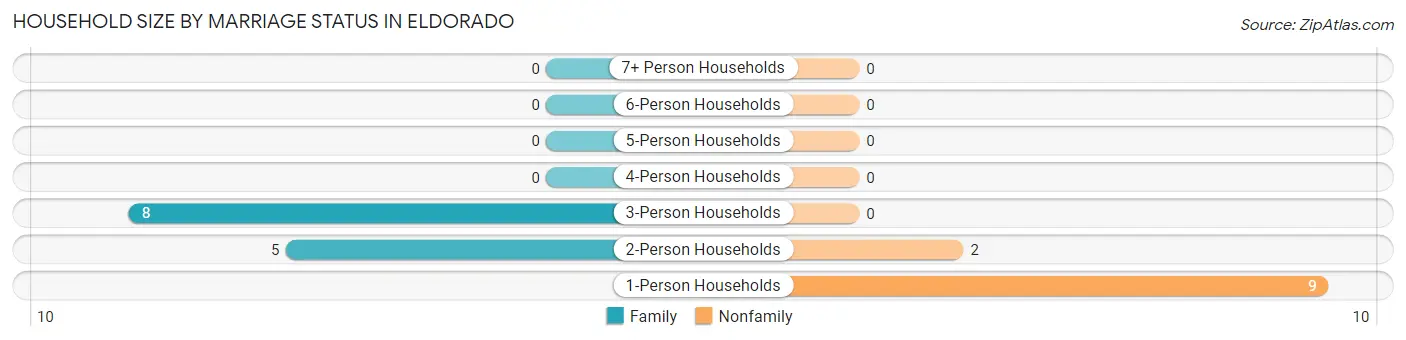
| Household Size | Family Households | Nonfamily Households |
| 1-Person Households | - | 9 (37.5%) |
| 2-Person Households | 5 (20.8%) | 2 (8.3%) |
| 3-Person Households | 8 (33.3%) | 0 (0.0%) |
| 4-Person Households | 0 (0.0%) | 0 (0.0%) |
| 5-Person Households | 0 (0.0%) | 0 (0.0%) |
| 6-Person Households | 0 (0.0%) | 0 (0.0%) |
| 7+ Person Households | 0 (0.0%) | 0 (0.0%) |
| Total | 13 (54.2%) | 11 (45.8%) |
Female Fertility in Eldorado
Fertility by Age in Eldorado
| Age Bracket | Women with Births | Births / 1,000 Women |
| 15 to 19 years | 0 (0.0%) | 0.0 |
| 20 to 34 years | 0 (0.0%) | 0.0 |
| 35 to 50 years | 0 (0.0%) | 0.0 |
| Total | 0 (0.0%) | 0.0 |
Fertility by Age by Marriage Status in Eldorado
| Age Bracket | Married | Unmarried |
| 15 to 19 years | 0 (0.0%) | 0 (0.0%) |
| 20 to 34 years | 0 (0.0%) | 0 (0.0%) |
| 35 to 50 years | 0 (0.0%) | 0 (0.0%) |
| Total | 0 (0.0%) | 0 (0.0%) |
Fertility by Education in Eldorado
| Educational Attainment | Women with Births | Births / 1,000 Women |
| Less than High School | 0 (0.0%) | 0.0 |
| High School Diploma | 0 (0.0%) | 0.0 |
| College or Associate's Degree | 0 (0.0%) | 0.0 |
| Bachelor's Degree | 0 (0.0%) | 0.0 |
| Graduate Degree | 0 (0.0%) | 0.0 |
| Total | 0 (0.0%) | 0.0 |
Fertility by Education by Marriage Status in Eldorado
| Educational Attainment | Married | Unmarried |
| Less than High School | 0 (0.0%) | 0 (0.0%) |
| High School Diploma | 0 (0.0%) | 0 (0.0%) |
| College or Associate's Degree | 0 (0.0%) | 0 (0.0%) |
| Bachelor's Degree | 0 (0.0%) | 0 (0.0%) |
| Graduate Degree | 0 (0.0%) | 0 (0.0%) |
| Total | 0 (0.0%) | 0 (0.0%) |
Income in Eldorado
Income Overview in Eldorado
Per Capita Income in Eldorado is $31,278, while median incomes of families and households are $45,750 and $45,500 respectively.
| Characteristic | Number | Measure |
| Per Capita Income | 50 | $31,278 |
| Median Family Income | 13 | $45,750 |
| Mean Family Income | 13 | $52,954 |
| Median Household Income | 24 | $45,500 |
| Mean Household Income | 24 | $63,779 |
| Income Deficit | 13 | $0 |
| Wage / Income Gap (%) | 50 | 0.00% |
| Wage / Income Gap ($) | 50 | 100.00¢ per $1 |
| Gini / Inequality Index | 50 | 0.34 |
Earnings by Sex in Eldorado
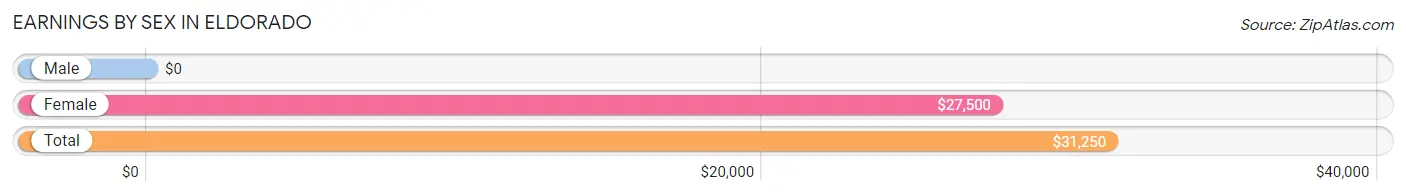
| Sex | Number | Average Earnings |
| Male | 17 (58.6%) | $0 |
| Female | 12 (41.4%) | $27,500 |
| Total | 29 (100.0%) | $31,250 |
Earnings by Sex by Income Bracket in Eldorado
The most common earnings brackets in Eldorado are $100,000+ for men (6 | 35.3%) and $35,000 to $39,999 for women (4 | 33.3%).
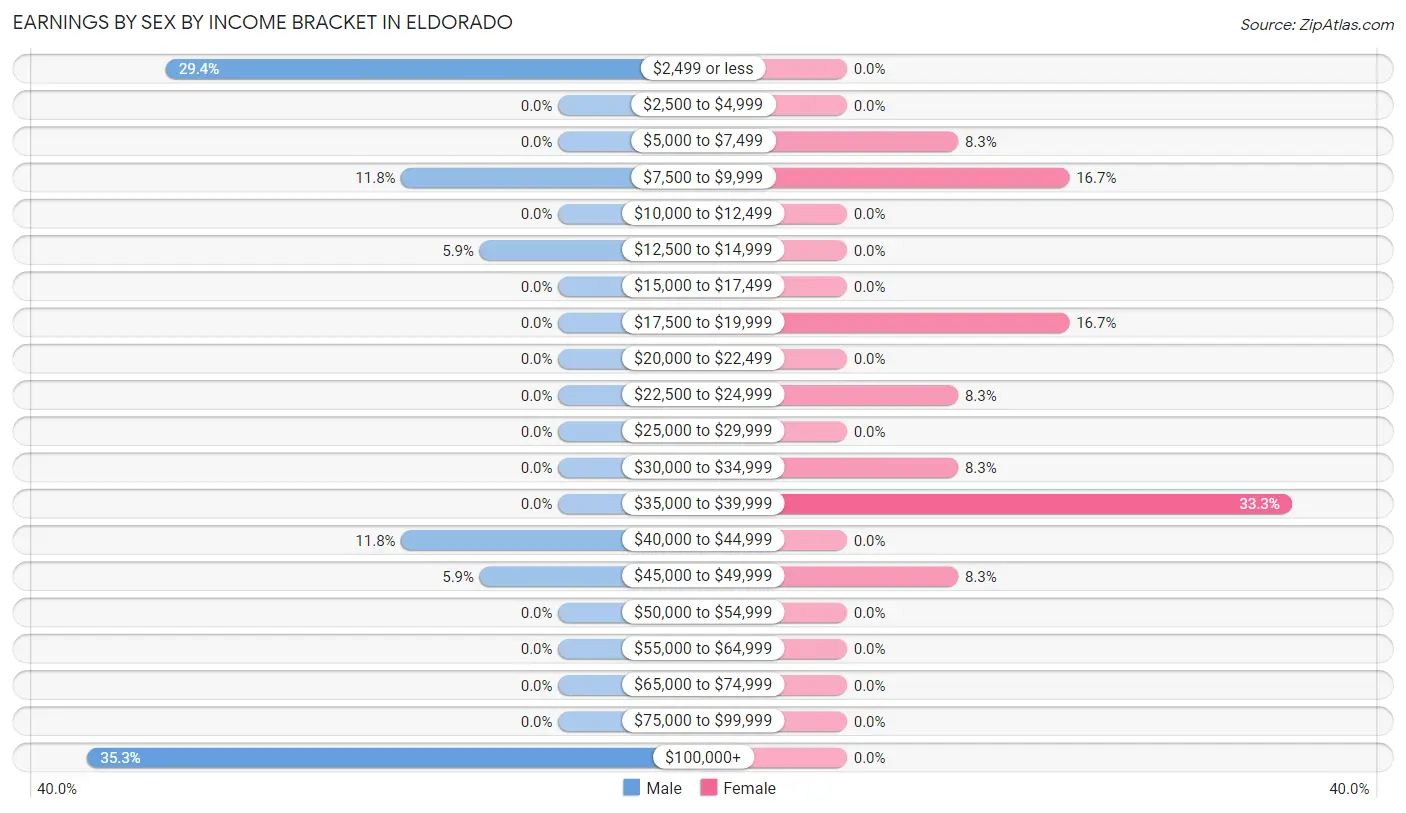
| Income | Male | Female |
| $2,499 or less | 5 (29.4%) | 0 (0.0%) |
| $2,500 to $4,999 | 0 (0.0%) | 0 (0.0%) |
| $5,000 to $7,499 | 0 (0.0%) | 1 (8.3%) |
| $7,500 to $9,999 | 2 (11.8%) | 2 (16.7%) |
| $10,000 to $12,499 | 0 (0.0%) | 0 (0.0%) |
| $12,500 to $14,999 | 1 (5.9%) | 0 (0.0%) |
| $15,000 to $17,499 | 0 (0.0%) | 0 (0.0%) |
| $17,500 to $19,999 | 0 (0.0%) | 2 (16.7%) |
| $20,000 to $22,499 | 0 (0.0%) | 0 (0.0%) |
| $22,500 to $24,999 | 0 (0.0%) | 1 (8.3%) |
| $25,000 to $29,999 | 0 (0.0%) | 0 (0.0%) |
| $30,000 to $34,999 | 0 (0.0%) | 1 (8.3%) |
| $35,000 to $39,999 | 0 (0.0%) | 4 (33.3%) |
| $40,000 to $44,999 | 2 (11.8%) | 0 (0.0%) |
| $45,000 to $49,999 | 1 (5.9%) | 1 (8.3%) |
| $50,000 to $54,999 | 0 (0.0%) | 0 (0.0%) |
| $55,000 to $64,999 | 0 (0.0%) | 0 (0.0%) |
| $65,000 to $74,999 | 0 (0.0%) | 0 (0.0%) |
| $75,000 to $99,999 | 0 (0.0%) | 0 (0.0%) |
| $100,000+ | 6 (35.3%) | 0 (0.0%) |
| Total | 17 (100.0%) | 12 (100.0%) |
Earnings by Sex by Educational Attainment in Eldorado
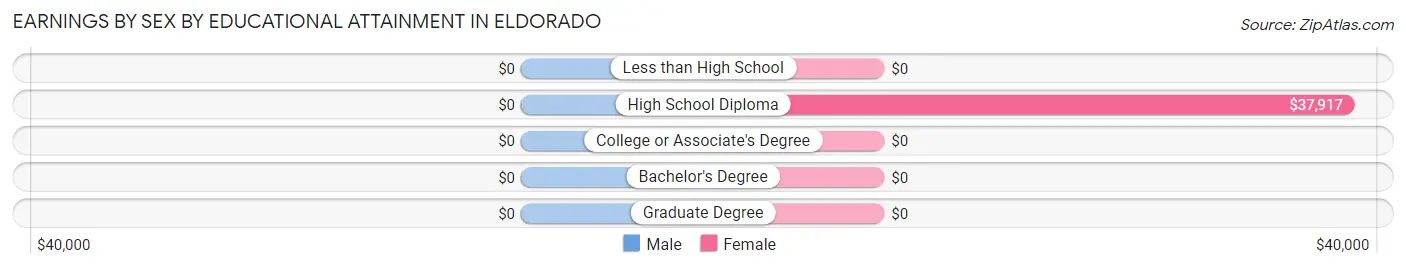
| Educational Attainment | Male Income | Female Income |
| Less than High School | - | - |
| High School Diploma | - | - |
| College or Associate's Degree | - | - |
| Bachelor's Degree | - | - |
| Graduate Degree | - | - |
| Total | - | - |
Family Income in Eldorado
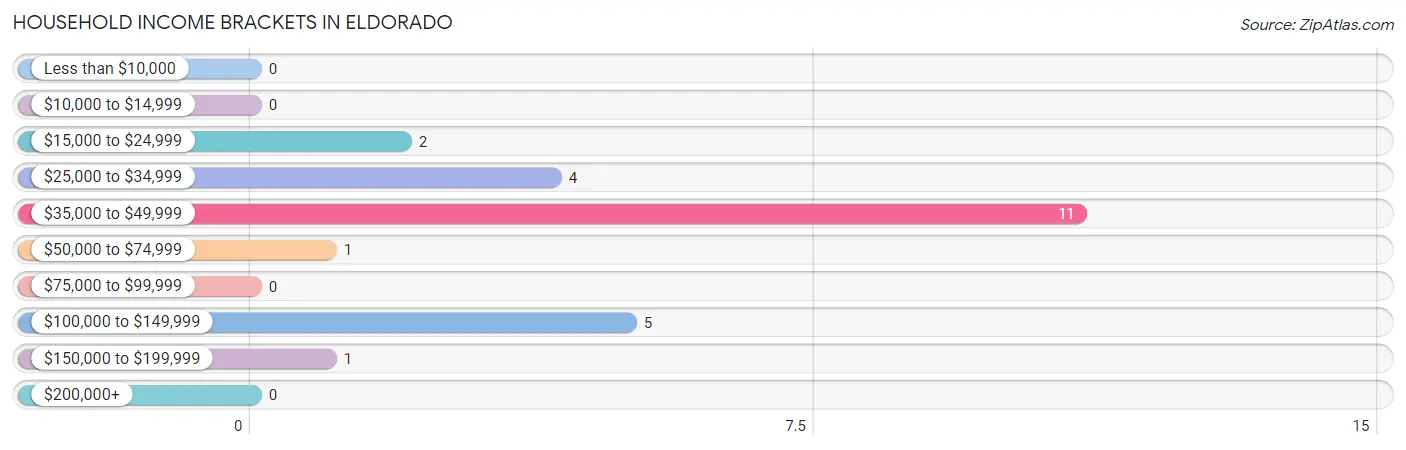
Family Income Brackets in Eldorado
According to the Eldorado family income data, there are 9 families falling into the $35,000 to $49,999 income range, which is the most common income bracket and makes up 69.2% of all families.
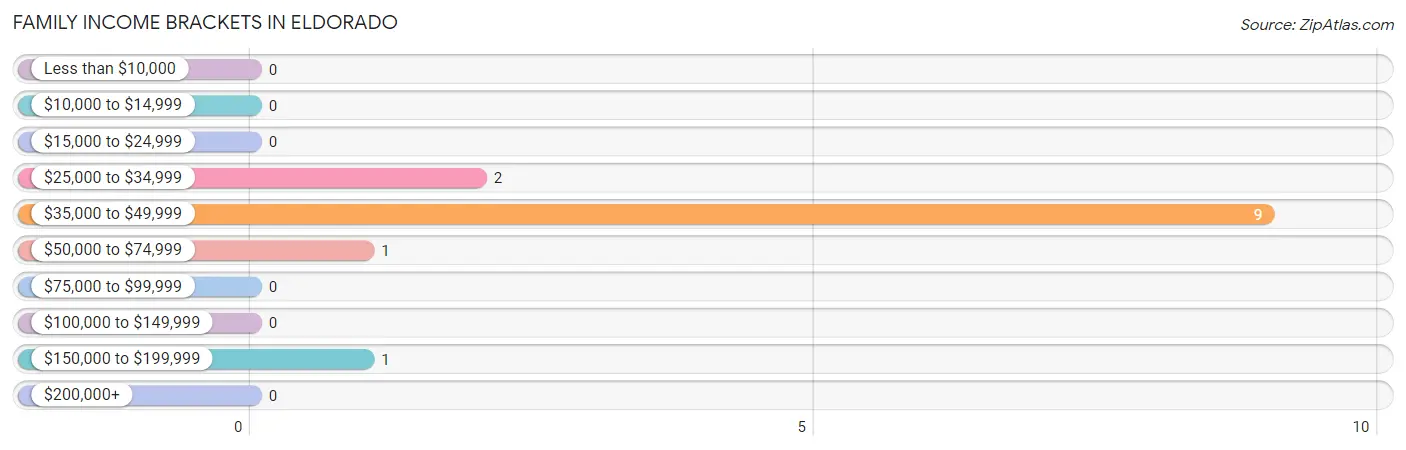
| Income Bracket | # Families | % Families |
| Less than $10,000 | 0 | 0.0% |
| $10,000 to $14,999 | 0 | 0.0% |
| $15,000 to $24,999 | 0 | 0.0% |
| $25,000 to $34,999 | 2 | 15.4% |
| $35,000 to $49,999 | 9 | 69.2% |
| $50,000 to $74,999 | 1 | 7.7% |
| $75,000 to $99,999 | 0 | 0.0% |
| $100,000 to $149,999 | 0 | 0.0% |
| $150,000 to $199,999 | 1 | 7.7% |
| $200,000+ | 0 | 0.0% |
Family Income by Famaliy Size in Eldorado
3-person families (8 | 61.5%) account for the highest median family income in Eldorado with $45,833 per family, while 2-person families (5 | 38.5%) have the highest median income of $22,812 per family member.
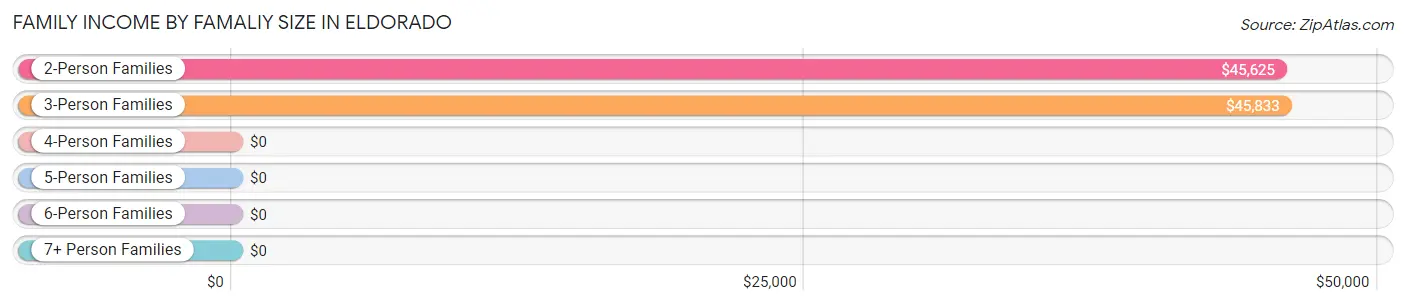
| Income Bracket | # Families | Median Income |
| 2-Person Families | 5 (38.5%) | $45,625 |
| 3-Person Families | 8 (61.5%) | $45,833 |
| 4-Person Families | 0 (0.0%) | $0 |
| 5-Person Families | 0 (0.0%) | $0 |
| 6-Person Families | 0 (0.0%) | $0 |
| 7+ Person Families | 0 (0.0%) | $0 |
| Total | 13 (100.0%) | $45,750 |
Family Income by Number of Earners in Eldorado
| Number of Earners | # Families | Median Income |
| No Earners | 2 (15.4%) | $0 |
| 1 Earner | 3 (23.1%) | $0 |
| 2 Earners | 6 (46.2%) | $0 |
| 3+ Earners | 2 (15.4%) | $0 |
| Total | 13 (100.0%) | $45,750 |
Household Income in Eldorado
Household Income Brackets in Eldorado
With 11 households falling in the category, the $35,000 to $49,999 income range is the most frequent in Eldorado, accounting for 45.8% of all households.
| Income Bracket | # Households | % Households |
| Less than $10,000 | 0 | 0.0% |
| $10,000 to $14,999 | 0 | 0.0% |
| $15,000 to $24,999 | 2 | 8.3% |
| $25,000 to $34,999 | 4 | 16.7% |
| $35,000 to $49,999 | 11 | 45.8% |
| $50,000 to $74,999 | 1 | 4.2% |
| $75,000 to $99,999 | 0 | 0.0% |
| $100,000 to $149,999 | 5 | 20.8% |
| $150,000 to $199,999 | 1 | 4.2% |
| $200,000+ | 0 | 0.0% |
Household Income by Householder Age in Eldorado
| Income Bracket | # Households | Median Income |
| 15 to 24 Years | 0 (0.0%) | $0 |
| 25 to 44 Years | 5 (20.8%) | $0 |
| 45 to 64 Years | 15 (62.5%) | $0 |
| 65+ Years | 4 (16.7%) | $0 |
| Total | 24 (100.0%) | $45,500 |
Poverty in Eldorado
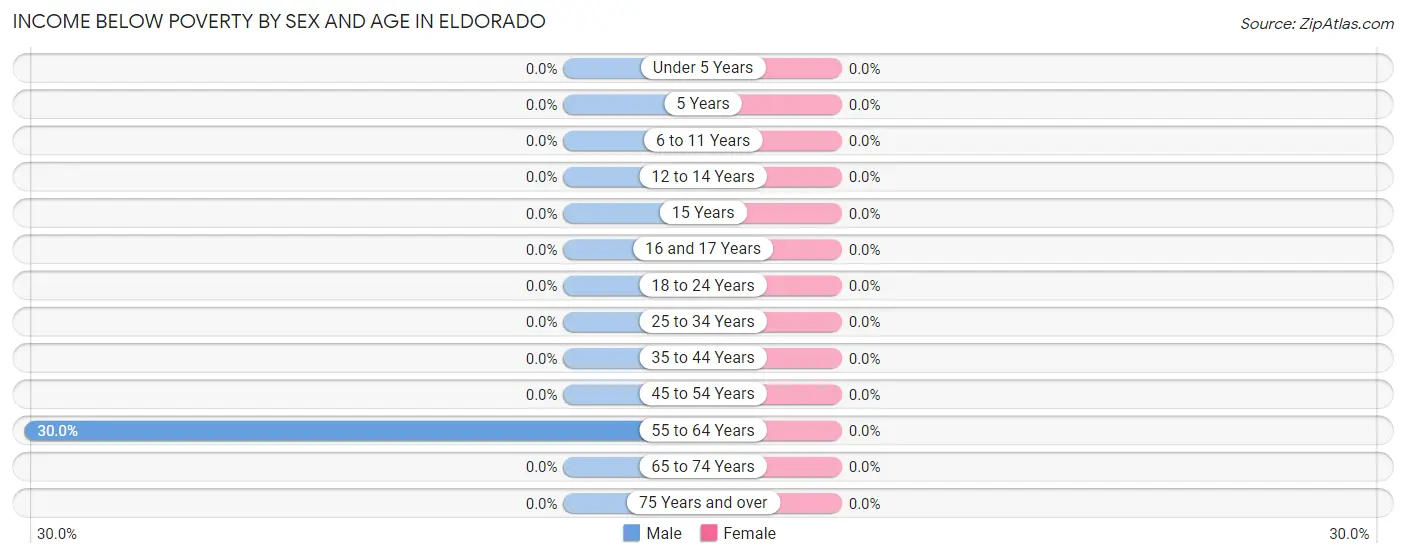
Income Below Poverty by Sex and Age in Eldorado
| Age Bracket | Male | Female |
| Under 5 Years | 0 (0.0%) | 0 (0.0%) |
| 5 Years | 0 (0.0%) | 0 (0.0%) |
| 6 to 11 Years | 0 (0.0%) | 0 (0.0%) |
| 12 to 14 Years | 0 (0.0%) | 0 (0.0%) |
| 15 Years | 0 (0.0%) | 0 (0.0%) |
| 16 and 17 Years | 0 (0.0%) | 0 (0.0%) |
| 18 to 24 Years | 0 (0.0%) | 0 (0.0%) |
| 25 to 34 Years | 0 (0.0%) | 0 (0.0%) |
| 35 to 44 Years | 0 (0.0%) | 0 (0.0%) |
| 45 to 54 Years | 0 (0.0%) | 0 (0.0%) |
| 55 to 64 Years | 3 (30.0%) | 0 (0.0%) |
| 65 to 74 Years | 0 (0.0%) | 0 (0.0%) |
| 75 Years and over | 0 (0.0%) | 0 (0.0%) |
| Total | 3 (11.5%) | 0 (0.0%) |
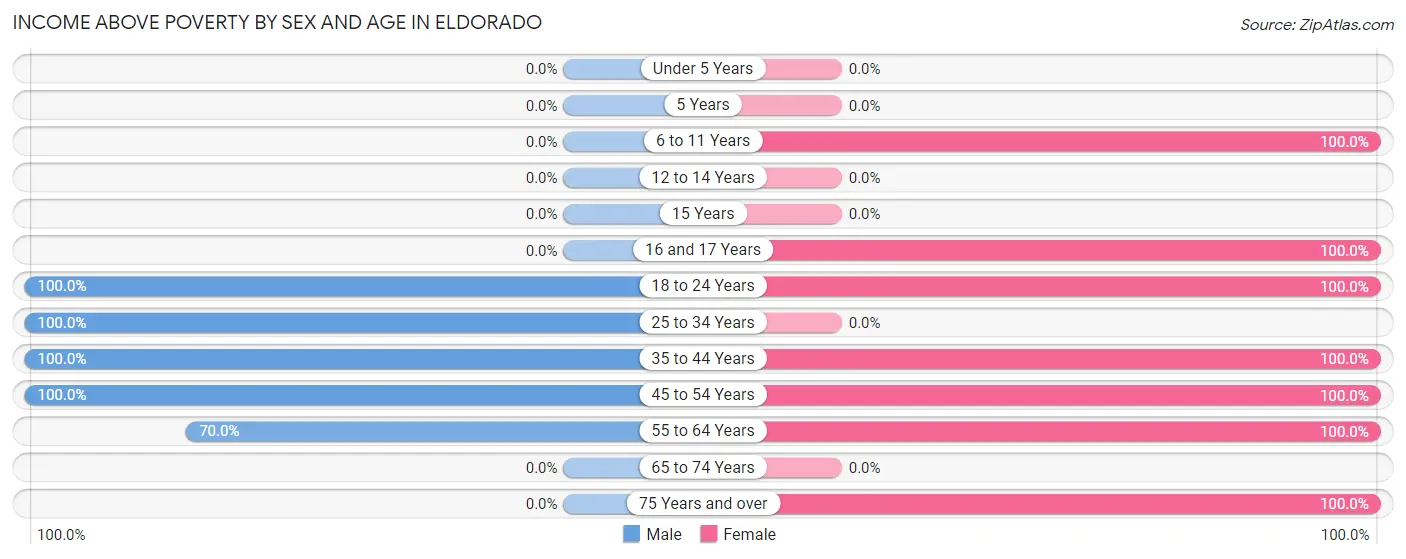
Income Above Poverty by Sex and Age in Eldorado
According to the poverty statistics in Eldorado, males aged 18 to 24 years and females aged 6 to 11 years are the age groups that are most secure financially, with 100.0% of males and 100.0% of females in these age groups living above the poverty line.
| Age Bracket | Male | Female |
| Under 5 Years | 0 (0.0%) | 0 (0.0%) |
| 5 Years | 0 (0.0%) | 0 (0.0%) |
| 6 to 11 Years | 0 (0.0%) | 4 (100.0%) |
| 12 to 14 Years | 0 (0.0%) | 0 (0.0%) |
| 15 Years | 0 (0.0%) | 0 (0.0%) |
| 16 and 17 Years | 0 (0.0%) | 2 (100.0%) |
| 18 to 24 Years | 4 (100.0%) | 1 (100.0%) |
| 25 to 34 Years | 2 (100.0%) | 0 (0.0%) |
| 35 to 44 Years | 4 (100.0%) | 3 (100.0%) |
| 45 to 54 Years | 6 (100.0%) | 2 (100.0%) |
| 55 to 64 Years | 7 (70.0%) | 6 (100.0%) |
| 65 to 74 Years | 0 (0.0%) | 0 (0.0%) |
| 75 Years and over | 0 (0.0%) | 6 (100.0%) |
| Total | 23 (88.5%) | 24 (100.0%) |
Income Below Poverty Among Married-Couple Families in Eldorado
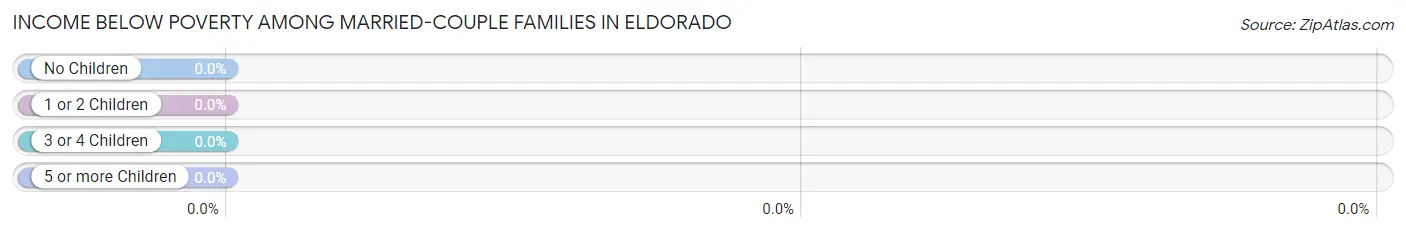
| Children | Above Poverty | Below Poverty |
| No Children | 6 (100.0%) | 0 (0.0%) |
| 1 or 2 Children | 1 (100.0%) | 0 (0.0%) |
| 3 or 4 Children | 0 (0.0%) | 0 (0.0%) |
| 5 or more Children | 0 (0.0%) | 0 (0.0%) |
| Total | 7 (100.0%) | 0 (0.0%) |
Income Below Poverty Among Single-Parent Households in Eldorado
| Children | Single Father | Single Mother |
| No Children | 0 (0.0%) | 0 (0.0%) |
| 1 or 2 Children | 0 (0.0%) | 0 (0.0%) |
| 3 or 4 Children | 0 (0.0%) | 0 (0.0%) |
| 5 or more Children | 0 (0.0%) | 0 (0.0%) |
| Total | 0 (0.0%) | 0 (0.0%) |
Income Below Poverty Among Married-Couple vs Single-Parent Households in Eldorado
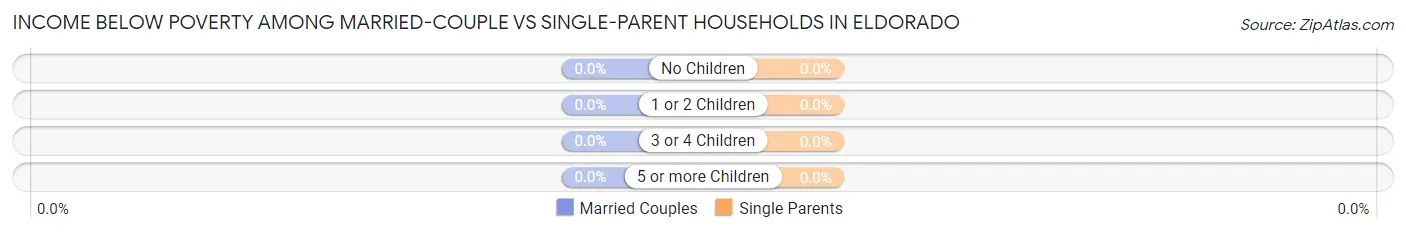
| Children | Married-Couple Families | Single-Parent Households |
| No Children | 0 (0.0%) | 0 (0.0%) |
| 1 or 2 Children | 0 (0.0%) | 0 (0.0%) |
| 3 or 4 Children | 0 (0.0%) | 0 (0.0%) |
| 5 or more Children | 0 (0.0%) | 0 (0.0%) |
| Total | 0 (0.0%) | 0 (0.0%) |
Employment Characteristics in Eldorado
Employment by Class of Employer in Eldorado
Among the 20 employed individuals in Eldorado, private company employees (15 | 75.0%), self-employed (not incorporated) (3 | 15.0%), and not-for-profit organizations (2 | 10.0%) make up the most common classes of employment.
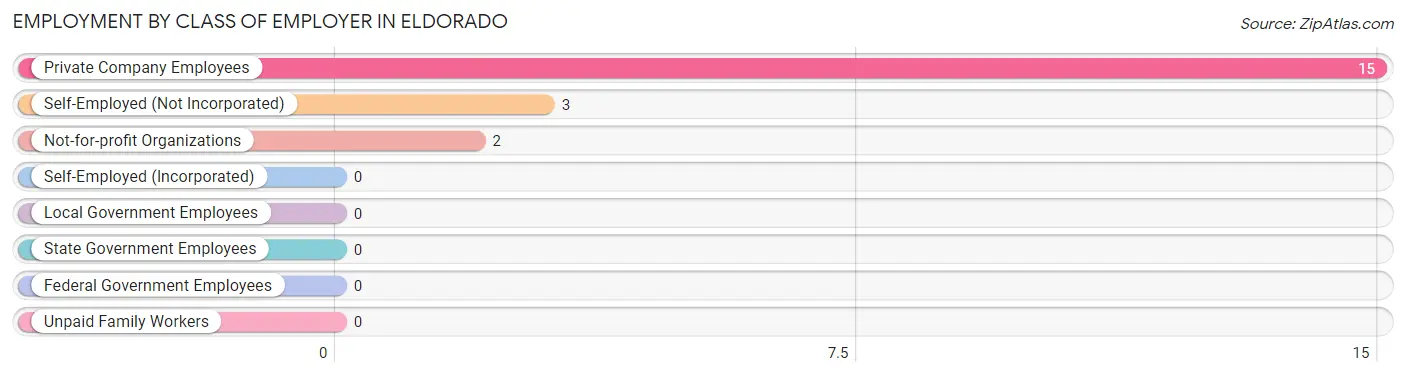
| Employer Class | # Employees | % Employees |
| Private Company Employees | 15 | 75.0% |
| Self-Employed (Incorporated) | 0 | 0.0% |
| Self-Employed (Not Incorporated) | 3 | 15.0% |
| Not-for-profit Organizations | 2 | 10.0% |
| Local Government Employees | 0 | 0.0% |
| State Government Employees | 0 | 0.0% |
| Federal Government Employees | 0 | 0.0% |
| Unpaid Family Workers | 0 | 0.0% |
| Total | 20 | 100.0% |
Employment Status by Age in Eldorado
According to the labor force statistics for Eldorado, out of the total population over 16 years of age (46), 54.3% or 25 individuals are in the labor force, with 8.0% or 2 of them unemployed. The age group with the highest labor force participation rate is 16 to 19 years, with 100.0% or 2 individuals in the labor force. Within the labor force, the 16 to 19 years age range has the highest percentage of unemployed individuals, with 100.0% or 2 of them being unemployed.
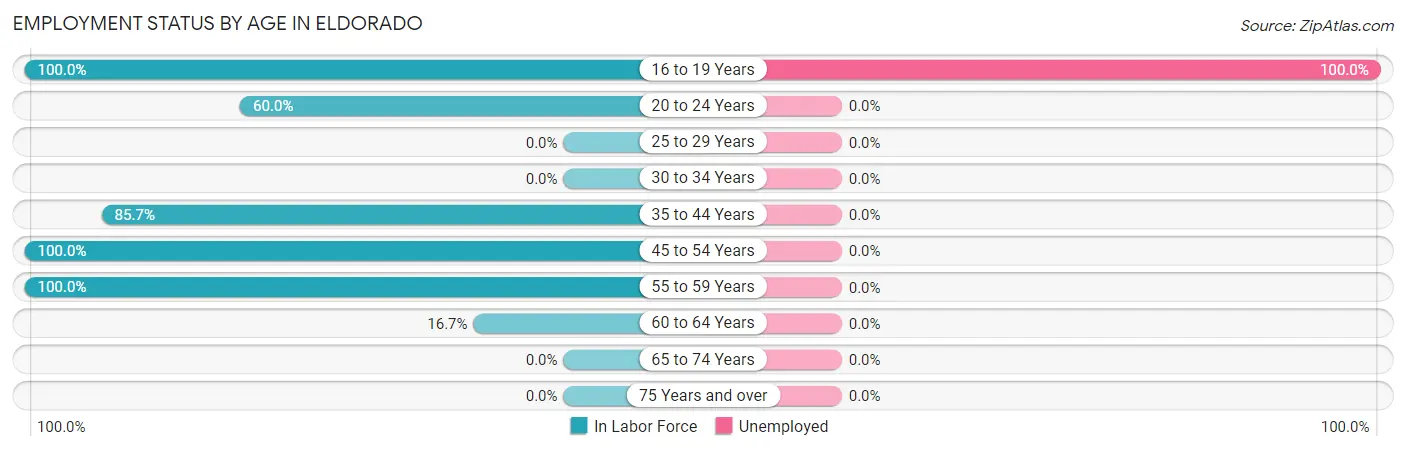
| Age Bracket | In Labor Force | Unemployed |
| 16 to 19 Years | 2 (100.0%) | 2 (100.0%) |
| 20 to 24 Years | 3 (60.0%) | 0 (0.0%) |
| 25 to 29 Years | 0 (0.0%) | 0 (0.0%) |
| 30 to 34 Years | 0 (0.0%) | 0 (0.0%) |
| 35 to 44 Years | 6 (85.7%) | 0 (0.0%) |
| 45 to 54 Years | 8 (100.0%) | 0 (0.0%) |
| 55 to 59 Years | 4 (100.0%) | 0 (0.0%) |
| 60 to 64 Years | 2 (16.7%) | 0 (0.0%) |
| 65 to 74 Years | 0 (0.0%) | 0 (0.0%) |
| 75 Years and over | 0 (0.0%) | 0 (0.0%) |
| Total | 25 (54.3%) | 2 (8.0%) |
Employment Status by Educational Attainment in Eldorado
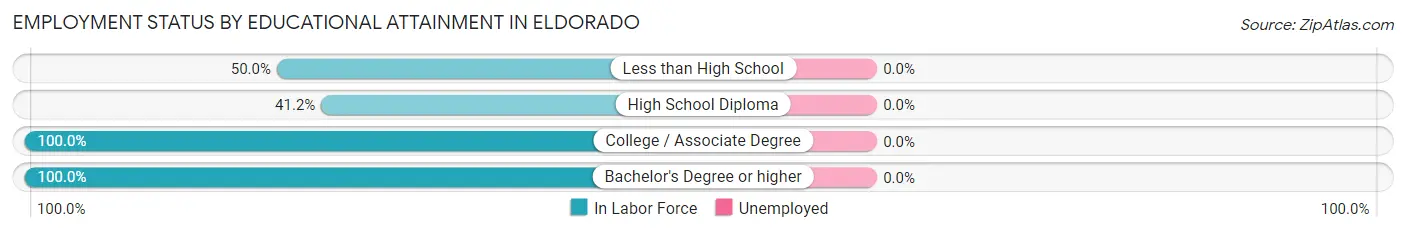
| Educational Attainment | In Labor Force | Unemployed |
| Less than High School | 3 (50.0%) | 0 (0.0%) |
| High School Diploma | 7 (41.2%) | 0 (0.0%) |
| College / Associate Degree | 8 (100.0%) | 0 (0.0%) |
| Bachelor's Degree or higher | 2 (100.0%) | 0 (0.0%) |
| Total | 20 (60.6%) | 0 (0.0%) |
Employment Occupations by Sex in Eldorado
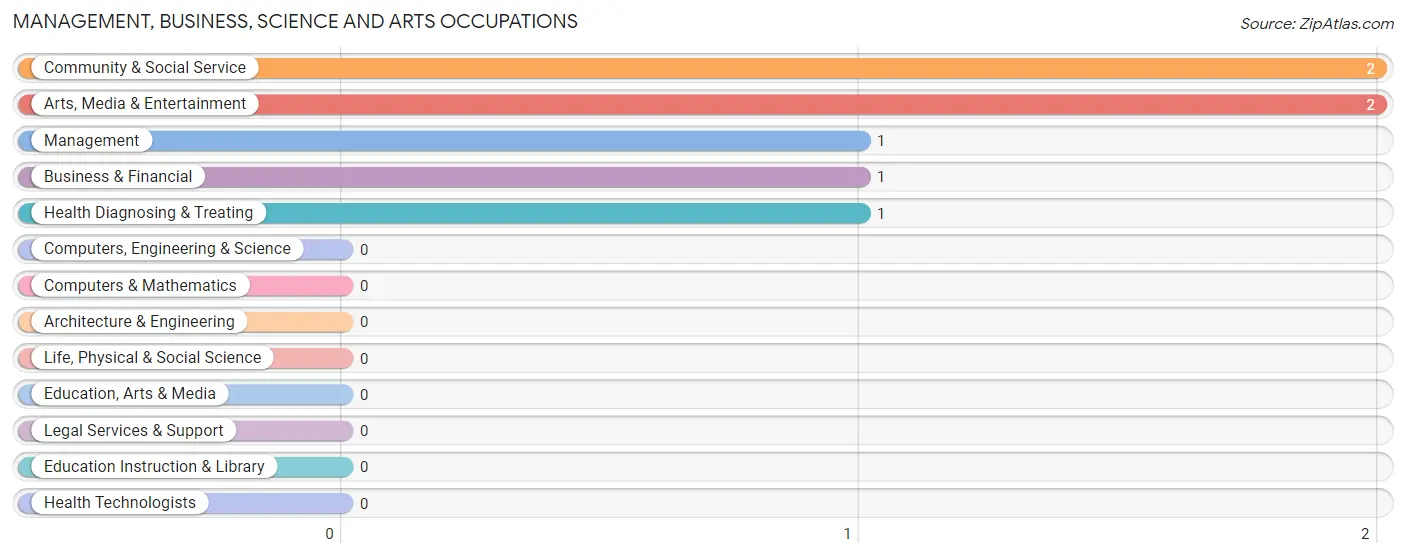
Management, Business, Science and Arts Occupations
The most common Management, Business, Science and Arts occupations in Eldorado are Community & Social Service (2 | 8.7%), Arts, Media & Entertainment (2 | 8.7%), Management (1 | 4.3%), Business & Financial (1 | 4.3%), and Health Diagnosing & Treating (1 | 4.3%).
Management, Business, Science and Arts Occupations by Sex
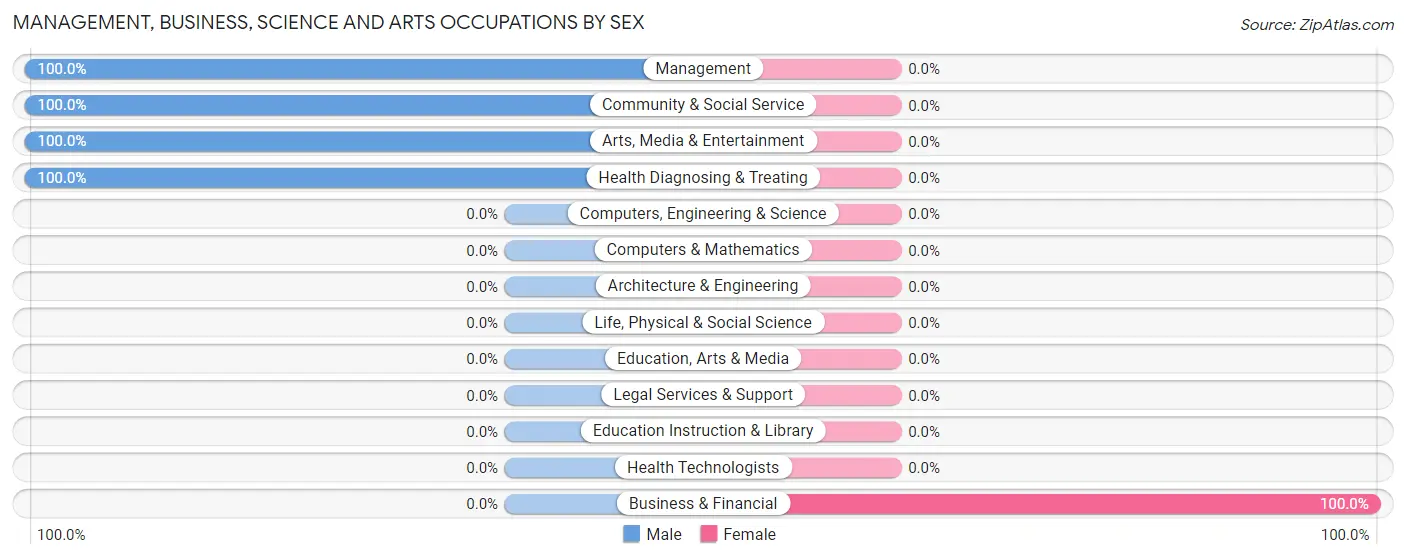
| Occupation | Male | Female |
| Management | 1 (100.0%) | 0 (0.0%) |
| Business & Financial | 0 (0.0%) | 1 (100.0%) |
| Computers, Engineering & Science | 0 (0.0%) | 0 (0.0%) |
| Computers & Mathematics | 0 (0.0%) | 0 (0.0%) |
| Architecture & Engineering | 0 (0.0%) | 0 (0.0%) |
| Life, Physical & Social Science | 0 (0.0%) | 0 (0.0%) |
| Community & Social Service | 2 (100.0%) | 0 (0.0%) |
| Education, Arts & Media | 0 (0.0%) | 0 (0.0%) |
| Legal Services & Support | 0 (0.0%) | 0 (0.0%) |
| Education Instruction & Library | 0 (0.0%) | 0 (0.0%) |
| Arts, Media & Entertainment | 2 (100.0%) | 0 (0.0%) |
| Health Diagnosing & Treating | 1 (100.0%) | 0 (0.0%) |
| Health Technologists | 0 (0.0%) | 0 (0.0%) |
| Total (Category) | 4 (80.0%) | 1 (20.0%) |
| Total (Overall) | 13 (56.5%) | 10 (43.5%) |
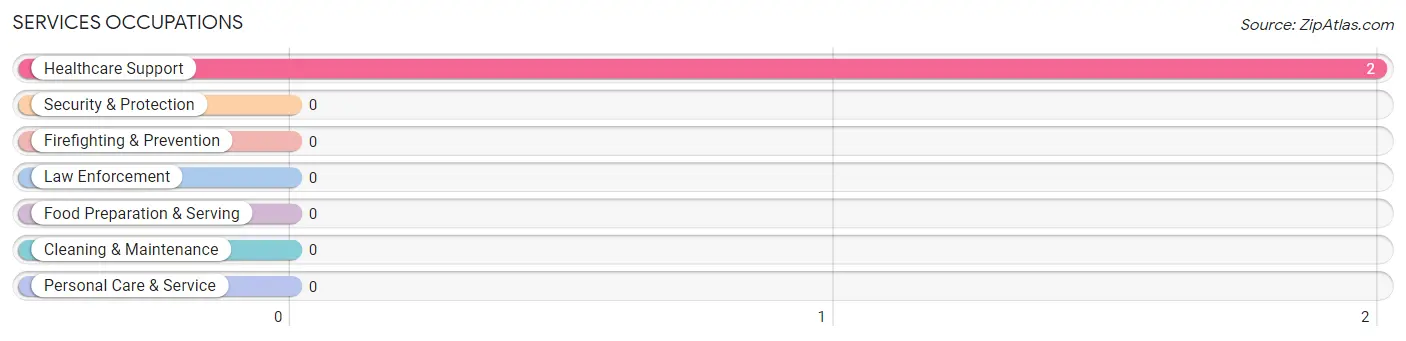
Services Occupations
The most common Services occupations in Eldorado are , and Healthcare Support (2 | 8.7%).
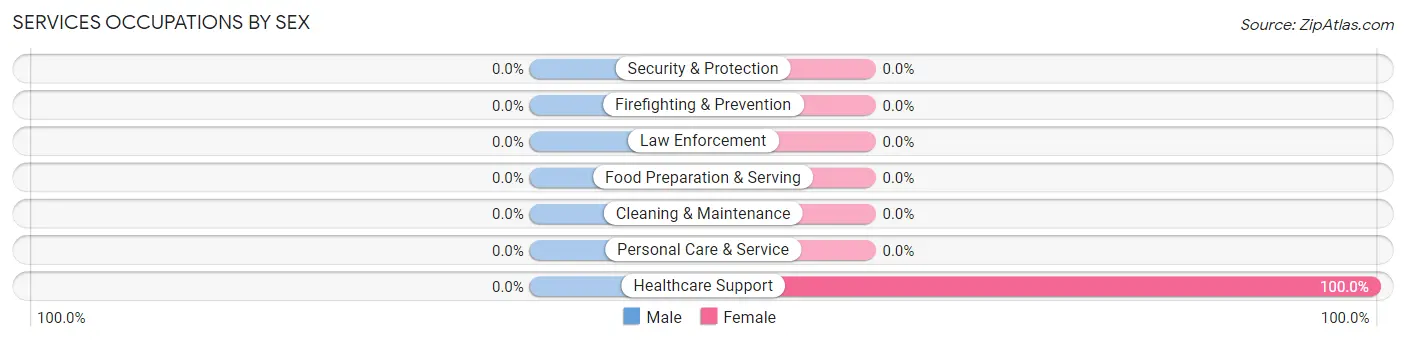
Services Occupations by Sex
| Occupation | Male | Female |
| Healthcare Support | 0 (0.0%) | 2 (100.0%) |
| Security & Protection | 0 (0.0%) | 0 (0.0%) |
| Firefighting & Prevention | 0 (0.0%) | 0 (0.0%) |
| Law Enforcement | 0 (0.0%) | 0 (0.0%) |
| Food Preparation & Serving | 0 (0.0%) | 0 (0.0%) |
| Cleaning & Maintenance | 0 (0.0%) | 0 (0.0%) |
| Personal Care & Service | 0 (0.0%) | 0 (0.0%) |
| Total (Category) | 0 (0.0%) | 2 (100.0%) |
| Total (Overall) | 13 (56.5%) | 10 (43.5%) |
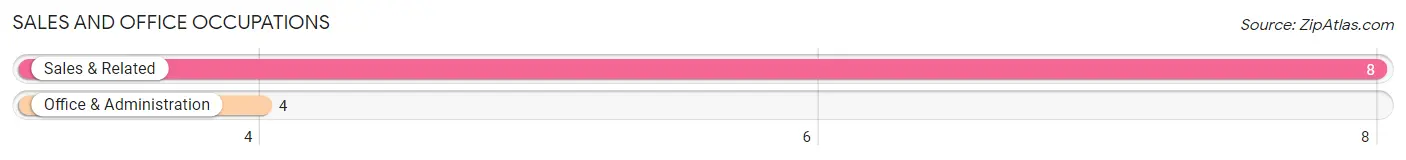
Sales and Office Occupations
The most common Sales and Office occupations in Eldorado are Sales & Related (8 | 34.8%), and Office & Administration (4 | 17.4%).
Sales and Office Occupations by Sex

| Occupation | Male | Female |
| Sales & Related | 5 (62.5%) | 3 (37.5%) |
| Office & Administration | 0 (0.0%) | 4 (100.0%) |
| Total (Category) | 5 (41.7%) | 7 (58.3%) |
| Total (Overall) | 13 (56.5%) | 10 (43.5%) |
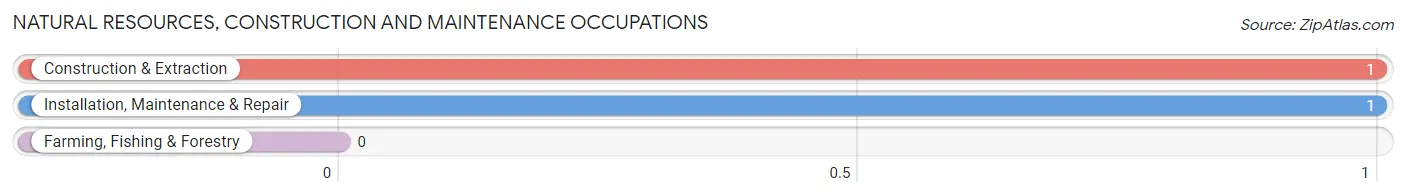
Natural Resources, Construction and Maintenance Occupations
The most common Natural Resources, Construction and Maintenance occupations in Eldorado are Construction & Extraction (1 | 4.3%), and Installation, Maintenance & Repair (1 | 4.3%).
Natural Resources, Construction and Maintenance Occupations by Sex
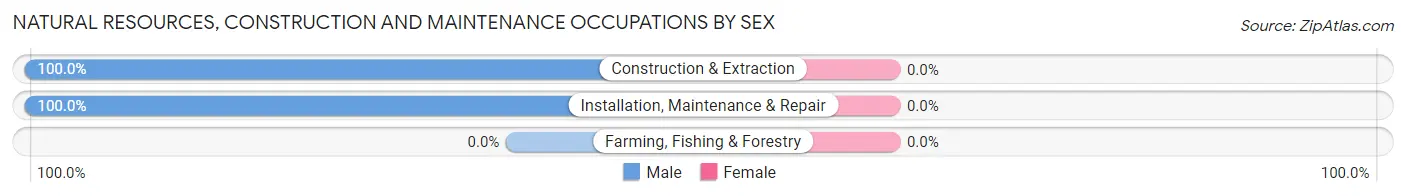
| Occupation | Male | Female |
| Farming, Fishing & Forestry | 0 (0.0%) | 0 (0.0%) |
| Construction & Extraction | 1 (100.0%) | 0 (0.0%) |
| Installation, Maintenance & Repair | 1 (100.0%) | 0 (0.0%) |
| Total (Category) | 2 (100.0%) | 0 (0.0%) |
| Total (Overall) | 13 (56.5%) | 10 (43.5%) |
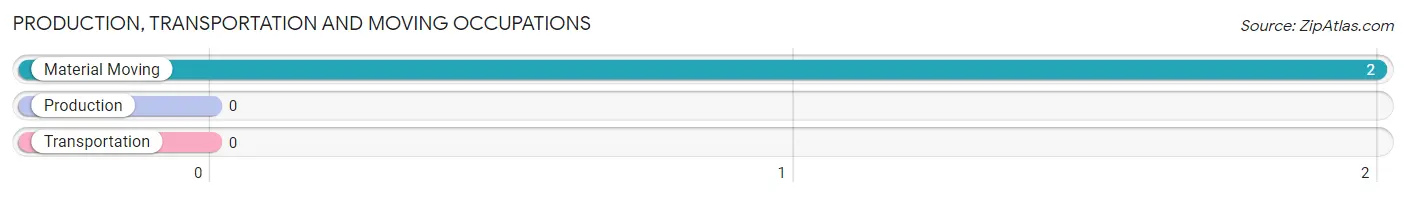
Production, Transportation and Moving Occupations
The most common Production, Transportation and Moving occupations in Eldorado are , and Material Moving (2 | 8.7%).
Production, Transportation and Moving Occupations by Sex
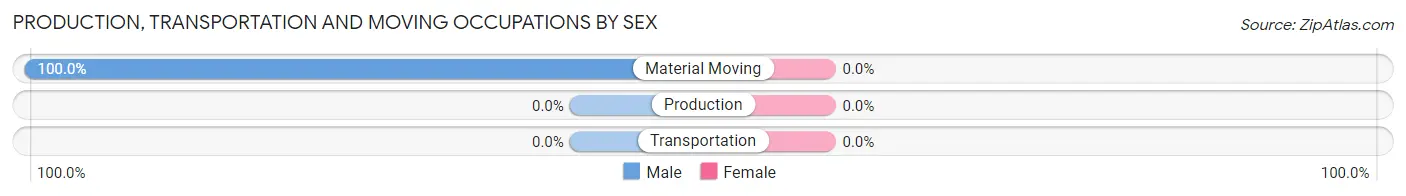
| Occupation | Male | Female |
| Production | 0 (0.0%) | 0 (0.0%) |
| Transportation | 0 (0.0%) | 0 (0.0%) |
| Material Moving | 2 (100.0%) | 0 (0.0%) |
| Total (Category) | 2 (100.0%) | 0 (0.0%) |
| Total (Overall) | 13 (56.5%) | 10 (43.5%) |
Employment Industries by Sex in Eldorado
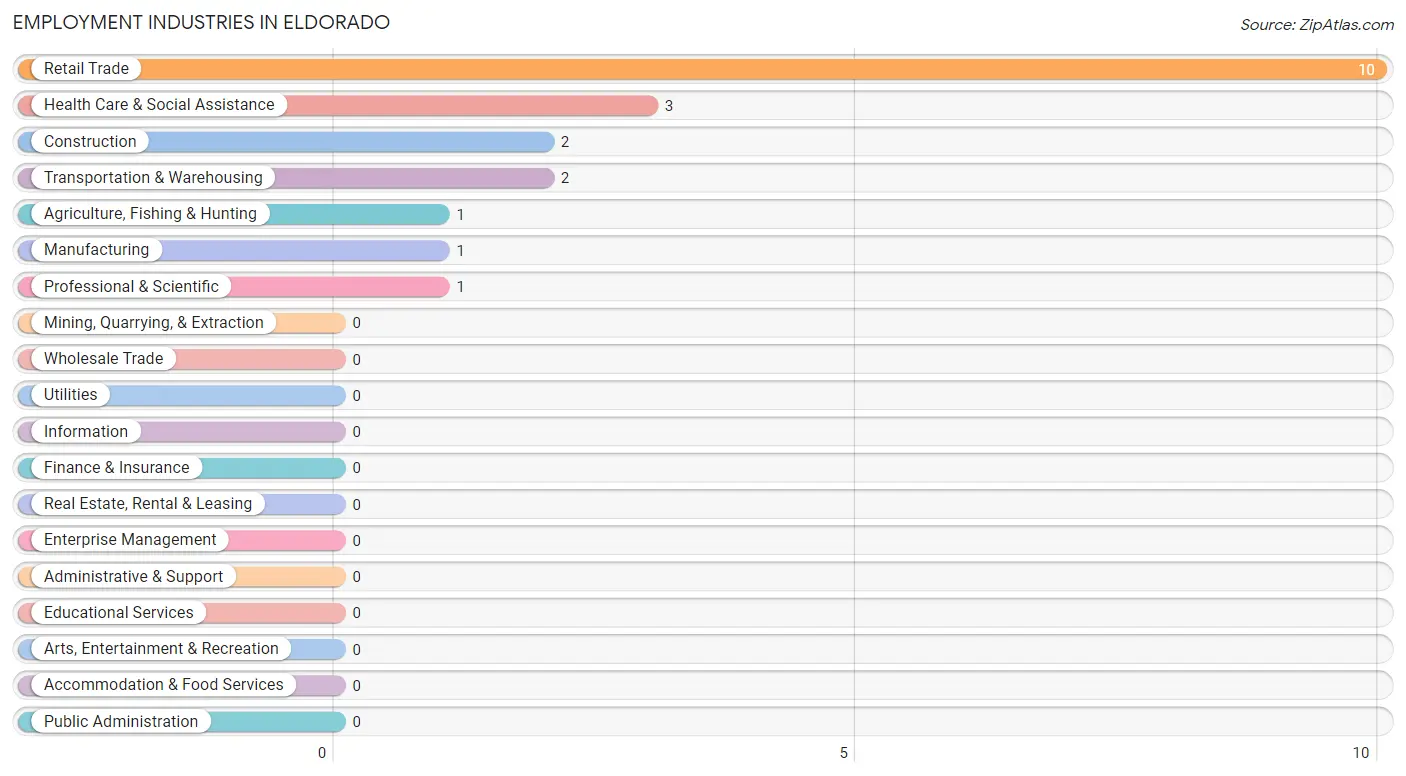
Employment Industries in Eldorado
The major employment industries in Eldorado include Retail Trade (10 | 43.5%), Health Care & Social Assistance (3 | 13.0%), Construction (2 | 8.7%), Transportation & Warehousing (2 | 8.7%), and Agriculture, Fishing & Hunting (1 | 4.3%).
Employment Industries by Sex in Eldorado
The Eldorado industries that see more men than women are Agriculture, Fishing & Hunting (100.0%), Construction (100.0%), and Transportation & Warehousing (100.0%), whereas the industries that tend to have a higher number of women are Manufacturing (100.0%), Professional & Scientific (100.0%), and Health Care & Social Assistance (66.7%).
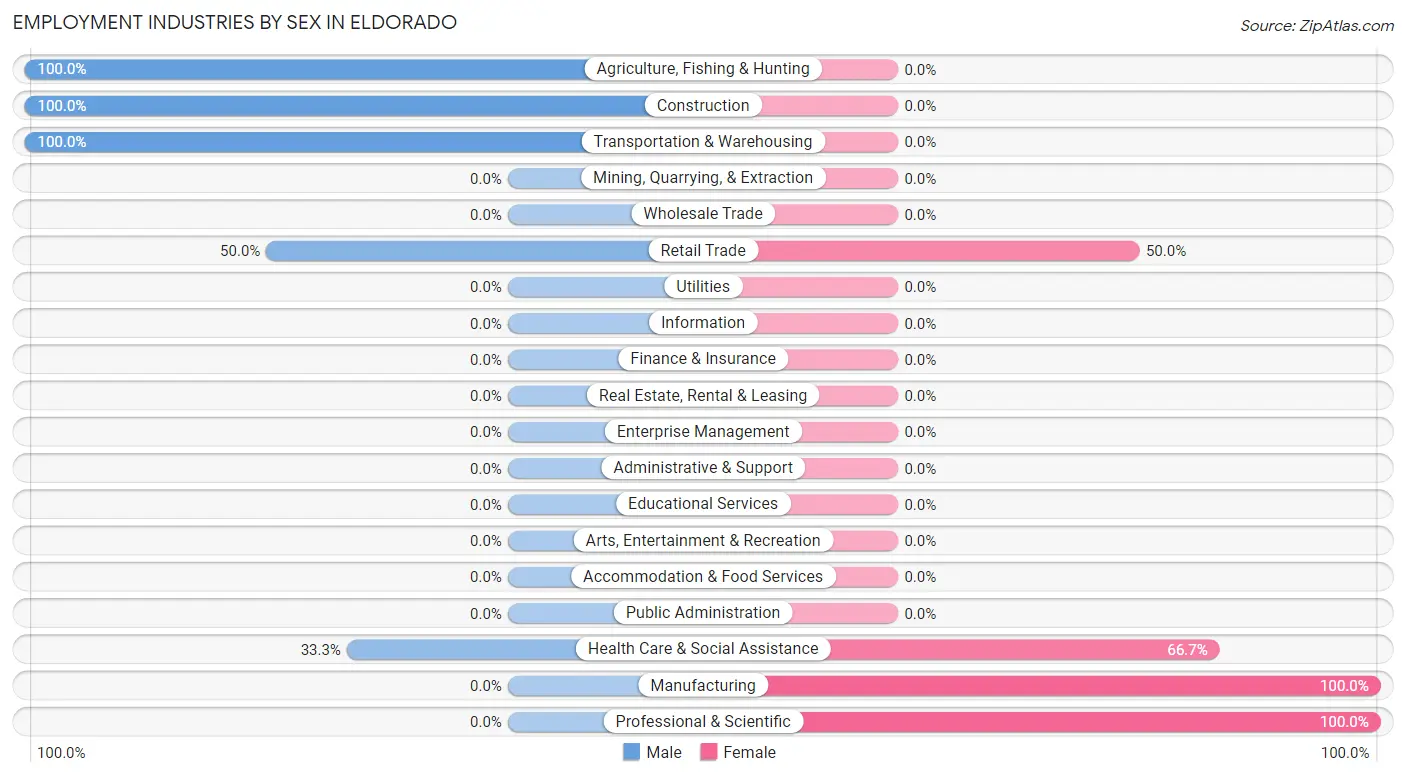
| Industry | Male | Female |
| Agriculture, Fishing & Hunting | 1 (100.0%) | 0 (0.0%) |
| Mining, Quarrying, & Extraction | 0 (0.0%) | 0 (0.0%) |
| Construction | 2 (100.0%) | 0 (0.0%) |
| Manufacturing | 0 (0.0%) | 1 (100.0%) |
| Wholesale Trade | 0 (0.0%) | 0 (0.0%) |
| Retail Trade | 5 (50.0%) | 5 (50.0%) |
| Transportation & Warehousing | 2 (100.0%) | 0 (0.0%) |
| Utilities | 0 (0.0%) | 0 (0.0%) |
| Information | 0 (0.0%) | 0 (0.0%) |
| Finance & Insurance | 0 (0.0%) | 0 (0.0%) |
| Real Estate, Rental & Leasing | 0 (0.0%) | 0 (0.0%) |
| Professional & Scientific | 0 (0.0%) | 1 (100.0%) |
| Enterprise Management | 0 (0.0%) | 0 (0.0%) |
| Administrative & Support | 0 (0.0%) | 0 (0.0%) |
| Educational Services | 0 (0.0%) | 0 (0.0%) |
| Health Care & Social Assistance | 1 (33.3%) | 2 (66.7%) |
| Arts, Entertainment & Recreation | 0 (0.0%) | 0 (0.0%) |
| Accommodation & Food Services | 0 (0.0%) | 0 (0.0%) |
| Public Administration | 0 (0.0%) | 0 (0.0%) |
| Total | 13 (56.5%) | 10 (43.5%) |
Education in Eldorado
School Enrollment in Eldorado
The most common levels of schooling among the 9 students in Eldorado are college / undergraduate (3 | 33.3%), elementary school (2 | 22.2%), and middle school (2 | 22.2%).
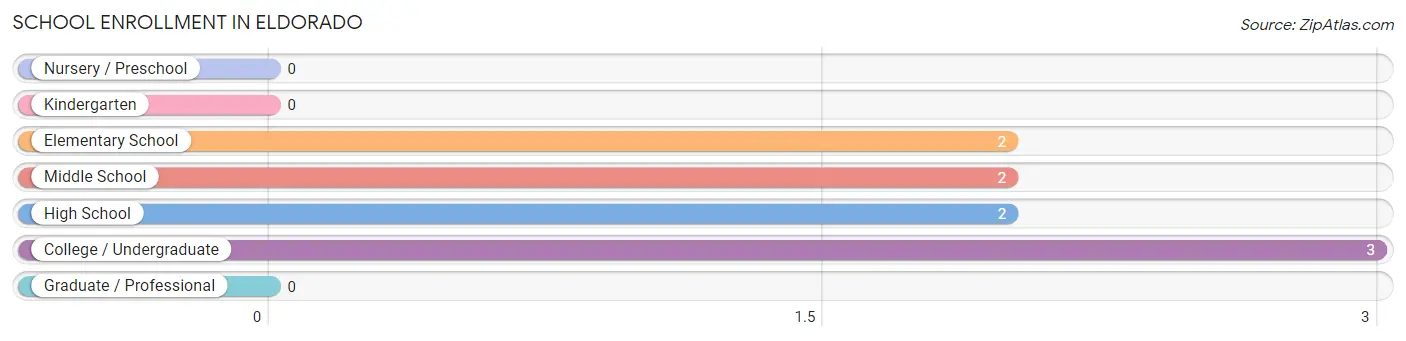
| School Level | # Students | % Students |
| Nursery / Preschool | 0 | 0.0% |
| Kindergarten | 0 | 0.0% |
| Elementary School | 2 | 22.2% |
| Middle School | 2 | 22.2% |
| High School | 2 | 22.2% |
| College / Undergraduate | 3 | 33.3% |
| Graduate / Professional | 0 | 0.0% |
| Total | 9 | 100.0% |
School Enrollment by Age by Funding Source in Eldorado
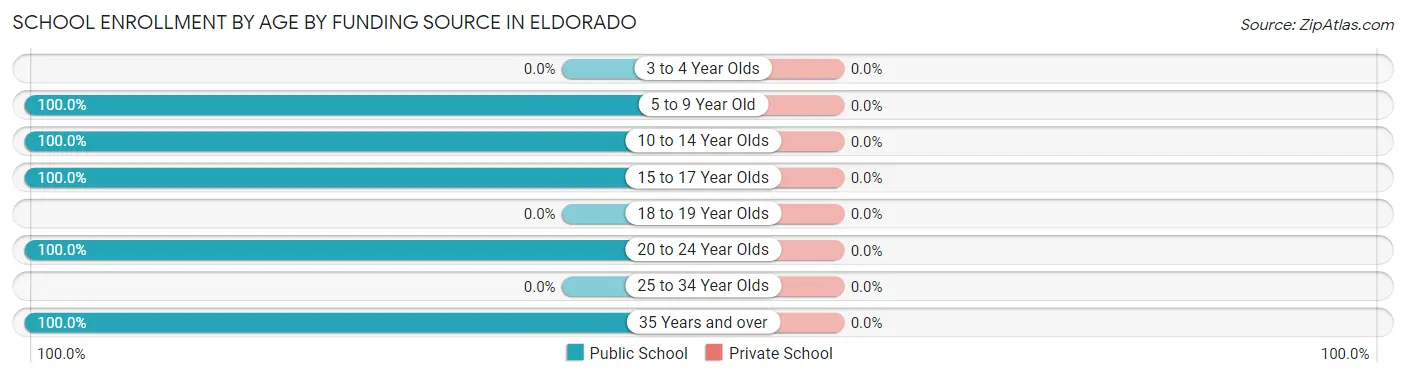
| Age Bracket | Public School | Private School |
| 3 to 4 Year Olds | 0 (0.0%) | 0 (0.0%) |
| 5 to 9 Year Old | 1 (100.0%) | 0 (0.0%) |
| 10 to 14 Year Olds | 3 (100.0%) | 0 (0.0%) |
| 15 to 17 Year Olds | 2 (100.0%) | 0 (0.0%) |
| 18 to 19 Year Olds | 0 (0.0%) | 0 (0.0%) |
| 20 to 24 Year Olds | 2 (100.0%) | 0 (0.0%) |
| 25 to 34 Year Olds | 0 (0.0%) | 0 (0.0%) |
| 35 Years and over | 1 (100.0%) | 0 (0.0%) |
| Total | 9 (100.0%) | 0 (0.0%) |
Educational Attainment by Field of Study in Eldorado
Business (1 | 50.0%), and literature & languages (1 | 50.0%) are the most common fields of study among 2 individuals in Eldorado who have obtained a bachelor's degree or higher.
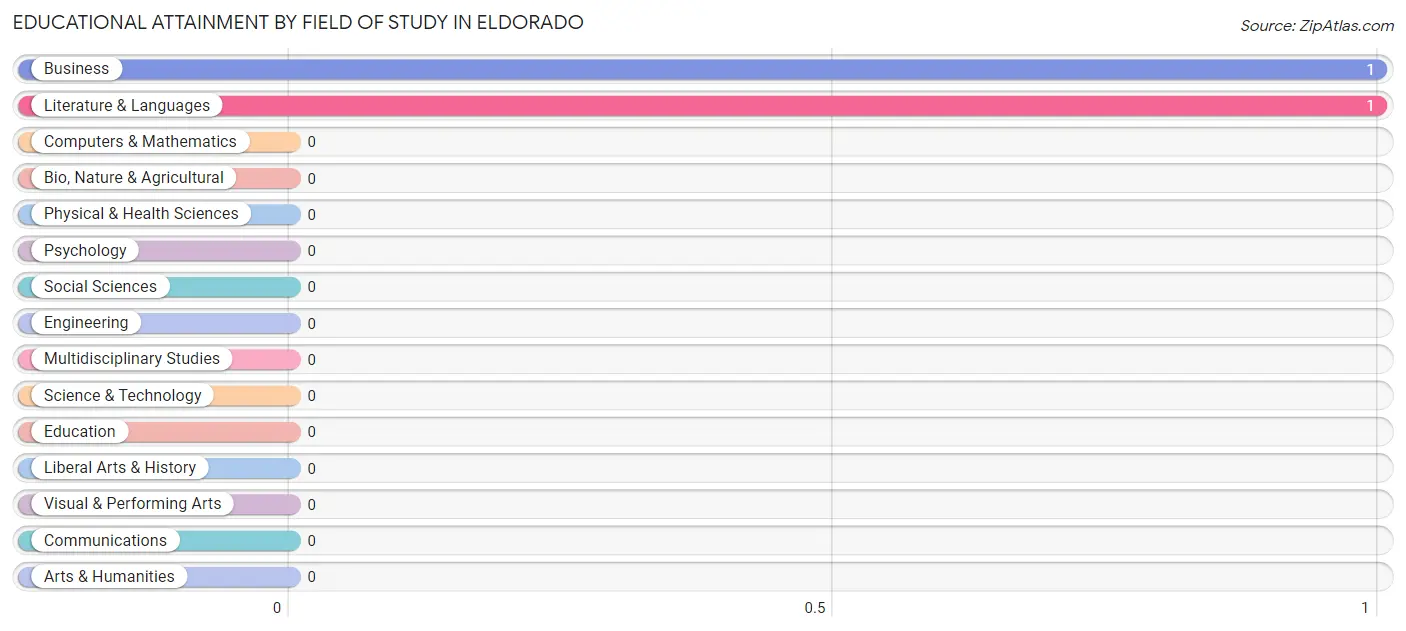
| Field of Study | # Graduates | % Graduates |
| Computers & Mathematics | 0 | 0.0% |
| Bio, Nature & Agricultural | 0 | 0.0% |
| Physical & Health Sciences | 0 | 0.0% |
| Psychology | 0 | 0.0% |
| Social Sciences | 0 | 0.0% |
| Engineering | 0 | 0.0% |
| Multidisciplinary Studies | 0 | 0.0% |
| Science & Technology | 0 | 0.0% |
| Business | 1 | 50.0% |
| Education | 0 | 0.0% |
| Literature & Languages | 1 | 50.0% |
| Liberal Arts & History | 0 | 0.0% |
| Visual & Performing Arts | 0 | 0.0% |
| Communications | 0 | 0.0% |
| Arts & Humanities | 0 | 0.0% |
| Total | 2 | 100.0% |
Transportation & Commute in Eldorado
Vehicle Availability by Sex in Eldorado
The most prevalent vehicle ownership categories in Eldorado are males with 2 vehicles (7, accounting for 53.8%) and females with 2 vehicles (4, making up 100.0%).
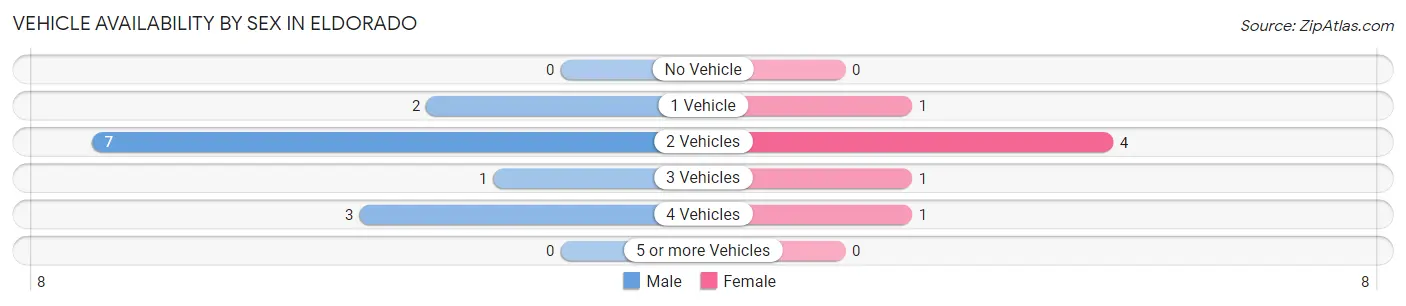
| Vehicles Available | Male | Female |
| No Vehicle | 0 (0.0%) | 0 (0.0%) |
| 1 Vehicle | 2 (15.4%) | 1 (14.3%) |
| 2 Vehicles | 7 (53.8%) | 4 (57.1%) |
| 3 Vehicles | 1 (7.7%) | 1 (14.3%) |
| 4 Vehicles | 3 (23.1%) | 1 (14.3%) |
| 5 or more Vehicles | 0 (0.0%) | 0 (0.0%) |
| Total | 13 (100.0%) | 7 (100.0%) |
Commute Time in Eldorado
The most frequently occuring commute durations in Eldorado are 20 to 24 minutes (6 commuters, 30.0%), 35 to 39 minutes (5 commuters, 25.0%), and 30 to 34 minutes (3 commuters, 15.0%).
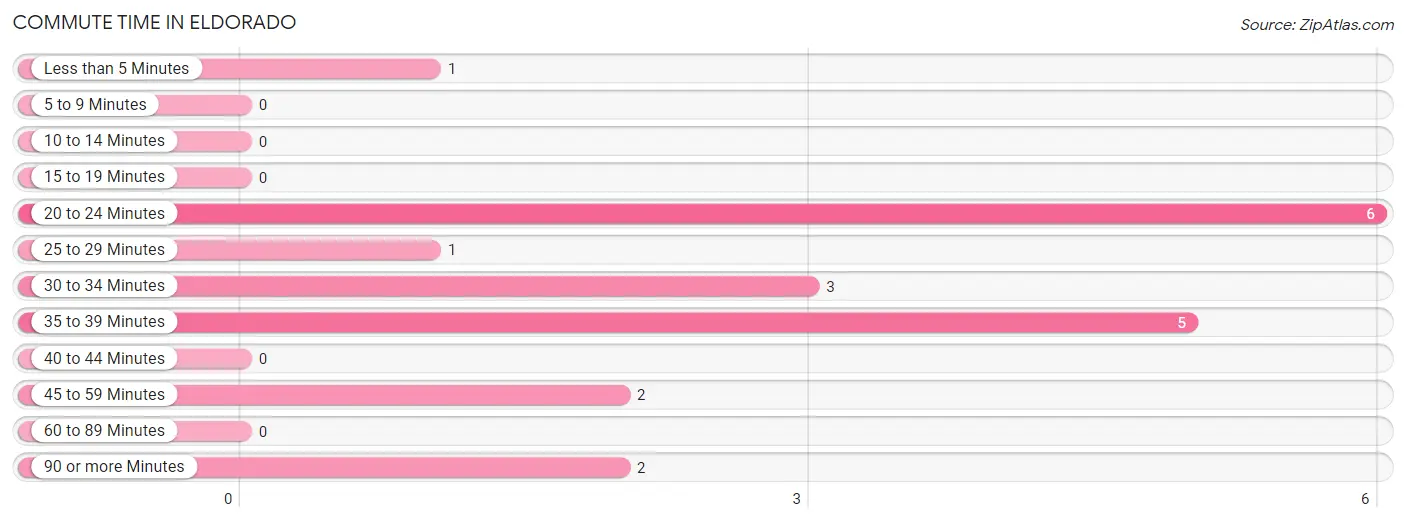
| Commute Time | # Commuters | % Commuters |
| Less than 5 Minutes | 1 | 5.0% |
| 5 to 9 Minutes | 0 | 0.0% |
| 10 to 14 Minutes | 0 | 0.0% |
| 15 to 19 Minutes | 0 | 0.0% |
| 20 to 24 Minutes | 6 | 30.0% |
| 25 to 29 Minutes | 1 | 5.0% |
| 30 to 34 Minutes | 3 | 15.0% |
| 35 to 39 Minutes | 5 | 25.0% |
| 40 to 44 Minutes | 0 | 0.0% |
| 45 to 59 Minutes | 2 | 10.0% |
| 60 to 89 Minutes | 0 | 0.0% |
| 90 or more Minutes | 2 | 10.0% |
Commute Time by Sex in Eldorado
The most common commute times in Eldorado are 35 to 39 minutes (5 commuters, 38.5%) for males and 30 to 34 minutes (3 commuters, 42.9%) for females.
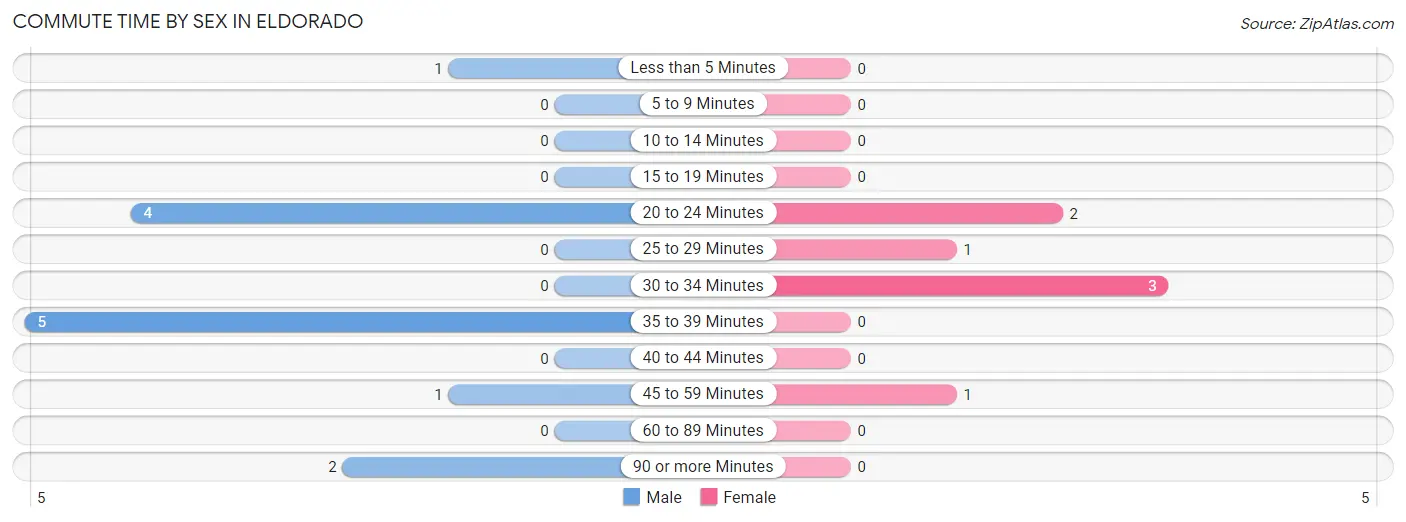
| Commute Time | Male | Female |
| Less than 5 Minutes | 1 (7.7%) | 0 (0.0%) |
| 5 to 9 Minutes | 0 (0.0%) | 0 (0.0%) |
| 10 to 14 Minutes | 0 (0.0%) | 0 (0.0%) |
| 15 to 19 Minutes | 0 (0.0%) | 0 (0.0%) |
| 20 to 24 Minutes | 4 (30.8%) | 2 (28.6%) |
| 25 to 29 Minutes | 0 (0.0%) | 1 (14.3%) |
| 30 to 34 Minutes | 0 (0.0%) | 3 (42.9%) |
| 35 to 39 Minutes | 5 (38.5%) | 0 (0.0%) |
| 40 to 44 Minutes | 0 (0.0%) | 0 (0.0%) |
| 45 to 59 Minutes | 1 (7.7%) | 1 (14.3%) |
| 60 to 89 Minutes | 0 (0.0%) | 0 (0.0%) |
| 90 or more Minutes | 2 (15.4%) | 0 (0.0%) |
Time of Departure to Work by Sex in Eldorado
The most frequent times of departure to work in Eldorado are 7:30 AM to 7:59 AM (5, 38.5%) for males and 9:00 AM to 9:59 AM (3, 42.9%) for females.
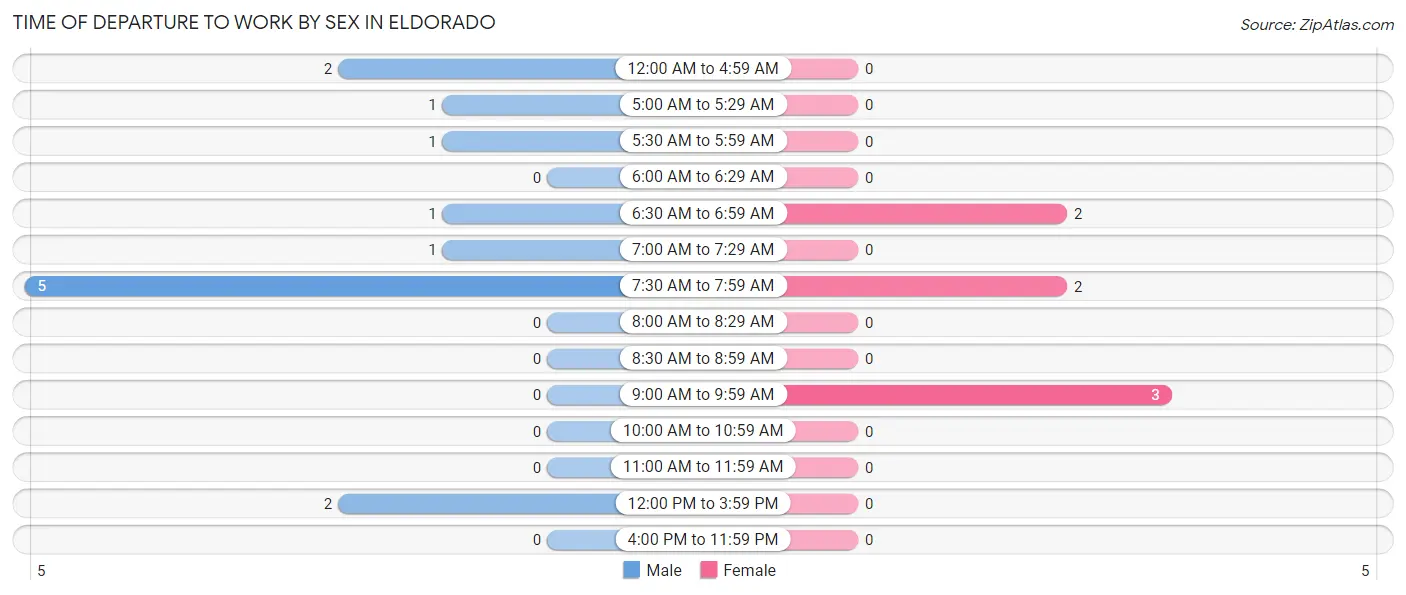
| Time of Departure | Male | Female |
| 12:00 AM to 4:59 AM | 2 (15.4%) | 0 (0.0%) |
| 5:00 AM to 5:29 AM | 1 (7.7%) | 0 (0.0%) |
| 5:30 AM to 5:59 AM | 1 (7.7%) | 0 (0.0%) |
| 6:00 AM to 6:29 AM | 0 (0.0%) | 0 (0.0%) |
| 6:30 AM to 6:59 AM | 1 (7.7%) | 2 (28.6%) |
| 7:00 AM to 7:29 AM | 1 (7.7%) | 0 (0.0%) |
| 7:30 AM to 7:59 AM | 5 (38.5%) | 2 (28.6%) |
| 8:00 AM to 8:29 AM | 0 (0.0%) | 0 (0.0%) |
| 8:30 AM to 8:59 AM | 0 (0.0%) | 0 (0.0%) |
| 9:00 AM to 9:59 AM | 0 (0.0%) | 3 (42.9%) |
| 10:00 AM to 10:59 AM | 0 (0.0%) | 0 (0.0%) |
| 11:00 AM to 11:59 AM | 0 (0.0%) | 0 (0.0%) |
| 12:00 PM to 3:59 PM | 2 (15.4%) | 0 (0.0%) |
| 4:00 PM to 11:59 PM | 0 (0.0%) | 0 (0.0%) |
| Total | 13 (100.0%) | 7 (100.0%) |
Housing Occupancy in Eldorado
Occupancy by Ownership in Eldorado
Of the total 24 dwellings in Eldorado, owner-occupied units account for 23 (95.8%), while renter-occupied units make up 1 (4.2%).
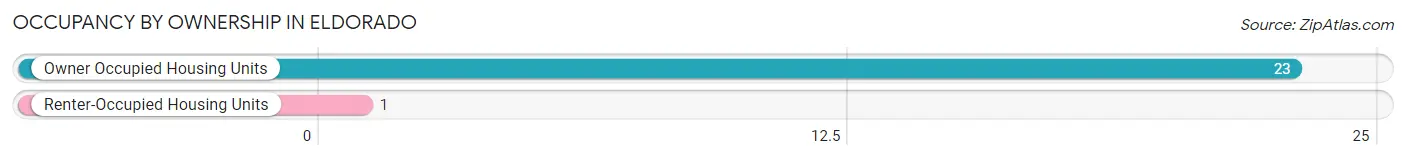
| Occupancy | # Housing Units | % Housing Units |
| Owner Occupied Housing Units | 23 | 95.8% |
| Renter-Occupied Housing Units | 1 | 4.2% |
| Total Occupied Housing Units | 24 | 100.0% |
Occupancy by Household Size in Eldorado
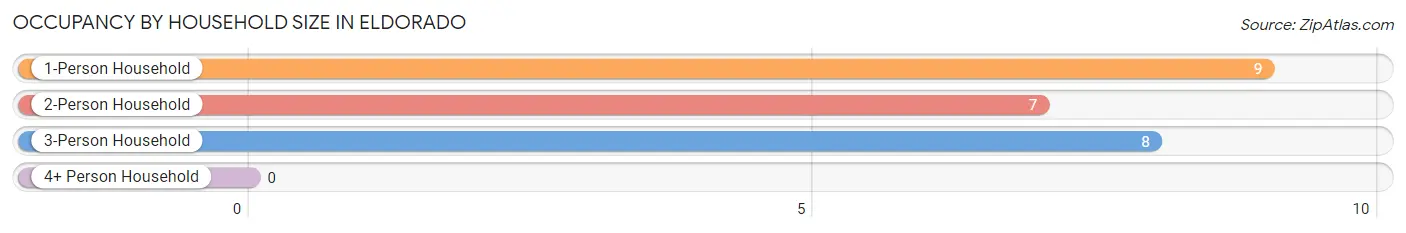
| Household Size | # Housing Units | % Housing Units |
| 1-Person Household | 9 | 37.5% |
| 2-Person Household | 7 | 29.2% |
| 3-Person Household | 8 | 33.3% |
| 4+ Person Household | 0 | 0.0% |
| Total Housing Units | 24 | 100.0% |
Occupancy by Ownership by Household Size in Eldorado
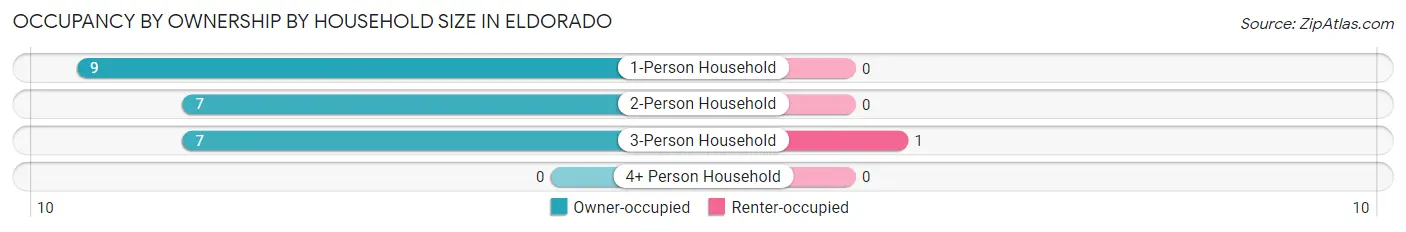
| Household Size | Owner-occupied | Renter-occupied |
| 1-Person Household | 9 (100.0%) | 0 (0.0%) |
| 2-Person Household | 7 (100.0%) | 0 (0.0%) |
| 3-Person Household | 7 (87.5%) | 1 (12.5%) |
| 4+ Person Household | 0 (0.0%) | 0 (0.0%) |
| Total Housing Units | 23 (95.8%) | 1 (4.2%) |
Occupancy by Educational Attainment in Eldorado
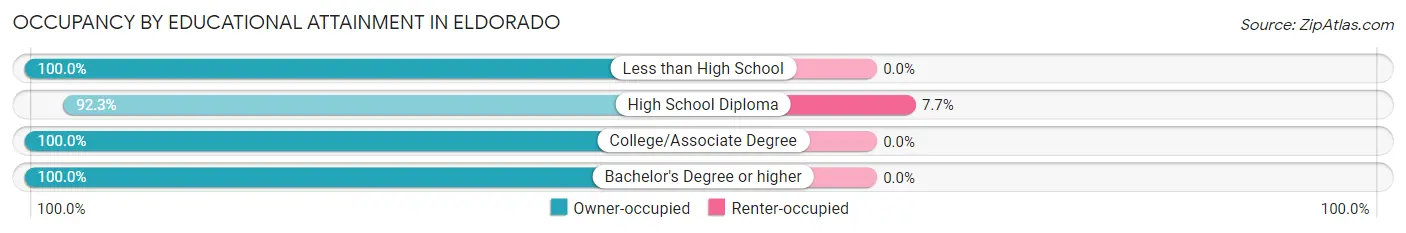
| Household Size | Owner-occupied | Renter-occupied |
| Less than High School | 2 (100.0%) | 0 (0.0%) |
| High School Diploma | 12 (92.3%) | 1 (7.7%) |
| College/Associate Degree | 8 (100.0%) | 0 (0.0%) |
| Bachelor's Degree or higher | 1 (100.0%) | 0 (0.0%) |
Occupancy by Age of Householder in Eldorado
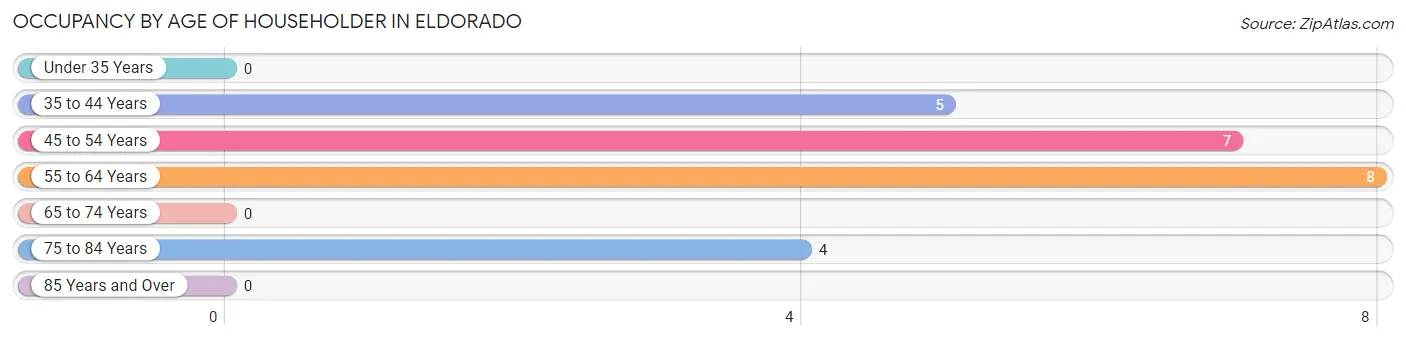
| Age Bracket | # Households | % Households |
| Under 35 Years | 0 | 0.0% |
| 35 to 44 Years | 5 | 20.8% |
| 45 to 54 Years | 7 | 29.2% |
| 55 to 64 Years | 8 | 33.3% |
| 65 to 74 Years | 0 | 0.0% |
| 75 to 84 Years | 4 | 16.7% |
| 85 Years and Over | 0 | 0.0% |
| Total | 24 | 100.0% |
Housing Finances in Eldorado
Median Income by Occupancy in Eldorado
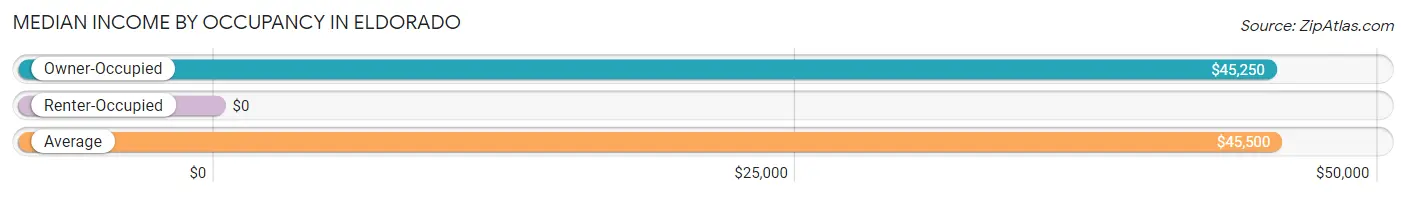
| Occupancy Type | # Households | Median Income |
| Owner-Occupied | 23 (95.8%) | $45,250 |
| Renter-Occupied | 1 (4.2%) | $0 |
| Average | 24 (100.0%) | $45,500 |
Occupancy by Householder Income Bracket in Eldorado
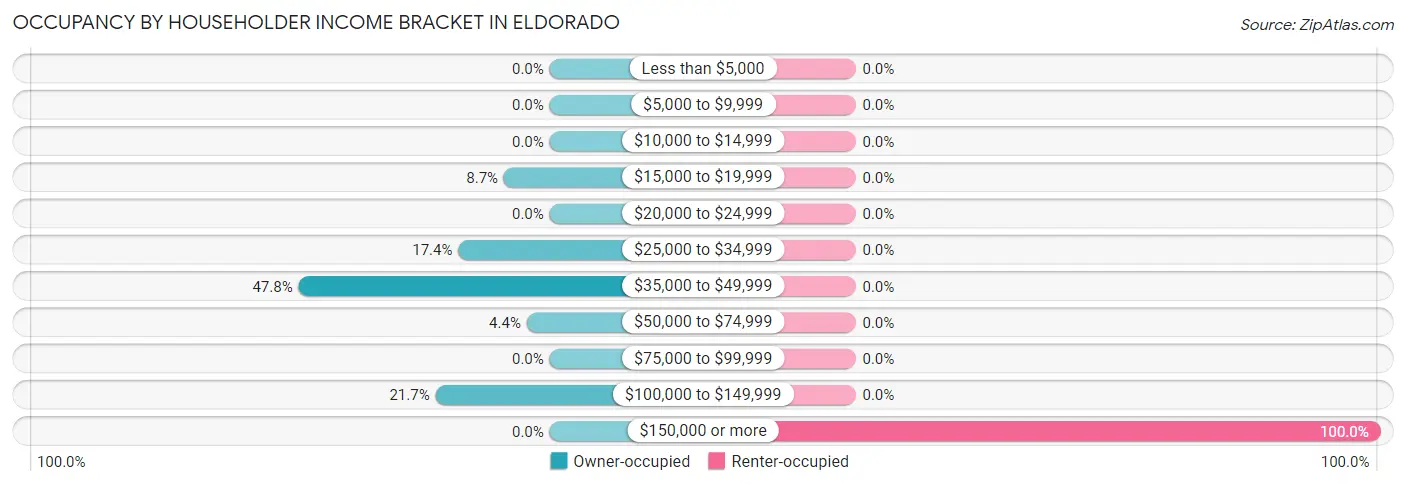
| Income Bracket | Owner-occupied | Renter-occupied |
| Less than $5,000 | 0 (0.0%) | 0 (0.0%) |
| $5,000 to $9,999 | 0 (0.0%) | 0 (0.0%) |
| $10,000 to $14,999 | 0 (0.0%) | 0 (0.0%) |
| $15,000 to $19,999 | 2 (8.7%) | 0 (0.0%) |
| $20,000 to $24,999 | 0 (0.0%) | 0 (0.0%) |
| $25,000 to $34,999 | 4 (17.4%) | 0 (0.0%) |
| $35,000 to $49,999 | 11 (47.8%) | 0 (0.0%) |
| $50,000 to $74,999 | 1 (4.3%) | 0 (0.0%) |
| $75,000 to $99,999 | 0 (0.0%) | 0 (0.0%) |
| $100,000 to $149,999 | 5 (21.7%) | 0 (0.0%) |
| $150,000 or more | 0 (0.0%) | 1 (100.0%) |
| Total | 23 (100.0%) | 1 (100.0%) |
Monthly Housing Cost Tiers in Eldorado
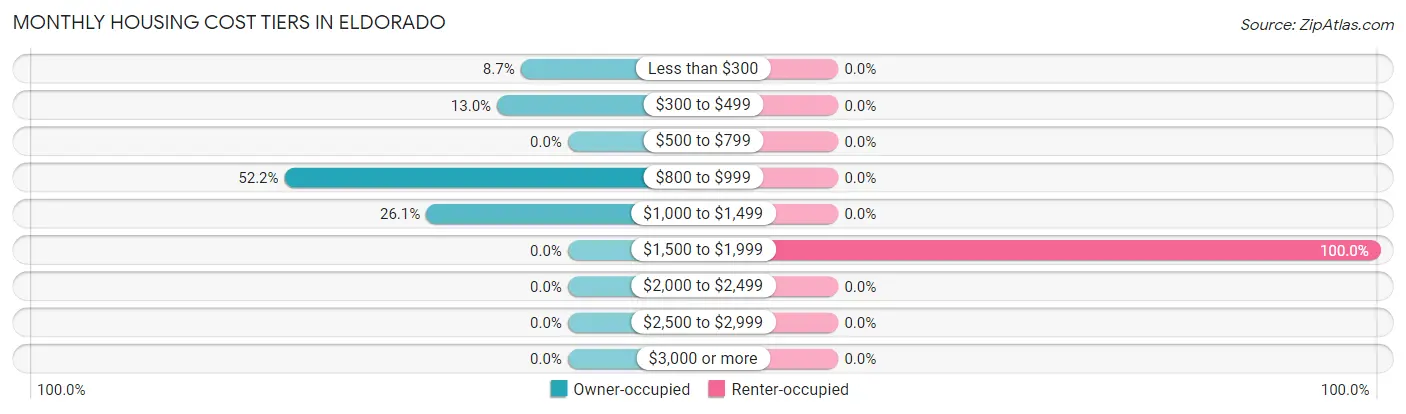
| Monthly Cost | Owner-occupied | Renter-occupied |
| Less than $300 | 2 (8.7%) | 0 (0.0%) |
| $300 to $499 | 3 (13.0%) | 0 (0.0%) |
| $500 to $799 | 0 (0.0%) | 0 (0.0%) |
| $800 to $999 | 12 (52.2%) | 0 (0.0%) |
| $1,000 to $1,499 | 6 (26.1%) | 0 (0.0%) |
| $1,500 to $1,999 | 0 (0.0%) | 1 (100.0%) |
| $2,000 to $2,499 | 0 (0.0%) | 0 (0.0%) |
| $2,500 to $2,999 | 0 (0.0%) | 0 (0.0%) |
| $3,000 or more | 0 (0.0%) | 0 (0.0%) |
| Total | 23 (100.0%) | 1 (100.0%) |
Physical Housing Characteristics in Eldorado
Housing Structures in Eldorado
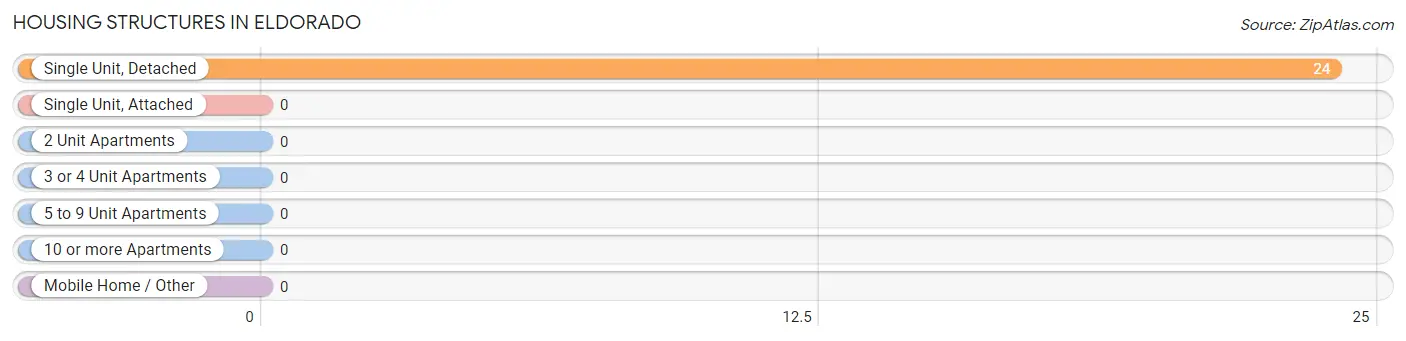
| Structure Type | # Housing Units | % Housing Units |
| Single Unit, Detached | 24 | 100.0% |
| Single Unit, Attached | 0 | 0.0% |
| 2 Unit Apartments | 0 | 0.0% |
| 3 or 4 Unit Apartments | 0 | 0.0% |
| 5 to 9 Unit Apartments | 0 | 0.0% |
| 10 or more Apartments | 0 | 0.0% |
| Mobile Home / Other | 0 | 0.0% |
| Total | 24 | 100.0% |
Housing Structures by Occupancy in Eldorado
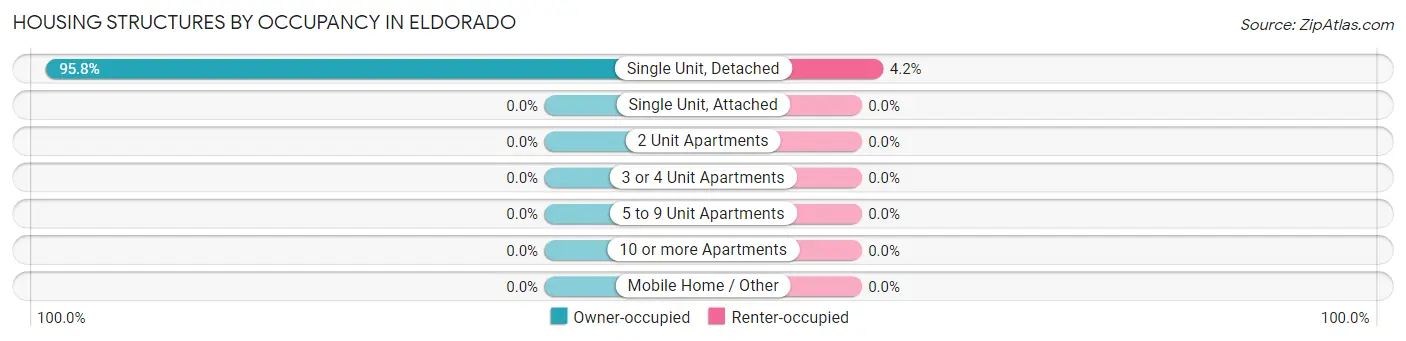
| Structure Type | Owner-occupied | Renter-occupied |
| Single Unit, Detached | 23 (95.8%) | 1 (4.2%) |
| Single Unit, Attached | 0 (0.0%) | 0 (0.0%) |
| 2 Unit Apartments | 0 (0.0%) | 0 (0.0%) |
| 3 or 4 Unit Apartments | 0 (0.0%) | 0 (0.0%) |
| 5 to 9 Unit Apartments | 0 (0.0%) | 0 (0.0%) |
| 10 or more Apartments | 0 (0.0%) | 0 (0.0%) |
| Mobile Home / Other | 0 (0.0%) | 0 (0.0%) |
| Total | 23 (95.8%) | 1 (4.2%) |
Housing Structures by Number of Rooms in Eldorado
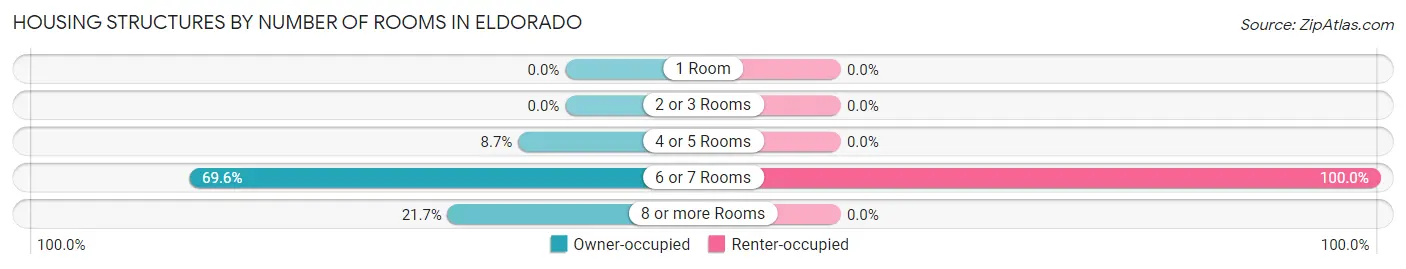
| Number of Rooms | Owner-occupied | Renter-occupied |
| 1 Room | 0 (0.0%) | 0 (0.0%) |
| 2 or 3 Rooms | 0 (0.0%) | 0 (0.0%) |
| 4 or 5 Rooms | 2 (8.7%) | 0 (0.0%) |
| 6 or 7 Rooms | 16 (69.6%) | 1 (100.0%) |
| 8 or more Rooms | 5 (21.7%) | 0 (0.0%) |
| Total | 23 (100.0%) | 1 (100.0%) |
Housing Structure by Heating Type in Eldorado
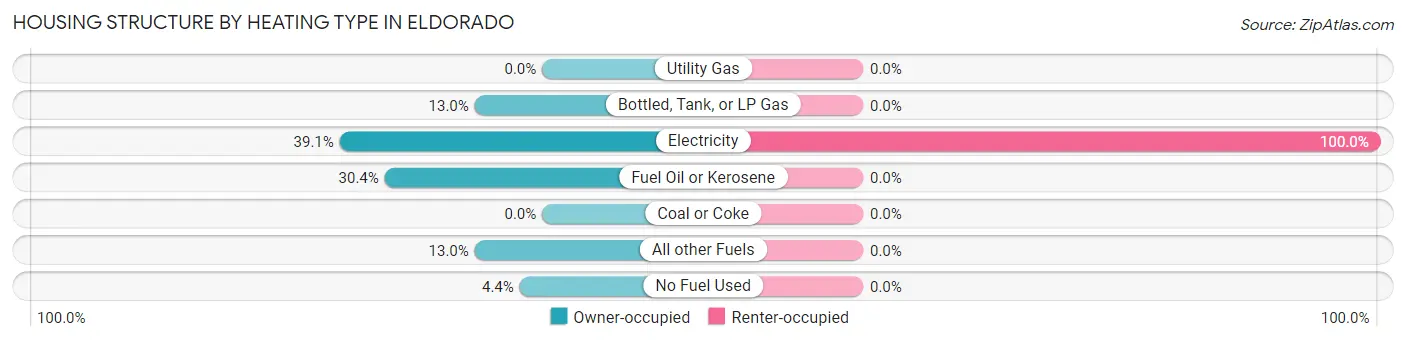
| Heating Type | Owner-occupied | Renter-occupied |
| Utility Gas | 0 (0.0%) | 0 (0.0%) |
| Bottled, Tank, or LP Gas | 3 (13.0%) | 0 (0.0%) |
| Electricity | 9 (39.1%) | 1 (100.0%) |
| Fuel Oil or Kerosene | 7 (30.4%) | 0 (0.0%) |
| Coal or Coke | 0 (0.0%) | 0 (0.0%) |
| All other Fuels | 3 (13.0%) | 0 (0.0%) |
| No Fuel Used | 1 (4.3%) | 0 (0.0%) |
| Total | 23 (100.0%) | 1 (100.0%) |
Household Vehicle Usage in Eldorado
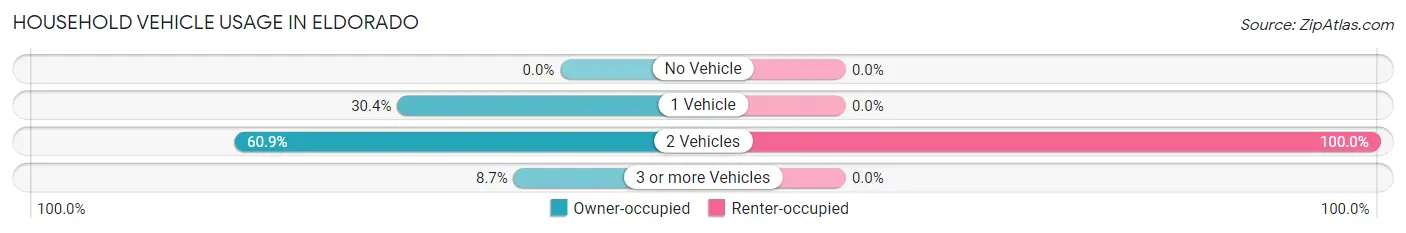
| Vehicles per Household | Owner-occupied | Renter-occupied |
| No Vehicle | 0 (0.0%) | 0 (0.0%) |
| 1 Vehicle | 7 (30.4%) | 0 (0.0%) |
| 2 Vehicles | 14 (60.9%) | 1 (100.0%) |
| 3 or more Vehicles | 2 (8.7%) | 0 (0.0%) |
| Total | 23 (100.0%) | 1 (100.0%) |
Real Estate & Mortgages in Eldorado
Real Estate and Mortgage Overview in Eldorado
| Characteristic | Without Mortgage | With Mortgage |
| Housing Units | 6 | 17 |
| Median Property Value | $162,500 | $141,100 |
| Median Household Income | $28,750 | $0 |
| Monthly Housing Costs | $375 | $0 |
| Real Estate Taxes | $1,250 | $0 |
Property Value by Mortgage Status in Eldorado
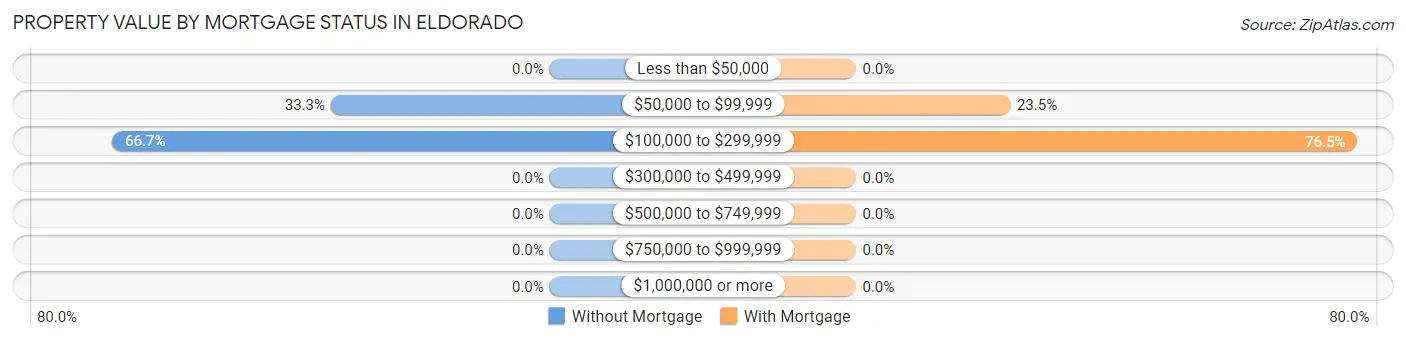
| Property Value | Without Mortgage | With Mortgage |
| Less than $50,000 | 0 (0.0%) | 0 (0.0%) |
| $50,000 to $99,999 | 2 (33.3%) | 4 (23.5%) |
| $100,000 to $299,999 | 4 (66.7%) | 13 (76.5%) |
| $300,000 to $499,999 | 0 (0.0%) | 0 (0.0%) |
| $500,000 to $749,999 | 0 (0.0%) | 0 (0.0%) |
| $750,000 to $999,999 | 0 (0.0%) | 0 (0.0%) |
| $1,000,000 or more | 0 (0.0%) | 0 (0.0%) |
| Total | 6 (100.0%) | 17 (100.0%) |
Household Income by Mortgage Status in Eldorado
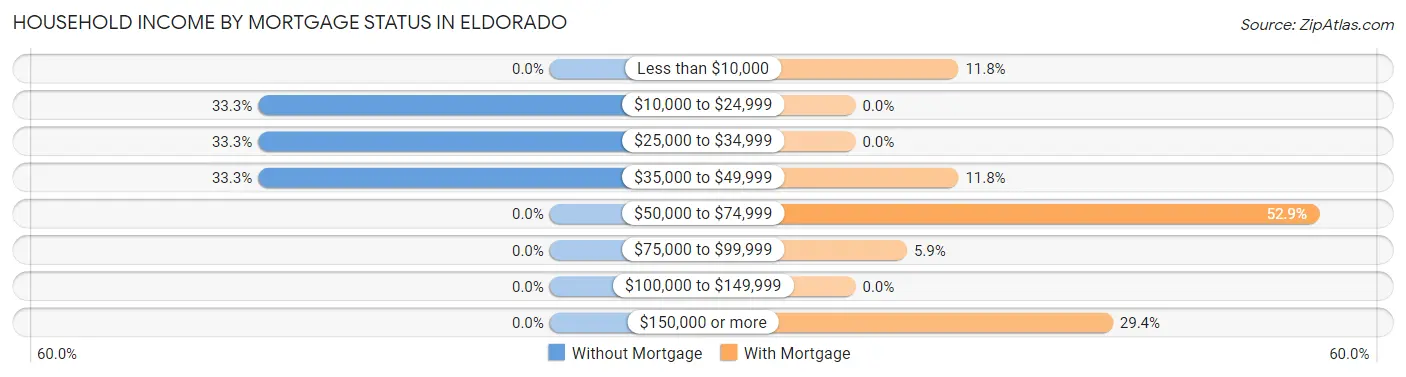
| Household Income | Without Mortgage | With Mortgage |
| Less than $10,000 | 0 (0.0%) | 2 (11.8%) |
| $10,000 to $24,999 | 2 (33.3%) | 0 (0.0%) |
| $25,000 to $34,999 | 2 (33.3%) | 0 (0.0%) |
| $35,000 to $49,999 | 2 (33.3%) | 2 (11.8%) |
| $50,000 to $74,999 | 0 (0.0%) | 9 (52.9%) |
| $75,000 to $99,999 | 0 (0.0%) | 1 (5.9%) |
| $100,000 to $149,999 | 0 (0.0%) | 0 (0.0%) |
| $150,000 or more | 0 (0.0%) | 5 (29.4%) |
| Total | 6 (100.0%) | 17 (100.0%) |
Property Value to Household Income Ratio in Eldorado
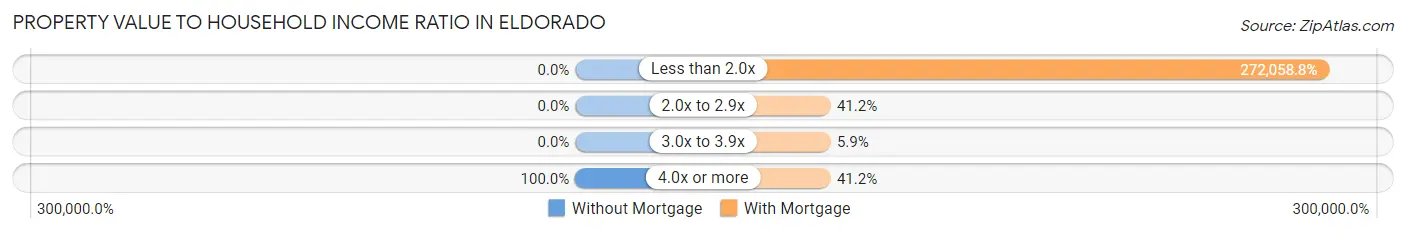
| Value-to-Income Ratio | Without Mortgage | With Mortgage |
| Less than 2.0x | 0 (0.0%) | 46,250 (272,058.8%) |
| 2.0x to 2.9x | 0 (0.0%) | 7 (41.2%) |
| 3.0x to 3.9x | 0 (0.0%) | 1 (5.9%) |
| 4.0x or more | 6 (100.0%) | 7 (41.2%) |
| Total | 6 (100.0%) | 17 (100.0%) |
Real Estate Taxes by Mortgage Status in Eldorado
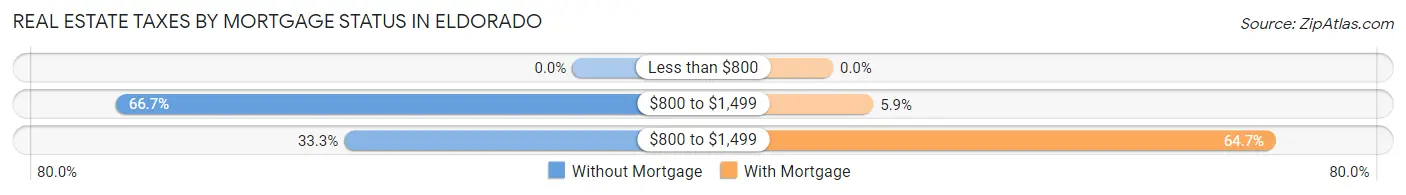
| Property Taxes | Without Mortgage | With Mortgage |
| Less than $800 | 0 (0.0%) | 0 (0.0%) |
| $800 to $1,499 | 4 (66.7%) | 1 (5.9%) |
| $800 to $1,499 | 2 (33.3%) | 11 (64.7%) |
| Total | 6 (100.0%) | 17 (100.0%) |
Health & Disability in Eldorado
Health Insurance Coverage by Age in Eldorado
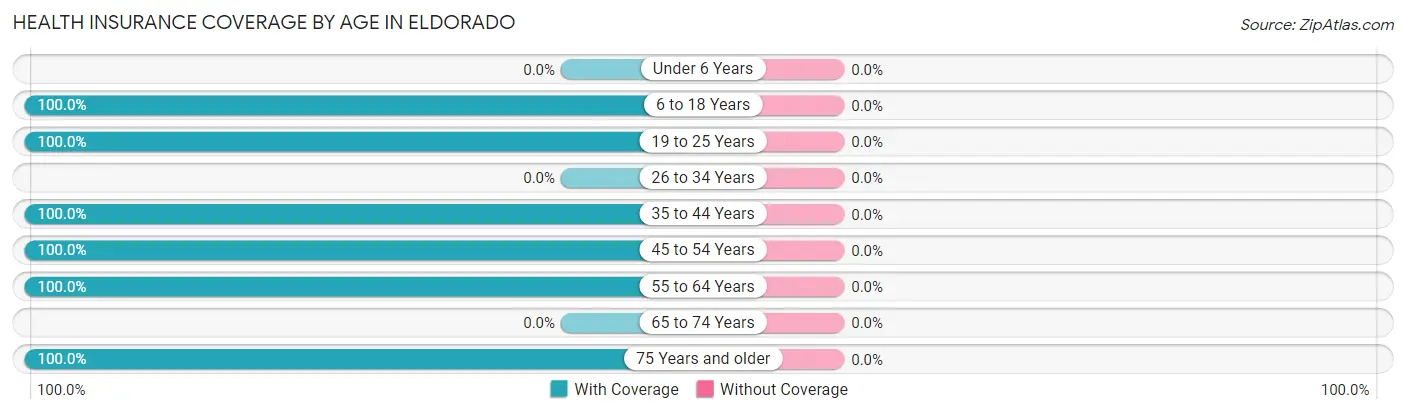
| Age Bracket | With Coverage | Without Coverage |
| Under 6 Years | 0 (0.0%) | 0 (0.0%) |
| 6 to 18 Years | 6 (100.0%) | 0 (0.0%) |
| 19 to 25 Years | 7 (100.0%) | 0 (0.0%) |
| 26 to 34 Years | 0 (0.0%) | 0 (0.0%) |
| 35 to 44 Years | 7 (100.0%) | 0 (0.0%) |
| 45 to 54 Years | 8 (100.0%) | 0 (0.0%) |
| 55 to 64 Years | 16 (100.0%) | 0 (0.0%) |
| 65 to 74 Years | 0 (0.0%) | 0 (0.0%) |
| 75 Years and older | 6 (100.0%) | 0 (0.0%) |
| Total | 50 (100.0%) | 0 (0.0%) |
Health Insurance Coverage by Citizenship Status in Eldorado
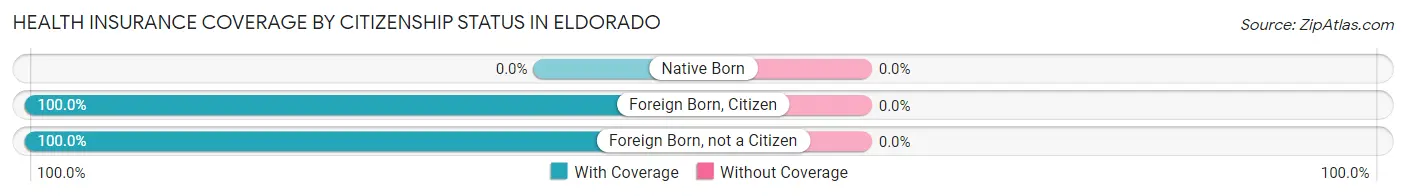
| Citizenship Status | With Coverage | Without Coverage |
| Native Born | 0 (0.0%) | 0 (0.0%) |
| Foreign Born, Citizen | 6 (100.0%) | 0 (0.0%) |
| Foreign Born, not a Citizen | 7 (100.0%) | 0 (0.0%) |
Health Insurance Coverage by Household Income in Eldorado
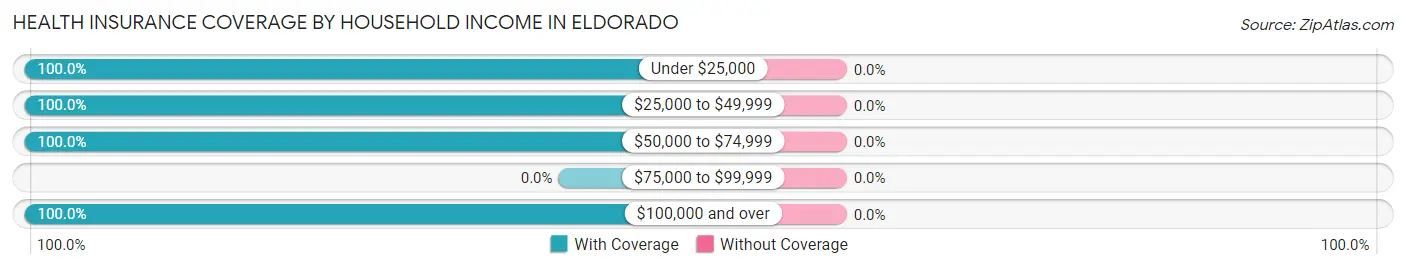
| Household Income | With Coverage | Without Coverage |
| Under $25,000 | 2 (100.0%) | 0 (0.0%) |
| $25,000 to $49,999 | 37 (100.0%) | 0 (0.0%) |
| $50,000 to $74,999 | 2 (100.0%) | 0 (0.0%) |
| $75,000 to $99,999 | 0 (0.0%) | 0 (0.0%) |
| $100,000 and over | 9 (100.0%) | 0 (0.0%) |
Public vs Private Health Insurance Coverage by Age in Eldorado
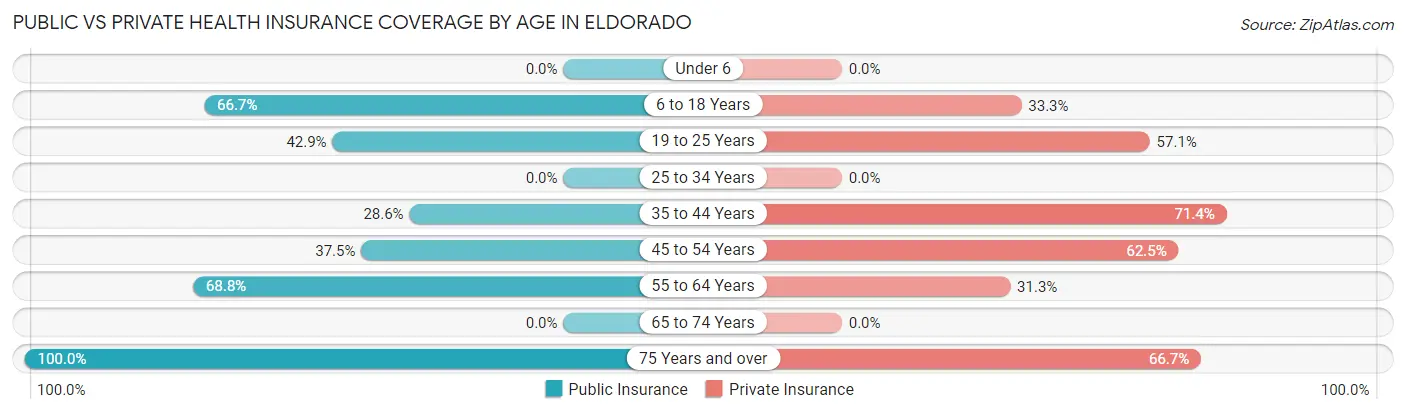
| Age Bracket | Public Insurance | Private Insurance |
| Under 6 | 0 (0.0%) | 0 (0.0%) |
| 6 to 18 Years | 4 (66.7%) | 2 (33.3%) |
| 19 to 25 Years | 3 (42.9%) | 4 (57.1%) |
| 25 to 34 Years | 0 (0.0%) | 0 (0.0%) |
| 35 to 44 Years | 2 (28.6%) | 5 (71.4%) |
| 45 to 54 Years | 3 (37.5%) | 5 (62.5%) |
| 55 to 64 Years | 11 (68.8%) | 5 (31.2%) |
| 65 to 74 Years | 0 (0.0%) | 0 (0.0%) |
| 75 Years and over | 6 (100.0%) | 4 (66.7%) |
| Total | 29 (58.0%) | 25 (50.0%) |
Disability Status by Sex by Age in Eldorado
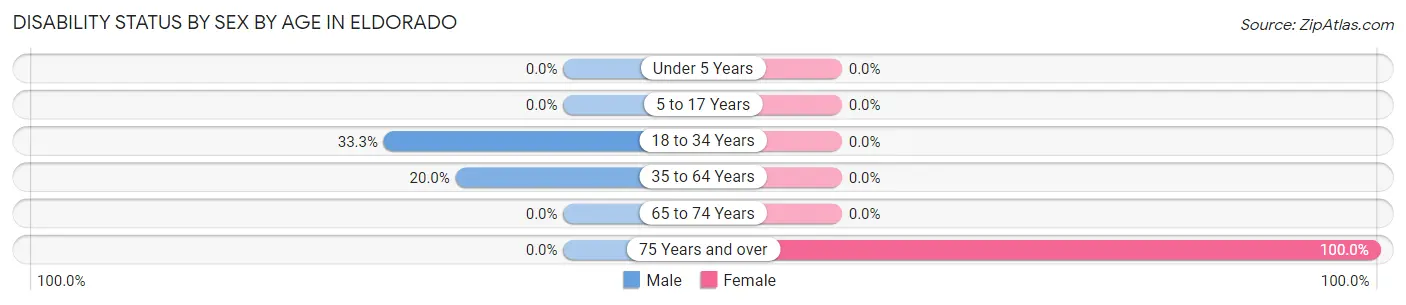
| Age Bracket | Male | Female |
| Under 5 Years | 0 (0.0%) | 0 (0.0%) |
| 5 to 17 Years | 0 (0.0%) | 0 (0.0%) |
| 18 to 34 Years | 2 (33.3%) | 0 (0.0%) |
| 35 to 64 Years | 4 (20.0%) | 0 (0.0%) |
| 65 to 74 Years | 0 (0.0%) | 0 (0.0%) |
| 75 Years and over | 0 (0.0%) | 6 (100.0%) |
Disability Class by Sex by Age in Eldorado
Disability Class: Hearing Difficulty
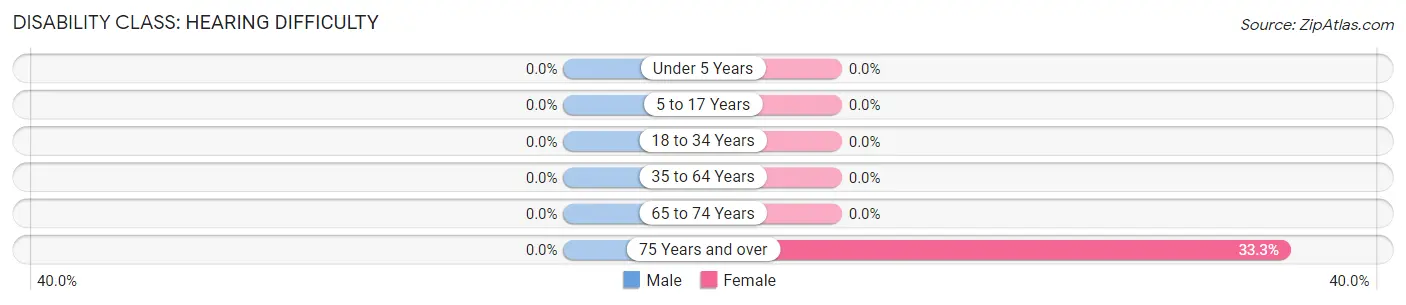
| Age Bracket | Male | Female |
| Under 5 Years | 0 (0.0%) | 0 (0.0%) |
| 5 to 17 Years | 0 (0.0%) | 0 (0.0%) |
| 18 to 34 Years | 0 (0.0%) | 0 (0.0%) |
| 35 to 64 Years | 0 (0.0%) | 0 (0.0%) |
| 65 to 74 Years | 0 (0.0%) | 0 (0.0%) |
| 75 Years and over | 0 (0.0%) | 2 (33.3%) |
Disability Class: Vision Difficulty
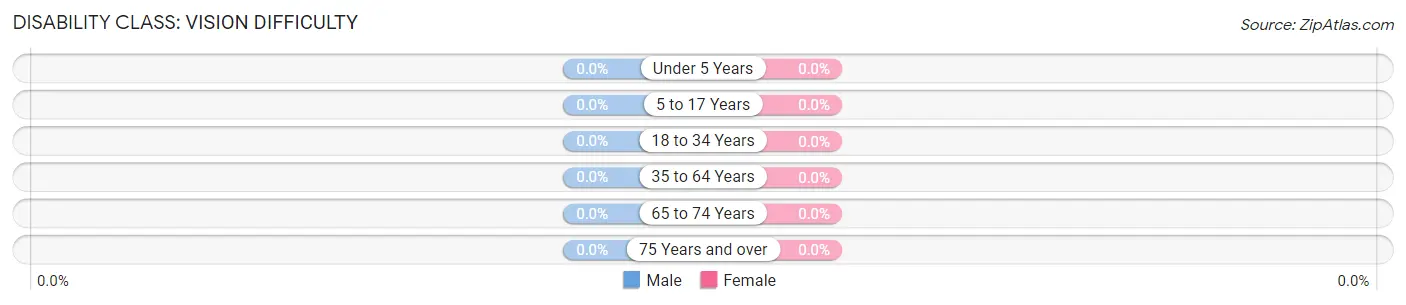
| Age Bracket | Male | Female |
| Under 5 Years | 0 (0.0%) | 0 (0.0%) |
| 5 to 17 Years | 0 (0.0%) | 0 (0.0%) |
| 18 to 34 Years | 0 (0.0%) | 0 (0.0%) |
| 35 to 64 Years | 0 (0.0%) | 0 (0.0%) |
| 65 to 74 Years | 0 (0.0%) | 0 (0.0%) |
| 75 Years and over | 0 (0.0%) | 0 (0.0%) |
Disability Class: Cognitive Difficulty
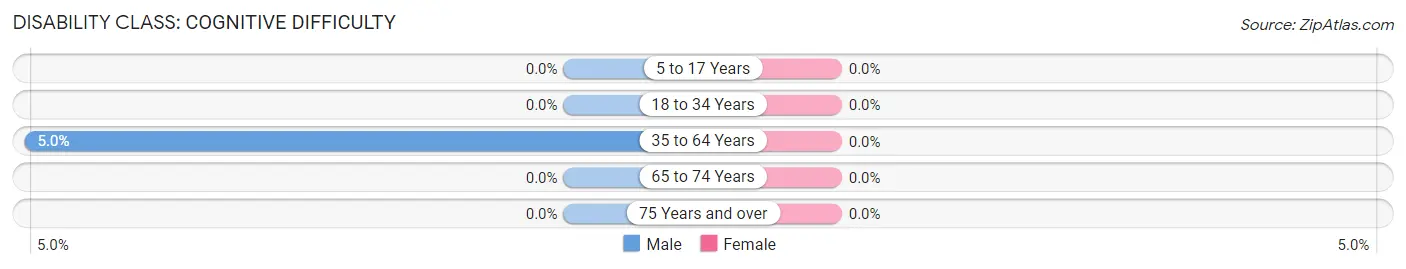
| Age Bracket | Male | Female |
| 5 to 17 Years | 0 (0.0%) | 0 (0.0%) |
| 18 to 34 Years | 0 (0.0%) | 0 (0.0%) |
| 35 to 64 Years | 1 (5.0%) | 0 (0.0%) |
| 65 to 74 Years | 0 (0.0%) | 0 (0.0%) |
| 75 Years and over | 0 (0.0%) | 0 (0.0%) |
Disability Class: Ambulatory Difficulty
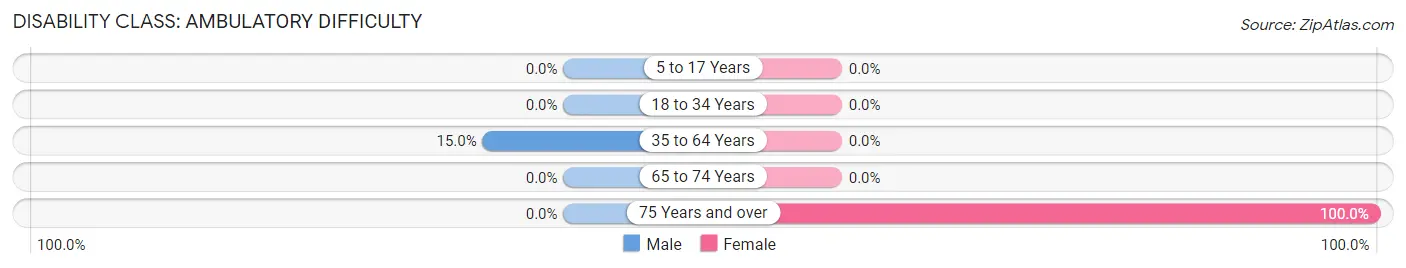
| Age Bracket | Male | Female |
| 5 to 17 Years | 0 (0.0%) | 0 (0.0%) |
| 18 to 34 Years | 0 (0.0%) | 0 (0.0%) |
| 35 to 64 Years | 3 (15.0%) | 0 (0.0%) |
| 65 to 74 Years | 0 (0.0%) | 0 (0.0%) |
| 75 Years and over | 0 (0.0%) | 6 (100.0%) |
Disability Class: Self-Care Difficulty

| Age Bracket | Male | Female |
| 5 to 17 Years | 0 (0.0%) | 0 (0.0%) |
| 18 to 34 Years | 0 (0.0%) | 0 (0.0%) |
| 35 to 64 Years | 3 (15.0%) | 0 (0.0%) |
| 65 to 74 Years | 0 (0.0%) | 0 (0.0%) |
| 75 Years and over | 0 (0.0%) | 0 (0.0%) |
Technology Access in Eldorado
Computing Device Access in Eldorado
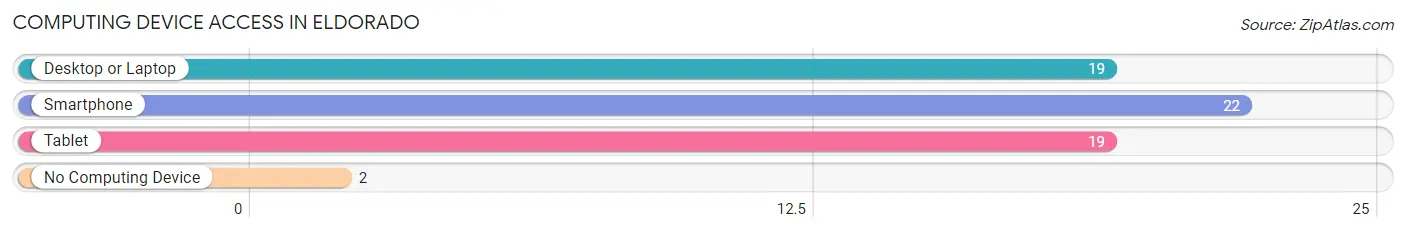
| Device Type | # Households | % Households |
| Desktop or Laptop | 19 | 79.2% |
| Smartphone | 22 | 91.7% |
| Tablet | 19 | 79.2% |
| No Computing Device | 2 | 8.3% |
| Total | 24 | 100.0% |
Internet Access in Eldorado
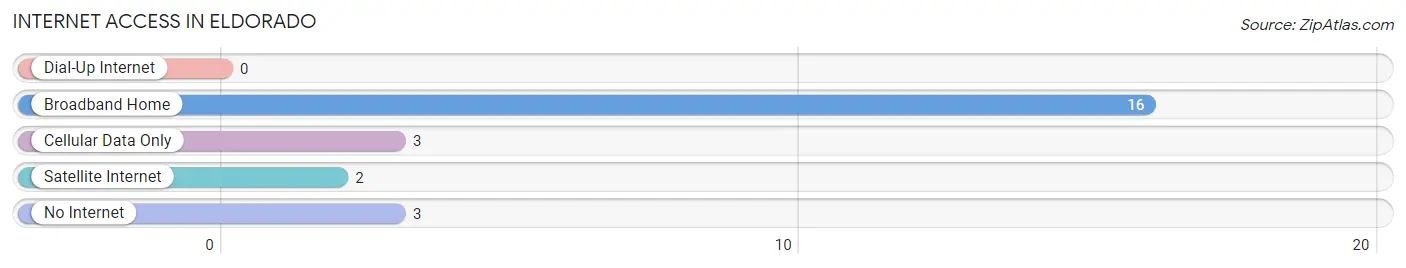
| Internet Type | # Households | % Households |
| Dial-Up Internet | 0 | 0.0% |
| Broadband Home | 16 | 66.7% |
| Cellular Data Only | 3 | 12.5% |
| Satellite Internet | 2 | 8.3% |
| No Internet | 3 | 12.5% |
| Total | 24 | 100.0% |
Eldorado Summary
Eldorado is a small town located in the state of Maryland, United States. It is situated in the northern part of the state, in the county of Montgomery. The town has a population of approximately 1,000 people, and is located about 25 miles northwest of Washington, D.C.
History
Eldorado was founded in 1871 by a group of German immigrants who had settled in the area. The town was named after the mythical city of El Dorado, which was said to be a city of gold. The town was originally a farming community, and the main crops grown were wheat, corn, and tobacco.
In the early 1900s, the town began to grow and develop. The first school was built in 1910, and the first post office was established in 1911. The town also had a general store, a blacksmith shop, and a few other businesses.
In the 1950s, the town began to experience a population boom. This was due to the growth of the nearby city of Washington, D.C., which was experiencing a population boom of its own. As a result, many people moved to Eldorado to take advantage of the town’s proximity to the nation’s capital.
Geography
Eldorado is located in the northern part of Maryland, in the county of Montgomery. The town is situated on the banks of the Potomac River, and is surrounded by rolling hills and forests. The town is located about 25 miles northwest of Washington, D.C.
The climate in Eldorado is temperate, with hot summers and cold winters. The average temperature in the summer is around 80 degrees Fahrenheit, and the average temperature in the winter is around 40 degrees Fahrenheit.
Economy
The economy of Eldorado is largely based on agriculture. The town is home to several farms, which produce a variety of crops, including wheat, corn, and tobacco. The town also has a few small businesses, such as a general store and a blacksmith shop.
Demographics
As of the 2010 census, the population of Eldorado was 1,000 people. The racial makeup of the town was 94.2% White, 2.2% African American, 0.7% Asian, 0.3% Native American, and 2.6% from other races. The median household income was $50,000, and the median age was 40 years.
Conclusion
Eldorado is a small town located in the northern part of Maryland, in the county of Montgomery. The town has a population of approximately 1,000 people, and is located about 25 miles northwest of Washington, D.C. The town was founded in 1871 by a group of German immigrants, and has since grown and developed into a thriving agricultural community. The economy of Eldorado is largely based on agriculture, and the town is home to several farms, which produce a variety of crops. The racial makeup of the town is 94.2% White, 2.2% African American, 0.7% Asian, 0.3% Native American, and 2.6% from other races. The median household income was $50,000, and the median age was 40 years.
Common Questions
What is the Total Population of Eldorado?
Total Population of Eldorado is 50.
What is the Total Male Population of Eldorado?
Total Male Population of Eldorado is 26.
What is the Total Female Population of Eldorado?
Total Female Population of Eldorado is 24.
What is the Ratio of Males per 100 Females in Eldorado?
There are 108.33 Males per 100 Females in Eldorado.
What is the Ratio of Females per 100 Males in Eldorado?
There are 92.31 Females per 100 Males in Eldorado.
What is the Median Population Age in Eldorado?
Median Population Age in Eldorado is 47.0 Years.
What is the Average Family Size in Eldorado
Average Family Size in Eldorado is 2.8 People.
What is the Average Household Size in Eldorado
Average Household Size in Eldorado is 2.1 People.
What is Per Capita Income in Eldorado?
Per Capita income in Eldorado is $31,278.
What is the Median Family Income in Eldorado?
Median Family Income in Eldorado is $45,750.
What is the Median Household income in Eldorado?
Median Household Income in Eldorado is $45,500.
What is Inequality or Gini Index in Eldorado?
Inequality or Gini Index in Eldorado is 0.34.
How Large is the Labor Force in Eldorado?
There are 25 People in the Labor Forcein in Eldorado.
What is the Percentage of People in the Labor Force in Eldorado?
54.3% of People are in the Labor Force in Eldorado.
What is the Unemployment Rate in Eldorado?
Unemployment Rate in Eldorado is 8.0%.