Crellin, MD
Crellin Map
Crellin Overview
194
TOTAL POPULATION
77
MALE POPULATION
117
FEMALE POPULATION
65.81
MALES / 100 FEMALES
151.95
FEMALES / 100 MALES
45.3
MEDIAN AGE
3.5
AVG FAMILY SIZE
2.7
AVG HOUSEHOLD SIZE
$44,105
PER CAPITA INCOME
$174,375
AVG FAMILY INCOME
0.36
INEQUALITY / GINI INDEX
113
LABOR FORCE [ PEOPLE ]
72.9%
PERCENT IN LABOR FORCE
Race in Crellin
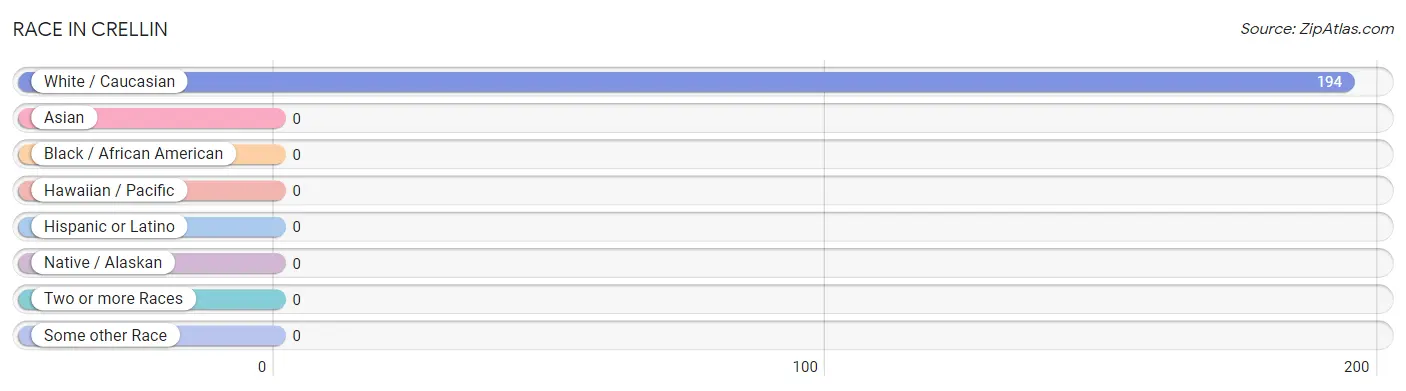
The most populous races in Crellin are , and White / Caucasian (194 | 100.0%).
| Race | # Population | % Population |
| Asian | 0 | 0.0% |
| Black / African American | 0 | 0.0% |
| Hawaiian / Pacific | 0 | 0.0% |
| Hispanic or Latino | 0 | 0.0% |
| Native / Alaskan | 0 | 0.0% |
| White / Caucasian | 194 | 100.0% |
| Two or more Races | 0 | 0.0% |
| Some other Race | 0 | 0.0% |
| Total | 194 | 100.0% |
Ancestry in Crellin
The most populous ancestries reported in Crellin are , and American (8 | 4.1%), together accounting for 4.1% of all Crellin residents.

| Ancestry | # Population | % Population |
| American | 8 | 4.1% | View All 1 Rows |
Immigrants in Crellin

| Immigration Origin | # Population | % Population | View All 0 Rows |
Sex and Age in Crellin
Sex and Age in Crellin
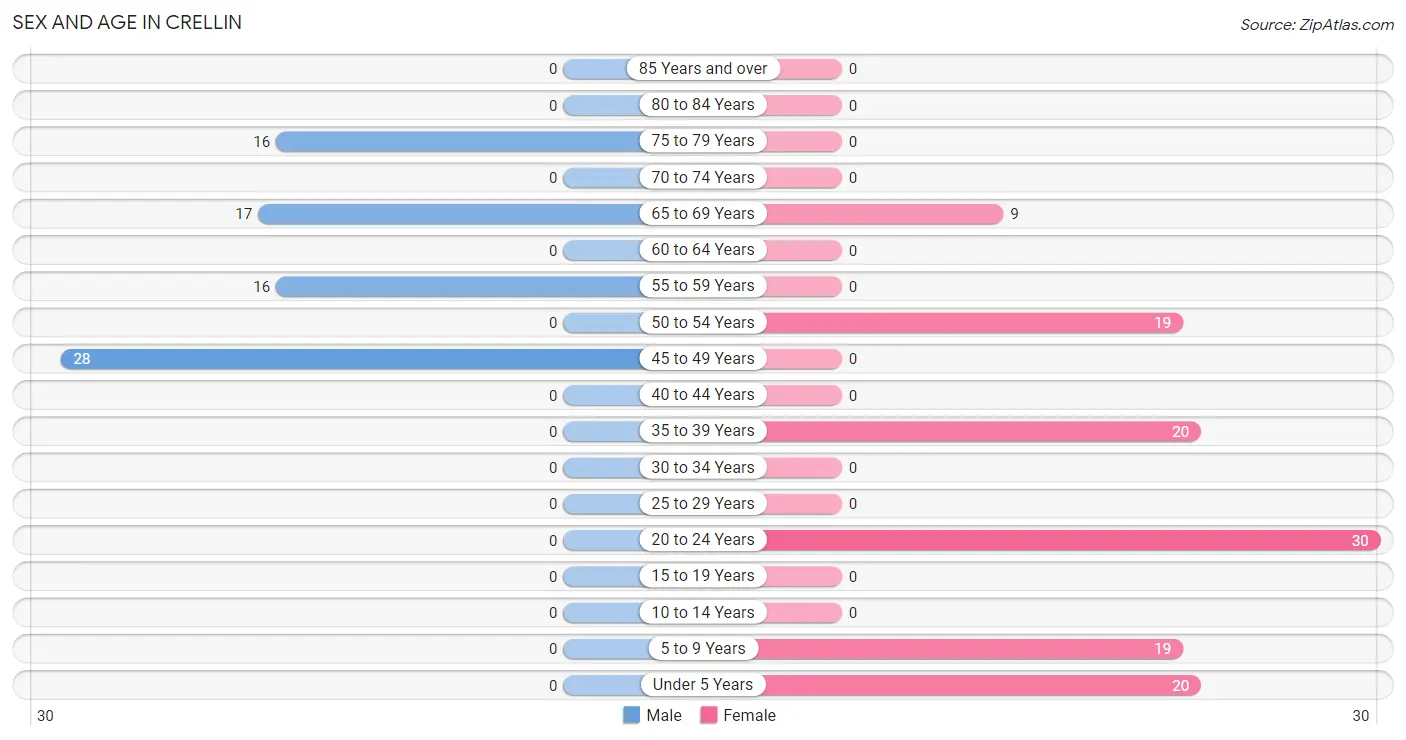
The most populous age groups in Crellin are 45 to 49 Years (28 | 36.4%) for men and 20 to 24 Years (30 | 25.6%) for women.
| Age Bracket | Male | Female |
| Under 5 Years | 0 (0.0%) | 20 (17.1%) |
| 5 to 9 Years | 0 (0.0%) | 19 (16.2%) |
| 10 to 14 Years | 0 (0.0%) | 0 (0.0%) |
| 15 to 19 Years | 0 (0.0%) | 0 (0.0%) |
| 20 to 24 Years | 0 (0.0%) | 30 (25.6%) |
| 25 to 29 Years | 0 (0.0%) | 0 (0.0%) |
| 30 to 34 Years | 0 (0.0%) | 0 (0.0%) |
| 35 to 39 Years | 0 (0.0%) | 20 (17.1%) |
| 40 to 44 Years | 0 (0.0%) | 0 (0.0%) |
| 45 to 49 Years | 28 (36.4%) | 0 (0.0%) |
| 50 to 54 Years | 0 (0.0%) | 19 (16.2%) |
| 55 to 59 Years | 16 (20.8%) | 0 (0.0%) |
| 60 to 64 Years | 0 (0.0%) | 0 (0.0%) |
| 65 to 69 Years | 17 (22.1%) | 9 (7.7%) |
| 70 to 74 Years | 0 (0.0%) | 0 (0.0%) |
| 75 to 79 Years | 16 (20.8%) | 0 (0.0%) |
| 80 to 84 Years | 0 (0.0%) | 0 (0.0%) |
| 85 Years and over | 0 (0.0%) | 0 (0.0%) |
| Total | 77 (100.0%) | 117 (100.0%) |
Families and Households in Crellin
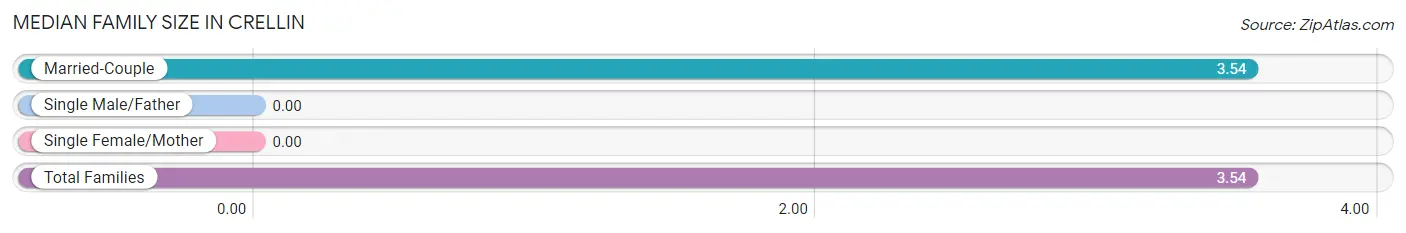
Median Family Size in Crellin
| Family Type | # Families | Family Size |
| Married-Couple | 48 (100.0%) | 3.54 |
| Single Male/Father | 0 (0.0%) | - |
| Single Female/Mother | 0 (0.0%) | - |
| Total Families | 48 (100.0%) | 3.54 |
Median Household Size in Crellin
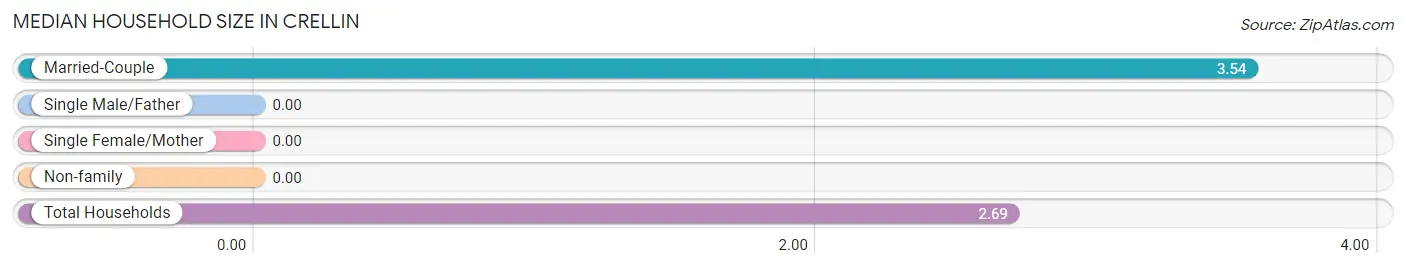
| Household Type | # Households | Household Size |
| Married-Couple | 48 (66.7%) | 3.54 |
| Single Male/Father | 0 (0.0%) | - |
| Single Female/Mother | 0 (0.0%) | - |
| Non-family | 24 (33.3%) | - |
| Total Households | 72 (100.0%) | 2.69 |
Household Size by Marriage Status in Crellin
Out of a total of 72 households in Crellin, 48 (66.7%) are family households, while 24 (33.3%) are nonfamily households. The most numerous type of family households are 4-person households, comprising 20, and the most common type of nonfamily households are 1-person households, comprising 24.
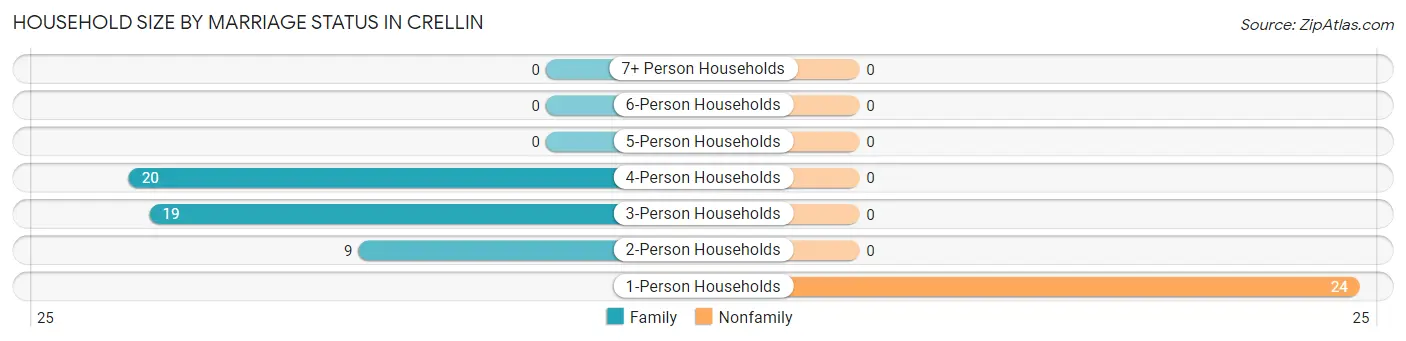
| Household Size | Family Households | Nonfamily Households |
| 1-Person Households | - | 24 (33.3%) |
| 2-Person Households | 9 (12.5%) | 0 (0.0%) |
| 3-Person Households | 19 (26.4%) | 0 (0.0%) |
| 4-Person Households | 20 (27.8%) | 0 (0.0%) |
| 5-Person Households | 0 (0.0%) | 0 (0.0%) |
| 6-Person Households | 0 (0.0%) | 0 (0.0%) |
| 7+ Person Households | 0 (0.0%) | 0 (0.0%) |
| Total | 48 (66.7%) | 24 (33.3%) |
Female Fertility in Crellin
Fertility by Age in Crellin
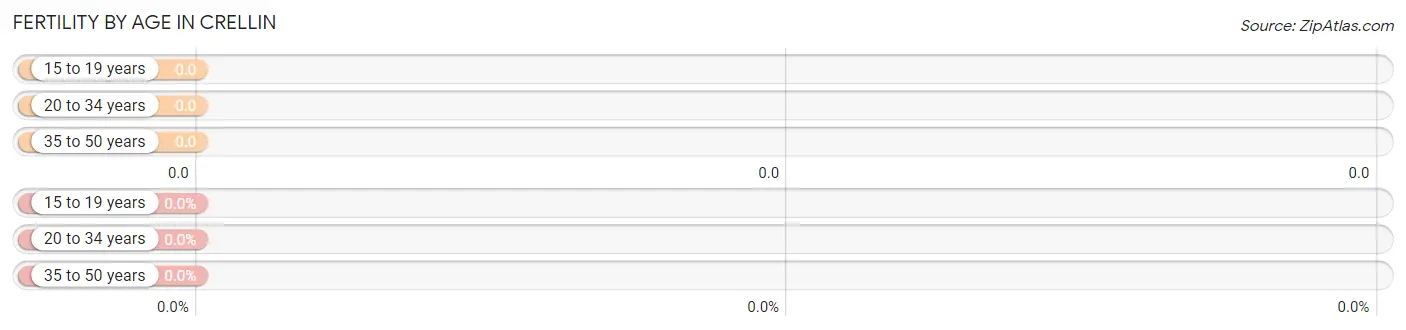
| Age Bracket | Women with Births | Births / 1,000 Women |
| 15 to 19 years | 0 (0.0%) | 0.0 |
| 20 to 34 years | 0 (0.0%) | 0.0 |
| 35 to 50 years | 0 (0.0%) | 0.0 |
| Total | 0 (0.0%) | 0.0 |
Fertility by Age by Marriage Status in Crellin
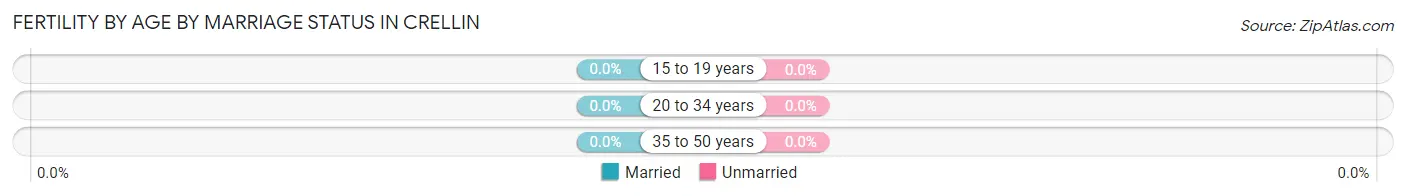
| Age Bracket | Married | Unmarried |
| 15 to 19 years | 0 (0.0%) | 0 (0.0%) |
| 20 to 34 years | 0 (0.0%) | 0 (0.0%) |
| 35 to 50 years | 0 (0.0%) | 0 (0.0%) |
| Total | 0 (0.0%) | 0 (0.0%) |
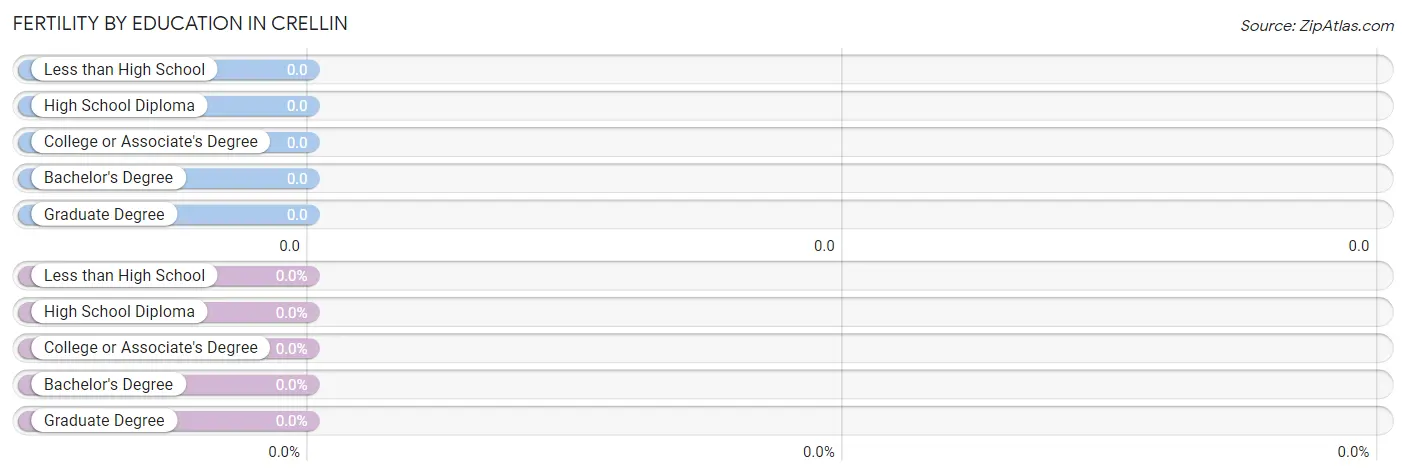
Fertility by Education in Crellin
| Educational Attainment | Women with Births | Births / 1,000 Women |
| Less than High School | 0 (0.0%) | 0.0 |
| High School Diploma | 0 (0.0%) | 0.0 |
| College or Associate's Degree | 0 (0.0%) | 0.0 |
| Bachelor's Degree | 0 (0.0%) | 0.0 |
| Graduate Degree | 0 (0.0%) | 0.0 |
| Total | 0 (0.0%) | 0.0 |
Fertility by Education by Marriage Status in Crellin
| Educational Attainment | Married | Unmarried |
| Less than High School | 0 (0.0%) | 0 (0.0%) |
| High School Diploma | 0 (0.0%) | 0 (0.0%) |
| College or Associate's Degree | 0 (0.0%) | 0 (0.0%) |
| Bachelor's Degree | 0 (0.0%) | 0 (0.0%) |
| Graduate Degree | 0 (0.0%) | 0 (0.0%) |
| Total | 0 (0.0%) | 0 (0.0%) |
Income in Crellin
Income Overview in Crellin
| Characteristic | Number | Measure |
| Per Capita Income | 194 | $44,105 |
| Median Family Income | 48 | $174,375 |
| Mean Family Income | 48 | $154,181 |
| Median Household Income | 72 | $0 |
| Mean Household Income | 72 | $115,378 |
| Income Deficit | 48 | $0 |
| Wage / Income Gap (%) | 194 | 0.00% |
| Wage / Income Gap ($) | 194 | 100.00¢ per $1 |
| Gini / Inequality Index | 194 | 0.36 |
Earnings by Sex in Crellin
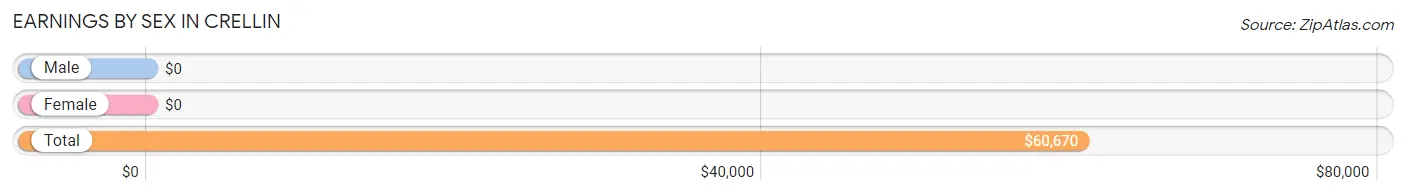
| Sex | Number | Average Earnings |
| Male | 44 (38.9%) | $0 |
| Female | 69 (61.1%) | $0 |
| Total | 113 (100.0%) | $60,670 |
Earnings by Sex by Income Bracket in Crellin
The most common earnings brackets in Crellin are $55,000 to $64,999 for men (28 | 63.6%) and $12,500 to $14,999 for women (30 | 43.5%).
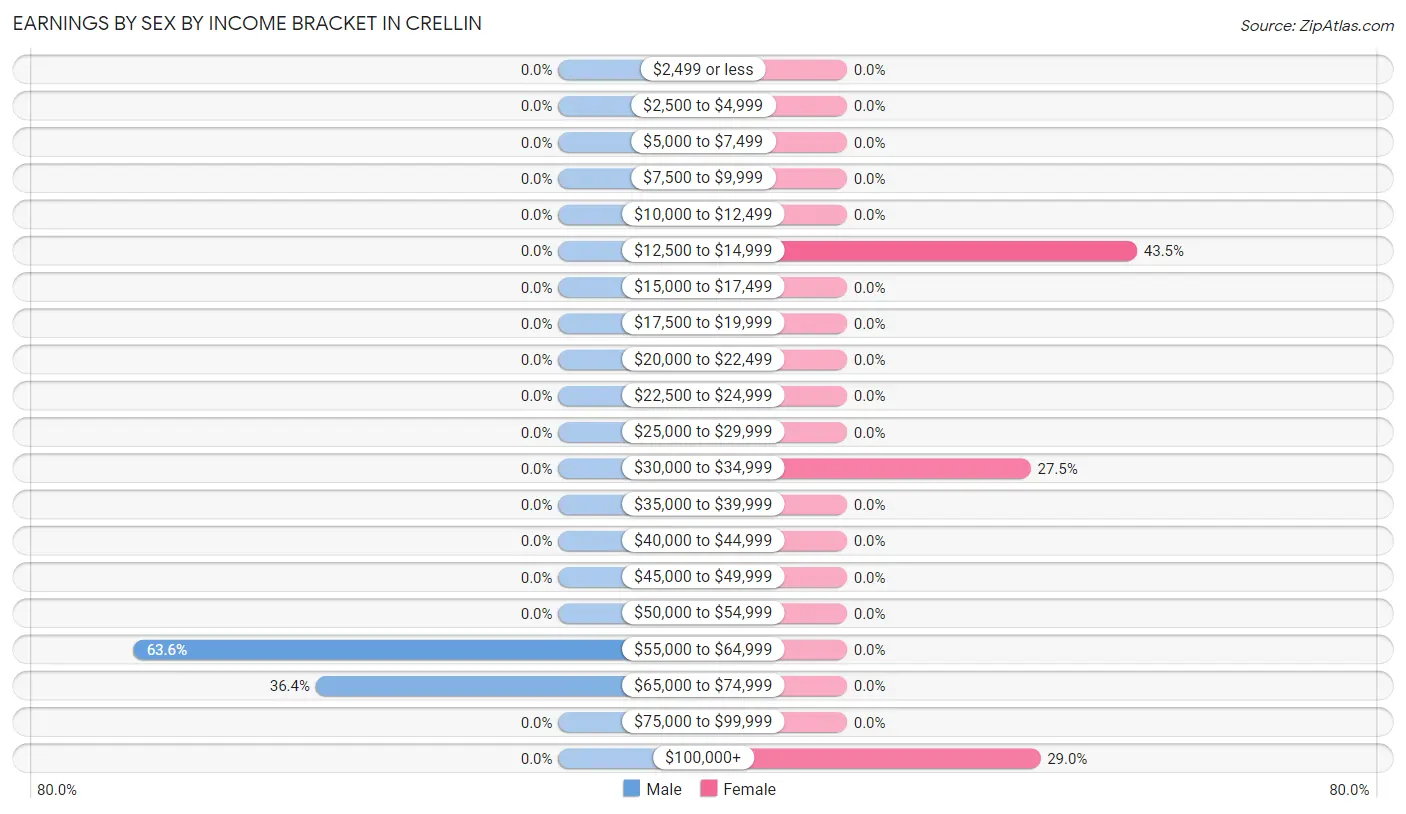
| Income | Male | Female |
| $2,499 or less | 0 (0.0%) | 0 (0.0%) |
| $2,500 to $4,999 | 0 (0.0%) | 0 (0.0%) |
| $5,000 to $7,499 | 0 (0.0%) | 0 (0.0%) |
| $7,500 to $9,999 | 0 (0.0%) | 0 (0.0%) |
| $10,000 to $12,499 | 0 (0.0%) | 0 (0.0%) |
| $12,500 to $14,999 | 0 (0.0%) | 30 (43.5%) |
| $15,000 to $17,499 | 0 (0.0%) | 0 (0.0%) |
| $17,500 to $19,999 | 0 (0.0%) | 0 (0.0%) |
| $20,000 to $22,499 | 0 (0.0%) | 0 (0.0%) |
| $22,500 to $24,999 | 0 (0.0%) | 0 (0.0%) |
| $25,000 to $29,999 | 0 (0.0%) | 0 (0.0%) |
| $30,000 to $34,999 | 0 (0.0%) | 19 (27.5%) |
| $35,000 to $39,999 | 0 (0.0%) | 0 (0.0%) |
| $40,000 to $44,999 | 0 (0.0%) | 0 (0.0%) |
| $45,000 to $49,999 | 0 (0.0%) | 0 (0.0%) |
| $50,000 to $54,999 | 0 (0.0%) | 0 (0.0%) |
| $55,000 to $64,999 | 28 (63.6%) | 0 (0.0%) |
| $65,000 to $74,999 | 16 (36.4%) | 0 (0.0%) |
| $75,000 to $99,999 | 0 (0.0%) | 0 (0.0%) |
| $100,000+ | 0 (0.0%) | 20 (29.0%) |
| Total | 44 (100.0%) | 69 (100.0%) |
Earnings by Sex by Educational Attainment in Crellin
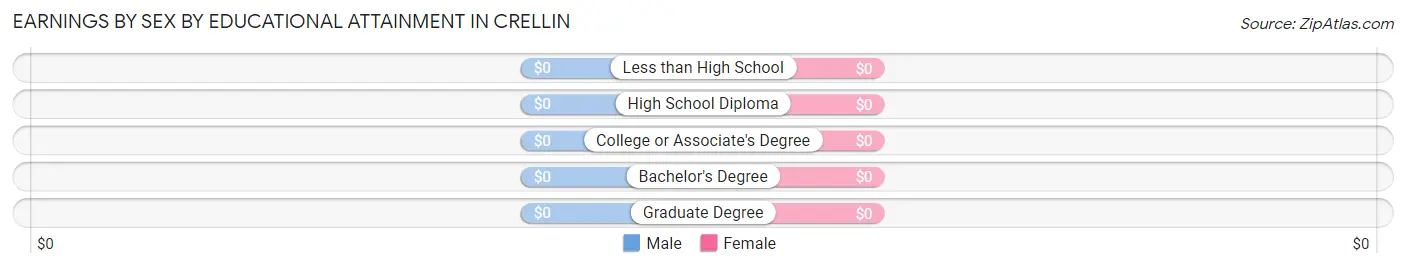
| Educational Attainment | Male Income | Female Income |
| Less than High School | - | - |
| High School Diploma | - | - |
| College or Associate's Degree | - | - |
| Bachelor's Degree | - | - |
| Graduate Degree | - | - |
| Total | - | - |
Family Income in Crellin
Family Income Brackets in Crellin
According to the Crellin family income data, there are 39 families falling into the $150,000 to $199,999 income range, which is the most common income bracket and makes up 81.2% of all families.
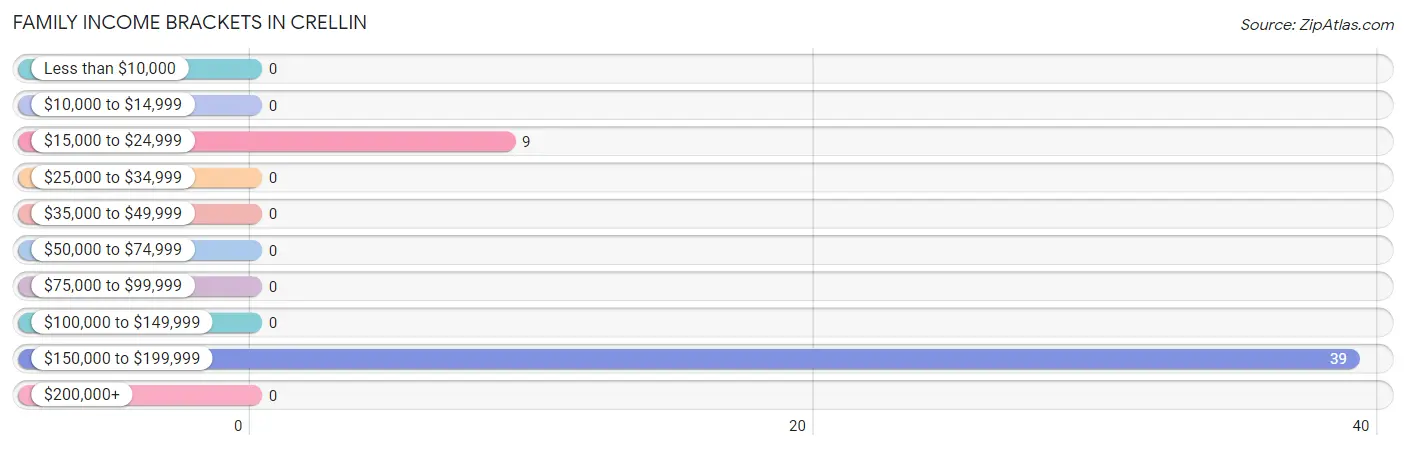
| Income Bracket | # Families | % Families |
| Less than $10,000 | 0 | 0.0% |
| $10,000 to $14,999 | 0 | 0.0% |
| $15,000 to $24,999 | 9 | 18.8% |
| $25,000 to $34,999 | 0 | 0.0% |
| $35,000 to $49,999 | 0 | 0.0% |
| $50,000 to $74,999 | 0 | 0.0% |
| $75,000 to $99,999 | 0 | 0.0% |
| $100,000 to $149,999 | 0 | 0.0% |
| $150,000 to $199,999 | 39 | 81.3% |
| $200,000+ | 0 | 0.0% |
Family Income by Famaliy Size in Crellin
| Income Bracket | # Families | Median Income |
| 2-Person Families | 9 (18.8%) | $0 |
| 3-Person Families | 19 (39.6%) | $0 |
| 4-Person Families | 20 (41.7%) | $0 |
| 5-Person Families | 0 (0.0%) | $0 |
| 6-Person Families | 0 (0.0%) | $0 |
| 7+ Person Families | 0 (0.0%) | $0 |
| Total | 48 (100.0%) | $174,375 |
Family Income by Number of Earners in Crellin
| Number of Earners | # Families | Median Income |
| No Earners | 9 (18.8%) | $0 |
| 1 Earner | 0 (0.0%) | $0 |
| 2 Earners | 20 (41.7%) | $0 |
| 3+ Earners | 19 (39.6%) | $0 |
| Total | 48 (100.0%) | $174,375 |
Household Income in Crellin
Household Income Brackets in Crellin
With 39 households falling in the category, the $150,000 to $199,999 income range is the most frequent in Crellin, accounting for 54.2% of all households.
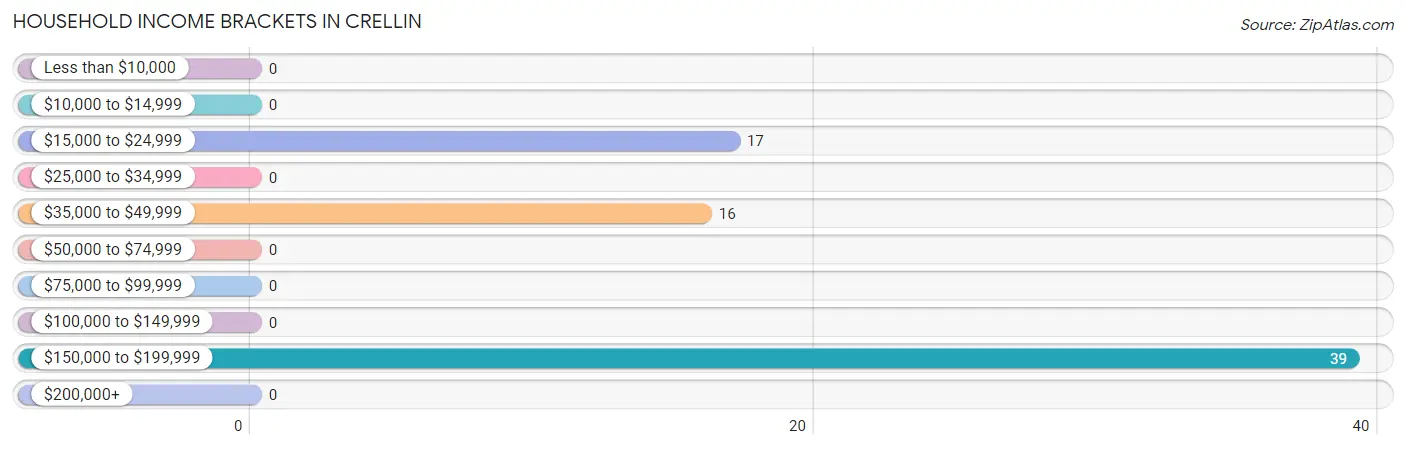
| Income Bracket | # Households | % Households |
| Less than $10,000 | 0 | 0.0% |
| $10,000 to $14,999 | 0 | 0.0% |
| $15,000 to $24,999 | 17 | 23.6% |
| $25,000 to $34,999 | 0 | 0.0% |
| $35,000 to $49,999 | 16 | 22.2% |
| $50,000 to $74,999 | 0 | 0.0% |
| $75,000 to $99,999 | 0 | 0.0% |
| $100,000 to $149,999 | 0 | 0.0% |
| $150,000 to $199,999 | 39 | 54.2% |
| $200,000+ | 0 | 0.0% |
Household Income by Householder Age in Crellin
| Income Bracket | # Households | Median Income |
| 15 to 24 Years | 0 (0.0%) | $0 |
| 25 to 44 Years | 20 (27.8%) | $0 |
| 45 to 64 Years | 19 (26.4%) | $0 |
| 65+ Years | 33 (45.8%) | $0 |
| Total | 72 (100.0%) | $0 |
Poverty in Crellin
Income Below Poverty by Sex and Age in Crellin
With 11.7% poverty level for males and 7.7% for females among the residents of Crellin, 65 to 74 year old males and 65 to 74 year old females are the most vulnerable to poverty, with 9 males (52.9%) and 9 females (100.0%) in their respective age groups living below the poverty level.
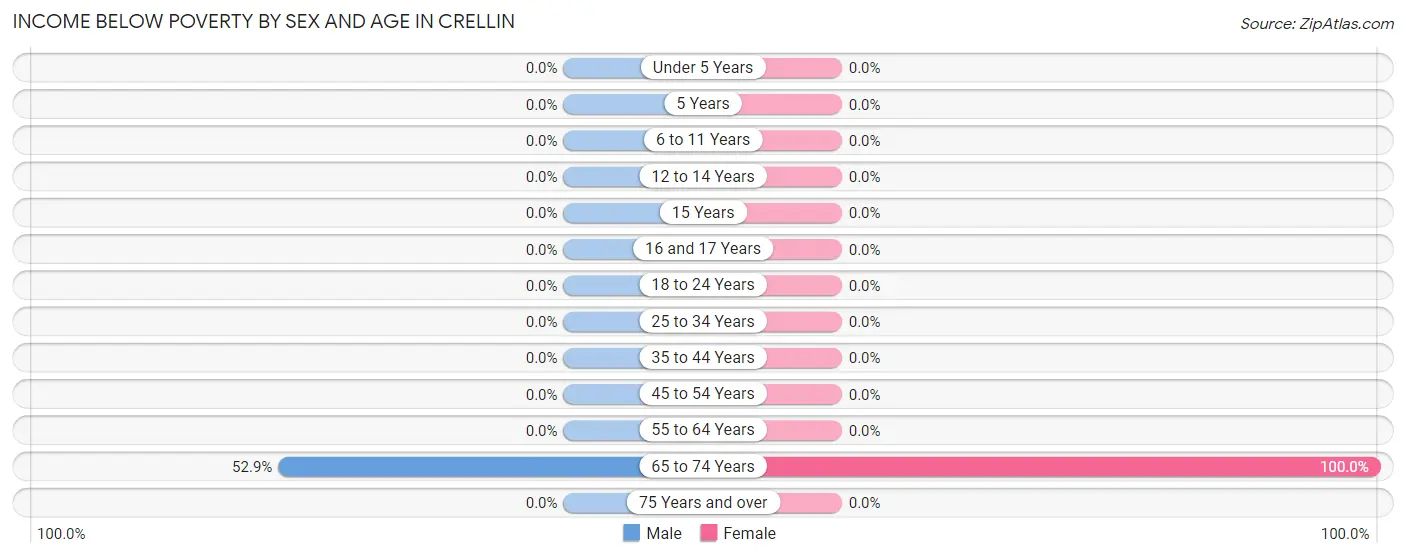
| Age Bracket | Male | Female |
| Under 5 Years | 0 (0.0%) | 0 (0.0%) |
| 5 Years | 0 (0.0%) | 0 (0.0%) |
| 6 to 11 Years | 0 (0.0%) | 0 (0.0%) |
| 12 to 14 Years | 0 (0.0%) | 0 (0.0%) |
| 15 Years | 0 (0.0%) | 0 (0.0%) |
| 16 and 17 Years | 0 (0.0%) | 0 (0.0%) |
| 18 to 24 Years | 0 (0.0%) | 0 (0.0%) |
| 25 to 34 Years | 0 (0.0%) | 0 (0.0%) |
| 35 to 44 Years | 0 (0.0%) | 0 (0.0%) |
| 45 to 54 Years | 0 (0.0%) | 0 (0.0%) |
| 55 to 64 Years | 0 (0.0%) | 0 (0.0%) |
| 65 to 74 Years | 9 (52.9%) | 9 (100.0%) |
| 75 Years and over | 0 (0.0%) | 0 (0.0%) |
| Total | 9 (11.7%) | 9 (7.7%) |
Income Above Poverty by Sex and Age in Crellin
According to the poverty statistics in Crellin, males aged 45 to 54 years and females aged under 5 years are the age groups that are most secure financially, with 100.0% of males and 100.0% of females in these age groups living above the poverty line.
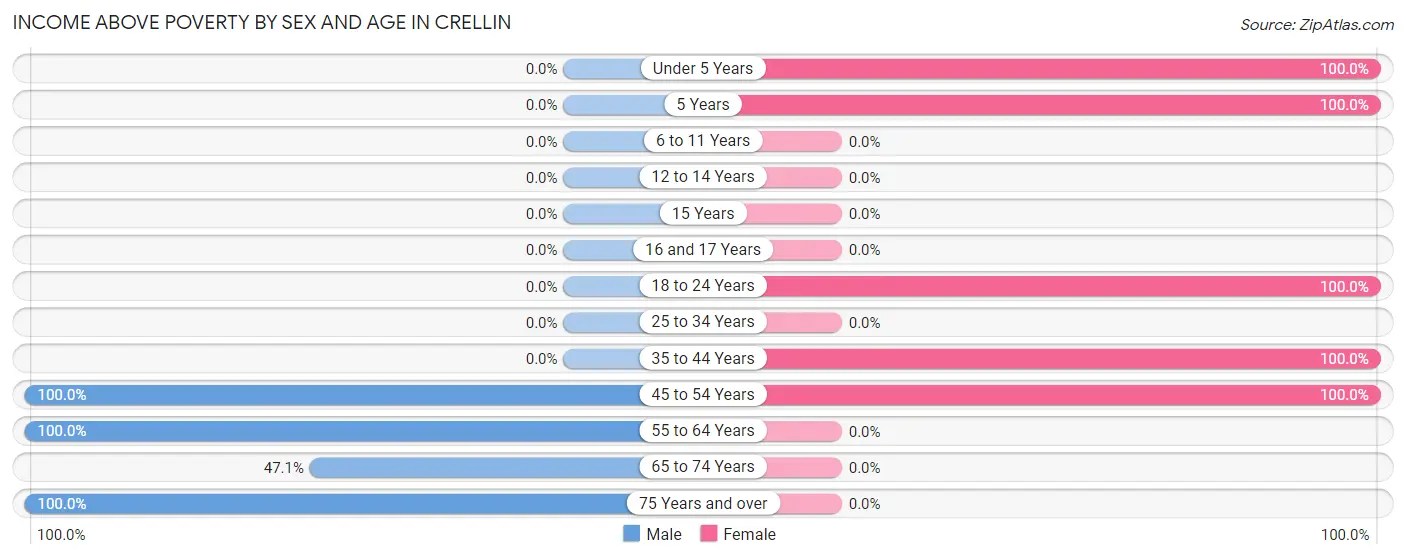
| Age Bracket | Male | Female |
| Under 5 Years | 0 (0.0%) | 20 (100.0%) |
| 5 Years | 0 (0.0%) | 19 (100.0%) |
| 6 to 11 Years | 0 (0.0%) | 0 (0.0%) |
| 12 to 14 Years | 0 (0.0%) | 0 (0.0%) |
| 15 Years | 0 (0.0%) | 0 (0.0%) |
| 16 and 17 Years | 0 (0.0%) | 0 (0.0%) |
| 18 to 24 Years | 0 (0.0%) | 30 (100.0%) |
| 25 to 34 Years | 0 (0.0%) | 0 (0.0%) |
| 35 to 44 Years | 0 (0.0%) | 20 (100.0%) |
| 45 to 54 Years | 28 (100.0%) | 19 (100.0%) |
| 55 to 64 Years | 16 (100.0%) | 0 (0.0%) |
| 65 to 74 Years | 8 (47.1%) | 0 (0.0%) |
| 75 Years and over | 16 (100.0%) | 0 (0.0%) |
| Total | 68 (88.3%) | 108 (92.3%) |
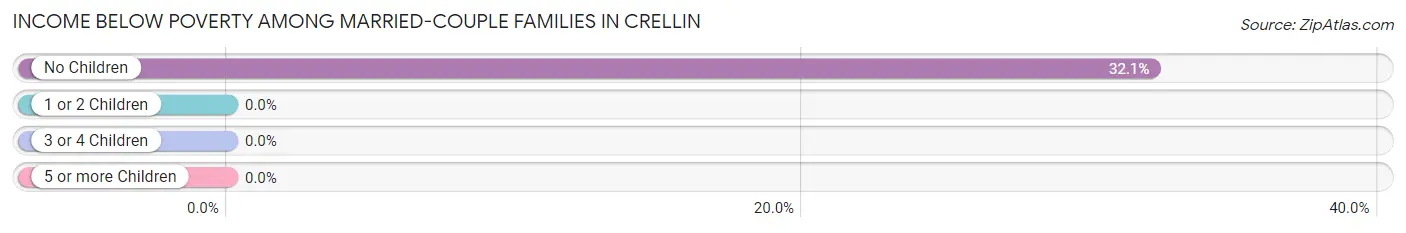
Income Below Poverty Among Married-Couple Families in Crellin
The poverty statistics for married-couple families in Crellin show that 18.8% or 9 of the total 48 families live below the poverty line. Families with no children have the highest poverty rate of 32.1%, comprising of 9 families. On the other hand, families with 1 or 2 children have the lowest poverty rate of 0.0%, which includes 0 families.
| Children | Above Poverty | Below Poverty |
| No Children | 19 (67.9%) | 9 (32.1%) |
| 1 or 2 Children | 20 (100.0%) | 0 (0.0%) |
| 3 or 4 Children | 0 (0.0%) | 0 (0.0%) |
| 5 or more Children | 0 (0.0%) | 0 (0.0%) |
| Total | 39 (81.2%) | 9 (18.8%) |
Income Below Poverty Among Single-Parent Households in Crellin
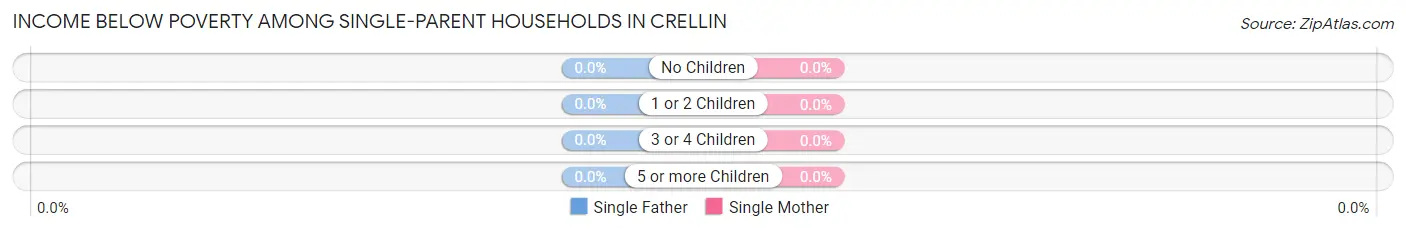
| Children | Single Father | Single Mother |
| No Children | 0 (0.0%) | 0 (0.0%) |
| 1 or 2 Children | 0 (0.0%) | 0 (0.0%) |
| 3 or 4 Children | 0 (0.0%) | 0 (0.0%) |
| 5 or more Children | 0 (0.0%) | 0 (0.0%) |
| Total | 0 (0.0%) | 0 (0.0%) |
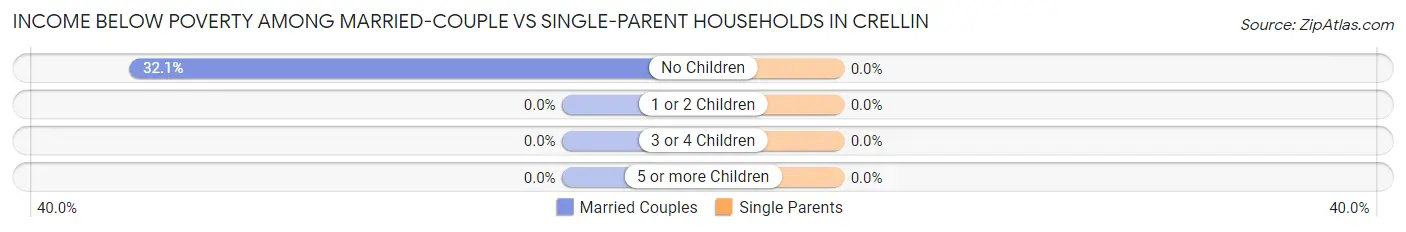
Income Below Poverty Among Married-Couple vs Single-Parent Households in Crellin
| Children | Married-Couple Families | Single-Parent Households |
| No Children | 9 (32.1%) | 0 (0.0%) |
| 1 or 2 Children | 0 (0.0%) | 0 (0.0%) |
| 3 or 4 Children | 0 (0.0%) | 0 (0.0%) |
| 5 or more Children | 0 (0.0%) | 0 (0.0%) |
| Total | 9 (18.8%) | 0 (0.0%) |
Employment Characteristics in Crellin
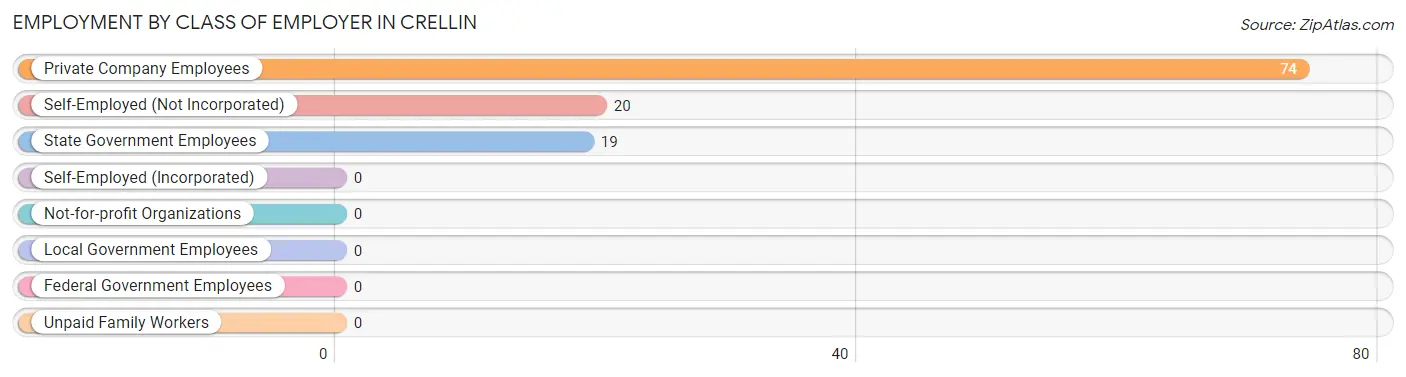
Employment by Class of Employer in Crellin
Among the 113 employed individuals in Crellin, private company employees (74 | 65.5%), self-employed (not incorporated) (20 | 17.7%), and state government employees (19 | 16.8%) make up the most common classes of employment.
| Employer Class | # Employees | % Employees |
| Private Company Employees | 74 | 65.5% |
| Self-Employed (Incorporated) | 0 | 0.0% |
| Self-Employed (Not Incorporated) | 20 | 17.7% |
| Not-for-profit Organizations | 0 | 0.0% |
| Local Government Employees | 0 | 0.0% |
| State Government Employees | 19 | 16.8% |
| Federal Government Employees | 0 | 0.0% |
| Unpaid Family Workers | 0 | 0.0% |
| Total | 113 | 100.0% |
Employment Status by Age in Crellin
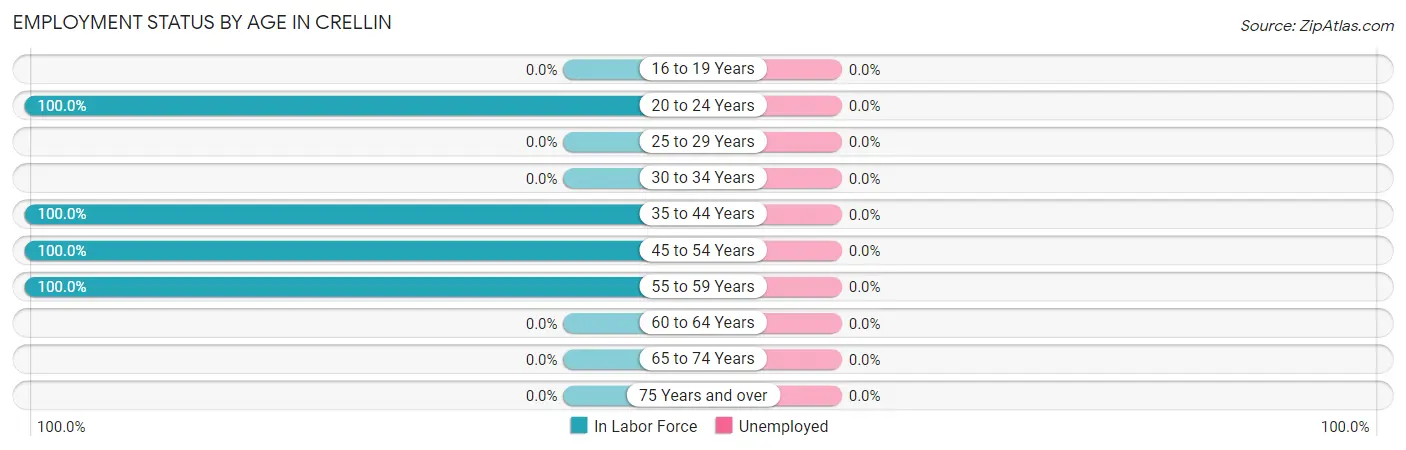
| Age Bracket | In Labor Force | Unemployed |
| 16 to 19 Years | 0 (0.0%) | 0 (0.0%) |
| 20 to 24 Years | 30 (100.0%) | 0 (0.0%) |
| 25 to 29 Years | 0 (0.0%) | 0 (0.0%) |
| 30 to 34 Years | 0 (0.0%) | 0 (0.0%) |
| 35 to 44 Years | 20 (100.0%) | 0 (0.0%) |
| 45 to 54 Years | 47 (100.0%) | 0 (0.0%) |
| 55 to 59 Years | 16 (100.0%) | 0 (0.0%) |
| 60 to 64 Years | 0 (0.0%) | 0 (0.0%) |
| 65 to 74 Years | 0 (0.0%) | 0 (0.0%) |
| 75 Years and over | 0 (0.0%) | 0 (0.0%) |
| Total | 113 (72.9%) | 0 (0.0%) |
Employment Status by Educational Attainment in Crellin
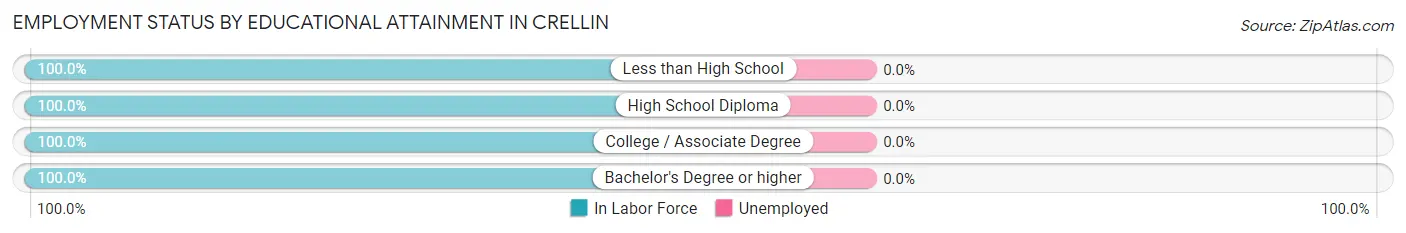
| Educational Attainment | In Labor Force | Unemployed |
| Less than High School | 16 (100.0%) | 0 (0.0%) |
| High School Diploma | 19 (100.0%) | 0 (0.0%) |
| College / Associate Degree | 28 (100.0%) | 0 (0.0%) |
| Bachelor's Degree or higher | 20 (100.0%) | 0 (0.0%) |
| Total | 83 (100.0%) | 0 (0.0%) |
Employment Occupations by Sex in Crellin
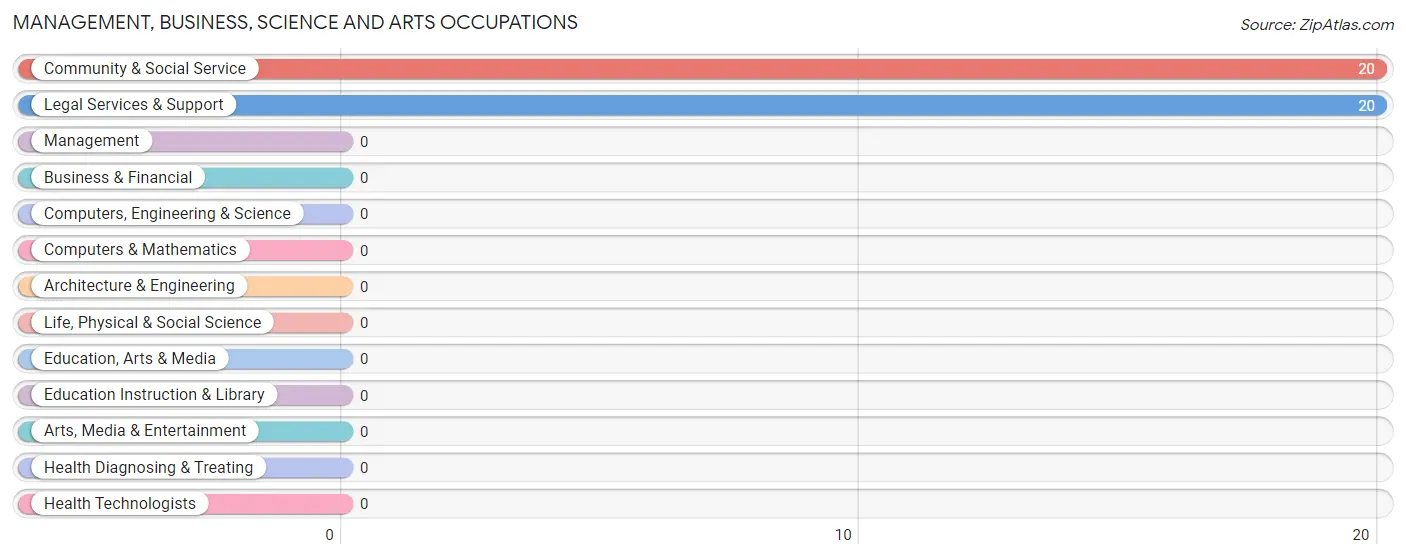
Management, Business, Science and Arts Occupations
The most common Management, Business, Science and Arts occupations in Crellin are Community & Social Service (20 | 17.7%), and Legal Services & Support (20 | 17.7%).
Management, Business, Science and Arts Occupations by Sex
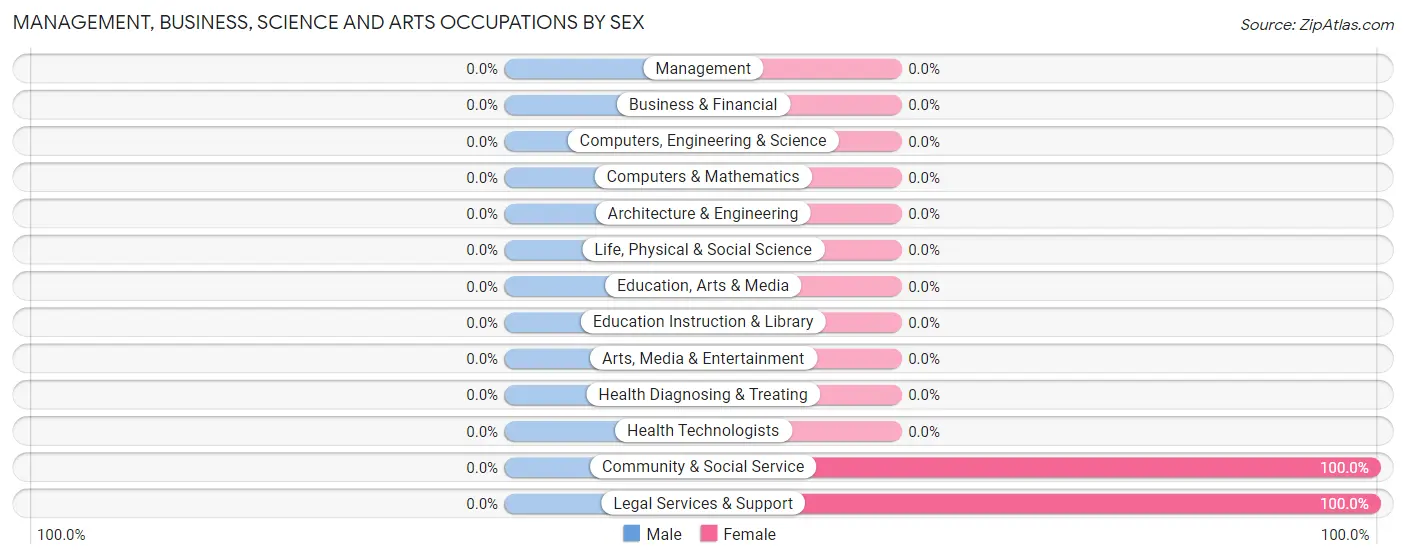
| Occupation | Male | Female |
| Management | 0 (0.0%) | 0 (0.0%) |
| Business & Financial | 0 (0.0%) | 0 (0.0%) |
| Computers, Engineering & Science | 0 (0.0%) | 0 (0.0%) |
| Computers & Mathematics | 0 (0.0%) | 0 (0.0%) |
| Architecture & Engineering | 0 (0.0%) | 0 (0.0%) |
| Life, Physical & Social Science | 0 (0.0%) | 0 (0.0%) |
| Community & Social Service | 0 (0.0%) | 20 (100.0%) |
| Education, Arts & Media | 0 (0.0%) | 0 (0.0%) |
| Legal Services & Support | 0 (0.0%) | 20 (100.0%) |
| Education Instruction & Library | 0 (0.0%) | 0 (0.0%) |
| Arts, Media & Entertainment | 0 (0.0%) | 0 (0.0%) |
| Health Diagnosing & Treating | 0 (0.0%) | 0 (0.0%) |
| Health Technologists | 0 (0.0%) | 0 (0.0%) |
| Total (Category) | 0 (0.0%) | 20 (100.0%) |
| Total (Overall) | 44 (38.9%) | 69 (61.1%) |
Services Occupations
The most common Services occupations in Crellin are , and Personal Care & Service (28 | 24.8%).
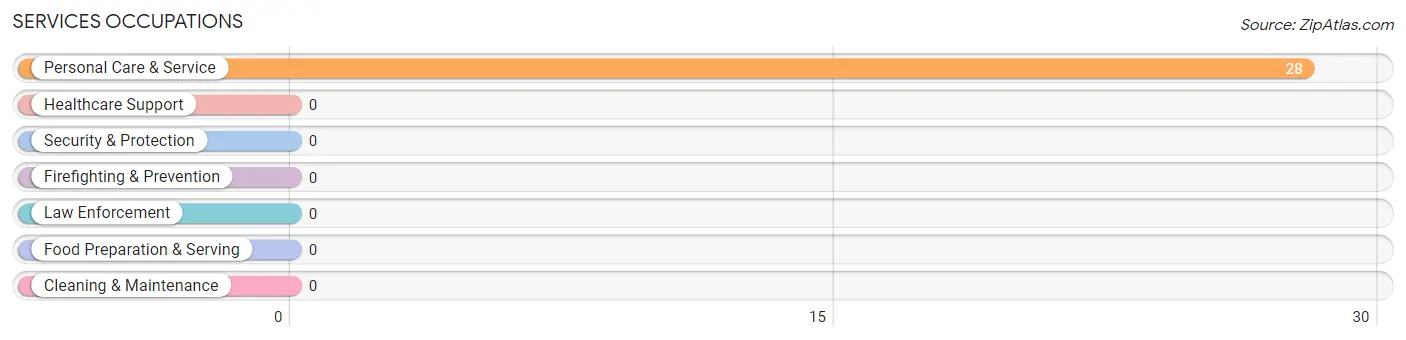
Services Occupations by Sex
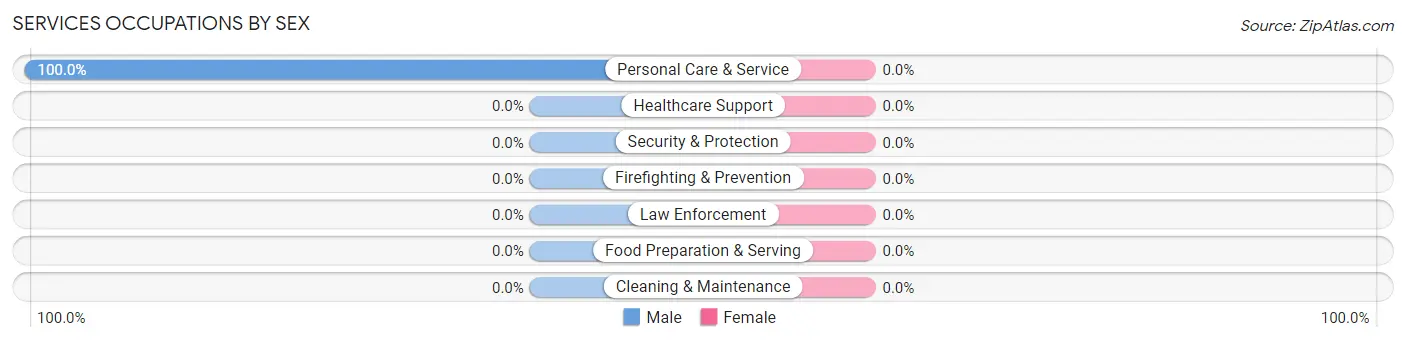
| Occupation | Male | Female |
| Healthcare Support | 0 (0.0%) | 0 (0.0%) |
| Security & Protection | 0 (0.0%) | 0 (0.0%) |
| Firefighting & Prevention | 0 (0.0%) | 0 (0.0%) |
| Law Enforcement | 0 (0.0%) | 0 (0.0%) |
| Food Preparation & Serving | 0 (0.0%) | 0 (0.0%) |
| Cleaning & Maintenance | 0 (0.0%) | 0 (0.0%) |
| Personal Care & Service | 28 (100.0%) | 0 (0.0%) |
| Total (Category) | 28 (100.0%) | 0 (0.0%) |
| Total (Overall) | 44 (38.9%) | 69 (61.1%) |
Sales and Office Occupations
The most common Sales and Office occupations in Crellin are , and Office & Administration (19 | 16.8%).
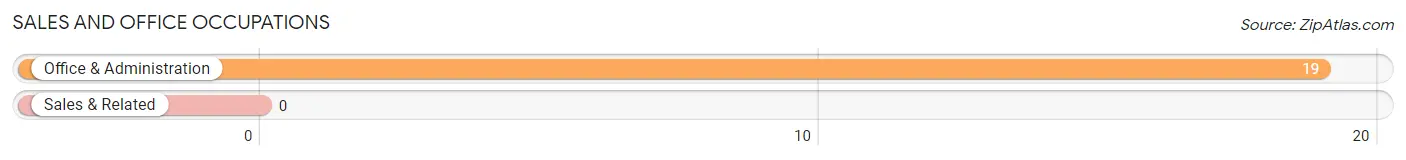
Sales and Office Occupations by Sex
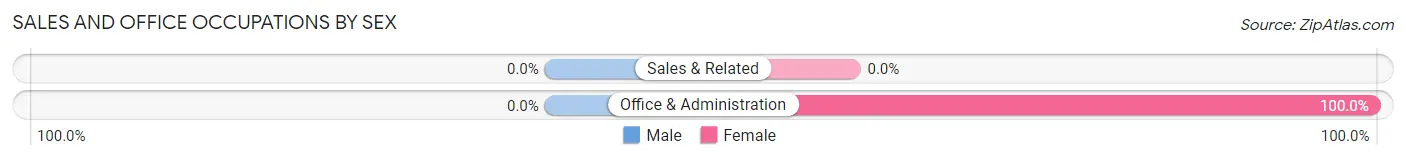
| Occupation | Male | Female |
| Sales & Related | 0 (0.0%) | 0 (0.0%) |
| Office & Administration | 0 (0.0%) | 19 (100.0%) |
| Total (Category) | 0 (0.0%) | 19 (100.0%) |
| Total (Overall) | 44 (38.9%) | 69 (61.1%) |
Natural Resources, Construction and Maintenance Occupations
The most common Natural Resources, Construction and Maintenance occupations in Crellin are , and Installation, Maintenance & Repair (16 | 14.2%).
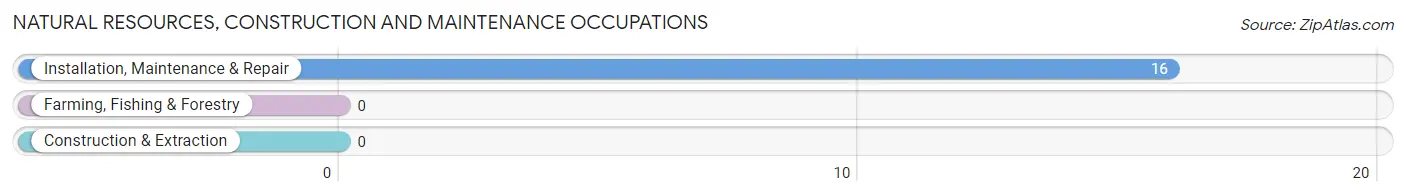
Natural Resources, Construction and Maintenance Occupations by Sex
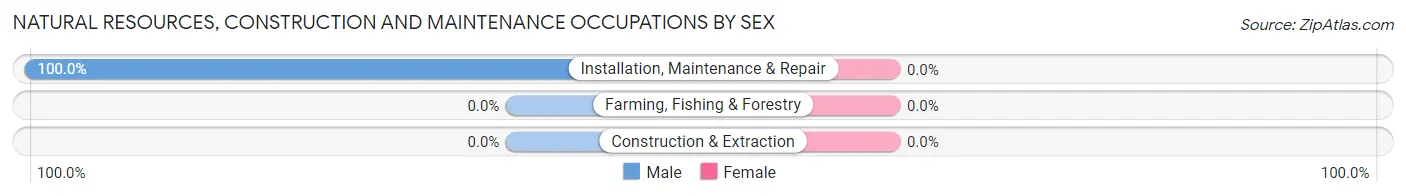
| Occupation | Male | Female |
| Farming, Fishing & Forestry | 0 (0.0%) | 0 (0.0%) |
| Construction & Extraction | 0 (0.0%) | 0 (0.0%) |
| Installation, Maintenance & Repair | 16 (100.0%) | 0 (0.0%) |
| Total (Category) | 16 (100.0%) | 0 (0.0%) |
| Total (Overall) | 44 (38.9%) | 69 (61.1%) |
Production, Transportation and Moving Occupations
The most common Production, Transportation and Moving occupations in Crellin are , and Material Moving (30 | 26.6%).
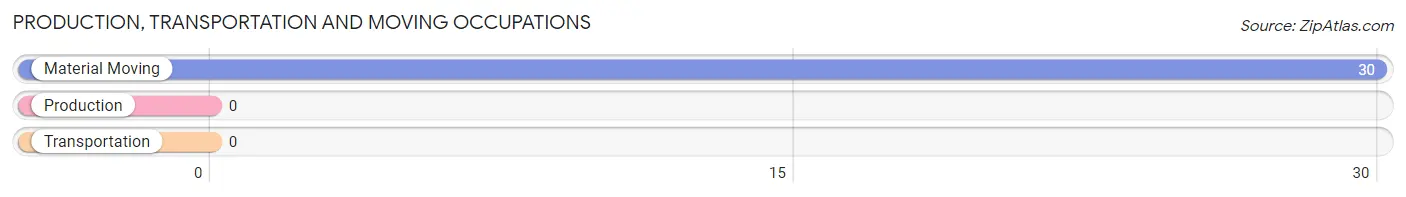
Production, Transportation and Moving Occupations by Sex
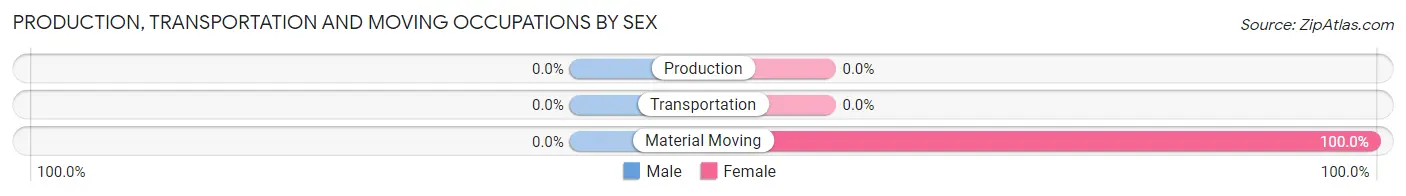
| Occupation | Male | Female |
| Production | 0 (0.0%) | 0 (0.0%) |
| Transportation | 0 (0.0%) | 0 (0.0%) |
| Material Moving | 0 (0.0%) | 30 (100.0%) |
| Total (Category) | 0 (0.0%) | 30 (100.0%) |
| Total (Overall) | 44 (38.9%) | 69 (61.1%) |
Employment Industries by Sex in Crellin
Employment Industries in Crellin
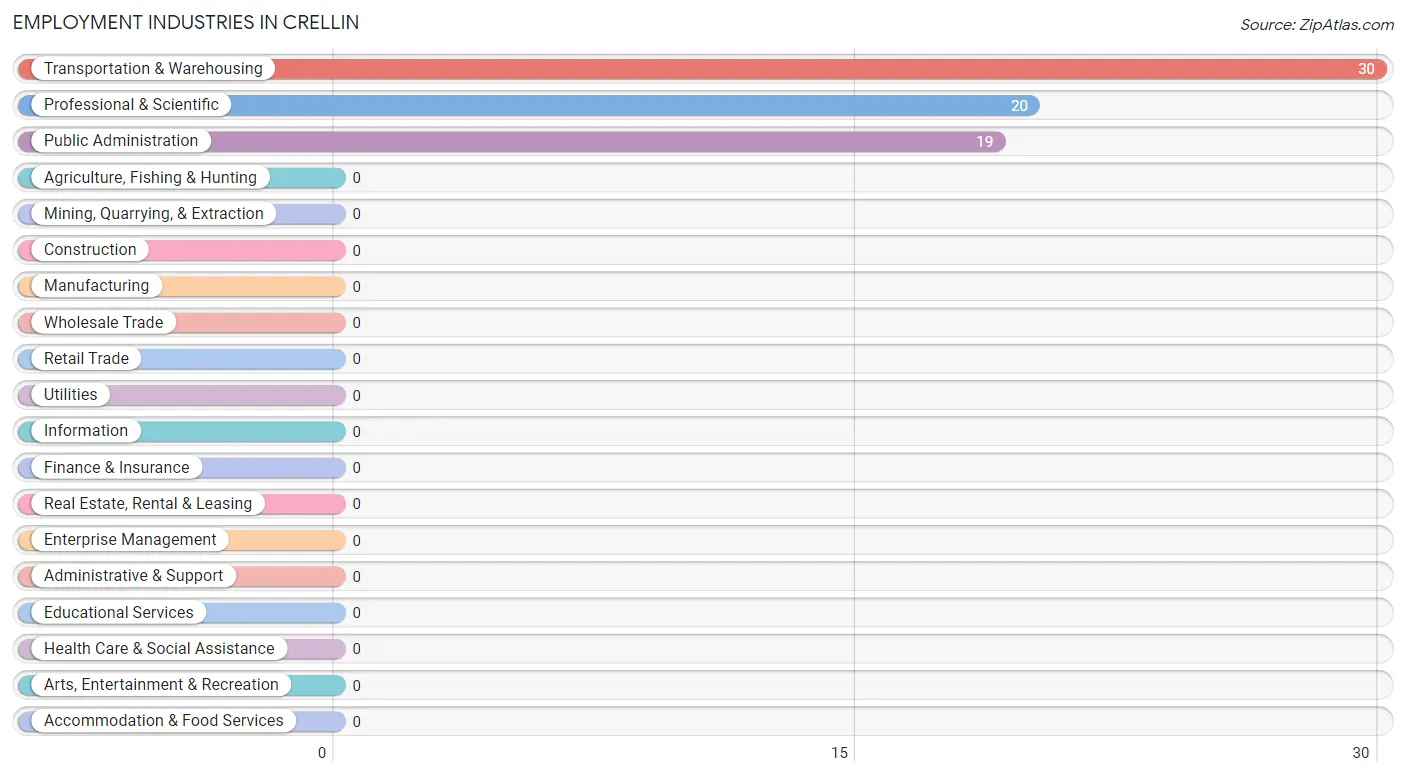
The major employment industries in Crellin include Transportation & Warehousing (30 | 26.6%), Professional & Scientific (20 | 17.7%), and Public Administration (19 | 16.8%).
Employment Industries by Sex in Crellin
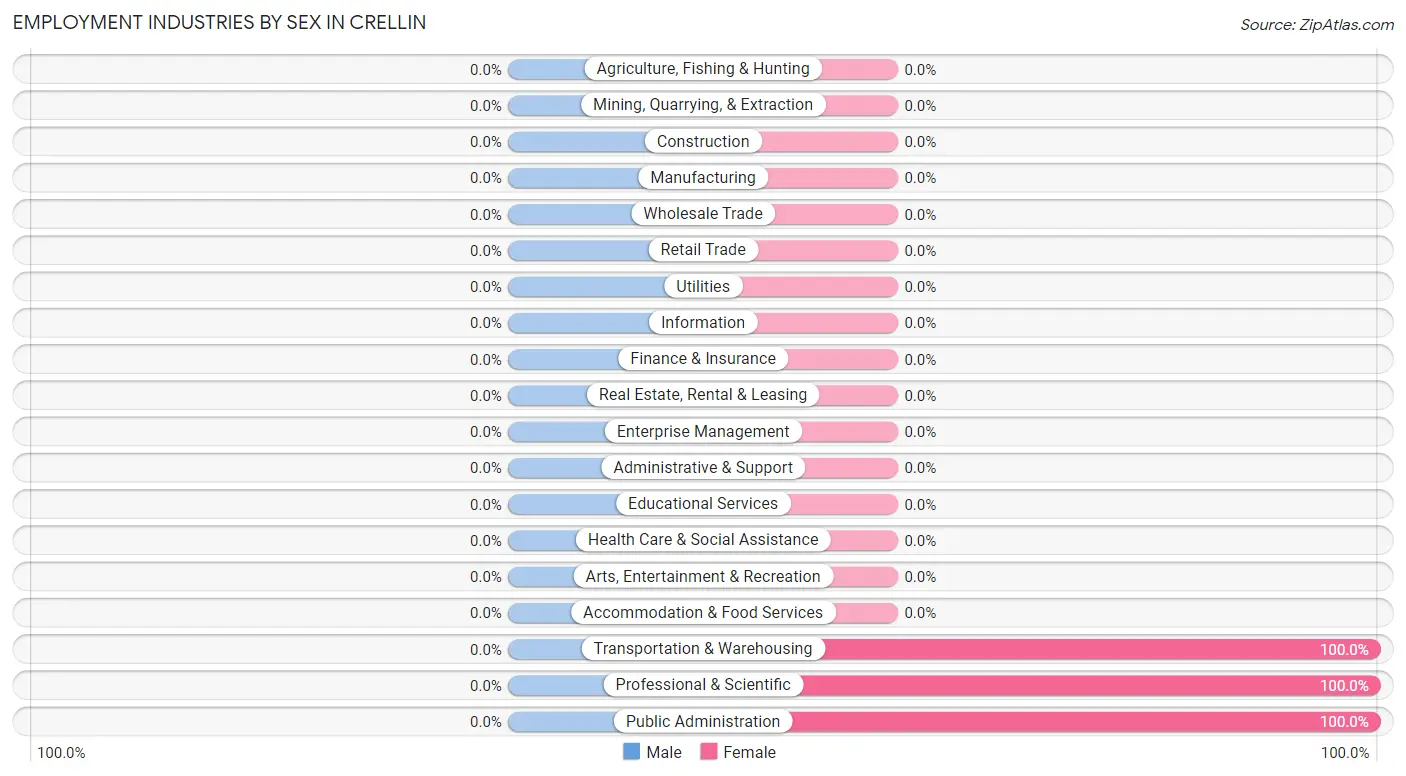
| Industry | Male | Female |
| Agriculture, Fishing & Hunting | 0 (0.0%) | 0 (0.0%) |
| Mining, Quarrying, & Extraction | 0 (0.0%) | 0 (0.0%) |
| Construction | 0 (0.0%) | 0 (0.0%) |
| Manufacturing | 0 (0.0%) | 0 (0.0%) |
| Wholesale Trade | 0 (0.0%) | 0 (0.0%) |
| Retail Trade | 0 (0.0%) | 0 (0.0%) |
| Transportation & Warehousing | 0 (0.0%) | 30 (100.0%) |
| Utilities | 0 (0.0%) | 0 (0.0%) |
| Information | 0 (0.0%) | 0 (0.0%) |
| Finance & Insurance | 0 (0.0%) | 0 (0.0%) |
| Real Estate, Rental & Leasing | 0 (0.0%) | 0 (0.0%) |
| Professional & Scientific | 0 (0.0%) | 20 (100.0%) |
| Enterprise Management | 0 (0.0%) | 0 (0.0%) |
| Administrative & Support | 0 (0.0%) | 0 (0.0%) |
| Educational Services | 0 (0.0%) | 0 (0.0%) |
| Health Care & Social Assistance | 0 (0.0%) | 0 (0.0%) |
| Arts, Entertainment & Recreation | 0 (0.0%) | 0 (0.0%) |
| Accommodation & Food Services | 0 (0.0%) | 0 (0.0%) |
| Public Administration | 0 (0.0%) | 19 (100.0%) |
| Total | 44 (38.9%) | 69 (61.1%) |
Education in Crellin
School Enrollment in Crellin
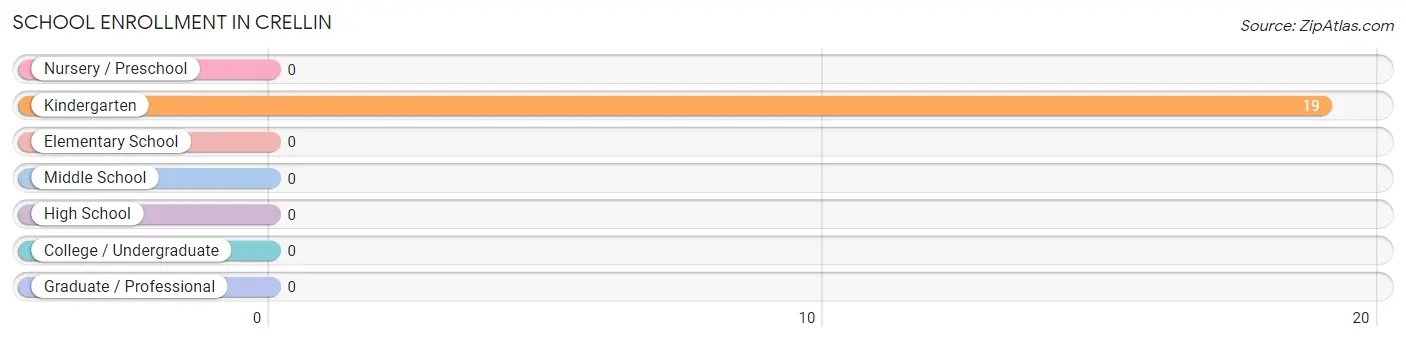
| School Level | # Students | % Students |
| Nursery / Preschool | 0 | 0.0% |
| Kindergarten | 19 | 100.0% |
| Elementary School | 0 | 0.0% |
| Middle School | 0 | 0.0% |
| High School | 0 | 0.0% |
| College / Undergraduate | 0 | 0.0% |
| Graduate / Professional | 0 | 0.0% |
| Total | 19 | 100.0% |
School Enrollment by Age by Funding Source in Crellin
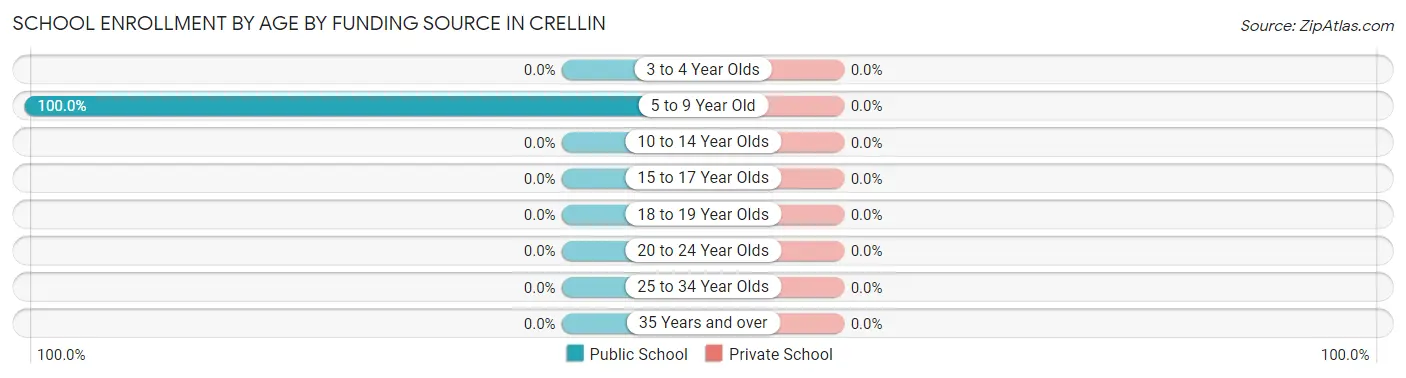
| Age Bracket | Public School | Private School |
| 3 to 4 Year Olds | 0 (0.0%) | 0 (0.0%) |
| 5 to 9 Year Old | 19 (100.0%) | 0 (0.0%) |
| 10 to 14 Year Olds | 0 (0.0%) | 0 (0.0%) |
| 15 to 17 Year Olds | 0 (0.0%) | 0 (0.0%) |
| 18 to 19 Year Olds | 0 (0.0%) | 0 (0.0%) |
| 20 to 24 Year Olds | 0 (0.0%) | 0 (0.0%) |
| 25 to 34 Year Olds | 0 (0.0%) | 0 (0.0%) |
| 35 Years and over | 0 (0.0%) | 0 (0.0%) |
| Total | 19 (100.0%) | 0 (0.0%) |
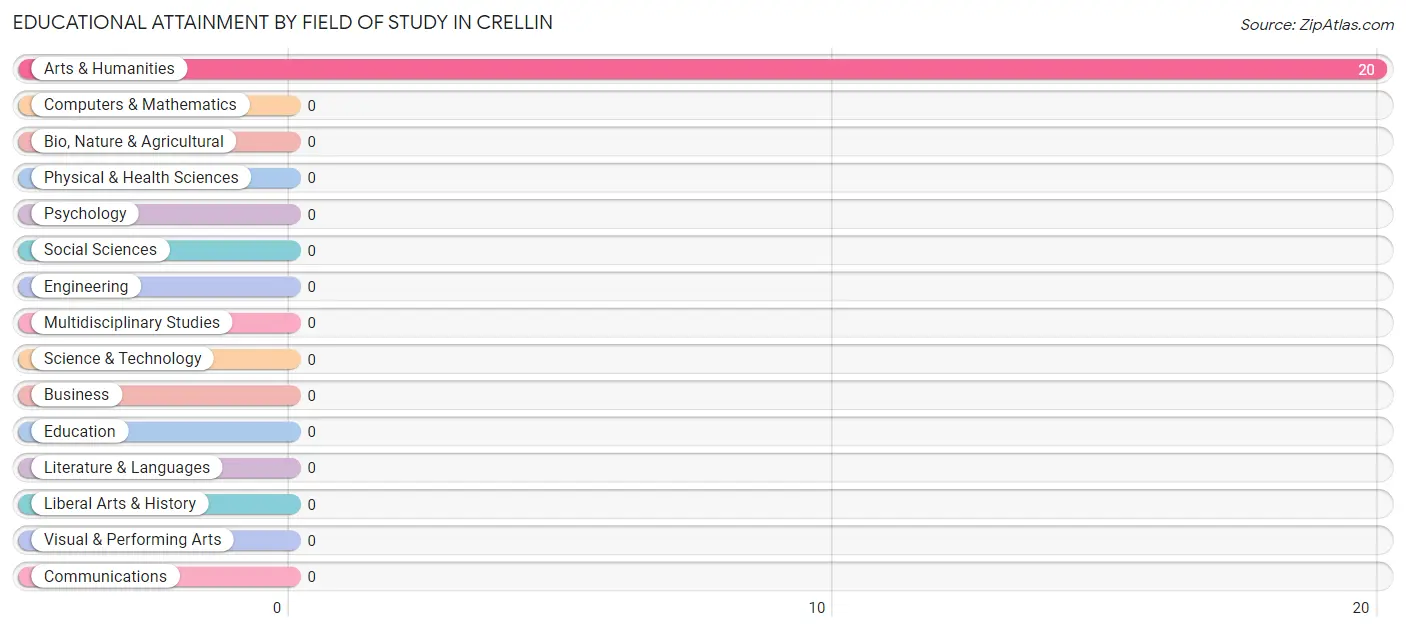
Educational Attainment by Field of Study in Crellin
, and arts & humanities (20 | 100.0%) are the most common fields of study among 20 individuals in Crellin who have obtained a bachelor's degree or higher.
| Field of Study | # Graduates | % Graduates |
| Computers & Mathematics | 0 | 0.0% |
| Bio, Nature & Agricultural | 0 | 0.0% |
| Physical & Health Sciences | 0 | 0.0% |
| Psychology | 0 | 0.0% |
| Social Sciences | 0 | 0.0% |
| Engineering | 0 | 0.0% |
| Multidisciplinary Studies | 0 | 0.0% |
| Science & Technology | 0 | 0.0% |
| Business | 0 | 0.0% |
| Education | 0 | 0.0% |
| Literature & Languages | 0 | 0.0% |
| Liberal Arts & History | 0 | 0.0% |
| Visual & Performing Arts | 0 | 0.0% |
| Communications | 0 | 0.0% |
| Arts & Humanities | 20 | 100.0% |
| Total | 20 | 100.0% |
Transportation & Commute in Crellin
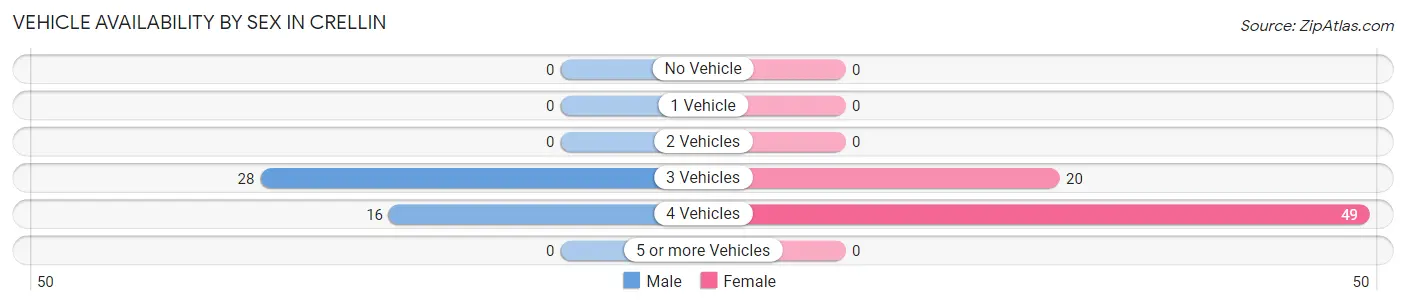
Vehicle Availability by Sex in Crellin
The most prevalent vehicle ownership categories in Crellin are males with 3 vehicles (28, accounting for 63.6%) and females with 3 vehicles (20, making up 40.6%).
| Vehicles Available | Male | Female |
| No Vehicle | 0 (0.0%) | 0 (0.0%) |
| 1 Vehicle | 0 (0.0%) | 0 (0.0%) |
| 2 Vehicles | 0 (0.0%) | 0 (0.0%) |
| 3 Vehicles | 28 (63.6%) | 20 (29.0%) |
| 4 Vehicles | 16 (36.4%) | 49 (71.0%) |
| 5 or more Vehicles | 0 (0.0%) | 0 (0.0%) |
| Total | 44 (100.0%) | 69 (100.0%) |
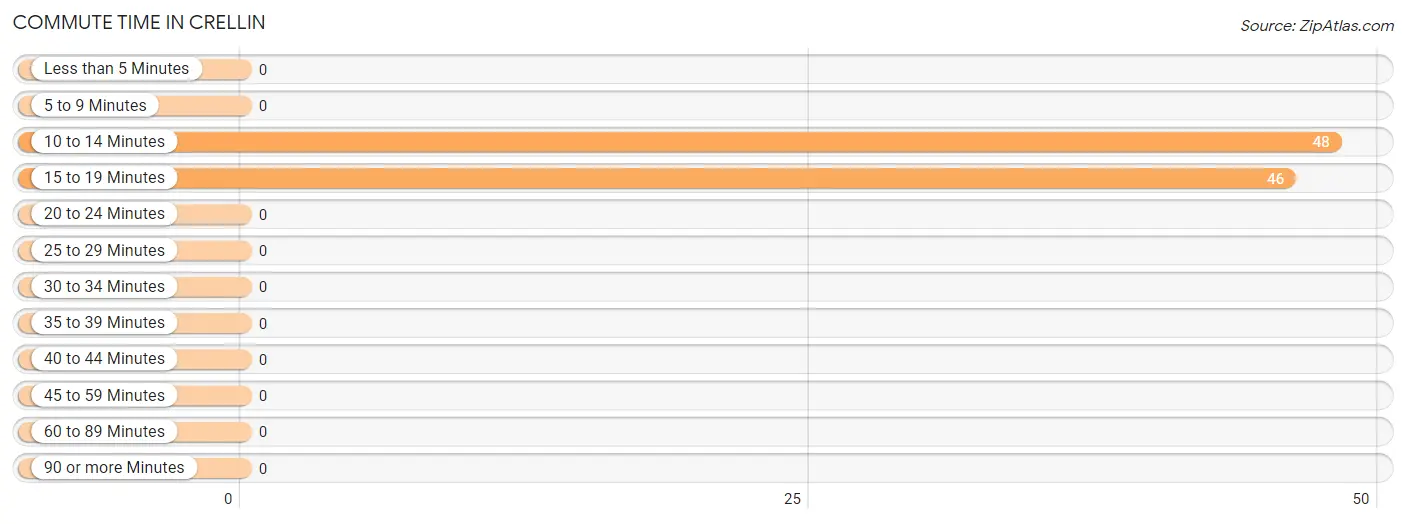
Commute Time in Crellin
The most frequently occuring commute durations in Crellin are 10 to 14 minutes (48 commuters, 51.1%), 15 to 19 minutes (46 commuters, 48.9%), and less than 5 minutes (0 commuters, 0.0%).
| Commute Time | # Commuters | % Commuters |
| Less than 5 Minutes | 0 | 0.0% |
| 5 to 9 Minutes | 0 | 0.0% |
| 10 to 14 Minutes | 48 | 51.1% |
| 15 to 19 Minutes | 46 | 48.9% |
| 20 to 24 Minutes | 0 | 0.0% |
| 25 to 29 Minutes | 0 | 0.0% |
| 30 to 34 Minutes | 0 | 0.0% |
| 35 to 39 Minutes | 0 | 0.0% |
| 40 to 44 Minutes | 0 | 0.0% |
| 45 to 59 Minutes | 0 | 0.0% |
| 60 to 89 Minutes | 0 | 0.0% |
| 90 or more Minutes | 0 | 0.0% |
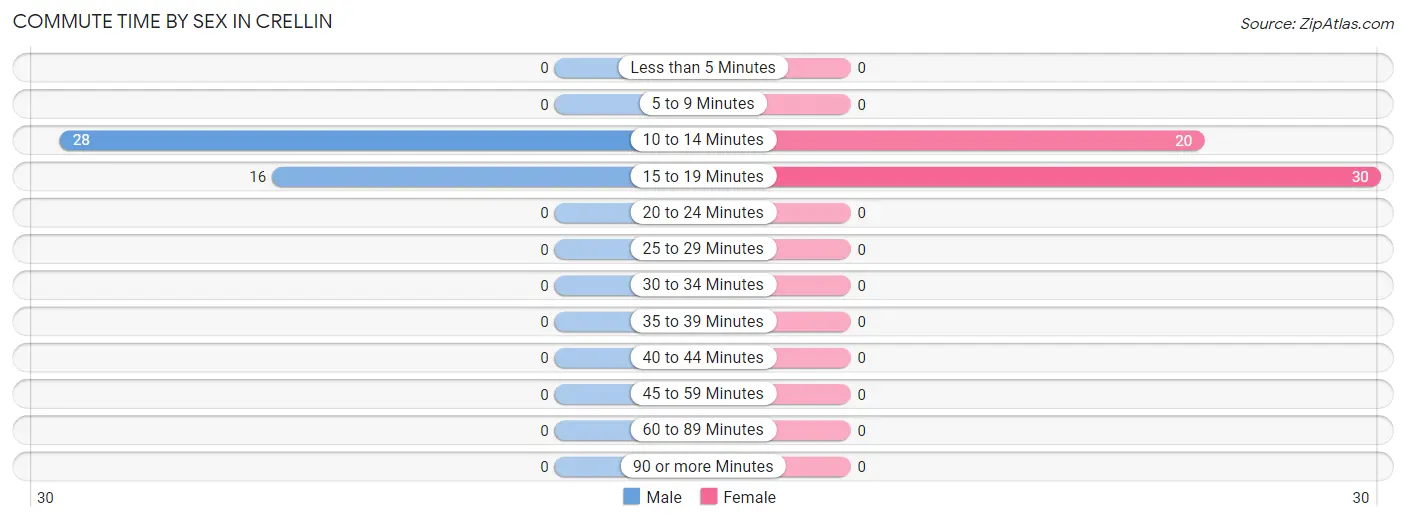
Commute Time by Sex in Crellin
The most common commute times in Crellin are 10 to 14 minutes (28 commuters, 63.6%) for males and 15 to 19 minutes (30 commuters, 60.0%) for females.
| Commute Time | Male | Female |
| Less than 5 Minutes | 0 (0.0%) | 0 (0.0%) |
| 5 to 9 Minutes | 0 (0.0%) | 0 (0.0%) |
| 10 to 14 Minutes | 28 (63.6%) | 20 (40.0%) |
| 15 to 19 Minutes | 16 (36.4%) | 30 (60.0%) |
| 20 to 24 Minutes | 0 (0.0%) | 0 (0.0%) |
| 25 to 29 Minutes | 0 (0.0%) | 0 (0.0%) |
| 30 to 34 Minutes | 0 (0.0%) | 0 (0.0%) |
| 35 to 39 Minutes | 0 (0.0%) | 0 (0.0%) |
| 40 to 44 Minutes | 0 (0.0%) | 0 (0.0%) |
| 45 to 59 Minutes | 0 (0.0%) | 0 (0.0%) |
| 60 to 89 Minutes | 0 (0.0%) | 0 (0.0%) |
| 90 or more Minutes | 0 (0.0%) | 0 (0.0%) |
Time of Departure to Work by Sex in Crellin
The most frequent times of departure to work in Crellin are 8:00 AM to 8:29 AM (28, 63.6%) for males and 7:00 AM to 7:29 AM (30, 60.0%) for females.
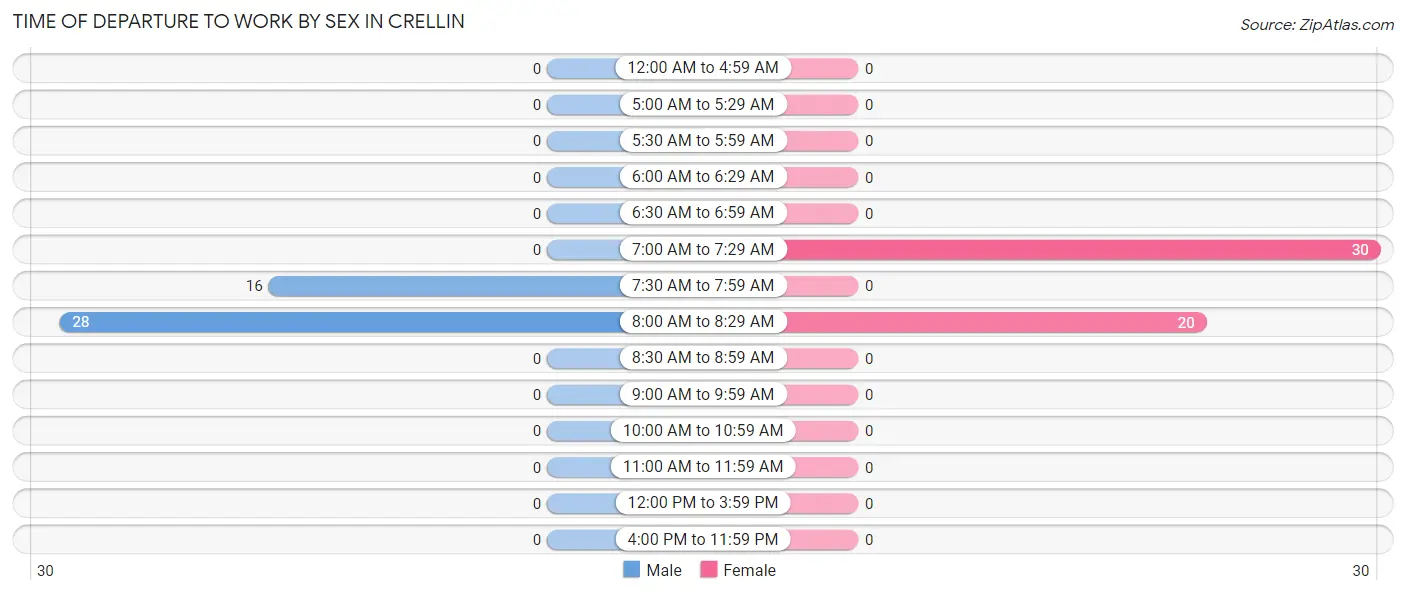
| Time of Departure | Male | Female |
| 12:00 AM to 4:59 AM | 0 (0.0%) | 0 (0.0%) |
| 5:00 AM to 5:29 AM | 0 (0.0%) | 0 (0.0%) |
| 5:30 AM to 5:59 AM | 0 (0.0%) | 0 (0.0%) |
| 6:00 AM to 6:29 AM | 0 (0.0%) | 0 (0.0%) |
| 6:30 AM to 6:59 AM | 0 (0.0%) | 0 (0.0%) |
| 7:00 AM to 7:29 AM | 0 (0.0%) | 30 (60.0%) |
| 7:30 AM to 7:59 AM | 16 (36.4%) | 0 (0.0%) |
| 8:00 AM to 8:29 AM | 28 (63.6%) | 20 (40.0%) |
| 8:30 AM to 8:59 AM | 0 (0.0%) | 0 (0.0%) |
| 9:00 AM to 9:59 AM | 0 (0.0%) | 0 (0.0%) |
| 10:00 AM to 10:59 AM | 0 (0.0%) | 0 (0.0%) |
| 11:00 AM to 11:59 AM | 0 (0.0%) | 0 (0.0%) |
| 12:00 PM to 3:59 PM | 0 (0.0%) | 0 (0.0%) |
| 4:00 PM to 11:59 PM | 0 (0.0%) | 0 (0.0%) |
| Total | 44 (100.0%) | 50 (100.0%) |
Housing Occupancy in Crellin
Occupancy by Ownership in Crellin
Of the total 72 dwellings in Crellin, owner-occupied units account for 56 (77.8%), while renter-occupied units make up 16 (22.2%).
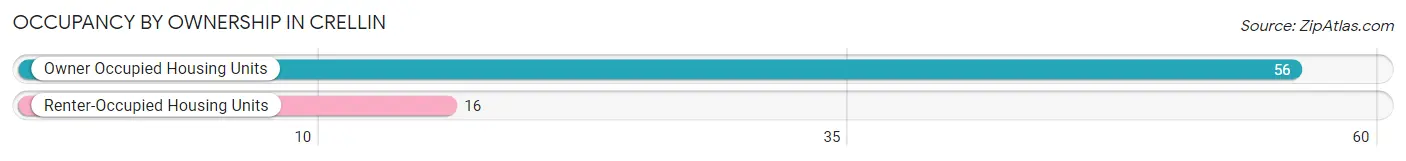
| Occupancy | # Housing Units | % Housing Units |
| Owner Occupied Housing Units | 56 | 77.8% |
| Renter-Occupied Housing Units | 16 | 22.2% |
| Total Occupied Housing Units | 72 | 100.0% |
Occupancy by Household Size in Crellin
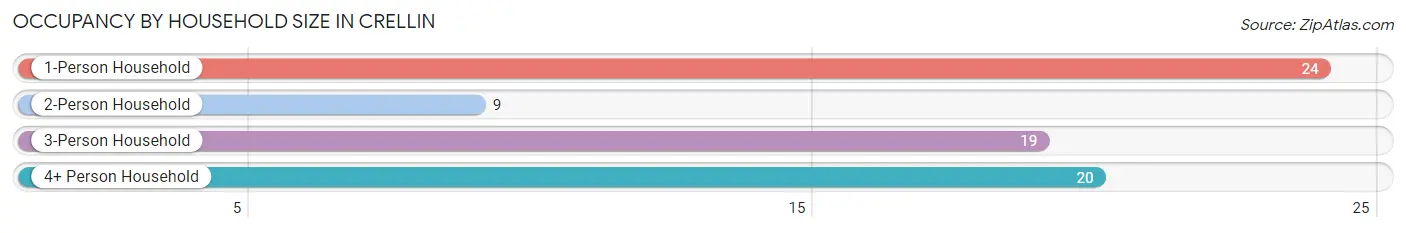
| Household Size | # Housing Units | % Housing Units |
| 1-Person Household | 24 | 33.3% |
| 2-Person Household | 9 | 12.5% |
| 3-Person Household | 19 | 26.4% |
| 4+ Person Household | 20 | 27.8% |
| Total Housing Units | 72 | 100.0% |
Occupancy by Ownership by Household Size in Crellin
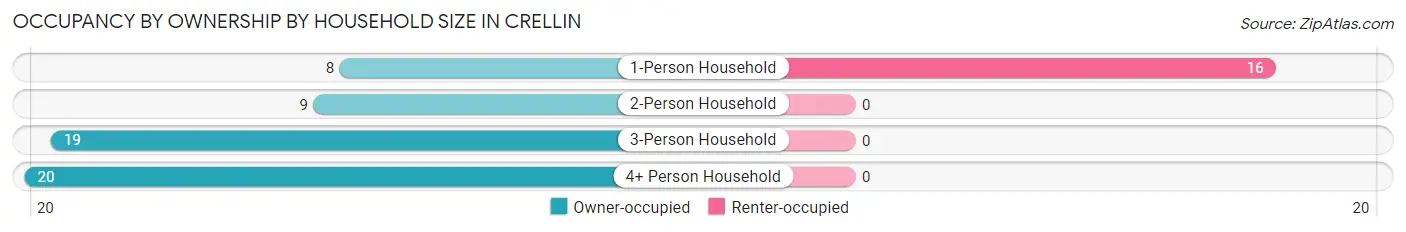
| Household Size | Owner-occupied | Renter-occupied |
| 1-Person Household | 8 (33.3%) | 16 (66.7%) |
| 2-Person Household | 9 (100.0%) | 0 (0.0%) |
| 3-Person Household | 19 (100.0%) | 0 (0.0%) |
| 4+ Person Household | 20 (100.0%) | 0 (0.0%) |
| Total Housing Units | 56 (77.8%) | 16 (22.2%) |
Occupancy by Educational Attainment in Crellin
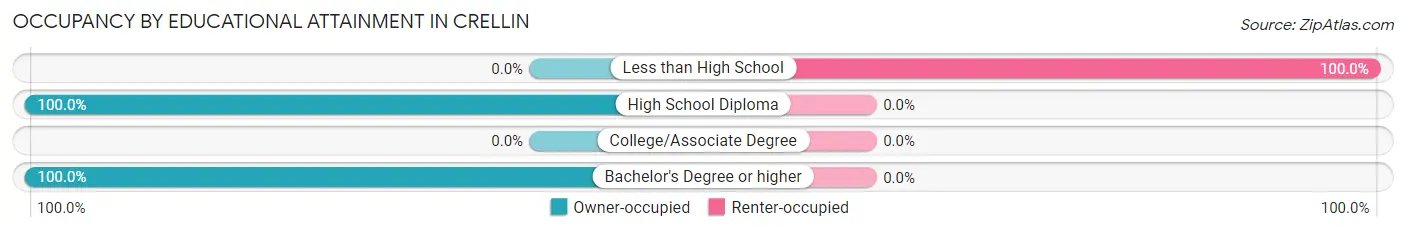
| Household Size | Owner-occupied | Renter-occupied |
| Less than High School | 0 (0.0%) | 16 (100.0%) |
| High School Diploma | 36 (100.0%) | 0 (0.0%) |
| College/Associate Degree | 0 (0.0%) | 0 (0.0%) |
| Bachelor's Degree or higher | 20 (100.0%) | 0 (0.0%) |
Occupancy by Age of Householder in Crellin
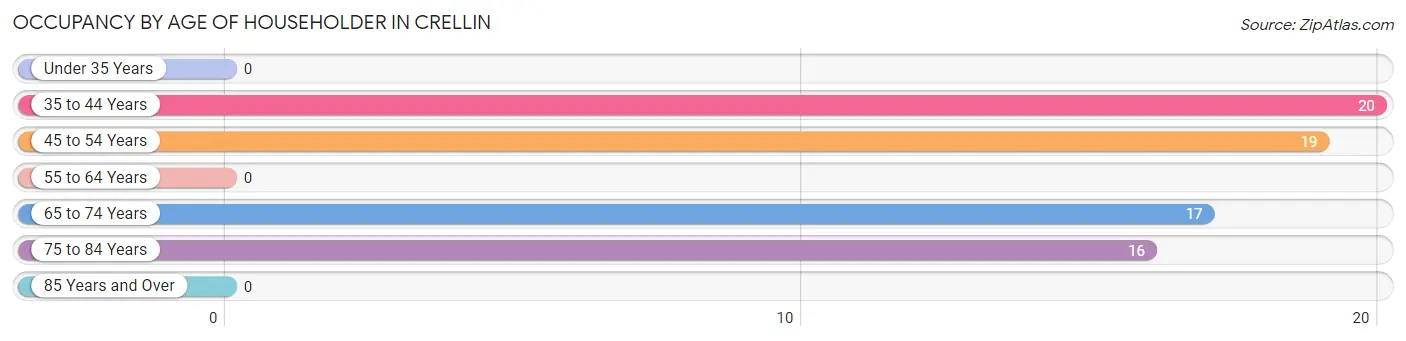
| Age Bracket | # Households | % Households |
| Under 35 Years | 0 | 0.0% |
| 35 to 44 Years | 20 | 27.8% |
| 45 to 54 Years | 19 | 26.4% |
| 55 to 64 Years | 0 | 0.0% |
| 65 to 74 Years | 17 | 23.6% |
| 75 to 84 Years | 16 | 22.2% |
| 85 Years and Over | 0 | 0.0% |
| Total | 72 | 100.0% |
Housing Finances in Crellin
Median Income by Occupancy in Crellin
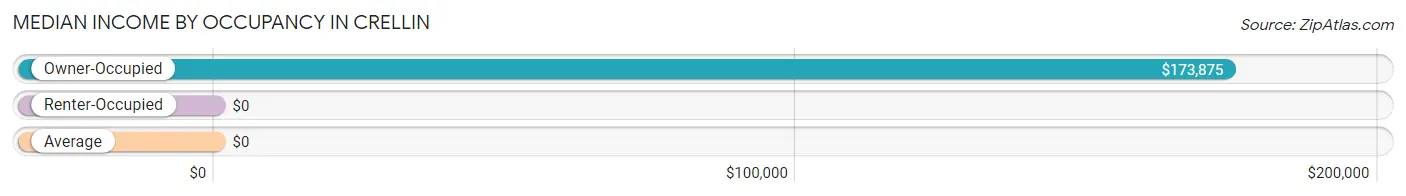
| Occupancy Type | # Households | Median Income |
| Owner-Occupied | 56 (77.8%) | $173,875 |
| Renter-Occupied | 16 (22.2%) | $0 |
| Average | 72 (100.0%) | $0 |
Occupancy by Householder Income Bracket in Crellin
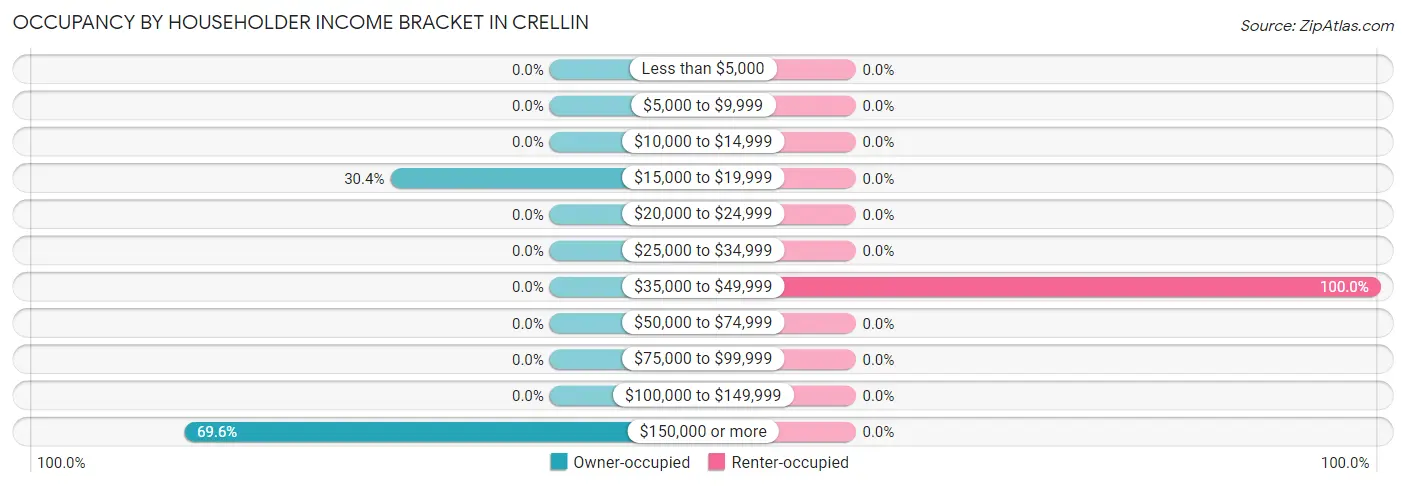
| Income Bracket | Owner-occupied | Renter-occupied |
| Less than $5,000 | 0 (0.0%) | 0 (0.0%) |
| $5,000 to $9,999 | 0 (0.0%) | 0 (0.0%) |
| $10,000 to $14,999 | 0 (0.0%) | 0 (0.0%) |
| $15,000 to $19,999 | 17 (30.4%) | 0 (0.0%) |
| $20,000 to $24,999 | 0 (0.0%) | 0 (0.0%) |
| $25,000 to $34,999 | 0 (0.0%) | 0 (0.0%) |
| $35,000 to $49,999 | 0 (0.0%) | 16 (100.0%) |
| $50,000 to $74,999 | 0 (0.0%) | 0 (0.0%) |
| $75,000 to $99,999 | 0 (0.0%) | 0 (0.0%) |
| $100,000 to $149,999 | 0 (0.0%) | 0 (0.0%) |
| $150,000 or more | 39 (69.6%) | 0 (0.0%) |
| Total | 56 (100.0%) | 16 (100.0%) |
Monthly Housing Cost Tiers in Crellin
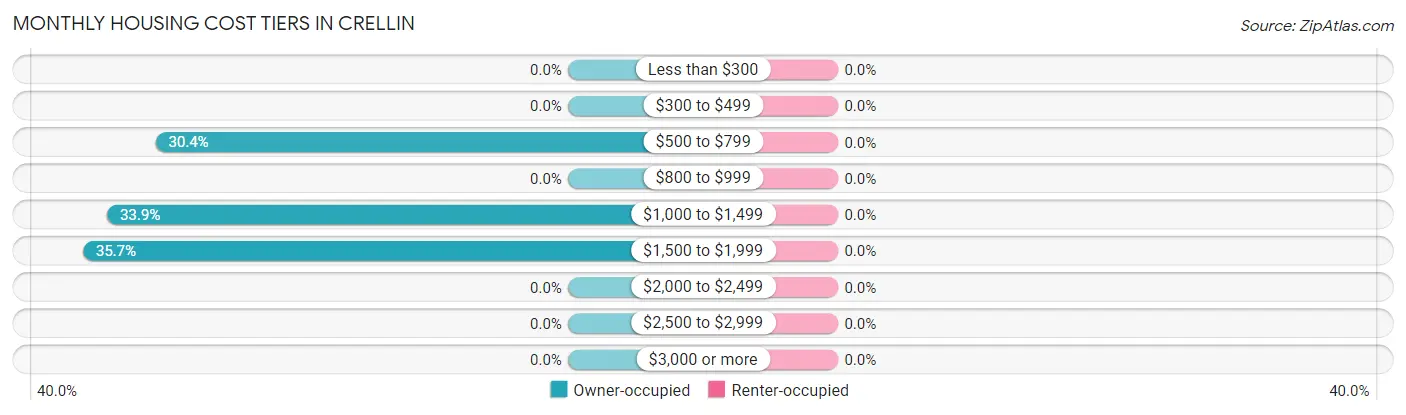
| Monthly Cost | Owner-occupied | Renter-occupied |
| Less than $300 | 0 (0.0%) | 0 (0.0%) |
| $300 to $499 | 0 (0.0%) | 0 (0.0%) |
| $500 to $799 | 17 (30.4%) | 0 (0.0%) |
| $800 to $999 | 0 (0.0%) | 0 (0.0%) |
| $1,000 to $1,499 | 19 (33.9%) | 0 (0.0%) |
| $1,500 to $1,999 | 20 (35.7%) | 0 (0.0%) |
| $2,000 to $2,499 | 0 (0.0%) | 0 (0.0%) |
| $2,500 to $2,999 | 0 (0.0%) | 0 (0.0%) |
| $3,000 or more | 0 (0.0%) | 0 (0.0%) |
| Total | 56 (100.0%) | 16 (100.0%) |
Physical Housing Characteristics in Crellin
Housing Structures in Crellin
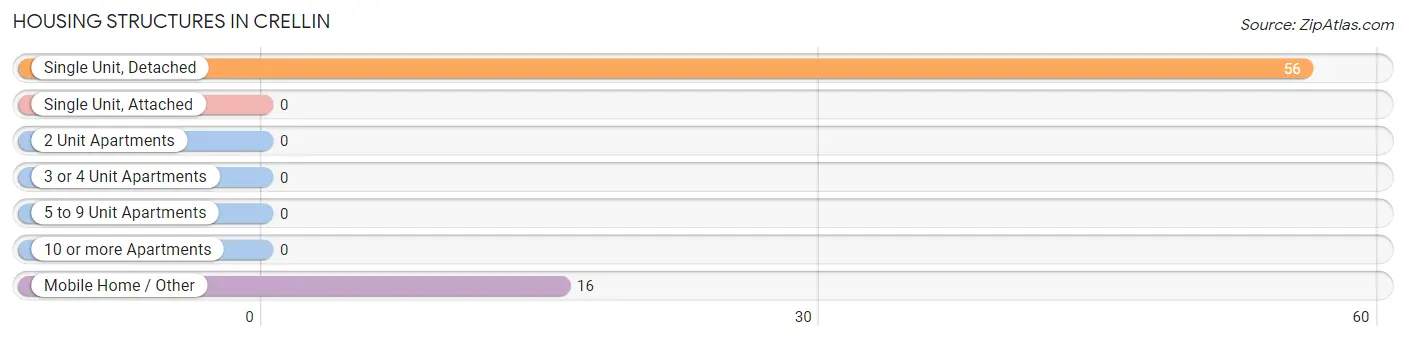
| Structure Type | # Housing Units | % Housing Units |
| Single Unit, Detached | 56 | 77.8% |
| Single Unit, Attached | 0 | 0.0% |
| 2 Unit Apartments | 0 | 0.0% |
| 3 or 4 Unit Apartments | 0 | 0.0% |
| 5 to 9 Unit Apartments | 0 | 0.0% |
| 10 or more Apartments | 0 | 0.0% |
| Mobile Home / Other | 16 | 22.2% |
| Total | 72 | 100.0% |
Housing Structures by Occupancy in Crellin
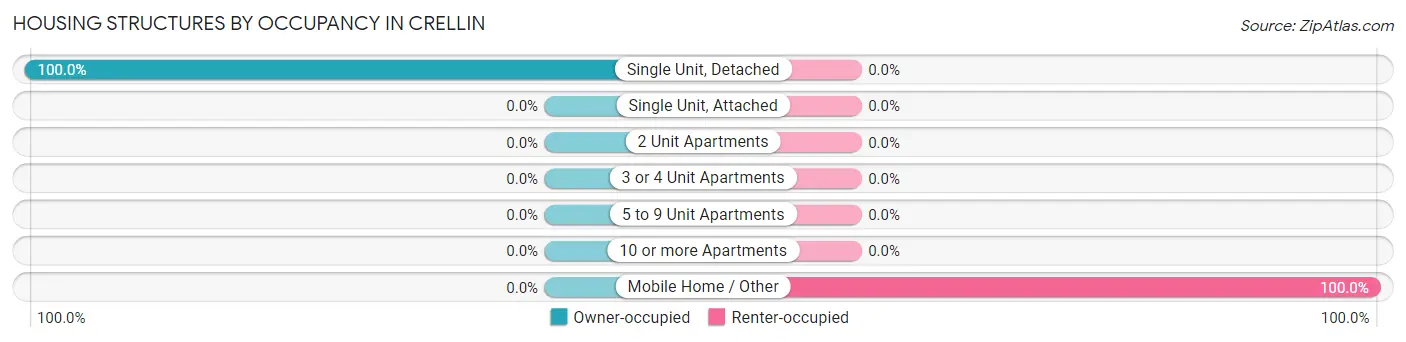
| Structure Type | Owner-occupied | Renter-occupied |
| Single Unit, Detached | 56 (100.0%) | 0 (0.0%) |
| Single Unit, Attached | 0 (0.0%) | 0 (0.0%) |
| 2 Unit Apartments | 0 (0.0%) | 0 (0.0%) |
| 3 or 4 Unit Apartments | 0 (0.0%) | 0 (0.0%) |
| 5 to 9 Unit Apartments | 0 (0.0%) | 0 (0.0%) |
| 10 or more Apartments | 0 (0.0%) | 0 (0.0%) |
| Mobile Home / Other | 0 (0.0%) | 16 (100.0%) |
| Total | 56 (77.8%) | 16 (22.2%) |
Housing Structures by Number of Rooms in Crellin
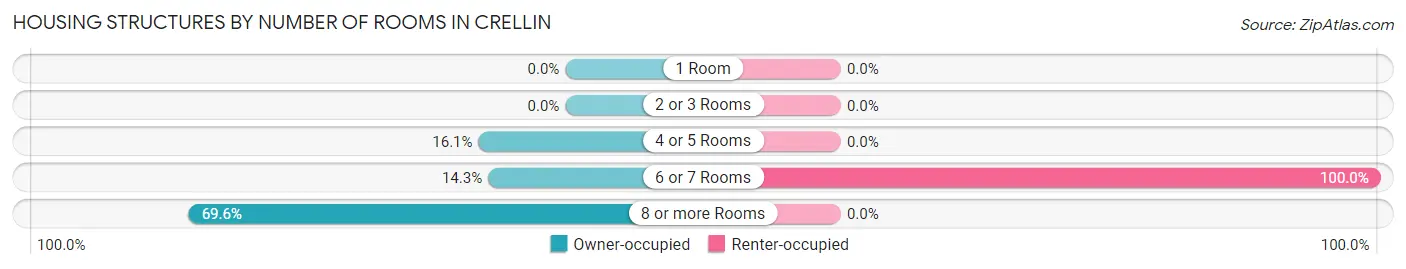
| Number of Rooms | Owner-occupied | Renter-occupied |
| 1 Room | 0 (0.0%) | 0 (0.0%) |
| 2 or 3 Rooms | 0 (0.0%) | 0 (0.0%) |
| 4 or 5 Rooms | 9 (16.1%) | 0 (0.0%) |
| 6 or 7 Rooms | 8 (14.3%) | 16 (100.0%) |
| 8 or more Rooms | 39 (69.6%) | 0 (0.0%) |
| Total | 56 (100.0%) | 16 (100.0%) |
Housing Structure by Heating Type in Crellin
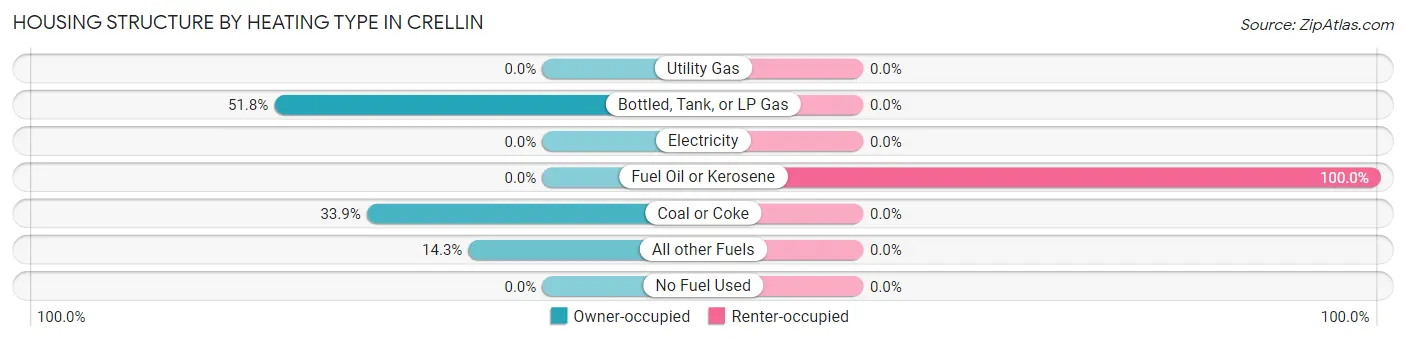
| Heating Type | Owner-occupied | Renter-occupied |
| Utility Gas | 0 (0.0%) | 0 (0.0%) |
| Bottled, Tank, or LP Gas | 29 (51.8%) | 0 (0.0%) |
| Electricity | 0 (0.0%) | 0 (0.0%) |
| Fuel Oil or Kerosene | 0 (0.0%) | 16 (100.0%) |
| Coal or Coke | 19 (33.9%) | 0 (0.0%) |
| All other Fuels | 8 (14.3%) | 0 (0.0%) |
| No Fuel Used | 0 (0.0%) | 0 (0.0%) |
| Total | 56 (100.0%) | 16 (100.0%) |
Household Vehicle Usage in Crellin
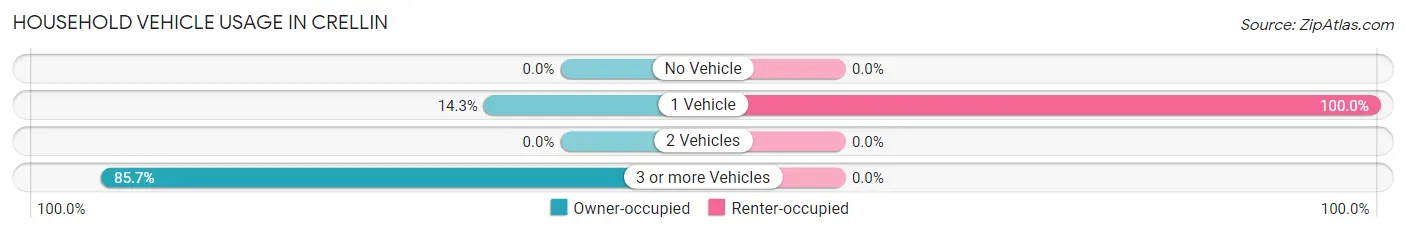
| Vehicles per Household | Owner-occupied | Renter-occupied |
| No Vehicle | 0 (0.0%) | 0 (0.0%) |
| 1 Vehicle | 8 (14.3%) | 16 (100.0%) |
| 2 Vehicles | 0 (0.0%) | 0 (0.0%) |
| 3 or more Vehicles | 48 (85.7%) | 0 (0.0%) |
| Total | 56 (100.0%) | 16 (100.0%) |
Real Estate & Mortgages in Crellin
Real Estate and Mortgage Overview in Crellin
| Characteristic | Without Mortgage | With Mortgage |
| Housing Units | 9 | 47 |
| Median Property Value | - | - |
| Median Household Income | - | - |
| Monthly Housing Costs | - | - |
| Real Estate Taxes | - | - |
Property Value by Mortgage Status in Crellin
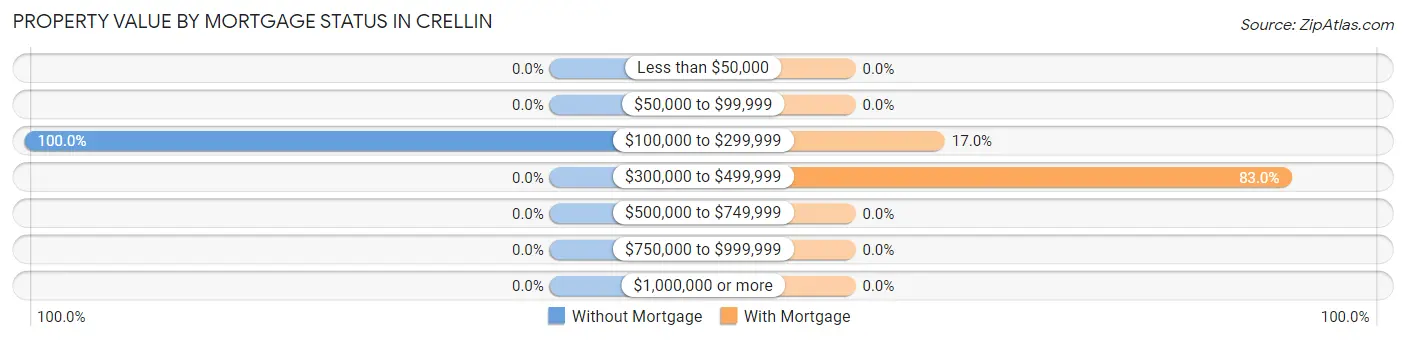
| Property Value | Without Mortgage | With Mortgage |
| Less than $50,000 | 0 (0.0%) | 0 (0.0%) |
| $50,000 to $99,999 | 0 (0.0%) | 0 (0.0%) |
| $100,000 to $299,999 | 9 (100.0%) | 8 (17.0%) |
| $300,000 to $499,999 | 0 (0.0%) | 39 (83.0%) |
| $500,000 to $749,999 | 0 (0.0%) | 0 (0.0%) |
| $750,000 to $999,999 | 0 (0.0%) | 0 (0.0%) |
| $1,000,000 or more | 0 (0.0%) | 0 (0.0%) |
| Total | 9 (100.0%) | 47 (100.0%) |
Household Income by Mortgage Status in Crellin
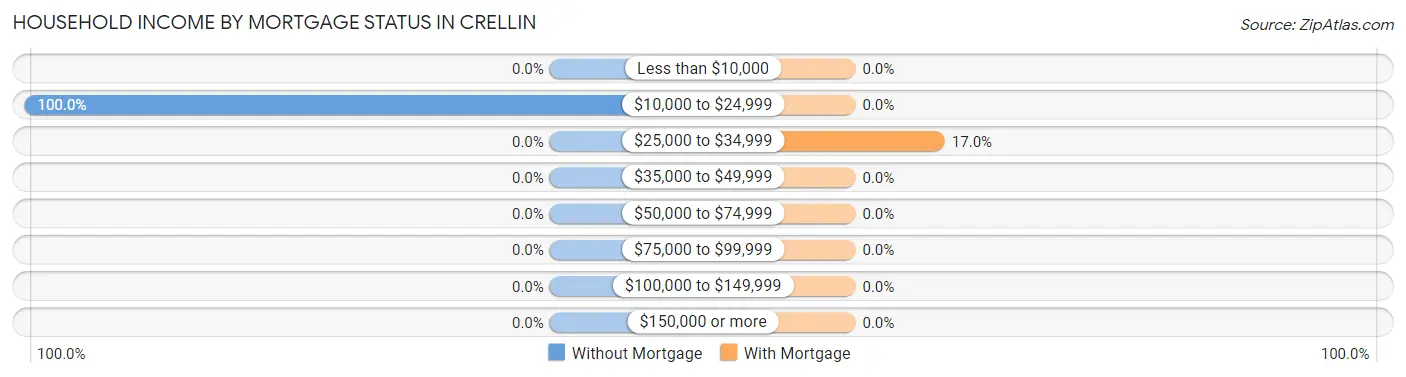
| Household Income | Without Mortgage | With Mortgage |
| Less than $10,000 | 0 (0.0%) | 0 (0.0%) |
| $10,000 to $24,999 | 9 (100.0%) | 0 (0.0%) |
| $25,000 to $34,999 | 0 (0.0%) | 8 (17.0%) |
| $35,000 to $49,999 | 0 (0.0%) | 0 (0.0%) |
| $50,000 to $74,999 | 0 (0.0%) | 0 (0.0%) |
| $75,000 to $99,999 | 0 (0.0%) | 0 (0.0%) |
| $100,000 to $149,999 | 0 (0.0%) | 0 (0.0%) |
| $150,000 or more | 0 (0.0%) | 0 (0.0%) |
| Total | 9 (100.0%) | 47 (100.0%) |
Property Value to Household Income Ratio in Crellin
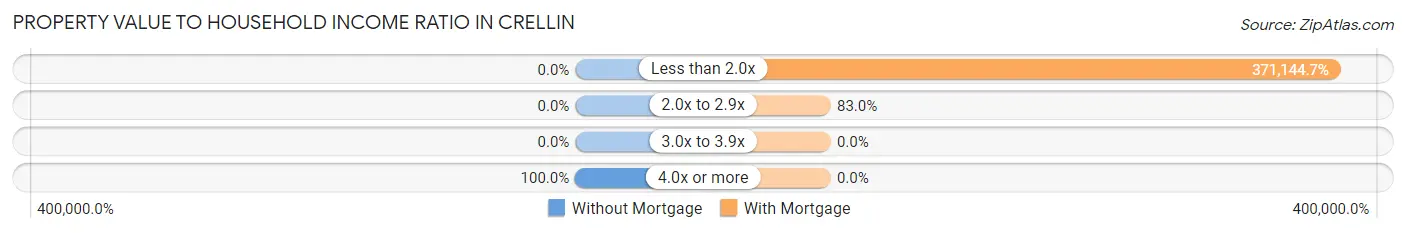
| Value-to-Income Ratio | Without Mortgage | With Mortgage |
| Less than 2.0x | 0 (0.0%) | 174,438 (371,144.7%) |
| 2.0x to 2.9x | 0 (0.0%) | 39 (83.0%) |
| 3.0x to 3.9x | 0 (0.0%) | 0 (0.0%) |
| 4.0x or more | 9 (100.0%) | 0 (0.0%) |
| Total | 9 (100.0%) | 47 (100.0%) |
Real Estate Taxes by Mortgage Status in Crellin
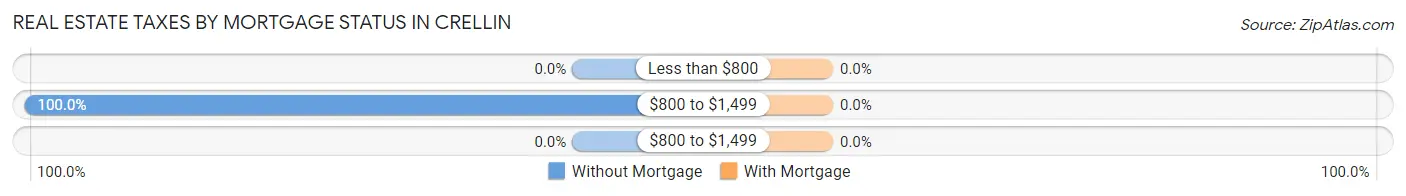
| Property Taxes | Without Mortgage | With Mortgage |
| Less than $800 | 0 (0.0%) | 0 (0.0%) |
| $800 to $1,499 | 9 (100.0%) | 0 (0.0%) |
| $800 to $1,499 | 0 (0.0%) | 0 (0.0%) |
| Total | 9 (100.0%) | 47 (100.0%) |
Health & Disability in Crellin
Health Insurance Coverage by Age in Crellin
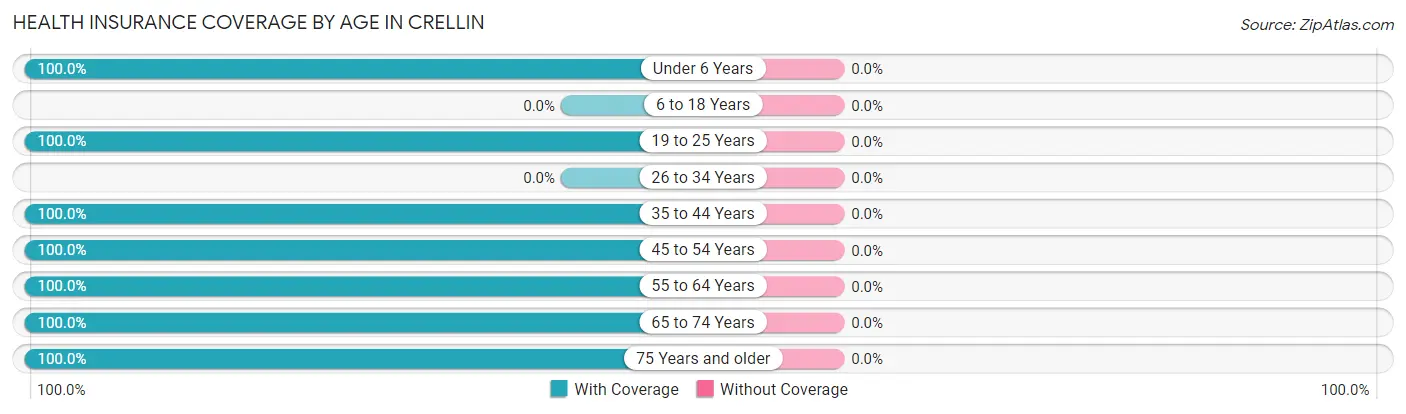
| Age Bracket | With Coverage | Without Coverage |
| Under 6 Years | 39 (100.0%) | 0 (0.0%) |
| 6 to 18 Years | 0 (0.0%) | 0 (0.0%) |
| 19 to 25 Years | 30 (100.0%) | 0 (0.0%) |
| 26 to 34 Years | 0 (0.0%) | 0 (0.0%) |
| 35 to 44 Years | 20 (100.0%) | 0 (0.0%) |
| 45 to 54 Years | 47 (100.0%) | 0 (0.0%) |
| 55 to 64 Years | 16 (100.0%) | 0 (0.0%) |
| 65 to 74 Years | 26 (100.0%) | 0 (0.0%) |
| 75 Years and older | 16 (100.0%) | 0 (0.0%) |
| Total | 194 (100.0%) | 0 (0.0%) |
Health Insurance Coverage by Citizenship Status in Crellin
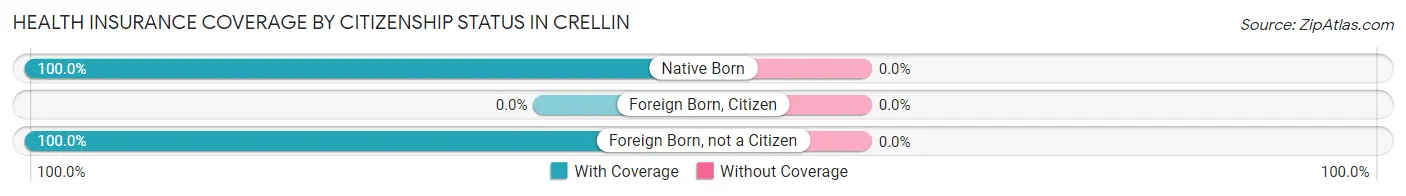
| Citizenship Status | With Coverage | Without Coverage |
| Native Born | 39 (100.0%) | 0 (0.0%) |
| Foreign Born, Citizen | 0 (0.0%) | 0 (0.0%) |
| Foreign Born, not a Citizen | 30 (100.0%) | 0 (0.0%) |
Health Insurance Coverage by Household Income in Crellin
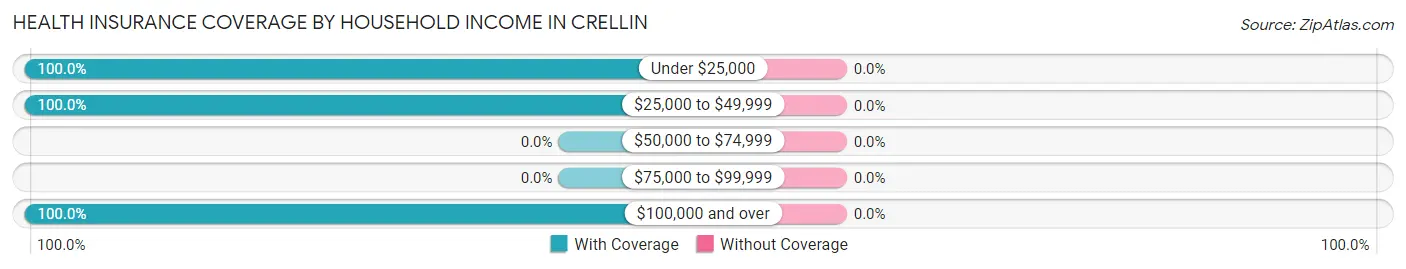
| Household Income | With Coverage | Without Coverage |
| Under $25,000 | 26 (100.0%) | 0 (0.0%) |
| $25,000 to $49,999 | 16 (100.0%) | 0 (0.0%) |
| $50,000 to $74,999 | 0 (0.0%) | 0 (0.0%) |
| $75,000 to $99,999 | 0 (0.0%) | 0 (0.0%) |
| $100,000 and over | 152 (100.0%) | 0 (0.0%) |
Public vs Private Health Insurance Coverage by Age in Crellin
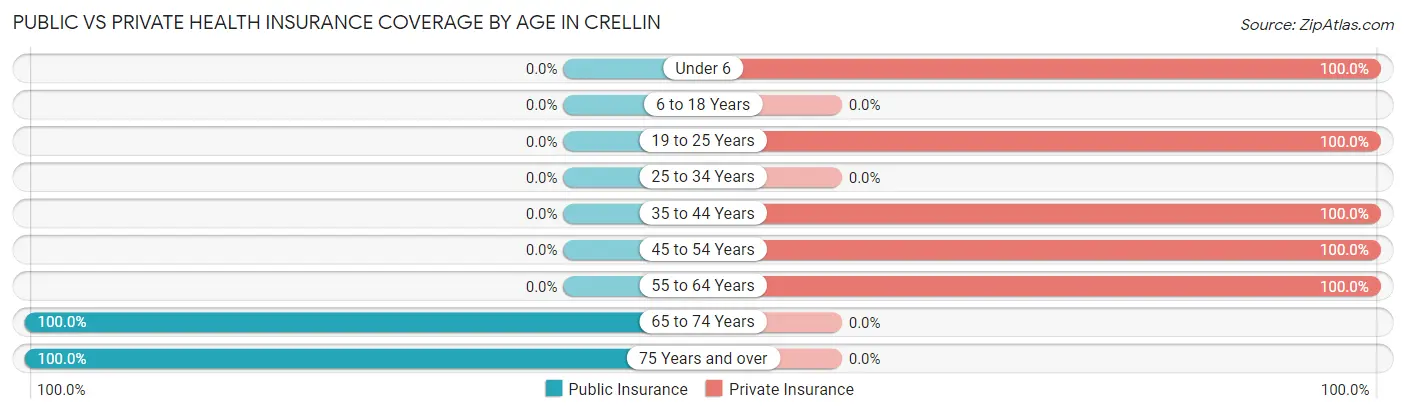
| Age Bracket | Public Insurance | Private Insurance |
| Under 6 | 0 (0.0%) | 39 (100.0%) |
| 6 to 18 Years | 0 (0.0%) | 0 (0.0%) |
| 19 to 25 Years | 0 (0.0%) | 30 (100.0%) |
| 25 to 34 Years | 0 (0.0%) | 0 (0.0%) |
| 35 to 44 Years | 0 (0.0%) | 20 (100.0%) |
| 45 to 54 Years | 0 (0.0%) | 47 (100.0%) |
| 55 to 64 Years | 0 (0.0%) | 16 (100.0%) |
| 65 to 74 Years | 26 (100.0%) | 0 (0.0%) |
| 75 Years and over | 16 (100.0%) | 0 (0.0%) |
| Total | 42 (21.6%) | 152 (78.3%) |
Disability Status by Sex by Age in Crellin
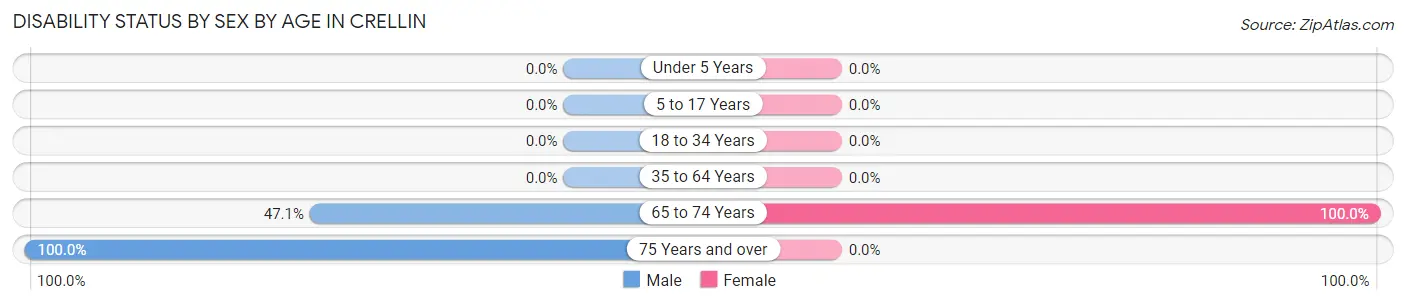
| Age Bracket | Male | Female |
| Under 5 Years | 0 (0.0%) | 0 (0.0%) |
| 5 to 17 Years | 0 (0.0%) | 0 (0.0%) |
| 18 to 34 Years | 0 (0.0%) | 0 (0.0%) |
| 35 to 64 Years | 0 (0.0%) | 0 (0.0%) |
| 65 to 74 Years | 8 (47.1%) | 9 (100.0%) |
| 75 Years and over | 16 (100.0%) | 0 (0.0%) |
Disability Class by Sex by Age in Crellin
Disability Class: Hearing Difficulty
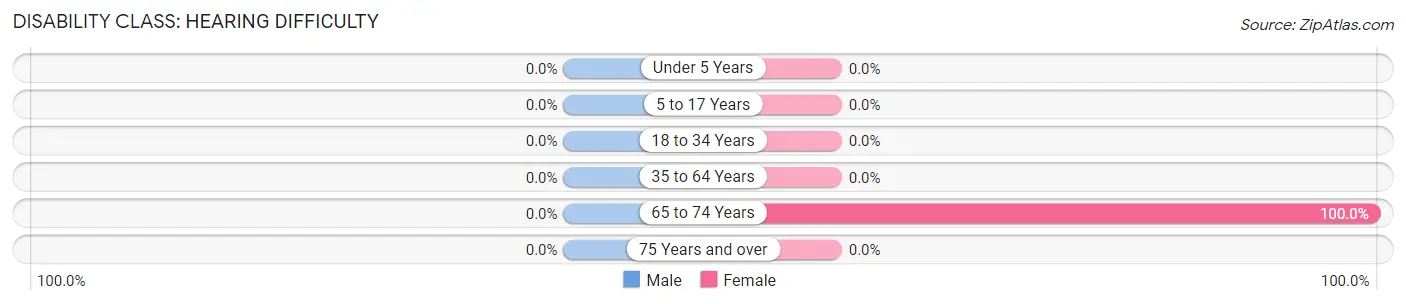
| Age Bracket | Male | Female |
| Under 5 Years | 0 (0.0%) | 0 (0.0%) |
| 5 to 17 Years | 0 (0.0%) | 0 (0.0%) |
| 18 to 34 Years | 0 (0.0%) | 0 (0.0%) |
| 35 to 64 Years | 0 (0.0%) | 0 (0.0%) |
| 65 to 74 Years | 0 (0.0%) | 9 (100.0%) |
| 75 Years and over | 0 (0.0%) | 0 (0.0%) |
Disability Class: Vision Difficulty
| Age Bracket | Male | Female |
| Under 5 Years | 0 (0.0%) | 0 (0.0%) |
| 5 to 17 Years | 0 (0.0%) | 0 (0.0%) |
| 18 to 34 Years | 0 (0.0%) | 0 (0.0%) |
| 35 to 64 Years | 0 (0.0%) | 0 (0.0%) |
| 65 to 74 Years | 0 (0.0%) | 0 (0.0%) |
| 75 Years and over | 0 (0.0%) | 0 (0.0%) |
Disability Class: Cognitive Difficulty
| Age Bracket | Male | Female |
| 5 to 17 Years | 0 (0.0%) | 0 (0.0%) |
| 18 to 34 Years | 0 (0.0%) | 0 (0.0%) |
| 35 to 64 Years | 0 (0.0%) | 0 (0.0%) |
| 65 to 74 Years | 0 (0.0%) | 0 (0.0%) |
| 75 Years and over | 0 (0.0%) | 0 (0.0%) |
Disability Class: Ambulatory Difficulty
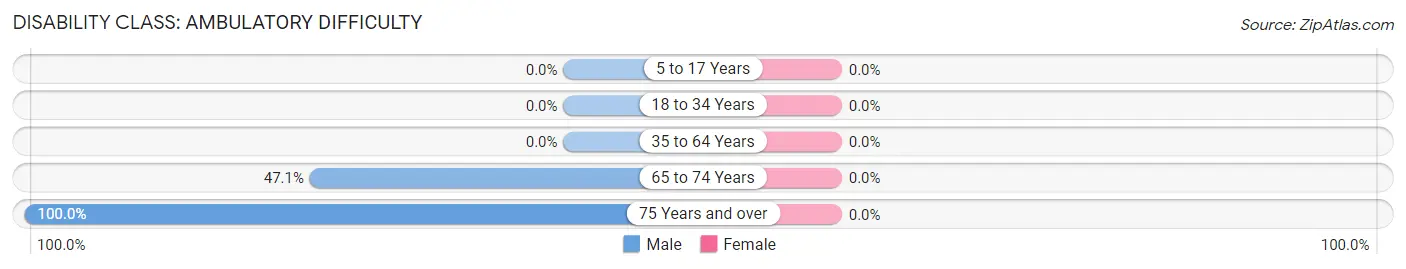
| Age Bracket | Male | Female |
| 5 to 17 Years | 0 (0.0%) | 0 (0.0%) |
| 18 to 34 Years | 0 (0.0%) | 0 (0.0%) |
| 35 to 64 Years | 0 (0.0%) | 0 (0.0%) |
| 65 to 74 Years | 8 (47.1%) | 0 (0.0%) |
| 75 Years and over | 16 (100.0%) | 0 (0.0%) |
Disability Class: Self-Care Difficulty
| Age Bracket | Male | Female |
| 5 to 17 Years | 0 (0.0%) | 0 (0.0%) |
| 18 to 34 Years | 0 (0.0%) | 0 (0.0%) |
| 35 to 64 Years | 0 (0.0%) | 0 (0.0%) |
| 65 to 74 Years | 0 (0.0%) | 0 (0.0%) |
| 75 Years and over | 0 (0.0%) | 0 (0.0%) |
Technology Access in Crellin
Computing Device Access in Crellin
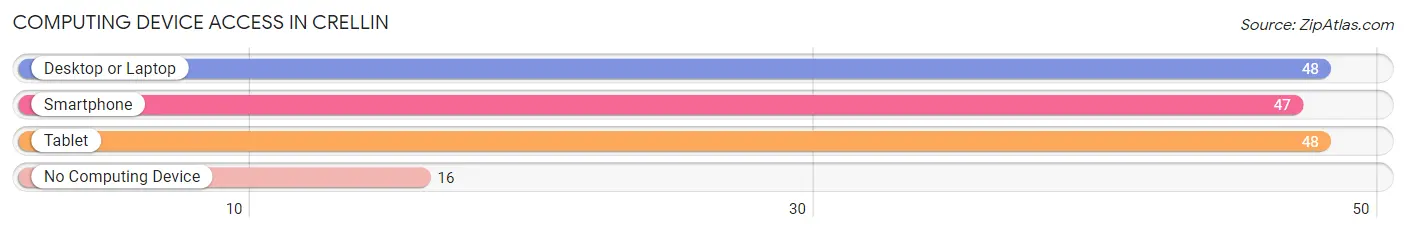
| Device Type | # Households | % Households |
| Desktop or Laptop | 48 | 66.7% |
| Smartphone | 47 | 65.3% |
| Tablet | 48 | 66.7% |
| No Computing Device | 16 | 22.2% |
| Total | 72 | 100.0% |
Internet Access in Crellin
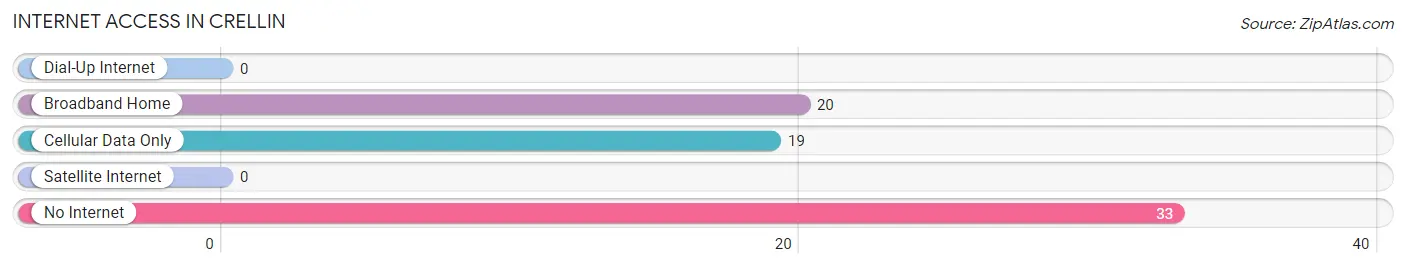
| Internet Type | # Households | % Households |
| Dial-Up Internet | 0 | 0.0% |
| Broadband Home | 20 | 27.8% |
| Cellular Data Only | 19 | 26.4% |
| Satellite Internet | 0 | 0.0% |
| No Internet | 33 | 45.8% |
| Total | 72 | 100.0% |
Crellin Summary
History
Crellin is a small town located in Garrett County, Maryland. It was founded in 1872 by a group of settlers from Pennsylvania. The town was named after the Crellin family, who were among the first settlers. The town was originally a farming community, but over the years it has become a popular tourist destination.
The town has a rich history, which includes the Civil War. During the war, the town was occupied by Confederate forces. The town was also the site of a skirmish between Union and Confederate forces in 1864.
The town has also been home to several notable people, including former Maryland Governor William Preston Lane, Jr., who was born in Crellin in 1892.
Geography
Crellin is located in the Appalachian Mountains of western Maryland. The town is situated in a valley surrounded by mountains, and is located near the Potomac River. The town is located at an elevation of 1,890 feet above sea level.
The town is located in a temperate climate, with hot summers and cold winters. The average annual temperature is around 50 degrees Fahrenheit. The town receives an average of 40 inches of precipitation per year.
Economy
Crellin is a small town with a population of just over 1,000 people. The town's economy is largely based on tourism, as it is a popular destination for outdoor activities such as fishing, hunting, and camping. The town also has several small businesses, including restaurants, shops, and a few bed and breakfasts.
Demographics
As of the 2010 census, the population of Crellin was 1,072. The racial makeup of the town was 97.2% White, 0.9% African American, 0.3% Native American, 0.2% Asian, 0.1% Pacific Islander, and 0.3% from other races. The median household income was $37,500, and the median family income was $45,000. The per capita income was $19,000. The town has a poverty rate of 11.3%.
Common Questions
What is the Total Population of Crellin?
Total Population of Crellin is 194.
What is the Total Male Population of Crellin?
Total Male Population of Crellin is 77.
What is the Total Female Population of Crellin?
Total Female Population of Crellin is 117.
What is the Ratio of Males per 100 Females in Crellin?
There are 65.81 Males per 100 Females in Crellin.
What is the Ratio of Females per 100 Males in Crellin?
There are 151.95 Females per 100 Males in Crellin.
What is the Median Population Age in Crellin?
Median Population Age in Crellin is 45.3 Years.
What is the Average Family Size in Crellin
Average Family Size in Crellin is 3.5 People.
What is the Average Household Size in Crellin
Average Household Size in Crellin is 2.7 People.
What is Per Capita Income in Crellin?
Per Capita income in Crellin is $44,105.
What is the Median Family Income in Crellin?
Median Family Income in Crellin is $174,375.
What is Inequality or Gini Index in Crellin?
Inequality or Gini Index in Crellin is 0.36.
How Large is the Labor Force in Crellin?
There are 113 People in the Labor Forcein in Crellin.
What is the Percentage of People in the Labor Force in Crellin?
72.9% of People are in the Labor Force in Crellin.