Worcester County, MD
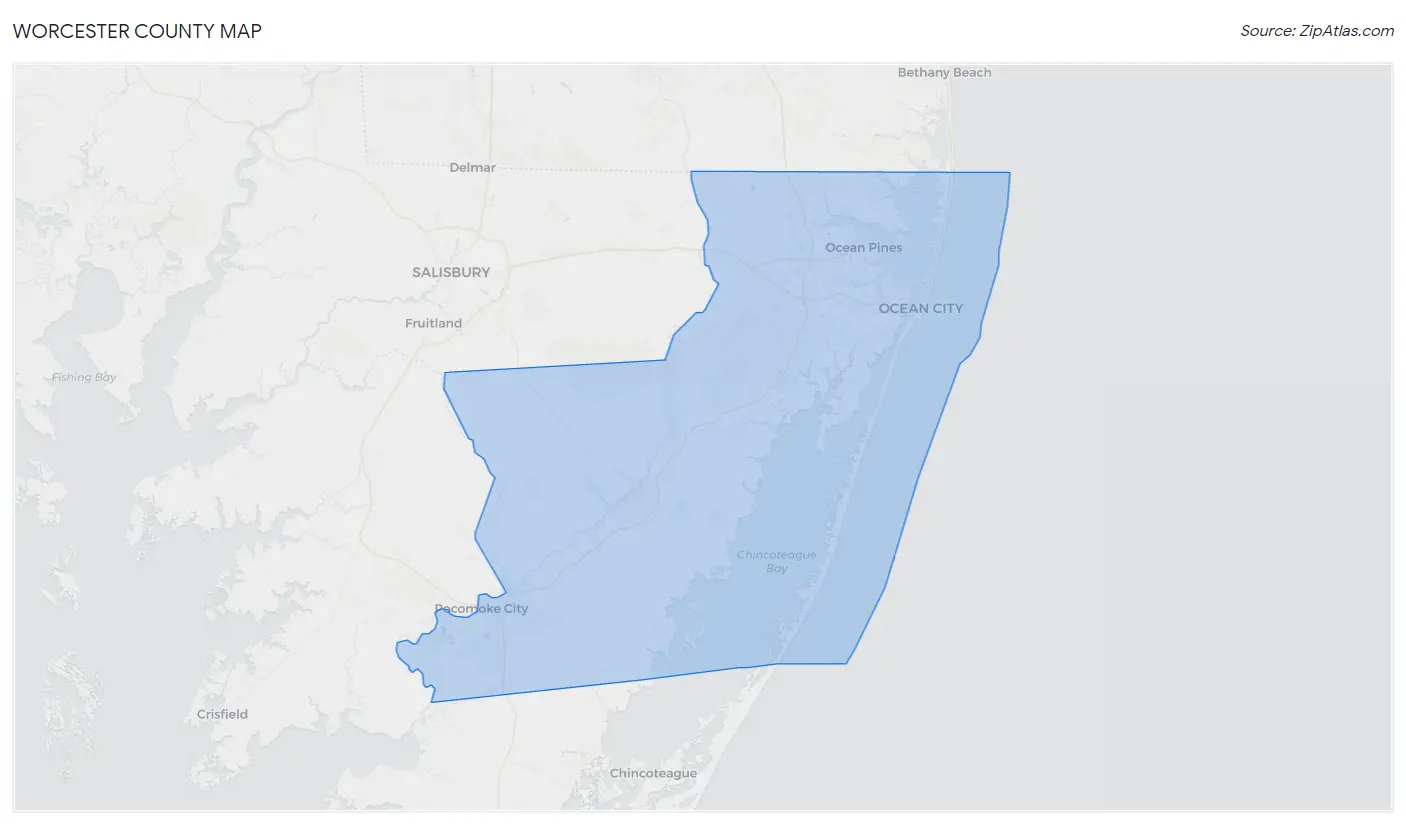
Worcester County Map
Worcester County Overview
52,827
TOTAL POPULATION
25,841
MALE POPULATION
26,986
FEMALE POPULATION
95.76
MALES / 100 FEMALES
104.43
FEMALES / 100 MALES
50.6
MEDIAN AGE
2.8
AVG FAMILY SIZE
2.2
AVG HOUSEHOLD SIZE
$48,769
PER CAPITA INCOME
$97,408
AVG FAMILY INCOME
$76,689
AVG HOUSEHOLD INCOME
21.6%
WAGE / INCOME GAP [ % ]
78.4¢/ $1
WAGE / INCOME GAP [ $ ]
$9,823
FAMILY INCOME DEFICIT
0.48
INEQUALITY / GINI INDEX
26,465
LABOR FORCE [ PEOPLE ]
59.0%
PERCENT IN LABOR FORCE
6.5%
UNEMPLOYMENT RATE
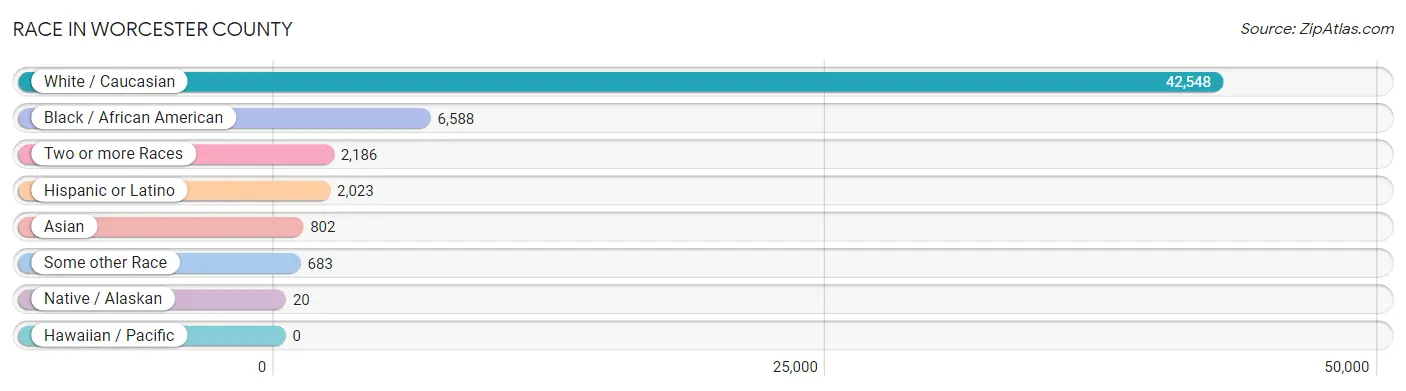
Race in Worcester County
The most populous races in Worcester County are White / Caucasian (42,548 | 80.5%), Black / African American (6,588 | 12.5%), and Two or more Races (2,186 | 4.1%).
| Race | # Population | % Population |
| Asian | 802 | 1.5% |
| Black / African American | 6,588 | 12.5% |
| Hawaiian / Pacific | 0 | 0.0% |
| Hispanic or Latino | 2,023 | 3.8% |
| Native / Alaskan | 20 | 0.0% |
| White / Caucasian | 42,548 | 80.5% |
| Two or more Races | 2,186 | 4.1% |
| Some other Race | 683 | 1.3% |
| Total | 52,827 | 100.0% |
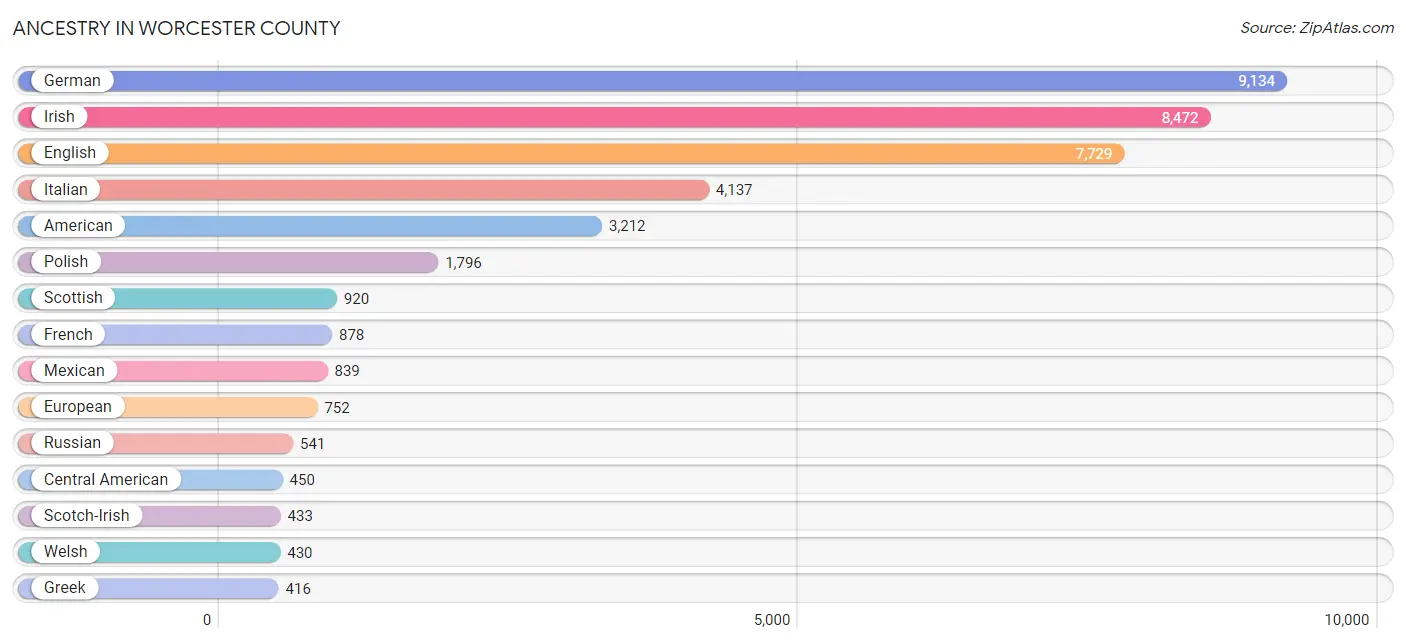
Ancestry in Worcester County
The most populous ancestries reported in Worcester County are German (9,134 | 17.3%), Irish (8,472 | 16.0%), English (7,729 | 14.6%), Italian (4,137 | 7.8%), and American (3,212 | 6.1%), together accounting for 61.9% of all Worcester County residents.
| Ancestry | # Population | % Population |
| African | 190 | 0.4% |
| Albanian | 19 | 0.0% |
| American | 3,212 | 6.1% |
| Arab | 88 | 0.2% |
| Argentinean | 41 | 0.1% |
| Armenian | 84 | 0.2% |
| Austrian | 130 | 0.3% |
| Barbadian | 42 | 0.1% |
| Belgian | 18 | 0.0% |
| Bhutanese | 63 | 0.1% |
| Blackfeet | 35 | 0.1% |
| British | 366 | 0.7% |
| British West Indian | 46 | 0.1% |
| Bulgarian | 12 | 0.0% |
| Burmese | 66 | 0.1% |
| Canadian | 38 | 0.1% |
| Cape Verdean | 15 | 0.0% |
| Central American | 450 | 0.9% |
| Cherokee | 26 | 0.1% |
| Chickasaw | 5 | 0.0% |
| Colombian | 4 | 0.0% |
| Costa Rican | 20 | 0.0% |
| Croatian | 12 | 0.0% |
| Cuban | 162 | 0.3% |
| Czech | 330 | 0.6% |
| Czechoslovakian | 82 | 0.2% |
| Danish | 37 | 0.1% |
| Delaware | 13 | 0.0% |
| Dominican | 33 | 0.1% |
| Dutch | 350 | 0.7% |
| Eastern European | 99 | 0.2% |
| Ecuadorian | 15 | 0.0% |
| Egyptian | 1 | 0.0% |
| English | 7,729 | 14.6% |
| Estonian | 10 | 0.0% |
| Ethiopian | 2 | 0.0% |
| European | 752 | 1.4% |
| Filipino | 18 | 0.0% |
| Finnish | 77 | 0.2% |
| French | 878 | 1.7% |
| French Canadian | 210 | 0.4% |
| German | 9,134 | 17.3% |
| Ghanaian | 56 | 0.1% |
| Greek | 416 | 0.8% |
| Guatemalan | 7 | 0.0% |
| Haitian | 31 | 0.1% |
| Honduran | 37 | 0.1% |
| Hungarian | 363 | 0.7% |
| Icelander | 3 | 0.0% |
| Indian (Asian) | 351 | 0.7% |
| Irish | 8,472 | 16.0% |
| Iroquois | 1 | 0.0% |
| Israeli | 162 | 0.3% |
| Italian | 4,137 | 7.8% |
| Jamaican | 24 | 0.1% |
| Korean | 153 | 0.3% |
| Latvian | 27 | 0.1% |
| Lebanese | 77 | 0.2% |
| Lithuanian | 296 | 0.6% |
| Lumbee | 6 | 0.0% |
| Macedonian | 50 | 0.1% |
| Maltese | 200 | 0.4% |
| Mexican | 839 | 1.6% |
| Mongolian | 18 | 0.0% |
| Nicaraguan | 47 | 0.1% |
| Nigerian | 97 | 0.2% |
| Northern European | 114 | 0.2% |
| Norwegian | 313 | 0.6% |
| Panamanian | 11 | 0.0% |
| Pennsylvania German | 84 | 0.2% |
| Peruvian | 86 | 0.2% |
| Polish | 1,796 | 3.4% |
| Portuguese | 40 | 0.1% |
| Puerto Rican | 189 | 0.4% |
| Romanian | 92 | 0.2% |
| Russian | 541 | 1.0% |
| Salvadoran | 328 | 0.6% |
| Scandinavian | 111 | 0.2% |
| Scotch-Irish | 433 | 0.8% |
| Scottish | 920 | 1.7% |
| Serbian | 53 | 0.1% |
| Sioux | 9 | 0.0% |
| Slavic | 28 | 0.1% |
| Slovak | 322 | 0.6% |
| Slovene | 9 | 0.0% |
| South American | 155 | 0.3% |
| Spaniard | 32 | 0.1% |
| Spanish | 148 | 0.3% |
| Sri Lankan | 255 | 0.5% |
| Subsaharan African | 360 | 0.7% |
| Swedish | 305 | 0.6% |
| Swiss | 45 | 0.1% |
| Syrian | 10 | 0.0% |
| Thai | 239 | 0.4% |
| Turkish | 67 | 0.1% |
| Ugandan | 4 | 0.0% |
| Ukrainian | 281 | 0.5% |
| Venezuelan | 9 | 0.0% |
| Welsh | 430 | 0.8% | View All 99 Rows |
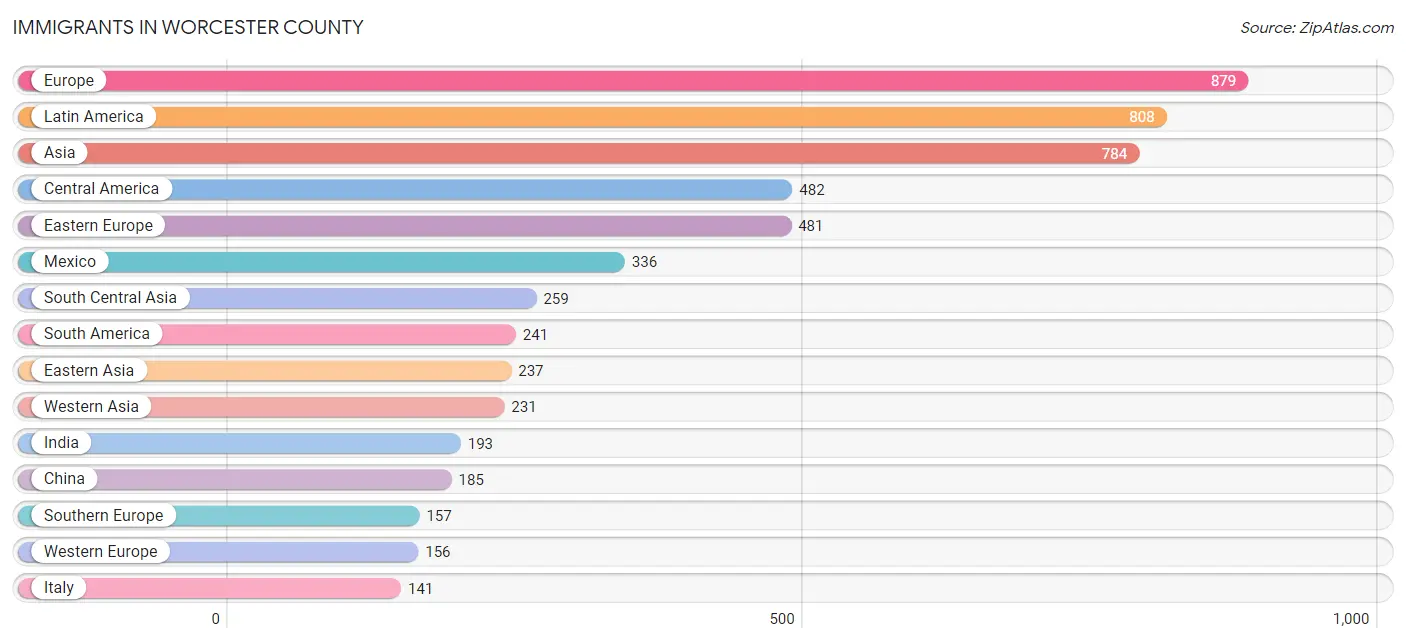
Immigrants in Worcester County
The most numerous immigrant groups reported in Worcester County came from Europe (879 | 1.7%), Latin America (808 | 1.5%), Asia (784 | 1.5%), Central America (482 | 0.9%), and Eastern Europe (481 | 0.9%), together accounting for 6.5% of all Worcester County residents.
| Immigration Origin | # Population | % Population |
| Africa | 73 | 0.1% |
| Argentina | 73 | 0.1% |
| Armenia | 54 | 0.1% |
| Asia | 784 | 1.5% |
| Austria | 28 | 0.1% |
| Belarus | 67 | 0.1% |
| Brazil | 17 | 0.0% |
| Bulgaria | 12 | 0.0% |
| Canada | 26 | 0.1% |
| Caribbean | 85 | 0.2% |
| Central America | 482 | 0.9% |
| China | 185 | 0.4% |
| Colombia | 4 | 0.0% |
| Costa Rica | 1 | 0.0% |
| Dominican Republic | 33 | 0.1% |
| Eastern Africa | 6 | 0.0% |
| Eastern Asia | 237 | 0.4% |
| Eastern Europe | 481 | 0.9% |
| Ecuador | 15 | 0.0% |
| El Salvador | 105 | 0.2% |
| England | 54 | 0.1% |
| Ethiopia | 2 | 0.0% |
| Europe | 879 | 1.7% |
| Germany | 88 | 0.2% |
| Ghana | 26 | 0.1% |
| Greece | 16 | 0.0% |
| Guatemala | 7 | 0.0% |
| Guyana | 71 | 0.1% |
| Honduras | 23 | 0.0% |
| Hong Kong | 27 | 0.1% |
| India | 193 | 0.4% |
| Ireland | 14 | 0.0% |
| Israel | 112 | 0.2% |
| Italy | 141 | 0.3% |
| Japan | 28 | 0.1% |
| Kazakhstan | 15 | 0.0% |
| Korea | 24 | 0.1% |
| Latin America | 808 | 1.5% |
| Mexico | 336 | 0.6% |
| Nepal | 40 | 0.1% |
| Netherlands | 36 | 0.1% |
| Nicaragua | 10 | 0.0% |
| Nigeria | 41 | 0.1% |
| Northern Europe | 85 | 0.2% |
| Pakistan | 11 | 0.0% |
| Peru | 52 | 0.1% |
| Philippines | 1 | 0.0% |
| Poland | 23 | 0.0% |
| Romania | 101 | 0.2% |
| Russia | 69 | 0.1% |
| Serbia | 53 | 0.1% |
| South America | 241 | 0.5% |
| South Central Asia | 259 | 0.5% |
| South Eastern Asia | 57 | 0.1% |
| Southern Europe | 157 | 0.3% |
| St. Vincent and the Grenadines | 46 | 0.1% |
| Switzerland | 4 | 0.0% |
| Taiwan | 18 | 0.0% |
| Trinidad and Tobago | 6 | 0.0% |
| Turkey | 65 | 0.1% |
| Uganda | 4 | 0.0% |
| Ukraine | 118 | 0.2% |
| Venezuela | 9 | 0.0% |
| Vietnam | 56 | 0.1% |
| Western Africa | 67 | 0.1% |
| Western Asia | 231 | 0.4% |
| Western Europe | 156 | 0.3% | View All 67 Rows |
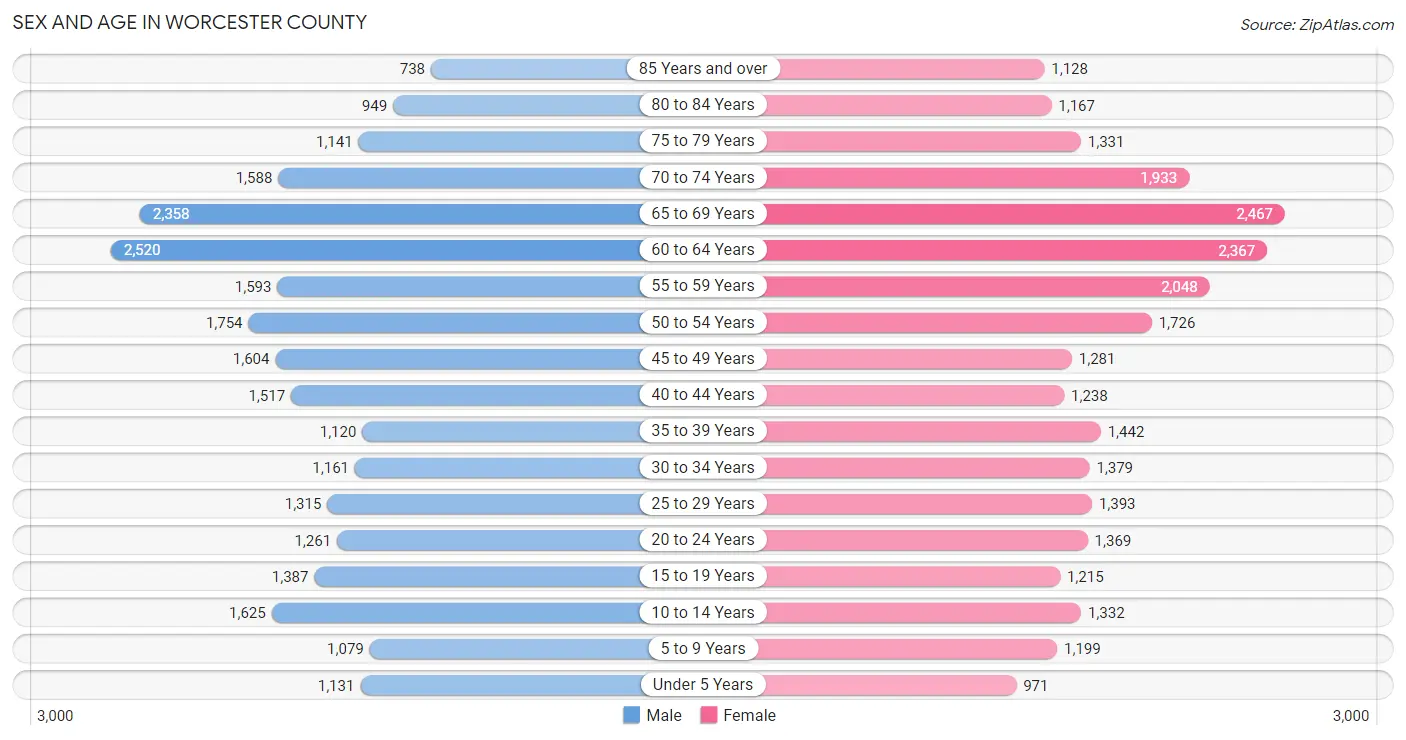
Sex and Age in Worcester County
Sex and Age in Worcester County
The most populous age groups in Worcester County are 60 to 64 Years (2,520 | 9.8%) for men and 65 to 69 Years (2,467 | 9.1%) for women.
| Age Bracket | Male | Female |
| Under 5 Years | 1,131 (4.4%) | 971 (3.6%) |
| 5 to 9 Years | 1,079 (4.2%) | 1,199 (4.4%) |
| 10 to 14 Years | 1,625 (6.3%) | 1,332 (4.9%) |
| 15 to 19 Years | 1,387 (5.4%) | 1,215 (4.5%) |
| 20 to 24 Years | 1,261 (4.9%) | 1,369 (5.1%) |
| 25 to 29 Years | 1,315 (5.1%) | 1,393 (5.2%) |
| 30 to 34 Years | 1,161 (4.5%) | 1,379 (5.1%) |
| 35 to 39 Years | 1,120 (4.3%) | 1,442 (5.3%) |
| 40 to 44 Years | 1,517 (5.9%) | 1,238 (4.6%) |
| 45 to 49 Years | 1,604 (6.2%) | 1,281 (4.8%) |
| 50 to 54 Years | 1,754 (6.8%) | 1,726 (6.4%) |
| 55 to 59 Years | 1,593 (6.2%) | 2,048 (7.6%) |
| 60 to 64 Years | 2,520 (9.8%) | 2,367 (8.8%) |
| 65 to 69 Years | 2,358 (9.1%) | 2,467 (9.1%) |
| 70 to 74 Years | 1,588 (6.1%) | 1,933 (7.2%) |
| 75 to 79 Years | 1,141 (4.4%) | 1,331 (4.9%) |
| 80 to 84 Years | 949 (3.7%) | 1,167 (4.3%) |
| 85 Years and over | 738 (2.9%) | 1,128 (4.2%) |
| Total | 25,841 (100.0%) | 26,986 (100.0%) |
Families and Households in Worcester County
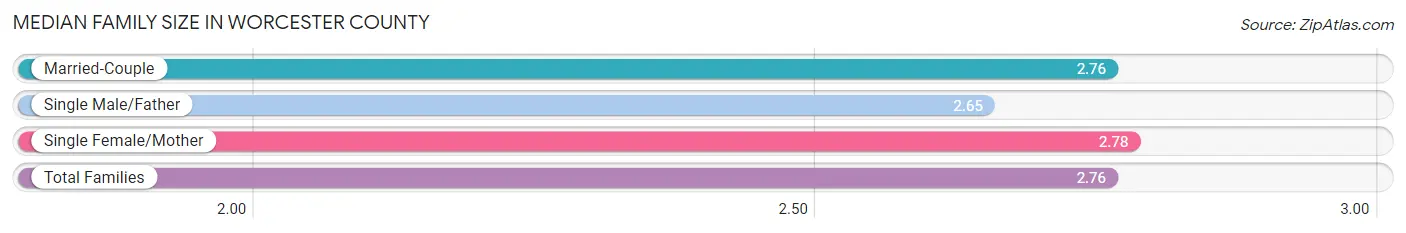
Median Family Size in Worcester County
The median family size in Worcester County is 2.76 persons per family, with single female/mother families (2,628 | 17.6%) accounting for the largest median family size of 2.78 persons per family. On the other hand, single male/father families (858 | 5.7%) represent the smallest median family size with 2.65 persons per family.
| Family Type | # Families | Family Size |
| Married-Couple | 11,473 (76.7%) | 2.76 |
| Single Male/Father | 858 (5.7%) | 2.65 |
| Single Female/Mother | 2,628 (17.6%) | 2.78 |
| Total Families | 14,959 (100.0%) | 2.76 |
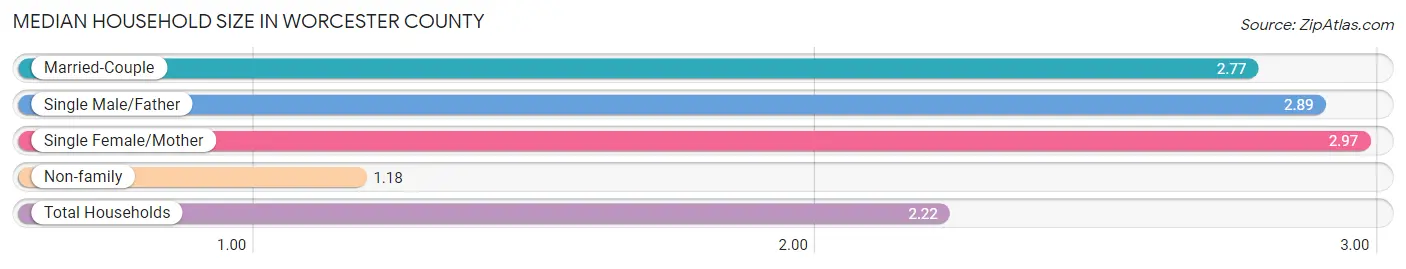
Median Household Size in Worcester County
The median household size in Worcester County is 2.22 persons per household, with single female/mother households (2,628 | 11.2%) accounting for the largest median household size of 2.97 persons per household. non-family households (8,498 | 36.2%) represent the smallest median household size with 1.18 persons per household.
| Household Type | # Households | Household Size |
| Married-Couple | 11,473 (48.9%) | 2.77 |
| Single Male/Father | 858 (3.7%) | 2.89 |
| Single Female/Mother | 2,628 (11.2%) | 2.97 |
| Non-family | 8,498 (36.2%) | 1.18 |
| Total Households | 23,457 (100.0%) | 2.22 |
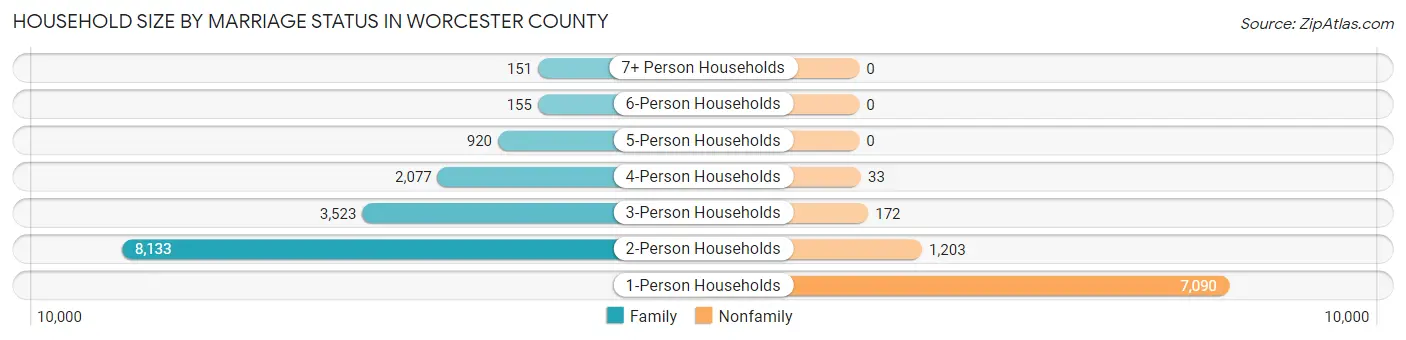
Household Size by Marriage Status in Worcester County
Out of a total of 23,457 households in Worcester County, 14,959 (63.8%) are family households, while 8,498 (36.2%) are nonfamily households. The most numerous type of family households are 2-person households, comprising 8,133, and the most common type of nonfamily households are 1-person households, comprising 7,090.
| Household Size | Family Households | Nonfamily Households |
| 1-Person Households | - | 7,090 (30.2%) |
| 2-Person Households | 8,133 (34.7%) | 1,203 (5.1%) |
| 3-Person Households | 3,523 (15.0%) | 172 (0.7%) |
| 4-Person Households | 2,077 (8.8%) | 33 (0.1%) |
| 5-Person Households | 920 (3.9%) | 0 (0.0%) |
| 6-Person Households | 155 (0.7%) | 0 (0.0%) |
| 7+ Person Households | 151 (0.6%) | 0 (0.0%) |
| Total | 14,959 (63.8%) | 8,498 (36.2%) |
Female Fertility in Worcester County
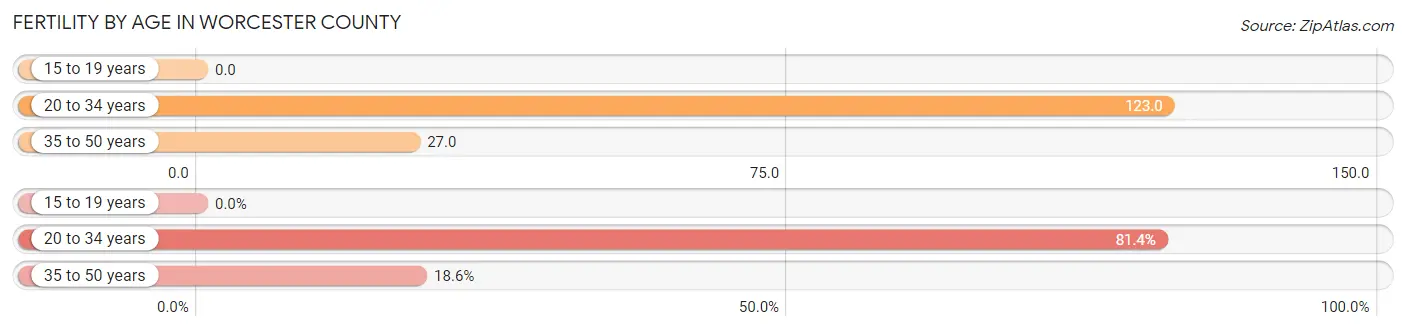
Fertility by Age in Worcester County
Average fertility rate in Worcester County is 65.0 births per 1,000 women. Women in the age bracket of 20 to 34 years have the highest fertility rate with 123.0 births per 1,000 women. Women in the age bracket of 20 to 34 years acount for 81.4% of all women with births.
| Age Bracket | Women with Births | Births / 1,000 Women |
| 15 to 19 years | 0 (0.0%) | 0.0 |
| 20 to 34 years | 508 (81.4%) | 123.0 |
| 35 to 50 years | 116 (18.6%) | 27.0 |
| Total | 624 (100.0%) | 65.0 |
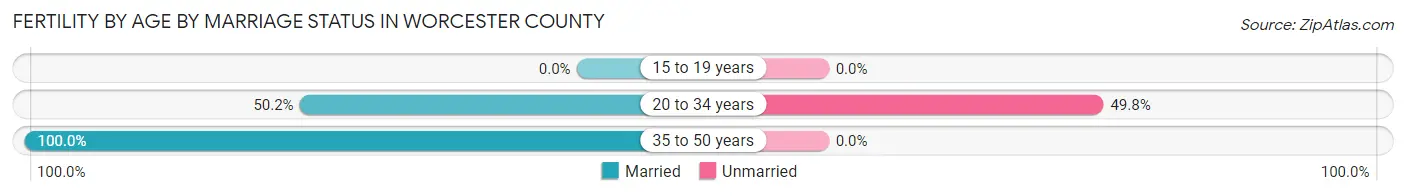
Fertility by Age by Marriage Status in Worcester County
59.5% of women with births (624) in Worcester County are married. The highest percentage of unmarried women with births falls into 20 to 34 years age bracket with 49.8% of them unmarried at the time of birth, while the lowest percentage of unmarried women with births belong to 35 to 50 years age bracket with 0.0% of them unmarried.
| Age Bracket | Married | Unmarried |
| 15 to 19 years | 0 (0.0%) | 0 (0.0%) |
| 20 to 34 years | 255 (50.2%) | 253 (49.8%) |
| 35 to 50 years | 116 (100.0%) | 0 (0.0%) |
| Total | 371 (59.5%) | 253 (40.5%) |
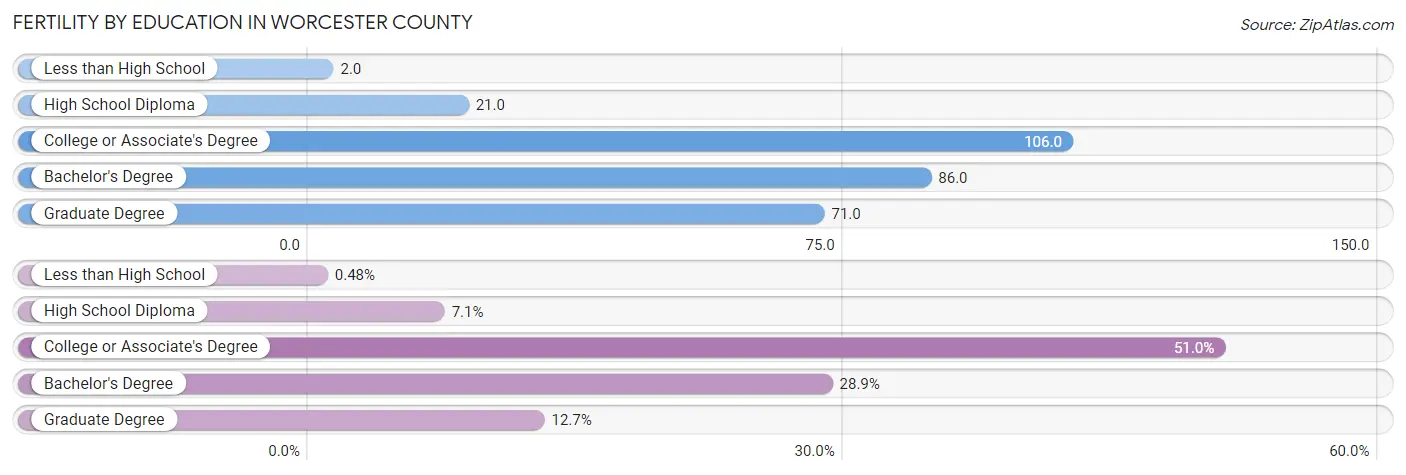
Fertility by Education in Worcester County
Average fertility rate in Worcester County is 65.0 births per 1,000 women. Women with the education attainment of college or associate's degree have the highest fertility rate of 106.0 births per 1,000 women, while women with the education attainment of less than high school have the lowest fertility at 2.0 births per 1,000 women. Women with the education attainment of college or associate's degree represent 51.0% of all women with births.
| Educational Attainment | Women with Births | Births / 1,000 Women |
| Less than High School | 3 (0.5%) | 2.0 |
| High School Diploma | 44 (7.0%) | 21.0 |
| College or Associate's Degree | 318 (51.0%) | 106.0 |
| Bachelor's Degree | 180 (28.8%) | 86.0 |
| Graduate Degree | 79 (12.7%) | 71.0 |
| Total | 624 (100.0%) | 65.0 |
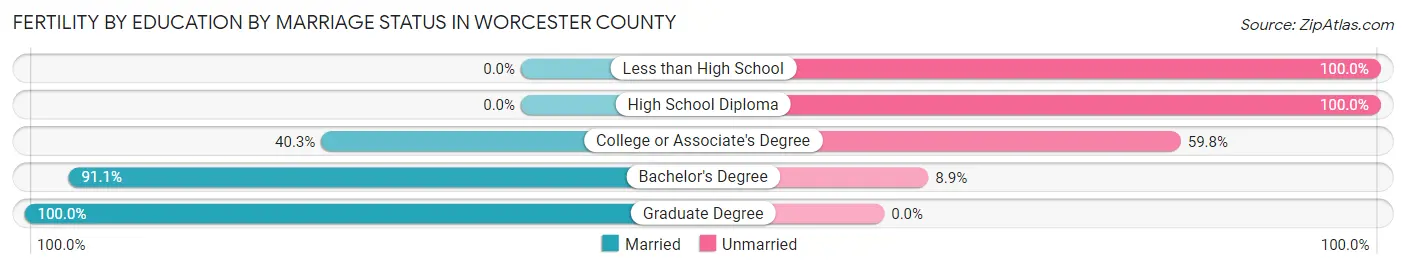
Fertility by Education by Marriage Status in Worcester County
40.5% of women with births in Worcester County are unmarried. Women with the educational attainment of graduate degree are most likely to be married with 100.0% of them married at childbirth, while women with the educational attainment of less than high school are least likely to be married with 100.0% of them unmarried at childbirth.
| Educational Attainment | Married | Unmarried |
| Less than High School | 0 (0.0%) | 3 (100.0%) |
| High School Diploma | 0 (0.0%) | 44 (100.0%) |
| College or Associate's Degree | 128 (40.3%) | 190 (59.8%) |
| Bachelor's Degree | 164 (91.1%) | 16 (8.9%) |
| Graduate Degree | 79 (100.0%) | 0 (0.0%) |
| Total | 371 (59.5%) | 253 (40.5%) |
Income in Worcester County
Income Overview in Worcester County
Per Capita Income in Worcester County is $48,769, while median incomes of families and households are $97,408 and $76,689 respectively.
| Characteristic | Number | Measure |
| Per Capita Income | 52,827 | $48,769 |
| Median Family Income | 14,959 | $97,408 |
| Mean Family Income | 14,959 | $129,618 |
| Median Household Income | 23,457 | $76,689 |
| Mean Household Income | 23,457 | $109,044 |
| Income Deficit | 14,959 | $9,823 |
| Wage / Income Gap (%) | 52,827 | 21.63% |
| Wage / Income Gap ($) | 52,827 | 78.37¢ per $1 |
| Gini / Inequality Index | 52,827 | 0.48 |
Earnings by Sex in Worcester County
Average Earnings in Worcester County are $40,754, $45,533 for men and $35,683 for women, a difference of 21.6%.
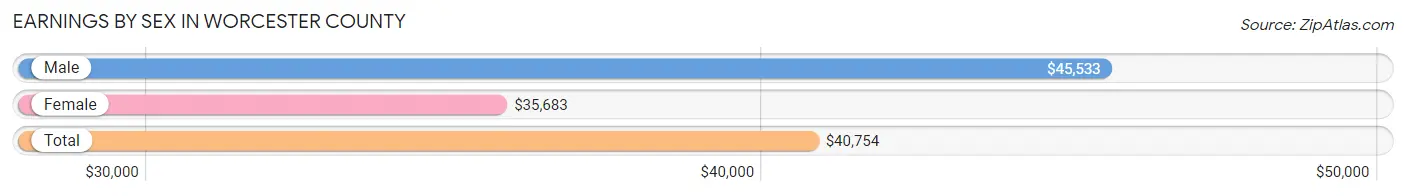
| Sex | Number | Average Earnings |
| Male | 14,378 (51.2%) | $45,533 |
| Female | 13,676 (48.7%) | $35,683 |
| Total | 28,054 (100.0%) | $40,754 |
Earnings by Sex by Income Bracket in Worcester County
The most common earnings brackets in Worcester County are $100,000+ for men (2,725 | 19.0%) and $100,000+ for women (1,263 | 9.2%).
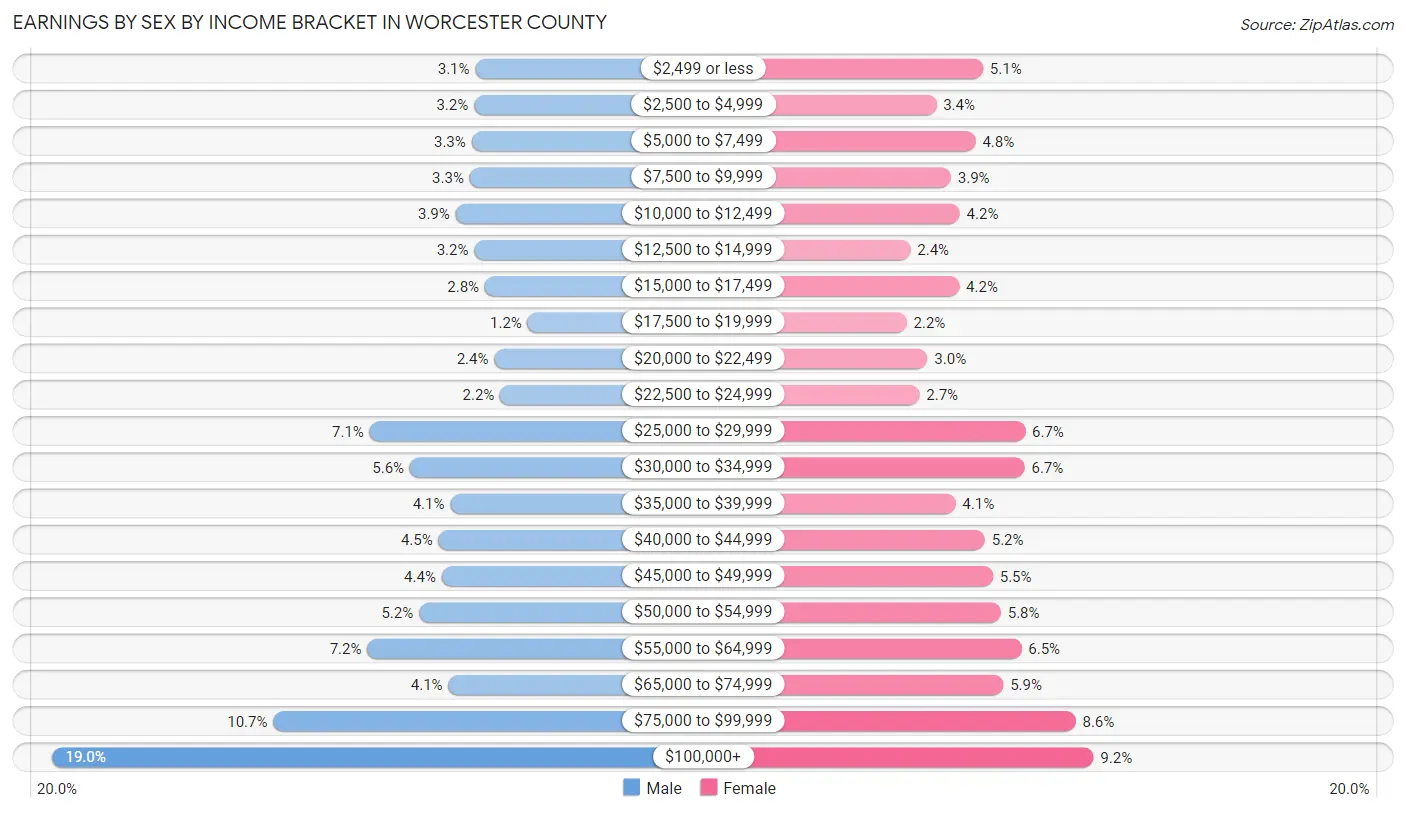
| Income | Male | Female |
| $2,499 or less | 447 (3.1%) | 698 (5.1%) |
| $2,500 to $4,999 | 455 (3.2%) | 458 (3.4%) |
| $5,000 to $7,499 | 468 (3.3%) | 659 (4.8%) |
| $7,500 to $9,999 | 478 (3.3%) | 533 (3.9%) |
| $10,000 to $12,499 | 554 (3.8%) | 578 (4.2%) |
| $12,500 to $14,999 | 453 (3.2%) | 326 (2.4%) |
| $15,000 to $17,499 | 395 (2.8%) | 576 (4.2%) |
| $17,500 to $19,999 | 166 (1.1%) | 307 (2.2%) |
| $20,000 to $22,499 | 345 (2.4%) | 413 (3.0%) |
| $22,500 to $24,999 | 313 (2.2%) | 372 (2.7%) |
| $25,000 to $29,999 | 1,016 (7.1%) | 913 (6.7%) |
| $30,000 to $34,999 | 799 (5.6%) | 911 (6.7%) |
| $35,000 to $39,999 | 582 (4.1%) | 557 (4.1%) |
| $40,000 to $44,999 | 646 (4.5%) | 707 (5.2%) |
| $45,000 to $49,999 | 629 (4.4%) | 748 (5.5%) |
| $50,000 to $54,999 | 750 (5.2%) | 789 (5.8%) |
| $55,000 to $64,999 | 1,029 (7.2%) | 895 (6.5%) |
| $65,000 to $74,999 | 592 (4.1%) | 801 (5.9%) |
| $75,000 to $99,999 | 1,536 (10.7%) | 1,172 (8.6%) |
| $100,000+ | 2,725 (19.0%) | 1,263 (9.2%) |
| Total | 14,378 (100.0%) | 13,676 (100.0%) |
Earnings by Sex by Educational Attainment in Worcester County
Average earnings in Worcester County are $51,142 for men and $41,986 for women, a difference of 17.9%. Men with an educational attainment of graduate degree enjoy the highest average annual earnings of $117,500, while those with high school diploma education earn the least with $37,276. Women with an educational attainment of graduate degree earn the most with the average annual earnings of $62,911, while those with less than high school education have the smallest earnings of $20,313.
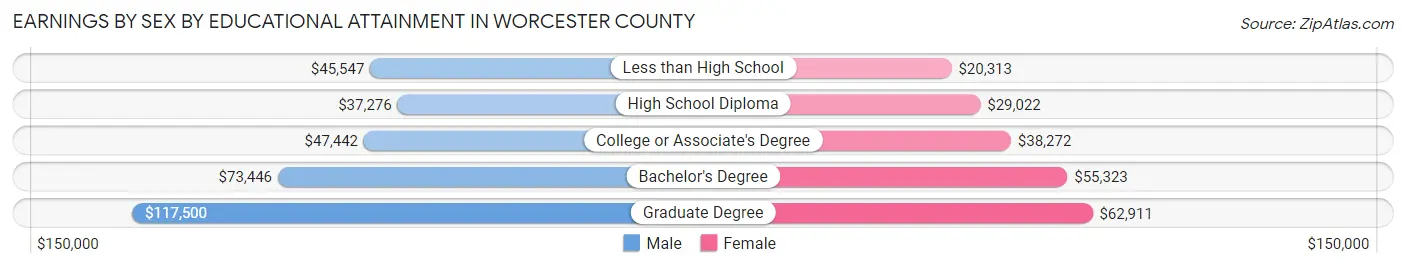
| Educational Attainment | Male Income | Female Income |
| Less than High School | $45,547 | $20,313 |
| High School Diploma | $37,276 | $29,022 |
| College or Associate's Degree | $47,442 | $38,272 |
| Bachelor's Degree | $73,446 | $55,323 |
| Graduate Degree | $117,500 | $62,911 |
| Total | $51,142 | $41,986 |
Family Income in Worcester County
Family Income Brackets in Worcester County
According to the Worcester County family income data, there are 3,426 families falling into the $100,000 to $149,999 income range, which is the most common income bracket and makes up 22.9% of all families. Conversely, the less than $10,000 income bracket is the least frequent group with only 209 families (1.4%) belonging to this category.
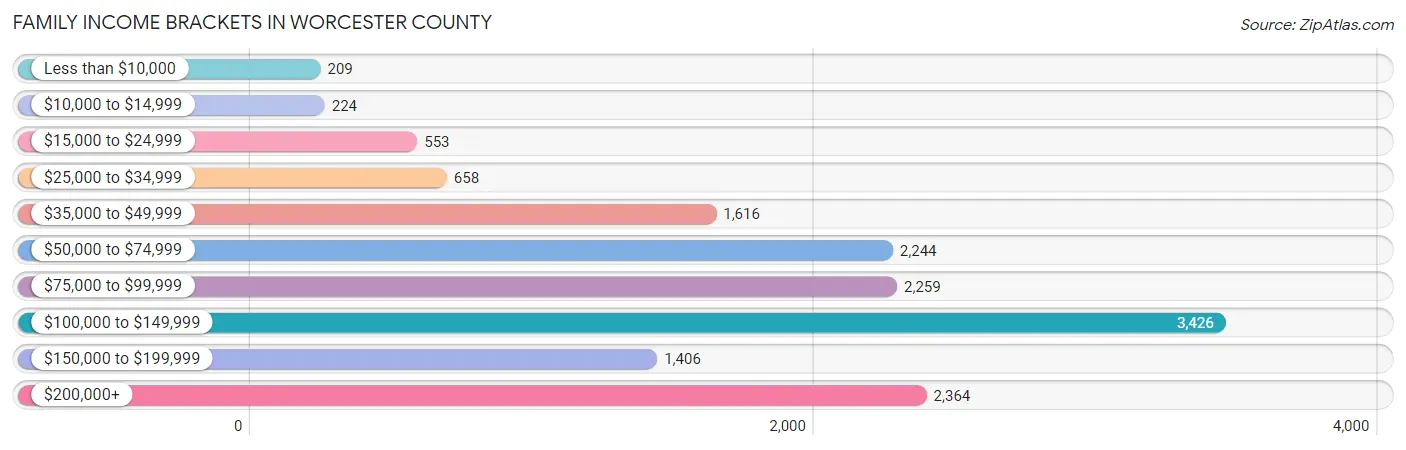
| Income Bracket | # Families | % Families |
| Less than $10,000 | 209 | 1.4% |
| $10,000 to $14,999 | 224 | 1.5% |
| $15,000 to $24,999 | 553 | 3.7% |
| $25,000 to $34,999 | 658 | 4.4% |
| $35,000 to $49,999 | 1,616 | 10.8% |
| $50,000 to $74,999 | 2,244 | 15.0% |
| $75,000 to $99,999 | 2,259 | 15.1% |
| $100,000 to $149,999 | 3,426 | 22.9% |
| $150,000 to $199,999 | 1,406 | 9.4% |
| $200,000+ | 2,364 | 15.8% |
Family Income by Famaliy Size in Worcester County
7+ person families (127 | 0.9%) account for the highest median family income in Worcester County with $123,646 per family, while 2-person families (8,488 | 56.7%) have the highest median income of $44,792 per family member.
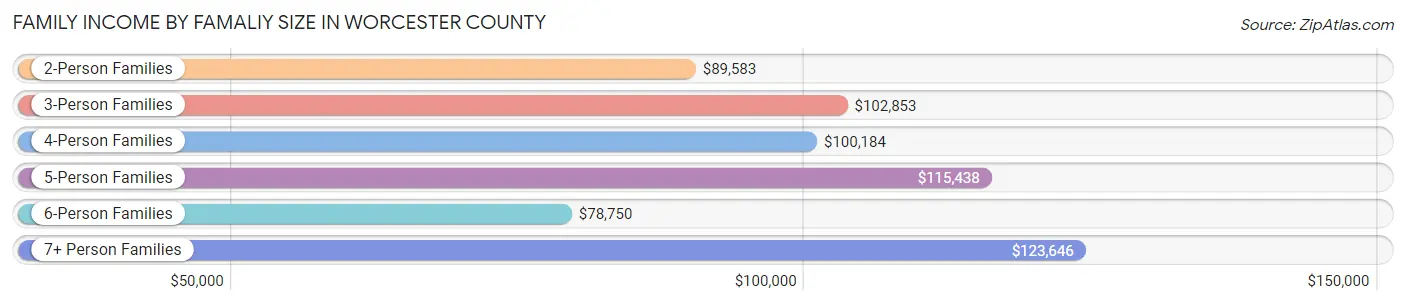
| Income Bracket | # Families | Median Income |
| 2-Person Families | 8,488 (56.7%) | $89,583 |
| 3-Person Families | 3,381 (22.6%) | $102,853 |
| 4-Person Families | 1,975 (13.2%) | $100,184 |
| 5-Person Families | 858 (5.7%) | $115,438 |
| 6-Person Families | 130 (0.9%) | $78,750 |
| 7+ Person Families | 127 (0.9%) | $123,646 |
| Total | 14,959 (100.0%) | $97,408 |
Family Income by Number of Earners in Worcester County
The median family income in Worcester County is $97,408, with families comprising 3+ earners (1,430) having the highest median family income of $151,818, while families with no earners (2,918) have the lowest median family income of $63,679, accounting for 9.6% and 19.5% of families, respectively.
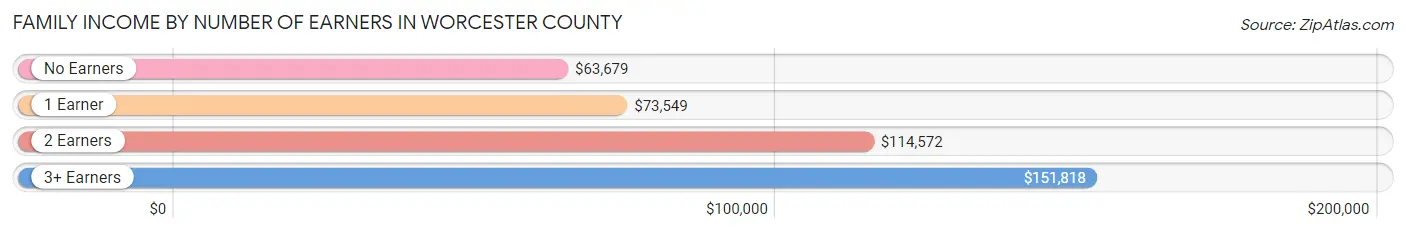
| Number of Earners | # Families | Median Income |
| No Earners | 2,918 (19.5%) | $63,679 |
| 1 Earner | 4,831 (32.3%) | $73,549 |
| 2 Earners | 5,780 (38.6%) | $114,572 |
| 3+ Earners | 1,430 (9.6%) | $151,818 |
| Total | 14,959 (100.0%) | $97,408 |
Household Income in Worcester County
Household Income Brackets in Worcester County
With 4,340 households falling in the category, the $100,000 to $149,999 income range is the most frequent in Worcester County, accounting for 18.5% of all households. In contrast, only 657 households (2.8%) fall into the $10,000 to $14,999 income bracket, making it the least populous group.
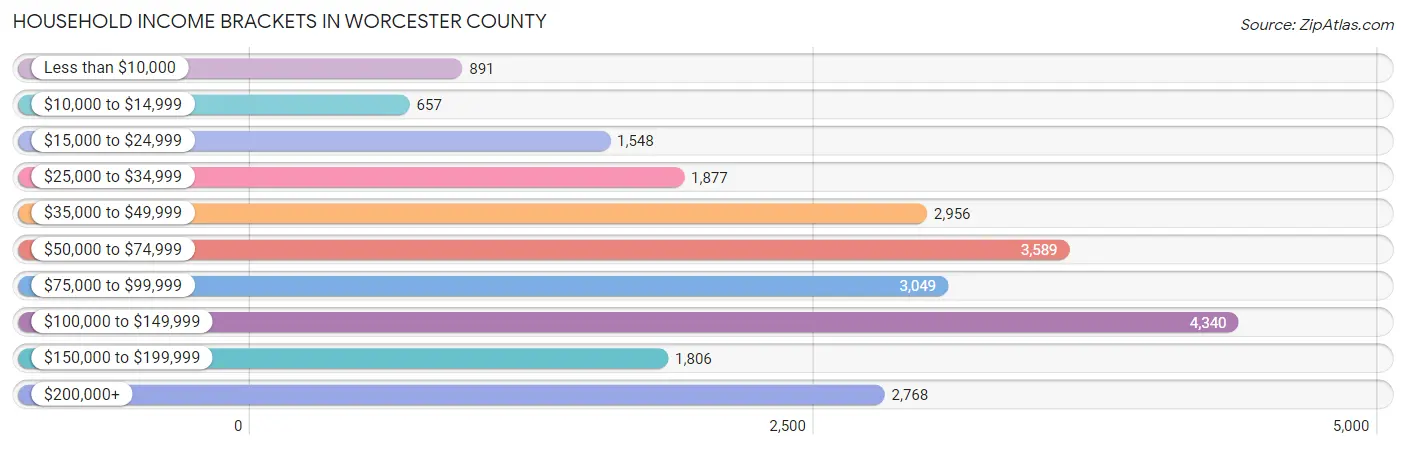
| Income Bracket | # Households | % Households |
| Less than $10,000 | 891 | 3.8% |
| $10,000 to $14,999 | 657 | 2.8% |
| $15,000 to $24,999 | 1,548 | 6.6% |
| $25,000 to $34,999 | 1,877 | 8.0% |
| $35,000 to $49,999 | 2,956 | 12.6% |
| $50,000 to $74,999 | 3,589 | 15.3% |
| $75,000 to $99,999 | 3,049 | 13.0% |
| $100,000 to $149,999 | 4,340 | 18.5% |
| $150,000 to $199,999 | 1,806 | 7.7% |
| $200,000+ | 2,768 | 11.8% |
Household Income by Householder Age in Worcester County
The median household income in Worcester County is $76,689, with the highest median household income of $93,698 found in the 25 to 44 years age bracket for the primary householder. A total of 5,058 households (21.6%) fall into this category. Meanwhile, the 15 to 24 years age bracket for the primary householder has the lowest median household income of $32,056, with 634 households (2.7%) in this group.
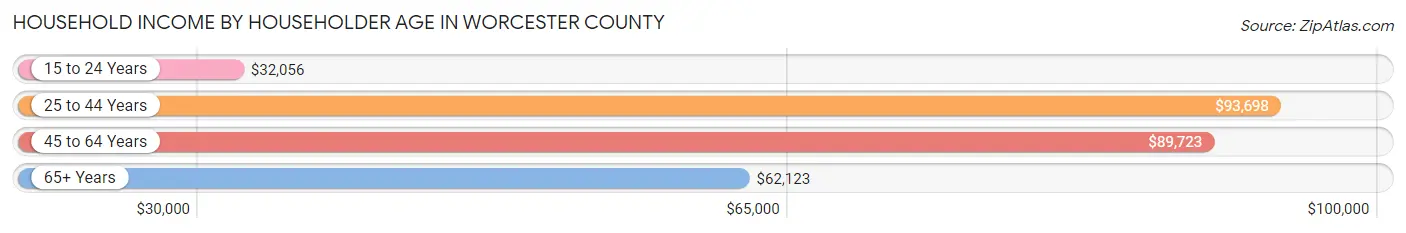
| Income Bracket | # Households | Median Income |
| 15 to 24 Years | 634 (2.7%) | $32,056 |
| 25 to 44 Years | 5,058 (21.6%) | $93,698 |
| 45 to 64 Years | 8,387 (35.7%) | $89,723 |
| 65+ Years | 9,378 (40.0%) | $62,123 |
| Total | 23,457 (100.0%) | $76,689 |
Poverty in Worcester County
Income Below Poverty by Sex and Age in Worcester County
With 7.1% poverty level for males and 9.2% for females among the residents of Worcester County, 5 year old males and 5 year old females are the most vulnerable to poverty, with 29 males (23.8%) and 55 females (26.8%) in their respective age groups living below the poverty level.
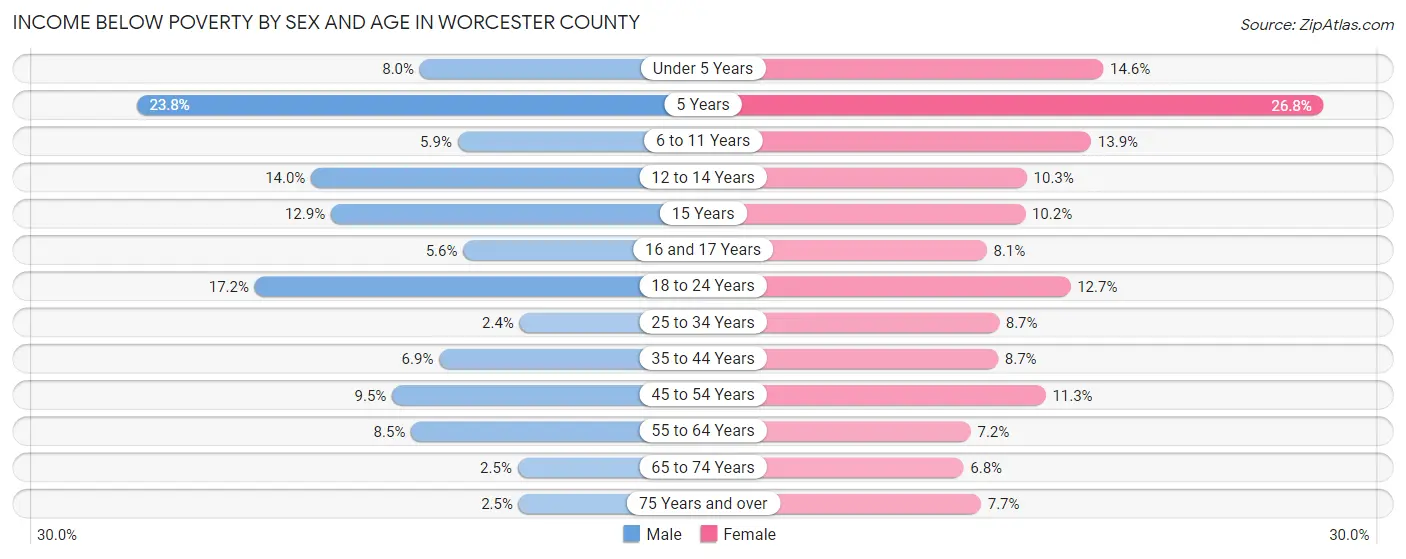
| Age Bracket | Male | Female |
| Under 5 Years | 88 (8.0%) | 139 (14.5%) |
| 5 Years | 29 (23.8%) | 55 (26.8%) |
| 6 to 11 Years | 80 (5.9%) | 196 (13.9%) |
| 12 to 14 Years | 170 (14.0%) | 93 (10.3%) |
| 15 Years | 44 (12.9%) | 30 (10.2%) |
| 16 and 17 Years | 30 (5.6%) | 44 (8.1%) |
| 18 to 24 Years | 295 (17.2%) | 221 (12.7%) |
| 25 to 34 Years | 58 (2.4%) | 242 (8.7%) |
| 35 to 44 Years | 179 (6.9%) | 233 (8.7%) |
| 45 to 54 Years | 316 (9.5%) | 341 (11.3%) |
| 55 to 64 Years | 347 (8.5%) | 316 (7.2%) |
| 65 to 74 Years | 100 (2.5%) | 295 (6.8%) |
| 75 Years and over | 68 (2.5%) | 266 (7.7%) |
| Total | 1,804 (7.1%) | 2,471 (9.2%) |
Income Above Poverty by Sex and Age in Worcester County
According to the poverty statistics in Worcester County, males aged 25 to 34 years and females aged 65 to 74 years are the age groups that are most secure financially, with 97.6% of males and 93.2% of females in these age groups living above the poverty line.
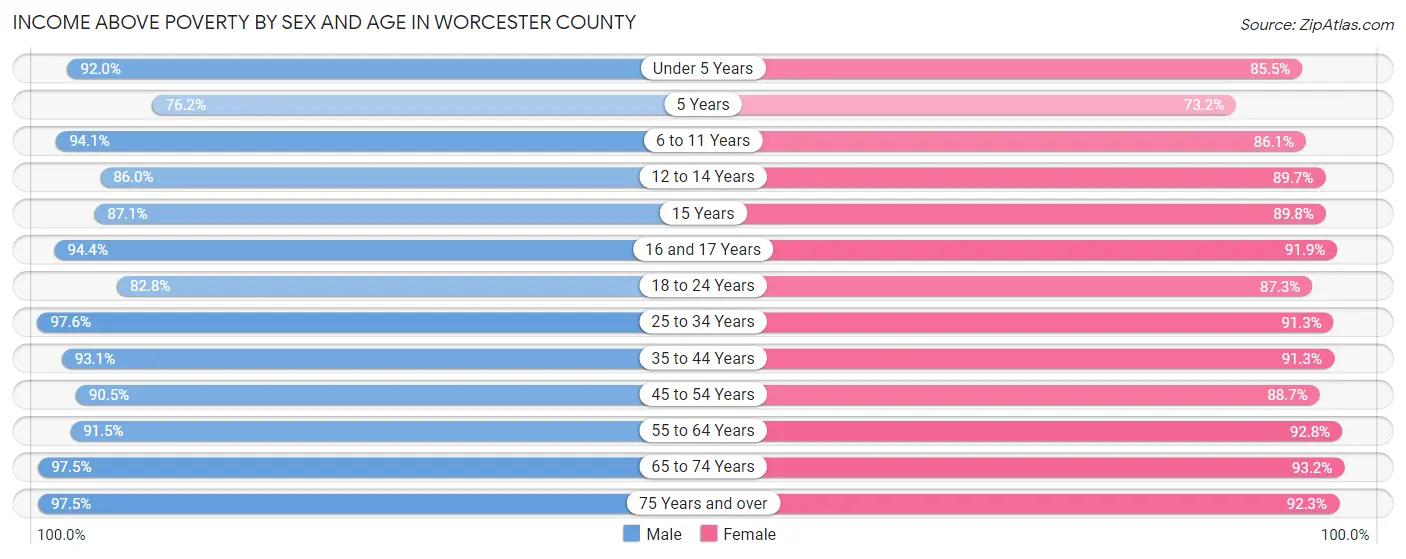
| Age Bracket | Male | Female |
| Under 5 Years | 1,013 (92.0%) | 816 (85.5%) |
| 5 Years | 93 (76.2%) | 150 (73.2%) |
| 6 to 11 Years | 1,280 (94.1%) | 1,217 (86.1%) |
| 12 to 14 Years | 1,041 (86.0%) | 811 (89.7%) |
| 15 Years | 296 (87.1%) | 264 (89.8%) |
| 16 and 17 Years | 509 (94.4%) | 502 (91.9%) |
| 18 to 24 Years | 1,422 (82.8%) | 1,516 (87.3%) |
| 25 to 34 Years | 2,329 (97.6%) | 2,526 (91.3%) |
| 35 to 44 Years | 2,412 (93.1%) | 2,447 (91.3%) |
| 45 to 54 Years | 2,999 (90.5%) | 2,666 (88.7%) |
| 55 to 64 Years | 3,751 (91.5%) | 4,089 (92.8%) |
| 65 to 74 Years | 3,840 (97.5%) | 4,062 (93.2%) |
| 75 Years and over | 2,672 (97.5%) | 3,169 (92.3%) |
| Total | 23,657 (92.9%) | 24,235 (90.7%) |
Income Below Poverty Among Married-Couple Families in Worcester County
The poverty statistics for married-couple families in Worcester County show that 2.8% or 315 of the total 11,473 families live below the poverty line. Families with 1 or 2 children have the highest poverty rate of 3.7%, comprising of 102 families. On the other hand, families with 5 or more children have the lowest poverty rate of 0.0%, which includes 0 families.
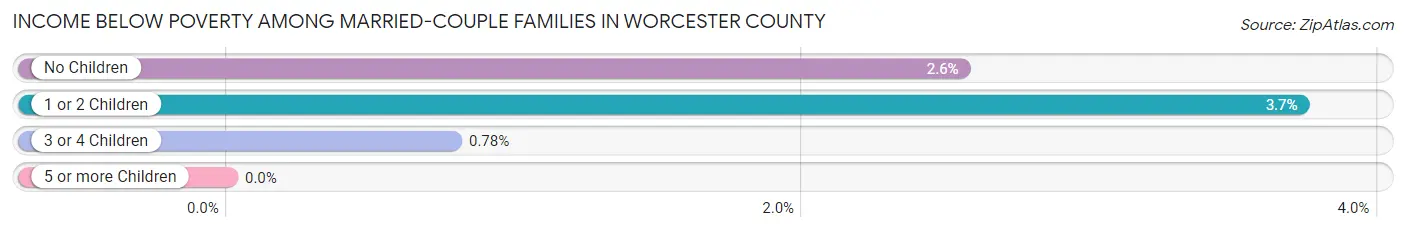
| Children | Above Poverty | Below Poverty |
| No Children | 7,989 (97.5%) | 209 (2.5%) |
| 1 or 2 Children | 2,633 (96.3%) | 102 (3.7%) |
| 3 or 4 Children | 508 (99.2%) | 4 (0.8%) |
| 5 or more Children | 28 (100.0%) | 0 (0.0%) |
| Total | 11,158 (97.3%) | 315 (2.8%) |
Income Below Poverty Among Single-Parent Households in Worcester County
According to the poverty data in Worcester County, 7.6% or 65 single-father households and 14.5% or 381 single-mother households are living below the poverty line. Among single-father households, those with 1 or 2 children have the highest poverty rate, with 61 households (15.8%) experiencing poverty. Likewise, among single-mother households, those with 5 or more children have the highest poverty rate, with 5 households (27.8%) falling below the poverty line.
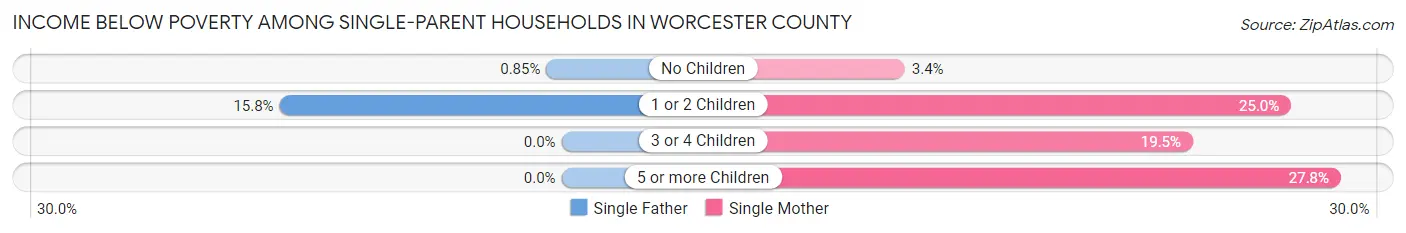
| Children | Single Father | Single Mother |
| No Children | 4 (0.9%) | 42 (3.4%) |
| 1 or 2 Children | 61 (15.8%) | 294 (25.0%) |
| 3 or 4 Children | 0 (0.0%) | 40 (19.5%) |
| 5 or more Children | 0 (0.0%) | 5 (27.8%) |
| Total | 65 (7.6%) | 381 (14.5%) |
Income Below Poverty Among Married-Couple vs Single-Parent Households in Worcester County
The poverty data for Worcester County shows that 315 of the married-couple family households (2.8%) and 446 of the single-parent households (12.8%) are living below the poverty level. Within the married-couple family households, those with 1 or 2 children have the highest poverty rate, with 102 households (3.7%) falling below the poverty line. Among the single-parent households, those with 5 or more children have the highest poverty rate, with 5 household (27.8%) living below poverty.
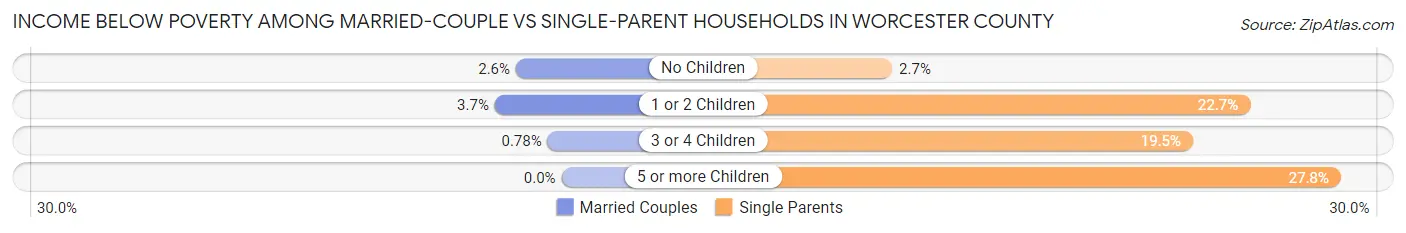
| Children | Married-Couple Families | Single-Parent Households |
| No Children | 209 (2.5%) | 46 (2.7%) |
| 1 or 2 Children | 102 (3.7%) | 355 (22.7%) |
| 3 or 4 Children | 4 (0.8%) | 40 (19.5%) |
| 5 or more Children | 0 (0.0%) | 5 (27.8%) |
| Total | 315 (2.8%) | 446 (12.8%) |
Employment Characteristics in Worcester County
Employment by Class of Employer in Worcester County
Among the 24,119 employed individuals in Worcester County, private company employees (14,306 | 59.3%), local government employees (2,158 | 8.9%), and self-employed (not incorporated) (1,837 | 7.6%) make up the most common classes of employment.
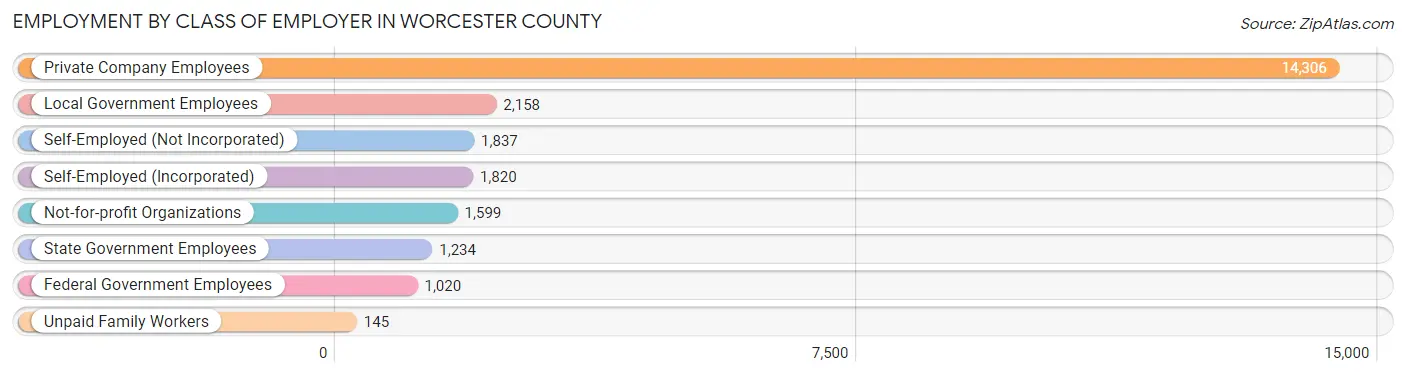
| Employer Class | # Employees | % Employees |
| Private Company Employees | 14,306 | 59.3% |
| Self-Employed (Incorporated) | 1,820 | 7.5% |
| Self-Employed (Not Incorporated) | 1,837 | 7.6% |
| Not-for-profit Organizations | 1,599 | 6.6% |
| Local Government Employees | 2,158 | 8.9% |
| State Government Employees | 1,234 | 5.1% |
| Federal Government Employees | 1,020 | 4.2% |
| Unpaid Family Workers | 145 | 0.6% |
| Total | 24,119 | 100.0% |
Employment Status by Age in Worcester County
According to the labor force statistics for Worcester County, out of the total population over 16 years of age (44,856), 59.0% or 26,465 individuals are in the labor force, with 6.5% or 1,720 of them unemployed. The age group with the highest labor force participation rate is 30 to 34 years, with 88.1% or 2,238 individuals in the labor force. Within the labor force, the 20 to 24 years age range has the highest percentage of unemployed individuals, with 19.4% or 417 of them being unemployed.
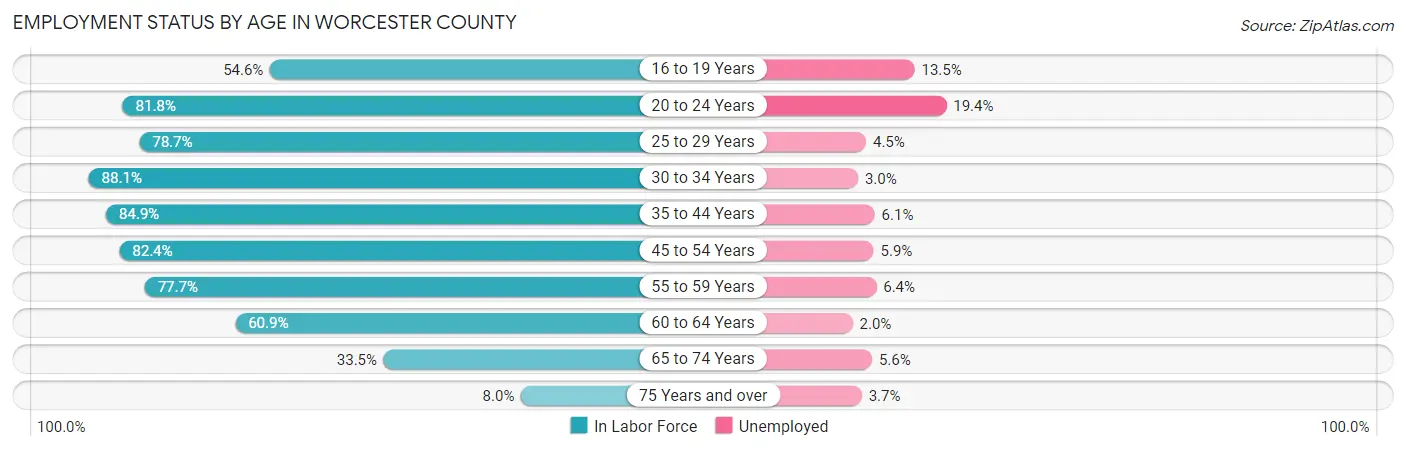
| Age Bracket | In Labor Force | Unemployed |
| 16 to 19 Years | 1,075 (54.6%) | 145 (13.5%) |
| 20 to 24 Years | 2,151 (81.8%) | 417 (19.4%) |
| 25 to 29 Years | 2,131 (78.7%) | 96 (4.5%) |
| 30 to 34 Years | 2,238 (88.1%) | 67 (3.0%) |
| 35 to 44 Years | 4,514 (84.9%) | 275 (6.1%) |
| 45 to 54 Years | 5,245 (82.4%) | 309 (5.9%) |
| 55 to 59 Years | 2,829 (77.7%) | 181 (6.4%) |
| 60 to 64 Years | 2,976 (60.9%) | 60 (2.0%) |
| 65 to 74 Years | 2,796 (33.5%) | 157 (5.6%) |
| 75 Years and over | 516 (8.0%) | 19 (3.7%) |
| Total | 26,465 (59.0%) | 1,720 (6.5%) |
Employment Status by Educational Attainment in Worcester County
According to labor force statistics for Worcester County, 78.3% of individuals (19,934) out of the total population between 25 and 64 years of age (25,458) are in the labor force, with 5.0% or 997 of them being unemployed. The group with the highest labor force participation rate are those with the educational attainment of bachelor's degree or higher, with 84.6% or 7,195 individuals in the labor force. Within the labor force, individuals with high school diploma education have the highest percentage of unemployment, with 7.7% or 413 of them being unemployed.
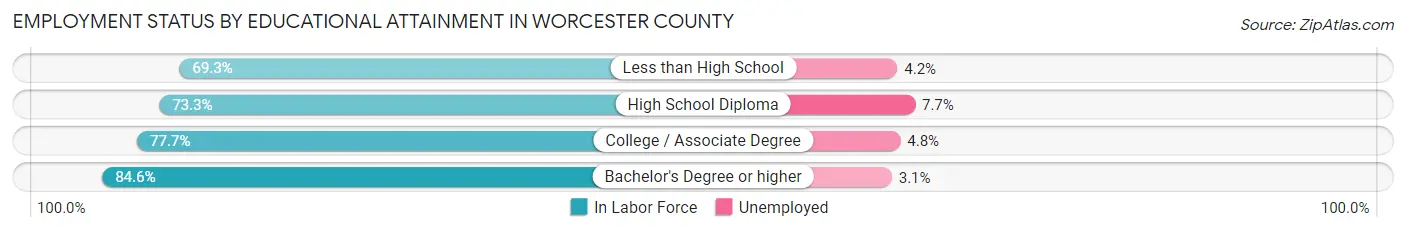
| Educational Attainment | In Labor Force | Unemployed |
| Less than High School | 960 (69.3%) | 58 (4.2%) |
| High School Diploma | 5,358 (73.3%) | 563 (7.7%) |
| College / Associate Degree | 6,416 (77.7%) | 396 (4.8%) |
| Bachelor's Degree or higher | 7,195 (84.6%) | 264 (3.1%) |
| Total | 19,934 (78.3%) | 1,273 (5.0%) |
Employment Occupations by Sex in Worcester County
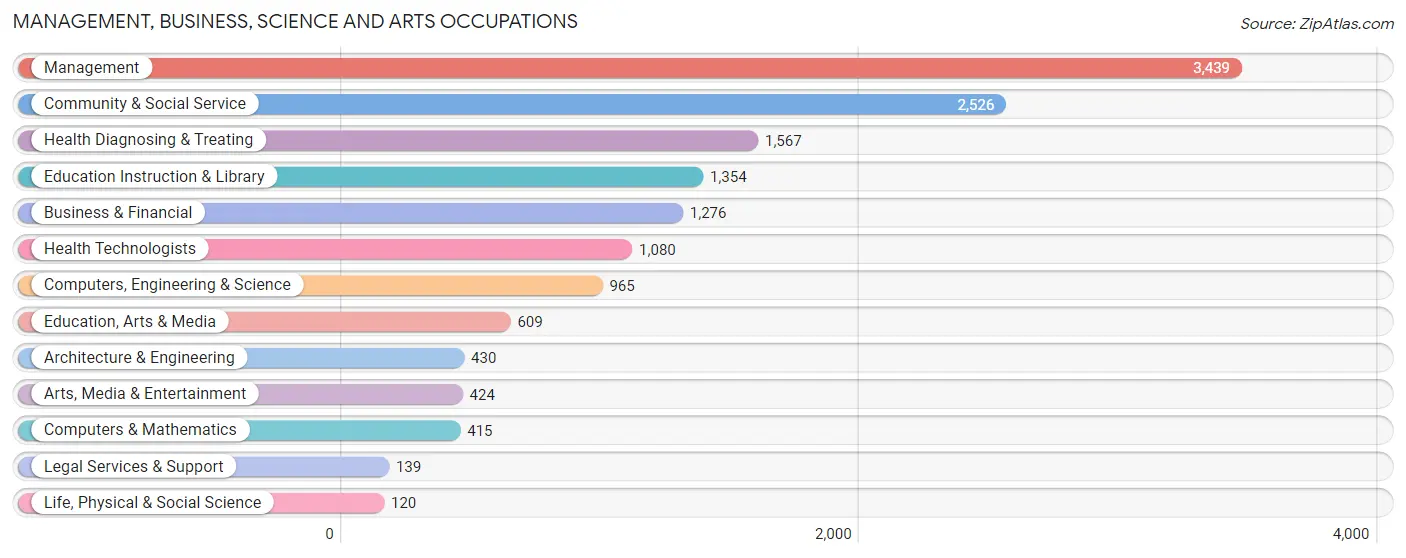
Management, Business, Science and Arts Occupations
The most common Management, Business, Science and Arts occupations in Worcester County are Management (3,439 | 14.0%), Community & Social Service (2,526 | 10.2%), Health Diagnosing & Treating (1,567 | 6.4%), Education Instruction & Library (1,354 | 5.5%), and Business & Financial (1,276 | 5.2%).
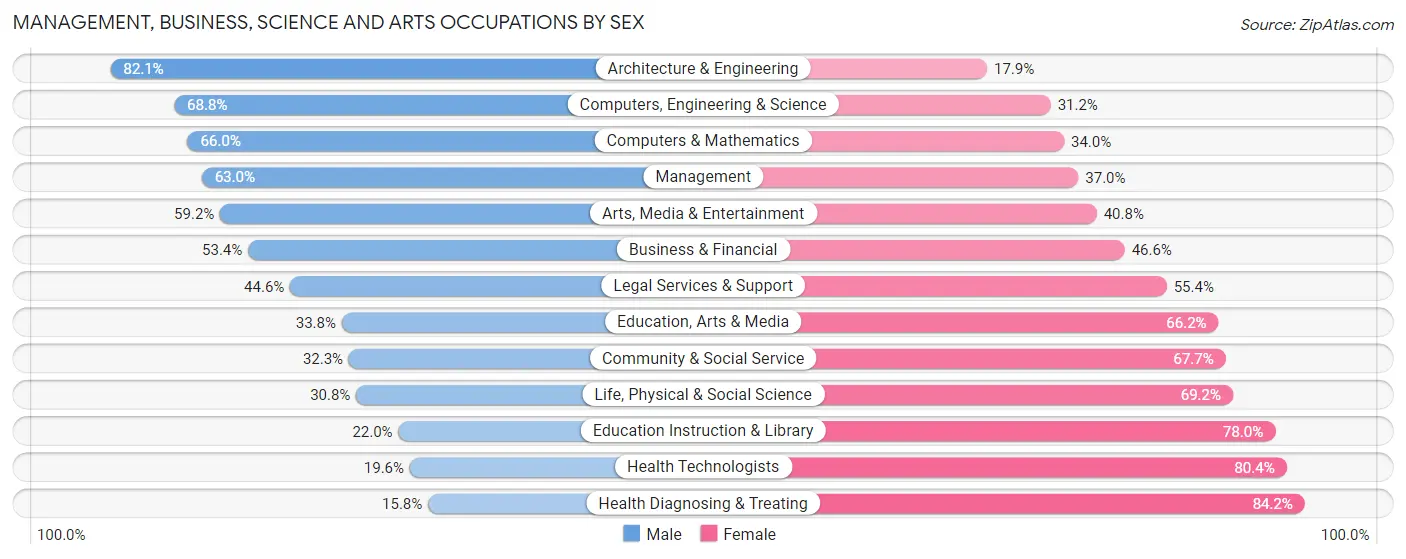
Management, Business, Science and Arts Occupations by Sex
Within the Management, Business, Science and Arts occupations in Worcester County, the most male-oriented occupations are Architecture & Engineering (82.1%), Computers, Engineering & Science (68.8%), and Computers & Mathematics (66.0%), while the most female-oriented occupations are Health Diagnosing & Treating (84.2%), Health Technologists (80.4%), and Education Instruction & Library (78.0%).
| Occupation | Male | Female |
| Management | 2,168 (63.0%) | 1,271 (37.0%) |
| Business & Financial | 681 (53.4%) | 595 (46.6%) |
| Computers, Engineering & Science | 664 (68.8%) | 301 (31.2%) |
| Computers & Mathematics | 274 (66.0%) | 141 (34.0%) |
| Architecture & Engineering | 353 (82.1%) | 77 (17.9%) |
| Life, Physical & Social Science | 37 (30.8%) | 83 (69.2%) |
| Community & Social Service | 817 (32.3%) | 1,709 (67.7%) |
| Education, Arts & Media | 206 (33.8%) | 403 (66.2%) |
| Legal Services & Support | 62 (44.6%) | 77 (55.4%) |
| Education Instruction & Library | 298 (22.0%) | 1,056 (78.0%) |
| Arts, Media & Entertainment | 251 (59.2%) | 173 (40.8%) |
| Health Diagnosing & Treating | 248 (15.8%) | 1,319 (84.2%) |
| Health Technologists | 212 (19.6%) | 868 (80.4%) |
| Total (Category) | 4,578 (46.8%) | 5,195 (53.2%) |
| Total (Overall) | 12,614 (51.2%) | 12,030 (48.8%) |
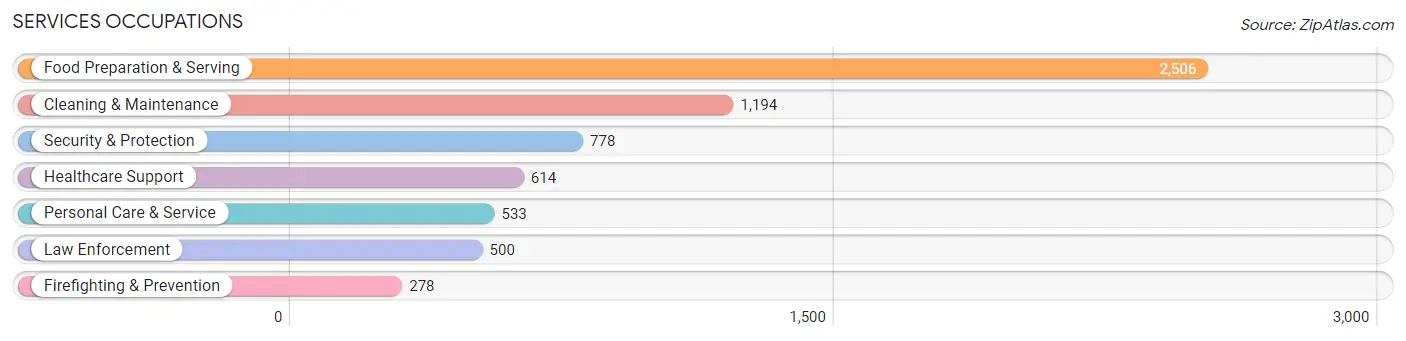
Services Occupations
The most common Services occupations in Worcester County are Food Preparation & Serving (2,506 | 10.2%), Cleaning & Maintenance (1,194 | 4.8%), Security & Protection (778 | 3.2%), Healthcare Support (614 | 2.5%), and Personal Care & Service (533 | 2.2%).
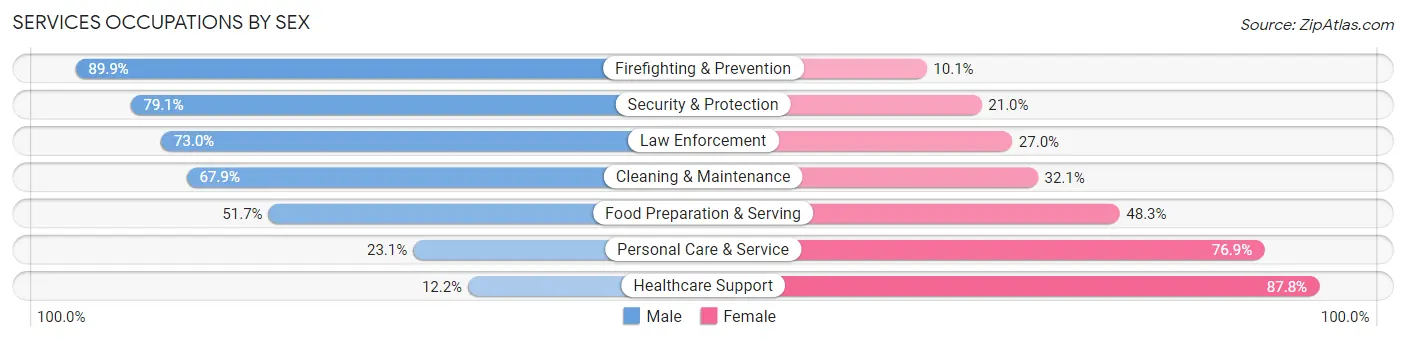
Services Occupations by Sex
Within the Services occupations in Worcester County, the most male-oriented occupations are Firefighting & Prevention (89.9%), Security & Protection (79.0%), and Law Enforcement (73.0%), while the most female-oriented occupations are Healthcare Support (87.8%), Personal Care & Service (76.9%), and Food Preparation & Serving (48.3%).
| Occupation | Male | Female |
| Healthcare Support | 75 (12.2%) | 539 (87.8%) |
| Security & Protection | 615 (79.0%) | 163 (20.9%) |
| Firefighting & Prevention | 250 (89.9%) | 28 (10.1%) |
| Law Enforcement | 365 (73.0%) | 135 (27.0%) |
| Food Preparation & Serving | 1,296 (51.7%) | 1,210 (48.3%) |
| Cleaning & Maintenance | 811 (67.9%) | 383 (32.1%) |
| Personal Care & Service | 123 (23.1%) | 410 (76.9%) |
| Total (Category) | 2,920 (51.9%) | 2,705 (48.1%) |
| Total (Overall) | 12,614 (51.2%) | 12,030 (48.8%) |
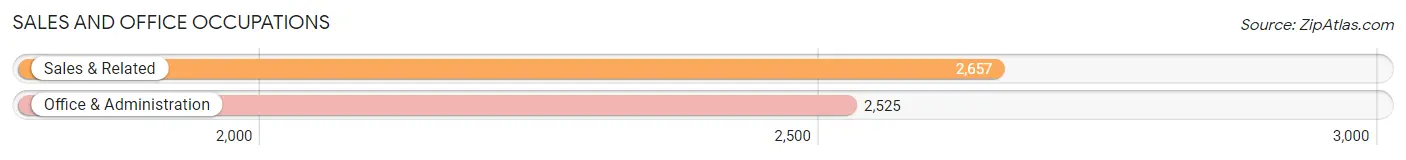
Sales and Office Occupations
The most common Sales and Office occupations in Worcester County are Sales & Related (2,657 | 10.8%), and Office & Administration (2,525 | 10.2%).
Sales and Office Occupations by Sex
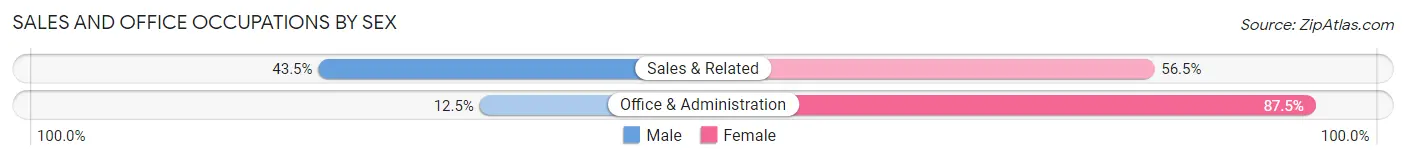
| Occupation | Male | Female |
| Sales & Related | 1,156 (43.5%) | 1,501 (56.5%) |
| Office & Administration | 315 (12.5%) | 2,210 (87.5%) |
| Total (Category) | 1,471 (28.4%) | 3,711 (71.6%) |
| Total (Overall) | 12,614 (51.2%) | 12,030 (48.8%) |
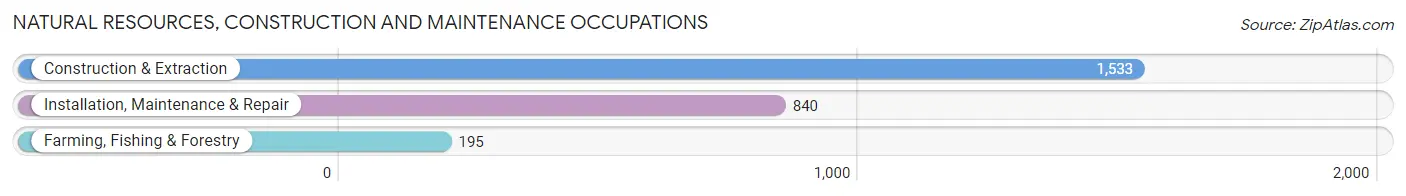
Natural Resources, Construction and Maintenance Occupations
The most common Natural Resources, Construction and Maintenance occupations in Worcester County are Construction & Extraction (1,533 | 6.2%), Installation, Maintenance & Repair (840 | 3.4%), and Farming, Fishing & Forestry (195 | 0.8%).
Natural Resources, Construction and Maintenance Occupations by Sex
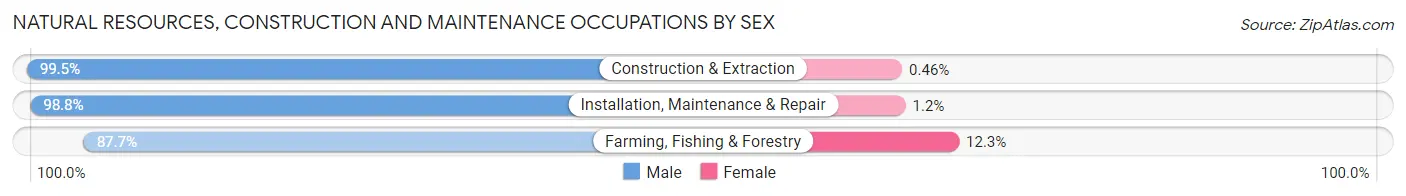
| Occupation | Male | Female |
| Farming, Fishing & Forestry | 171 (87.7%) | 24 (12.3%) |
| Construction & Extraction | 1,526 (99.5%) | 7 (0.5%) |
| Installation, Maintenance & Repair | 830 (98.8%) | 10 (1.2%) |
| Total (Category) | 2,527 (98.4%) | 41 (1.6%) |
| Total (Overall) | 12,614 (51.2%) | 12,030 (48.8%) |
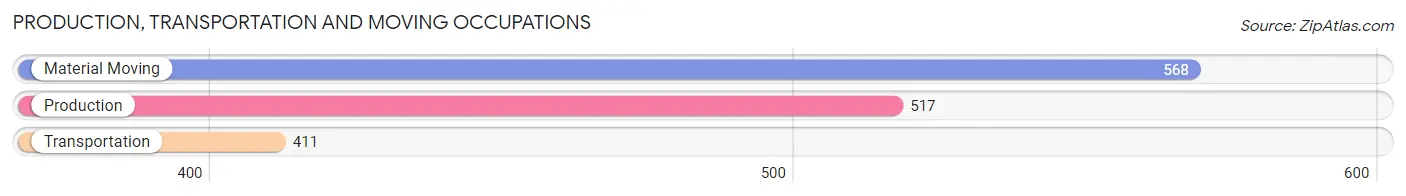
Production, Transportation and Moving Occupations
The most common Production, Transportation and Moving occupations in Worcester County are Material Moving (568 | 2.3%), Production (517 | 2.1%), and Transportation (411 | 1.7%).
Production, Transportation and Moving Occupations by Sex
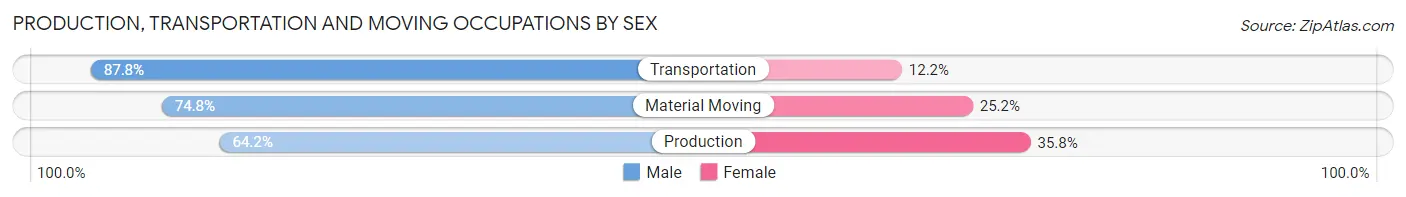
| Occupation | Male | Female |
| Production | 332 (64.2%) | 185 (35.8%) |
| Transportation | 361 (87.8%) | 50 (12.2%) |
| Material Moving | 425 (74.8%) | 143 (25.2%) |
| Total (Category) | 1,118 (74.7%) | 378 (25.3%) |
| Total (Overall) | 12,614 (51.2%) | 12,030 (48.8%) |
Employment Industries by Sex in Worcester County
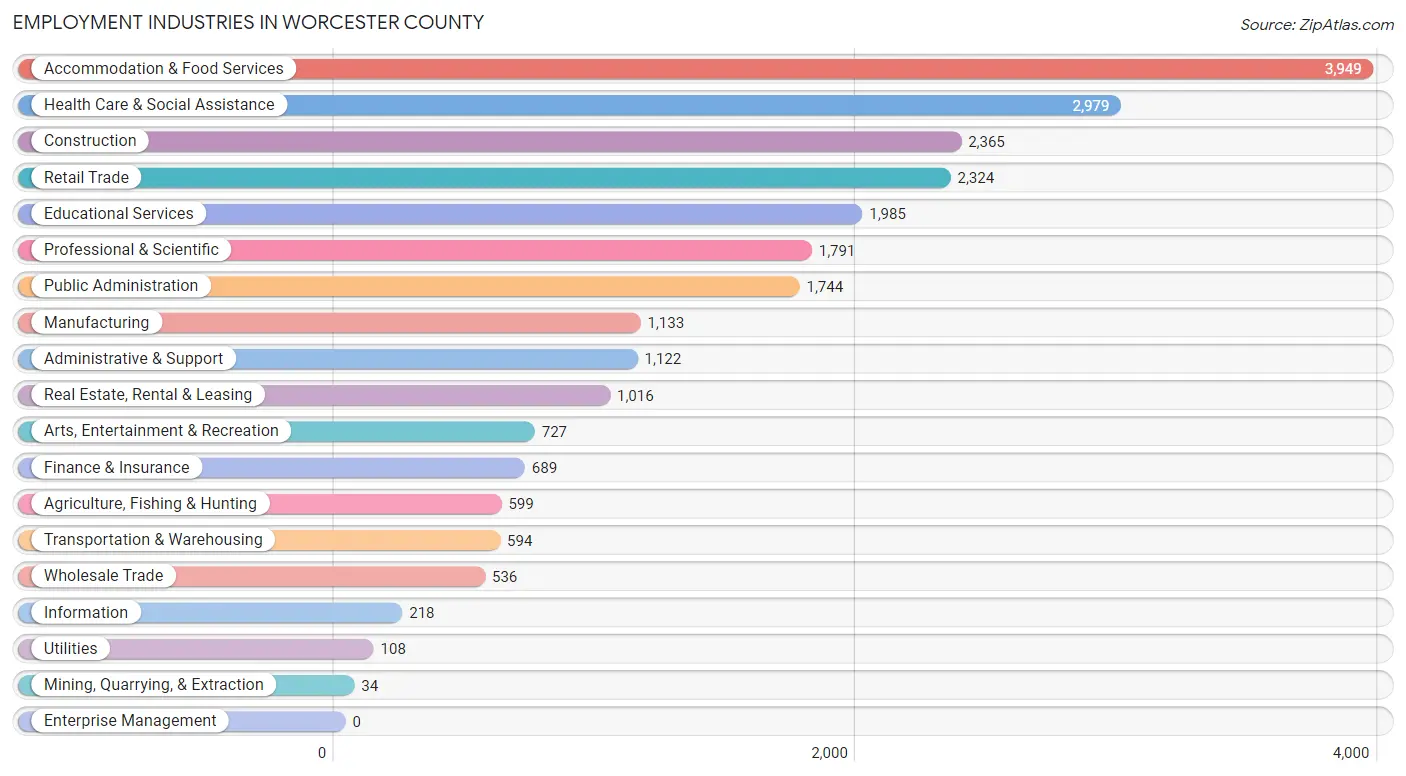
Employment Industries in Worcester County
The major employment industries in Worcester County include Accommodation & Food Services (3,949 | 16.0%), Health Care & Social Assistance (2,979 | 12.1%), Construction (2,365 | 9.6%), Retail Trade (2,324 | 9.4%), and Educational Services (1,985 | 8.1%).
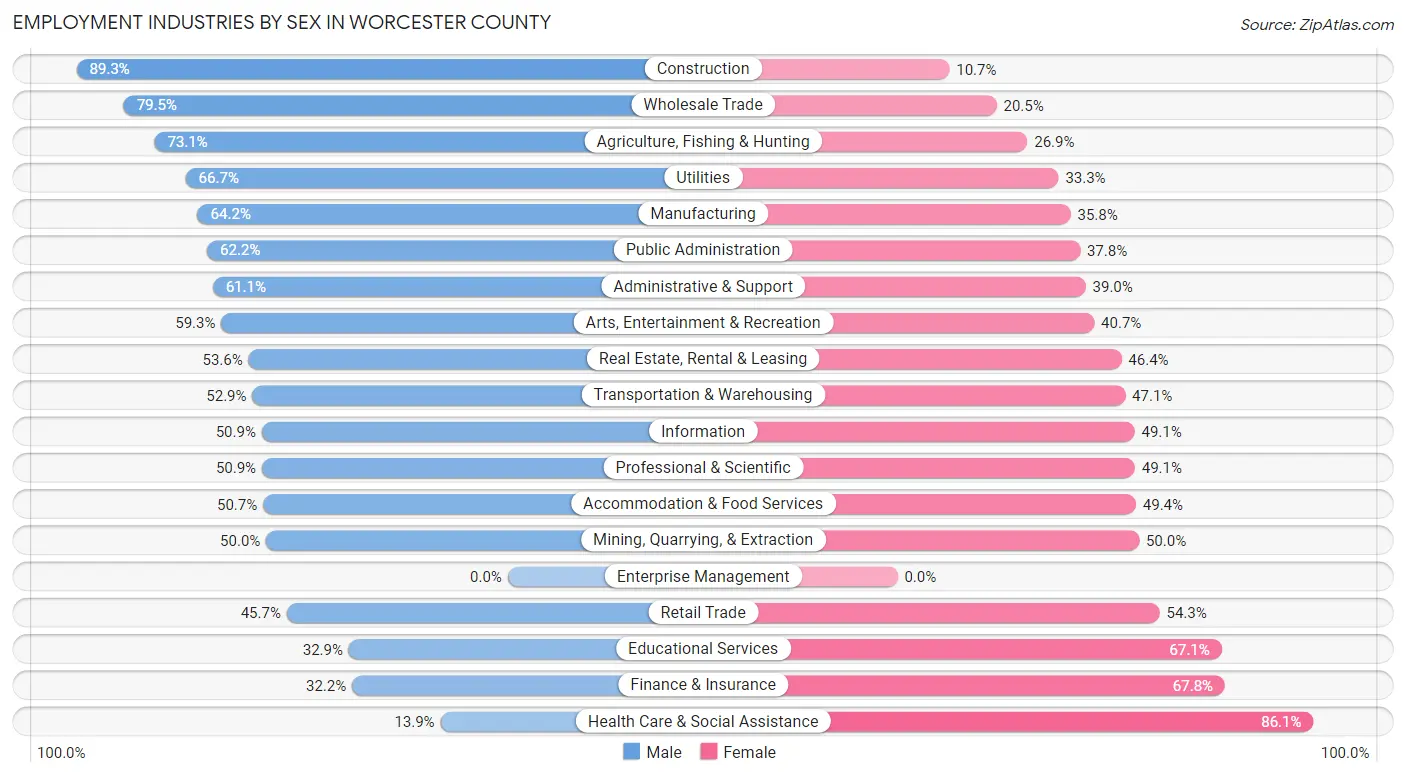
Employment Industries by Sex in Worcester County
The Worcester County industries that see more men than women are Construction (89.3%), Wholesale Trade (79.5%), and Agriculture, Fishing & Hunting (73.1%), whereas the industries that tend to have a higher number of women are Health Care & Social Assistance (86.1%), Finance & Insurance (67.8%), and Educational Services (67.1%).
| Industry | Male | Female |
| Agriculture, Fishing & Hunting | 438 (73.1%) | 161 (26.9%) |
| Mining, Quarrying, & Extraction | 17 (50.0%) | 17 (50.0%) |
| Construction | 2,111 (89.3%) | 254 (10.7%) |
| Manufacturing | 727 (64.2%) | 406 (35.8%) |
| Wholesale Trade | 426 (79.5%) | 110 (20.5%) |
| Retail Trade | 1,063 (45.7%) | 1,261 (54.3%) |
| Transportation & Warehousing | 314 (52.9%) | 280 (47.1%) |
| Utilities | 72 (66.7%) | 36 (33.3%) |
| Information | 111 (50.9%) | 107 (49.1%) |
| Finance & Insurance | 222 (32.2%) | 467 (67.8%) |
| Real Estate, Rental & Leasing | 545 (53.6%) | 471 (46.4%) |
| Professional & Scientific | 911 (50.9%) | 880 (49.1%) |
| Enterprise Management | 0 (0.0%) | 0 (0.0%) |
| Administrative & Support | 685 (61.1%) | 437 (39.0%) |
| Educational Services | 653 (32.9%) | 1,332 (67.1%) |
| Health Care & Social Assistance | 415 (13.9%) | 2,564 (86.1%) |
| Arts, Entertainment & Recreation | 431 (59.3%) | 296 (40.7%) |
| Accommodation & Food Services | 2,000 (50.6%) | 1,949 (49.3%) |
| Public Administration | 1,085 (62.2%) | 659 (37.8%) |
| Total | 12,614 (51.2%) | 12,030 (48.8%) |
Education in Worcester County
School Enrollment in Worcester County
The most common levels of schooling among the 9,593 students in Worcester County are high school (2,776 | 28.9%), middle school (1,977 | 20.6%), and elementary school (1,909 | 19.9%).
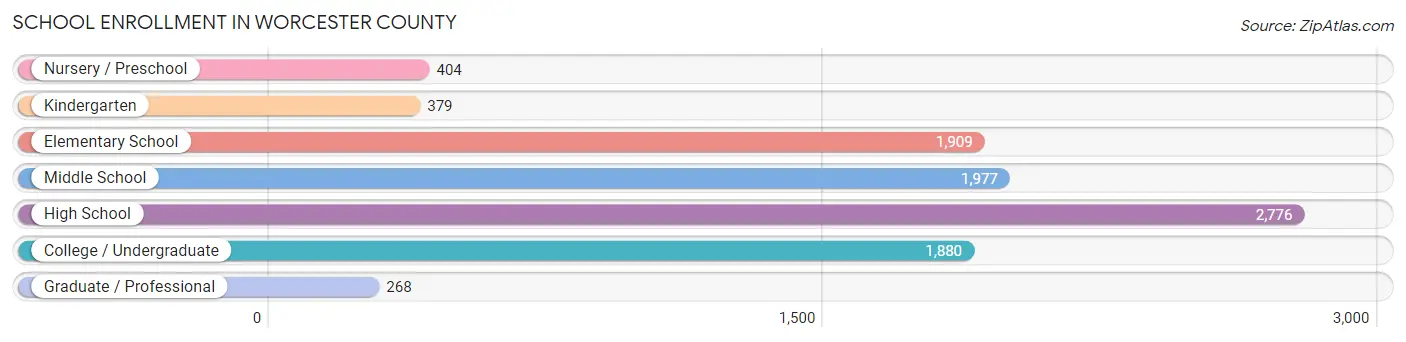
| School Level | # Students | % Students |
| Nursery / Preschool | 404 | 4.2% |
| Kindergarten | 379 | 4.0% |
| Elementary School | 1,909 | 19.9% |
| Middle School | 1,977 | 20.6% |
| High School | 2,776 | 28.9% |
| College / Undergraduate | 1,880 | 19.6% |
| Graduate / Professional | 268 | 2.8% |
| Total | 9,593 | 100.0% |
School Enrollment by Age by Funding Source in Worcester County
Out of a total of 9,593 students who are enrolled in schools in Worcester County, 1,132 (11.8%) attend a private institution, while the remaining 8,461 (88.2%) are enrolled in public schools. The age group of 3 to 4 year olds has the highest likelihood of being enrolled in private schools, with 109 (34.8% in the age bracket) enrolled. Conversely, the age group of 25 to 34 year olds has the lowest likelihood of being enrolled in a private school, with 604 (96.5% in the age bracket) attending a public institution.
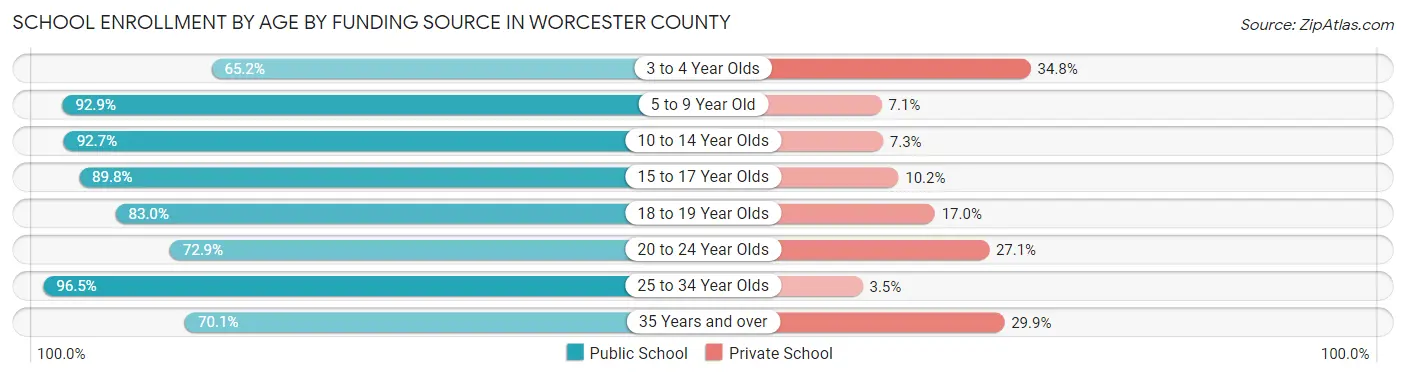
| Age Bracket | Public School | Private School |
| 3 to 4 Year Olds | 204 (65.2%) | 109 (34.8%) |
| 5 to 9 Year Old | 2,013 (92.9%) | 153 (7.1%) |
| 10 to 14 Year Olds | 2,731 (92.7%) | 215 (7.3%) |
| 15 to 17 Year Olds | 1,545 (89.8%) | 175 (10.2%) |
| 18 to 19 Year Olds | 372 (83.0%) | 76 (17.0%) |
| 20 to 24 Year Olds | 690 (72.9%) | 256 (27.1%) |
| 25 to 34 Year Olds | 604 (96.5%) | 22 (3.5%) |
| 35 Years and over | 300 (70.1%) | 128 (29.9%) |
| Total | 8,461 (88.2%) | 1,132 (11.8%) |
Educational Attainment by Field of Study in Worcester County
Business (2,400 | 17.3%), education (2,222 | 16.0%), science & technology (1,590 | 11.5%), social sciences (1,228 | 8.8%), and arts & humanities (1,079 | 7.8%) are the most common fields of study among 13,892 individuals in Worcester County who have obtained a bachelor's degree or higher.
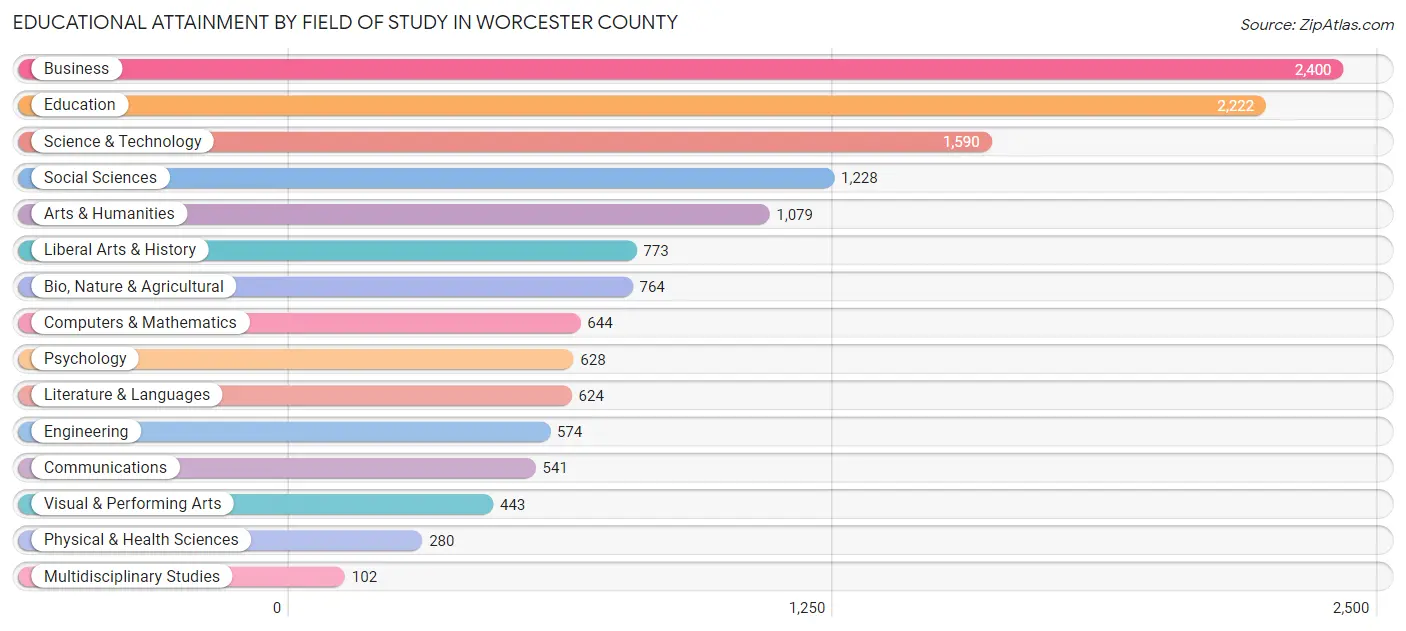
| Field of Study | # Graduates | % Graduates |
| Computers & Mathematics | 644 | 4.6% |
| Bio, Nature & Agricultural | 764 | 5.5% |
| Physical & Health Sciences | 280 | 2.0% |
| Psychology | 628 | 4.5% |
| Social Sciences | 1,228 | 8.8% |
| Engineering | 574 | 4.1% |
| Multidisciplinary Studies | 102 | 0.7% |
| Science & Technology | 1,590 | 11.5% |
| Business | 2,400 | 17.3% |
| Education | 2,222 | 16.0% |
| Literature & Languages | 624 | 4.5% |
| Liberal Arts & History | 773 | 5.6% |
| Visual & Performing Arts | 443 | 3.2% |
| Communications | 541 | 3.9% |
| Arts & Humanities | 1,079 | 7.8% |
| Total | 13,892 | 100.0% |
Transportation & Commute in Worcester County
Vehicle Availability by Sex in Worcester County
The most prevalent vehicle ownership categories in Worcester County are males with 2 vehicles (5,674, accounting for 45.2%) and females with 2 vehicles (4,545, making up 49.3%).
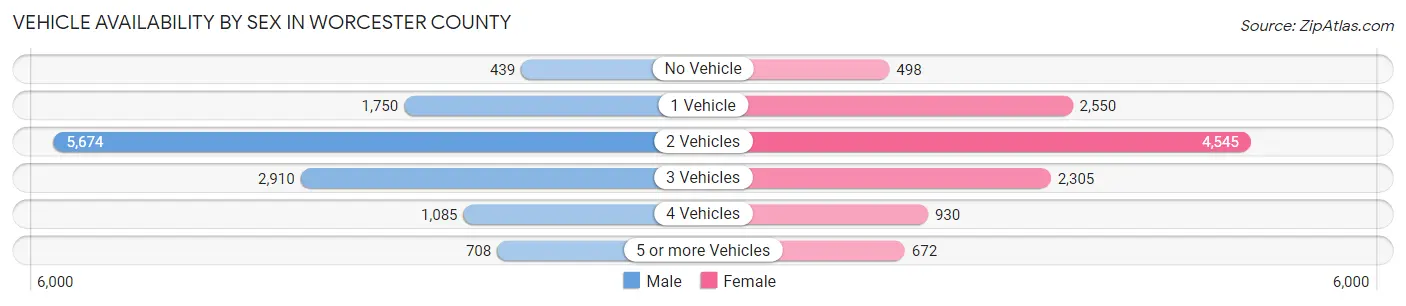
| Vehicles Available | Male | Female |
| No Vehicle | 439 (3.5%) | 498 (4.3%) |
| 1 Vehicle | 1,750 (13.9%) | 2,550 (22.2%) |
| 2 Vehicles | 5,674 (45.2%) | 4,545 (39.5%) |
| 3 Vehicles | 2,910 (23.2%) | 2,305 (20.0%) |
| 4 Vehicles | 1,085 (8.6%) | 930 (8.1%) |
| 5 or more Vehicles | 708 (5.6%) | 672 (5.8%) |
| Total | 12,566 (100.0%) | 11,500 (100.0%) |
Commute Time in Worcester County
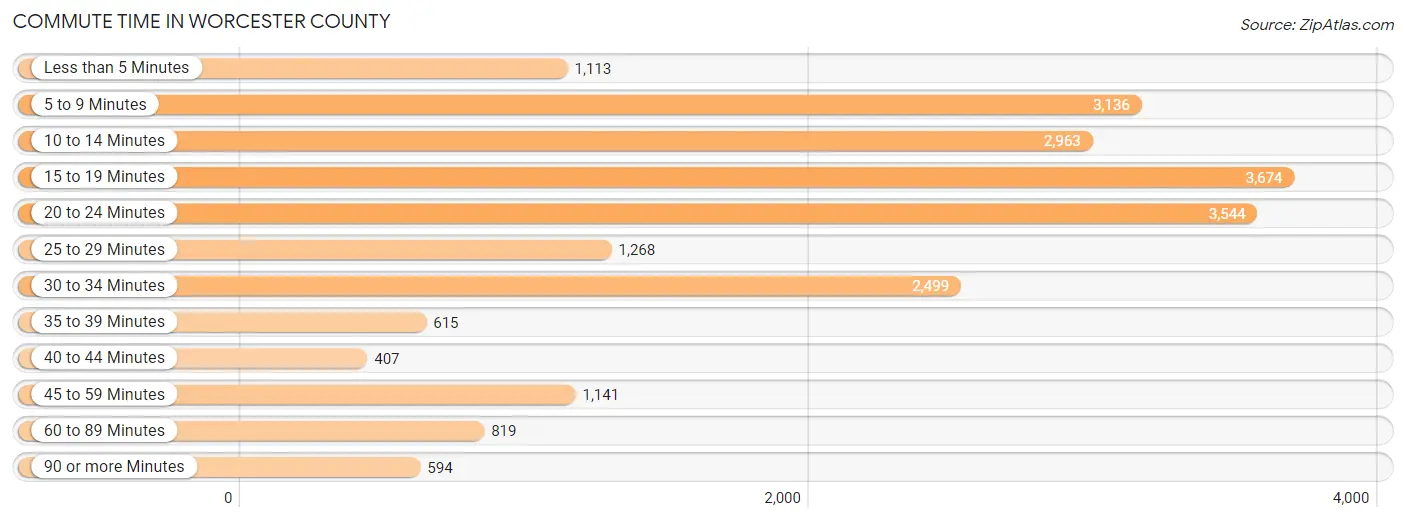
The most frequently occuring commute durations in Worcester County are 15 to 19 minutes (3,674 commuters, 16.9%), 20 to 24 minutes (3,544 commuters, 16.3%), and 5 to 9 minutes (3,136 commuters, 14.4%).
| Commute Time | # Commuters | % Commuters |
| Less than 5 Minutes | 1,113 | 5.1% |
| 5 to 9 Minutes | 3,136 | 14.4% |
| 10 to 14 Minutes | 2,963 | 13.6% |
| 15 to 19 Minutes | 3,674 | 16.9% |
| 20 to 24 Minutes | 3,544 | 16.3% |
| 25 to 29 Minutes | 1,268 | 5.8% |
| 30 to 34 Minutes | 2,499 | 11.5% |
| 35 to 39 Minutes | 615 | 2.8% |
| 40 to 44 Minutes | 407 | 1.9% |
| 45 to 59 Minutes | 1,141 | 5.2% |
| 60 to 89 Minutes | 819 | 3.8% |
| 90 or more Minutes | 594 | 2.7% |
Commute Time by Sex in Worcester County
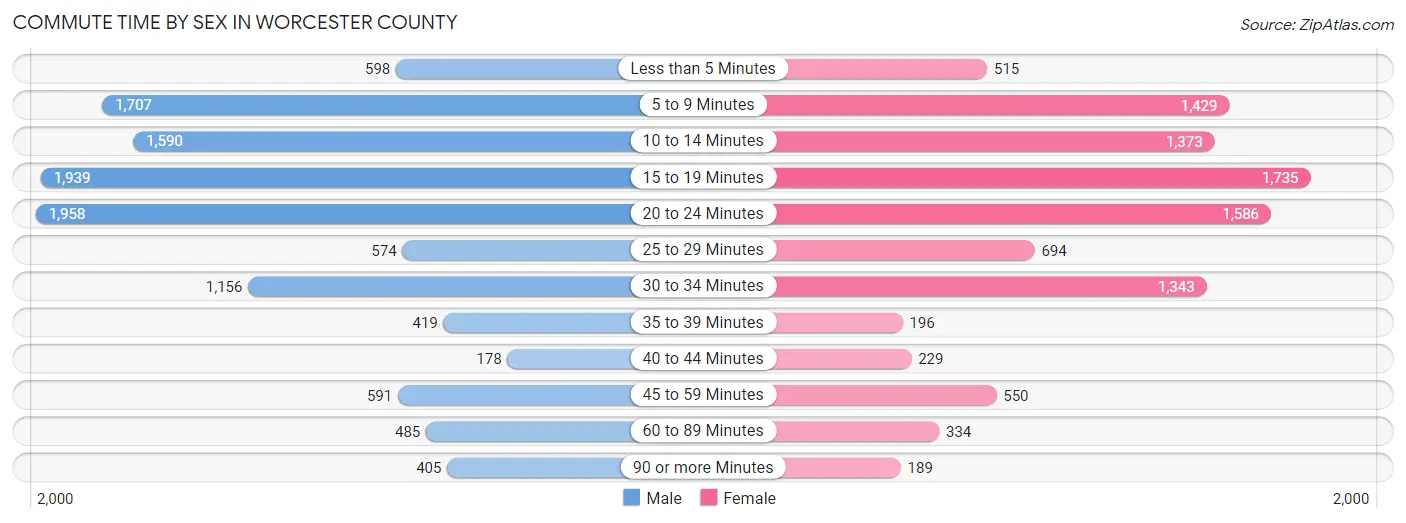
The most common commute times in Worcester County are 20 to 24 minutes (1,958 commuters, 16.9%) for males and 15 to 19 minutes (1,735 commuters, 17.1%) for females.
| Commute Time | Male | Female |
| Less than 5 Minutes | 598 (5.2%) | 515 (5.1%) |
| 5 to 9 Minutes | 1,707 (14.7%) | 1,429 (14.1%) |
| 10 to 14 Minutes | 1,590 (13.7%) | 1,373 (13.5%) |
| 15 to 19 Minutes | 1,939 (16.7%) | 1,735 (17.1%) |
| 20 to 24 Minutes | 1,958 (16.9%) | 1,586 (15.6%) |
| 25 to 29 Minutes | 574 (5.0%) | 694 (6.8%) |
| 30 to 34 Minutes | 1,156 (10.0%) | 1,343 (13.2%) |
| 35 to 39 Minutes | 419 (3.6%) | 196 (1.9%) |
| 40 to 44 Minutes | 178 (1.5%) | 229 (2.2%) |
| 45 to 59 Minutes | 591 (5.1%) | 550 (5.4%) |
| 60 to 89 Minutes | 485 (4.2%) | 334 (3.3%) |
| 90 or more Minutes | 405 (3.5%) | 189 (1.9%) |
Time of Departure to Work by Sex in Worcester County
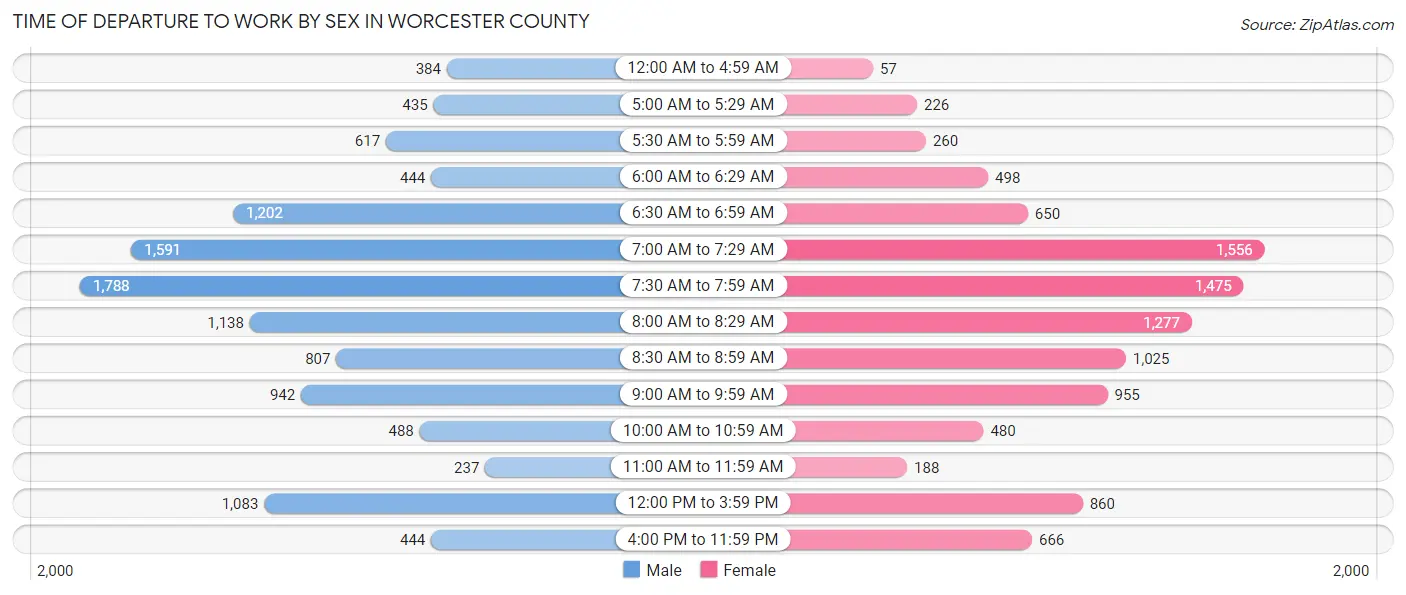
The most frequent times of departure to work in Worcester County are 7:30 AM to 7:59 AM (1,788, 15.4%) for males and 7:00 AM to 7:29 AM (1,556, 15.3%) for females.
| Time of Departure | Male | Female |
| 12:00 AM to 4:59 AM | 384 (3.3%) | 57 (0.6%) |
| 5:00 AM to 5:29 AM | 435 (3.7%) | 226 (2.2%) |
| 5:30 AM to 5:59 AM | 617 (5.3%) | 260 (2.6%) |
| 6:00 AM to 6:29 AM | 444 (3.8%) | 498 (4.9%) |
| 6:30 AM to 6:59 AM | 1,202 (10.4%) | 650 (6.4%) |
| 7:00 AM to 7:29 AM | 1,591 (13.7%) | 1,556 (15.3%) |
| 7:30 AM to 7:59 AM | 1,788 (15.4%) | 1,475 (14.5%) |
| 8:00 AM to 8:29 AM | 1,138 (9.8%) | 1,277 (12.6%) |
| 8:30 AM to 8:59 AM | 807 (7.0%) | 1,025 (10.1%) |
| 9:00 AM to 9:59 AM | 942 (8.1%) | 955 (9.4%) |
| 10:00 AM to 10:59 AM | 488 (4.2%) | 480 (4.7%) |
| 11:00 AM to 11:59 AM | 237 (2.0%) | 188 (1.8%) |
| 12:00 PM to 3:59 PM | 1,083 (9.3%) | 860 (8.5%) |
| 4:00 PM to 11:59 PM | 444 (3.8%) | 666 (6.6%) |
| Total | 11,600 (100.0%) | 10,173 (100.0%) |
Housing Occupancy in Worcester County
Occupancy by Ownership in Worcester County
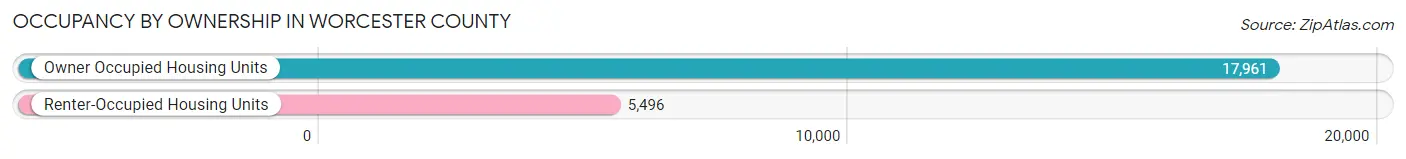
Of the total 23,457 dwellings in Worcester County, owner-occupied units account for 17,961 (76.6%), while renter-occupied units make up 5,496 (23.4%).
| Occupancy | # Housing Units | % Housing Units |
| Owner Occupied Housing Units | 17,961 | 76.6% |
| Renter-Occupied Housing Units | 5,496 | 23.4% |
| Total Occupied Housing Units | 23,457 | 100.0% |
Occupancy by Household Size in Worcester County
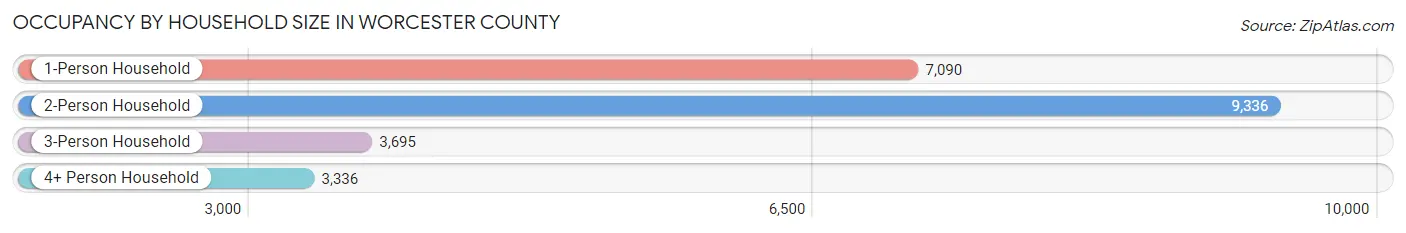
| Household Size | # Housing Units | % Housing Units |
| 1-Person Household | 7,090 | 30.2% |
| 2-Person Household | 9,336 | 39.8% |
| 3-Person Household | 3,695 | 15.8% |
| 4+ Person Household | 3,336 | 14.2% |
| Total Housing Units | 23,457 | 100.0% |
Occupancy by Ownership by Household Size in Worcester County
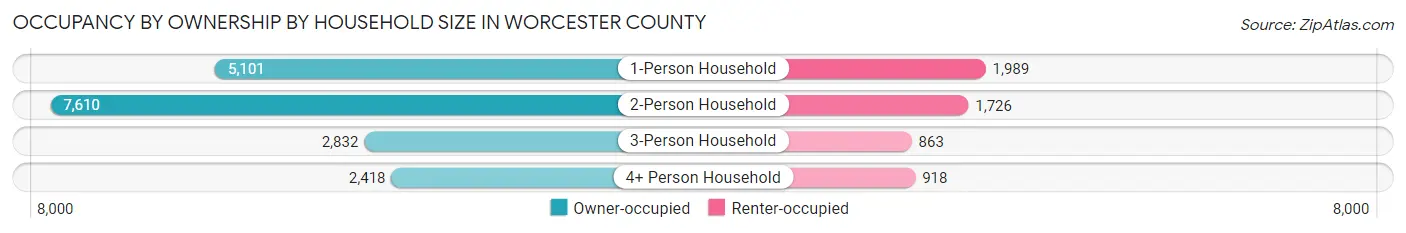
| Household Size | Owner-occupied | Renter-occupied |
| 1-Person Household | 5,101 (72.0%) | 1,989 (28.1%) |
| 2-Person Household | 7,610 (81.5%) | 1,726 (18.5%) |
| 3-Person Household | 2,832 (76.6%) | 863 (23.4%) |
| 4+ Person Household | 2,418 (72.5%) | 918 (27.5%) |
| Total Housing Units | 17,961 (76.6%) | 5,496 (23.4%) |
Occupancy by Educational Attainment in Worcester County
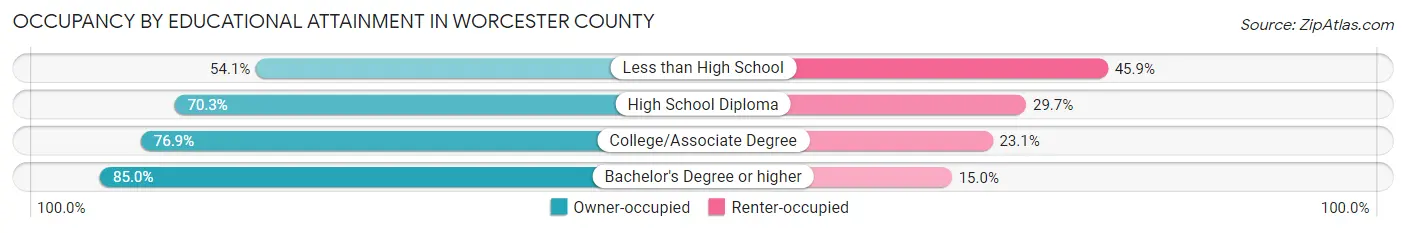
| Household Size | Owner-occupied | Renter-occupied |
| Less than High School | 787 (54.1%) | 668 (45.9%) |
| High School Diploma | 4,420 (70.3%) | 1,869 (29.7%) |
| College/Associate Degree | 5,763 (76.9%) | 1,727 (23.1%) |
| Bachelor's Degree or higher | 6,991 (85.0%) | 1,232 (15.0%) |
Occupancy by Age of Householder in Worcester County
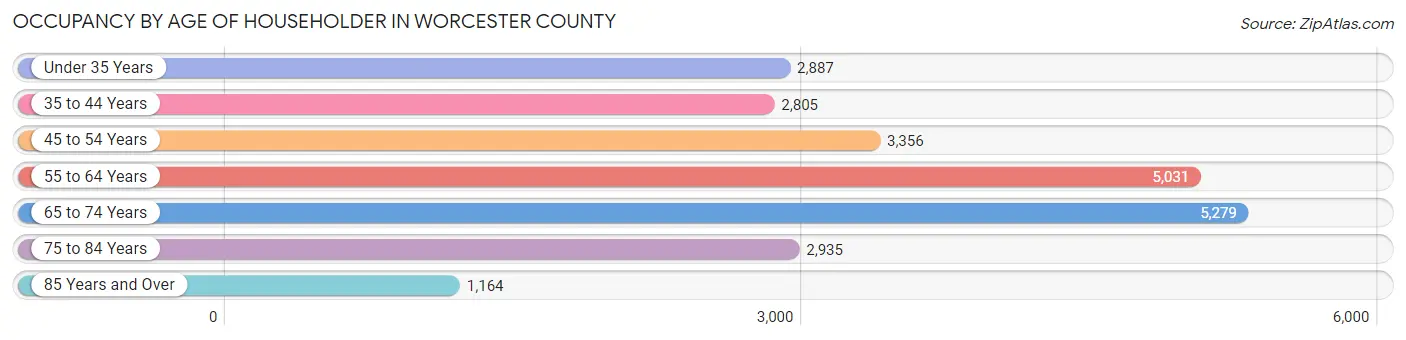
| Age Bracket | # Households | % Households |
| Under 35 Years | 2,887 | 12.3% |
| 35 to 44 Years | 2,805 | 12.0% |
| 45 to 54 Years | 3,356 | 14.3% |
| 55 to 64 Years | 5,031 | 21.4% |
| 65 to 74 Years | 5,279 | 22.5% |
| 75 to 84 Years | 2,935 | 12.5% |
| 85 Years and Over | 1,164 | 5.0% |
| Total | 23,457 | 100.0% |
Housing Finances in Worcester County
Median Income by Occupancy in Worcester County
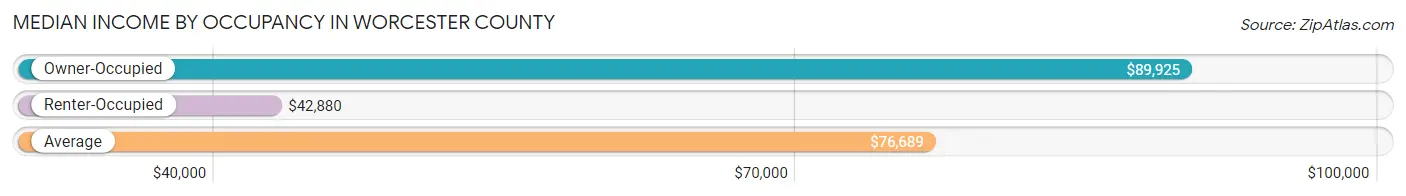
| Occupancy Type | # Households | Median Income |
| Owner-Occupied | 17,961 (76.6%) | $89,925 |
| Renter-Occupied | 5,496 (23.4%) | $42,880 |
| Average | 23,457 (100.0%) | $76,689 |
Occupancy by Householder Income Bracket in Worcester County
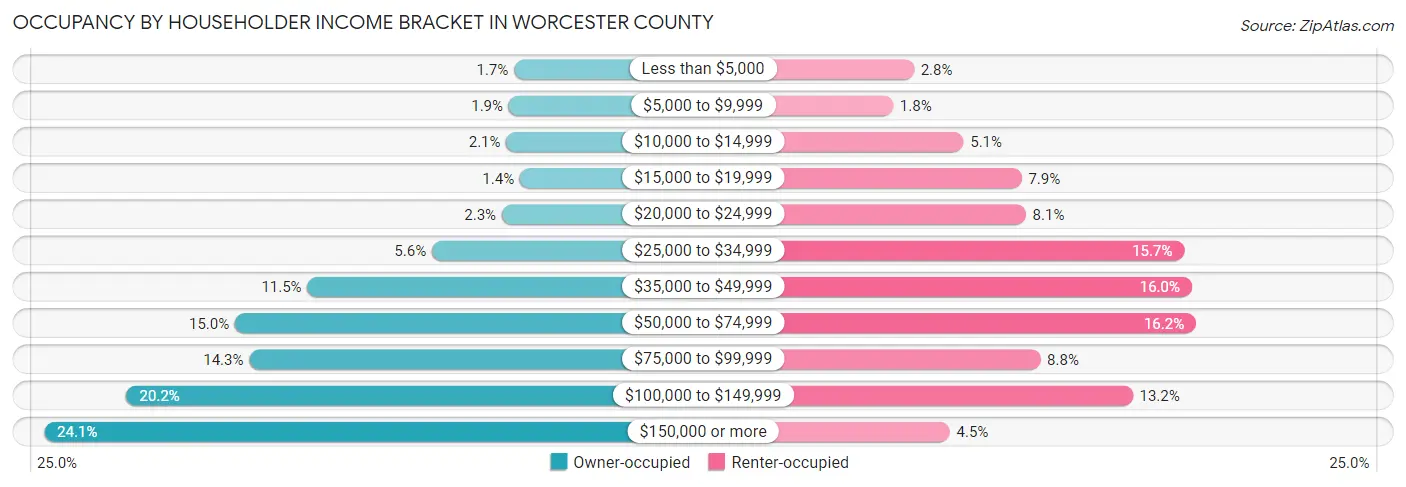
| Income Bracket | Owner-occupied | Renter-occupied |
| Less than $5,000 | 303 (1.7%) | 152 (2.8%) |
| $5,000 to $9,999 | 348 (1.9%) | 98 (1.8%) |
| $10,000 to $14,999 | 370 (2.1%) | 282 (5.1%) |
| $15,000 to $19,999 | 254 (1.4%) | 434 (7.9%) |
| $20,000 to $24,999 | 408 (2.3%) | 445 (8.1%) |
| $25,000 to $34,999 | 1,005 (5.6%) | 860 (15.7%) |
| $35,000 to $49,999 | 2,071 (11.5%) | 880 (16.0%) |
| $50,000 to $74,999 | 2,691 (15.0%) | 891 (16.2%) |
| $75,000 to $99,999 | 2,568 (14.3%) | 483 (8.8%) |
| $100,000 to $149,999 | 3,619 (20.2%) | 725 (13.2%) |
| $150,000 or more | 4,324 (24.1%) | 246 (4.5%) |
| Total | 17,961 (100.0%) | 5,496 (100.0%) |
Monthly Housing Cost Tiers in Worcester County
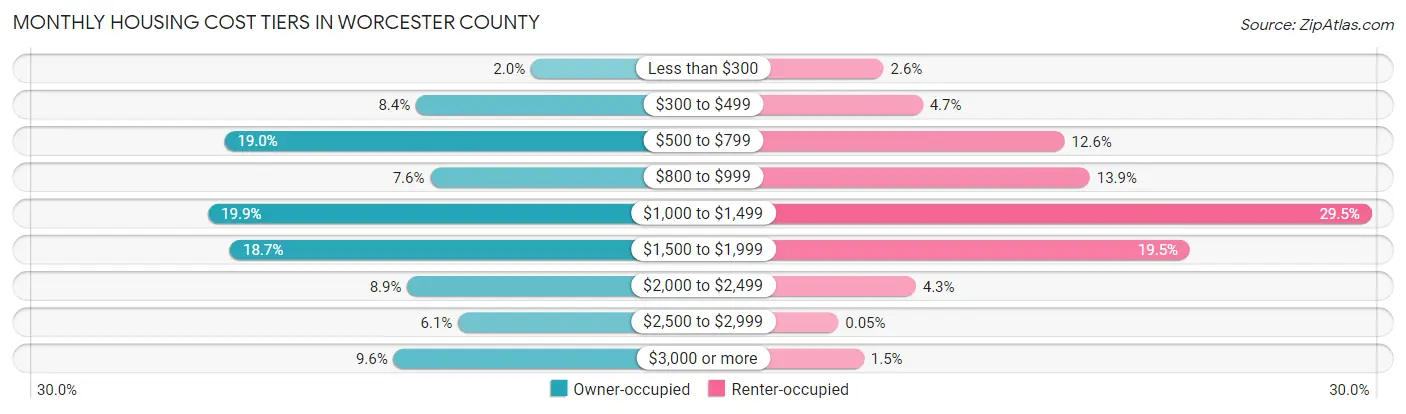
| Monthly Cost | Owner-occupied | Renter-occupied |
| Less than $300 | 364 (2.0%) | 140 (2.5%) |
| $300 to $499 | 1,506 (8.4%) | 259 (4.7%) |
| $500 to $799 | 3,406 (19.0%) | 690 (12.6%) |
| $800 to $999 | 1,363 (7.6%) | 766 (13.9%) |
| $1,000 to $1,499 | 3,567 (19.9%) | 1,622 (29.5%) |
| $1,500 to $1,999 | 3,349 (18.6%) | 1,070 (19.5%) |
| $2,000 to $2,499 | 1,591 (8.9%) | 238 (4.3%) |
| $2,500 to $2,999 | 1,087 (6.0%) | 3 (0.1%) |
| $3,000 or more | 1,728 (9.6%) | 80 (1.5%) |
| Total | 17,961 (100.0%) | 5,496 (100.0%) |
Physical Housing Characteristics in Worcester County
Housing Structures in Worcester County
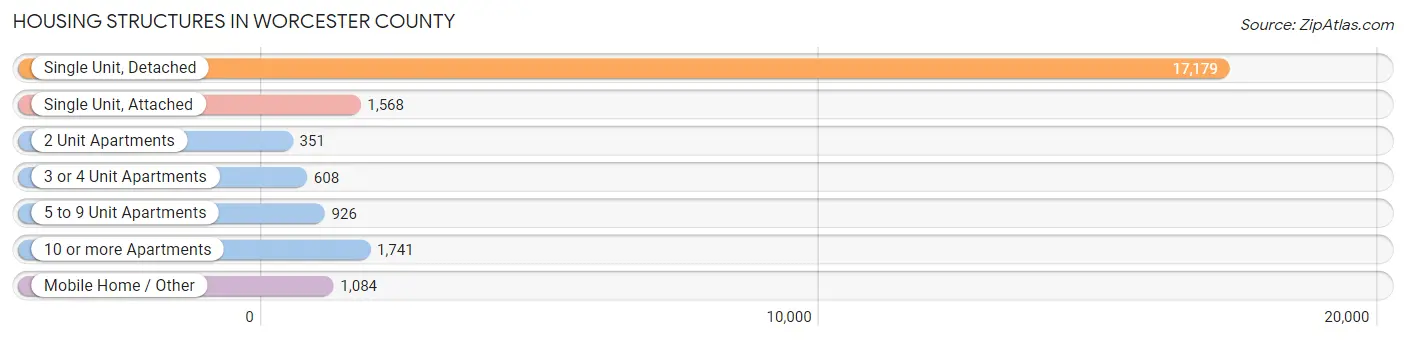
| Structure Type | # Housing Units | % Housing Units |
| Single Unit, Detached | 17,179 | 73.2% |
| Single Unit, Attached | 1,568 | 6.7% |
| 2 Unit Apartments | 351 | 1.5% |
| 3 or 4 Unit Apartments | 608 | 2.6% |
| 5 to 9 Unit Apartments | 926 | 4.0% |
| 10 or more Apartments | 1,741 | 7.4% |
| Mobile Home / Other | 1,084 | 4.6% |
| Total | 23,457 | 100.0% |
Housing Structures by Occupancy in Worcester County
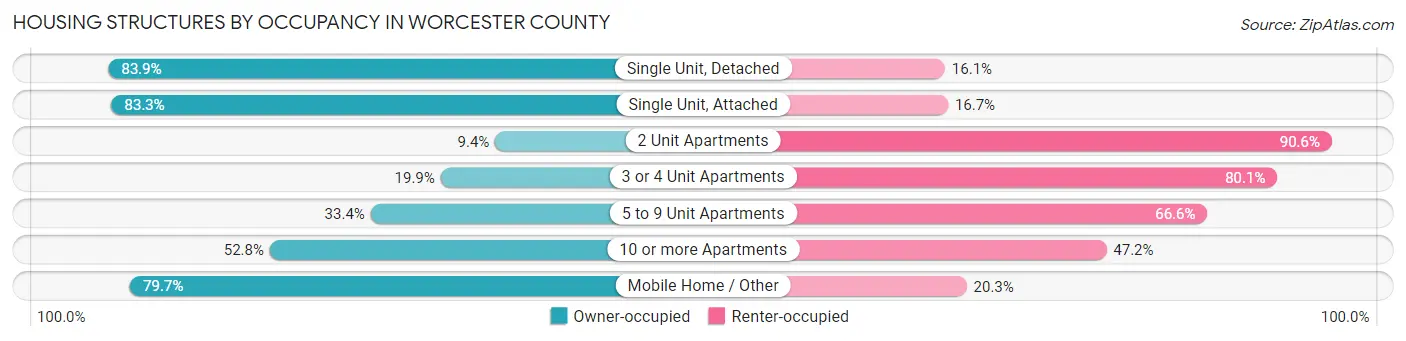
| Structure Type | Owner-occupied | Renter-occupied |
| Single Unit, Detached | 14,409 (83.9%) | 2,770 (16.1%) |
| Single Unit, Attached | 1,306 (83.3%) | 262 (16.7%) |
| 2 Unit Apartments | 33 (9.4%) | 318 (90.6%) |
| 3 or 4 Unit Apartments | 121 (19.9%) | 487 (80.1%) |
| 5 to 9 Unit Apartments | 309 (33.4%) | 617 (66.6%) |
| 10 or more Apartments | 919 (52.8%) | 822 (47.2%) |
| Mobile Home / Other | 864 (79.7%) | 220 (20.3%) |
| Total | 17,961 (76.6%) | 5,496 (23.4%) |
Housing Structures by Number of Rooms in Worcester County
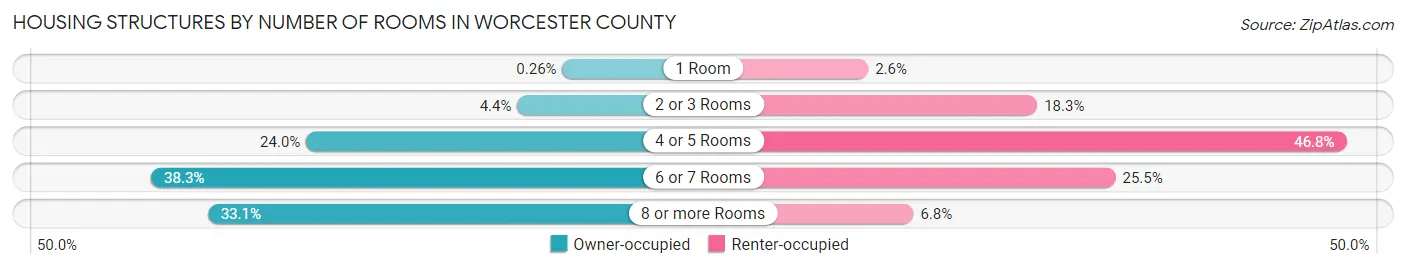
| Number of Rooms | Owner-occupied | Renter-occupied |
| 1 Room | 47 (0.3%) | 144 (2.6%) |
| 2 or 3 Rooms | 796 (4.4%) | 1,003 (18.2%) |
| 4 or 5 Rooms | 4,303 (24.0%) | 2,574 (46.8%) |
| 6 or 7 Rooms | 6,877 (38.3%) | 1,401 (25.5%) |
| 8 or more Rooms | 5,938 (33.1%) | 374 (6.8%) |
| Total | 17,961 (100.0%) | 5,496 (100.0%) |
Housing Structure by Heating Type in Worcester County
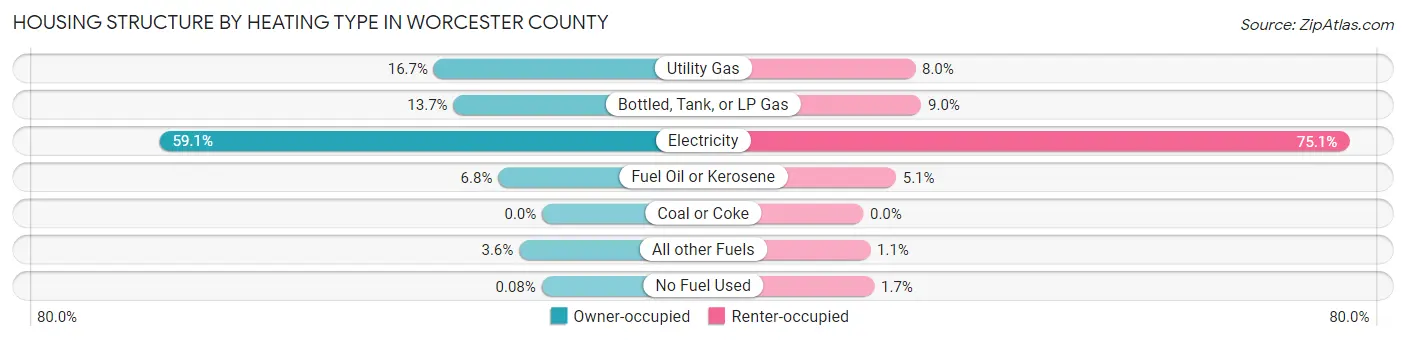
| Heating Type | Owner-occupied | Renter-occupied |
| Utility Gas | 3,006 (16.7%) | 442 (8.0%) |
| Bottled, Tank, or LP Gas | 2,463 (13.7%) | 493 (9.0%) |
| Electricity | 10,622 (59.1%) | 4,129 (75.1%) |
| Fuel Oil or Kerosene | 1,217 (6.8%) | 278 (5.1%) |
| Coal or Coke | 0 (0.0%) | 0 (0.0%) |
| All other Fuels | 638 (3.5%) | 60 (1.1%) |
| No Fuel Used | 15 (0.1%) | 94 (1.7%) |
| Total | 17,961 (100.0%) | 5,496 (100.0%) |
Household Vehicle Usage in Worcester County
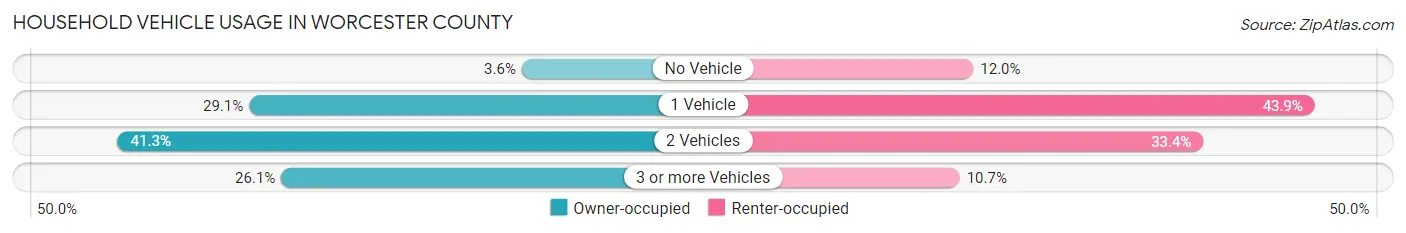
| Vehicles per Household | Owner-occupied | Renter-occupied |
| No Vehicle | 644 (3.6%) | 659 (12.0%) |
| 1 Vehicle | 5,218 (29.0%) | 2,410 (43.9%) |
| 2 Vehicles | 7,420 (41.3%) | 1,838 (33.4%) |
| 3 or more Vehicles | 4,679 (26.1%) | 589 (10.7%) |
| Total | 17,961 (100.0%) | 5,496 (100.0%) |
Real Estate & Mortgages in Worcester County
Real Estate and Mortgage Overview in Worcester County
| Characteristic | Without Mortgage | With Mortgage |
| Housing Units | 7,205 | 10,756 |
| Median Property Value | $302,500 | $315,400 |
| Median Household Income | $71,476 | $2,896 |
| Monthly Housing Costs | $670 | $1,639 |
| Real Estate Taxes | $2,526 | $323 |
Property Value by Mortgage Status in Worcester County
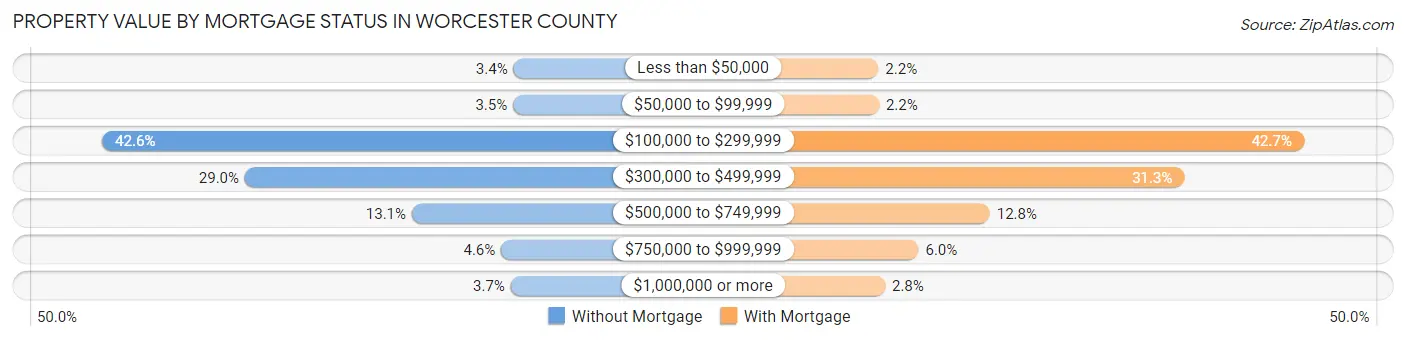
| Property Value | Without Mortgage | With Mortgage |
| Less than $50,000 | 248 (3.4%) | 235 (2.2%) |
| $50,000 to $99,999 | 251 (3.5%) | 240 (2.2%) |
| $100,000 to $299,999 | 3,070 (42.6%) | 4,591 (42.7%) |
| $300,000 to $499,999 | 2,091 (29.0%) | 3,367 (31.3%) |
| $500,000 to $749,999 | 945 (13.1%) | 1,376 (12.8%) |
| $750,000 to $999,999 | 333 (4.6%) | 645 (6.0%) |
| $1,000,000 or more | 267 (3.7%) | 302 (2.8%) |
| Total | 7,205 (100.0%) | 10,756 (100.0%) |
Household Income by Mortgage Status in Worcester County
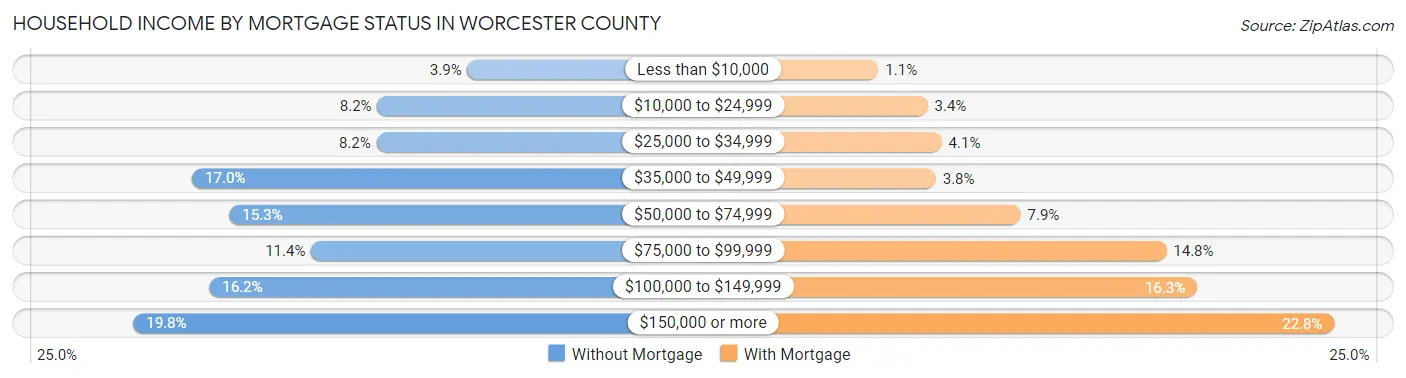
| Household Income | Without Mortgage | With Mortgage |
| Less than $10,000 | 282 (3.9%) | 117 (1.1%) |
| $10,000 to $24,999 | 591 (8.2%) | 369 (3.4%) |
| $25,000 to $34,999 | 594 (8.2%) | 441 (4.1%) |
| $35,000 to $49,999 | 1,226 (17.0%) | 411 (3.8%) |
| $50,000 to $74,999 | 1,099 (15.2%) | 845 (7.9%) |
| $75,000 to $99,999 | 818 (11.4%) | 1,592 (14.8%) |
| $100,000 to $149,999 | 1,167 (16.2%) | 1,750 (16.3%) |
| $150,000 or more | 1,428 (19.8%) | 2,452 (22.8%) |
| Total | 7,205 (100.0%) | 10,756 (100.0%) |
Property Value to Household Income Ratio in Worcester County
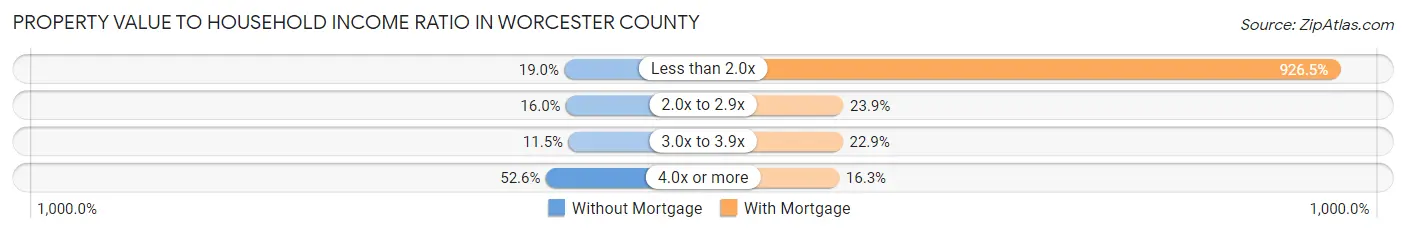
| Value-to-Income Ratio | Without Mortgage | With Mortgage |
| Less than 2.0x | 1,366 (19.0%) | 99,654 (926.5%) |
| 2.0x to 2.9x | 1,156 (16.0%) | 2,575 (23.9%) |
| 3.0x to 3.9x | 830 (11.5%) | 2,460 (22.9%) |
| 4.0x or more | 3,786 (52.5%) | 1,754 (16.3%) |
| Total | 7,205 (100.0%) | 10,756 (100.0%) |
Real Estate Taxes by Mortgage Status in Worcester County
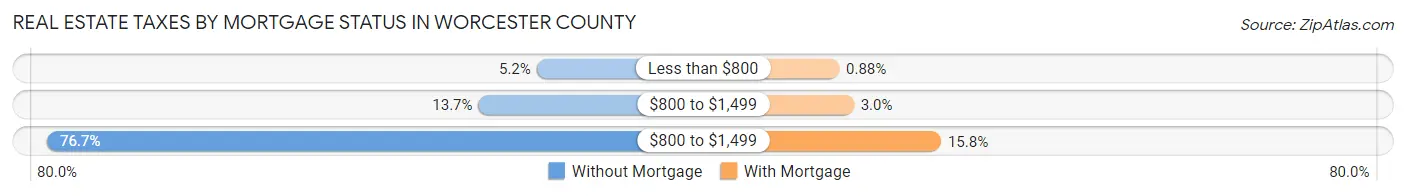
| Property Taxes | Without Mortgage | With Mortgage |
| Less than $800 | 373 (5.2%) | 95 (0.9%) |
| $800 to $1,499 | 987 (13.7%) | 325 (3.0%) |
| $800 to $1,499 | 5,527 (76.7%) | 1,696 (15.8%) |
| Total | 7,205 (100.0%) | 10,756 (100.0%) |
Health & Disability in Worcester County
Health Insurance Coverage by Age in Worcester County
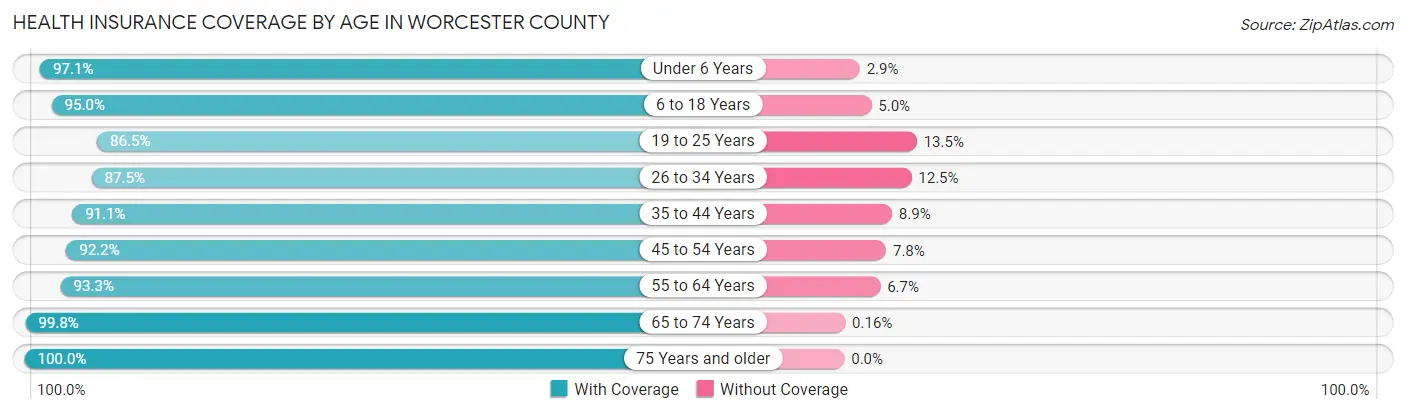
| Age Bracket | With Coverage | Without Coverage |
| Under 6 Years | 2,359 (97.1%) | 70 (2.9%) |
| 6 to 18 Years | 6,762 (95.0%) | 359 (5.0%) |
| 19 to 25 Years | 2,933 (86.5%) | 458 (13.5%) |
| 26 to 34 Years | 4,079 (87.5%) | 583 (12.5%) |
| 35 to 44 Years | 4,803 (91.1%) | 468 (8.9%) |
| 45 to 54 Years | 5,784 (92.2%) | 488 (7.8%) |
| 55 to 64 Years | 7,933 (93.3%) | 570 (6.7%) |
| 65 to 74 Years | 8,284 (99.8%) | 13 (0.2%) |
| 75 Years and older | 6,175 (100.0%) | 0 (0.0%) |
| Total | 49,112 (94.2%) | 3,009 (5.8%) |
Health Insurance Coverage by Citizenship Status in Worcester County
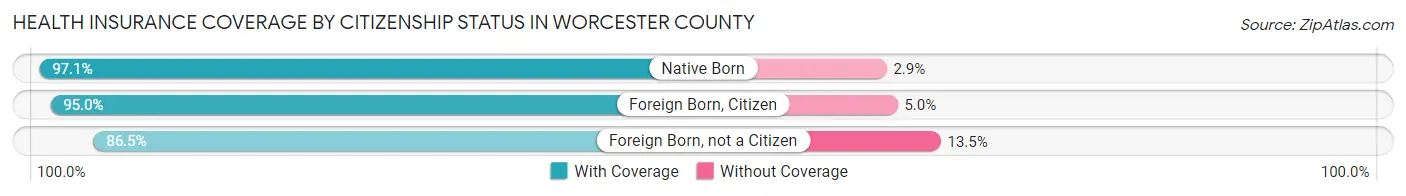
| Citizenship Status | With Coverage | Without Coverage |
| Native Born | 2,359 (97.1%) | 70 (2.9%) |
| Foreign Born, Citizen | 6,762 (95.0%) | 359 (5.0%) |
| Foreign Born, not a Citizen | 2,933 (86.5%) | 458 (13.5%) |
Health Insurance Coverage by Household Income in Worcester County
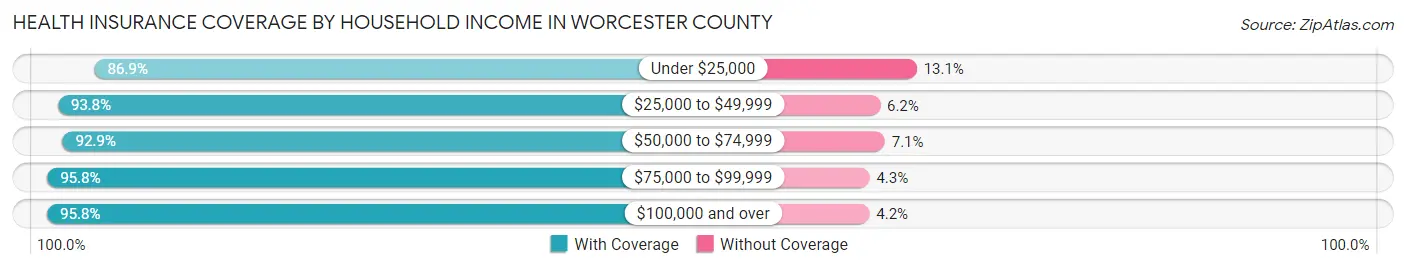
| Household Income | With Coverage | Without Coverage |
| Under $25,000 | 4,101 (86.9%) | 618 (13.1%) |
| $25,000 to $49,999 | 7,952 (93.8%) | 528 (6.2%) |
| $50,000 to $74,999 | 6,984 (92.9%) | 535 (7.1%) |
| $75,000 to $99,999 | 7,368 (95.8%) | 327 (4.3%) |
| $100,000 and over | 22,567 (95.8%) | 995 (4.2%) |
Public vs Private Health Insurance Coverage by Age in Worcester County
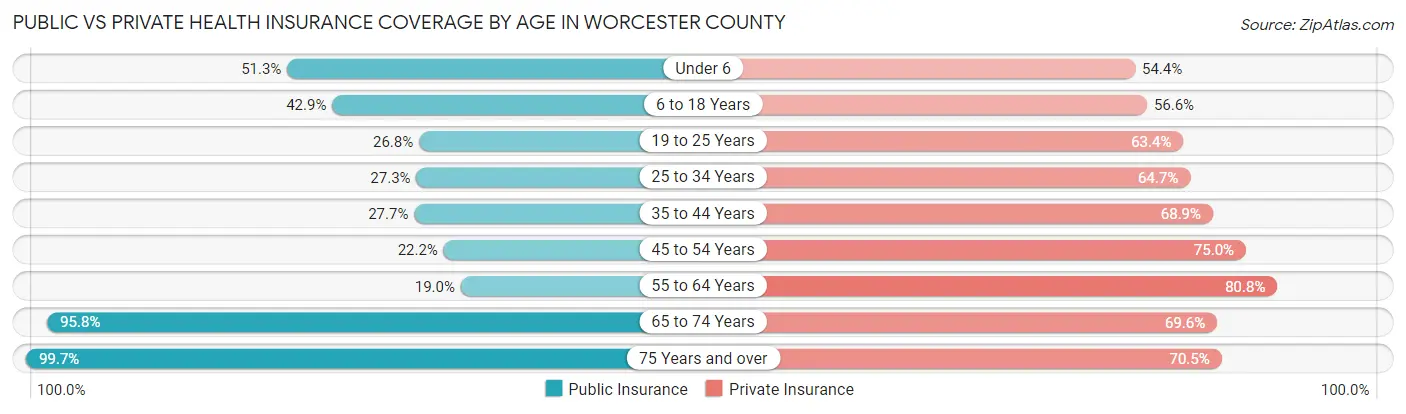
| Age Bracket | Public Insurance | Private Insurance |
| Under 6 | 1,245 (51.3%) | 1,322 (54.4%) |
| 6 to 18 Years | 3,055 (42.9%) | 4,033 (56.6%) |
| 19 to 25 Years | 908 (26.8%) | 2,149 (63.4%) |
| 25 to 34 Years | 1,272 (27.3%) | 3,014 (64.6%) |
| 35 to 44 Years | 1,459 (27.7%) | 3,630 (68.9%) |
| 45 to 54 Years | 1,393 (22.2%) | 4,704 (75.0%) |
| 55 to 64 Years | 1,618 (19.0%) | 6,872 (80.8%) |
| 65 to 74 Years | 7,952 (95.8%) | 5,778 (69.6%) |
| 75 Years and over | 6,159 (99.7%) | 4,352 (70.5%) |
| Total | 25,061 (48.1%) | 35,854 (68.8%) |
Disability Status by Sex by Age in Worcester County
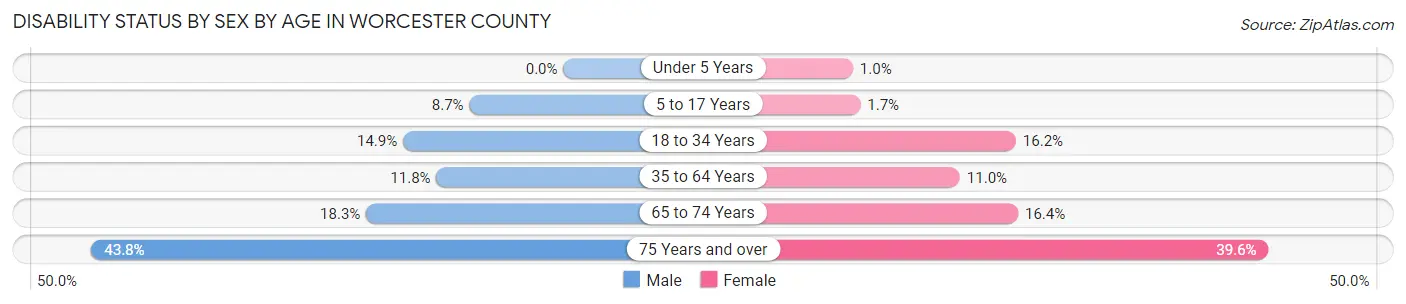
| Age Bracket | Male | Female |
| Under 5 Years | 0 (0.0%) | 10 (1.0%) |
| 5 to 17 Years | 312 (8.7%) | 58 (1.7%) |
| 18 to 34 Years | 602 (14.9%) | 728 (16.2%) |
| 35 to 64 Years | 1,173 (11.8%) | 1,106 (11.0%) |
| 65 to 74 Years | 721 (18.3%) | 713 (16.4%) |
| 75 Years and over | 1,200 (43.8%) | 1,360 (39.6%) |
Disability Class by Sex by Age in Worcester County
Disability Class: Hearing Difficulty
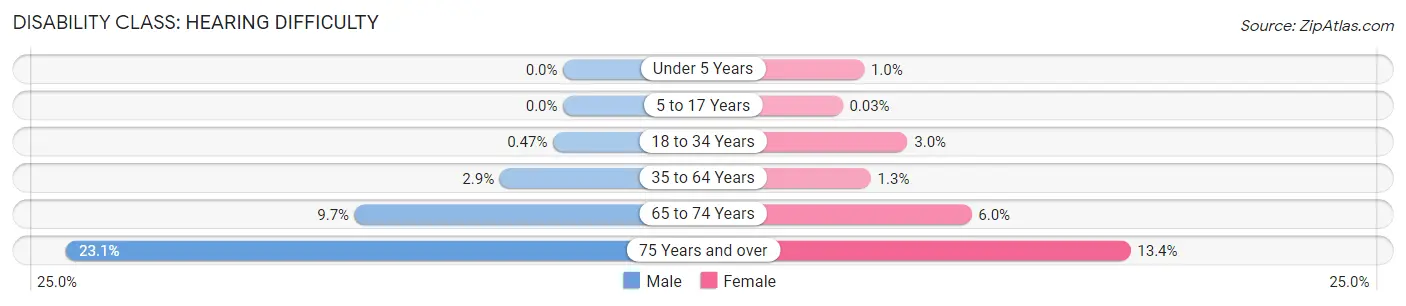
| Age Bracket | Male | Female |
| Under 5 Years | 0 (0.0%) | 10 (1.0%) |
| 5 to 17 Years | 0 (0.0%) | 1 (0.0%) |
| 18 to 34 Years | 19 (0.5%) | 137 (3.0%) |
| 35 to 64 Years | 293 (2.9%) | 135 (1.3%) |
| 65 to 74 Years | 381 (9.7%) | 262 (6.0%) |
| 75 Years and over | 632 (23.1%) | 460 (13.4%) |
Disability Class: Vision Difficulty
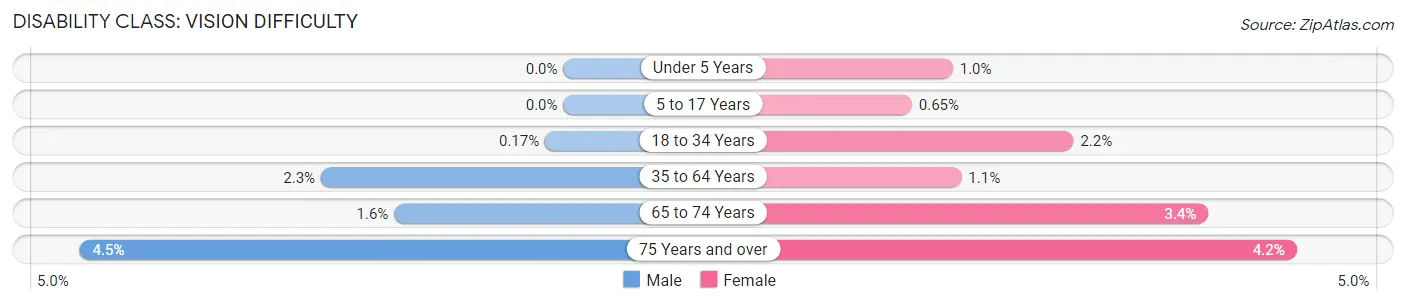
| Age Bracket | Male | Female |
| Under 5 Years | 0 (0.0%) | 10 (1.0%) |
| 5 to 17 Years | 0 (0.0%) | 22 (0.6%) |
| 18 to 34 Years | 7 (0.2%) | 97 (2.1%) |
| 35 to 64 Years | 224 (2.2%) | 112 (1.1%) |
| 65 to 74 Years | 62 (1.6%) | 148 (3.4%) |
| 75 Years and over | 123 (4.5%) | 145 (4.2%) |
Disability Class: Cognitive Difficulty
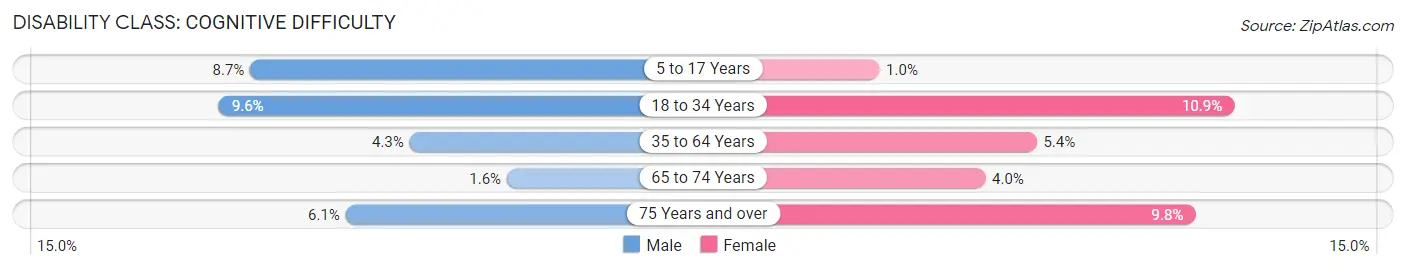
| Age Bracket | Male | Female |
| 5 to 17 Years | 312 (8.7%) | 35 (1.0%) |
| 18 to 34 Years | 388 (9.6%) | 492 (10.9%) |
| 35 to 64 Years | 426 (4.3%) | 547 (5.4%) |
| 65 to 74 Years | 62 (1.6%) | 174 (4.0%) |
| 75 Years and over | 166 (6.1%) | 338 (9.8%) |
Disability Class: Ambulatory Difficulty
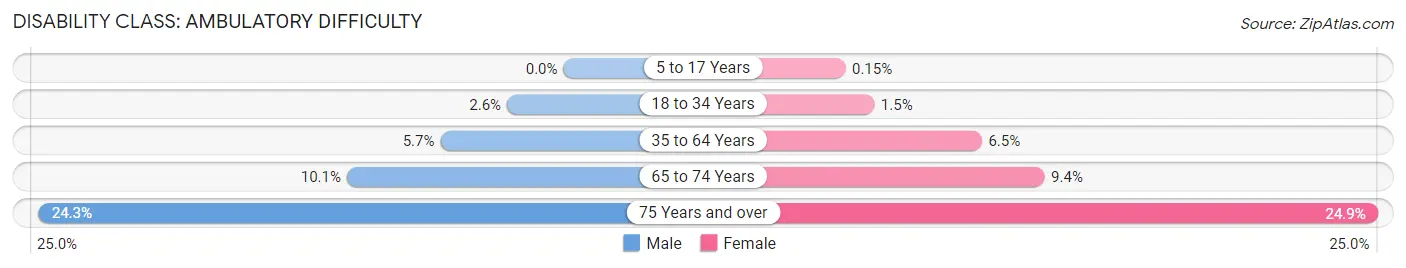
| Age Bracket | Male | Female |
| 5 to 17 Years | 0 (0.0%) | 5 (0.2%) |
| 18 to 34 Years | 106 (2.6%) | 67 (1.5%) |
| 35 to 64 Years | 568 (5.7%) | 654 (6.5%) |
| 65 to 74 Years | 396 (10.1%) | 409 (9.4%) |
| 75 Years and over | 667 (24.3%) | 854 (24.9%) |
Disability Class: Self-Care Difficulty
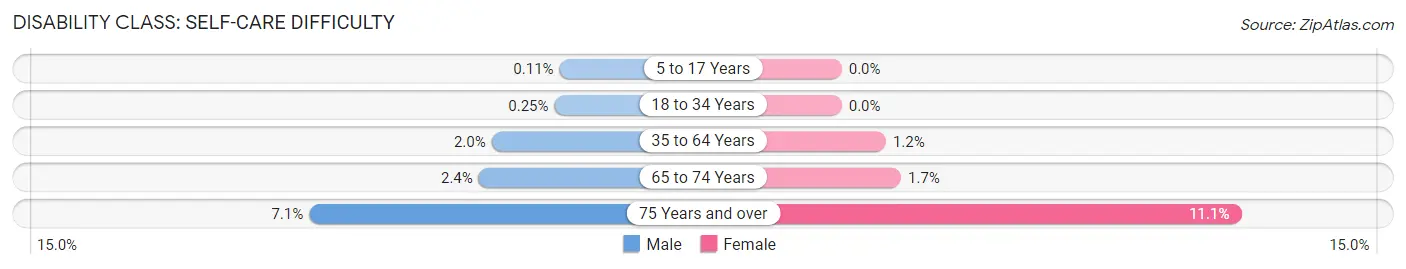
| Age Bracket | Male | Female |
| 5 to 17 Years | 4 (0.1%) | 0 (0.0%) |
| 18 to 34 Years | 10 (0.3%) | 0 (0.0%) |
| 35 to 64 Years | 199 (2.0%) | 124 (1.2%) |
| 65 to 74 Years | 93 (2.4%) | 72 (1.7%) |
| 75 Years and over | 194 (7.1%) | 382 (11.1%) |
Technology Access in Worcester County
Computing Device Access in Worcester County
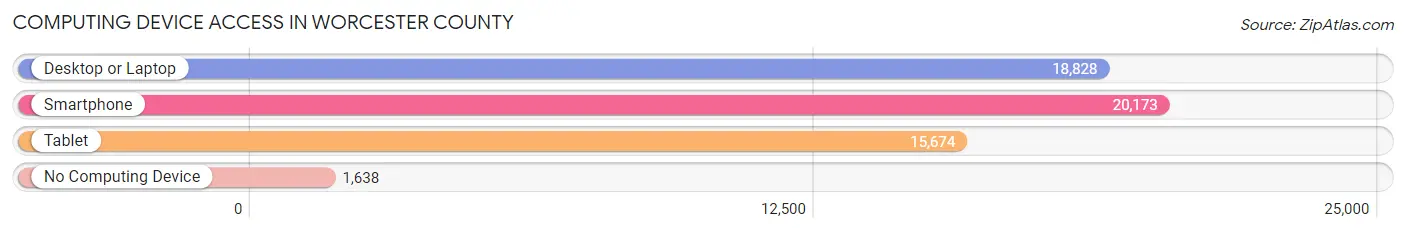
| Device Type | # Households | % Households |
| Desktop or Laptop | 18,828 | 80.3% |
| Smartphone | 20,173 | 86.0% |
| Tablet | 15,674 | 66.8% |
| No Computing Device | 1,638 | 7.0% |
| Total | 23,457 | 100.0% |
Internet Access in Worcester County
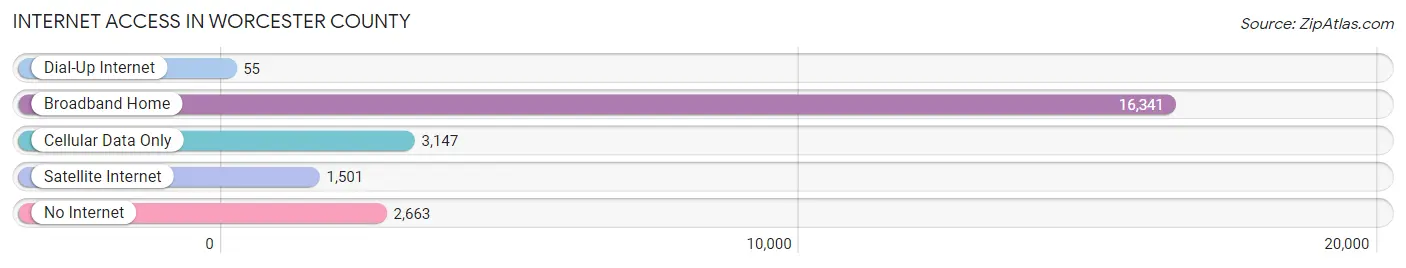
| Internet Type | # Households | % Households |
| Dial-Up Internet | 55 | 0.2% |
| Broadband Home | 16,341 | 69.7% |
| Cellular Data Only | 3,147 | 13.4% |
| Satellite Internet | 1,501 | 6.4% |
| No Internet | 2,663 | 11.4% |
| Total | 23,457 | 100.0% |
Worcester County Summary
Worcester County is located in the eastern part of the state of Maryland, on the Delmarva Peninsula. It is bordered by the Atlantic Ocean to the east, Wicomico County to the south, Somerset County to the west, and Sussex County, Delaware to the north. The county seat is Snow Hill, and the largest city is Ocean City. Worcester County is the second largest county in Maryland, with a total area of 695 square miles.
History
Worcester County was established in 1742, and was named for Mary Arundell, the wife of Thomas Arundell, 1st Baron Arundell of Wardour. The county was originally part of Somerset County, and was divided into two parts in 1748. The northern part was named Worcester County, and the southern part was named Somerset County.
The county was home to a variety of Native American tribes, including the Nanticoke, Assateague, and Pocomoke. The first European settlers arrived in the area in the 1630s, and the county was officially established in 1742.
During the American Revolution, Worcester County was a hotbed of activity. The county was home to several battles, including the Battle of Snow Hill in 1777. The county was also home to several prominent figures in the Revolution, including Thomas Stone, a signer of the Declaration of Independence, and William Paca, a signer of the Articles of Confederation.
Geography
Worcester County is located in the eastern part of the state of Maryland, on the Delmarva Peninsula. It is bordered by the Atlantic Ocean to the east, Wicomico County to the south, Somerset County to the west, and Sussex County, Delaware to the north. The county has a total area of 695 square miles, making it the second largest county in Maryland.
The county is divided into two distinct regions: the Eastern Shore and the Western Shore. The Eastern Shore is characterized by flat, marshy terrain, while the Western Shore is more hilly and forested. The county is home to several rivers, including the Pocomoke River, the Nanticoke River, and the Choptank River.
Economy
Worcester County has a diverse economy, with a mix of agriculture, manufacturing, tourism, and services. The county is home to several large employers, including Perdue Farms, the largest employer in the county, and the University of Maryland Eastern Shore.
Agriculture is a major part of the county’s economy, with poultry, corn, soybeans, and wheat being the main crops. The county is also home to several manufacturing companies, including Ocean Spray Cranberries, which produces cranberry juice and other products.
Tourism is a major industry in Worcester County, with Ocean City being the main destination. The county is also home to several state parks, including Assateague Island National Seashore, Pocomoke River State Park, and Chincoteague National Wildlife Refuge.
Demographics
As of the 2010 census, Worcester County had a population of 51,454. The population is predominantly white (87.3%), with African Americans (7.7%) and Hispanics (2.7%) making up the largest minority groups. The median household income is $50,867, and the median age is 44.7.
Conclusion
Worcester County is located in the eastern part of the state of Maryland, on the Delmarva Peninsula. It was established in 1742, and is the second largest county in Maryland. The county has a diverse economy, with a mix of agriculture, manufacturing, tourism, and services. The population is predominantly white, with African Americans and Hispanics making up the largest minority groups. Worcester County is home to several large employers, state parks, and tourist attractions, making it an important part of the state’s economy.
Common Questions
What is the Total Population of Worcester County?
Total Population of Worcester County is 52,827.
What is the Total Male Population of Worcester County?
Total Male Population of Worcester County is 25,841.
What is the Total Female Population of Worcester County?
Total Female Population of Worcester County is 26,986.
What is the Ratio of Males per 100 Females in Worcester County?
There are 95.76 Males per 100 Females in Worcester County.
What is the Ratio of Females per 100 Males in Worcester County?
There are 104.43 Females per 100 Males in Worcester County.
What is the Median Population Age in Worcester County?
Median Population Age in Worcester County is 50.6 Years.
What is the Average Family Size in Worcester County
Average Family Size in Worcester County is 2.8 People.
What is the Average Household Size in Worcester County
Average Household Size in Worcester County is 2.2 People.
What is Per Capita Income in Worcester County?
Per Capita income in Worcester County is $48,769.
What is the Median Family Income in Worcester County?
Median Family Income in Worcester County is $97,408.
What is the Median Household income in Worcester County?
Median Household Income in Worcester County is $76,689.
What is Income or Wage Gap in Worcester County?
Income or Wage Gap in Worcester County is 21.6%.
Women in Worcester County earn 78.4 cents for every dollar earned by a man.
What is Family Income Deficit in Worcester County?
Family Income Deficit in Worcester County is $9,823.
Families that are below poverty line in Worcester County earn $9,823 less on average than the poverty threshold level.
What is Inequality or Gini Index in Worcester County?
Inequality or Gini Index in Worcester County is 0.48.
How Large is the Labor Force in Worcester County?
There are 26,465 People in the Labor Forcein in Worcester County.
What is the Percentage of People in the Labor Force in Worcester County?
59.0% of People are in the Labor Force in Worcester County.
What is the Unemployment Rate in Worcester County?
Unemployment Rate in Worcester County is 6.5%.