Wicomico County, MD
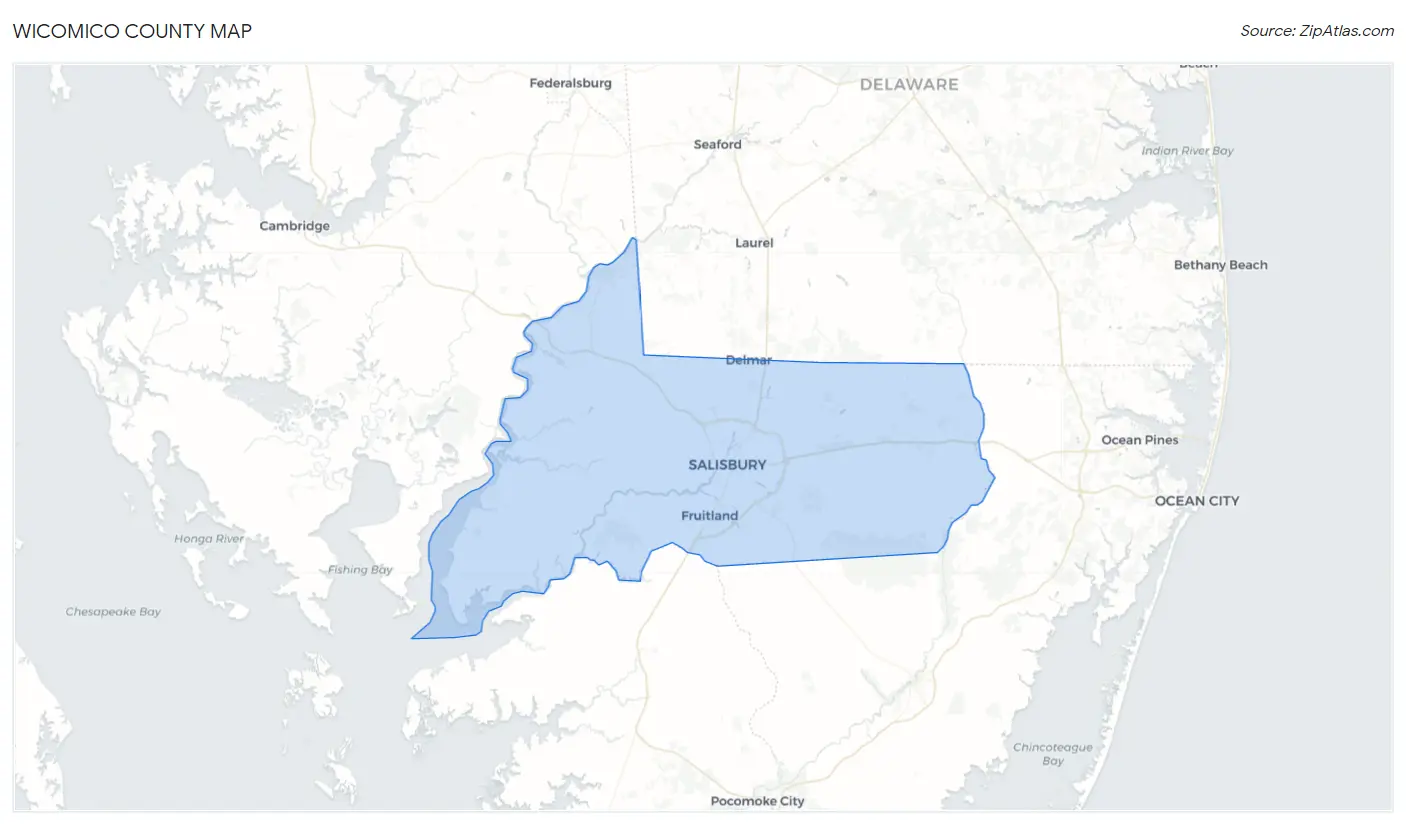
Wicomico County Map
Wicomico County Overview
103,815
TOTAL POPULATION
49,720
MALE POPULATION
54,095
FEMALE POPULATION
91.91
MALES / 100 FEMALES
108.80
FEMALES / 100 MALES
36.1
MEDIAN AGE
3.0
AVG FAMILY SIZE
2.5
AVG HOUSEHOLD SIZE
$35,658
PER CAPITA INCOME
$84,504
AVG FAMILY INCOME
$69,421
AVG HOUSEHOLD INCOME
23.7%
WAGE / INCOME GAP [ % ]
76.3¢/ $1
WAGE / INCOME GAP [ $ ]
$10,315
FAMILY INCOME DEFICIT
0.46
INEQUALITY / GINI INDEX
54,815
LABOR FORCE [ PEOPLE ]
65.5%
PERCENT IN LABOR FORCE
6.9%
UNEMPLOYMENT RATE
Race in Wicomico County
The most populous races in Wicomico County are White / Caucasian (64,951 | 62.6%), Black / African American (27,049 | 26.1%), and Two or more Races (6,065 | 5.8%).
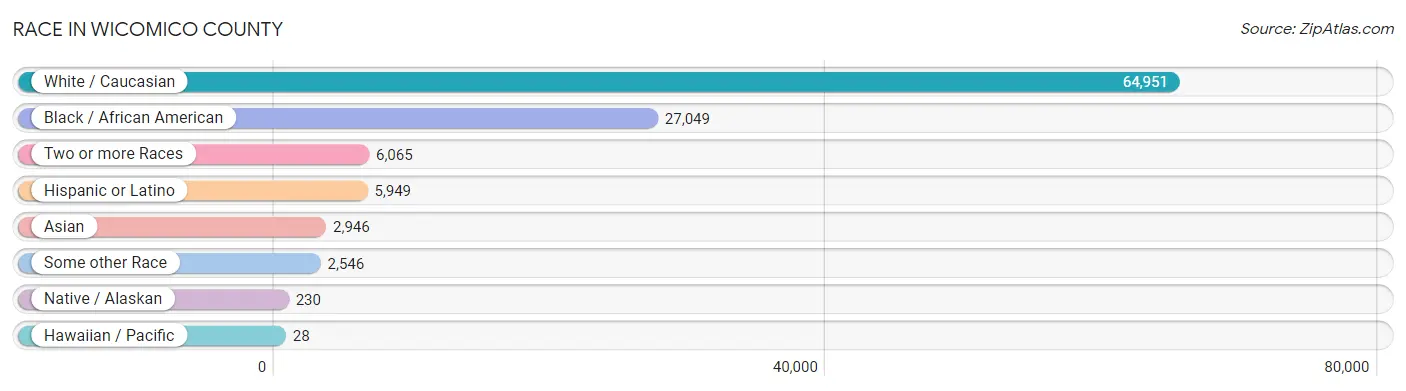
| Race | # Population | % Population |
| Asian | 2,946 | 2.8% |
| Black / African American | 27,049 | 26.1% |
| Hawaiian / Pacific | 28 | 0.0% |
| Hispanic or Latino | 5,949 | 5.7% |
| Native / Alaskan | 230 | 0.2% |
| White / Caucasian | 64,951 | 62.6% |
| Two or more Races | 6,065 | 5.8% |
| Some other Race | 2,546 | 2.5% |
| Total | 103,815 | 100.0% |
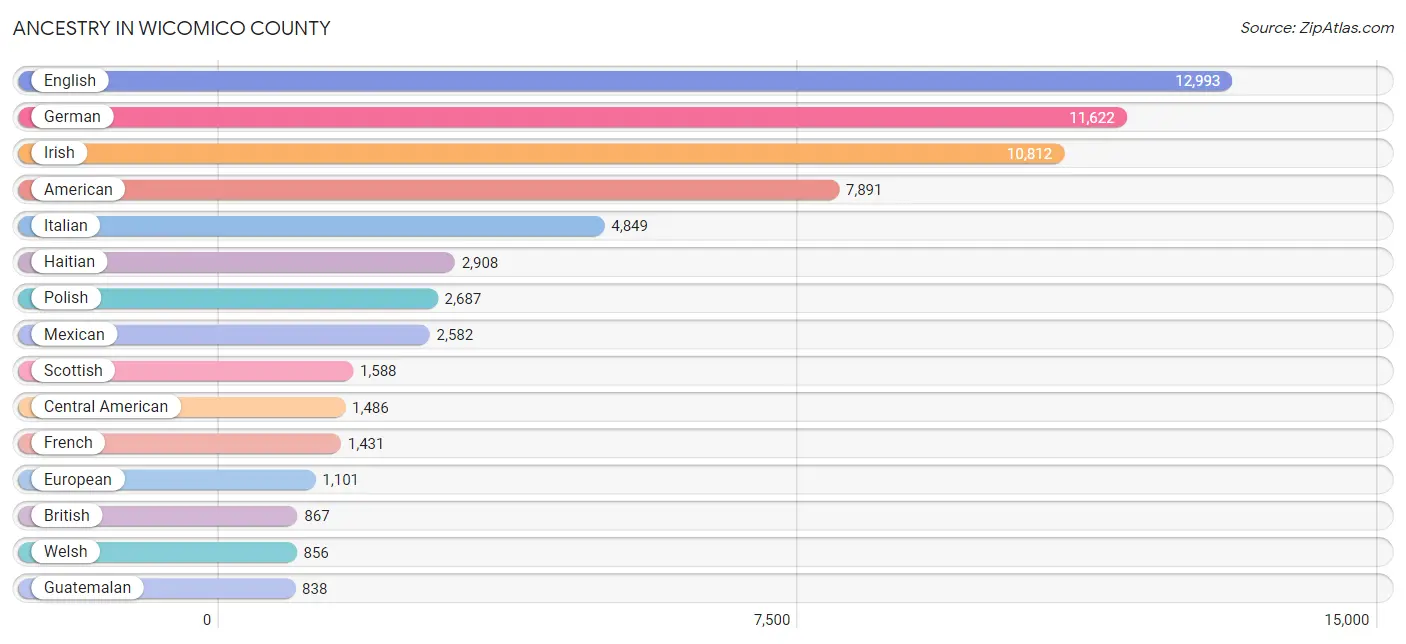
Ancestry in Wicomico County
The most populous ancestries reported in Wicomico County are English (12,993 | 12.5%), German (11,622 | 11.2%), Irish (10,812 | 10.4%), American (7,891 | 7.6%), and Italian (4,849 | 4.7%), together accounting for 46.4% of all Wicomico County residents.
| Ancestry | # Population | % Population |
| African | 348 | 0.3% |
| Albanian | 5 | 0.0% |
| American | 7,891 | 7.6% |
| Apache | 8 | 0.0% |
| Arab | 299 | 0.3% |
| Argentinean | 6 | 0.0% |
| Armenian | 17 | 0.0% |
| Austrian | 192 | 0.2% |
| Bahamian | 28 | 0.0% |
| Belgian | 70 | 0.1% |
| Bermudan | 45 | 0.0% |
| Bhutanese | 192 | 0.2% |
| Blackfeet | 71 | 0.1% |
| Brazilian | 305 | 0.3% |
| British | 867 | 0.8% |
| British West Indian | 4 | 0.0% |
| Burmese | 728 | 0.7% |
| Canadian | 24 | 0.0% |
| Celtic | 17 | 0.0% |
| Central American | 1,486 | 1.4% |
| Central American Indian | 177 | 0.2% |
| Cherokee | 297 | 0.3% |
| Colombian | 40 | 0.0% |
| Comanche | 47 | 0.1% |
| Costa Rican | 212 | 0.2% |
| Croatian | 110 | 0.1% |
| Cuban | 112 | 0.1% |
| Czech | 159 | 0.2% |
| Czechoslovakian | 72 | 0.1% |
| Danish | 45 | 0.0% |
| Dominican | 360 | 0.4% |
| Dutch | 491 | 0.5% |
| Eastern European | 296 | 0.3% |
| Ecuadorian | 19 | 0.0% |
| Egyptian | 83 | 0.1% |
| English | 12,993 | 12.5% |
| Estonian | 26 | 0.0% |
| Ethiopian | 73 | 0.1% |
| European | 1,101 | 1.1% |
| Filipino | 17 | 0.0% |
| Finnish | 121 | 0.1% |
| French | 1,431 | 1.4% |
| French Canadian | 142 | 0.1% |
| German | 11,622 | 11.2% |
| German Russian | 4 | 0.0% |
| Ghanaian | 60 | 0.1% |
| Greek | 257 | 0.3% |
| Guamanian / Chamorro | 19 | 0.0% |
| Guatemalan | 838 | 0.8% |
| Guyanese | 105 | 0.1% |
| Haitian | 2,908 | 2.8% |
| Honduran | 258 | 0.3% |
| Hungarian | 300 | 0.3% |
| Indian (Asian) | 430 | 0.4% |
| Iranian | 99 | 0.1% |
| Irish | 10,812 | 10.4% |
| Iroquois | 14 | 0.0% |
| Italian | 4,849 | 4.7% |
| Jamaican | 204 | 0.2% |
| Kiowa | 12 | 0.0% |
| Korean | 575 | 0.5% |
| Laotian | 9 | 0.0% |
| Latvian | 4 | 0.0% |
| Lebanese | 163 | 0.2% |
| Lithuanian | 107 | 0.1% |
| Malaysian | 7 | 0.0% |
| Mexican | 2,582 | 2.5% |
| Mexican American Indian | 53 | 0.1% |
| Moroccan | 2 | 0.0% |
| Native Hawaiian | 377 | 0.4% |
| Navajo | 6 | 0.0% |
| Nigerian | 13 | 0.0% |
| Northern European | 65 | 0.1% |
| Norwegian | 445 | 0.4% |
| Palestinian | 78 | 0.1% |
| Pennsylvania German | 127 | 0.1% |
| Peruvian | 103 | 0.1% |
| Polish | 2,687 | 2.6% |
| Portuguese | 250 | 0.2% |
| Pueblo | 4 | 0.0% |
| Puerto Rican | 585 | 0.6% |
| Romanian | 66 | 0.1% |
| Russian | 421 | 0.4% |
| Salvadoran | 178 | 0.2% |
| Scandinavian | 224 | 0.2% |
| Scotch-Irish | 698 | 0.7% |
| Scottish | 1,588 | 1.5% |
| Serbian | 16 | 0.0% |
| Sierra Leonean | 17 | 0.0% |
| Sioux | 16 | 0.0% |
| Slavic | 41 | 0.0% |
| Slovak | 200 | 0.2% |
| Slovene | 44 | 0.0% |
| South African | 80 | 0.1% |
| South American | 168 | 0.2% |
| Spaniard | 194 | 0.2% |
| Spanish | 16 | 0.0% |
| Sri Lankan | 662 | 0.6% |
| Subsaharan African | 619 | 0.6% |
| Sudanese | 20 | 0.0% |
| Swedish | 523 | 0.5% |
| Swiss | 97 | 0.1% |
| Syrian | 34 | 0.0% |
| Thai | 300 | 0.3% |
| Turkish | 303 | 0.3% |
| Ukrainian | 144 | 0.1% |
| Welsh | 856 | 0.8% |
| West Indian | 217 | 0.2% |
| Yugoslavian | 18 | 0.0% | View All 109 Rows |
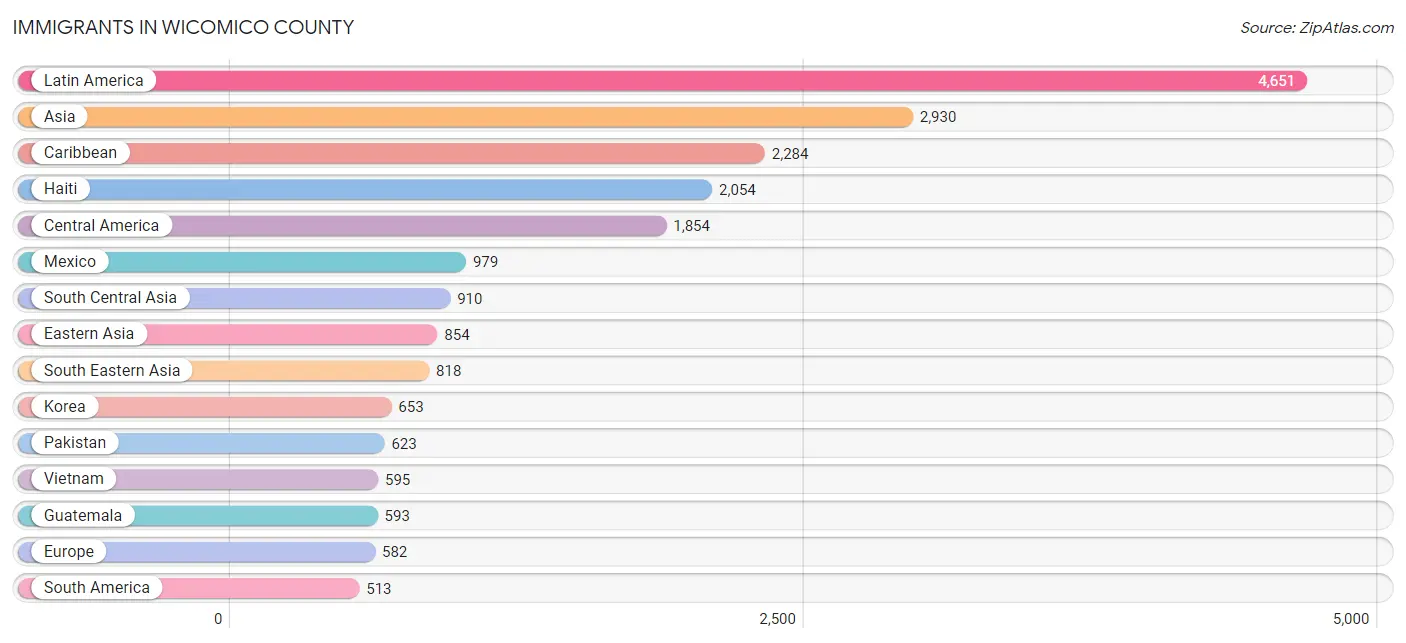
Immigrants in Wicomico County
The most numerous immigrant groups reported in Wicomico County came from Latin America (4,651 | 4.5%), Asia (2,930 | 2.8%), Caribbean (2,284 | 2.2%), Haiti (2,054 | 2.0%), and Central America (1,854 | 1.8%), together accounting for 13.3% of all Wicomico County residents.
| Immigration Origin | # Population | % Population |
| Africa | 279 | 0.3% |
| Asia | 2,930 | 2.8% |
| Austria | 18 | 0.0% |
| Bahamas | 26 | 0.0% |
| Bosnia and Herzegovina | 16 | 0.0% |
| Brazil | 327 | 0.3% |
| Cameroon | 8 | 0.0% |
| Canada | 76 | 0.1% |
| Caribbean | 2,284 | 2.2% |
| Central America | 1,854 | 1.8% |
| China | 189 | 0.2% |
| Colombia | 26 | 0.0% |
| Costa Rica | 47 | 0.1% |
| Cuba | 30 | 0.0% |
| Czechoslovakia | 9 | 0.0% |
| Dominican Republic | 168 | 0.2% |
| Eastern Africa | 29 | 0.0% |
| Eastern Asia | 854 | 0.8% |
| Eastern Europe | 146 | 0.1% |
| El Salvador | 95 | 0.1% |
| England | 79 | 0.1% |
| Ethiopia | 21 | 0.0% |
| Europe | 582 | 0.6% |
| France | 47 | 0.1% |
| Germany | 93 | 0.1% |
| Ghana | 63 | 0.1% |
| Guatemala | 593 | 0.6% |
| Guyana | 85 | 0.1% |
| Haiti | 2,054 | 2.0% |
| Honduras | 140 | 0.1% |
| Hong Kong | 34 | 0.0% |
| India | 165 | 0.2% |
| Iran | 122 | 0.1% |
| Ireland | 4 | 0.0% |
| Italy | 11 | 0.0% |
| Jamaica | 6 | 0.0% |
| Japan | 12 | 0.0% |
| Jordan | 5 | 0.0% |
| Kenya | 8 | 0.0% |
| Korea | 653 | 0.6% |
| Laos | 5 | 0.0% |
| Latin America | 4,651 | 4.5% |
| Lebanon | 97 | 0.1% |
| Lithuania | 13 | 0.0% |
| Mexico | 979 | 0.9% |
| Middle Africa | 8 | 0.0% |
| Moldova | 17 | 0.0% |
| Morocco | 2 | 0.0% |
| Nigeria | 25 | 0.0% |
| Northern Africa | 22 | 0.0% |
| Northern Europe | 184 | 0.2% |
| Pakistan | 623 | 0.6% |
| Peru | 47 | 0.1% |
| Philippines | 218 | 0.2% |
| Portugal | 76 | 0.1% |
| Romania | 37 | 0.0% |
| Russia | 31 | 0.0% |
| Scotland | 58 | 0.1% |
| Sierra Leone | 6 | 0.0% |
| South Africa | 126 | 0.1% |
| South America | 513 | 0.5% |
| South Central Asia | 910 | 0.9% |
| South Eastern Asia | 818 | 0.8% |
| Southern Europe | 94 | 0.1% |
| Spain | 7 | 0.0% |
| Sudan | 20 | 0.0% |
| Taiwan | 27 | 0.0% |
| Turkey | 154 | 0.2% |
| Ukraine | 7 | 0.0% |
| Venezuela | 28 | 0.0% |
| Vietnam | 595 | 0.6% |
| Western Africa | 94 | 0.1% |
| Western Asia | 304 | 0.3% |
| Western Europe | 158 | 0.2% | View All 74 Rows |
Sex and Age in Wicomico County
Sex and Age in Wicomico County
The most populous age groups in Wicomico County are 20 to 24 Years (4,854 | 9.8%) for men and 20 to 24 Years (5,607 | 10.4%) for women.
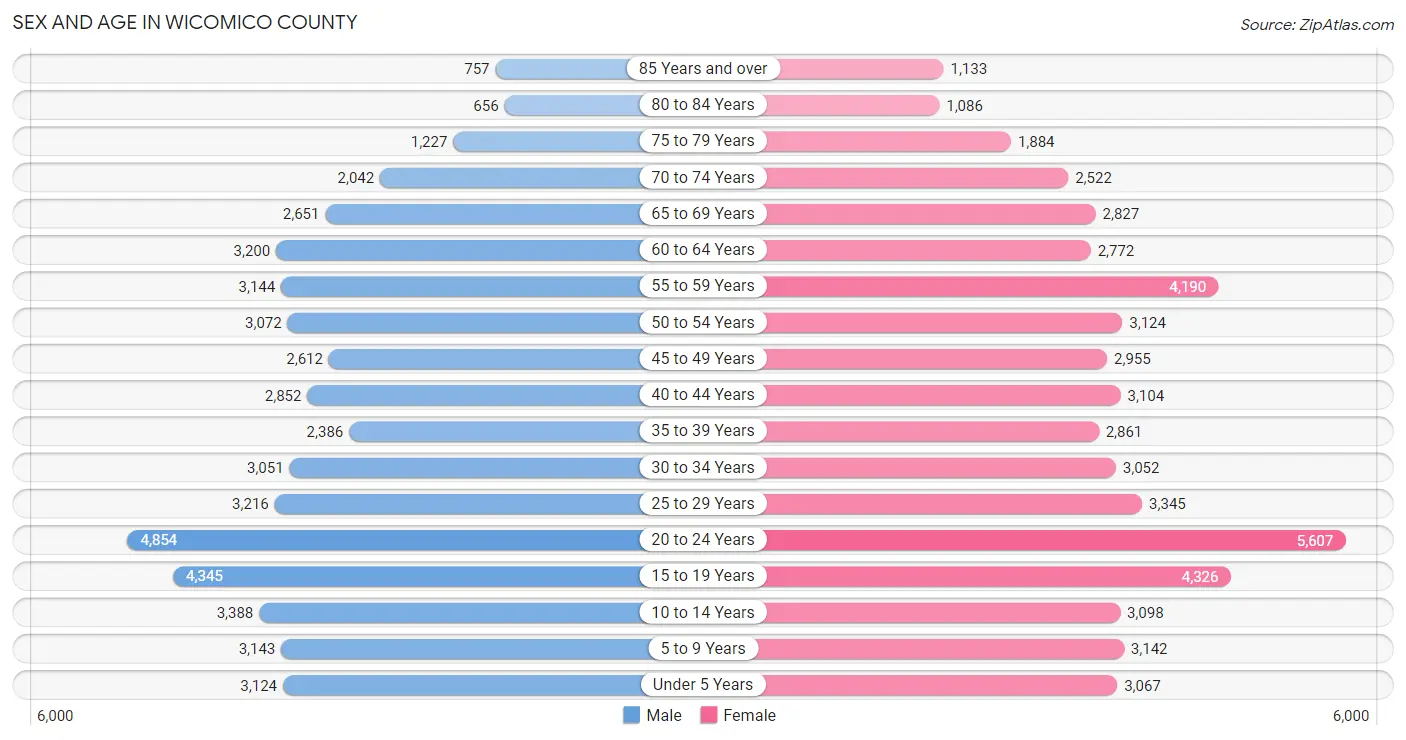
| Age Bracket | Male | Female |
| Under 5 Years | 3,124 (6.3%) | 3,067 (5.7%) |
| 5 to 9 Years | 3,143 (6.3%) | 3,142 (5.8%) |
| 10 to 14 Years | 3,388 (6.8%) | 3,098 (5.7%) |
| 15 to 19 Years | 4,345 (8.7%) | 4,326 (8.0%) |
| 20 to 24 Years | 4,854 (9.8%) | 5,607 (10.4%) |
| 25 to 29 Years | 3,216 (6.5%) | 3,345 (6.2%) |
| 30 to 34 Years | 3,051 (6.1%) | 3,052 (5.6%) |
| 35 to 39 Years | 2,386 (4.8%) | 2,861 (5.3%) |
| 40 to 44 Years | 2,852 (5.7%) | 3,104 (5.7%) |
| 45 to 49 Years | 2,612 (5.2%) | 2,955 (5.5%) |
| 50 to 54 Years | 3,072 (6.2%) | 3,124 (5.8%) |
| 55 to 59 Years | 3,144 (6.3%) | 4,190 (7.7%) |
| 60 to 64 Years | 3,200 (6.4%) | 2,772 (5.1%) |
| 65 to 69 Years | 2,651 (5.3%) | 2,827 (5.2%) |
| 70 to 74 Years | 2,042 (4.1%) | 2,522 (4.7%) |
| 75 to 79 Years | 1,227 (2.5%) | 1,884 (3.5%) |
| 80 to 84 Years | 656 (1.3%) | 1,086 (2.0%) |
| 85 Years and over | 757 (1.5%) | 1,133 (2.1%) |
| Total | 49,720 (100.0%) | 54,095 (100.0%) |
Families and Households in Wicomico County
Median Family Size in Wicomico County
The median family size in Wicomico County is 3.02 persons per family, with married-couple families (17,050 | 66.4%) accounting for the largest median family size of 3.15 persons per family. On the other hand, single male/father families (2,650 | 10.3%) represent the smallest median family size with 2.34 persons per family.
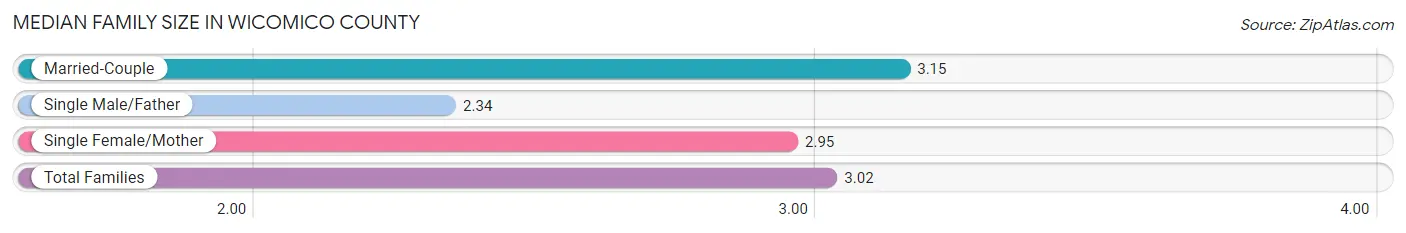
| Family Type | # Families | Family Size |
| Married-Couple | 17,050 (66.4%) | 3.15 |
| Single Male/Father | 2,650 (10.3%) | 2.34 |
| Single Female/Mother | 5,968 (23.3%) | 2.95 |
| Total Families | 25,668 (100.0%) | 3.02 |
Median Household Size in Wicomico County
The median household size in Wicomico County is 2.50 persons per household, with single female/mother households (5,968 | 14.9%) accounting for the largest median household size of 3.2 persons per household. non-family households (14,271 | 35.7%) represent the smallest median household size with 1.35 persons per household.
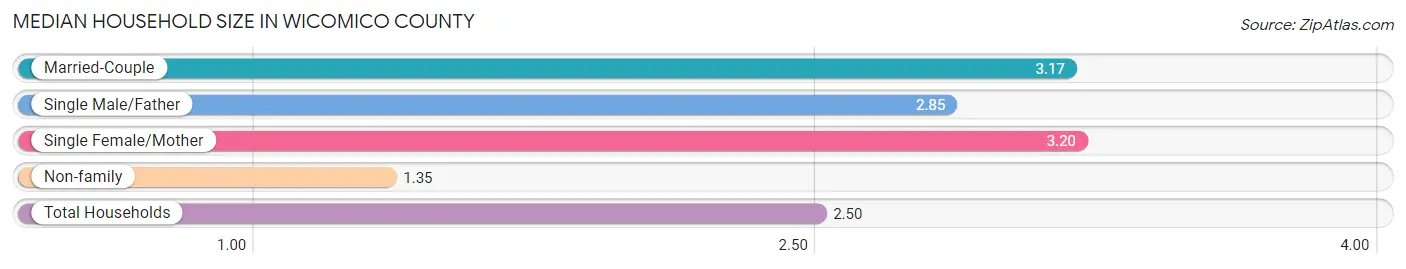
| Household Type | # Households | Household Size |
| Married-Couple | 17,050 (42.7%) | 3.17 |
| Single Male/Father | 2,650 (6.6%) | 2.85 |
| Single Female/Mother | 5,968 (14.9%) | 3.20 |
| Non-family | 14,271 (35.7%) | 1.35 |
| Total Households | 39,939 (100.0%) | 2.50 |
Household Size by Marriage Status in Wicomico County
Out of a total of 39,939 households in Wicomico County, 25,668 (64.3%) are family households, while 14,271 (35.7%) are nonfamily households. The most numerous type of family households are 2-person households, comprising 11,156, and the most common type of nonfamily households are 1-person households, comprising 10,220.
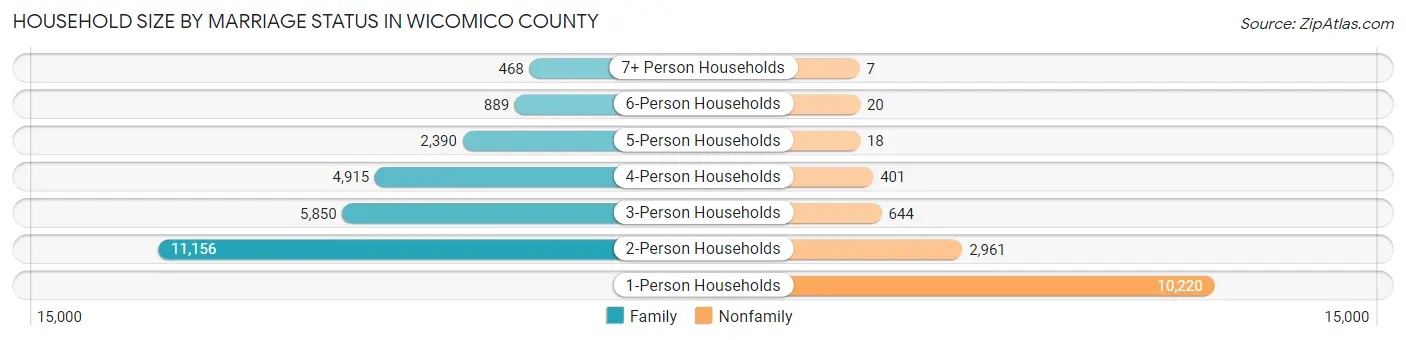
| Household Size | Family Households | Nonfamily Households |
| 1-Person Households | - | 10,220 (25.6%) |
| 2-Person Households | 11,156 (27.9%) | 2,961 (7.4%) |
| 3-Person Households | 5,850 (14.6%) | 644 (1.6%) |
| 4-Person Households | 4,915 (12.3%) | 401 (1.0%) |
| 5-Person Households | 2,390 (6.0%) | 18 (0.1%) |
| 6-Person Households | 889 (2.2%) | 20 (0.1%) |
| 7+ Person Households | 468 (1.2%) | 7 (0.0%) |
| Total | 25,668 (64.3%) | 14,271 (35.7%) |
Female Fertility in Wicomico County
Fertility by Age in Wicomico County
Average fertility rate in Wicomico County is 33.0 births per 1,000 women. Women in the age bracket of 20 to 34 years have the highest fertility rate with 50.0 births per 1,000 women. Women in the age bracket of 20 to 34 years acount for 70.5% of all women with births.
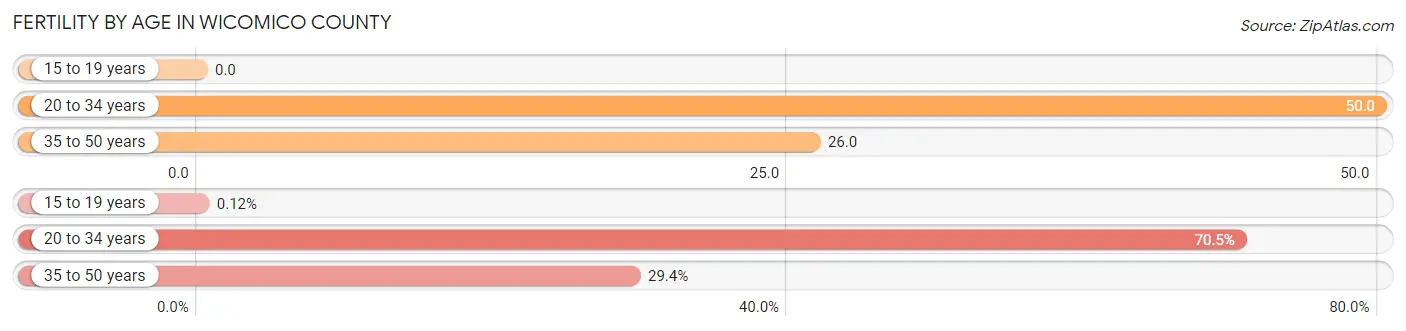
| Age Bracket | Women with Births | Births / 1,000 Women |
| 15 to 19 years | 1 (0.1%) | 0.0 |
| 20 to 34 years | 602 (70.5%) | 50.0 |
| 35 to 50 years | 251 (29.4%) | 26.0 |
| Total | 854 (100.0%) | 33.0 |
Fertility by Age by Marriage Status in Wicomico County
59.6% of women with births (854) in Wicomico County are married. The highest percentage of unmarried women with births falls into 15 to 19 years age bracket with 100.0% of them unmarried at the time of birth, while the lowest percentage of unmarried women with births belong to 35 to 50 years age bracket with 5.2% of them unmarried.
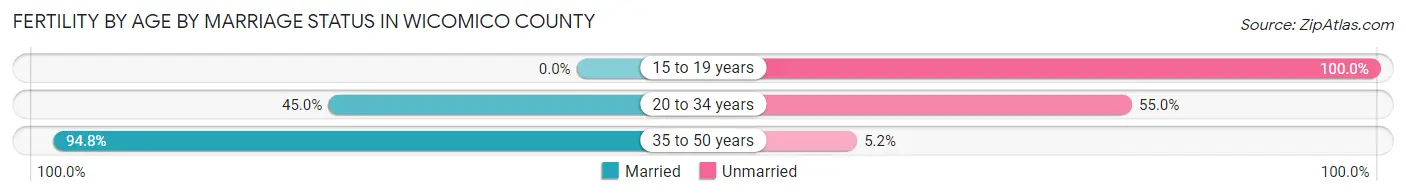
| Age Bracket | Married | Unmarried |
| 15 to 19 years | 0 (0.0%) | 1 (100.0%) |
| 20 to 34 years | 271 (45.0%) | 331 (55.0%) |
| 35 to 50 years | 238 (94.8%) | 13 (5.2%) |
| Total | 509 (59.6%) | 345 (40.4%) |
Fertility by Education in Wicomico County
Average fertility rate in Wicomico County is 33.0 births per 1,000 women. Women with the education attainment of bachelor's degree have the highest fertility rate of 46.0 births per 1,000 women, while women with the education attainment of graduate degree have the lowest fertility at 18.0 births per 1,000 women. Women with the education attainment of college or associate's degree represent 39.2% of all women with births.
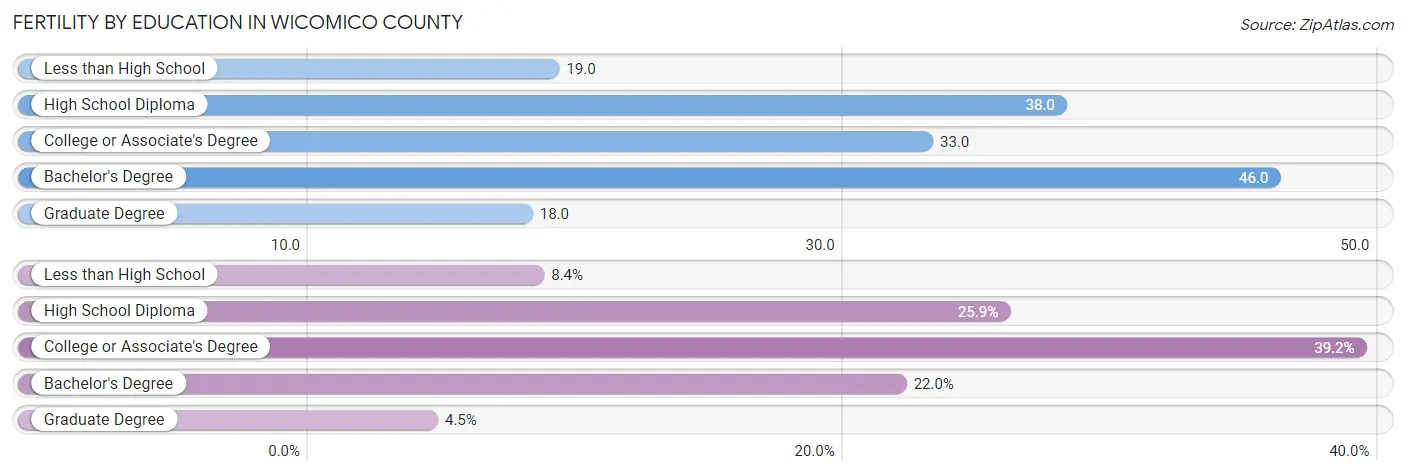
| Educational Attainment | Women with Births | Births / 1,000 Women |
| Less than High School | 72 (8.4%) | 19.0 |
| High School Diploma | 221 (25.9%) | 38.0 |
| College or Associate's Degree | 335 (39.2%) | 33.0 |
| Bachelor's Degree | 188 (22.0%) | 46.0 |
| Graduate Degree | 38 (4.4%) | 18.0 |
| Total | 854 (100.0%) | 33.0 |
Fertility by Education by Marriage Status in Wicomico County
40.4% of women with births in Wicomico County are unmarried. Women with the educational attainment of graduate degree are most likely to be married with 100.0% of them married at childbirth, while women with the educational attainment of high school diploma are least likely to be married with 82.4% of them unmarried at childbirth.
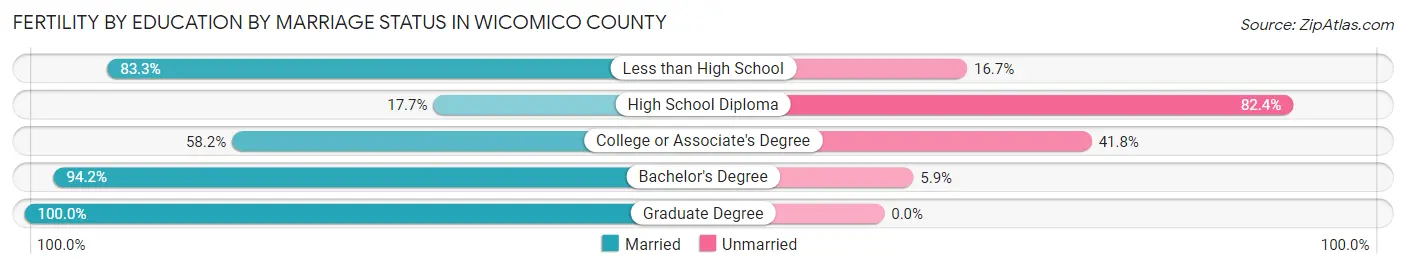
| Educational Attainment | Married | Unmarried |
| Less than High School | 60 (83.3%) | 12 (16.7%) |
| High School Diploma | 39 (17.6%) | 182 (82.4%) |
| College or Associate's Degree | 195 (58.2%) | 140 (41.8%) |
| Bachelor's Degree | 177 (94.2%) | 11 (5.9%) |
| Graduate Degree | 38 (100.0%) | 0 (0.0%) |
| Total | 509 (59.6%) | 345 (40.4%) |
Income in Wicomico County
Income Overview in Wicomico County
Per Capita Income in Wicomico County is $35,658, while median incomes of families and households are $84,504 and $69,421 respectively.
| Characteristic | Number | Measure |
| Per Capita Income | 103,815 | $35,658 |
| Median Family Income | 25,668 | $84,504 |
| Mean Family Income | 25,668 | $107,738 |
| Median Household Income | 39,939 | $69,421 |
| Mean Household Income | 39,939 | $92,407 |
| Income Deficit | 25,668 | $10,315 |
| Wage / Income Gap (%) | 103,815 | 23.70% |
| Wage / Income Gap ($) | 103,815 | 76.30¢ per $1 |
| Gini / Inequality Index | 103,815 | 0.46 |
Earnings by Sex in Wicomico County
Average Earnings in Wicomico County are $35,418, $42,089 for men and $32,114 for women, a difference of 23.7%.
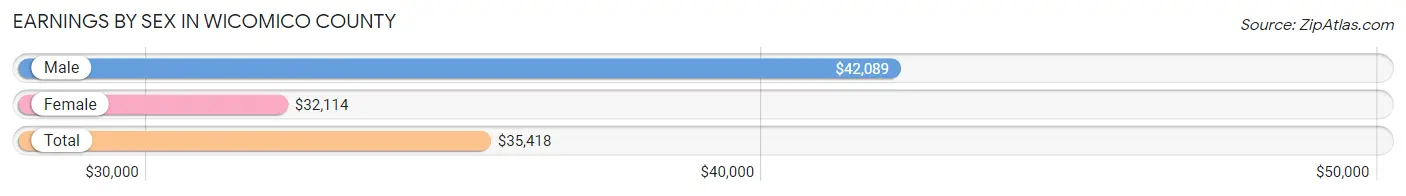
| Sex | Number | Average Earnings |
| Male | 28,618 (49.1%) | $42,089 |
| Female | 29,672 (50.9%) | $32,114 |
| Total | 58,290 (100.0%) | $35,418 |
Earnings by Sex by Income Bracket in Wicomico County
The most common earnings brackets in Wicomico County are $100,000+ for men (3,814 | 13.3%) and $75,000 to $99,999 for women (2,554 | 8.6%).
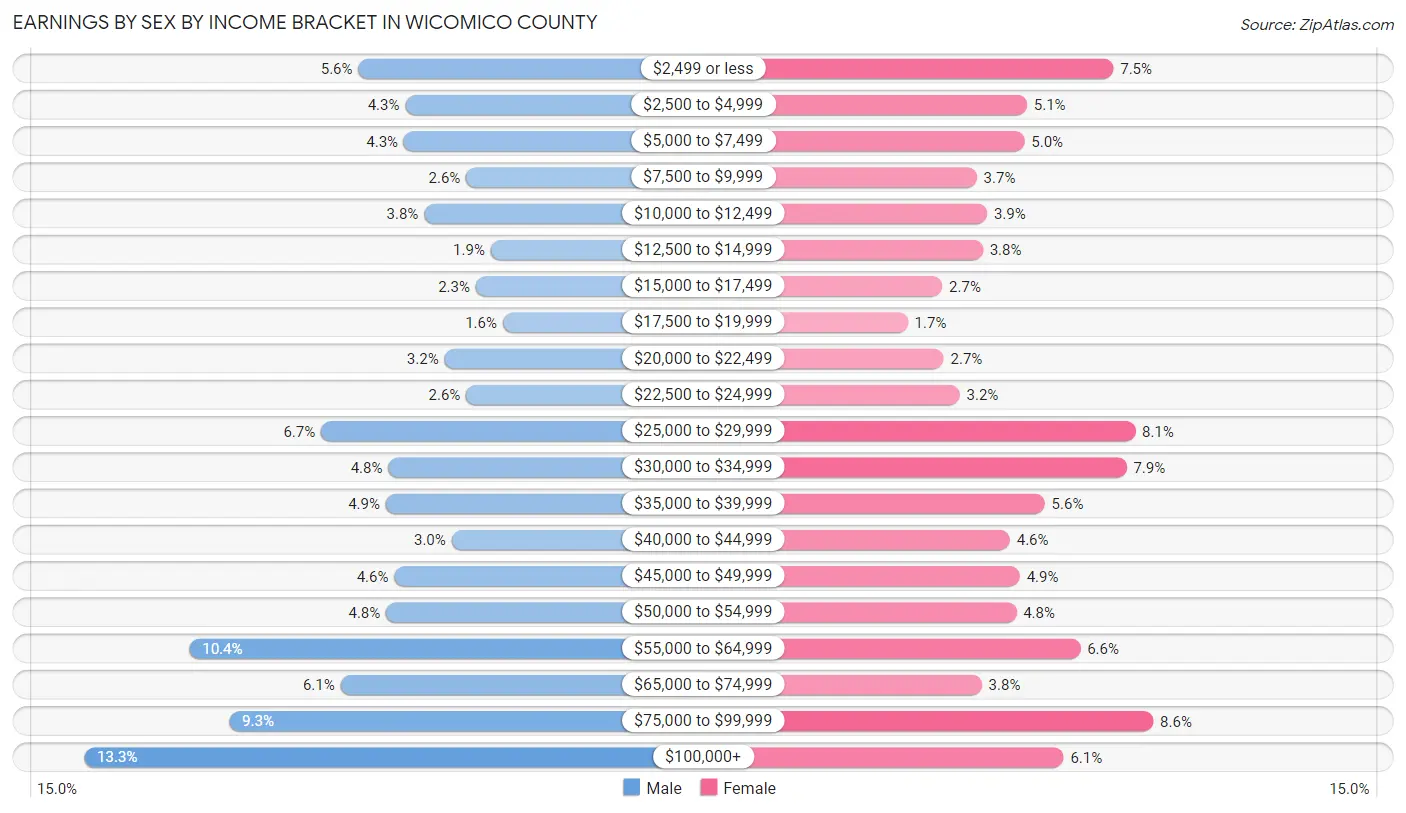
| Income | Male | Female |
| $2,499 or less | 1,607 (5.6%) | 2,221 (7.5%) |
| $2,500 to $4,999 | 1,231 (4.3%) | 1,501 (5.1%) |
| $5,000 to $7,499 | 1,242 (4.3%) | 1,482 (5.0%) |
| $7,500 to $9,999 | 741 (2.6%) | 1,083 (3.6%) |
| $10,000 to $12,499 | 1,080 (3.8%) | 1,170 (3.9%) |
| $12,500 to $14,999 | 545 (1.9%) | 1,134 (3.8%) |
| $15,000 to $17,499 | 663 (2.3%) | 794 (2.7%) |
| $17,500 to $19,999 | 446 (1.6%) | 508 (1.7%) |
| $20,000 to $22,499 | 917 (3.2%) | 806 (2.7%) |
| $22,500 to $24,999 | 740 (2.6%) | 941 (3.2%) |
| $25,000 to $29,999 | 1,910 (6.7%) | 2,403 (8.1%) |
| $30,000 to $34,999 | 1,368 (4.8%) | 2,333 (7.9%) |
| $35,000 to $39,999 | 1,387 (4.9%) | 1,650 (5.6%) |
| $40,000 to $44,999 | 859 (3.0%) | 1,359 (4.6%) |
| $45,000 to $49,999 | 1,318 (4.6%) | 1,441 (4.9%) |
| $50,000 to $54,999 | 1,384 (4.8%) | 1,412 (4.8%) |
| $55,000 to $64,999 | 2,969 (10.4%) | 1,947 (6.6%) |
| $65,000 to $74,999 | 1,750 (6.1%) | 1,126 (3.8%) |
| $75,000 to $99,999 | 2,647 (9.2%) | 2,554 (8.6%) |
| $100,000+ | 3,814 (13.3%) | 1,807 (6.1%) |
| Total | 28,618 (100.0%) | 29,672 (100.0%) |
Earnings by Sex by Educational Attainment in Wicomico County
Average earnings in Wicomico County are $53,615 for men and $40,196 for women, a difference of 25.0%. Men with an educational attainment of graduate degree enjoy the highest average annual earnings of $96,406, while those with less than high school education earn the least with $32,828. Women with an educational attainment of graduate degree earn the most with the average annual earnings of $69,771, while those with less than high school education have the smallest earnings of $25,915.
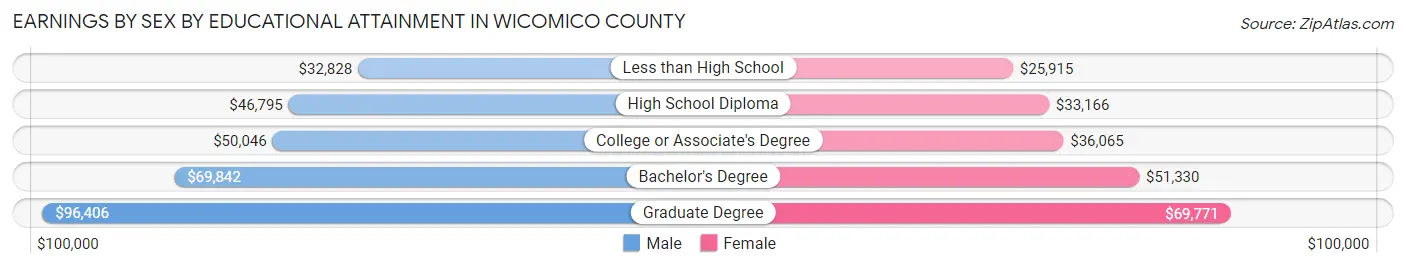
| Educational Attainment | Male Income | Female Income |
| Less than High School | $32,828 | $25,915 |
| High School Diploma | $46,795 | $33,166 |
| College or Associate's Degree | $50,046 | $36,065 |
| Bachelor's Degree | $69,842 | $51,330 |
| Graduate Degree | $96,406 | $69,771 |
| Total | $53,615 | $40,196 |
Family Income in Wicomico County
Family Income Brackets in Wicomico County
According to the Wicomico County family income data, there are 5,211 families falling into the $100,000 to $149,999 income range, which is the most common income bracket and makes up 20.3% of all families. Conversely, the $10,000 to $14,999 income bracket is the least frequent group with only 359 families (1.4%) belonging to this category.
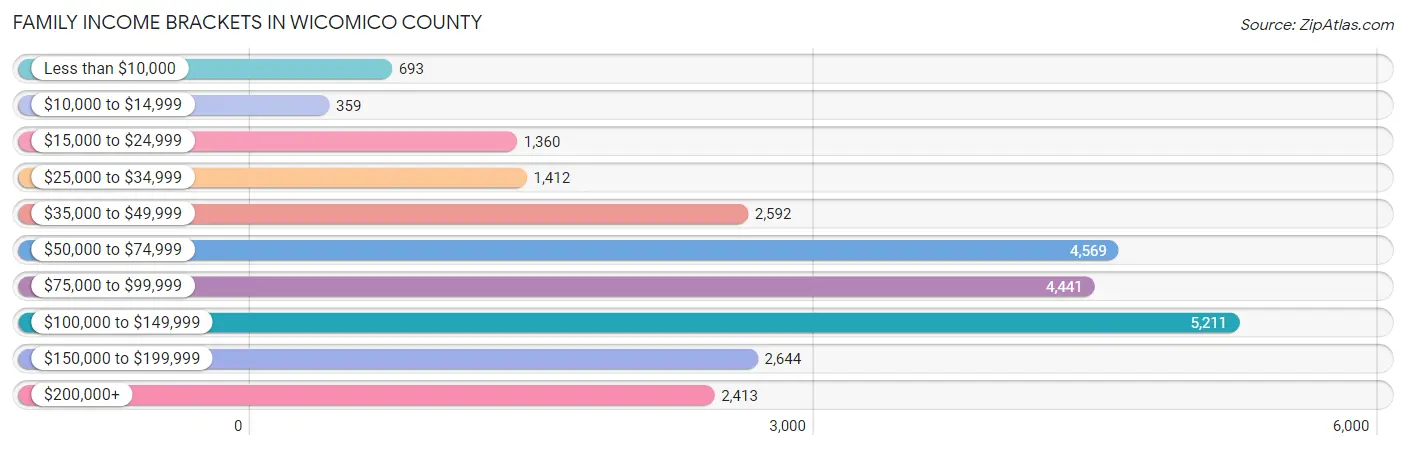
| Income Bracket | # Families | % Families |
| Less than $10,000 | 693 | 2.7% |
| $10,000 to $14,999 | 359 | 1.4% |
| $15,000 to $24,999 | 1,360 | 5.3% |
| $25,000 to $34,999 | 1,412 | 5.5% |
| $35,000 to $49,999 | 2,592 | 10.1% |
| $50,000 to $74,999 | 4,569 | 17.8% |
| $75,000 to $99,999 | 4,441 | 17.3% |
| $100,000 to $149,999 | 5,211 | 20.3% |
| $150,000 to $199,999 | 2,644 | 10.3% |
| $200,000+ | 2,413 | 9.4% |
Family Income by Famaliy Size in Wicomico County
5-person families (2,152 | 8.4%) account for the highest median family income in Wicomico County with $101,587 per family, while 2-person families (12,463 | 48.5%) have the highest median income of $38,822 per family member.
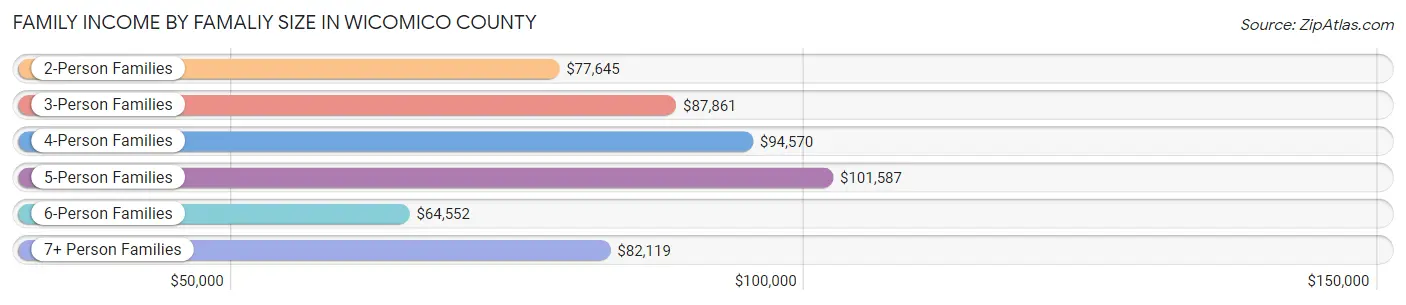
| Income Bracket | # Families | Median Income |
| 2-Person Families | 12,463 (48.5%) | $77,645 |
| 3-Person Families | 5,380 (21.0%) | $87,861 |
| 4-Person Families | 4,681 (18.2%) | $94,570 |
| 5-Person Families | 2,152 (8.4%) | $101,587 |
| 6-Person Families | 548 (2.1%) | $64,552 |
| 7+ Person Families | 444 (1.7%) | $82,119 |
| Total | 25,668 (100.0%) | $84,504 |
Family Income by Number of Earners in Wicomico County
The median family income in Wicomico County is $84,504, with families comprising 3+ earners (3,105) having the highest median family income of $134,135, while families with no earners (2,936) have the lowest median family income of $49,731, accounting for 12.1% and 11.4% of families, respectively.
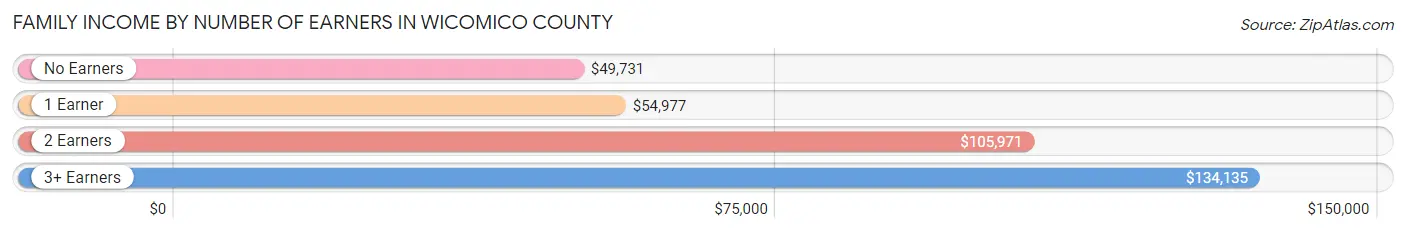
| Number of Earners | # Families | Median Income |
| No Earners | 2,936 (11.4%) | $49,731 |
| 1 Earner | 8,265 (32.2%) | $54,977 |
| 2 Earners | 11,362 (44.3%) | $105,971 |
| 3+ Earners | 3,105 (12.1%) | $134,135 |
| Total | 25,668 (100.0%) | $84,504 |
Household Income in Wicomico County
Household Income Brackets in Wicomico County
With 7,469 households falling in the category, the $50,000 to $74,999 income range is the most frequent in Wicomico County, accounting for 18.7% of all households. In contrast, only 1,158 households (2.9%) fall into the $10,000 to $14,999 income bracket, making it the least populous group.
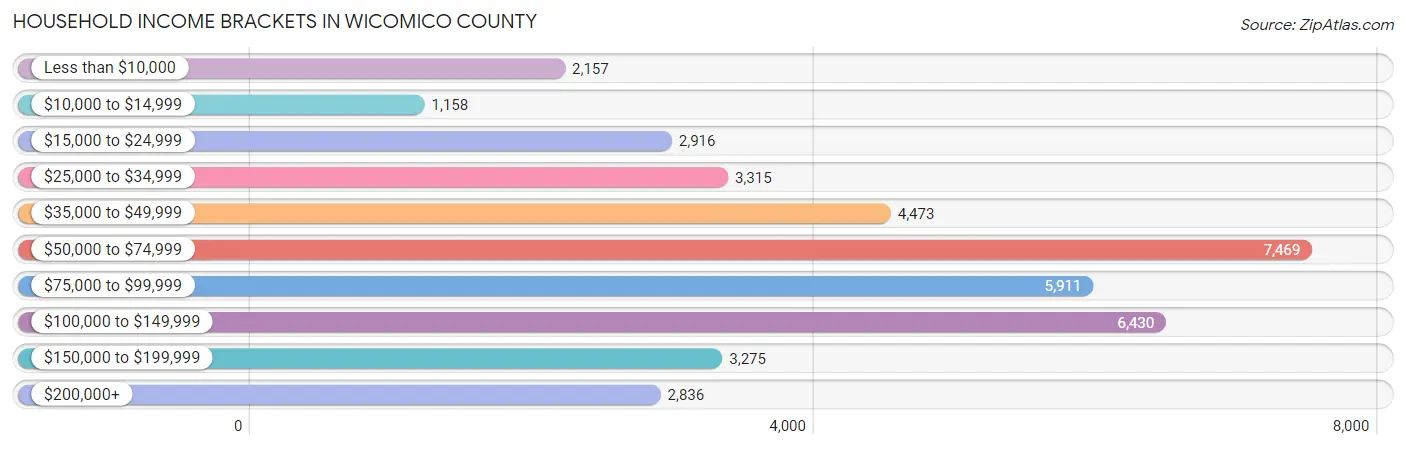
| Income Bracket | # Households | % Households |
| Less than $10,000 | 2,157 | 5.4% |
| $10,000 to $14,999 | 1,158 | 2.9% |
| $15,000 to $24,999 | 2,916 | 7.3% |
| $25,000 to $34,999 | 3,315 | 8.3% |
| $35,000 to $49,999 | 4,473 | 11.2% |
| $50,000 to $74,999 | 7,469 | 18.7% |
| $75,000 to $99,999 | 5,911 | 14.8% |
| $100,000 to $149,999 | 6,430 | 16.1% |
| $150,000 to $199,999 | 3,275 | 8.2% |
| $200,000+ | 2,836 | 7.1% |
Household Income by Householder Age in Wicomico County
The median household income in Wicomico County is $69,421, with the highest median household income of $91,403 found in the 45 to 64 years age bracket for the primary householder. A total of 13,909 households (34.8%) fall into this category. Meanwhile, the 15 to 24 years age bracket for the primary householder has the lowest median household income of $32,282, with 3,004 households (7.5%) in this group.
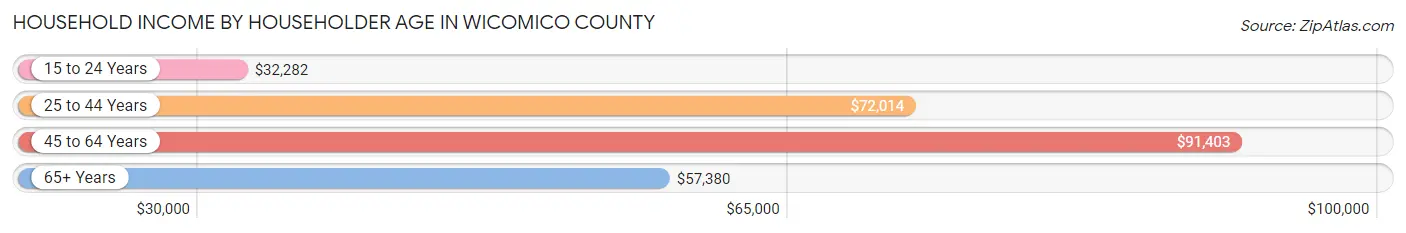
| Income Bracket | # Households | Median Income |
| 15 to 24 Years | 3,004 (7.5%) | $32,282 |
| 25 to 44 Years | 12,118 (30.3%) | $72,014 |
| 45 to 64 Years | 13,909 (34.8%) | $91,403 |
| 65+ Years | 10,908 (27.3%) | $57,380 |
| Total | 39,939 (100.0%) | $69,421 |
Poverty in Wicomico County
Income Below Poverty by Sex and Age in Wicomico County
With 12.0% poverty level for males and 15.5% for females among the residents of Wicomico County, 5 year old males and 18 to 24 year old females are the most vulnerable to poverty, with 302 males (42.2%) and 2,535 females (36.9%) in their respective age groups living below the poverty level.
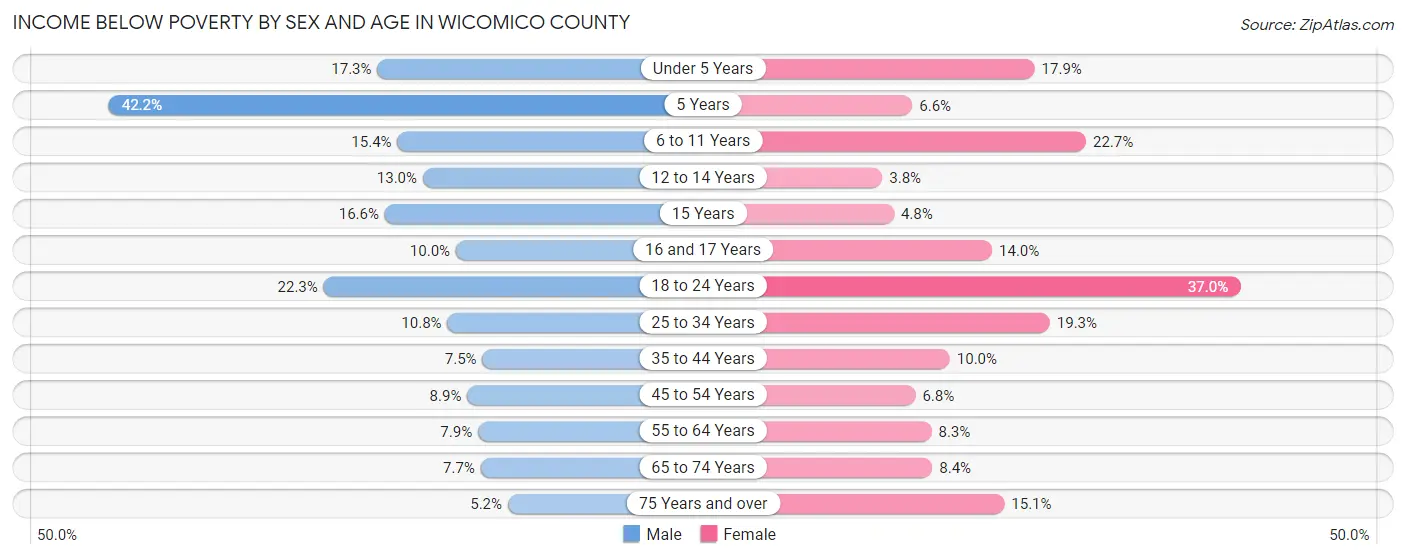
| Age Bracket | Male | Female |
| Under 5 Years | 537 (17.3%) | 549 (17.9%) |
| 5 Years | 302 (42.2%) | 35 (6.6%) |
| 6 to 11 Years | 572 (15.4%) | 887 (22.7%) |
| 12 to 14 Years | 257 (13.0%) | 60 (3.8%) |
| 15 Years | 87 (16.6%) | 31 (4.8%) |
| 16 and 17 Years | 159 (10.0%) | 161 (14.0%) |
| 18 to 24 Years | 1,298 (22.3%) | 2,535 (36.9%) |
| 25 to 34 Years | 663 (10.8%) | 1,225 (19.3%) |
| 35 to 44 Years | 385 (7.5%) | 594 (10.0%) |
| 45 to 54 Years | 499 (8.9%) | 415 (6.8%) |
| 55 to 64 Years | 498 (7.9%) | 578 (8.3%) |
| 65 to 74 Years | 356 (7.7%) | 444 (8.4%) |
| 75 Years and over | 132 (5.1%) | 585 (15.1%) |
| Total | 5,745 (12.0%) | 8,099 (15.5%) |
Income Above Poverty by Sex and Age in Wicomico County
According to the poverty statistics in Wicomico County, males aged 75 years and over and females aged 12 to 14 years are the age groups that are most secure financially, with 94.9% of males and 96.2% of females in these age groups living above the poverty line.
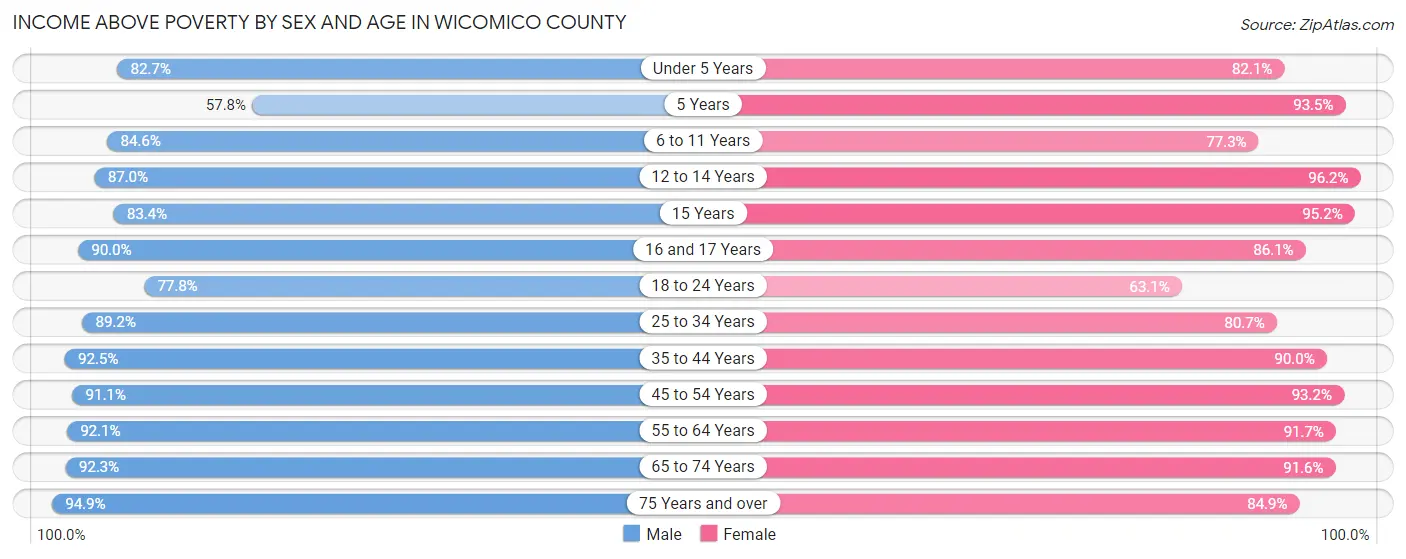
| Age Bracket | Male | Female |
| Under 5 Years | 2,574 (82.7%) | 2,518 (82.1%) |
| 5 Years | 414 (57.8%) | 499 (93.4%) |
| 6 to 11 Years | 3,143 (84.6%) | 3,026 (77.3%) |
| 12 to 14 Years | 1,714 (87.0%) | 1,534 (96.2%) |
| 15 Years | 438 (83.4%) | 609 (95.2%) |
| 16 and 17 Years | 1,435 (90.0%) | 993 (86.1%) |
| 18 to 24 Years | 4,536 (77.7%) | 4,326 (63.0%) |
| 25 to 34 Years | 5,499 (89.2%) | 5,118 (80.7%) |
| 35 to 44 Years | 4,741 (92.5%) | 5,327 (90.0%) |
| 45 to 54 Years | 5,096 (91.1%) | 5,655 (93.2%) |
| 55 to 64 Years | 5,789 (92.1%) | 6,363 (91.7%) |
| 65 to 74 Years | 4,284 (92.3%) | 4,842 (91.6%) |
| 75 Years and over | 2,432 (94.9%) | 3,292 (84.9%) |
| Total | 42,095 (88.0%) | 44,102 (84.5%) |
Income Below Poverty Among Married-Couple Families in Wicomico County
The poverty statistics for married-couple families in Wicomico County show that 2.6% or 442 of the total 17,050 families live below the poverty line. Families with 3 or 4 children have the highest poverty rate of 10.6%, comprising of 144 families. On the other hand, families with no children have the lowest poverty rate of 1.7%, which includes 176 families.
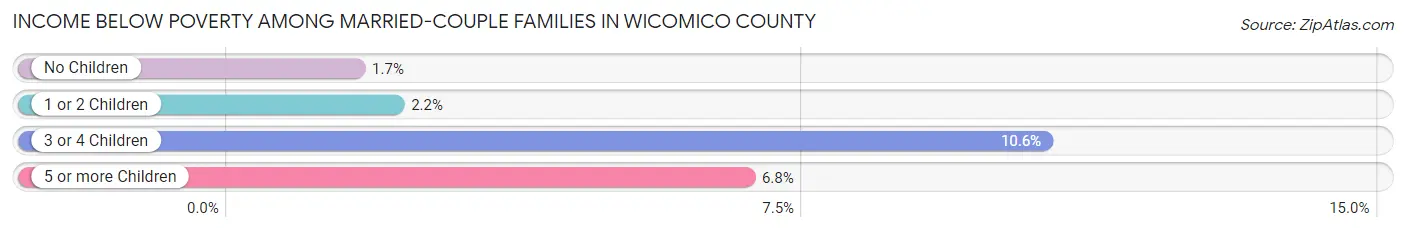
| Children | Above Poverty | Below Poverty |
| No Children | 10,398 (98.3%) | 176 (1.7%) |
| 1 or 2 Children | 4,780 (97.8%) | 106 (2.2%) |
| 3 or 4 Children | 1,209 (89.4%) | 144 (10.6%) |
| 5 or more Children | 221 (93.2%) | 16 (6.8%) |
| Total | 16,608 (97.4%) | 442 (2.6%) |
Income Below Poverty Among Single-Parent Households in Wicomico County
According to the poverty data in Wicomico County, 5.7% or 152 single-father households and 24.6% or 1,471 single-mother households are living below the poverty line. Among single-father households, those with 3 or 4 children have the highest poverty rate, with 71 households (31.1%) experiencing poverty. Likewise, among single-mother households, those with 3 or 4 children have the highest poverty rate, with 343 households (49.0%) falling below the poverty line.
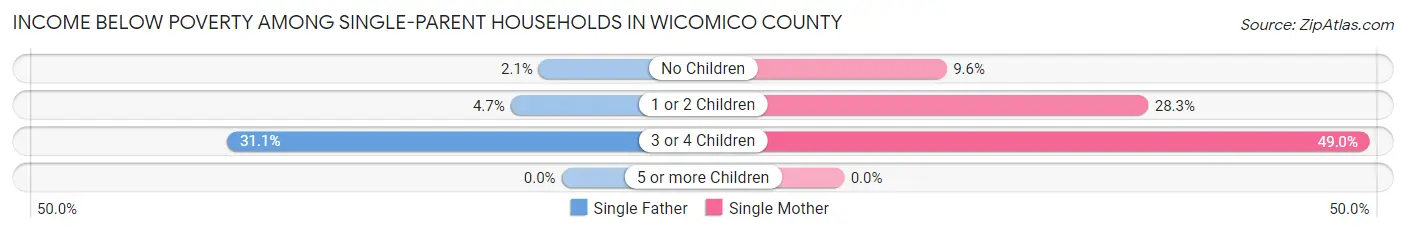
| Children | Single Father | Single Mother |
| No Children | 27 (2.1%) | 179 (9.6%) |
| 1 or 2 Children | 54 (4.7%) | 949 (28.3%) |
| 3 or 4 Children | 71 (31.1%) | 343 (49.0%) |
| 5 or more Children | 0 (0.0%) | 0 (0.0%) |
| Total | 152 (5.7%) | 1,471 (24.6%) |
Income Below Poverty Among Married-Couple vs Single-Parent Households in Wicomico County
The poverty data for Wicomico County shows that 442 of the married-couple family households (2.6%) and 1,623 of the single-parent households (18.8%) are living below the poverty level. Within the married-couple family households, those with 3 or 4 children have the highest poverty rate, with 144 households (10.6%) falling below the poverty line. Among the single-parent households, those with 3 or 4 children have the highest poverty rate, with 414 household (44.6%) living below poverty.
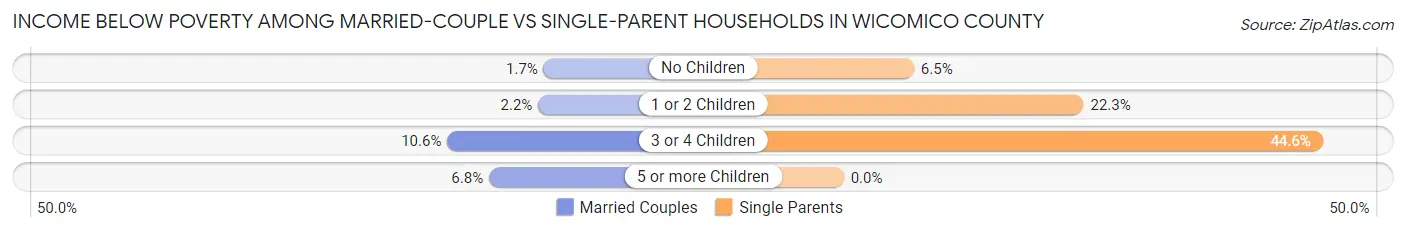
| Children | Married-Couple Families | Single-Parent Households |
| No Children | 176 (1.7%) | 206 (6.5%) |
| 1 or 2 Children | 106 (2.2%) | 1,003 (22.3%) |
| 3 or 4 Children | 144 (10.6%) | 414 (44.6%) |
| 5 or more Children | 16 (6.8%) | 0 (0.0%) |
| Total | 442 (2.6%) | 1,623 (18.8%) |
Employment Characteristics in Wicomico County
Employment by Class of Employer in Wicomico County
Among the 50,503 employed individuals in Wicomico County, private company employees (32,685 | 64.7%), local government employees (4,527 | 9.0%), and state government employees (3,885 | 7.7%) make up the most common classes of employment.
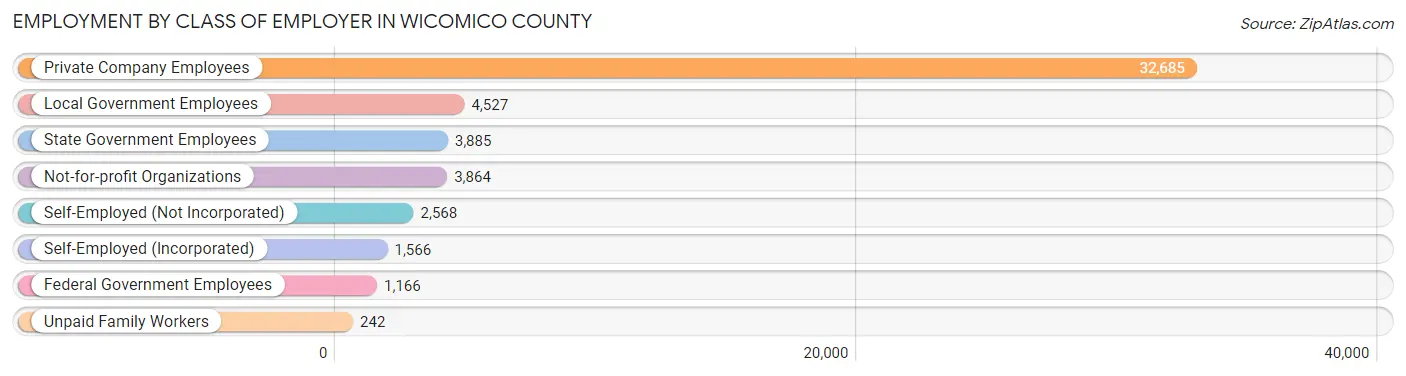
| Employer Class | # Employees | % Employees |
| Private Company Employees | 32,685 | 64.7% |
| Self-Employed (Incorporated) | 1,566 | 3.1% |
| Self-Employed (Not Incorporated) | 2,568 | 5.1% |
| Not-for-profit Organizations | 3,864 | 7.6% |
| Local Government Employees | 4,527 | 9.0% |
| State Government Employees | 3,885 | 7.7% |
| Federal Government Employees | 1,166 | 2.3% |
| Unpaid Family Workers | 242 | 0.5% |
| Total | 50,503 | 100.0% |
Employment Status by Age in Wicomico County
According to the labor force statistics for Wicomico County, out of the total population over 16 years of age (83,687), 65.5% or 54,815 individuals are in the labor force, with 6.9% or 3,782 of them unemployed. The age group with the highest labor force participation rate is 30 to 34 years, with 91.0% or 5,554 individuals in the labor force. Within the labor force, the 16 to 19 years age range has the highest percentage of unemployed individuals, with 23.4% or 780 of them being unemployed.
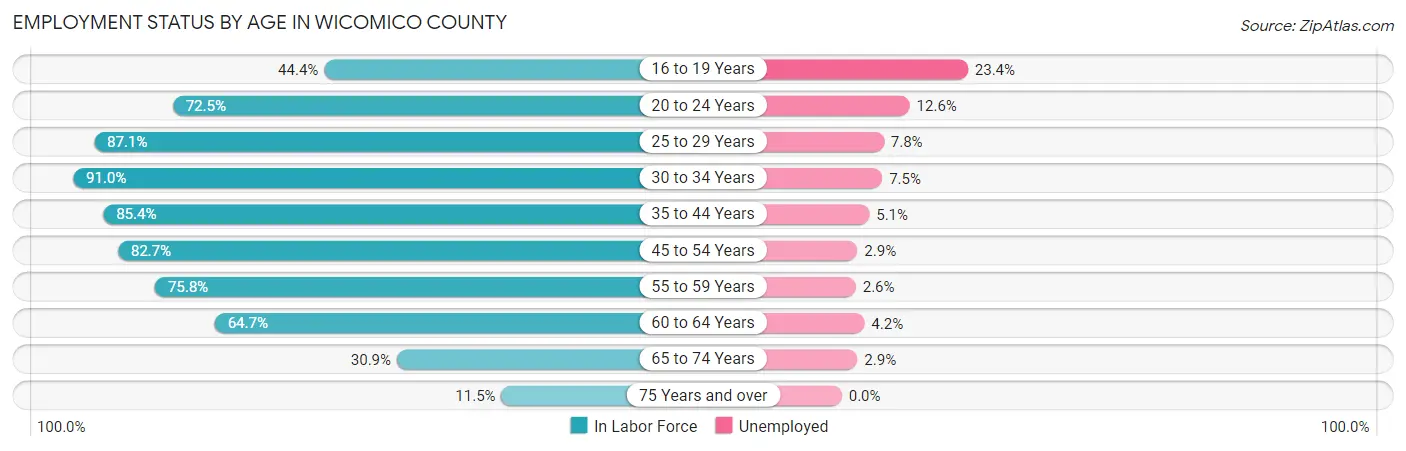
| Age Bracket | In Labor Force | Unemployed |
| 16 to 19 Years | 3,332 (44.4%) | 780 (23.4%) |
| 20 to 24 Years | 7,584 (72.5%) | 956 (12.6%) |
| 25 to 29 Years | 5,715 (87.1%) | 446 (7.8%) |
| 30 to 34 Years | 5,554 (91.0%) | 417 (7.5%) |
| 35 to 44 Years | 9,567 (85.4%) | 488 (5.1%) |
| 45 to 54 Years | 9,728 (82.7%) | 282 (2.9%) |
| 55 to 59 Years | 5,559 (75.8%) | 145 (2.6%) |
| 60 to 64 Years | 3,864 (64.7%) | 162 (4.2%) |
| 65 to 74 Years | 3,103 (30.9%) | 90 (2.9%) |
| 75 Years and over | 775 (11.5%) | 0 (0.0%) |
| Total | 54,815 (65.5%) | 3,782 (6.9%) |
Employment Status by Educational Attainment in Wicomico County
According to labor force statistics for Wicomico County, 81.7% of individuals (39,981) out of the total population between 25 and 64 years of age (48,936) are in the labor force, with 4.9% or 1,959 of them being unemployed. The group with the highest labor force participation rate are those with the educational attainment of bachelor's degree or higher, with 90.4% or 13,033 individuals in the labor force. Within the labor force, individuals with less than high school education have the highest percentage of unemployment, with 10.0% or 319 of them being unemployed.
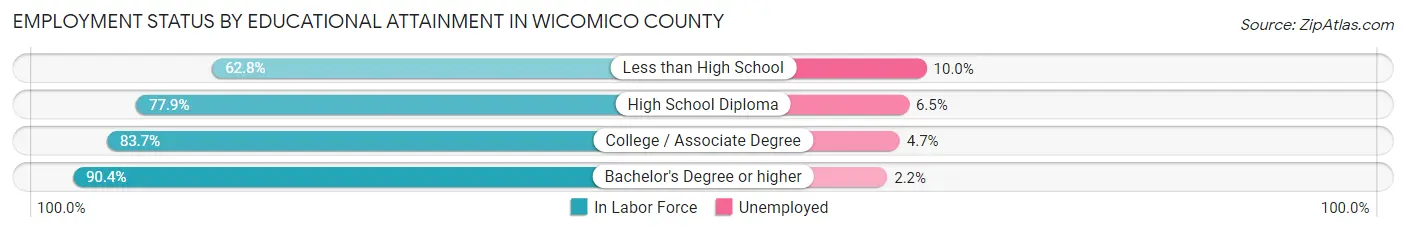
| Educational Attainment | In Labor Force | Unemployed |
| Less than High School | 3,188 (62.8%) | 508 (10.0%) |
| High School Diploma | 11,720 (77.9%) | 978 (6.5%) |
| College / Associate Degree | 12,050 (83.7%) | 677 (4.7%) |
| Bachelor's Degree or higher | 13,033 (90.4%) | 317 (2.2%) |
| Total | 39,981 (81.7%) | 2,398 (4.9%) |
Employment Occupations by Sex in Wicomico County
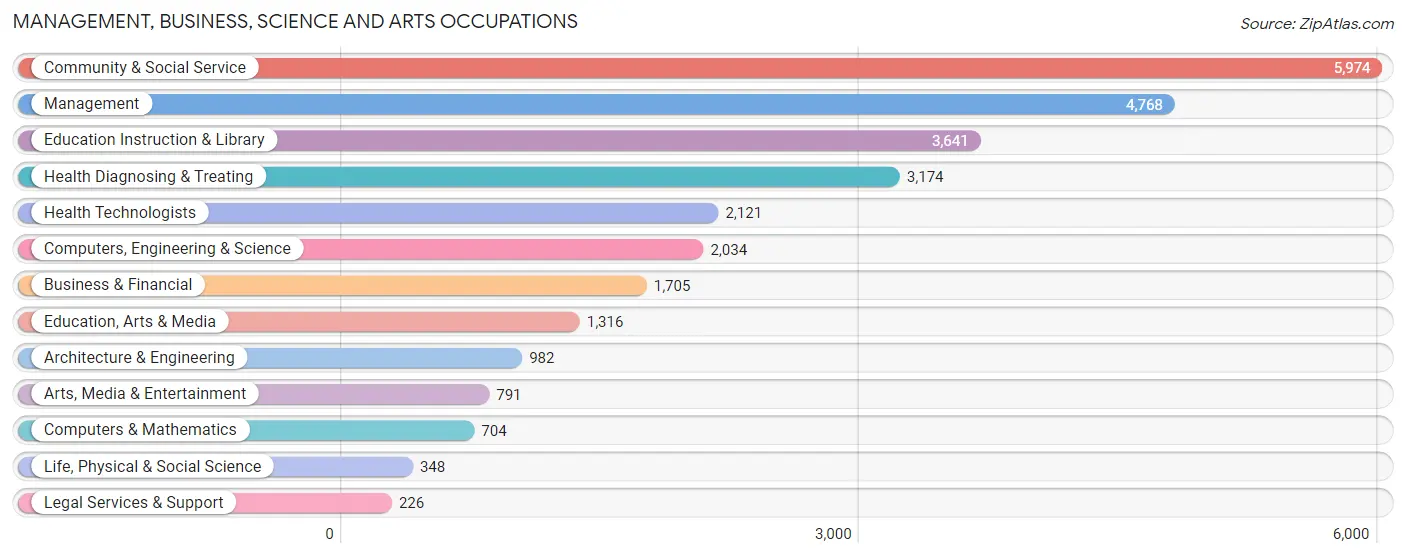
Management, Business, Science and Arts Occupations
The most common Management, Business, Science and Arts occupations in Wicomico County are Community & Social Service (5,974 | 11.7%), Management (4,768 | 9.4%), Education Instruction & Library (3,641 | 7.2%), Health Diagnosing & Treating (3,174 | 6.2%), and Health Technologists (2,121 | 4.2%).
Management, Business, Science and Arts Occupations by Sex
Within the Management, Business, Science and Arts occupations in Wicomico County, the most male-oriented occupations are Architecture & Engineering (92.6%), Computers, Engineering & Science (79.0%), and Computers & Mathematics (67.5%), while the most female-oriented occupations are Health Technologists (78.8%), Health Diagnosing & Treating (74.4%), and Education Instruction & Library (74.3%).
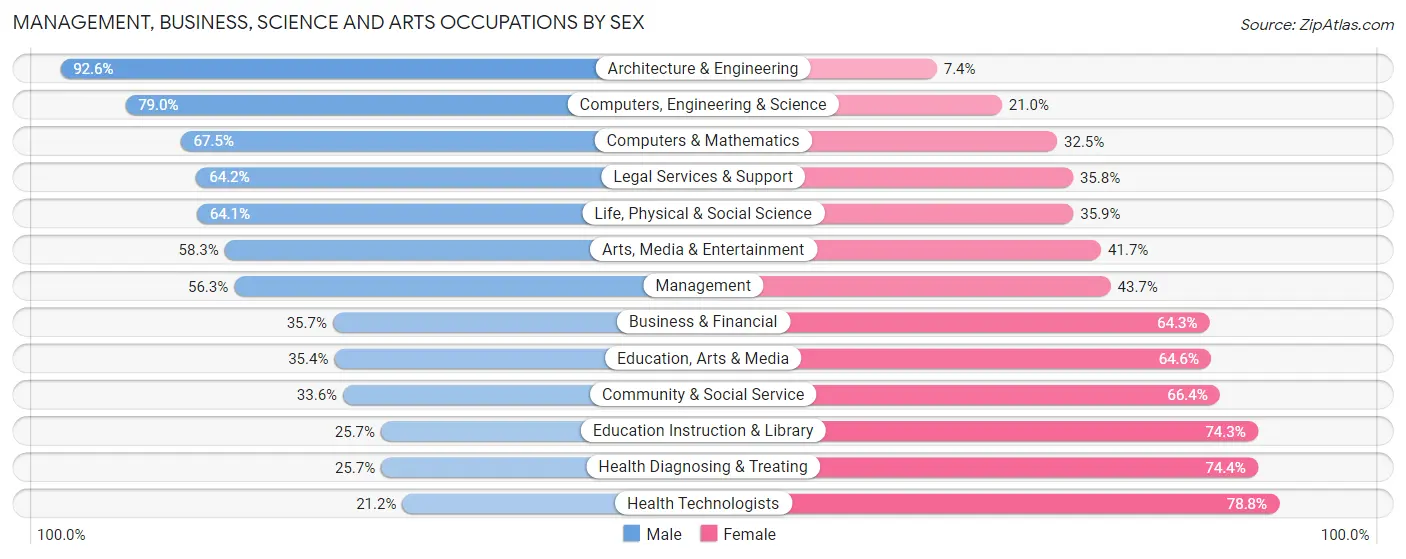
| Occupation | Male | Female |
| Management | 2,685 (56.3%) | 2,083 (43.7%) |
| Business & Financial | 609 (35.7%) | 1,096 (64.3%) |
| Computers, Engineering & Science | 1,607 (79.0%) | 427 (21.0%) |
| Computers & Mathematics | 475 (67.5%) | 229 (32.5%) |
| Architecture & Engineering | 909 (92.6%) | 73 (7.4%) |
| Life, Physical & Social Science | 223 (64.1%) | 125 (35.9%) |
| Community & Social Service | 2,007 (33.6%) | 3,967 (66.4%) |
| Education, Arts & Media | 466 (35.4%) | 850 (64.6%) |
| Legal Services & Support | 145 (64.2%) | 81 (35.8%) |
| Education Instruction & Library | 935 (25.7%) | 2,706 (74.3%) |
| Arts, Media & Entertainment | 461 (58.3%) | 330 (41.7%) |
| Health Diagnosing & Treating | 814 (25.7%) | 2,360 (74.4%) |
| Health Technologists | 450 (21.2%) | 1,671 (78.8%) |
| Total (Category) | 7,722 (43.7%) | 9,933 (56.3%) |
| Total (Overall) | 25,097 (49.3%) | 25,772 (50.7%) |
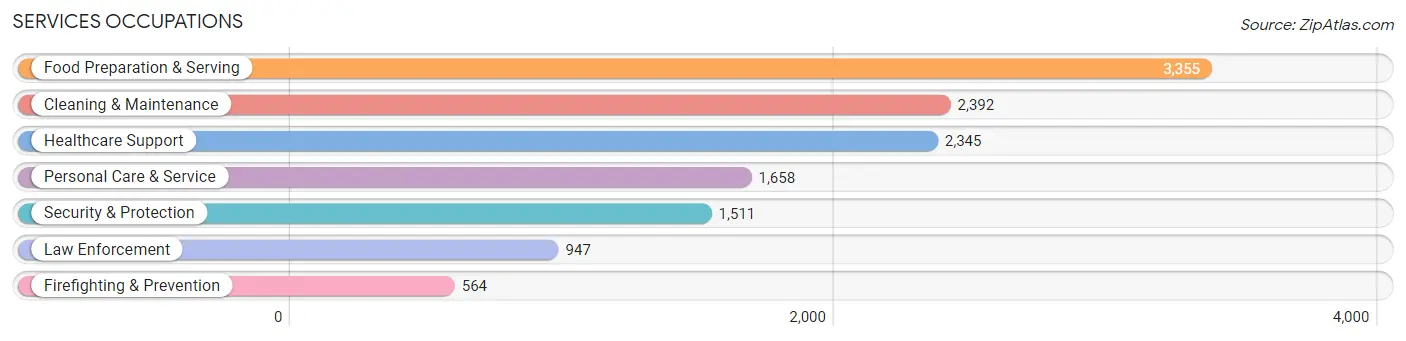
Services Occupations
The most common Services occupations in Wicomico County are Food Preparation & Serving (3,355 | 6.6%), Cleaning & Maintenance (2,392 | 4.7%), Healthcare Support (2,345 | 4.6%), Personal Care & Service (1,658 | 3.3%), and Security & Protection (1,511 | 3.0%).
Services Occupations by Sex
Within the Services occupations in Wicomico County, the most male-oriented occupations are Law Enforcement (82.7%), Security & Protection (81.1%), and Firefighting & Prevention (78.4%), while the most female-oriented occupations are Healthcare Support (83.5%), Personal Care & Service (75.6%), and Food Preparation & Serving (60.9%).
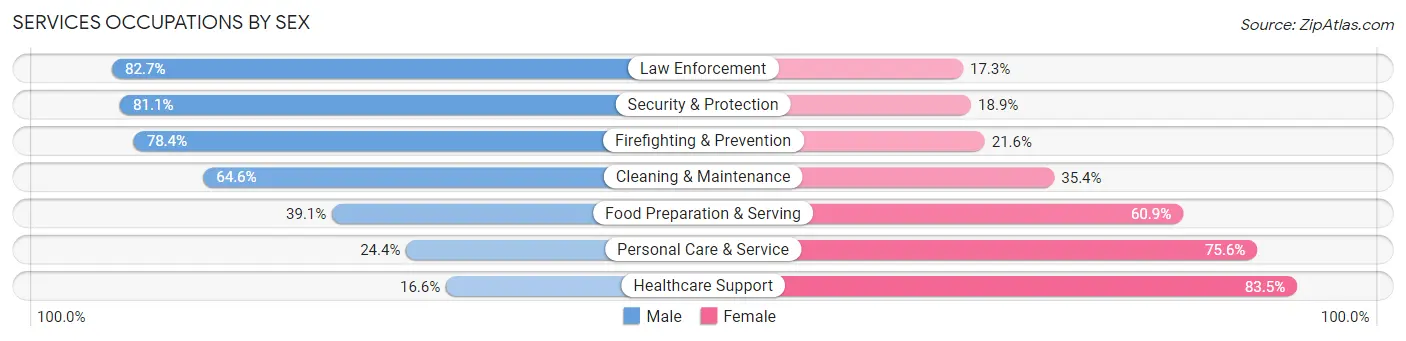
| Occupation | Male | Female |
| Healthcare Support | 388 (16.6%) | 1,957 (83.5%) |
| Security & Protection | 1,225 (81.1%) | 286 (18.9%) |
| Firefighting & Prevention | 442 (78.4%) | 122 (21.6%) |
| Law Enforcement | 783 (82.7%) | 164 (17.3%) |
| Food Preparation & Serving | 1,312 (39.1%) | 2,043 (60.9%) |
| Cleaning & Maintenance | 1,545 (64.6%) | 847 (35.4%) |
| Personal Care & Service | 405 (24.4%) | 1,253 (75.6%) |
| Total (Category) | 4,875 (43.3%) | 6,386 (56.7%) |
| Total (Overall) | 25,097 (49.3%) | 25,772 (50.7%) |
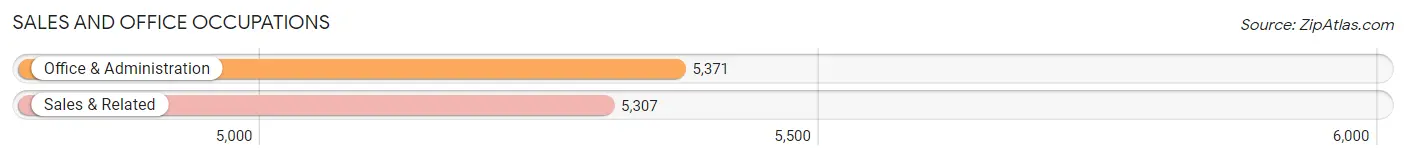
Sales and Office Occupations
The most common Sales and Office occupations in Wicomico County are Office & Administration (5,371 | 10.6%), and Sales & Related (5,307 | 10.4%).
Sales and Office Occupations by Sex
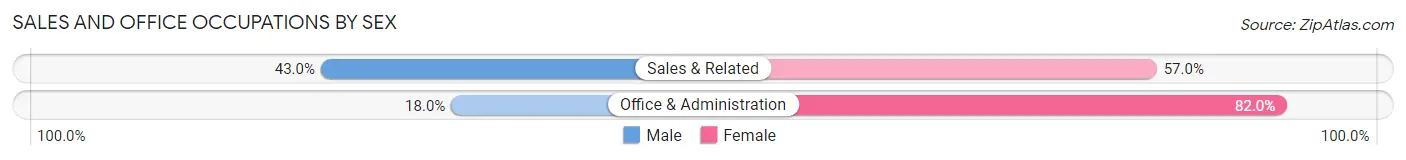
| Occupation | Male | Female |
| Sales & Related | 2,284 (43.0%) | 3,023 (57.0%) |
| Office & Administration | 965 (18.0%) | 4,406 (82.0%) |
| Total (Category) | 3,249 (30.4%) | 7,429 (69.6%) |
| Total (Overall) | 25,097 (49.3%) | 25,772 (50.7%) |
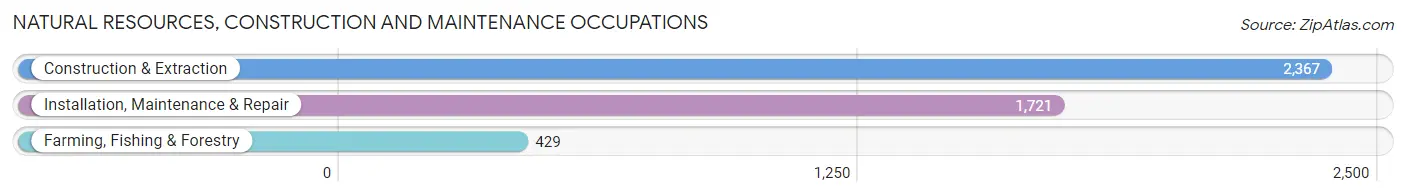
Natural Resources, Construction and Maintenance Occupations
The most common Natural Resources, Construction and Maintenance occupations in Wicomico County are Construction & Extraction (2,367 | 4.6%), Installation, Maintenance & Repair (1,721 | 3.4%), and Farming, Fishing & Forestry (429 | 0.8%).
Natural Resources, Construction and Maintenance Occupations by Sex
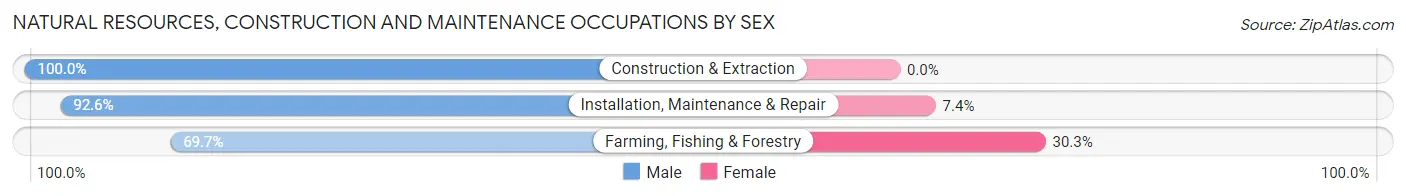
| Occupation | Male | Female |
| Farming, Fishing & Forestry | 299 (69.7%) | 130 (30.3%) |
| Construction & Extraction | 2,367 (100.0%) | 0 (0.0%) |
| Installation, Maintenance & Repair | 1,593 (92.6%) | 128 (7.4%) |
| Total (Category) | 4,259 (94.3%) | 258 (5.7%) |
| Total (Overall) | 25,097 (49.3%) | 25,772 (50.7%) |
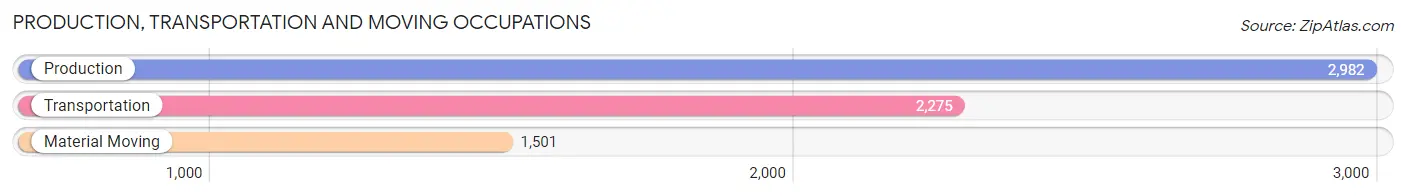
Production, Transportation and Moving Occupations
The most common Production, Transportation and Moving occupations in Wicomico County are Production (2,982 | 5.9%), Transportation (2,275 | 4.5%), and Material Moving (1,501 | 2.9%).
Production, Transportation and Moving Occupations by Sex
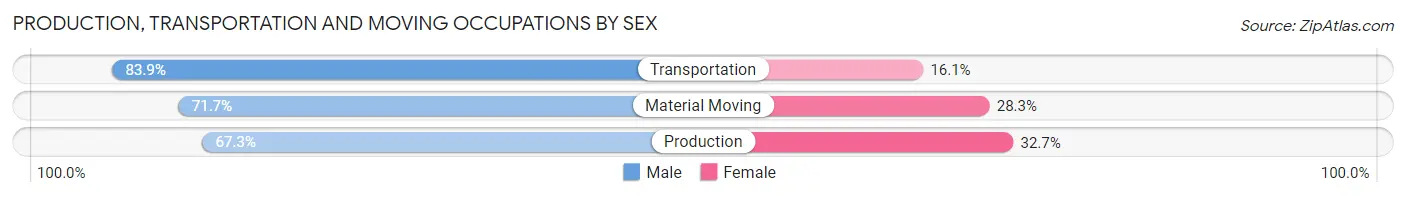
| Occupation | Male | Female |
| Production | 2,008 (67.3%) | 974 (32.7%) |
| Transportation | 1,908 (83.9%) | 367 (16.1%) |
| Material Moving | 1,076 (71.7%) | 425 (28.3%) |
| Total (Category) | 4,992 (73.9%) | 1,766 (26.1%) |
| Total (Overall) | 25,097 (49.3%) | 25,772 (50.7%) |
Employment Industries by Sex in Wicomico County
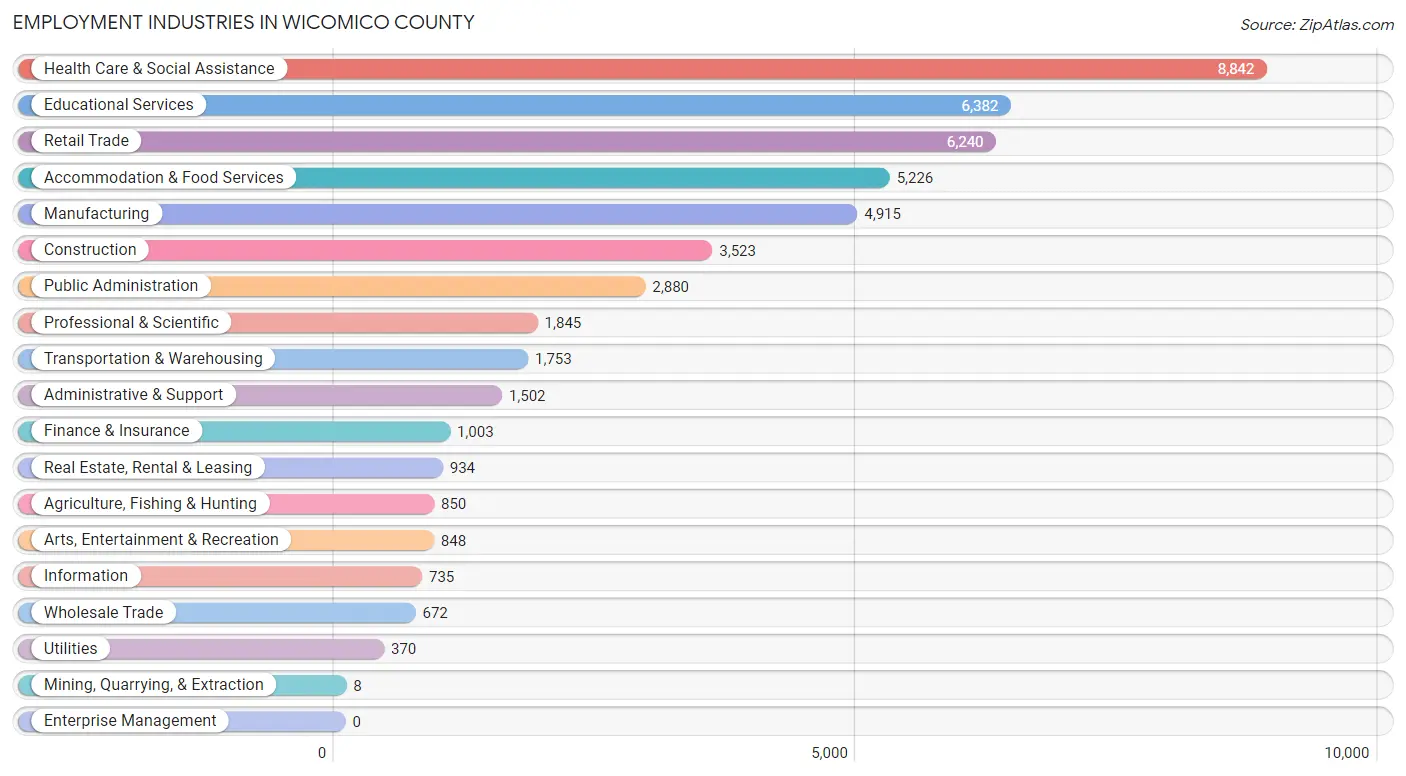
Employment Industries in Wicomico County
The major employment industries in Wicomico County include Health Care & Social Assistance (8,842 | 17.4%), Educational Services (6,382 | 12.6%), Retail Trade (6,240 | 12.3%), Accommodation & Food Services (5,226 | 10.3%), and Manufacturing (4,915 | 9.7%).
Employment Industries by Sex in Wicomico County
The Wicomico County industries that see more men than women are Utilities (90.3%), Mining, Quarrying, & Extraction (87.5%), and Construction (86.6%), whereas the industries that tend to have a higher number of women are Health Care & Social Assistance (79.0%), Finance & Insurance (69.9%), and Educational Services (68.0%).
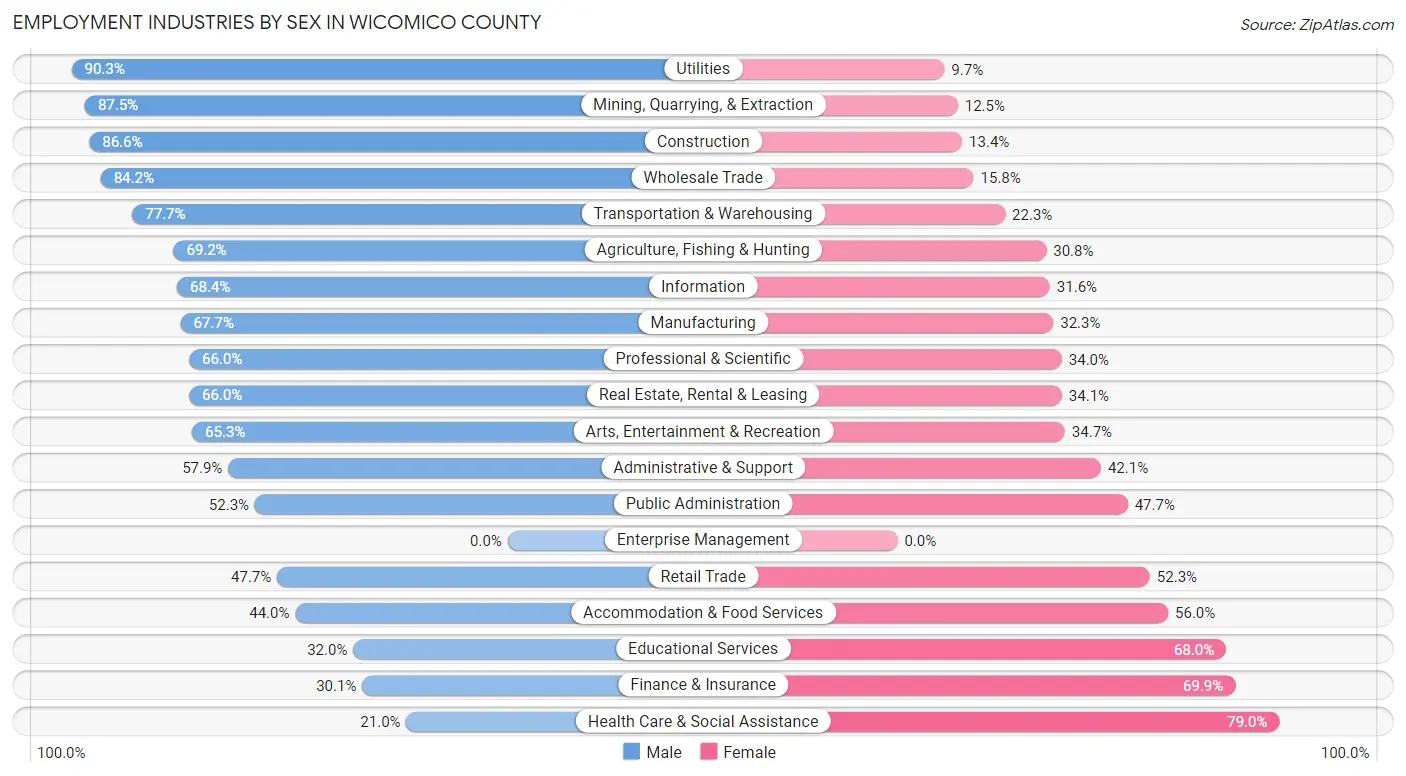
| Industry | Male | Female |
| Agriculture, Fishing & Hunting | 588 (69.2%) | 262 (30.8%) |
| Mining, Quarrying, & Extraction | 7 (87.5%) | 1 (12.5%) |
| Construction | 3,051 (86.6%) | 472 (13.4%) |
| Manufacturing | 3,329 (67.7%) | 1,586 (32.3%) |
| Wholesale Trade | 566 (84.2%) | 106 (15.8%) |
| Retail Trade | 2,979 (47.7%) | 3,261 (52.3%) |
| Transportation & Warehousing | 1,362 (77.7%) | 391 (22.3%) |
| Utilities | 334 (90.3%) | 36 (9.7%) |
| Information | 503 (68.4%) | 232 (31.6%) |
| Finance & Insurance | 302 (30.1%) | 701 (69.9%) |
| Real Estate, Rental & Leasing | 616 (65.9%) | 318 (34.1%) |
| Professional & Scientific | 1,217 (66.0%) | 628 (34.0%) |
| Enterprise Management | 0 (0.0%) | 0 (0.0%) |
| Administrative & Support | 869 (57.9%) | 633 (42.1%) |
| Educational Services | 2,041 (32.0%) | 4,341 (68.0%) |
| Health Care & Social Assistance | 1,854 (21.0%) | 6,988 (79.0%) |
| Arts, Entertainment & Recreation | 554 (65.3%) | 294 (34.7%) |
| Accommodation & Food Services | 2,298 (44.0%) | 2,928 (56.0%) |
| Public Administration | 1,507 (52.3%) | 1,373 (47.7%) |
| Total | 25,097 (49.3%) | 25,772 (50.7%) |
Education in Wicomico County
School Enrollment in Wicomico County
The most common levels of schooling among the 29,194 students in Wicomico County are college / undergraduate (9,395 | 32.2%), high school (5,471 | 18.7%), and middle school (5,345 | 18.3%).
| School Level | # Students | % Students |
| Nursery / Preschool | 1,282 | 4.4% |
| Kindergarten | 1,743 | 6.0% |
| Elementary School | 4,383 | 15.0% |
| Middle School | 5,345 | 18.3% |
| High School | 5,471 | 18.7% |
| College / Undergraduate | 9,395 | 32.2% |
| Graduate / Professional | 1,575 | 5.4% |
| Total | 29,194 | 100.0% |
School Enrollment by Age by Funding Source in Wicomico County
Out of a total of 29,194 students who are enrolled in schools in Wicomico County, 3,941 (13.5%) attend a private institution, while the remaining 25,253 (86.5%) are enrolled in public schools. The age group of 3 to 4 year olds has the highest likelihood of being enrolled in private schools, with 493 (36.7% in the age bracket) enrolled. Conversely, the age group of 20 to 24 year olds has the lowest likelihood of being enrolled in a private school, with 5,003 (96.5% in the age bracket) attending a public institution.
| Age Bracket | Public School | Private School |
| 3 to 4 Year Olds | 850 (63.3%) | 493 (36.7%) |
| 5 to 9 Year Old | 4,564 (79.6%) | 1,168 (20.4%) |
| 10 to 14 Year Olds | 5,489 (85.7%) | 915 (14.3%) |
| 15 to 17 Year Olds | 3,393 (87.4%) | 490 (12.6%) |
| 18 to 19 Year Olds | 3,734 (93.8%) | 248 (6.2%) |
| 20 to 24 Year Olds | 5,003 (96.5%) | 181 (3.5%) |
| 25 to 34 Year Olds | 1,277 (90.7%) | 131 (9.3%) |
| 35 Years and over | 936 (74.4%) | 322 (25.6%) |
| Total | 25,253 (86.5%) | 3,941 (13.5%) |
Educational Attainment by Field of Study in Wicomico County
Business (3,475 | 17.1%), education (3,316 | 16.3%), science & technology (2,288 | 11.2%), arts & humanities (1,527 | 7.5%), and bio, nature & agricultural (1,337 | 6.6%) are the most common fields of study among 20,358 individuals in Wicomico County who have obtained a bachelor's degree or higher.
| Field of Study | # Graduates | % Graduates |
| Computers & Mathematics | 783 | 3.8% |
| Bio, Nature & Agricultural | 1,337 | 6.6% |
| Physical & Health Sciences | 538 | 2.6% |
| Psychology | 1,265 | 6.2% |
| Social Sciences | 923 | 4.5% |
| Engineering | 966 | 4.8% |
| Multidisciplinary Studies | 344 | 1.7% |
| Science & Technology | 2,288 | 11.2% |
| Business | 3,475 | 17.1% |
| Education | 3,316 | 16.3% |
| Literature & Languages | 889 | 4.4% |
| Liberal Arts & History | 1,179 | 5.8% |
| Visual & Performing Arts | 599 | 2.9% |
| Communications | 929 | 4.6% |
| Arts & Humanities | 1,527 | 7.5% |
| Total | 20,358 | 100.0% |
Transportation & Commute in Wicomico County
Vehicle Availability by Sex in Wicomico County
The most prevalent vehicle ownership categories in Wicomico County are males with 2 vehicles (10,350, accounting for 41.6%) and females with 2 vehicles (9,609, making up 41.8%).
| Vehicles Available | Male | Female |
| No Vehicle | 403 (1.6%) | 637 (2.6%) |
| 1 Vehicle | 4,266 (17.2%) | 5,499 (22.2%) |
| 2 Vehicles | 10,350 (41.6%) | 9,609 (38.8%) |
| 3 Vehicles | 5,379 (21.6%) | 4,813 (19.4%) |
| 4 Vehicles | 2,781 (11.2%) | 2,700 (10.9%) |
| 5 or more Vehicles | 1,668 (6.7%) | 1,518 (6.1%) |
| Total | 24,847 (100.0%) | 24,776 (100.0%) |
Commute Time in Wicomico County
The most frequently occuring commute durations in Wicomico County are 15 to 19 minutes (9,674 commuters, 20.4%), 10 to 14 minutes (9,056 commuters, 19.1%), and 5 to 9 minutes (6,425 commuters, 13.6%).
| Commute Time | # Commuters | % Commuters |
| Less than 5 Minutes | 1,135 | 2.4% |
| 5 to 9 Minutes | 6,425 | 13.6% |
| 10 to 14 Minutes | 9,056 | 19.1% |
| 15 to 19 Minutes | 9,674 | 20.4% |
| 20 to 24 Minutes | 5,275 | 11.1% |
| 25 to 29 Minutes | 2,325 | 4.9% |
| 30 to 34 Minutes | 3,898 | 8.2% |
| 35 to 39 Minutes | 1,527 | 3.2% |
| 40 to 44 Minutes | 1,975 | 4.2% |
| 45 to 59 Minutes | 3,273 | 6.9% |
| 60 to 89 Minutes | 1,647 | 3.5% |
| 90 or more Minutes | 1,178 | 2.5% |
Commute Time by Sex in Wicomico County
The most common commute times in Wicomico County are 15 to 19 minutes (4,340 commuters, 18.3%) for males and 15 to 19 minutes (5,334 commuters, 22.5%) for females.
| Commute Time | Male | Female |
| Less than 5 Minutes | 778 (3.3%) | 357 (1.5%) |
| 5 to 9 Minutes | 2,916 (12.3%) | 3,509 (14.8%) |
| 10 to 14 Minutes | 4,110 (17.3%) | 4,946 (20.9%) |
| 15 to 19 Minutes | 4,340 (18.3%) | 5,334 (22.5%) |
| 20 to 24 Minutes | 2,623 (11.1%) | 2,652 (11.2%) |
| 25 to 29 Minutes | 1,040 (4.4%) | 1,285 (5.4%) |
| 30 to 34 Minutes | 1,785 (7.5%) | 2,113 (8.9%) |
| 35 to 39 Minutes | 1,052 (4.4%) | 475 (2.0%) |
| 40 to 44 Minutes | 1,019 (4.3%) | 956 (4.0%) |
| 45 to 59 Minutes | 2,042 (8.6%) | 1,231 (5.2%) |
| 60 to 89 Minutes | 1,068 (4.5%) | 579 (2.5%) |
| 90 or more Minutes | 953 (4.0%) | 225 (0.9%) |
Time of Departure to Work by Sex in Wicomico County
The most frequent times of departure to work in Wicomico County are 7:00 AM to 7:29 AM (3,715, 15.7%) for males and 7:30 AM to 7:59 AM (4,328, 18.3%) for females.
| Time of Departure | Male | Female |
| 12:00 AM to 4:59 AM | 914 (3.8%) | 630 (2.7%) |
| 5:00 AM to 5:29 AM | 942 (4.0%) | 447 (1.9%) |
| 5:30 AM to 5:59 AM | 1,068 (4.5%) | 718 (3.0%) |
| 6:00 AM to 6:29 AM | 2,088 (8.8%) | 836 (3.5%) |
| 6:30 AM to 6:59 AM | 2,404 (10.1%) | 2,444 (10.3%) |
| 7:00 AM to 7:29 AM | 3,715 (15.7%) | 4,019 (17.0%) |
| 7:30 AM to 7:59 AM | 3,614 (15.2%) | 4,328 (18.3%) |
| 8:00 AM to 8:29 AM | 2,054 (8.7%) | 2,410 (10.2%) |
| 8:30 AM to 8:59 AM | 1,183 (5.0%) | 1,362 (5.8%) |
| 9:00 AM to 9:59 AM | 751 (3.2%) | 1,220 (5.2%) |
| 10:00 AM to 10:59 AM | 579 (2.4%) | 1,065 (4.5%) |
| 11:00 AM to 11:59 AM | 188 (0.8%) | 389 (1.6%) |
| 12:00 PM to 3:59 PM | 2,217 (9.3%) | 1,781 (7.5%) |
| 4:00 PM to 11:59 PM | 2,009 (8.5%) | 2,013 (8.5%) |
| Total | 23,726 (100.0%) | 23,662 (100.0%) |
Housing Occupancy in Wicomico County
Occupancy by Ownership in Wicomico County
Of the total 39,939 dwellings in Wicomico County, owner-occupied units account for 23,825 (59.7%), while renter-occupied units make up 16,114 (40.4%).
| Occupancy | # Housing Units | % Housing Units |
| Owner Occupied Housing Units | 23,825 | 59.7% |
| Renter-Occupied Housing Units | 16,114 | 40.4% |
| Total Occupied Housing Units | 39,939 | 100.0% |
Occupancy by Household Size in Wicomico County
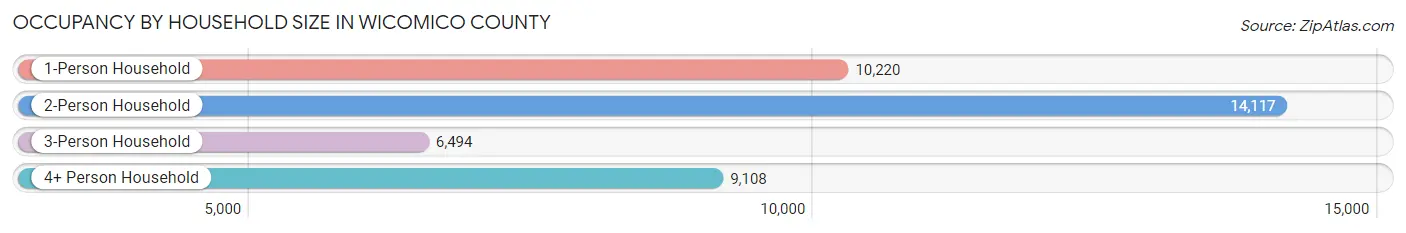
| Household Size | # Housing Units | % Housing Units |
| 1-Person Household | 10,220 | 25.6% |
| 2-Person Household | 14,117 | 35.3% |
| 3-Person Household | 6,494 | 16.3% |
| 4+ Person Household | 9,108 | 22.8% |
| Total Housing Units | 39,939 | 100.0% |
Occupancy by Ownership by Household Size in Wicomico County
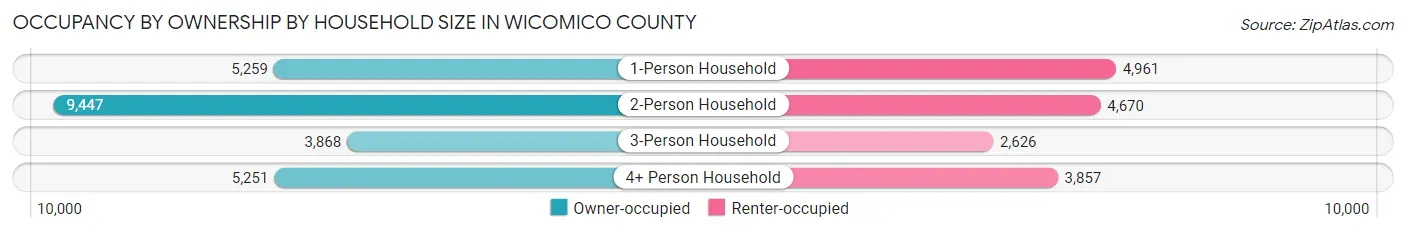
| Household Size | Owner-occupied | Renter-occupied |
| 1-Person Household | 5,259 (51.5%) | 4,961 (48.5%) |
| 2-Person Household | 9,447 (66.9%) | 4,670 (33.1%) |
| 3-Person Household | 3,868 (59.6%) | 2,626 (40.4%) |
| 4+ Person Household | 5,251 (57.7%) | 3,857 (42.3%) |
| Total Housing Units | 23,825 (59.7%) | 16,114 (40.4%) |
Occupancy by Educational Attainment in Wicomico County
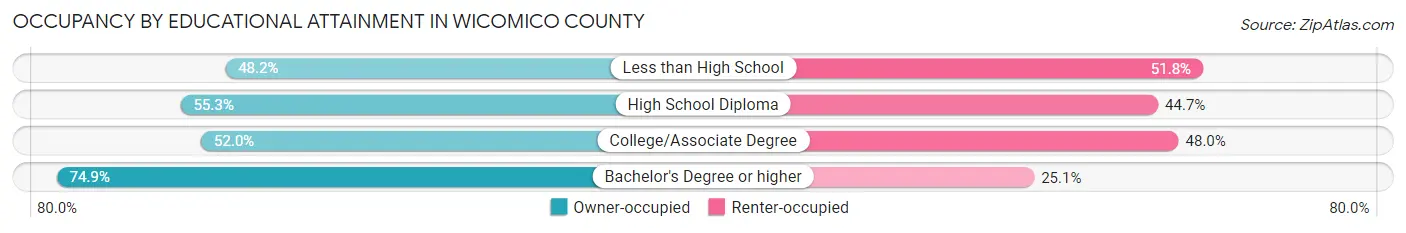
| Household Size | Owner-occupied | Renter-occupied |
| Less than High School | 1,826 (48.2%) | 1,964 (51.8%) |
| High School Diploma | 6,255 (55.3%) | 5,062 (44.7%) |
| College/Associate Degree | 6,505 (52.0%) | 5,997 (48.0%) |
| Bachelor's Degree or higher | 9,239 (74.9%) | 3,091 (25.1%) |
Occupancy by Age of Householder in Wicomico County
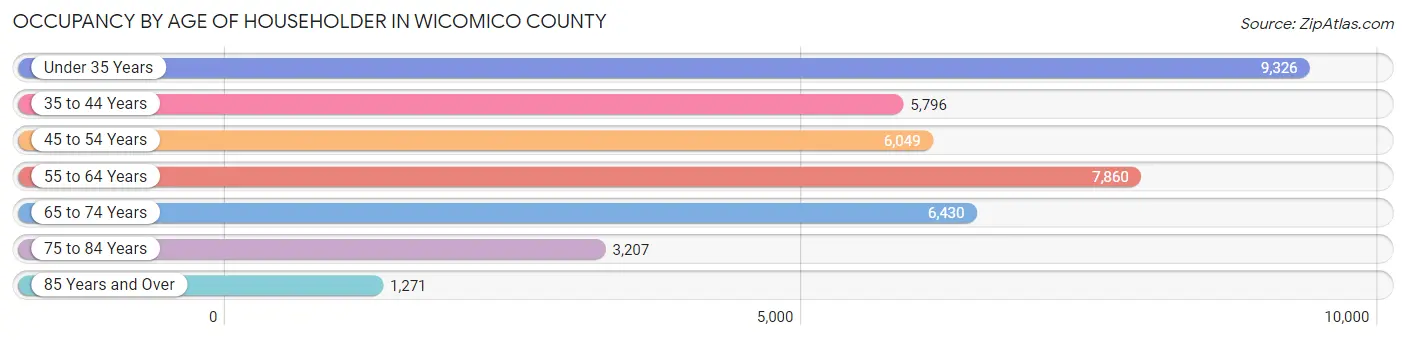
| Age Bracket | # Households | % Households |
| Under 35 Years | 9,326 | 23.4% |
| 35 to 44 Years | 5,796 | 14.5% |
| 45 to 54 Years | 6,049 | 15.1% |
| 55 to 64 Years | 7,860 | 19.7% |
| 65 to 74 Years | 6,430 | 16.1% |
| 75 to 84 Years | 3,207 | 8.0% |
| 85 Years and Over | 1,271 | 3.2% |
| Total | 39,939 | 100.0% |
Housing Finances in Wicomico County
Median Income by Occupancy in Wicomico County
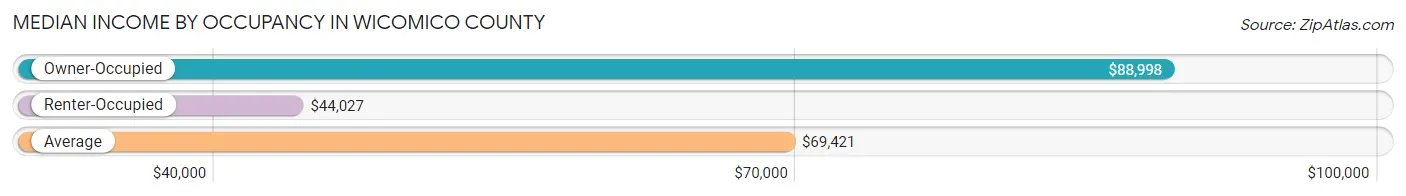
| Occupancy Type | # Households | Median Income |
| Owner-Occupied | 23,825 (59.7%) | $88,998 |
| Renter-Occupied | 16,114 (40.4%) | $44,027 |
| Average | 39,939 (100.0%) | $69,421 |
Occupancy by Householder Income Bracket in Wicomico County
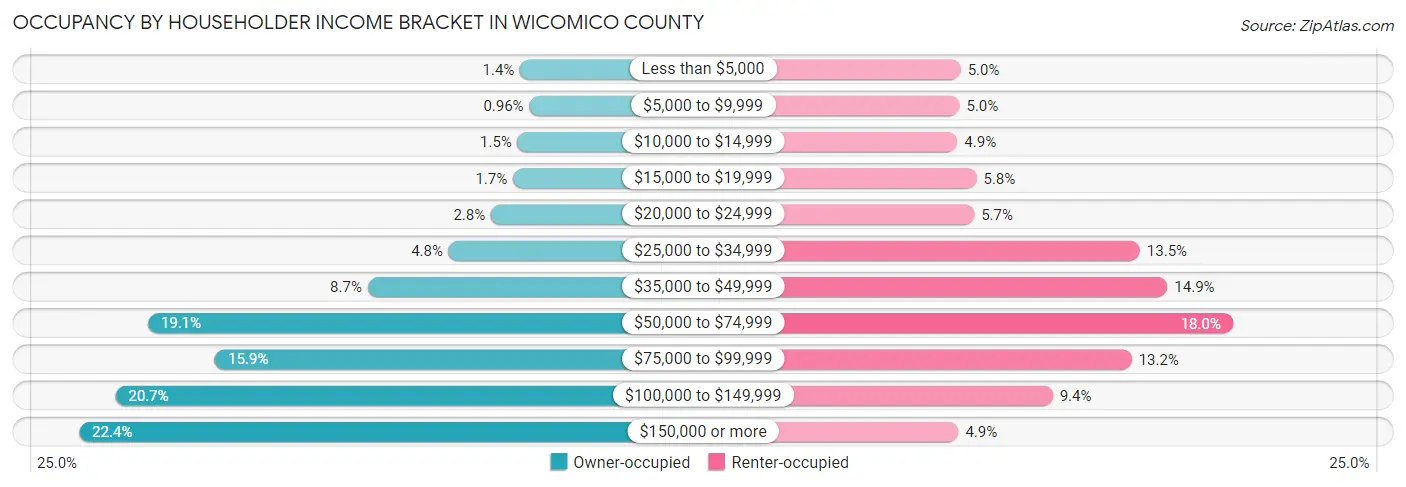
| Income Bracket | Owner-occupied | Renter-occupied |
| Less than $5,000 | 333 (1.4%) | 808 (5.0%) |
| $5,000 to $9,999 | 228 (1.0%) | 797 (5.0%) |
| $10,000 to $14,999 | 363 (1.5%) | 781 (4.9%) |
| $15,000 to $19,999 | 415 (1.7%) | 928 (5.8%) |
| $20,000 to $24,999 | 664 (2.8%) | 910 (5.7%) |
| $25,000 to $34,999 | 1,143 (4.8%) | 2,182 (13.5%) |
| $35,000 to $49,999 | 2,063 (8.7%) | 2,393 (14.8%) |
| $50,000 to $74,999 | 4,557 (19.1%) | 2,894 (18.0%) |
| $75,000 to $99,999 | 3,796 (15.9%) | 2,119 (13.2%) |
| $100,000 to $149,999 | 4,927 (20.7%) | 1,513 (9.4%) |
| $150,000 or more | 5,336 (22.4%) | 789 (4.9%) |
| Total | 23,825 (100.0%) | 16,114 (100.0%) |
Monthly Housing Cost Tiers in Wicomico County
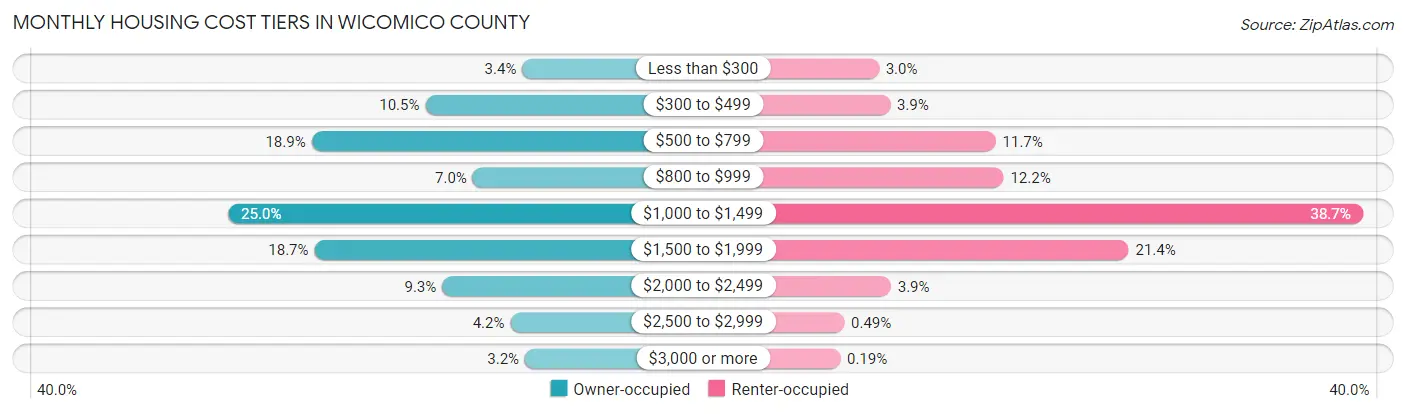
| Monthly Cost | Owner-occupied | Renter-occupied |
| Less than $300 | 797 (3.4%) | 490 (3.0%) |
| $300 to $499 | 2,499 (10.5%) | 624 (3.9%) |
| $500 to $799 | 4,495 (18.9%) | 1,878 (11.7%) |
| $800 to $999 | 1,668 (7.0%) | 1,970 (12.2%) |
| $1,000 to $1,499 | 5,958 (25.0%) | 6,232 (38.7%) |
| $1,500 to $1,999 | 4,446 (18.7%) | 3,455 (21.4%) |
| $2,000 to $2,499 | 2,203 (9.2%) | 633 (3.9%) |
| $2,500 to $2,999 | 1,008 (4.2%) | 79 (0.5%) |
| $3,000 or more | 751 (3.2%) | 31 (0.2%) |
| Total | 23,825 (100.0%) | 16,114 (100.0%) |
Physical Housing Characteristics in Wicomico County
Housing Structures in Wicomico County
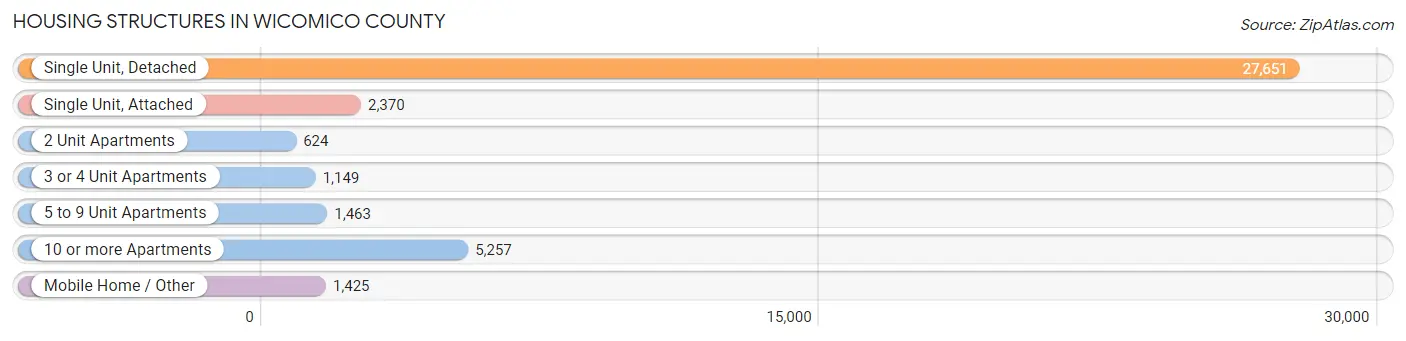
| Structure Type | # Housing Units | % Housing Units |
| Single Unit, Detached | 27,651 | 69.2% |
| Single Unit, Attached | 2,370 | 5.9% |
| 2 Unit Apartments | 624 | 1.6% |
| 3 or 4 Unit Apartments | 1,149 | 2.9% |
| 5 to 9 Unit Apartments | 1,463 | 3.7% |
| 10 or more Apartments | 5,257 | 13.2% |
| Mobile Home / Other | 1,425 | 3.6% |
| Total | 39,939 | 100.0% |
Housing Structures by Occupancy in Wicomico County
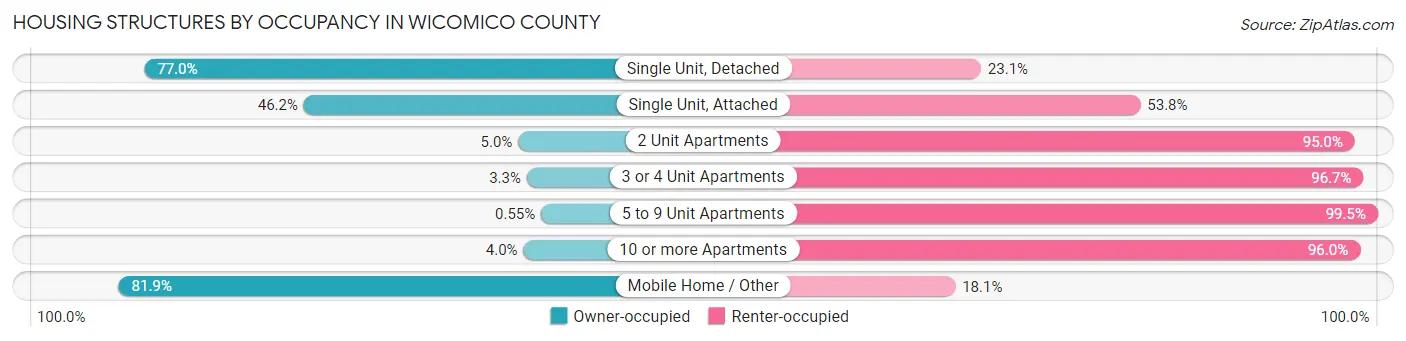
| Structure Type | Owner-occupied | Renter-occupied |
| Single Unit, Detached | 21,277 (76.9%) | 6,374 (23.1%) |
| Single Unit, Attached | 1,096 (46.2%) | 1,274 (53.8%) |
| 2 Unit Apartments | 31 (5.0%) | 593 (95.0%) |
| 3 or 4 Unit Apartments | 38 (3.3%) | 1,111 (96.7%) |
| 5 to 9 Unit Apartments | 8 (0.5%) | 1,455 (99.5%) |
| 10 or more Apartments | 208 (4.0%) | 5,049 (96.0%) |
| Mobile Home / Other | 1,167 (81.9%) | 258 (18.1%) |
| Total | 23,825 (59.7%) | 16,114 (40.4%) |
Housing Structures by Number of Rooms in Wicomico County
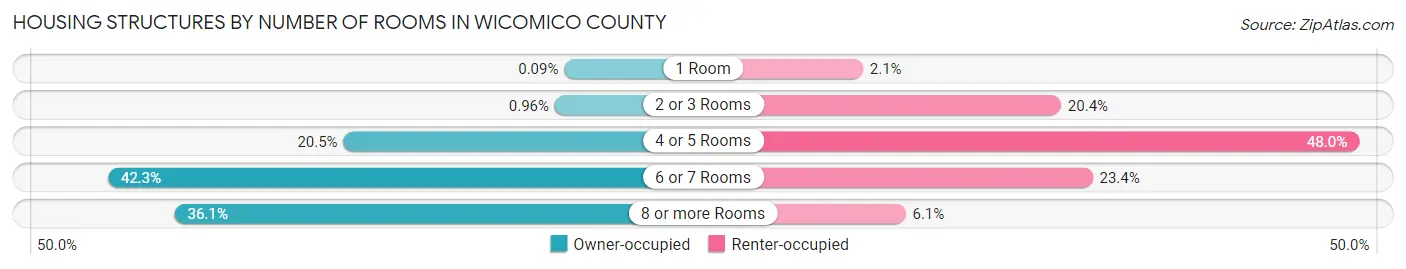
| Number of Rooms | Owner-occupied | Renter-occupied |
| 1 Room | 22 (0.1%) | 341 (2.1%) |
| 2 or 3 Rooms | 229 (1.0%) | 3,293 (20.4%) |
| 4 or 5 Rooms | 4,887 (20.5%) | 7,737 (48.0%) |
| 6 or 7 Rooms | 10,079 (42.3%) | 3,765 (23.4%) |
| 8 or more Rooms | 8,608 (36.1%) | 978 (6.1%) |
| Total | 23,825 (100.0%) | 16,114 (100.0%) |
Housing Structure by Heating Type in Wicomico County
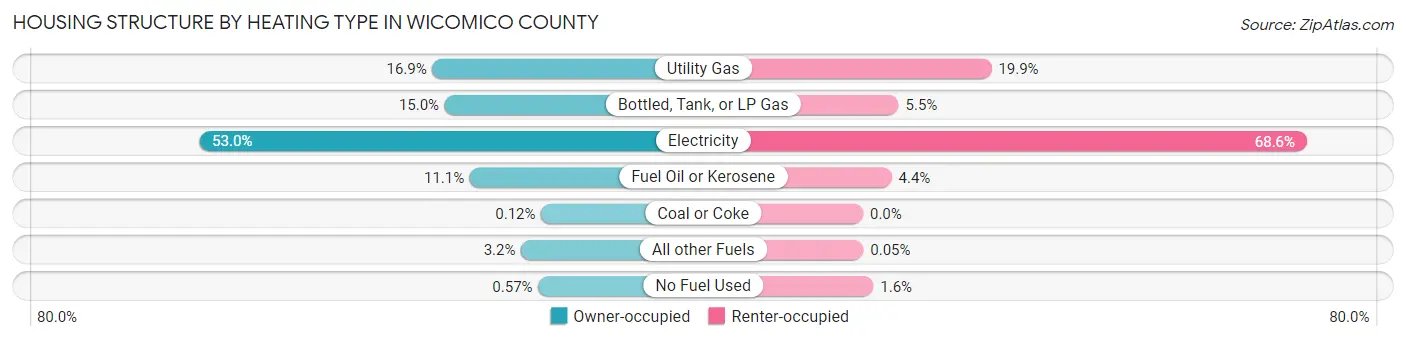
| Heating Type | Owner-occupied | Renter-occupied |
| Utility Gas | 4,036 (16.9%) | 3,199 (19.9%) |
| Bottled, Tank, or LP Gas | 3,579 (15.0%) | 886 (5.5%) |
| Electricity | 12,629 (53.0%) | 11,054 (68.6%) |
| Fuel Oil or Kerosene | 2,653 (11.1%) | 711 (4.4%) |
| Coal or Coke | 29 (0.1%) | 0 (0.0%) |
| All other Fuels | 764 (3.2%) | 8 (0.1%) |
| No Fuel Used | 135 (0.6%) | 256 (1.6%) |
| Total | 23,825 (100.0%) | 16,114 (100.0%) |
Household Vehicle Usage in Wicomico County
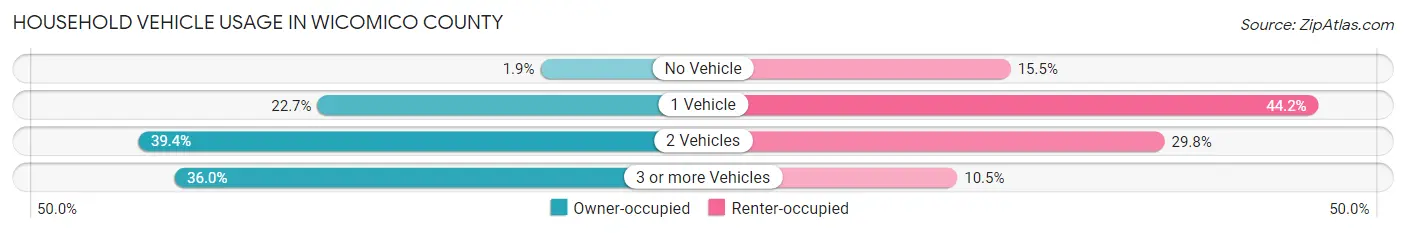
| Vehicles per Household | Owner-occupied | Renter-occupied |
| No Vehicle | 444 (1.9%) | 2,494 (15.5%) |
| 1 Vehicle | 5,401 (22.7%) | 7,122 (44.2%) |
| 2 Vehicles | 9,394 (39.4%) | 4,808 (29.8%) |
| 3 or more Vehicles | 8,586 (36.0%) | 1,690 (10.5%) |
| Total | 23,825 (100.0%) | 16,114 (100.0%) |
Real Estate & Mortgages in Wicomico County
Real Estate and Mortgage Overview in Wicomico County
| Characteristic | Without Mortgage | With Mortgage |
| Housing Units | 8,297 | 15,528 |
| Median Property Value | $211,600 | $233,500 |
| Median Household Income | $70,134 | $4,286 |
| Monthly Housing Costs | $558 | $725 |
| Real Estate Taxes | $1,885 | $419 |
Property Value by Mortgage Status in Wicomico County
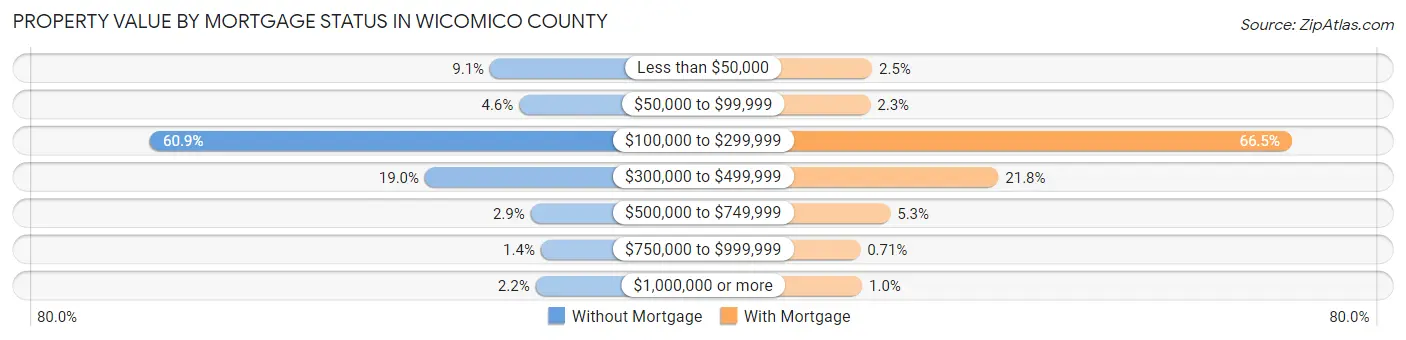
| Property Value | Without Mortgage | With Mortgage |
| Less than $50,000 | 754 (9.1%) | 391 (2.5%) |
| $50,000 to $99,999 | 385 (4.6%) | 351 (2.3%) |
| $100,000 to $299,999 | 5,050 (60.9%) | 10,321 (66.5%) |
| $300,000 to $499,999 | 1,577 (19.0%) | 3,379 (21.8%) |
| $500,000 to $749,999 | 241 (2.9%) | 821 (5.3%) |
| $750,000 to $999,999 | 112 (1.3%) | 110 (0.7%) |
| $1,000,000 or more | 178 (2.1%) | 155 (1.0%) |
| Total | 8,297 (100.0%) | 15,528 (100.0%) |
Household Income by Mortgage Status in Wicomico County
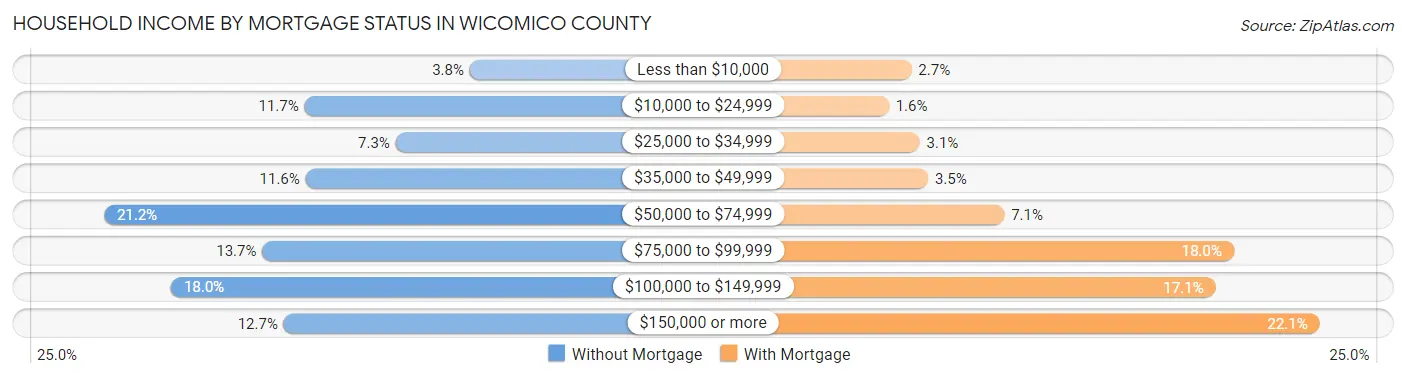
| Household Income | Without Mortgage | With Mortgage |
| Less than $10,000 | 315 (3.8%) | 413 (2.7%) |
| $10,000 to $24,999 | 968 (11.7%) | 246 (1.6%) |
| $25,000 to $34,999 | 608 (7.3%) | 474 (3.0%) |
| $35,000 to $49,999 | 964 (11.6%) | 535 (3.5%) |
| $50,000 to $74,999 | 1,761 (21.2%) | 1,099 (7.1%) |
| $75,000 to $99,999 | 1,135 (13.7%) | 2,796 (18.0%) |
| $100,000 to $149,999 | 1,496 (18.0%) | 2,661 (17.1%) |
| $150,000 or more | 1,050 (12.7%) | 3,431 (22.1%) |
| Total | 8,297 (100.0%) | 15,528 (100.0%) |
Property Value to Household Income Ratio in Wicomico County
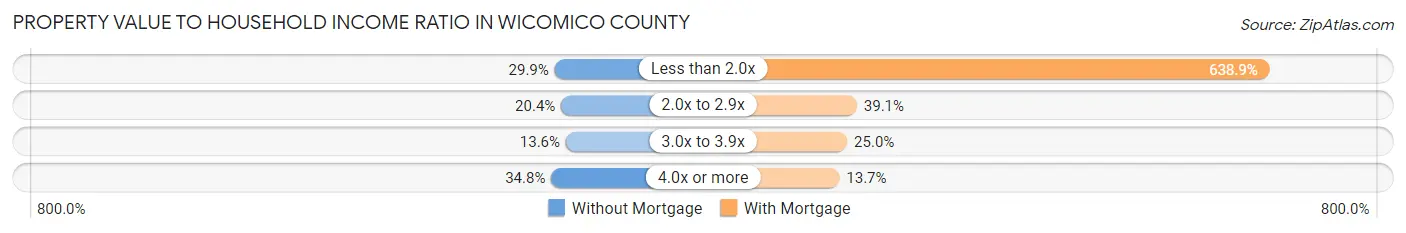
| Value-to-Income Ratio | Without Mortgage | With Mortgage |
| Less than 2.0x | 2,484 (29.9%) | 99,206 (638.9%) |
| 2.0x to 2.9x | 1,694 (20.4%) | 6,074 (39.1%) |
| 3.0x to 3.9x | 1,130 (13.6%) | 3,885 (25.0%) |
| 4.0x or more | 2,889 (34.8%) | 2,124 (13.7%) |
| Total | 8,297 (100.0%) | 15,528 (100.0%) |
Real Estate Taxes by Mortgage Status in Wicomico County
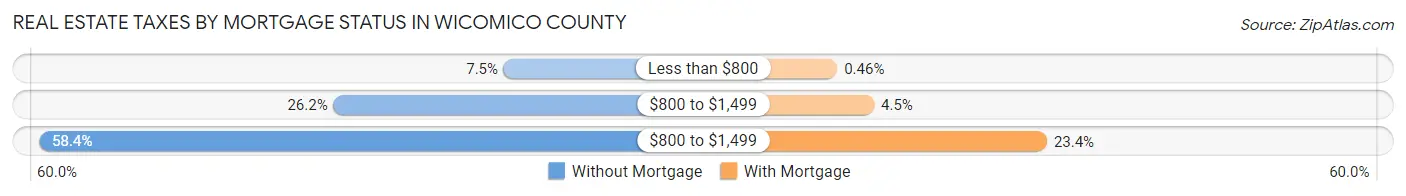
| Property Taxes | Without Mortgage | With Mortgage |
| Less than $800 | 621 (7.5%) | 72 (0.5%) |
| $800 to $1,499 | 2,170 (26.2%) | 699 (4.5%) |
| $800 to $1,499 | 4,847 (58.4%) | 3,640 (23.4%) |
| Total | 8,297 (100.0%) | 15,528 (100.0%) |
Health & Disability in Wicomico County
Health Insurance Coverage by Age in Wicomico County
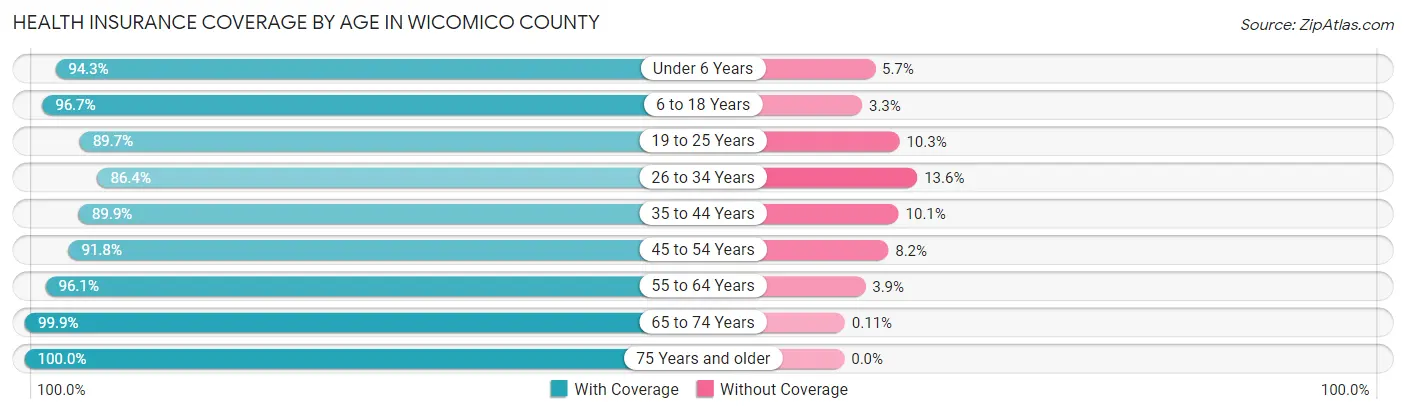
| Age Bracket | With Coverage | Without Coverage |
| Under 6 Years | 7,031 (94.3%) | 427 (5.7%) |
| 6 to 18 Years | 16,662 (96.7%) | 570 (3.3%) |
| 19 to 25 Years | 12,699 (89.7%) | 1,456 (10.3%) |
| 26 to 34 Years | 9,977 (86.4%) | 1,571 (13.6%) |
| 35 to 44 Years | 9,908 (89.9%) | 1,117 (10.1%) |
| 45 to 54 Years | 10,708 (91.8%) | 957 (8.2%) |
| 55 to 64 Years | 12,711 (96.1%) | 517 (3.9%) |
| 65 to 74 Years | 9,915 (99.9%) | 11 (0.1%) |
| 75 Years and older | 6,441 (100.0%) | 0 (0.0%) |
| Total | 96,052 (93.5%) | 6,626 (6.5%) |
Health Insurance Coverage by Citizenship Status in Wicomico County
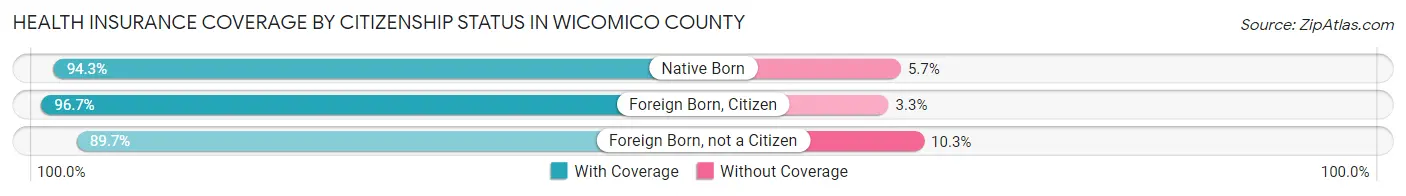
| Citizenship Status | With Coverage | Without Coverage |
| Native Born | 7,031 (94.3%) | 427 (5.7%) |
| Foreign Born, Citizen | 16,662 (96.7%) | 570 (3.3%) |
| Foreign Born, not a Citizen | 12,699 (89.7%) | 1,456 (10.3%) |
Health Insurance Coverage by Household Income in Wicomico County
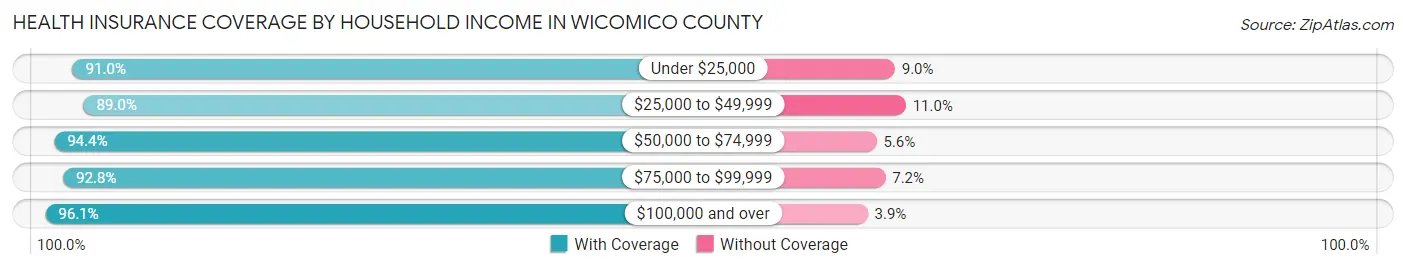
| Household Income | With Coverage | Without Coverage |
| Under $25,000 | 10,421 (91.0%) | 1,029 (9.0%) |
| $25,000 to $49,999 | 14,425 (89.0%) | 1,790 (11.0%) |
| $50,000 to $74,999 | 16,544 (94.4%) | 974 (5.6%) |
| $75,000 to $99,999 | 14,875 (92.8%) | 1,155 (7.2%) |
| $100,000 and over | 36,985 (96.1%) | 1,499 (3.9%) |
Public vs Private Health Insurance Coverage by Age in Wicomico County
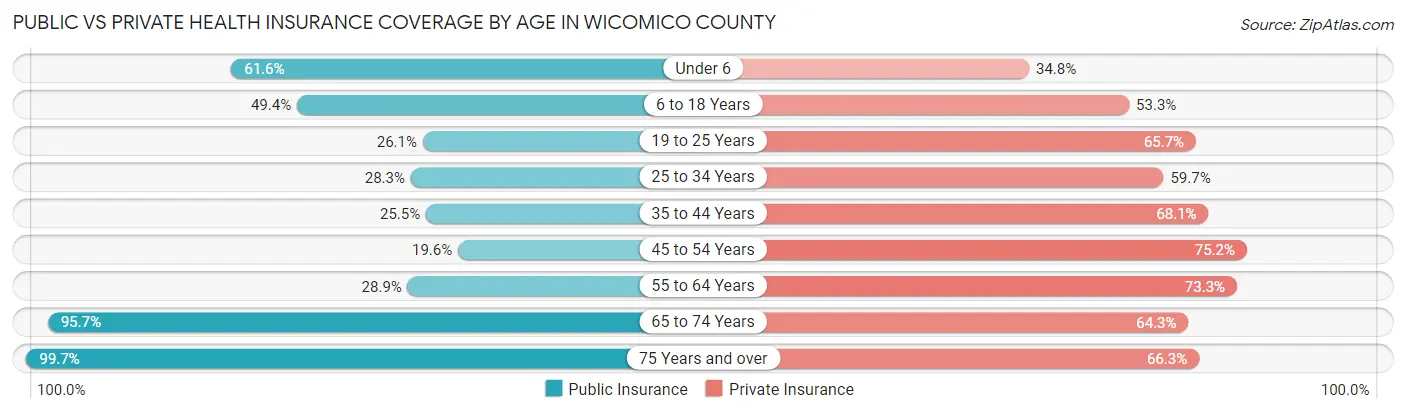
| Age Bracket | Public Insurance | Private Insurance |
| Under 6 | 4,596 (61.6%) | 2,592 (34.7%) |
| 6 to 18 Years | 8,520 (49.4%) | 9,191 (53.3%) |
| 19 to 25 Years | 3,693 (26.1%) | 9,304 (65.7%) |
| 25 to 34 Years | 3,270 (28.3%) | 6,895 (59.7%) |
| 35 to 44 Years | 2,810 (25.5%) | 7,502 (68.0%) |
| 45 to 54 Years | 2,280 (19.6%) | 8,770 (75.2%) |
| 55 to 64 Years | 3,823 (28.9%) | 9,700 (73.3%) |
| 65 to 74 Years | 9,499 (95.7%) | 6,384 (64.3%) |
| 75 Years and over | 6,419 (99.7%) | 4,271 (66.3%) |
| Total | 44,910 (43.7%) | 64,609 (62.9%) |
Disability Status by Sex by Age in Wicomico County
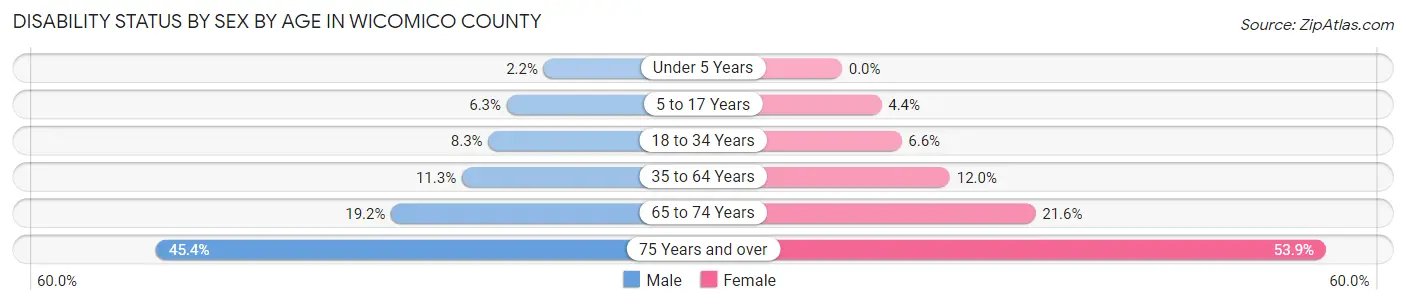
| Age Bracket | Male | Female |
| Under 5 Years | 68 (2.2%) | 0 (0.0%) |
| 5 to 17 Years | 545 (6.3%) | 354 (4.4%) |
| 18 to 34 Years | 1,083 (8.3%) | 962 (6.6%) |
| 35 to 64 Years | 1,917 (11.3%) | 2,277 (12.0%) |
| 65 to 74 Years | 889 (19.2%) | 1,139 (21.5%) |
| 75 Years and over | 1,163 (45.4%) | 2,090 (53.9%) |
Disability Class by Sex by Age in Wicomico County
Disability Class: Hearing Difficulty
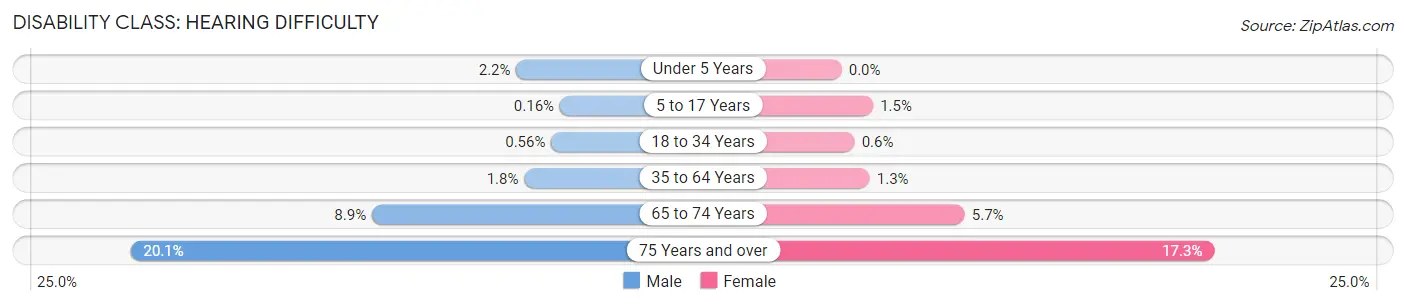
| Age Bracket | Male | Female |
| Under 5 Years | 68 (2.2%) | 0 (0.0%) |
| 5 to 17 Years | 14 (0.2%) | 117 (1.5%) |
| 18 to 34 Years | 73 (0.6%) | 87 (0.6%) |
| 35 to 64 Years | 308 (1.8%) | 246 (1.3%) |
| 65 to 74 Years | 412 (8.9%) | 302 (5.7%) |
| 75 Years and over | 515 (20.1%) | 670 (17.3%) |
Disability Class: Vision Difficulty
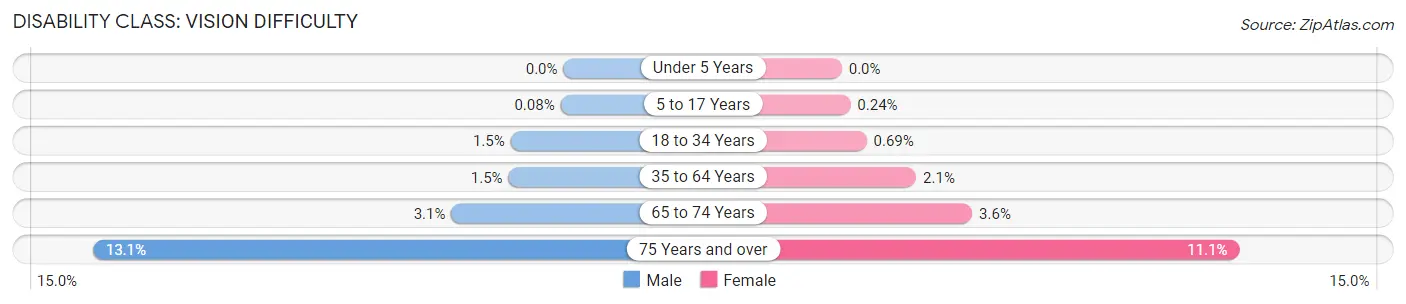
| Age Bracket | Male | Female |
| Under 5 Years | 0 (0.0%) | 0 (0.0%) |
| 5 to 17 Years | 7 (0.1%) | 19 (0.2%) |
| 18 to 34 Years | 191 (1.5%) | 100 (0.7%) |
| 35 to 64 Years | 260 (1.5%) | 392 (2.1%) |
| 65 to 74 Years | 145 (3.1%) | 192 (3.6%) |
| 75 Years and over | 336 (13.1%) | 429 (11.1%) |
Disability Class: Cognitive Difficulty
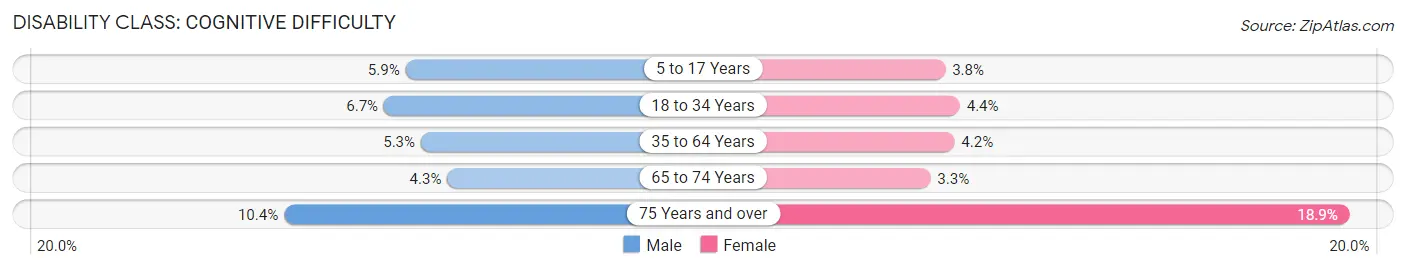
| Age Bracket | Male | Female |
| 5 to 17 Years | 508 (5.9%) | 309 (3.8%) |
| 18 to 34 Years | 865 (6.7%) | 636 (4.4%) |
| 35 to 64 Years | 899 (5.3%) | 791 (4.2%) |
| 65 to 74 Years | 200 (4.3%) | 174 (3.3%) |
| 75 Years and over | 266 (10.4%) | 731 (18.9%) |
Disability Class: Ambulatory Difficulty
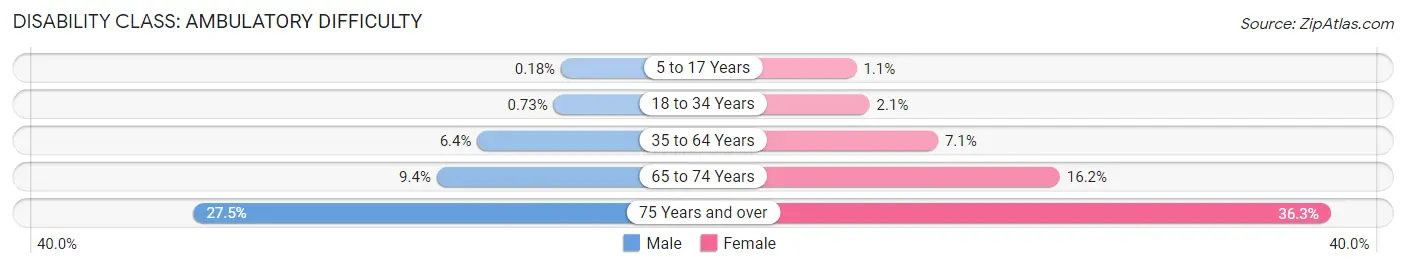
| Age Bracket | Male | Female |
| 5 to 17 Years | 16 (0.2%) | 88 (1.1%) |
| 18 to 34 Years | 95 (0.7%) | 300 (2.1%) |
| 35 to 64 Years | 1,086 (6.4%) | 1,352 (7.1%) |
| 65 to 74 Years | 436 (9.4%) | 856 (16.2%) |
| 75 Years and over | 704 (27.5%) | 1,407 (36.3%) |
Disability Class: Self-Care Difficulty
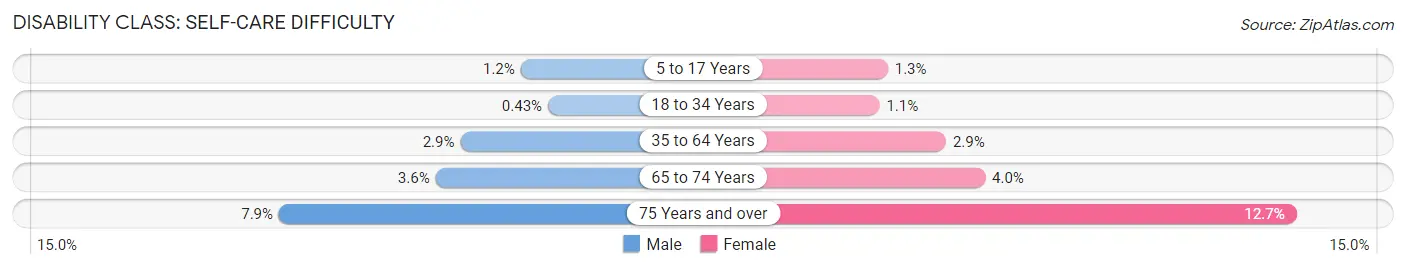
| Age Bracket | Male | Female |
| 5 to 17 Years | 103 (1.2%) | 103 (1.3%) |
| 18 to 34 Years | 56 (0.4%) | 153 (1.1%) |
| 35 to 64 Years | 487 (2.9%) | 549 (2.9%) |
| 65 to 74 Years | 165 (3.6%) | 211 (4.0%) |
| 75 Years and over | 203 (7.9%) | 491 (12.7%) |
Technology Access in Wicomico County
Computing Device Access in Wicomico County
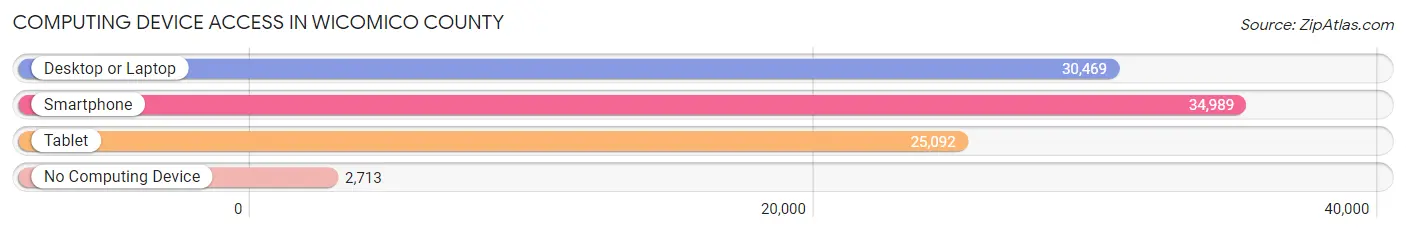
| Device Type | # Households | % Households |
| Desktop or Laptop | 30,469 | 76.3% |
| Smartphone | 34,989 | 87.6% |
| Tablet | 25,092 | 62.8% |
| No Computing Device | 2,713 | 6.8% |
| Total | 39,939 | 100.0% |
Internet Access in Wicomico County
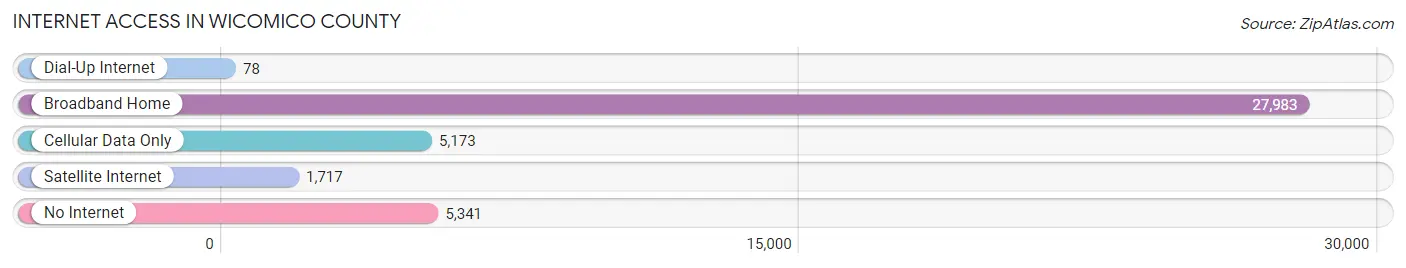
| Internet Type | # Households | % Households |
| Dial-Up Internet | 78 | 0.2% |
| Broadband Home | 27,983 | 70.1% |
| Cellular Data Only | 5,173 | 13.0% |
| Satellite Internet | 1,717 | 4.3% |
| No Internet | 5,341 | 13.4% |
| Total | 39,939 | 100.0% |
Wicomico County Summary
Wicomico County, Maryland is located in the Eastern Shore region of the state and is part of the Salisbury, MD-DE Metropolitan Statistical Area. The county is bordered by Somerset County to the south, Worcester County to the east, and Dorchester County to the north. The county seat is Salisbury, which is also the largest city in the county. Wicomico County is home to a population of 98,733 people, according to the 2019 U.S. Census.
Geography
Wicomico County is located in the Eastern Shore region of Maryland, and is bordered by Somerset County to the south, Worcester County to the east, and Dorchester County to the north. The county is located on the Delmarva Peninsula, which is bordered by the Chesapeake Bay to the west and the Atlantic Ocean to the east. The county is divided into two distinct regions: the Eastern Shore and the Western Shore. The Eastern Shore is characterized by flat, low-lying land, while the Western Shore is more hilly and forested. The county is home to several rivers, including the Wicomico River, the Nanticoke River, and the Choptank River.
The county is home to several state parks, including Pocomoke River State Park, Adkins Arboretum, and Blackwater National Wildlife Refuge. The county is also home to several wildlife refuges, including the Chincoteague National Wildlife Refuge, the Assateague Island National Seashore, and the Blackwater National Wildlife Refuge.
History
Wicomico County was established in 1867, and is named after the Wicomico River, which runs through the county. The county was originally part of Somerset County, but was split off in 1867. The county was home to several Native American tribes, including the Nanticoke, Assateague, and Choptank.
The county was home to several plantations during the colonial period, and was a major producer of tobacco, corn, and wheat. The county was also home to several shipbuilding yards, which produced ships for the Union Navy during the Civil War.
The county was home to several prominent figures in American history, including Harriet Tubman, who was born in Dorchester County, and John Wilkes Booth, who was born in St. Mary’s County.
Economy
Wicomico County is home to a diverse economy, with a mix of manufacturing, agriculture, and tourism. The county is home to several major employers, including Perdue Farms, which is the largest employer in the county, and the University of Maryland Eastern Shore.
The county is home to several major industries, including poultry processing, seafood processing, and tourism. The county is also home to several major agricultural products, including corn, soybeans, wheat, and tobacco.
Demographics
According to the 2019 U.S. Census, Wicomico County is home to a population of 98,733 people. The population is 53.3% White, 37.2% African American, 4.2% Hispanic or Latino, 2.2% Asian, and 0.7% Native American. The median household income in the county is $50,945, and the median home value is $179,400.
The county is home to several major cities, including Salisbury, which is the largest city in the county, and Fruitland, which is the second largest city. The county is also home to several smaller towns, including Delmar, Hebron, and Pittsville.
Conclusion
Wicomico County, Maryland is located in the Eastern Shore region of the state and is part of the Salisbury, MD-DE Metropolitan Statistical Area. The county is home to a population of 98,733 people, according to the 2019 U.S. Census. The county is divided into two distinct regions: the Eastern Shore and the Western Shore. The county is home to several major employers, including Perdue Farms, and the University of Maryland Eastern Shore. The county is home to a diverse population, with a mix of White, African American, Hispanic or Latino, Asian, and Native American residents. The county is home to several major industries, including poultry processing, seafood processing, and tourism.
Common Questions
What is the Total Population of Wicomico County?
Total Population of Wicomico County is 103,815.
What is the Total Male Population of Wicomico County?
Total Male Population of Wicomico County is 49,720.
What is the Total Female Population of Wicomico County?
Total Female Population of Wicomico County is 54,095.
What is the Ratio of Males per 100 Females in Wicomico County?
There are 91.91 Males per 100 Females in Wicomico County.
What is the Ratio of Females per 100 Males in Wicomico County?
There are 108.80 Females per 100 Males in Wicomico County.
What is the Median Population Age in Wicomico County?
Median Population Age in Wicomico County is 36.1 Years.
What is the Average Family Size in Wicomico County
Average Family Size in Wicomico County is 3.0 People.
What is the Average Household Size in Wicomico County
Average Household Size in Wicomico County is 2.5 People.
What is Per Capita Income in Wicomico County?
Per Capita income in Wicomico County is $35,658.
What is the Median Family Income in Wicomico County?
Median Family Income in Wicomico County is $84,504.
What is the Median Household income in Wicomico County?
Median Household Income in Wicomico County is $69,421.
What is Income or Wage Gap in Wicomico County?
Income or Wage Gap in Wicomico County is 23.7%.
Women in Wicomico County earn 76.3 cents for every dollar earned by a man.
What is Family Income Deficit in Wicomico County?
Family Income Deficit in Wicomico County is $10,315.
Families that are below poverty line in Wicomico County earn $10,315 less on average than the poverty threshold level.
What is Inequality or Gini Index in Wicomico County?
Inequality or Gini Index in Wicomico County is 0.46.
How Large is the Labor Force in Wicomico County?
There are 54,815 People in the Labor Forcein in Wicomico County.
What is the Percentage of People in the Labor Force in Wicomico County?
65.5% of People are in the Labor Force in Wicomico County.
What is the Unemployment Rate in Wicomico County?
Unemployment Rate in Wicomico County is 6.9%.