Talbot County, MD
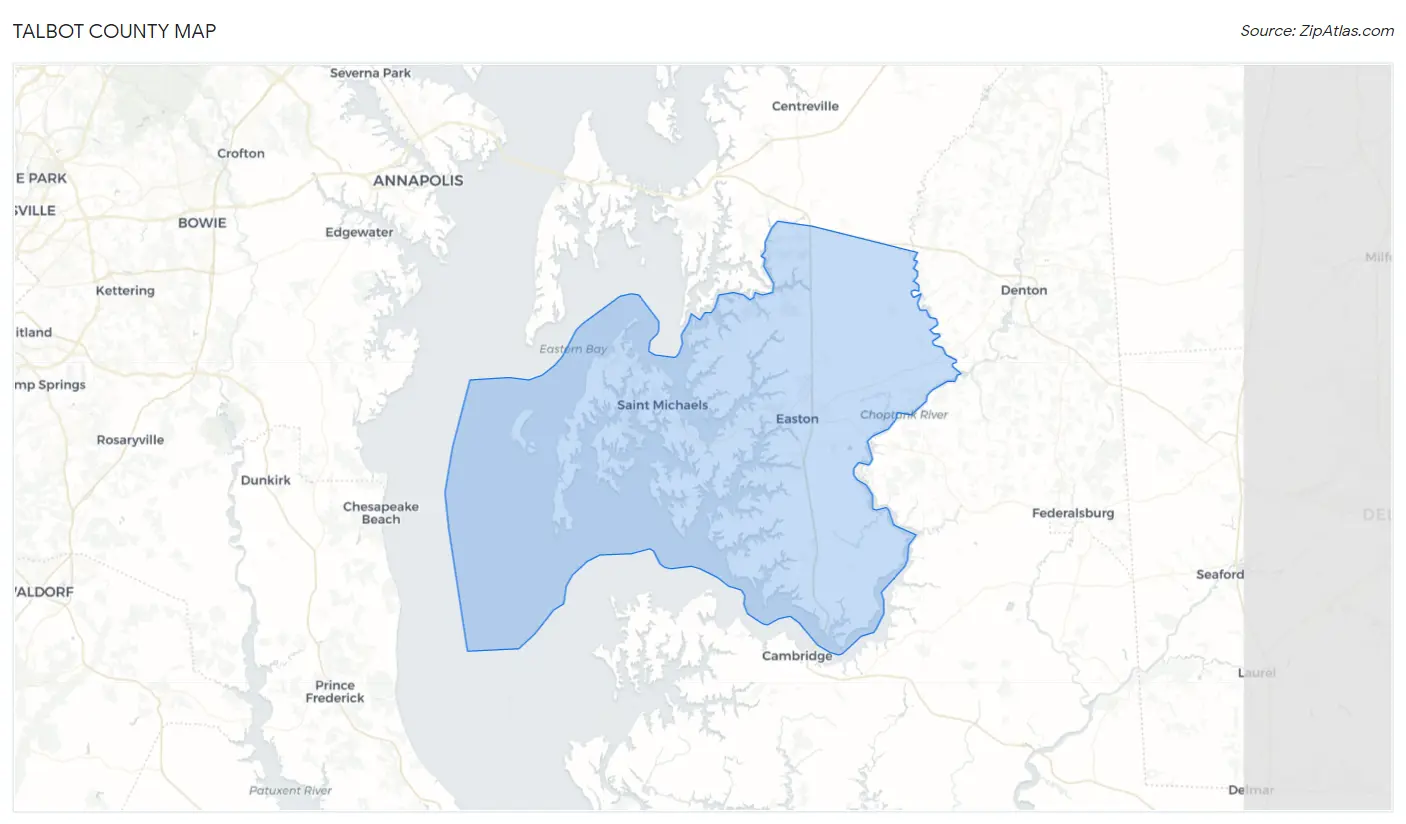
Talbot County Map
Talbot County Overview
37,663
TOTAL POPULATION
18,023
MALE POPULATION
19,640
FEMALE POPULATION
91.77
MALES / 100 FEMALES
108.97
FEMALES / 100 MALES
51.4
MEDIAN AGE
2.9
AVG FAMILY SIZE
2.3
AVG HOUSEHOLD SIZE
$52,555
PER CAPITA INCOME
$100,321
AVG FAMILY INCOME
$81,667
AVG HOUSEHOLD INCOME
24.5%
WAGE / INCOME GAP [ % ]
75.5¢/ $1
WAGE / INCOME GAP [ $ ]
$8,997
FAMILY INCOME DEFICIT
0.50
INEQUALITY / GINI INDEX
17,661
LABOR FORCE [ PEOPLE ]
55.8%
PERCENT IN LABOR FORCE
3.2%
UNEMPLOYMENT RATE
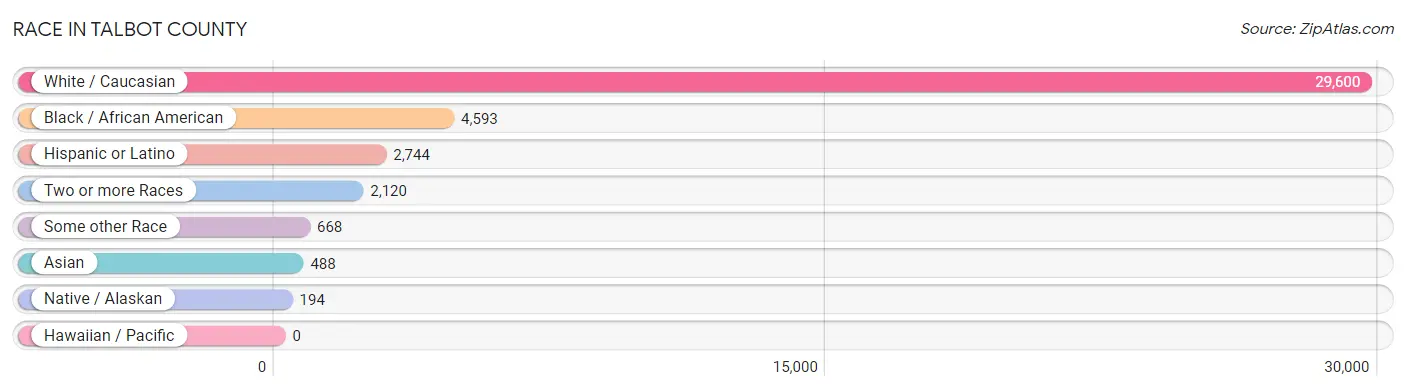
Race in Talbot County
The most populous races in Talbot County are White / Caucasian (29,600 | 78.6%), Black / African American (4,593 | 12.2%), and Hispanic or Latino (2,744 | 7.3%).
| Race | # Population | % Population |
| Asian | 488 | 1.3% |
| Black / African American | 4,593 | 12.2% |
| Hawaiian / Pacific | 0 | 0.0% |
| Hispanic or Latino | 2,744 | 7.3% |
| Native / Alaskan | 194 | 0.5% |
| White / Caucasian | 29,600 | 78.6% |
| Two or more Races | 2,120 | 5.6% |
| Some other Race | 668 | 1.8% |
| Total | 37,663 | 100.0% |
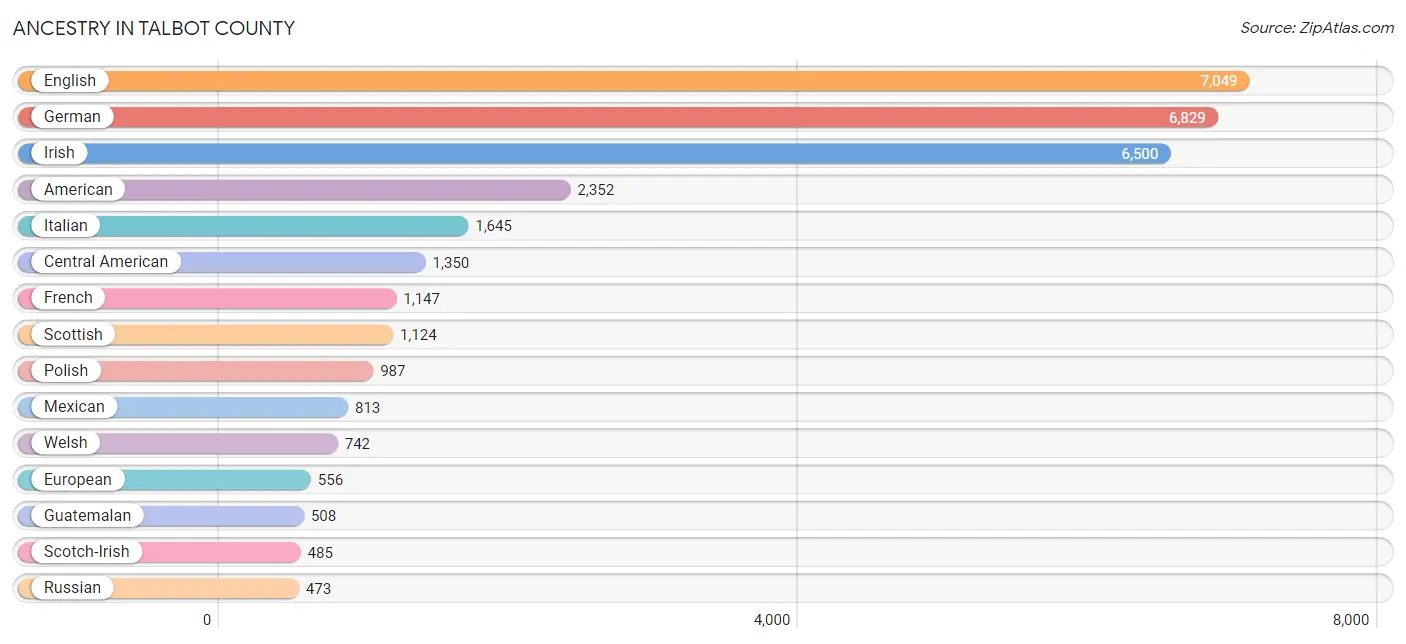
Ancestry in Talbot County
The most populous ancestries reported in Talbot County are English (7,049 | 18.7%), German (6,829 | 18.1%), Irish (6,500 | 17.3%), American (2,352 | 6.2%), and Italian (1,645 | 4.4%), together accounting for 64.7% of all Talbot County residents.
| Ancestry | # Population | % Population |
| Afghan | 27 | 0.1% |
| African | 120 | 0.3% |
| Alaska Native | 2 | 0.0% |
| Albanian | 17 | 0.1% |
| Alsatian | 8 | 0.0% |
| American | 2,352 | 6.2% |
| Arab | 43 | 0.1% |
| Argentinean | 34 | 0.1% |
| Armenian | 5 | 0.0% |
| Australian | 4 | 0.0% |
| Austrian | 77 | 0.2% |
| Belgian | 73 | 0.2% |
| Bhutanese | 29 | 0.1% |
| Brazilian | 74 | 0.2% |
| British | 261 | 0.7% |
| British West Indian | 51 | 0.1% |
| Burmese | 35 | 0.1% |
| Canadian | 45 | 0.1% |
| Central American | 1,350 | 3.6% |
| Central American Indian | 50 | 0.1% |
| Cherokee | 42 | 0.1% |
| Colombian | 24 | 0.1% |
| Costa Rican | 218 | 0.6% |
| Creek | 6 | 0.0% |
| Croatian | 54 | 0.1% |
| Cuban | 35 | 0.1% |
| Cypriot | 3 | 0.0% |
| Czech | 169 | 0.4% |
| Czechoslovakian | 32 | 0.1% |
| Danish | 49 | 0.1% |
| Dutch | 259 | 0.7% |
| Eastern European | 227 | 0.6% |
| Ecuadorian | 24 | 0.1% |
| English | 7,049 | 18.7% |
| Ethiopian | 36 | 0.1% |
| European | 556 | 1.5% |
| Finnish | 39 | 0.1% |
| French | 1,147 | 3.0% |
| French Canadian | 132 | 0.4% |
| German | 6,829 | 18.1% |
| Greek | 114 | 0.3% |
| Guatemalan | 508 | 1.3% |
| Haitian | 75 | 0.2% |
| Honduran | 215 | 0.6% |
| Hungarian | 67 | 0.2% |
| Icelander | 9 | 0.0% |
| Indian (Asian) | 45 | 0.1% |
| Indonesian | 4 | 0.0% |
| Iranian | 31 | 0.1% |
| Irish | 6,500 | 17.3% |
| Italian | 1,645 | 4.4% |
| Jamaican | 32 | 0.1% |
| Jordanian | 8 | 0.0% |
| Korean | 189 | 0.5% |
| Laotian | 1 | 0.0% |
| Lithuanian | 228 | 0.6% |
| Lumbee | 3 | 0.0% |
| Macedonian | 7 | 0.0% |
| Mexican | 813 | 2.2% |
| Native Hawaiian | 4 | 0.0% |
| Navajo | 11 | 0.0% |
| New Zealander | 12 | 0.0% |
| Nicaraguan | 9 | 0.0% |
| Northern European | 175 | 0.5% |
| Norwegian | 210 | 0.6% |
| Pakistani | 6 | 0.0% |
| Pennsylvania German | 11 | 0.0% |
| Peruvian | 40 | 0.1% |
| Polish | 987 | 2.6% |
| Portuguese | 58 | 0.2% |
| Puerto Rican | 207 | 0.5% |
| Romanian | 91 | 0.2% |
| Russian | 473 | 1.3% |
| Salvadoran | 400 | 1.1% |
| Scandinavian | 89 | 0.2% |
| Scotch-Irish | 485 | 1.3% |
| Scottish | 1,124 | 3.0% |
| Seminole | 23 | 0.1% |
| Serbian | 7 | 0.0% |
| Sierra Leonean | 4 | 0.0% |
| Slovak | 39 | 0.1% |
| Slovene | 19 | 0.1% |
| South American | 168 | 0.4% |
| Spaniard | 72 | 0.2% |
| Spanish | 5 | 0.0% |
| Sri Lankan | 46 | 0.1% |
| Subsaharan African | 160 | 0.4% |
| Swedish | 361 | 1.0% |
| Swiss | 118 | 0.3% |
| Thai | 176 | 0.5% |
| Turkish | 18 | 0.1% |
| Ukrainian | 148 | 0.4% |
| Venezuelan | 46 | 0.1% |
| Welsh | 742 | 2.0% |
| Yugoslavian | 14 | 0.0% | View All 95 Rows |
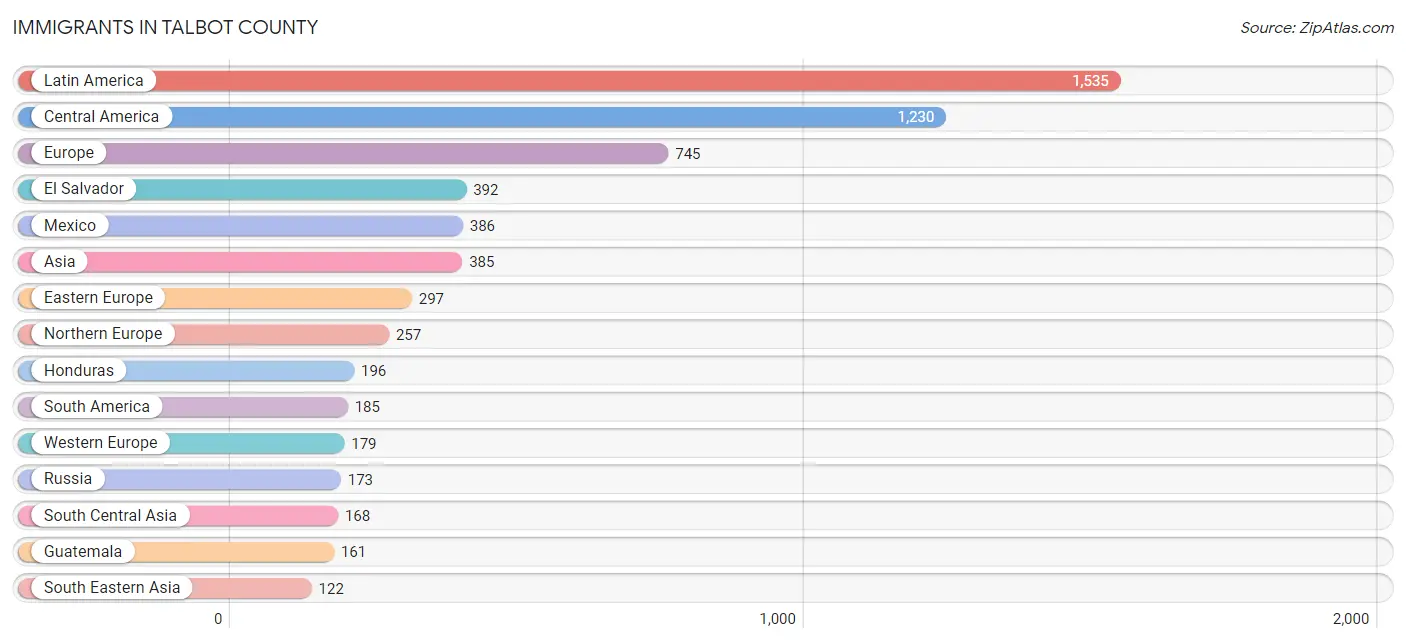
Immigrants in Talbot County
The most numerous immigrant groups reported in Talbot County came from Latin America (1,535 | 4.1%), Central America (1,230 | 3.3%), Europe (745 | 2.0%), El Salvador (392 | 1.0%), and Mexico (386 | 1.0%), together accounting for 11.4% of all Talbot County residents.
| Immigration Origin | # Population | % Population |
| Afghanistan | 10 | 0.0% |
| Africa | 34 | 0.1% |
| Argentina | 34 | 0.1% |
| Asia | 385 | 1.0% |
| Australia | 18 | 0.1% |
| Austria | 11 | 0.0% |
| Bangladesh | 21 | 0.1% |
| Belarus | 5 | 0.0% |
| Belgium | 66 | 0.2% |
| Brazil | 74 | 0.2% |
| Canada | 87 | 0.2% |
| Caribbean | 120 | 0.3% |
| Central America | 1,230 | 3.3% |
| China | 55 | 0.2% |
| Colombia | 7 | 0.0% |
| Costa Rica | 86 | 0.2% |
| Croatia | 7 | 0.0% |
| Cuba | 33 | 0.1% |
| Czechoslovakia | 7 | 0.0% |
| Eastern Africa | 26 | 0.1% |
| Eastern Asia | 87 | 0.2% |
| Eastern Europe | 297 | 0.8% |
| Ecuador | 8 | 0.0% |
| El Salvador | 392 | 1.0% |
| England | 89 | 0.2% |
| Ethiopia | 26 | 0.1% |
| Europe | 745 | 2.0% |
| France | 6 | 0.0% |
| Germany | 96 | 0.3% |
| Guatemala | 161 | 0.4% |
| Haiti | 33 | 0.1% |
| Honduras | 196 | 0.5% |
| Hong Kong | 6 | 0.0% |
| India | 42 | 0.1% |
| Indonesia | 9 | 0.0% |
| Iran | 31 | 0.1% |
| Ireland | 14 | 0.0% |
| Italy | 12 | 0.0% |
| Japan | 21 | 0.1% |
| Jordan | 8 | 0.0% |
| Korea | 11 | 0.0% |
| Latin America | 1,535 | 4.1% |
| Malaysia | 12 | 0.0% |
| Mexico | 386 | 1.0% |
| Nicaragua | 9 | 0.0% |
| Nigeria | 4 | 0.0% |
| North Macedonia | 7 | 0.0% |
| Northern Europe | 257 | 0.7% |
| Norway | 2 | 0.0% |
| Oceania | 24 | 0.1% |
| Pakistan | 64 | 0.2% |
| Peru | 40 | 0.1% |
| Philippines | 72 | 0.2% |
| Poland | 8 | 0.0% |
| Romania | 42 | 0.1% |
| Russia | 173 | 0.5% |
| Scotland | 12 | 0.0% |
| Sierra Leone | 4 | 0.0% |
| South America | 185 | 0.5% |
| South Central Asia | 168 | 0.4% |
| South Eastern Asia | 122 | 0.3% |
| Southern Europe | 12 | 0.0% |
| Sweden | 55 | 0.2% |
| Thailand | 6 | 0.0% |
| Trinidad and Tobago | 11 | 0.0% |
| Ukraine | 48 | 0.1% |
| Venezuela | 22 | 0.1% |
| Vietnam | 21 | 0.1% |
| Western Africa | 8 | 0.0% |
| Western Asia | 8 | 0.0% |
| Western Europe | 179 | 0.5% | View All 71 Rows |
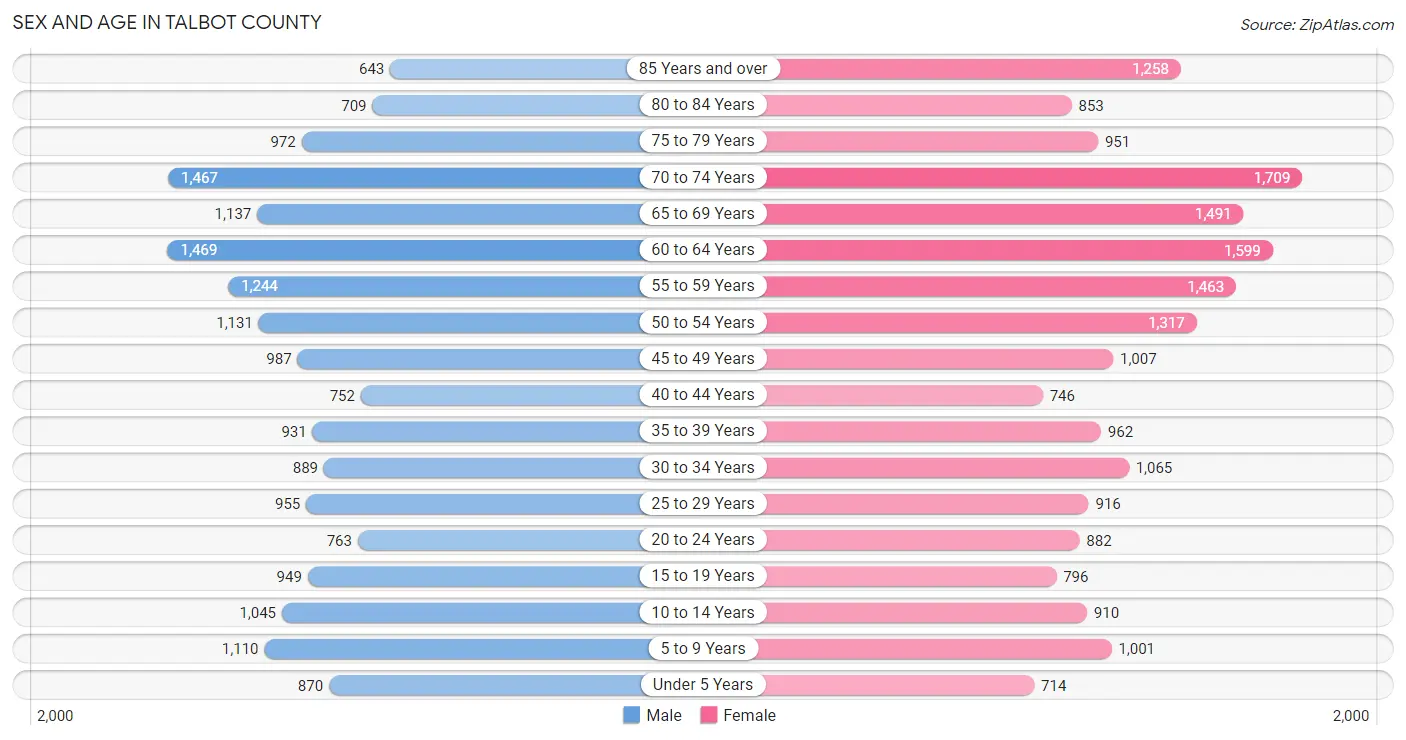
Sex and Age in Talbot County
Sex and Age in Talbot County
The most populous age groups in Talbot County are 60 to 64 Years (1,469 | 8.2%) for men and 70 to 74 Years (1,709 | 8.7%) for women.
| Age Bracket | Male | Female |
| Under 5 Years | 870 (4.8%) | 714 (3.6%) |
| 5 to 9 Years | 1,110 (6.2%) | 1,001 (5.1%) |
| 10 to 14 Years | 1,045 (5.8%) | 910 (4.6%) |
| 15 to 19 Years | 949 (5.3%) | 796 (4.1%) |
| 20 to 24 Years | 763 (4.2%) | 882 (4.5%) |
| 25 to 29 Years | 955 (5.3%) | 916 (4.7%) |
| 30 to 34 Years | 889 (4.9%) | 1,065 (5.4%) |
| 35 to 39 Years | 931 (5.2%) | 962 (4.9%) |
| 40 to 44 Years | 752 (4.2%) | 746 (3.8%) |
| 45 to 49 Years | 987 (5.5%) | 1,007 (5.1%) |
| 50 to 54 Years | 1,131 (6.3%) | 1,317 (6.7%) |
| 55 to 59 Years | 1,244 (6.9%) | 1,463 (7.4%) |
| 60 to 64 Years | 1,469 (8.2%) | 1,599 (8.1%) |
| 65 to 69 Years | 1,137 (6.3%) | 1,491 (7.6%) |
| 70 to 74 Years | 1,467 (8.1%) | 1,709 (8.7%) |
| 75 to 79 Years | 972 (5.4%) | 951 (4.8%) |
| 80 to 84 Years | 709 (3.9%) | 853 (4.3%) |
| 85 Years and over | 643 (3.6%) | 1,258 (6.4%) |
| Total | 18,023 (100.0%) | 19,640 (100.0%) |
Families and Households in Talbot County
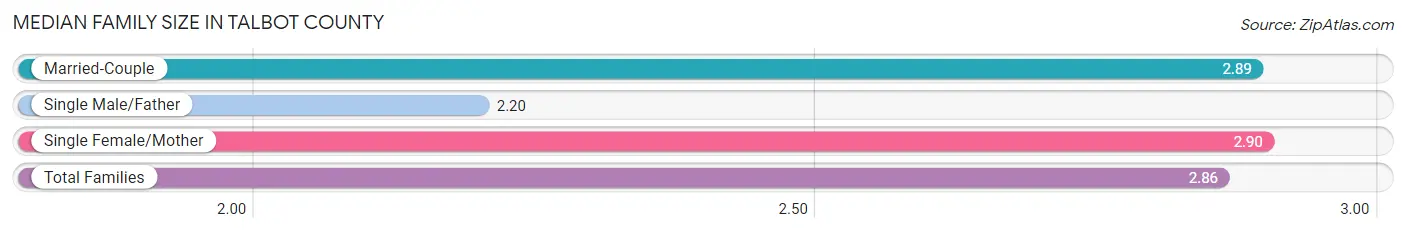
Median Family Size in Talbot County
The median family size in Talbot County is 2.86 persons per family, with single female/mother families (1,755 | 17.4%) accounting for the largest median family size of 2.9 persons per family. On the other hand, single male/father families (466 | 4.6%) represent the smallest median family size with 2.20 persons per family.
| Family Type | # Families | Family Size |
| Married-Couple | 7,877 (78.0%) | 2.89 |
| Single Male/Father | 466 (4.6%) | 2.20 |
| Single Female/Mother | 1,755 (17.4%) | 2.90 |
| Total Families | 10,098 (100.0%) | 2.86 |
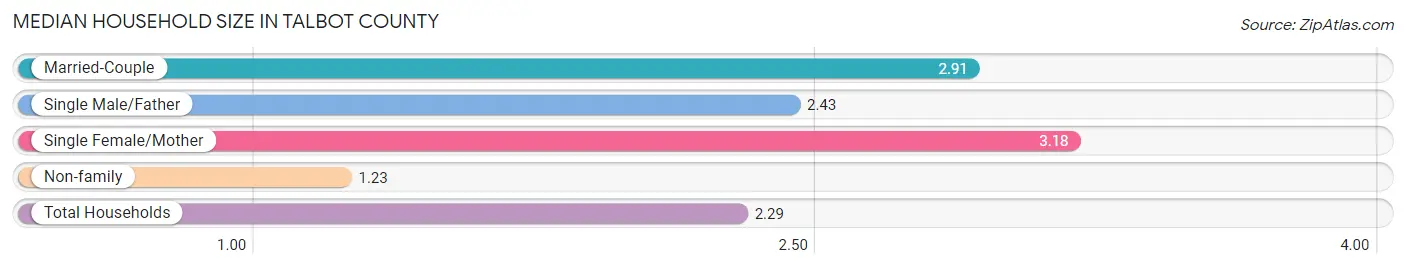
Median Household Size in Talbot County
The median household size in Talbot County is 2.29 persons per household, with single female/mother households (1,755 | 10.8%) accounting for the largest median household size of 3.18 persons per household. non-family households (6,172 | 37.9%) represent the smallest median household size with 1.23 persons per household.
| Household Type | # Households | Household Size |
| Married-Couple | 7,877 (48.4%) | 2.91 |
| Single Male/Father | 466 (2.9%) | 2.43 |
| Single Female/Mother | 1,755 (10.8%) | 3.18 |
| Non-family | 6,172 (37.9%) | 1.23 |
| Total Households | 16,270 (100.0%) | 2.29 |
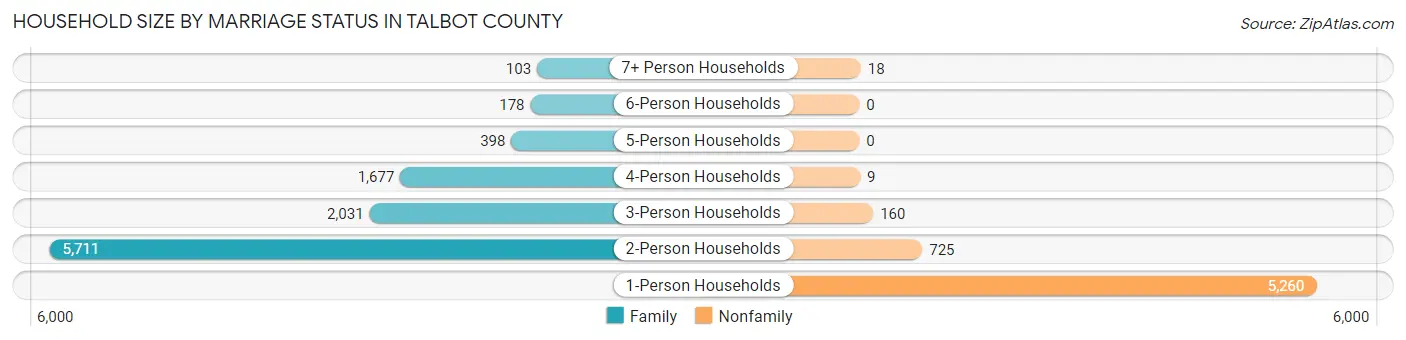
Household Size by Marriage Status in Talbot County
Out of a total of 16,270 households in Talbot County, 10,098 (62.1%) are family households, while 6,172 (37.9%) are nonfamily households. The most numerous type of family households are 2-person households, comprising 5,711, and the most common type of nonfamily households are 1-person households, comprising 5,260.
| Household Size | Family Households | Nonfamily Households |
| 1-Person Households | - | 5,260 (32.3%) |
| 2-Person Households | 5,711 (35.1%) | 725 (4.5%) |
| 3-Person Households | 2,031 (12.5%) | 160 (1.0%) |
| 4-Person Households | 1,677 (10.3%) | 9 (0.1%) |
| 5-Person Households | 398 (2.5%) | 0 (0.0%) |
| 6-Person Households | 178 (1.1%) | 0 (0.0%) |
| 7+ Person Households | 103 (0.6%) | 18 (0.1%) |
| Total | 10,098 (62.1%) | 6,172 (37.9%) |
Female Fertility in Talbot County
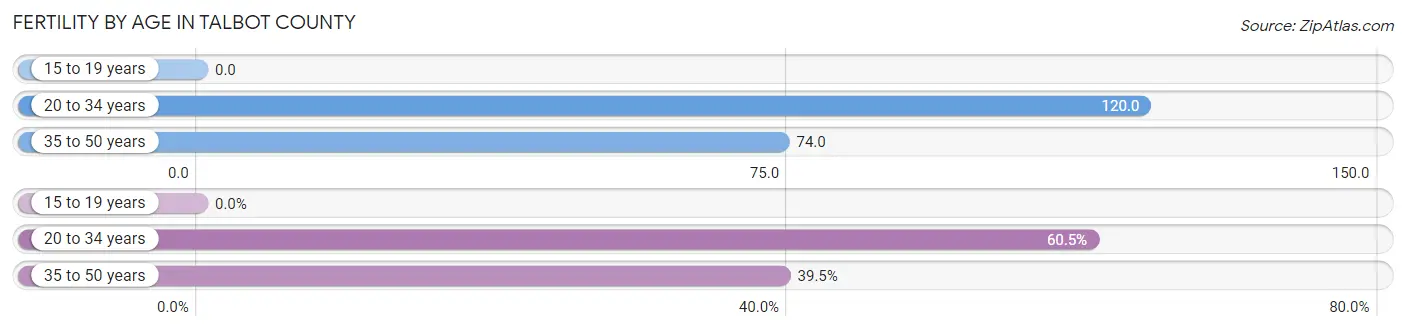
Fertility by Age in Talbot County
Average fertility rate in Talbot County is 85.0 births per 1,000 women. Women in the age bracket of 20 to 34 years have the highest fertility rate with 120.0 births per 1,000 women. Women in the age bracket of 20 to 34 years acount for 60.5% of all women with births.
| Age Bracket | Women with Births | Births / 1,000 Women |
| 15 to 19 years | 0 (0.0%) | 0.0 |
| 20 to 34 years | 344 (60.5%) | 120.0 |
| 35 to 50 years | 225 (39.5%) | 74.0 |
| Total | 569 (100.0%) | 85.0 |
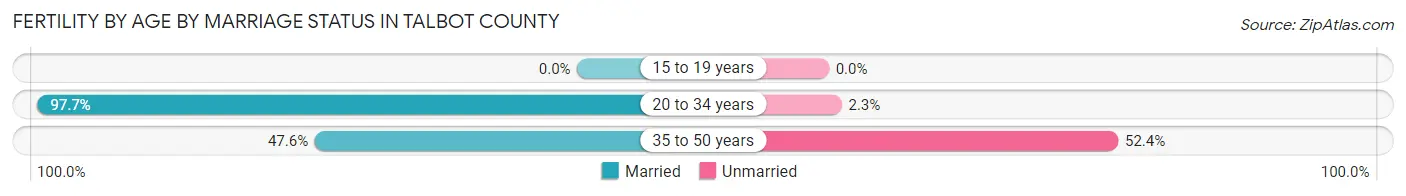
Fertility by Age by Marriage Status in Talbot County
77.9% of women with births (569) in Talbot County are married. The highest percentage of unmarried women with births falls into 35 to 50 years age bracket with 52.4% of them unmarried at the time of birth, while the lowest percentage of unmarried women with births belong to 20 to 34 years age bracket with 2.3% of them unmarried.
| Age Bracket | Married | Unmarried |
| 15 to 19 years | 0 (0.0%) | 0 (0.0%) |
| 20 to 34 years | 336 (97.7%) | 8 (2.3%) |
| 35 to 50 years | 107 (47.6%) | 118 (52.4%) |
| Total | 443 (77.9%) | 126 (22.1%) |
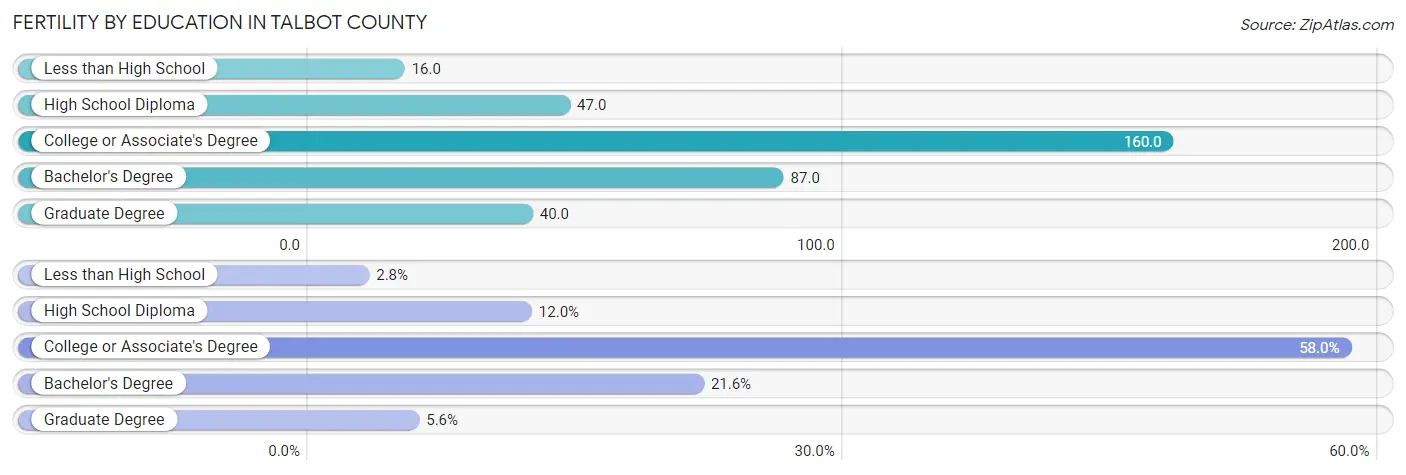
Fertility by Education in Talbot County
Average fertility rate in Talbot County is 85.0 births per 1,000 women. Women with the education attainment of college or associate's degree have the highest fertility rate of 160.0 births per 1,000 women, while women with the education attainment of less than high school have the lowest fertility at 16.0 births per 1,000 women. Women with the education attainment of college or associate's degree represent 58.0% of all women with births.
| Educational Attainment | Women with Births | Births / 1,000 Women |
| Less than High School | 16 (2.8%) | 16.0 |
| High School Diploma | 68 (11.9%) | 47.0 |
| College or Associate's Degree | 330 (58.0%) | 160.0 |
| Bachelor's Degree | 123 (21.6%) | 87.0 |
| Graduate Degree | 32 (5.6%) | 40.0 |
| Total | 569 (100.0%) | 85.0 |
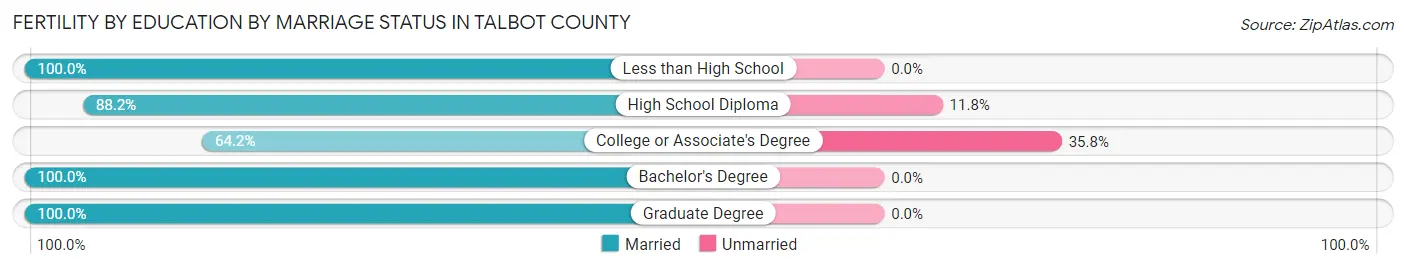
Fertility by Education by Marriage Status in Talbot County
22.1% of women with births in Talbot County are unmarried. Women with the educational attainment of less than high school are most likely to be married with 100.0% of them married at childbirth, while women with the educational attainment of college or associate's degree are least likely to be married with 35.8% of them unmarried at childbirth.
| Educational Attainment | Married | Unmarried |
| Less than High School | 16 (100.0%) | 0 (0.0%) |
| High School Diploma | 60 (88.2%) | 8 (11.8%) |
| College or Associate's Degree | 212 (64.2%) | 118 (35.8%) |
| Bachelor's Degree | 123 (100.0%) | 0 (0.0%) |
| Graduate Degree | 32 (100.0%) | 0 (0.0%) |
| Total | 443 (77.9%) | 126 (22.1%) |
Income in Talbot County
Income Overview in Talbot County
Per Capita Income in Talbot County is $52,555, while median incomes of families and households are $100,321 and $81,667 respectively.
| Characteristic | Number | Measure |
| Per Capita Income | 37,663 | $52,555 |
| Median Family Income | 10,098 | $100,321 |
| Mean Family Income | 10,098 | $145,320 |
| Median Household Income | 16,270 | $81,667 |
| Mean Household Income | 16,270 | $119,018 |
| Income Deficit | 10,098 | $8,997 |
| Wage / Income Gap (%) | 37,663 | 24.53% |
| Wage / Income Gap ($) | 37,663 | 75.47¢ per $1 |
| Gini / Inequality Index | 37,663 | 0.50 |
Earnings by Sex in Talbot County
Average Earnings in Talbot County are $44,991, $51,591 for men and $38,938 for women, a difference of 24.5%.
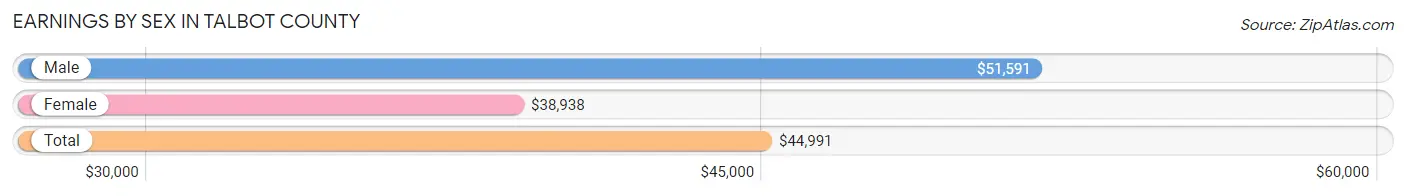
| Sex | Number | Average Earnings |
| Male | 9,890 (52.7%) | $51,591 |
| Female | 8,873 (47.3%) | $38,938 |
| Total | 18,763 (100.0%) | $44,991 |
Earnings by Sex by Income Bracket in Talbot County
The most common earnings brackets in Talbot County are $100,000+ for men (2,189 | 22.1%) and $100,000+ for women (1,059 | 11.9%).
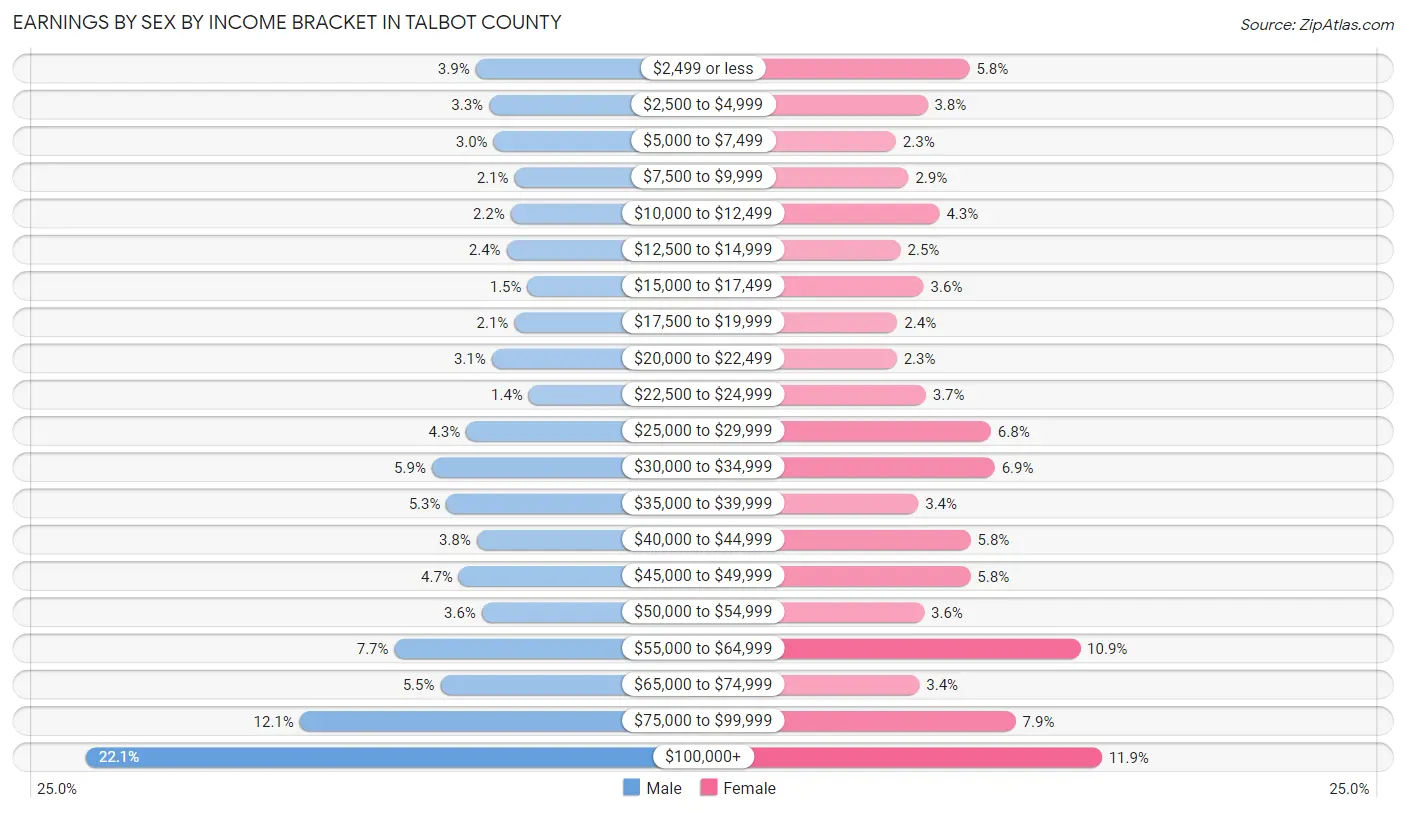
| Income | Male | Female |
| $2,499 or less | 384 (3.9%) | 510 (5.8%) |
| $2,500 to $4,999 | 321 (3.3%) | 335 (3.8%) |
| $5,000 to $7,499 | 301 (3.0%) | 204 (2.3%) |
| $7,500 to $9,999 | 204 (2.1%) | 256 (2.9%) |
| $10,000 to $12,499 | 222 (2.2%) | 385 (4.3%) |
| $12,500 to $14,999 | 240 (2.4%) | 224 (2.5%) |
| $15,000 to $17,499 | 143 (1.5%) | 319 (3.6%) |
| $17,500 to $19,999 | 205 (2.1%) | 210 (2.4%) |
| $20,000 to $22,499 | 310 (3.1%) | 208 (2.3%) |
| $22,500 to $24,999 | 137 (1.4%) | 328 (3.7%) |
| $25,000 to $29,999 | 427 (4.3%) | 599 (6.8%) |
| $30,000 to $34,999 | 586 (5.9%) | 615 (6.9%) |
| $35,000 to $39,999 | 519 (5.2%) | 297 (3.4%) |
| $40,000 to $44,999 | 379 (3.8%) | 515 (5.8%) |
| $45,000 to $49,999 | 462 (4.7%) | 514 (5.8%) |
| $50,000 to $54,999 | 355 (3.6%) | 321 (3.6%) |
| $55,000 to $64,999 | 760 (7.7%) | 970 (10.9%) |
| $65,000 to $74,999 | 547 (5.5%) | 302 (3.4%) |
| $75,000 to $99,999 | 1,199 (12.1%) | 702 (7.9%) |
| $100,000+ | 2,189 (22.1%) | 1,059 (11.9%) |
| Total | 9,890 (100.0%) | 8,873 (100.0%) |
Earnings by Sex by Educational Attainment in Talbot County
Average earnings in Talbot County are $57,567 for men and $42,675 for women, a difference of 25.9%. Men with an educational attainment of graduate degree enjoy the highest average annual earnings of $110,430, while those with less than high school education earn the least with $38,029. Women with an educational attainment of graduate degree earn the most with the average annual earnings of $88,104, while those with less than high school education have the smallest earnings of $12,136.
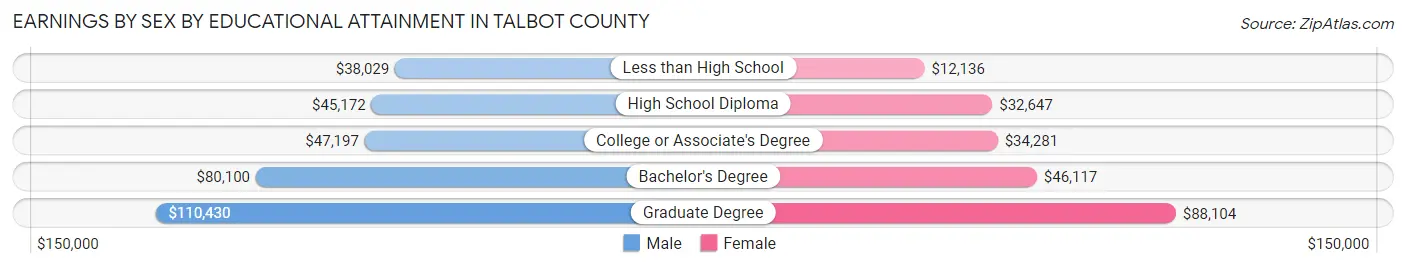
| Educational Attainment | Male Income | Female Income |
| Less than High School | $38,029 | $12,136 |
| High School Diploma | $45,172 | $32,647 |
| College or Associate's Degree | $47,197 | $34,281 |
| Bachelor's Degree | $80,100 | $46,117 |
| Graduate Degree | $110,430 | $88,104 |
| Total | $57,567 | $42,675 |
Family Income in Talbot County
Family Income Brackets in Talbot County
According to the Talbot County family income data, there are 2,080 families falling into the $200,000+ income range, which is the most common income bracket and makes up 20.6% of all families. Conversely, the less than $10,000 income bracket is the least frequent group with only 192 families (1.9%) belonging to this category.
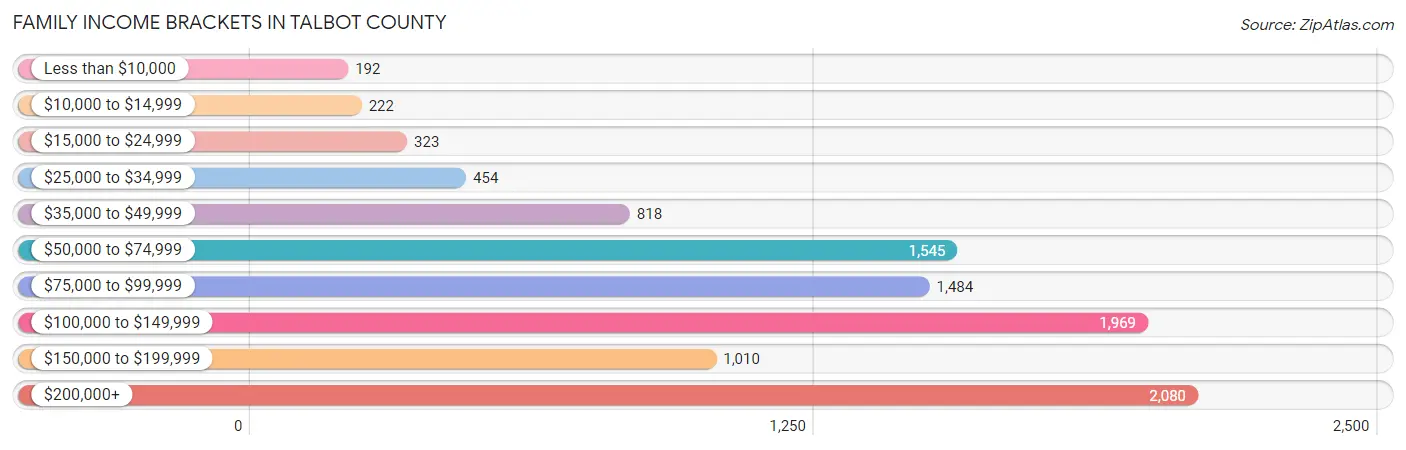
| Income Bracket | # Families | % Families |
| Less than $10,000 | 192 | 1.9% |
| $10,000 to $14,999 | 222 | 2.2% |
| $15,000 to $24,999 | 323 | 3.2% |
| $25,000 to $34,999 | 454 | 4.5% |
| $35,000 to $49,999 | 818 | 8.1% |
| $50,000 to $74,999 | 1,545 | 15.3% |
| $75,000 to $99,999 | 1,484 | 14.7% |
| $100,000 to $149,999 | 1,969 | 19.5% |
| $150,000 to $199,999 | 1,010 | 10.0% |
| $200,000+ | 2,080 | 20.6% |
Family Income by Famaliy Size in Talbot County
7+ person families (84 | 0.8%) account for the highest median family income in Talbot County with $225,556 per family, while 2-person families (6,034 | 59.8%) have the highest median income of $46,525 per family member.
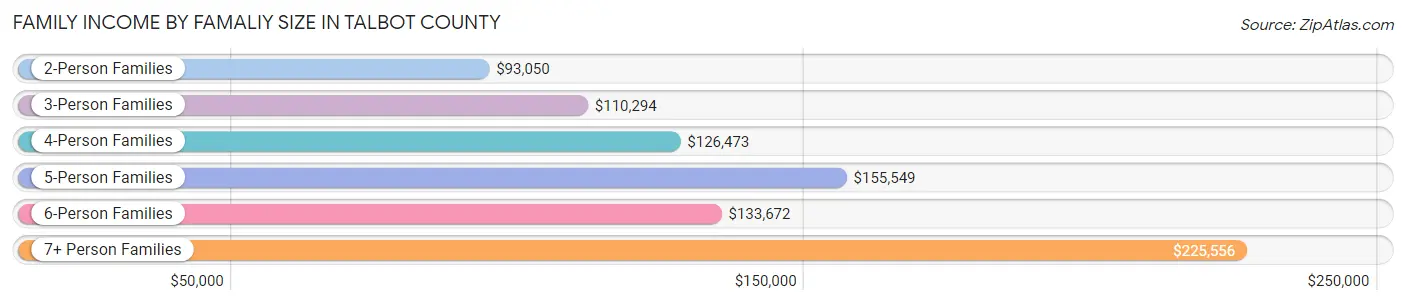
| Income Bracket | # Families | Median Income |
| 2-Person Families | 6,034 (59.8%) | $93,050 |
| 3-Person Families | 1,988 (19.7%) | $110,294 |
| 4-Person Families | 1,434 (14.2%) | $126,473 |
| 5-Person Families | 397 (3.9%) | $155,549 |
| 6-Person Families | 161 (1.6%) | $133,672 |
| 7+ Person Families | 84 (0.8%) | $225,556 |
| Total | 10,098 (100.0%) | $100,321 |
Family Income by Number of Earners in Talbot County
The median family income in Talbot County is $100,321, with families comprising 3+ earners (782) having the highest median family income of $166,477, while families with 1 earner (3,092) have the lowest median family income of $73,864, accounting for 7.7% and 30.6% of families, respectively.
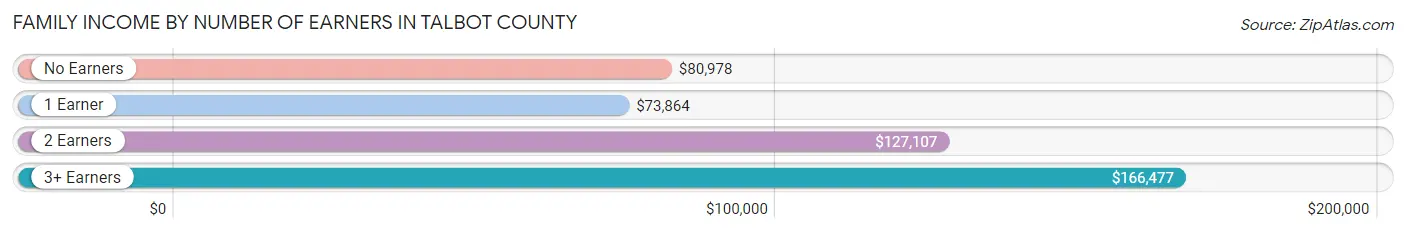
| Number of Earners | # Families | Median Income |
| No Earners | 2,416 (23.9%) | $80,978 |
| 1 Earner | 3,092 (30.6%) | $73,864 |
| 2 Earners | 3,808 (37.7%) | $127,107 |
| 3+ Earners | 782 (7.7%) | $166,477 |
| Total | 10,098 (100.0%) | $100,321 |
Household Income in Talbot County
Household Income Brackets in Talbot County
With 2,619 households falling in the category, the $100,000 to $149,999 income range is the most frequent in Talbot County, accounting for 16.1% of all households. In contrast, only 407 households (2.5%) fall into the $10,000 to $14,999 income bracket, making it the least populous group.
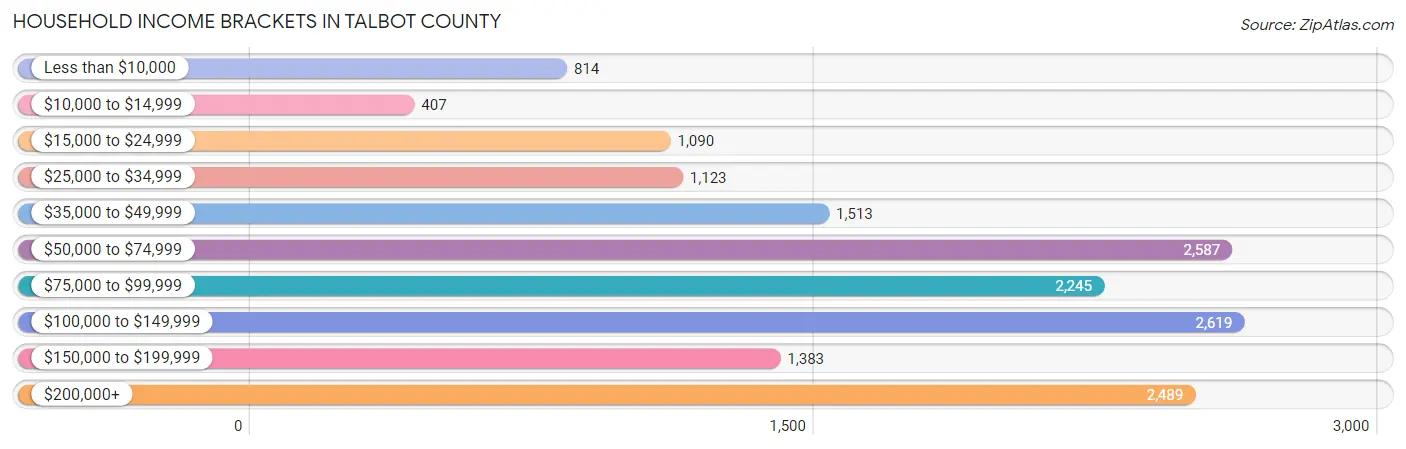
| Income Bracket | # Households | % Households |
| Less than $10,000 | 814 | 5.0% |
| $10,000 to $14,999 | 407 | 2.5% |
| $15,000 to $24,999 | 1,090 | 6.7% |
| $25,000 to $34,999 | 1,123 | 6.9% |
| $35,000 to $49,999 | 1,513 | 9.3% |
| $50,000 to $74,999 | 2,587 | 15.9% |
| $75,000 to $99,999 | 2,245 | 13.8% |
| $100,000 to $149,999 | 2,619 | 16.1% |
| $150,000 to $199,999 | 1,383 | 8.5% |
| $200,000+ | 2,489 | 15.3% |
Household Income by Householder Age in Talbot County
The median household income in Talbot County is $81,667, with the highest median household income of $89,212 found in the 25 to 44 years age bracket for the primary householder. A total of 3,173 households (19.5%) fall into this category. Meanwhile, the 15 to 24 years age bracket for the primary householder has the lowest median household income of $0, with 189 households (1.2%) in this group.
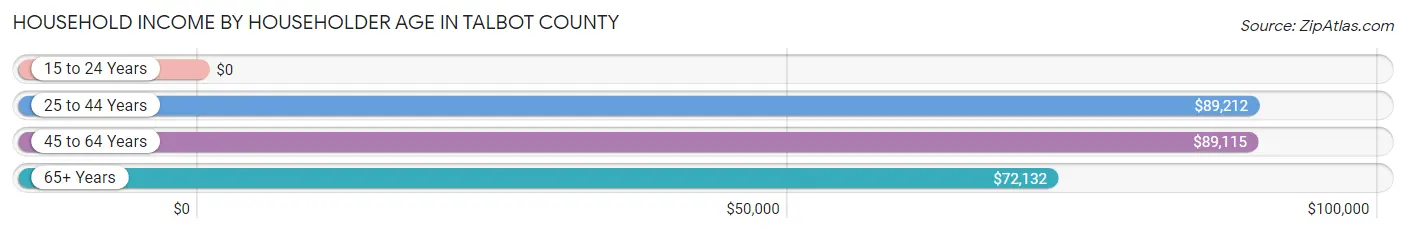
| Income Bracket | # Households | Median Income |
| 15 to 24 Years | 189 (1.2%) | $0 |
| 25 to 44 Years | 3,173 (19.5%) | $89,212 |
| 45 to 64 Years | 5,897 (36.2%) | $89,115 |
| 65+ Years | 7,011 (43.1%) | $72,132 |
| Total | 16,270 (100.0%) | $81,667 |
Poverty in Talbot County
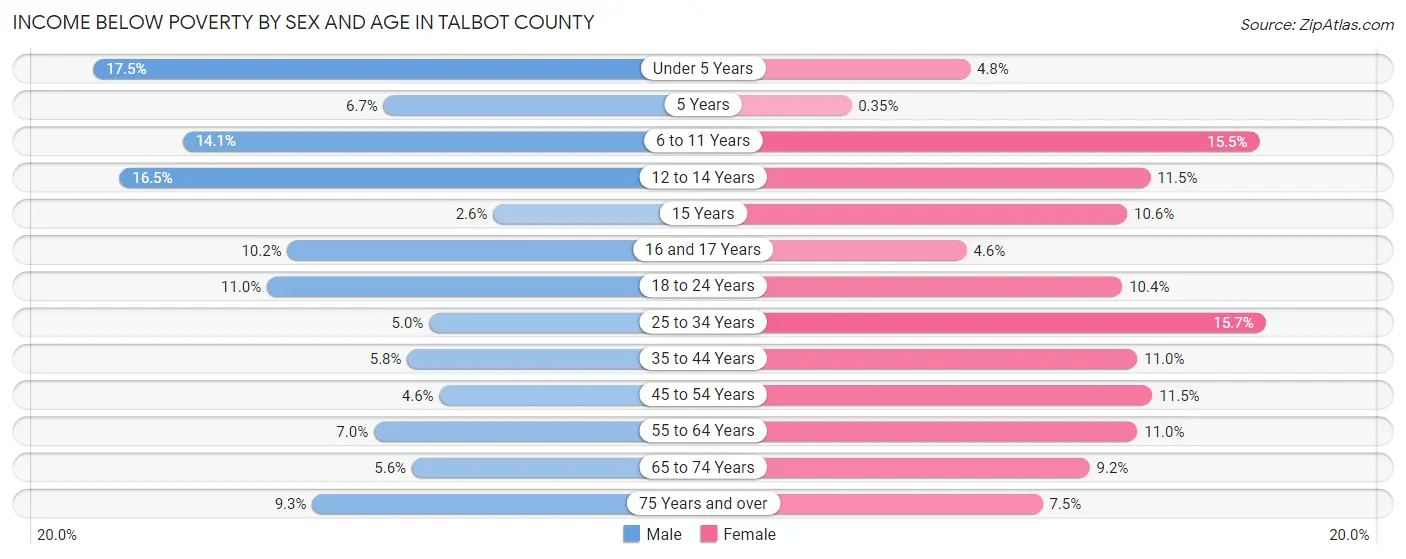
Income Below Poverty by Sex and Age in Talbot County
With 8.1% poverty level for males and 10.4% for females among the residents of Talbot County, under 5 year old males and 25 to 34 year old females are the most vulnerable to poverty, with 148 males (17.4%) and 311 females (15.7%) in their respective age groups living below the poverty level.
| Age Bracket | Male | Female |
| Under 5 Years | 148 (17.4%) | 34 (4.8%) |
| 5 Years | 9 (6.7%) | 1 (0.4%) |
| 6 to 11 Years | 220 (14.1%) | 159 (15.5%) |
| 12 to 14 Years | 75 (16.5%) | 57 (11.5%) |
| 15 Years | 5 (2.6%) | 18 (10.6%) |
| 16 and 17 Years | 43 (10.2%) | 20 (4.6%) |
| 18 to 24 Years | 120 (11.0%) | 112 (10.4%) |
| 25 to 34 Years | 91 (5.0%) | 311 (15.7%) |
| 35 to 44 Years | 96 (5.8%) | 187 (11.0%) |
| 45 to 54 Years | 97 (4.6%) | 267 (11.5%) |
| 55 to 64 Years | 190 (7.0%) | 334 (11.0%) |
| 65 to 74 Years | 145 (5.6%) | 293 (9.2%) |
| 75 Years and over | 214 (9.3%) | 214 (7.4%) |
| Total | 1,453 (8.1%) | 2,007 (10.4%) |
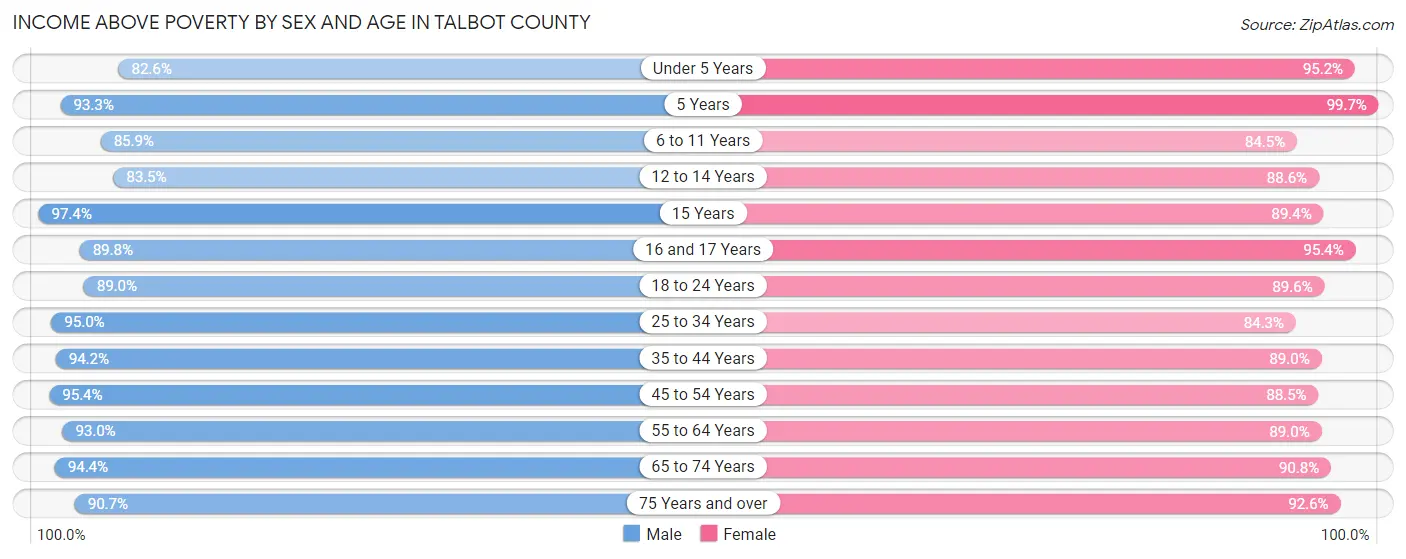
Income Above Poverty by Sex and Age in Talbot County
According to the poverty statistics in Talbot County, males aged 15 years and females aged 5 years are the age groups that are most secure financially, with 97.4% of males and 99.7% of females in these age groups living above the poverty line.
| Age Bracket | Male | Female |
| Under 5 Years | 700 (82.6%) | 680 (95.2%) |
| 5 Years | 126 (93.3%) | 288 (99.7%) |
| 6 to 11 Years | 1,337 (85.9%) | 867 (84.5%) |
| 12 to 14 Years | 380 (83.5%) | 441 (88.5%) |
| 15 Years | 187 (97.4%) | 152 (89.4%) |
| 16 and 17 Years | 377 (89.8%) | 412 (95.4%) |
| 18 to 24 Years | 971 (89.0%) | 964 (89.6%) |
| 25 to 34 Years | 1,737 (95.0%) | 1,666 (84.3%) |
| 35 to 44 Years | 1,563 (94.2%) | 1,518 (89.0%) |
| 45 to 54 Years | 2,013 (95.4%) | 2,049 (88.5%) |
| 55 to 64 Years | 2,512 (93.0%) | 2,710 (89.0%) |
| 65 to 74 Years | 2,434 (94.4%) | 2,891 (90.8%) |
| 75 Years and over | 2,083 (90.7%) | 2,657 (92.5%) |
| Total | 16,420 (91.9%) | 17,295 (89.6%) |
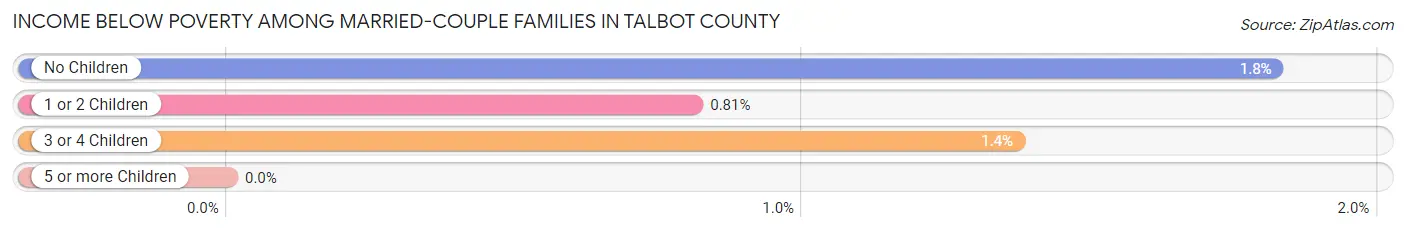
Income Below Poverty Among Married-Couple Families in Talbot County
The poverty statistics for married-couple families in Talbot County show that 1.5% or 122 of the total 7,877 families live below the poverty line. Families with no children have the highest poverty rate of 1.8%, comprising of 101 families. On the other hand, families with 5 or more children have the lowest poverty rate of 0.0%, which includes 0 families.
| Children | Above Poverty | Below Poverty |
| No Children | 5,456 (98.2%) | 101 (1.8%) |
| 1 or 2 Children | 1,839 (99.2%) | 15 (0.8%) |
| 3 or 4 Children | 431 (98.6%) | 6 (1.4%) |
| 5 or more Children | 29 (100.0%) | 0 (0.0%) |
| Total | 7,755 (98.5%) | 122 (1.5%) |
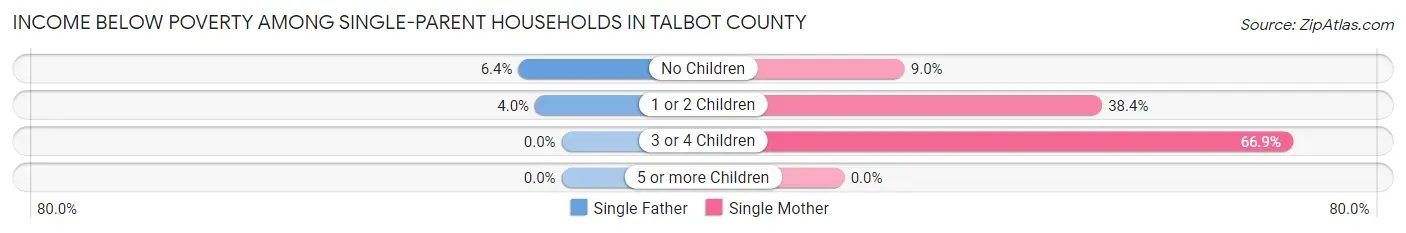
Income Below Poverty Among Single-Parent Households in Talbot County
According to the poverty data in Talbot County, 4.9% or 23 single-father households and 28.0% or 491 single-mother households are living below the poverty line. Among single-father households, those with no children have the highest poverty rate, with 13 households (6.4%) experiencing poverty. Likewise, among single-mother households, those with 3 or 4 children have the highest poverty rate, with 87 households (66.9%) falling below the poverty line.
| Children | Single Father | Single Mother |
| No Children | 13 (6.4%) | 67 (9.0%) |
| 1 or 2 Children | 10 (4.0%) | 337 (38.4%) |
| 3 or 4 Children | 0 (0.0%) | 87 (66.9%) |
| 5 or more Children | 0 (0.0%) | 0 (0.0%) |
| Total | 23 (4.9%) | 491 (28.0%) |
Income Below Poverty Among Married-Couple vs Single-Parent Households in Talbot County
The poverty data for Talbot County shows that 122 of the married-couple family households (1.5%) and 514 of the single-parent households (23.1%) are living below the poverty level. Within the married-couple family households, those with no children have the highest poverty rate, with 101 households (1.8%) falling below the poverty line. Among the single-parent households, those with 3 or 4 children have the highest poverty rate, with 87 household (61.7%) living below poverty.
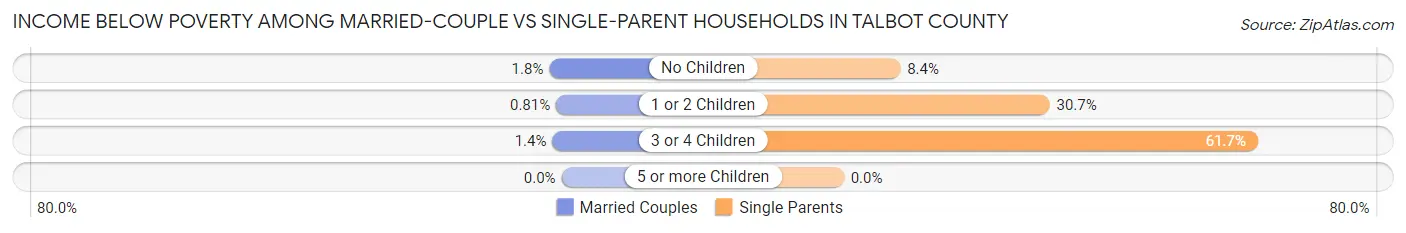
| Children | Married-Couple Families | Single-Parent Households |
| No Children | 101 (1.8%) | 80 (8.4%) |
| 1 or 2 Children | 15 (0.8%) | 347 (30.7%) |
| 3 or 4 Children | 6 (1.4%) | 87 (61.7%) |
| 5 or more Children | 0 (0.0%) | 0 (0.0%) |
| Total | 122 (1.5%) | 514 (23.1%) |
Employment Characteristics in Talbot County
Employment by Class of Employer in Talbot County
Among the 16,883 employed individuals in Talbot County, private company employees (9,655 | 57.2%), not-for-profit organizations (1,756 | 10.4%), and self-employed (not incorporated) (1,737 | 10.3%) make up the most common classes of employment.
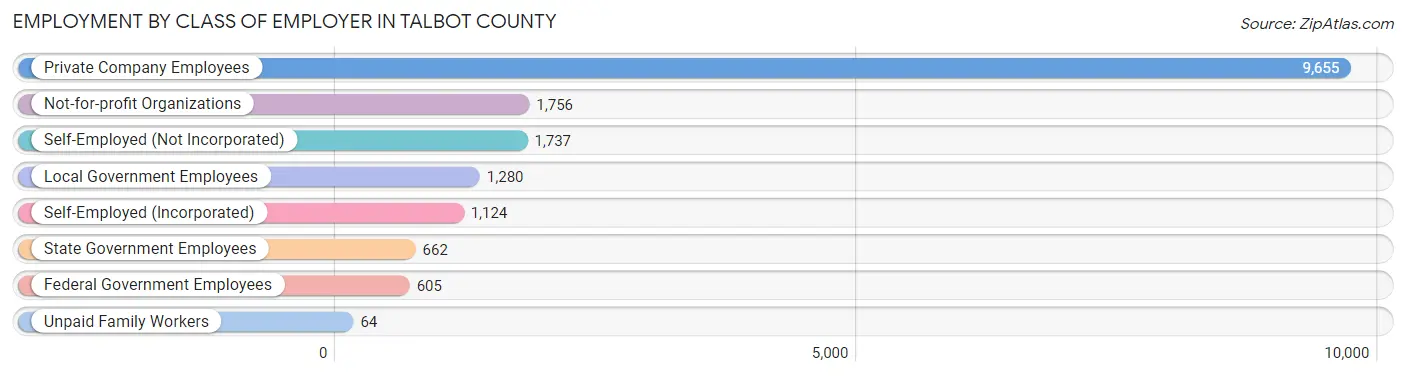
| Employer Class | # Employees | % Employees |
| Private Company Employees | 9,655 | 57.2% |
| Self-Employed (Incorporated) | 1,124 | 6.7% |
| Self-Employed (Not Incorporated) | 1,737 | 10.3% |
| Not-for-profit Organizations | 1,756 | 10.4% |
| Local Government Employees | 1,280 | 7.6% |
| State Government Employees | 662 | 3.9% |
| Federal Government Employees | 605 | 3.6% |
| Unpaid Family Workers | 64 | 0.4% |
| Total | 16,883 | 100.0% |
Employment Status by Age in Talbot County
According to the labor force statistics for Talbot County, out of the total population over 16 years of age (31,651), 55.8% or 17,661 individuals are in the labor force, with 3.2% or 565 of them unemployed. The age group with the highest labor force participation rate is 35 to 44 years, with 85.5% or 2,899 individuals in the labor force. Within the labor force, the 16 to 19 years age range has the highest percentage of unemployed individuals, with 7.9% or 54 of them being unemployed.
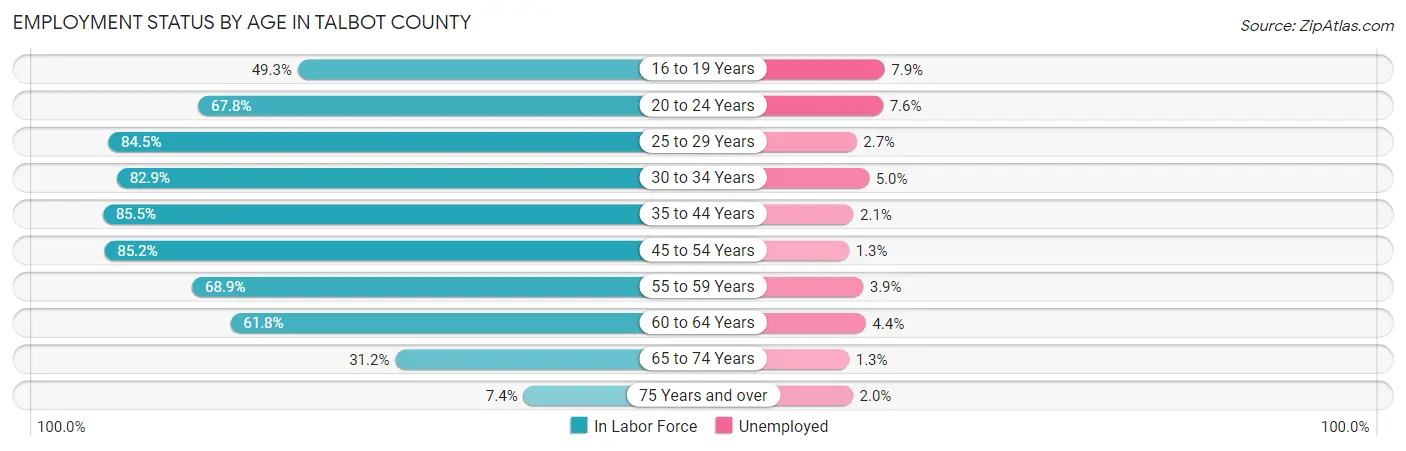
| Age Bracket | In Labor Force | Unemployed |
| 16 to 19 Years | 682 (49.3%) | 54 (7.9%) |
| 20 to 24 Years | 1,115 (67.8%) | 85 (7.6%) |
| 25 to 29 Years | 1,581 (84.5%) | 43 (2.7%) |
| 30 to 34 Years | 1,620 (82.9%) | 81 (5.0%) |
| 35 to 44 Years | 2,899 (85.5%) | 61 (2.1%) |
| 45 to 54 Years | 3,785 (85.2%) | 49 (1.3%) |
| 55 to 59 Years | 1,865 (68.9%) | 73 (3.9%) |
| 60 to 64 Years | 1,896 (61.8%) | 83 (4.4%) |
| 65 to 74 Years | 1,811 (31.2%) | 24 (1.3%) |
| 75 Years and over | 399 (7.4%) | 8 (2.0%) |
| Total | 17,661 (55.8%) | 565 (3.2%) |
Employment Status by Educational Attainment in Talbot County
According to labor force statistics for Talbot County, 78.3% of individuals (13,650) out of the total population between 25 and 64 years of age (17,433) are in the labor force, with 2.9% or 396 of them being unemployed. The group with the highest labor force participation rate are those with the educational attainment of bachelor's degree or higher, with 81.3% or 5,520 individuals in the labor force. Within the labor force, individuals with high school diploma education have the highest percentage of unemployment, with 5.1% or 154 of them being unemployed.
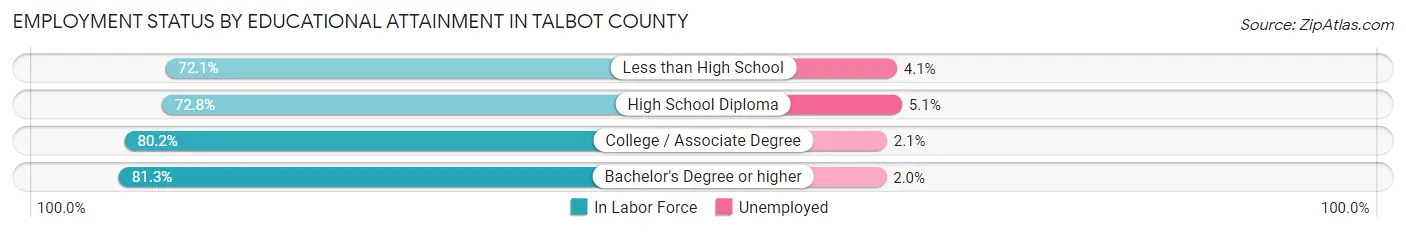
| Educational Attainment | In Labor Force | Unemployed |
| Less than High School | 924 (72.1%) | 53 (4.1%) |
| High School Diploma | 3,010 (72.8%) | 211 (5.1%) |
| College / Associate Degree | 4,193 (80.2%) | 110 (2.1%) |
| Bachelor's Degree or higher | 5,520 (81.3%) | 136 (2.0%) |
| Total | 13,650 (78.3%) | 506 (2.9%) |
Employment Occupations by Sex in Talbot County
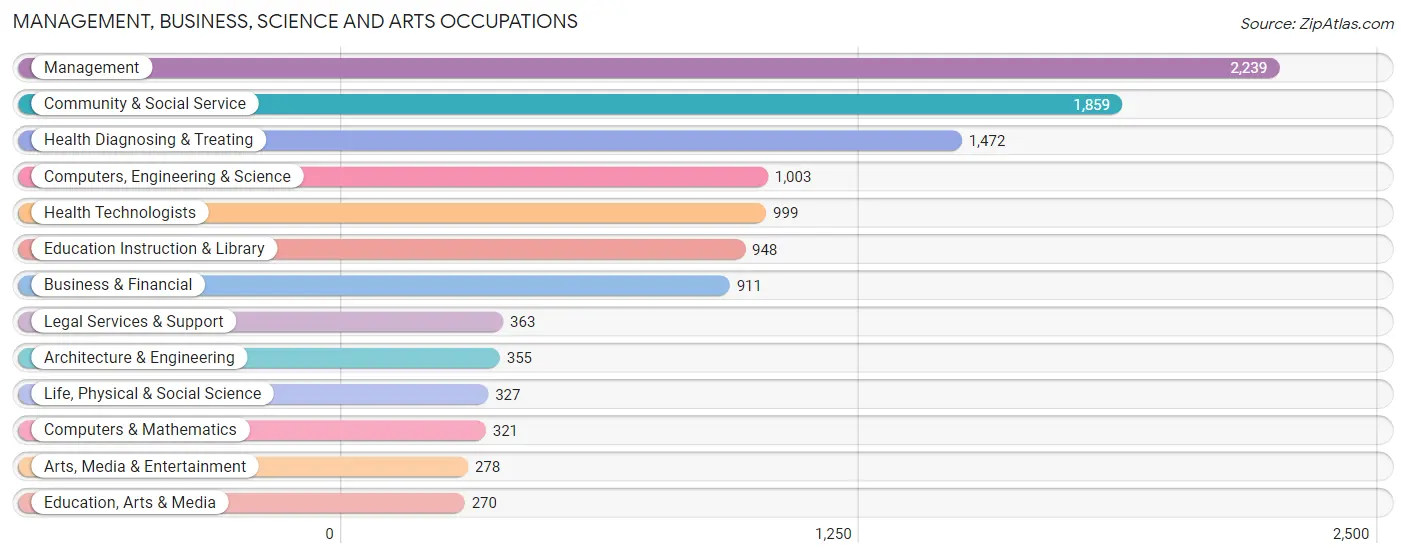
Management, Business, Science and Arts Occupations
The most common Management, Business, Science and Arts occupations in Talbot County are Management (2,239 | 13.1%), Community & Social Service (1,859 | 10.9%), Health Diagnosing & Treating (1,472 | 8.6%), Computers, Engineering & Science (1,003 | 5.9%), and Health Technologists (999 | 5.9%).
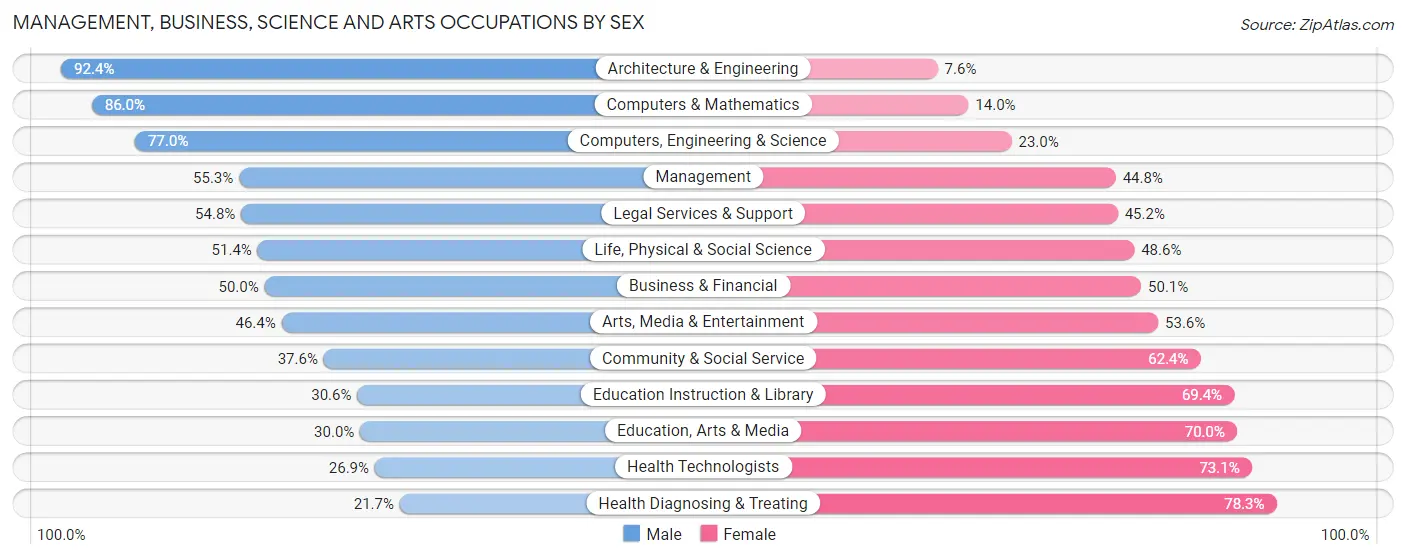
Management, Business, Science and Arts Occupations by Sex
Within the Management, Business, Science and Arts occupations in Talbot County, the most male-oriented occupations are Architecture & Engineering (92.4%), Computers & Mathematics (86.0%), and Computers, Engineering & Science (77.0%), while the most female-oriented occupations are Health Diagnosing & Treating (78.3%), Health Technologists (73.1%), and Education, Arts & Media (70.0%).
| Occupation | Male | Female |
| Management | 1,237 (55.2%) | 1,002 (44.8%) |
| Business & Financial | 455 (49.9%) | 456 (50.0%) |
| Computers, Engineering & Science | 772 (77.0%) | 231 (23.0%) |
| Computers & Mathematics | 276 (86.0%) | 45 (14.0%) |
| Architecture & Engineering | 328 (92.4%) | 27 (7.6%) |
| Life, Physical & Social Science | 168 (51.4%) | 159 (48.6%) |
| Community & Social Service | 699 (37.6%) | 1,160 (62.4%) |
| Education, Arts & Media | 81 (30.0%) | 189 (70.0%) |
| Legal Services & Support | 199 (54.8%) | 164 (45.2%) |
| Education Instruction & Library | 290 (30.6%) | 658 (69.4%) |
| Arts, Media & Entertainment | 129 (46.4%) | 149 (53.6%) |
| Health Diagnosing & Treating | 320 (21.7%) | 1,152 (78.3%) |
| Health Technologists | 269 (26.9%) | 730 (73.1%) |
| Total (Category) | 3,483 (46.5%) | 4,001 (53.5%) |
| Total (Overall) | 8,981 (52.7%) | 8,075 (47.3%) |
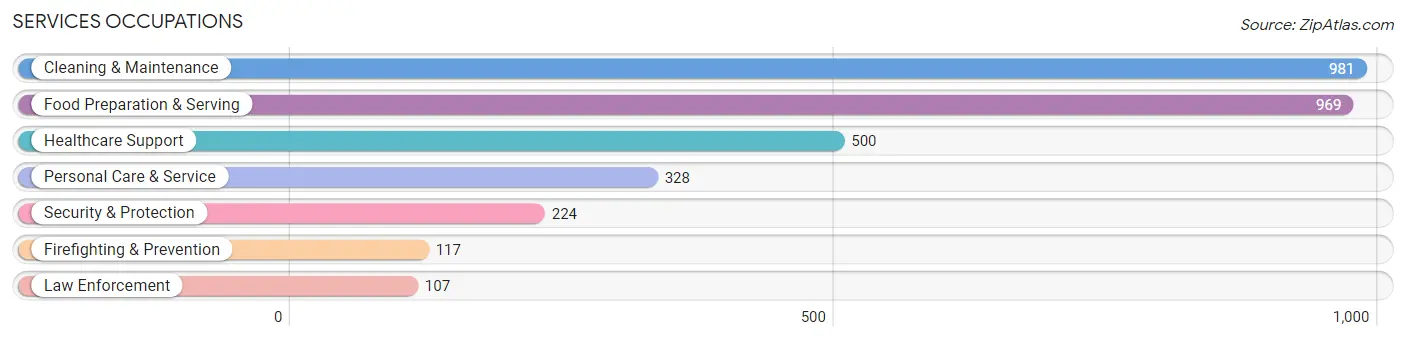
Services Occupations
The most common Services occupations in Talbot County are Cleaning & Maintenance (981 | 5.8%), Food Preparation & Serving (969 | 5.7%), Healthcare Support (500 | 2.9%), Personal Care & Service (328 | 1.9%), and Security & Protection (224 | 1.3%).
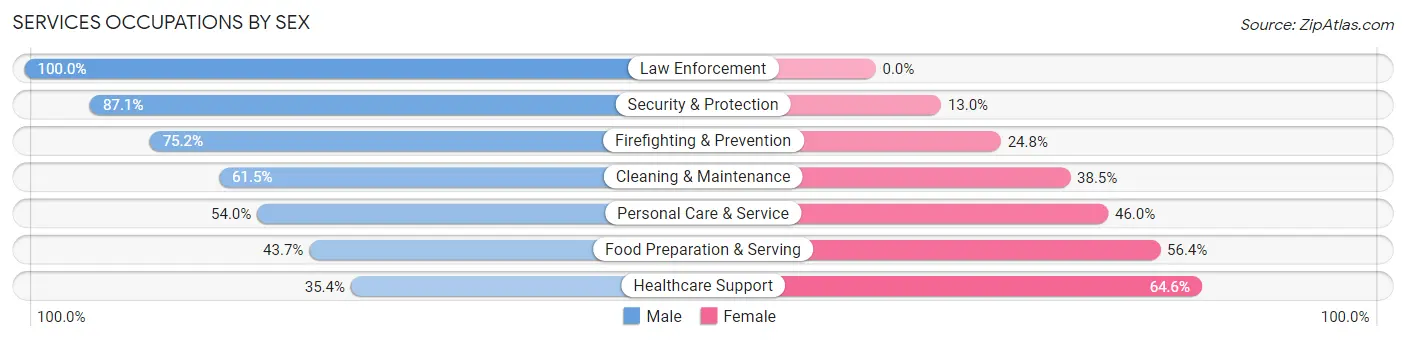
Services Occupations by Sex
Within the Services occupations in Talbot County, the most male-oriented occupations are Law Enforcement (100.0%), Security & Protection (87.1%), and Firefighting & Prevention (75.2%), while the most female-oriented occupations are Healthcare Support (64.6%), Food Preparation & Serving (56.4%), and Personal Care & Service (46.0%).
| Occupation | Male | Female |
| Healthcare Support | 177 (35.4%) | 323 (64.6%) |
| Security & Protection | 195 (87.1%) | 29 (13.0%) |
| Firefighting & Prevention | 88 (75.2%) | 29 (24.8%) |
| Law Enforcement | 107 (100.0%) | 0 (0.0%) |
| Food Preparation & Serving | 423 (43.6%) | 546 (56.4%) |
| Cleaning & Maintenance | 603 (61.5%) | 378 (38.5%) |
| Personal Care & Service | 177 (54.0%) | 151 (46.0%) |
| Total (Category) | 1,575 (52.5%) | 1,427 (47.5%) |
| Total (Overall) | 8,981 (52.7%) | 8,075 (47.3%) |
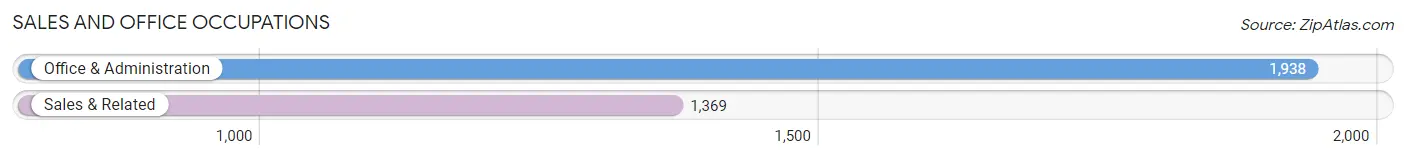
Sales and Office Occupations
The most common Sales and Office occupations in Talbot County are Office & Administration (1,938 | 11.4%), and Sales & Related (1,369 | 8.0%).
Sales and Office Occupations by Sex
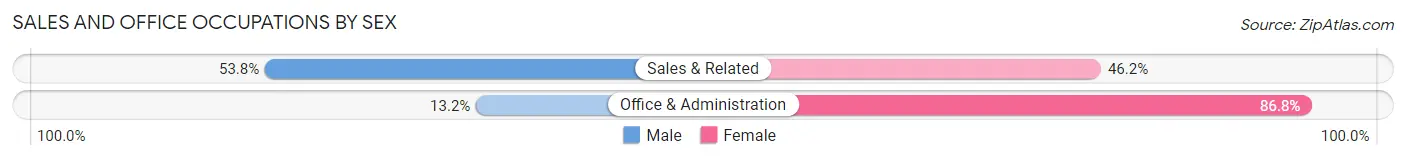
| Occupation | Male | Female |
| Sales & Related | 736 (53.8%) | 633 (46.2%) |
| Office & Administration | 255 (13.2%) | 1,683 (86.8%) |
| Total (Category) | 991 (30.0%) | 2,316 (70.0%) |
| Total (Overall) | 8,981 (52.7%) | 8,075 (47.3%) |
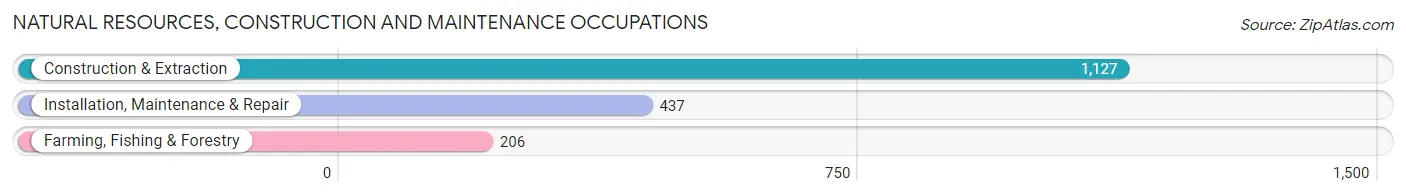
Natural Resources, Construction and Maintenance Occupations
The most common Natural Resources, Construction and Maintenance occupations in Talbot County are Construction & Extraction (1,127 | 6.6%), Installation, Maintenance & Repair (437 | 2.6%), and Farming, Fishing & Forestry (206 | 1.2%).
Natural Resources, Construction and Maintenance Occupations by Sex
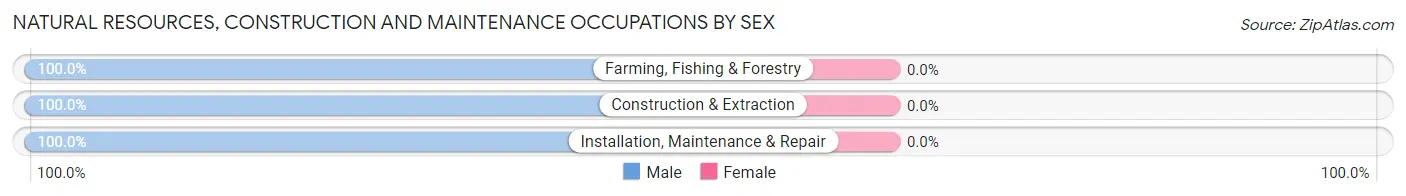
| Occupation | Male | Female |
| Farming, Fishing & Forestry | 206 (100.0%) | 0 (0.0%) |
| Construction & Extraction | 1,127 (100.0%) | 0 (0.0%) |
| Installation, Maintenance & Repair | 437 (100.0%) | 0 (0.0%) |
| Total (Category) | 1,770 (100.0%) | 0 (0.0%) |
| Total (Overall) | 8,981 (52.7%) | 8,075 (47.3%) |
Production, Transportation and Moving Occupations
The most common Production, Transportation and Moving occupations in Talbot County are Production (778 | 4.6%), Transportation (374 | 2.2%), and Material Moving (341 | 2.0%).
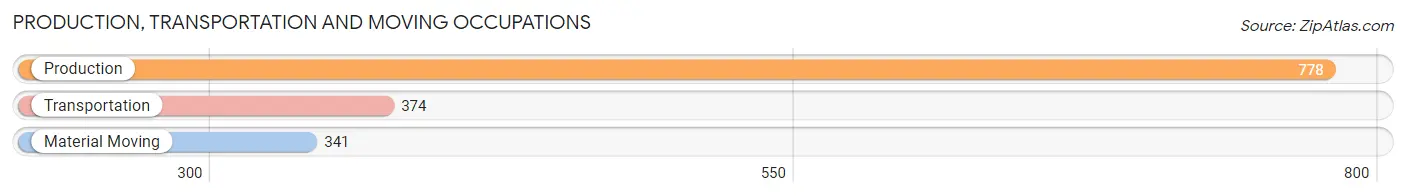
Production, Transportation and Moving Occupations by Sex
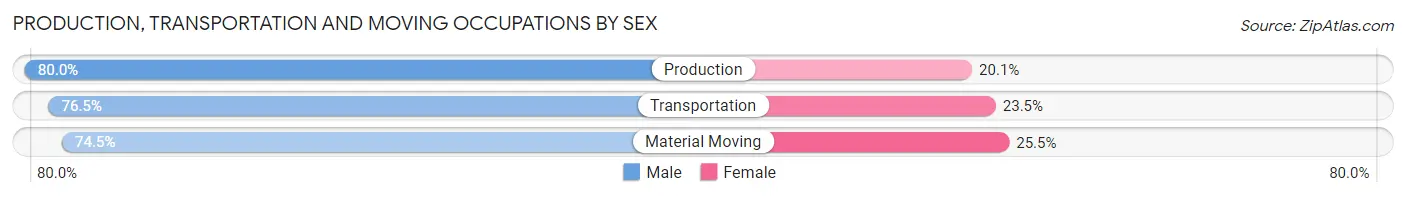
| Occupation | Male | Female |
| Production | 622 (79.9%) | 156 (20.1%) |
| Transportation | 286 (76.5%) | 88 (23.5%) |
| Material Moving | 254 (74.5%) | 87 (25.5%) |
| Total (Category) | 1,162 (77.8%) | 331 (22.2%) |
| Total (Overall) | 8,981 (52.7%) | 8,075 (47.3%) |
Employment Industries by Sex in Talbot County
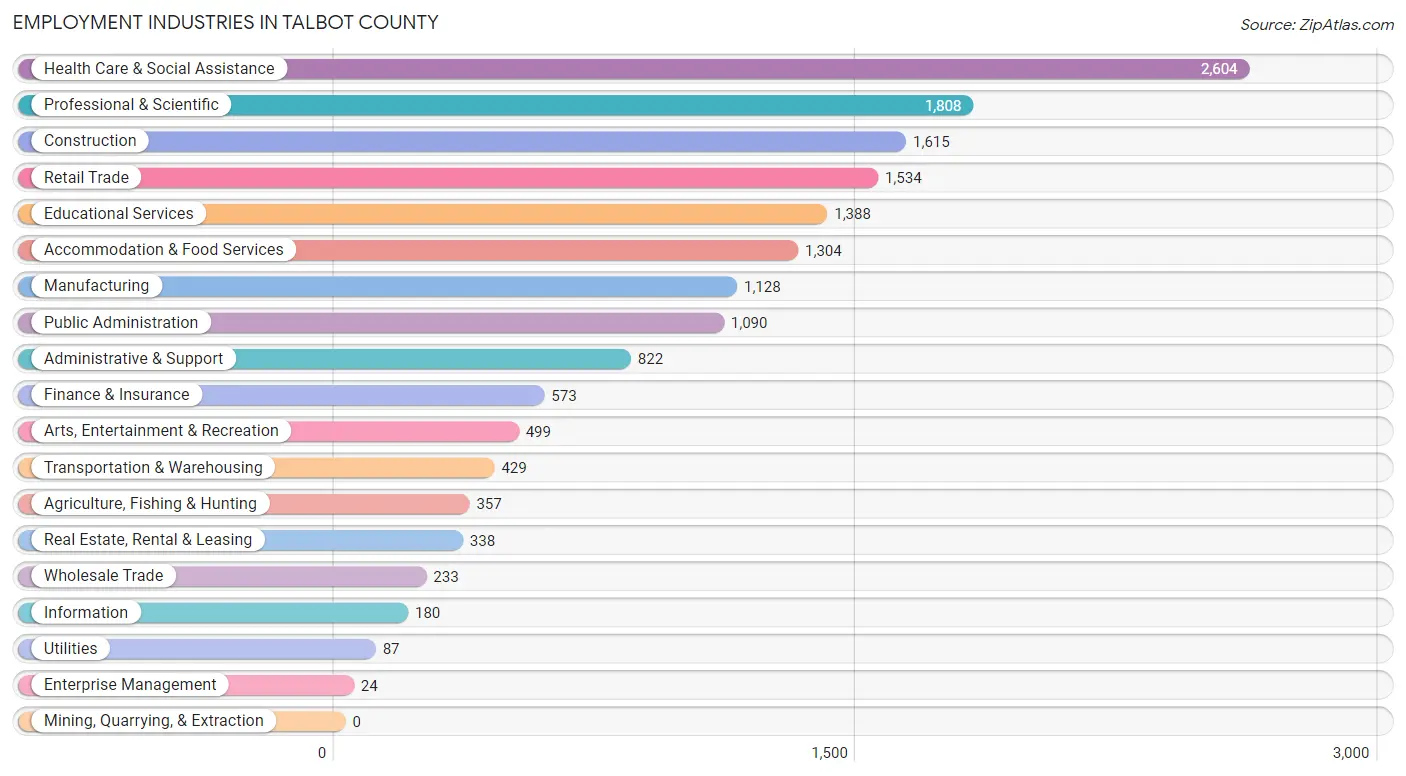
Employment Industries in Talbot County
The major employment industries in Talbot County include Health Care & Social Assistance (2,604 | 15.3%), Professional & Scientific (1,808 | 10.6%), Construction (1,615 | 9.5%), Retail Trade (1,534 | 9.0%), and Educational Services (1,388 | 8.1%).
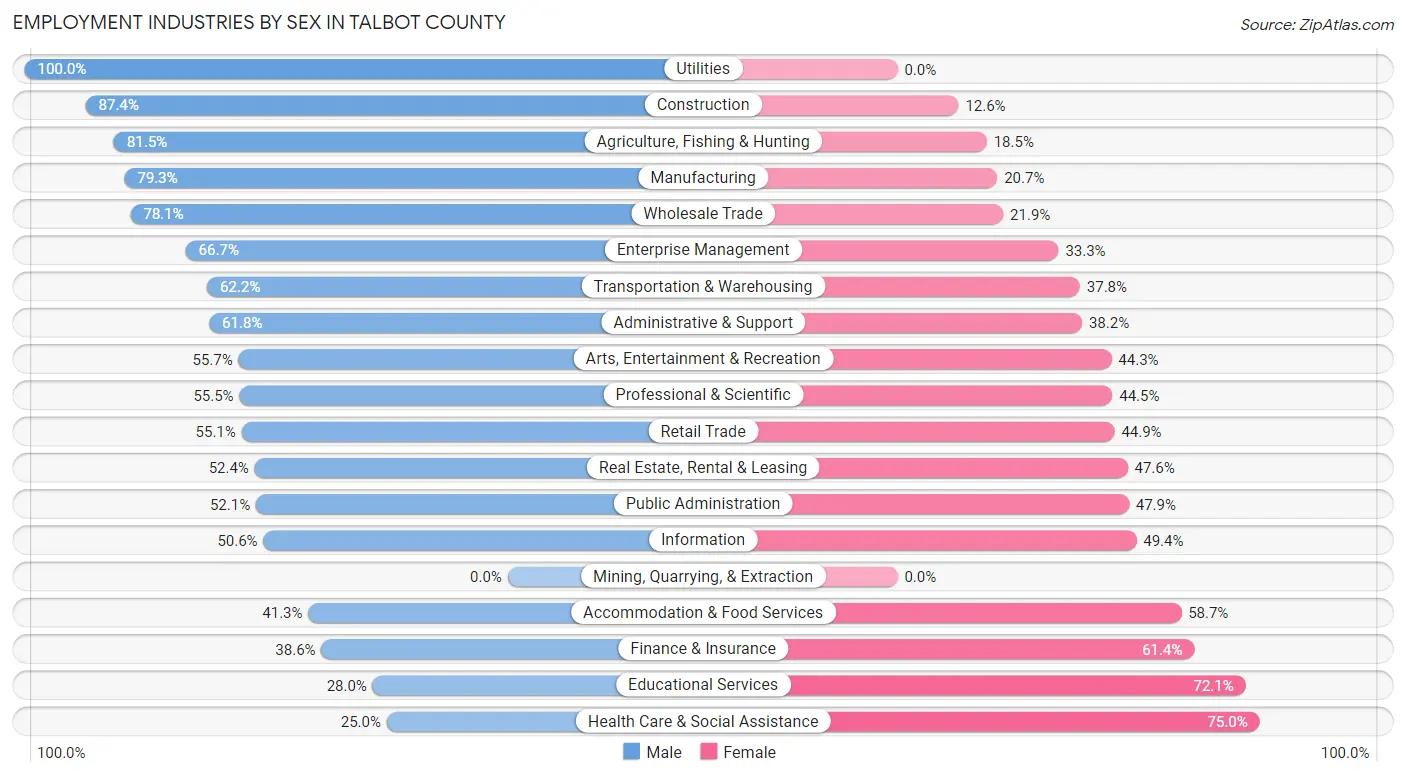
Employment Industries by Sex in Talbot County
The Talbot County industries that see more men than women are Utilities (100.0%), Construction (87.4%), and Agriculture, Fishing & Hunting (81.5%), whereas the industries that tend to have a higher number of women are Health Care & Social Assistance (75.0%), Educational Services (72.1%), and Finance & Insurance (61.4%).
| Industry | Male | Female |
| Agriculture, Fishing & Hunting | 291 (81.5%) | 66 (18.5%) |
| Mining, Quarrying, & Extraction | 0 (0.0%) | 0 (0.0%) |
| Construction | 1,411 (87.4%) | 204 (12.6%) |
| Manufacturing | 895 (79.3%) | 233 (20.7%) |
| Wholesale Trade | 182 (78.1%) | 51 (21.9%) |
| Retail Trade | 845 (55.1%) | 689 (44.9%) |
| Transportation & Warehousing | 267 (62.2%) | 162 (37.8%) |
| Utilities | 87 (100.0%) | 0 (0.0%) |
| Information | 91 (50.6%) | 89 (49.4%) |
| Finance & Insurance | 221 (38.6%) | 352 (61.4%) |
| Real Estate, Rental & Leasing | 177 (52.4%) | 161 (47.6%) |
| Professional & Scientific | 1,004 (55.5%) | 804 (44.5%) |
| Enterprise Management | 16 (66.7%) | 8 (33.3%) |
| Administrative & Support | 508 (61.8%) | 314 (38.2%) |
| Educational Services | 388 (28.0%) | 1,000 (72.1%) |
| Health Care & Social Assistance | 652 (25.0%) | 1,952 (75.0%) |
| Arts, Entertainment & Recreation | 278 (55.7%) | 221 (44.3%) |
| Accommodation & Food Services | 538 (41.3%) | 766 (58.7%) |
| Public Administration | 568 (52.1%) | 522 (47.9%) |
| Total | 8,981 (52.7%) | 8,075 (47.3%) |
Education in Talbot County
School Enrollment in Talbot County
The most common levels of schooling among the 7,122 students in Talbot County are elementary school (1,735 | 24.4%), high school (1,533 | 21.5%), and middle school (1,477 | 20.7%).
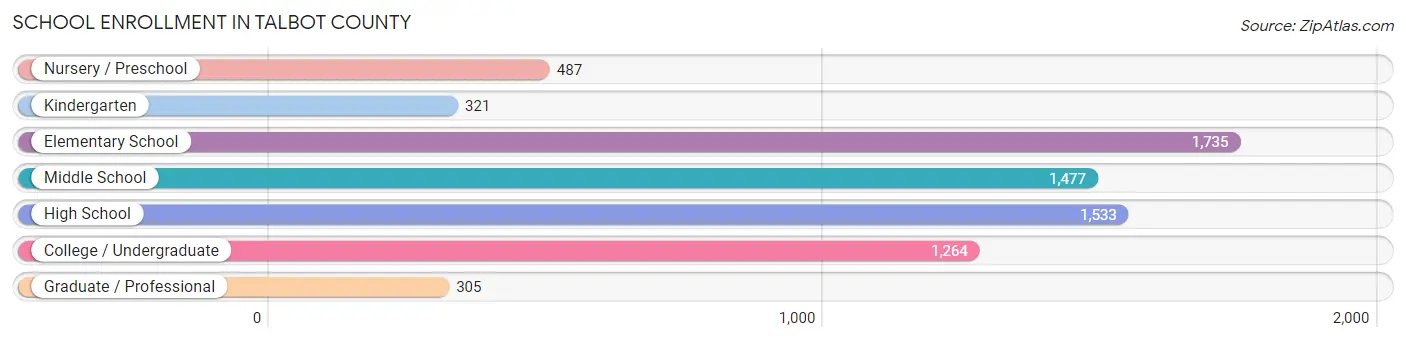
| School Level | # Students | % Students |
| Nursery / Preschool | 487 | 6.8% |
| Kindergarten | 321 | 4.5% |
| Elementary School | 1,735 | 24.4% |
| Middle School | 1,477 | 20.7% |
| High School | 1,533 | 21.5% |
| College / Undergraduate | 1,264 | 17.7% |
| Graduate / Professional | 305 | 4.3% |
| Total | 7,122 | 100.0% |
School Enrollment by Age by Funding Source in Talbot County
Out of a total of 7,122 students who are enrolled in schools in Talbot County, 1,773 (24.9%) attend a private institution, while the remaining 5,349 (75.1%) are enrolled in public schools. The age group of 3 to 4 year olds has the highest likelihood of being enrolled in private schools, with 107 (39.6% in the age bracket) enrolled. Conversely, the age group of 18 to 19 year olds has the lowest likelihood of being enrolled in a private school, with 325 (85.8% in the age bracket) attending a public institution.
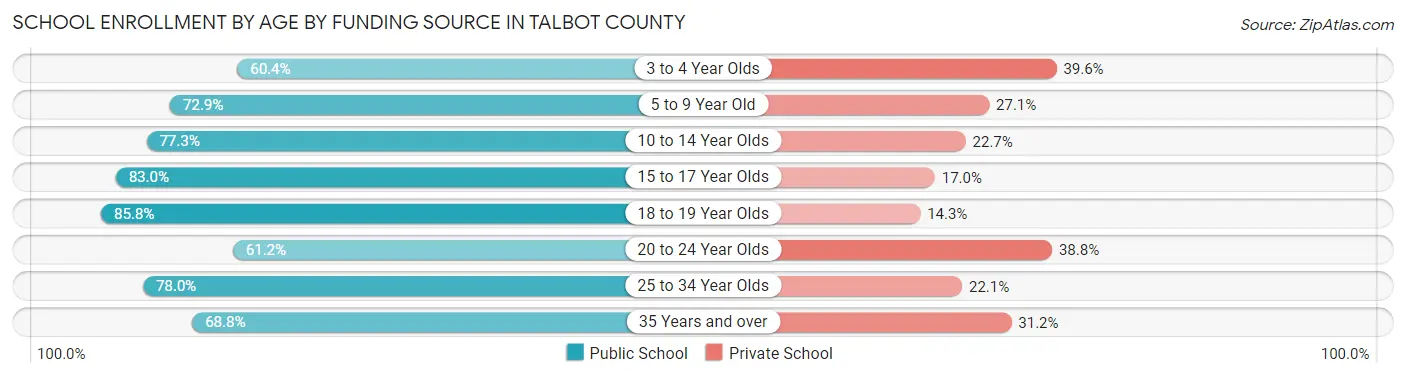
| Age Bracket | Public School | Private School |
| 3 to 4 Year Olds | 163 (60.4%) | 107 (39.6%) |
| 5 to 9 Year Old | 1,453 (72.9%) | 540 (27.1%) |
| 10 to 14 Year Olds | 1,501 (77.3%) | 441 (22.7%) |
| 15 to 17 Year Olds | 958 (83.0%) | 196 (17.0%) |
| 18 to 19 Year Olds | 325 (85.8%) | 54 (14.2%) |
| 20 to 24 Year Olds | 276 (61.2%) | 175 (38.8%) |
| 25 to 34 Year Olds | 258 (77.9%) | 73 (22.1%) |
| 35 Years and over | 414 (68.8%) | 188 (31.2%) |
| Total | 5,349 (75.1%) | 1,773 (24.9%) |
Educational Attainment by Field of Study in Talbot County
Business (1,689 | 13.1%), education (1,422 | 11.0%), social sciences (1,368 | 10.6%), science & technology (1,182 | 9.2%), and liberal arts & history (1,081 | 8.4%) are the most common fields of study among 12,877 individuals in Talbot County who have obtained a bachelor's degree or higher.
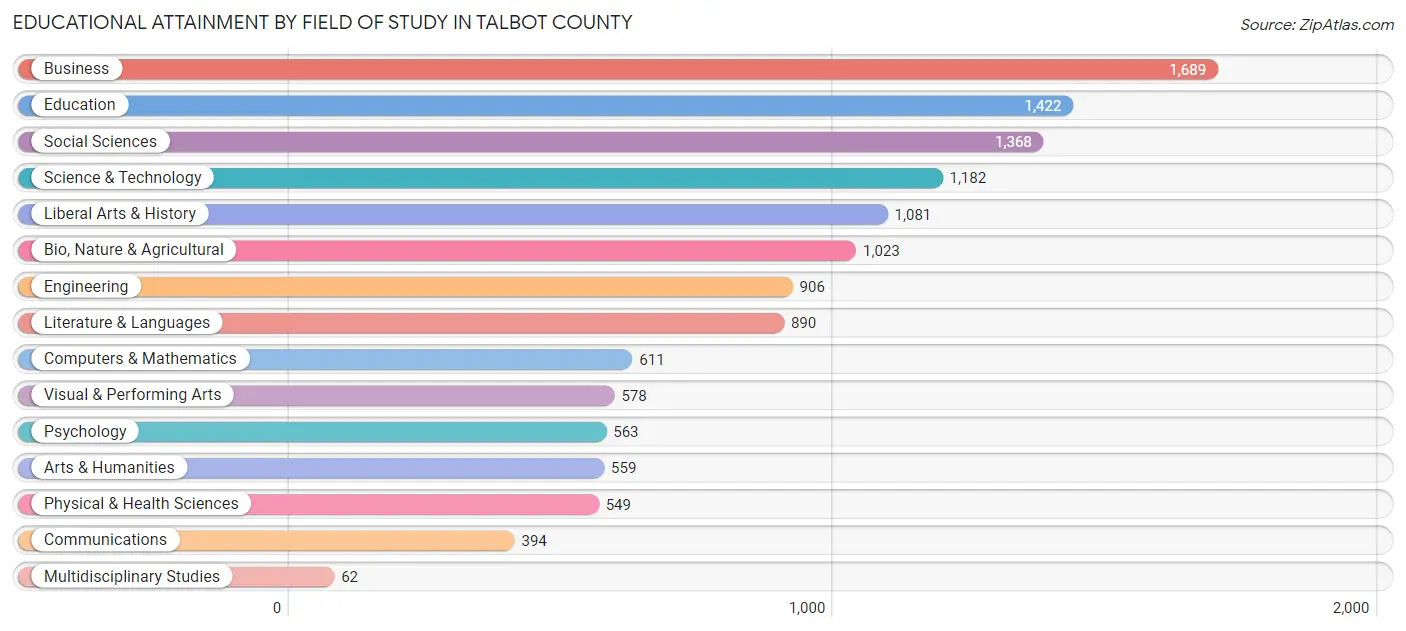
| Field of Study | # Graduates | % Graduates |
| Computers & Mathematics | 611 | 4.7% |
| Bio, Nature & Agricultural | 1,023 | 7.9% |
| Physical & Health Sciences | 549 | 4.3% |
| Psychology | 563 | 4.4% |
| Social Sciences | 1,368 | 10.6% |
| Engineering | 906 | 7.0% |
| Multidisciplinary Studies | 62 | 0.5% |
| Science & Technology | 1,182 | 9.2% |
| Business | 1,689 | 13.1% |
| Education | 1,422 | 11.0% |
| Literature & Languages | 890 | 6.9% |
| Liberal Arts & History | 1,081 | 8.4% |
| Visual & Performing Arts | 578 | 4.5% |
| Communications | 394 | 3.1% |
| Arts & Humanities | 559 | 4.3% |
| Total | 12,877 | 100.0% |
Transportation & Commute in Talbot County
Vehicle Availability by Sex in Talbot County
The most prevalent vehicle ownership categories in Talbot County are males with 2 vehicles (4,074, accounting for 45.9%) and females with 2 vehicles (3,162, making up 50.9%).
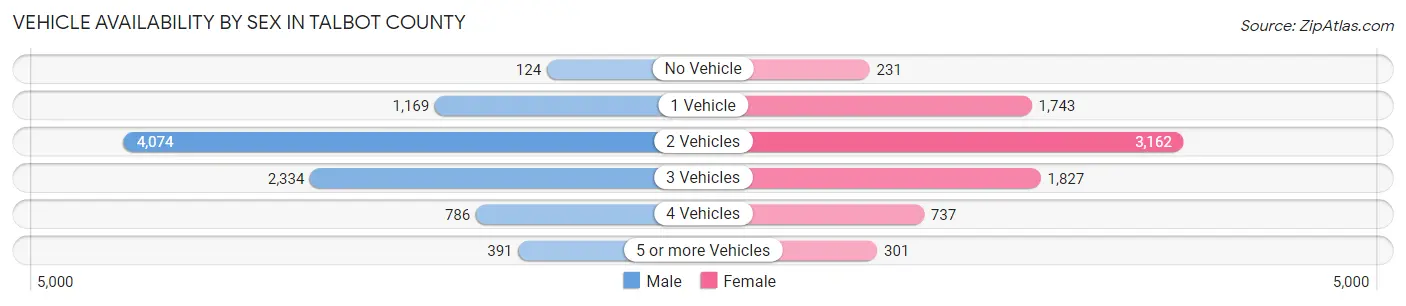
| Vehicles Available | Male | Female |
| No Vehicle | 124 (1.4%) | 231 (2.9%) |
| 1 Vehicle | 1,169 (13.2%) | 1,743 (21.8%) |
| 2 Vehicles | 4,074 (45.9%) | 3,162 (39.5%) |
| 3 Vehicles | 2,334 (26.3%) | 1,827 (22.8%) |
| 4 Vehicles | 786 (8.8%) | 737 (9.2%) |
| 5 or more Vehicles | 391 (4.4%) | 301 (3.8%) |
| Total | 8,878 (100.0%) | 8,001 (100.0%) |
Commute Time in Talbot County
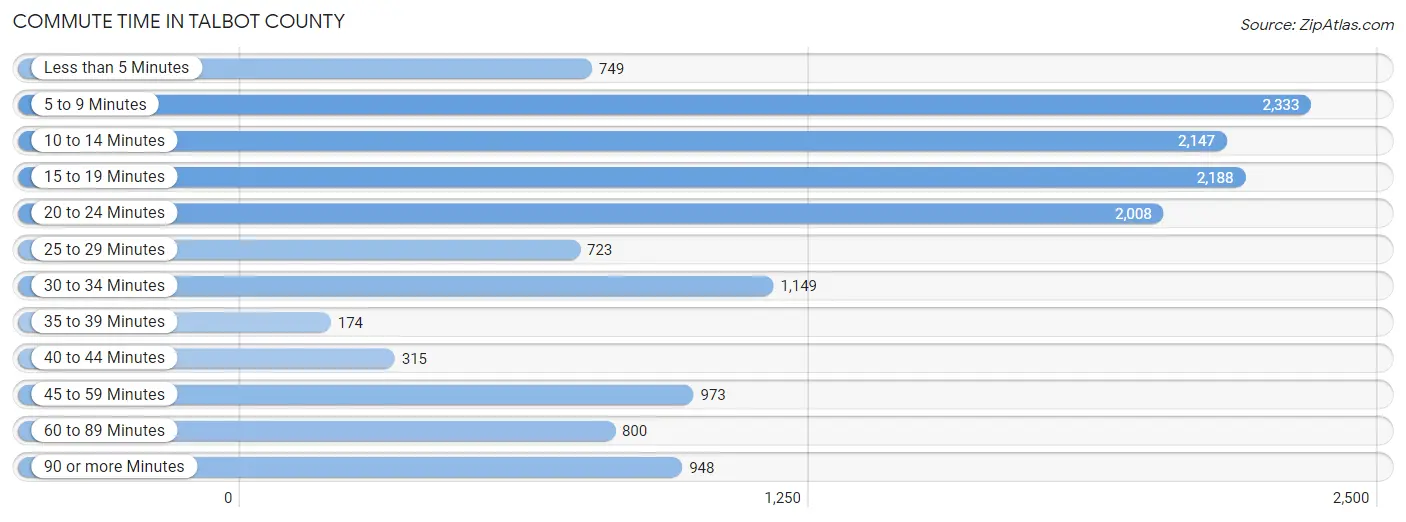
The most frequently occuring commute durations in Talbot County are 5 to 9 minutes (2,333 commuters, 16.1%), 15 to 19 minutes (2,188 commuters, 15.1%), and 10 to 14 minutes (2,147 commuters, 14.8%).
| Commute Time | # Commuters | % Commuters |
| Less than 5 Minutes | 749 | 5.2% |
| 5 to 9 Minutes | 2,333 | 16.1% |
| 10 to 14 Minutes | 2,147 | 14.8% |
| 15 to 19 Minutes | 2,188 | 15.1% |
| 20 to 24 Minutes | 2,008 | 13.8% |
| 25 to 29 Minutes | 723 | 5.0% |
| 30 to 34 Minutes | 1,149 | 7.9% |
| 35 to 39 Minutes | 174 | 1.2% |
| 40 to 44 Minutes | 315 | 2.2% |
| 45 to 59 Minutes | 973 | 6.7% |
| 60 to 89 Minutes | 800 | 5.5% |
| 90 or more Minutes | 948 | 6.5% |
Commute Time by Sex in Talbot County
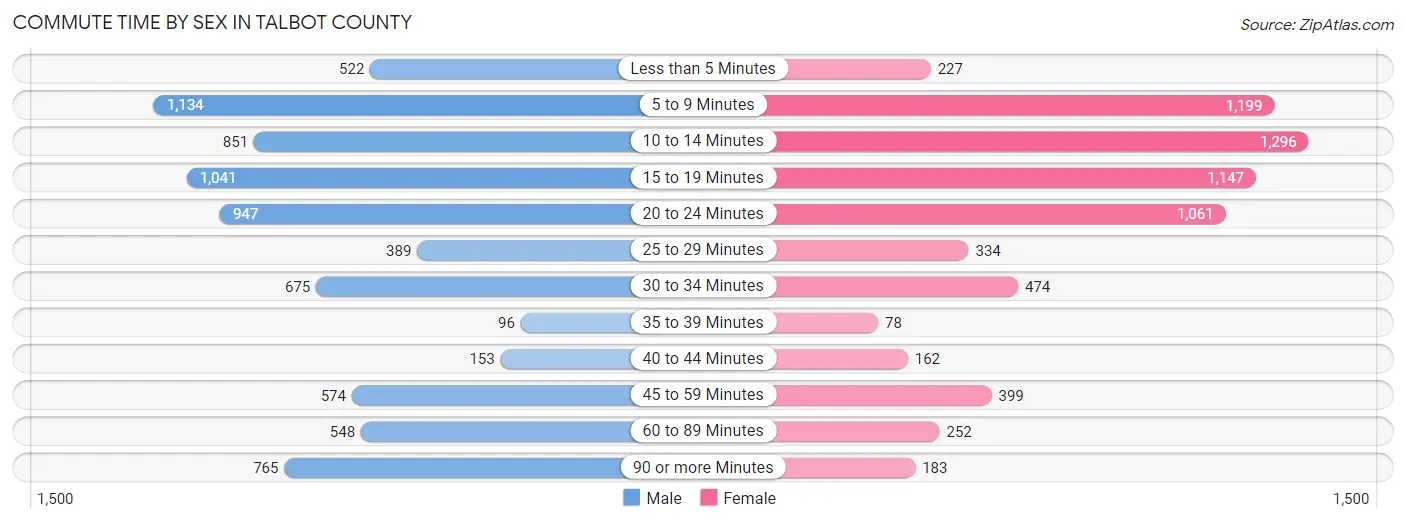
The most common commute times in Talbot County are 5 to 9 minutes (1,134 commuters, 14.7%) for males and 10 to 14 minutes (1,296 commuters, 19.0%) for females.
| Commute Time | Male | Female |
| Less than 5 Minutes | 522 (6.8%) | 227 (3.3%) |
| 5 to 9 Minutes | 1,134 (14.7%) | 1,199 (17.6%) |
| 10 to 14 Minutes | 851 (11.1%) | 1,296 (19.0%) |
| 15 to 19 Minutes | 1,041 (13.5%) | 1,147 (16.8%) |
| 20 to 24 Minutes | 947 (12.3%) | 1,061 (15.6%) |
| 25 to 29 Minutes | 389 (5.1%) | 334 (4.9%) |
| 30 to 34 Minutes | 675 (8.8%) | 474 (7.0%) |
| 35 to 39 Minutes | 96 (1.3%) | 78 (1.1%) |
| 40 to 44 Minutes | 153 (2.0%) | 162 (2.4%) |
| 45 to 59 Minutes | 574 (7.5%) | 399 (5.9%) |
| 60 to 89 Minutes | 548 (7.1%) | 252 (3.7%) |
| 90 or more Minutes | 765 (9.9%) | 183 (2.7%) |
Time of Departure to Work by Sex in Talbot County
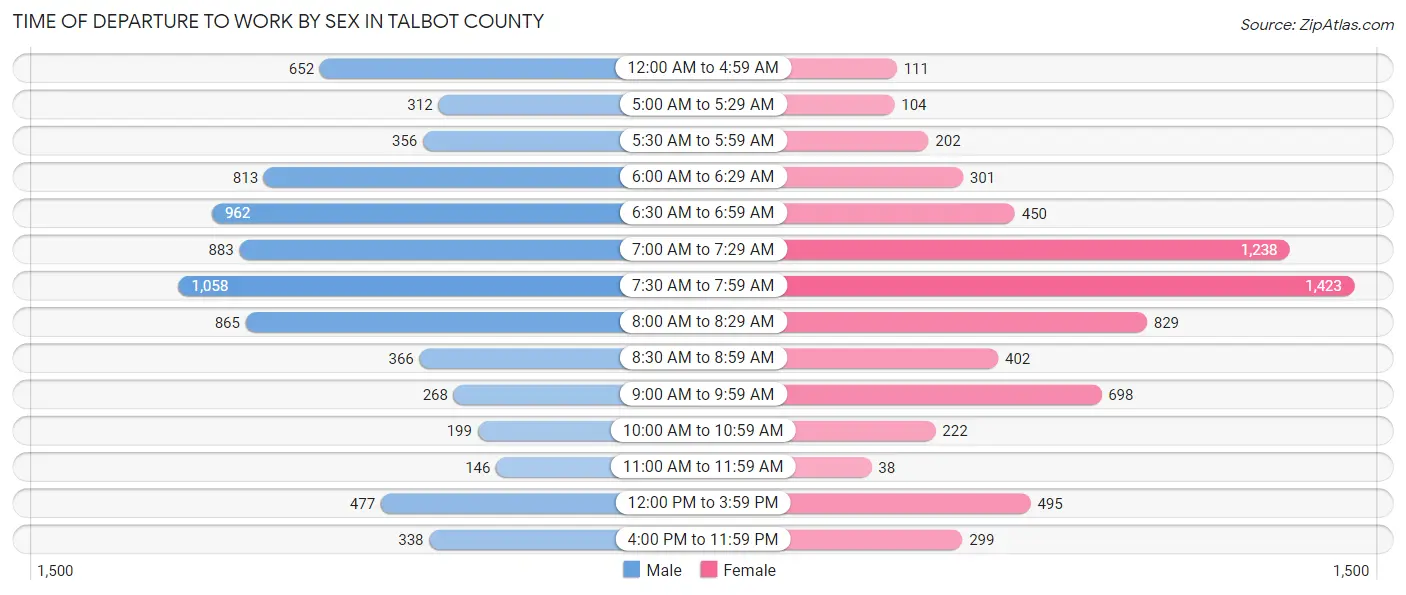
The most frequent times of departure to work in Talbot County are 7:30 AM to 7:59 AM (1,058, 13.8%) for males and 7:30 AM to 7:59 AM (1,423, 20.9%) for females.
| Time of Departure | Male | Female |
| 12:00 AM to 4:59 AM | 652 (8.5%) | 111 (1.6%) |
| 5:00 AM to 5:29 AM | 312 (4.1%) | 104 (1.5%) |
| 5:30 AM to 5:59 AM | 356 (4.6%) | 202 (3.0%) |
| 6:00 AM to 6:29 AM | 813 (10.6%) | 301 (4.4%) |
| 6:30 AM to 6:59 AM | 962 (12.5%) | 450 (6.6%) |
| 7:00 AM to 7:29 AM | 883 (11.5%) | 1,238 (18.2%) |
| 7:30 AM to 7:59 AM | 1,058 (13.8%) | 1,423 (20.9%) |
| 8:00 AM to 8:29 AM | 865 (11.2%) | 829 (12.2%) |
| 8:30 AM to 8:59 AM | 366 (4.8%) | 402 (5.9%) |
| 9:00 AM to 9:59 AM | 268 (3.5%) | 698 (10.2%) |
| 10:00 AM to 10:59 AM | 199 (2.6%) | 222 (3.3%) |
| 11:00 AM to 11:59 AM | 146 (1.9%) | 38 (0.6%) |
| 12:00 PM to 3:59 PM | 477 (6.2%) | 495 (7.3%) |
| 4:00 PM to 11:59 PM | 338 (4.4%) | 299 (4.4%) |
| Total | 7,695 (100.0%) | 6,812 (100.0%) |
Housing Occupancy in Talbot County
Occupancy by Ownership in Talbot County
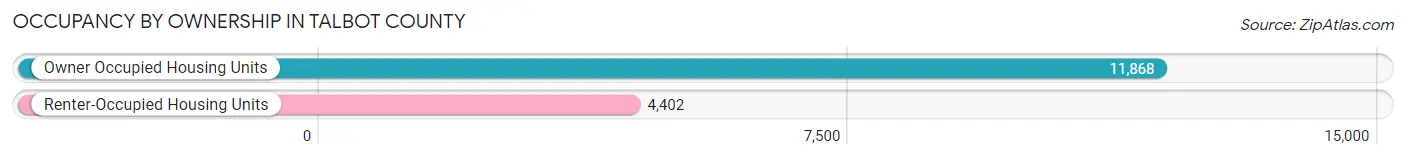
Of the total 16,270 dwellings in Talbot County, owner-occupied units account for 11,868 (72.9%), while renter-occupied units make up 4,402 (27.1%).
| Occupancy | # Housing Units | % Housing Units |
| Owner Occupied Housing Units | 11,868 | 72.9% |
| Renter-Occupied Housing Units | 4,402 | 27.1% |
| Total Occupied Housing Units | 16,270 | 100.0% |
Occupancy by Household Size in Talbot County
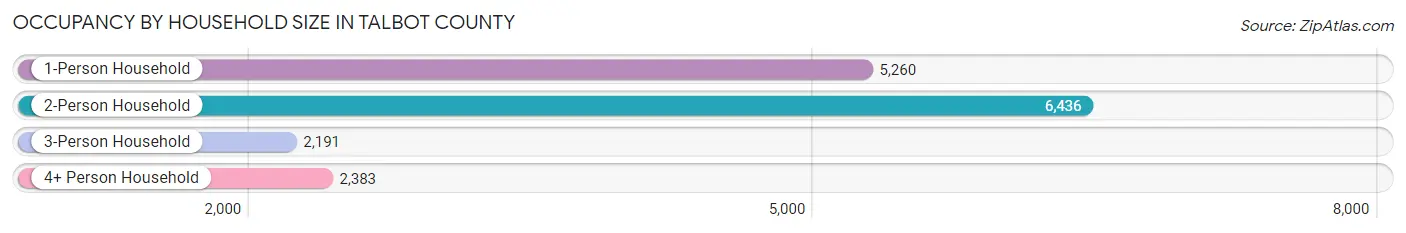
| Household Size | # Housing Units | % Housing Units |
| 1-Person Household | 5,260 | 32.3% |
| 2-Person Household | 6,436 | 39.6% |
| 3-Person Household | 2,191 | 13.5% |
| 4+ Person Household | 2,383 | 14.6% |
| Total Housing Units | 16,270 | 100.0% |
Occupancy by Ownership by Household Size in Talbot County
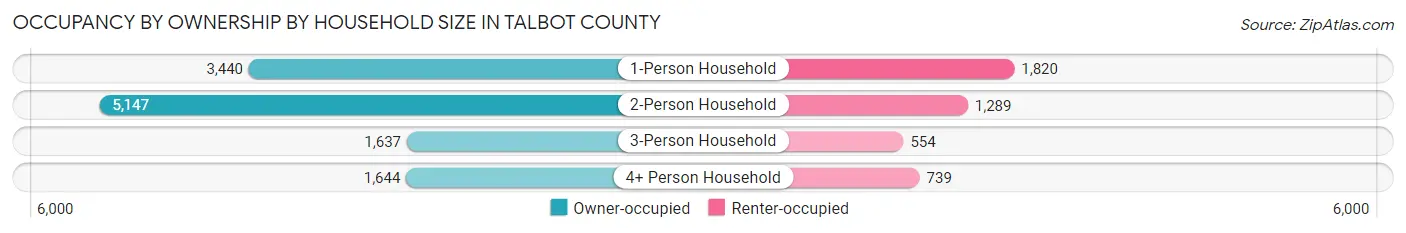
| Household Size | Owner-occupied | Renter-occupied |
| 1-Person Household | 3,440 (65.4%) | 1,820 (34.6%) |
| 2-Person Household | 5,147 (80.0%) | 1,289 (20.0%) |
| 3-Person Household | 1,637 (74.7%) | 554 (25.3%) |
| 4+ Person Household | 1,644 (69.0%) | 739 (31.0%) |
| Total Housing Units | 11,868 (72.9%) | 4,402 (27.1%) |
Occupancy by Educational Attainment in Talbot County
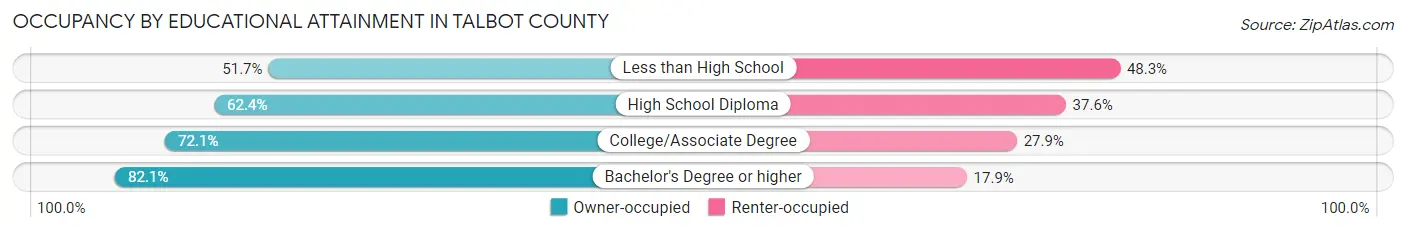
| Household Size | Owner-occupied | Renter-occupied |
| Less than High School | 574 (51.7%) | 537 (48.3%) |
| High School Diploma | 2,272 (62.4%) | 1,367 (37.6%) |
| College/Associate Degree | 3,136 (72.1%) | 1,211 (27.9%) |
| Bachelor's Degree or higher | 5,886 (82.1%) | 1,287 (17.9%) |
Occupancy by Age of Householder in Talbot County
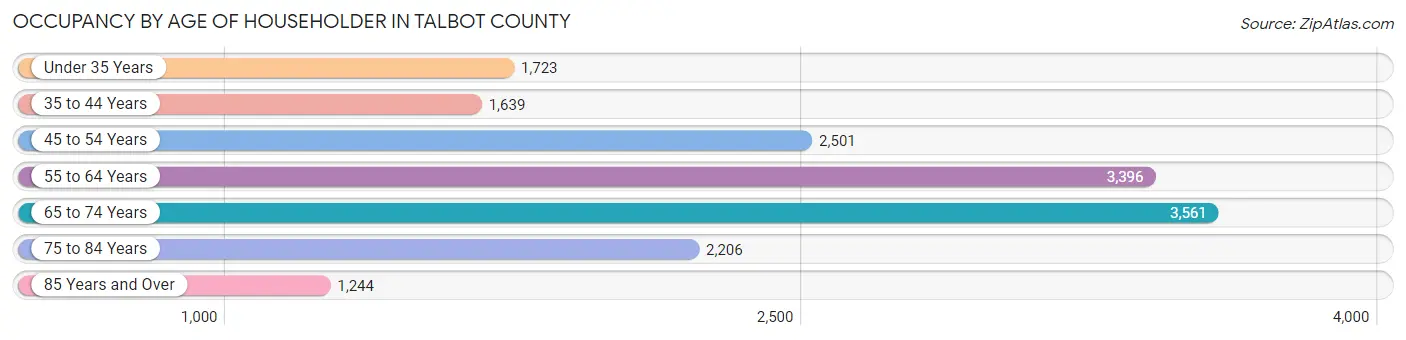
| Age Bracket | # Households | % Households |
| Under 35 Years | 1,723 | 10.6% |
| 35 to 44 Years | 1,639 | 10.1% |
| 45 to 54 Years | 2,501 | 15.4% |
| 55 to 64 Years | 3,396 | 20.9% |
| 65 to 74 Years | 3,561 | 21.9% |
| 75 to 84 Years | 2,206 | 13.6% |
| 85 Years and Over | 1,244 | 7.6% |
| Total | 16,270 | 100.0% |
Housing Finances in Talbot County
Median Income by Occupancy in Talbot County
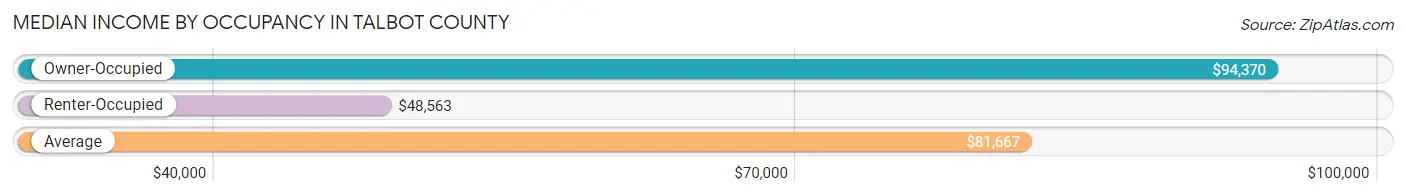
| Occupancy Type | # Households | Median Income |
| Owner-Occupied | 11,868 (72.9%) | $94,370 |
| Renter-Occupied | 4,402 (27.1%) | $48,563 |
| Average | 16,270 (100.0%) | $81,667 |
Occupancy by Householder Income Bracket in Talbot County
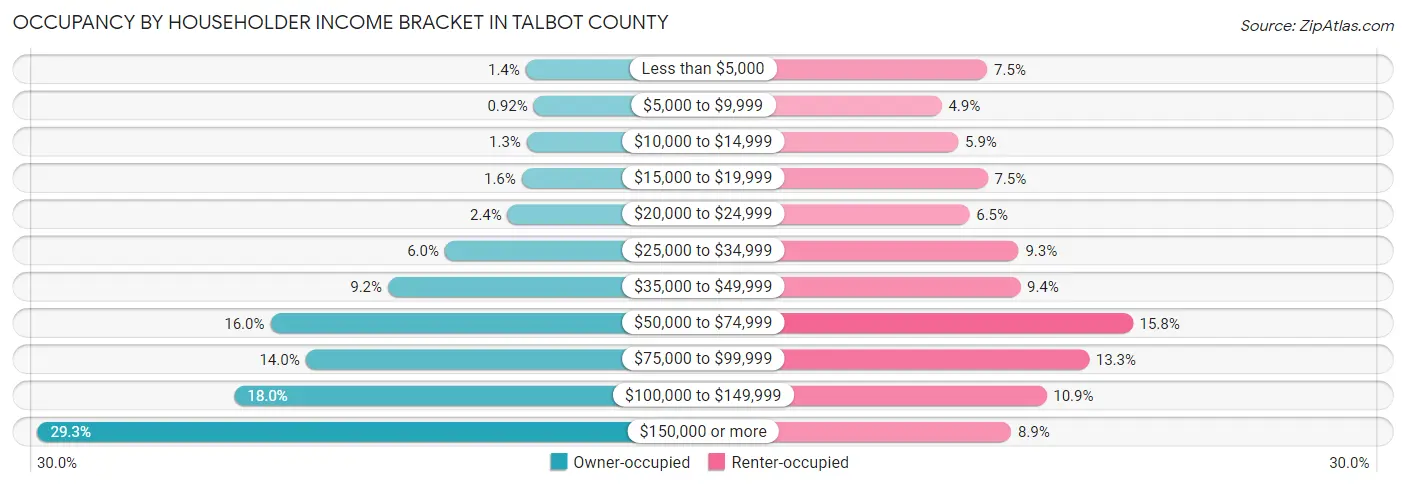
| Income Bracket | Owner-occupied | Renter-occupied |
| Less than $5,000 | 162 (1.4%) | 331 (7.5%) |
| $5,000 to $9,999 | 109 (0.9%) | 216 (4.9%) |
| $10,000 to $14,999 | 156 (1.3%) | 258 (5.9%) |
| $15,000 to $19,999 | 190 (1.6%) | 332 (7.5%) |
| $20,000 to $24,999 | 285 (2.4%) | 286 (6.5%) |
| $25,000 to $34,999 | 711 (6.0%) | 410 (9.3%) |
| $35,000 to $49,999 | 1,097 (9.2%) | 414 (9.4%) |
| $50,000 to $74,999 | 1,894 (16.0%) | 697 (15.8%) |
| $75,000 to $99,999 | 1,655 (14.0%) | 587 (13.3%) |
| $100,000 to $149,999 | 2,137 (18.0%) | 480 (10.9%) |
| $150,000 or more | 3,472 (29.3%) | 391 (8.9%) |
| Total | 11,868 (100.0%) | 4,402 (100.0%) |
Monthly Housing Cost Tiers in Talbot County
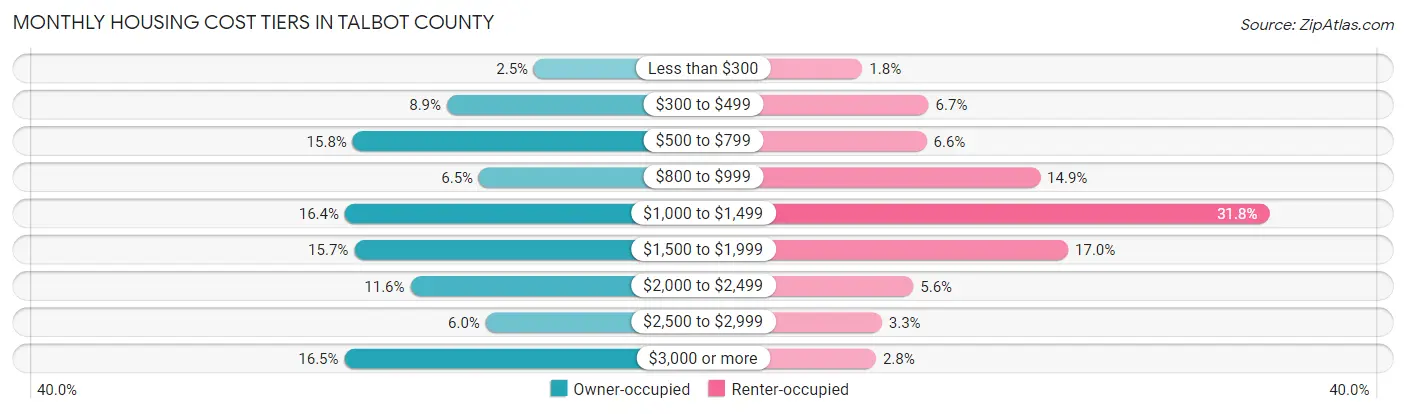
| Monthly Cost | Owner-occupied | Renter-occupied |
| Less than $300 | 295 (2.5%) | 81 (1.8%) |
| $300 to $499 | 1,056 (8.9%) | 296 (6.7%) |
| $500 to $799 | 1,880 (15.8%) | 289 (6.6%) |
| $800 to $999 | 776 (6.5%) | 657 (14.9%) |
| $1,000 to $1,499 | 1,949 (16.4%) | 1,400 (31.8%) |
| $1,500 to $1,999 | 1,867 (15.7%) | 748 (17.0%) |
| $2,000 to $2,499 | 1,376 (11.6%) | 246 (5.6%) |
| $2,500 to $2,999 | 717 (6.0%) | 144 (3.3%) |
| $3,000 or more | 1,952 (16.5%) | 125 (2.8%) |
| Total | 11,868 (100.0%) | 4,402 (100.0%) |
Physical Housing Characteristics in Talbot County
Housing Structures in Talbot County
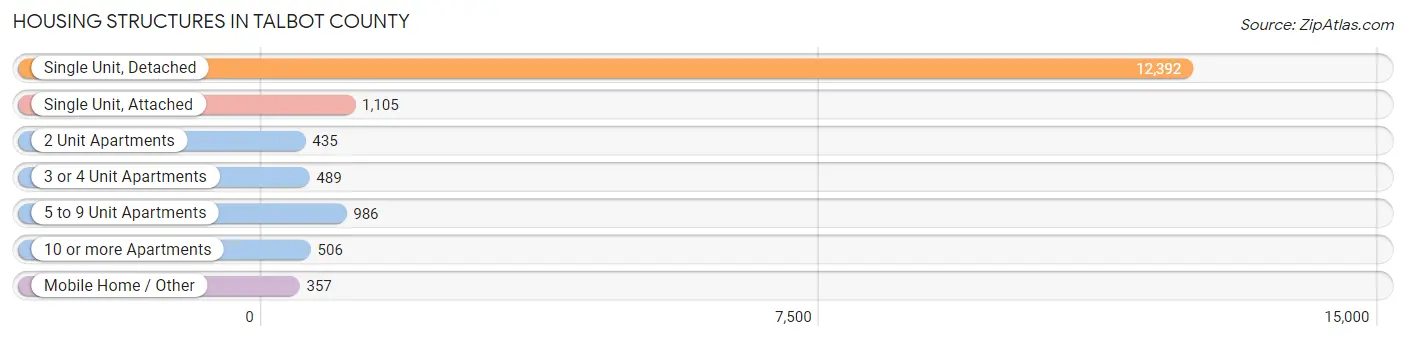
| Structure Type | # Housing Units | % Housing Units |
| Single Unit, Detached | 12,392 | 76.2% |
| Single Unit, Attached | 1,105 | 6.8% |
| 2 Unit Apartments | 435 | 2.7% |
| 3 or 4 Unit Apartments | 489 | 3.0% |
| 5 to 9 Unit Apartments | 986 | 6.1% |
| 10 or more Apartments | 506 | 3.1% |
| Mobile Home / Other | 357 | 2.2% |
| Total | 16,270 | 100.0% |
Housing Structures by Occupancy in Talbot County
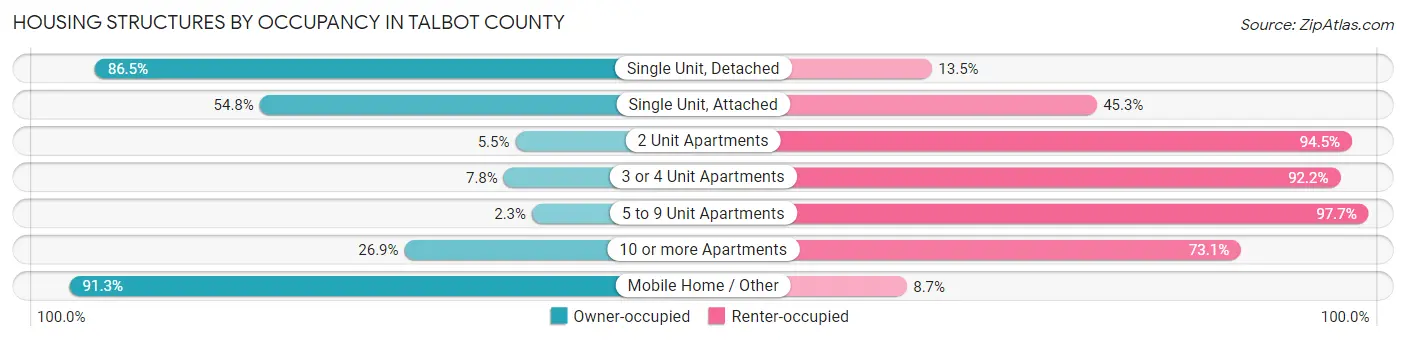
| Structure Type | Owner-occupied | Renter-occupied |
| Single Unit, Detached | 10,716 (86.5%) | 1,676 (13.5%) |
| Single Unit, Attached | 605 (54.7%) | 500 (45.3%) |
| 2 Unit Apartments | 24 (5.5%) | 411 (94.5%) |
| 3 or 4 Unit Apartments | 38 (7.8%) | 451 (92.2%) |
| 5 to 9 Unit Apartments | 23 (2.3%) | 963 (97.7%) |
| 10 or more Apartments | 136 (26.9%) | 370 (73.1%) |
| Mobile Home / Other | 326 (91.3%) | 31 (8.7%) |
| Total | 11,868 (72.9%) | 4,402 (27.1%) |
Housing Structures by Number of Rooms in Talbot County
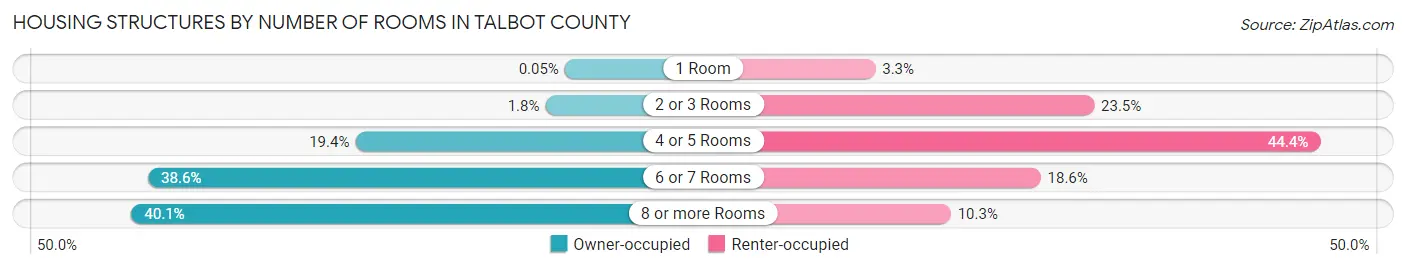
| Number of Rooms | Owner-occupied | Renter-occupied |
| 1 Room | 6 (0.1%) | 144 (3.3%) |
| 2 or 3 Rooms | 218 (1.8%) | 1,035 (23.5%) |
| 4 or 5 Rooms | 2,305 (19.4%) | 1,955 (44.4%) |
| 6 or 7 Rooms | 4,578 (38.6%) | 817 (18.6%) |
| 8 or more Rooms | 4,761 (40.1%) | 451 (10.2%) |
| Total | 11,868 (100.0%) | 4,402 (100.0%) |
Housing Structure by Heating Type in Talbot County
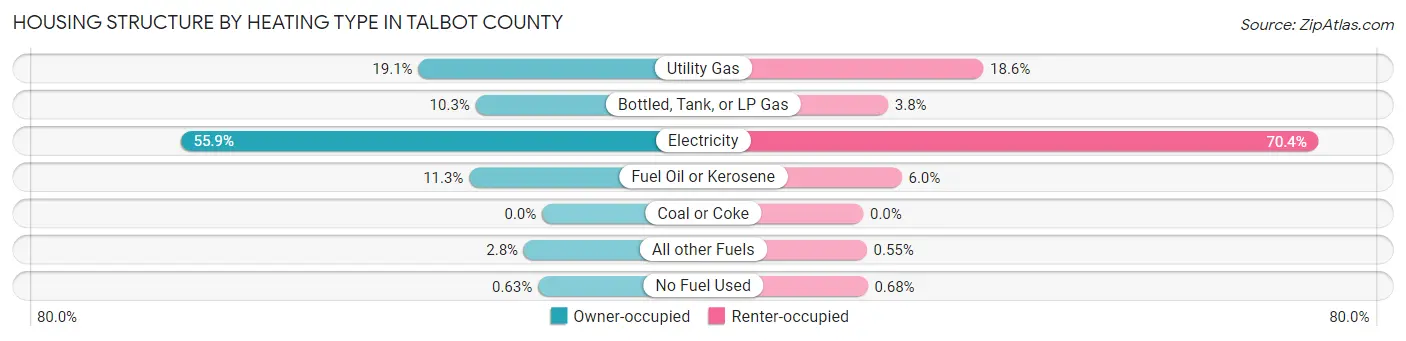
| Heating Type | Owner-occupied | Renter-occupied |
| Utility Gas | 2,269 (19.1%) | 817 (18.6%) |
| Bottled, Tank, or LP Gas | 1,219 (10.3%) | 169 (3.8%) |
| Electricity | 6,633 (55.9%) | 3,100 (70.4%) |
| Fuel Oil or Kerosene | 1,338 (11.3%) | 262 (5.9%) |
| Coal or Coke | 0 (0.0%) | 0 (0.0%) |
| All other Fuels | 334 (2.8%) | 24 (0.5%) |
| No Fuel Used | 75 (0.6%) | 30 (0.7%) |
| Total | 11,868 (100.0%) | 4,402 (100.0%) |
Household Vehicle Usage in Talbot County
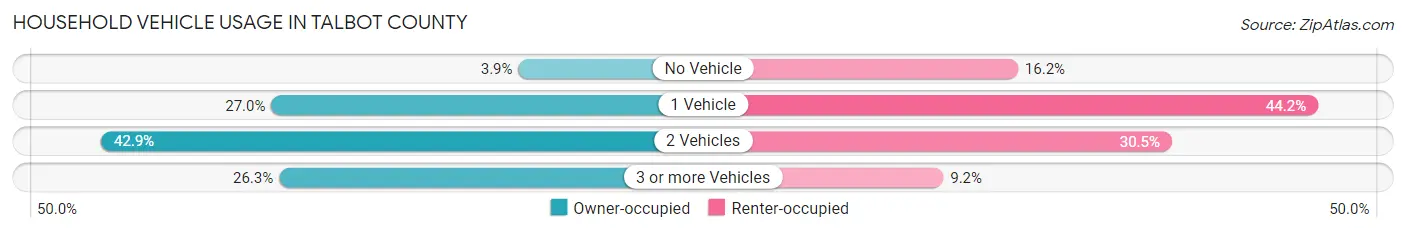
| Vehicles per Household | Owner-occupied | Renter-occupied |
| No Vehicle | 464 (3.9%) | 711 (16.2%) |
| 1 Vehicle | 3,201 (27.0%) | 1,944 (44.2%) |
| 2 Vehicles | 5,088 (42.9%) | 1,343 (30.5%) |
| 3 or more Vehicles | 3,115 (26.3%) | 404 (9.2%) |
| Total | 11,868 (100.0%) | 4,402 (100.0%) |
Real Estate & Mortgages in Talbot County
Real Estate and Mortgage Overview in Talbot County
| Characteristic | Without Mortgage | With Mortgage |
| Housing Units | 4,545 | 7,323 |
| Median Property Value | $357,700 | $398,000 |
| Median Household Income | $68,125 | $2,472 |
| Monthly Housing Costs | $669 | $1,791 |
| Real Estate Taxes | $2,311 | $197 |
Property Value by Mortgage Status in Talbot County
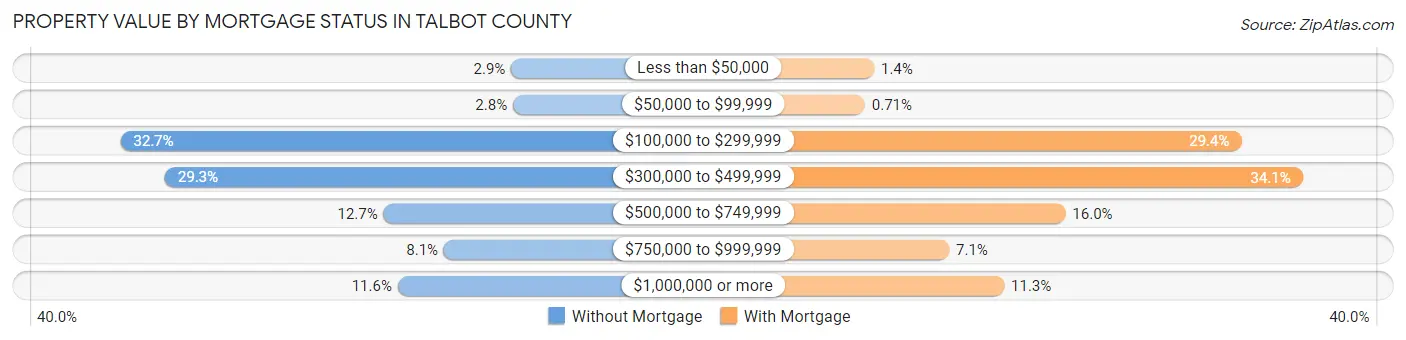
| Property Value | Without Mortgage | With Mortgage |
| Less than $50,000 | 133 (2.9%) | 103 (1.4%) |
| $50,000 to $99,999 | 127 (2.8%) | 52 (0.7%) |
| $100,000 to $299,999 | 1,486 (32.7%) | 2,152 (29.4%) |
| $300,000 to $499,999 | 1,332 (29.3%) | 2,494 (34.1%) |
| $500,000 to $749,999 | 575 (12.7%) | 1,171 (16.0%) |
| $750,000 to $999,999 | 366 (8.1%) | 522 (7.1%) |
| $1,000,000 or more | 526 (11.6%) | 829 (11.3%) |
| Total | 4,545 (100.0%) | 7,323 (100.0%) |
Household Income by Mortgage Status in Talbot County
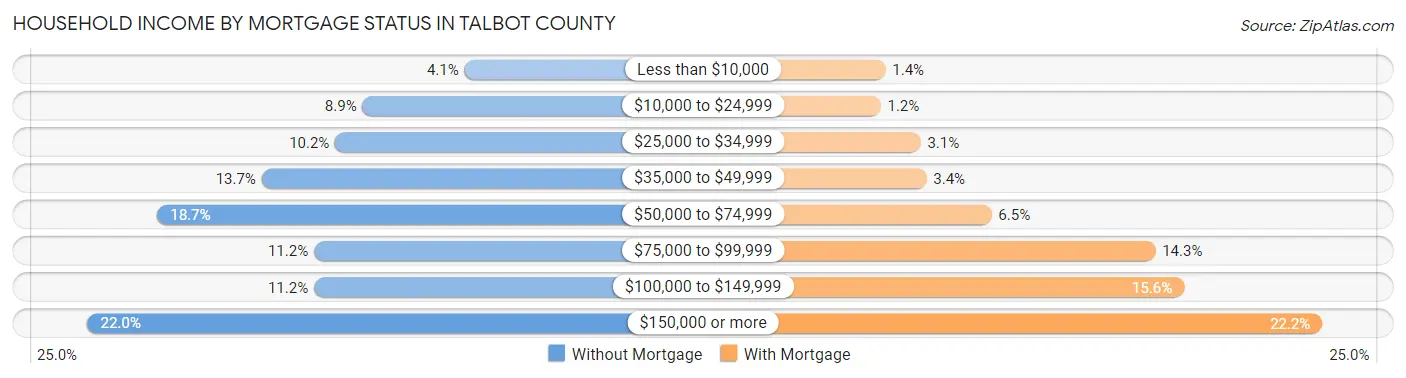
| Household Income | Without Mortgage | With Mortgage |
| Less than $10,000 | 184 (4.1%) | 104 (1.4%) |
| $10,000 to $24,999 | 405 (8.9%) | 87 (1.2%) |
| $25,000 to $34,999 | 464 (10.2%) | 226 (3.1%) |
| $35,000 to $49,999 | 623 (13.7%) | 247 (3.4%) |
| $50,000 to $74,999 | 849 (18.7%) | 474 (6.5%) |
| $75,000 to $99,999 | 510 (11.2%) | 1,045 (14.3%) |
| $100,000 to $149,999 | 510 (11.2%) | 1,145 (15.6%) |
| $150,000 or more | 1,000 (22.0%) | 1,627 (22.2%) |
| Total | 4,545 (100.0%) | 7,323 (100.0%) |
Property Value to Household Income Ratio in Talbot County
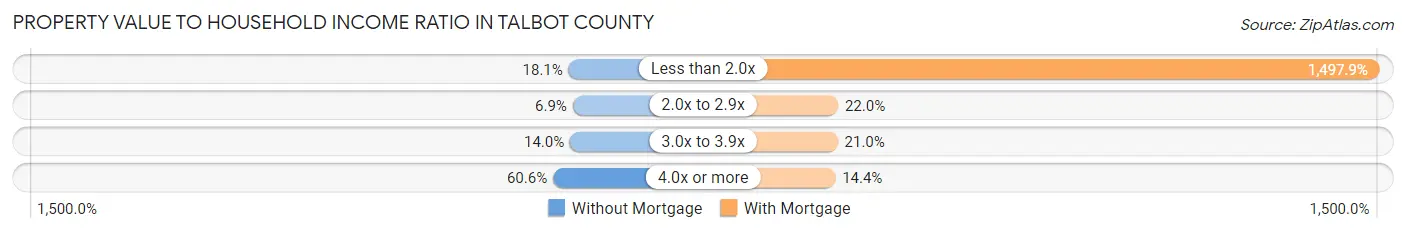
| Value-to-Income Ratio | Without Mortgage | With Mortgage |
| Less than 2.0x | 821 (18.1%) | 109,692 (1,497.9%) |
| 2.0x to 2.9x | 312 (6.9%) | 1,612 (22.0%) |
| 3.0x to 3.9x | 638 (14.0%) | 1,538 (21.0%) |
| 4.0x or more | 2,752 (60.6%) | 1,052 (14.4%) |
| Total | 4,545 (100.0%) | 7,323 (100.0%) |
Real Estate Taxes by Mortgage Status in Talbot County
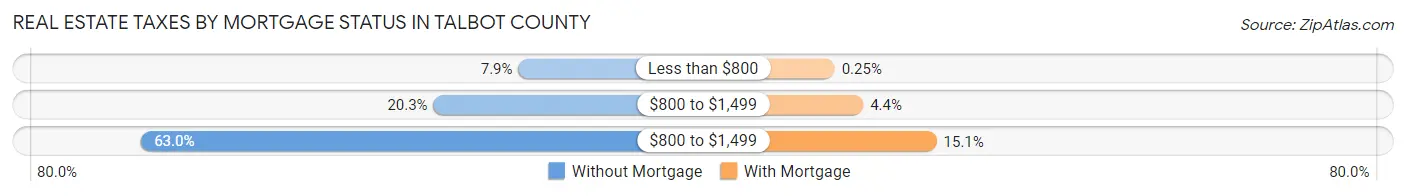
| Property Taxes | Without Mortgage | With Mortgage |
| Less than $800 | 357 (7.9%) | 18 (0.3%) |
| $800 to $1,499 | 921 (20.3%) | 323 (4.4%) |
| $800 to $1,499 | 2,861 (62.9%) | 1,108 (15.1%) |
| Total | 4,545 (100.0%) | 7,323 (100.0%) |
Health & Disability in Talbot County
Health Insurance Coverage by Age in Talbot County
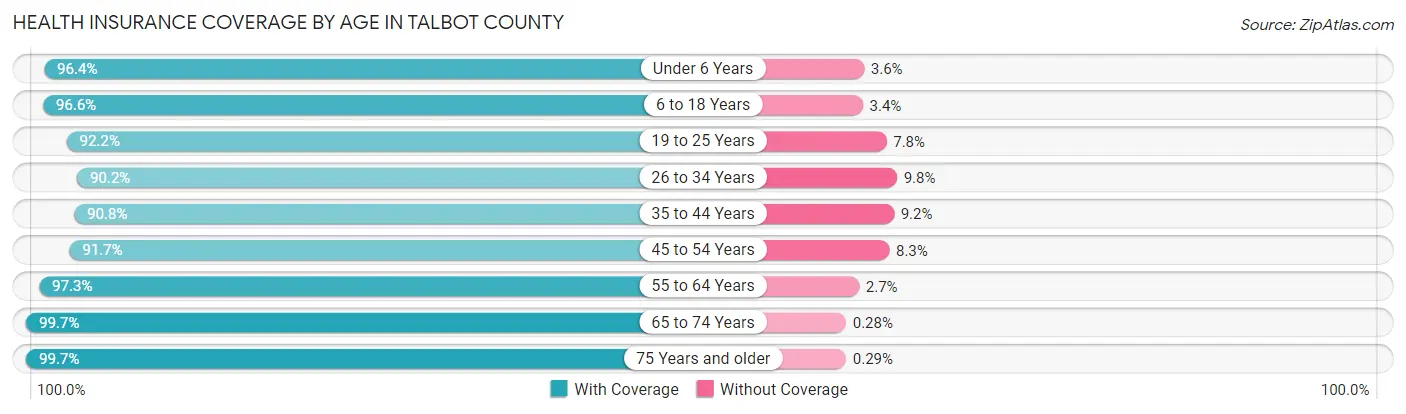
| Age Bracket | With Coverage | Without Coverage |
| Under 6 Years | 1,935 (96.4%) | 73 (3.6%) |
| 6 to 18 Years | 4,972 (96.6%) | 176 (3.4%) |
| 19 to 25 Years | 2,001 (92.2%) | 170 (7.8%) |
| 26 to 34 Years | 3,131 (90.2%) | 339 (9.8%) |
| 35 to 44 Years | 3,054 (90.8%) | 310 (9.2%) |
| 45 to 54 Years | 4,057 (91.7%) | 369 (8.3%) |
| 55 to 64 Years | 5,590 (97.3%) | 156 (2.7%) |
| 65 to 74 Years | 5,747 (99.7%) | 16 (0.3%) |
| 75 Years and older | 5,153 (99.7%) | 15 (0.3%) |
| Total | 35,640 (95.6%) | 1,624 (4.4%) |
Health Insurance Coverage by Citizenship Status in Talbot County
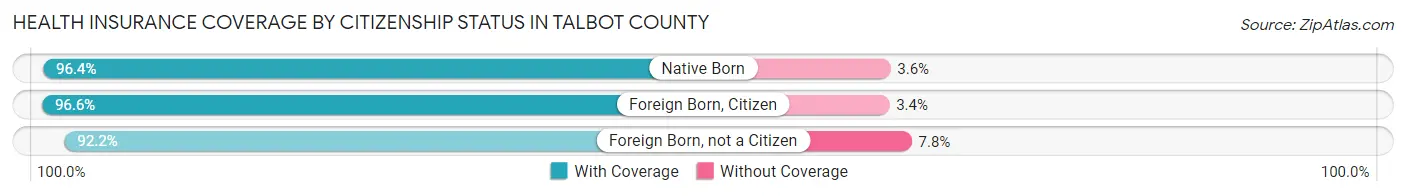
| Citizenship Status | With Coverage | Without Coverage |
| Native Born | 1,935 (96.4%) | 73 (3.6%) |
| Foreign Born, Citizen | 4,972 (96.6%) | 176 (3.4%) |
| Foreign Born, not a Citizen | 2,001 (92.2%) | 170 (7.8%) |
Health Insurance Coverage by Household Income in Talbot County
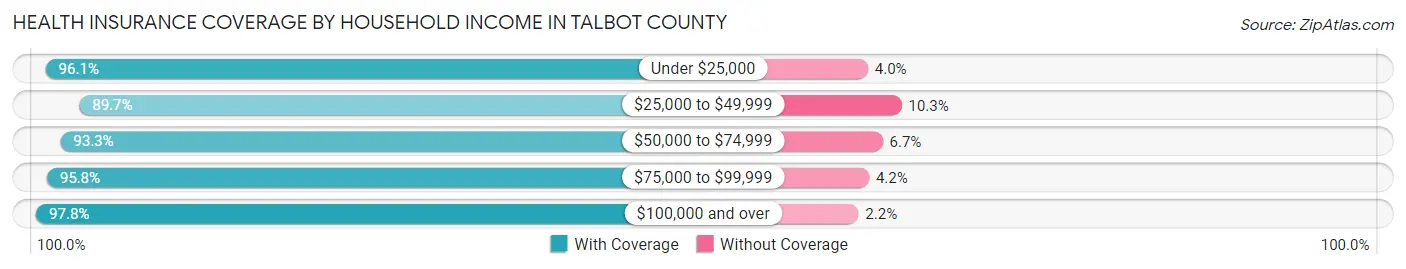
| Household Income | With Coverage | Without Coverage |
| Under $25,000 | 3,430 (96.1%) | 141 (4.0%) |
| $25,000 to $49,999 | 4,284 (89.7%) | 490 (10.3%) |
| $50,000 to $74,999 | 5,449 (93.3%) | 392 (6.7%) |
| $75,000 to $99,999 | 4,863 (95.8%) | 211 (4.2%) |
| $100,000 and over | 17,532 (97.8%) | 389 (2.2%) |
Public vs Private Health Insurance Coverage by Age in Talbot County
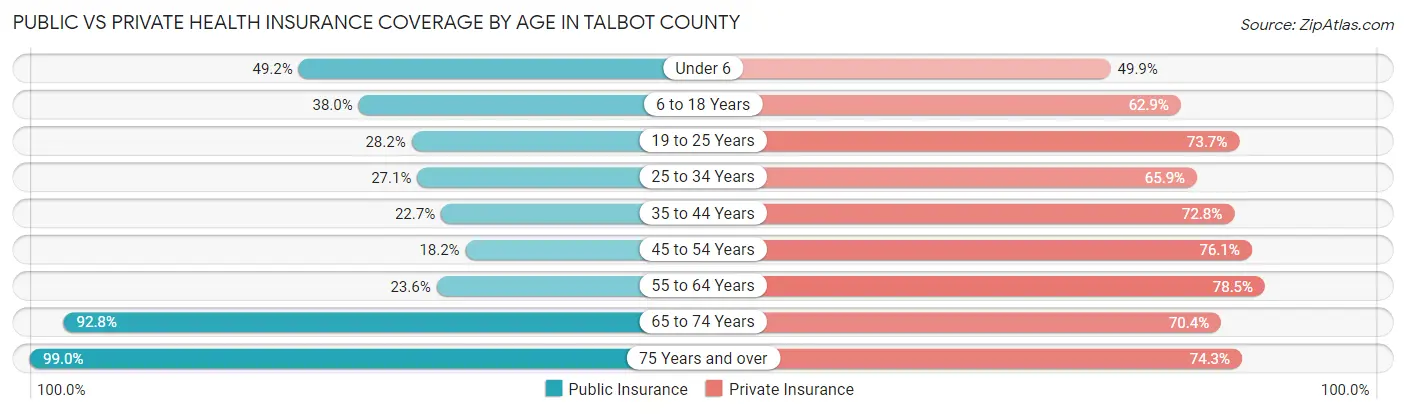
| Age Bracket | Public Insurance | Private Insurance |
| Under 6 | 987 (49.1%) | 1,002 (49.9%) |
| 6 to 18 Years | 1,957 (38.0%) | 3,238 (62.9%) |
| 19 to 25 Years | 612 (28.2%) | 1,601 (73.7%) |
| 25 to 34 Years | 941 (27.1%) | 2,287 (65.9%) |
| 35 to 44 Years | 764 (22.7%) | 2,449 (72.8%) |
| 45 to 54 Years | 804 (18.2%) | 3,367 (76.1%) |
| 55 to 64 Years | 1,353 (23.5%) | 4,512 (78.5%) |
| 65 to 74 Years | 5,345 (92.7%) | 4,056 (70.4%) |
| 75 Years and over | 5,114 (99.0%) | 3,837 (74.3%) |
| Total | 17,877 (48.0%) | 26,349 (70.7%) |
Disability Status by Sex by Age in Talbot County
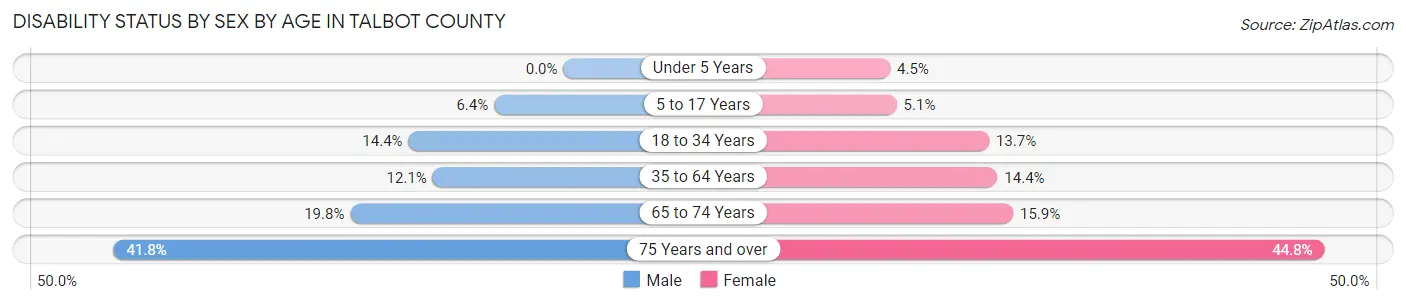
| Age Bracket | Male | Female |
| Under 5 Years | 0 (0.0%) | 32 (4.5%) |
| 5 to 17 Years | 178 (6.4%) | 128 (5.1%) |
| 18 to 34 Years | 414 (14.4%) | 417 (13.7%) |
| 35 to 64 Years | 785 (12.1%) | 1,020 (14.4%) |
| 65 to 74 Years | 510 (19.8%) | 506 (15.9%) |
| 75 Years and over | 959 (41.7%) | 1,286 (44.8%) |
Disability Class by Sex by Age in Talbot County
Disability Class: Hearing Difficulty
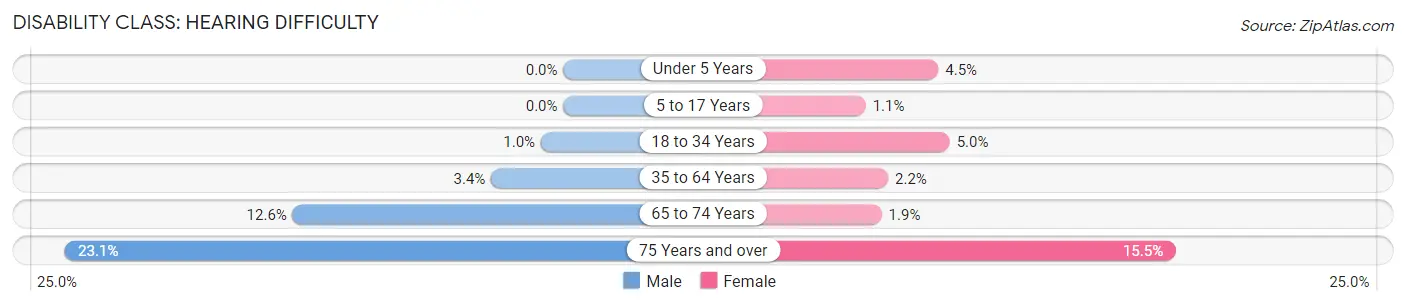
| Age Bracket | Male | Female |
| Under 5 Years | 0 (0.0%) | 32 (4.5%) |
| 5 to 17 Years | 0 (0.0%) | 28 (1.1%) |
| 18 to 34 Years | 30 (1.0%) | 153 (5.0%) |
| 35 to 64 Years | 217 (3.4%) | 152 (2.1%) |
| 65 to 74 Years | 324 (12.6%) | 59 (1.8%) |
| 75 Years and over | 531 (23.1%) | 444 (15.5%) |
Disability Class: Vision Difficulty
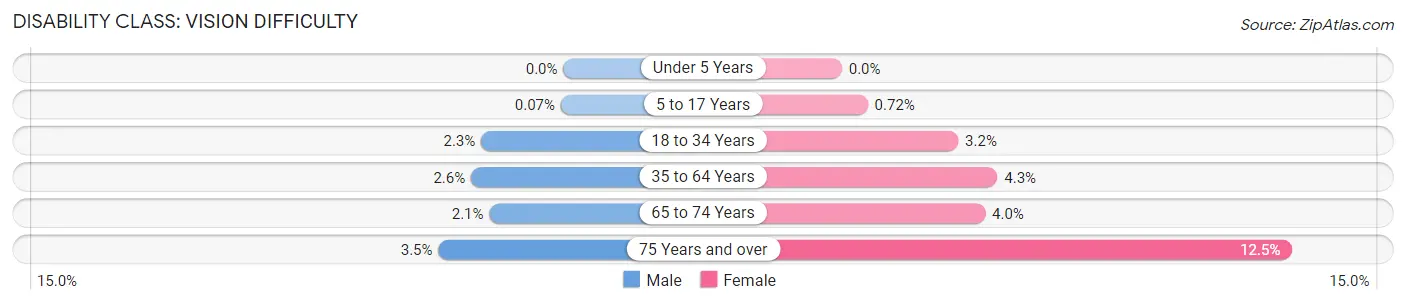
| Age Bracket | Male | Female |
| Under 5 Years | 0 (0.0%) | 0 (0.0%) |
| 5 to 17 Years | 2 (0.1%) | 18 (0.7%) |
| 18 to 34 Years | 66 (2.3%) | 99 (3.2%) |
| 35 to 64 Years | 166 (2.6%) | 306 (4.3%) |
| 65 to 74 Years | 53 (2.1%) | 127 (4.0%) |
| 75 Years and over | 80 (3.5%) | 360 (12.5%) |
Disability Class: Cognitive Difficulty
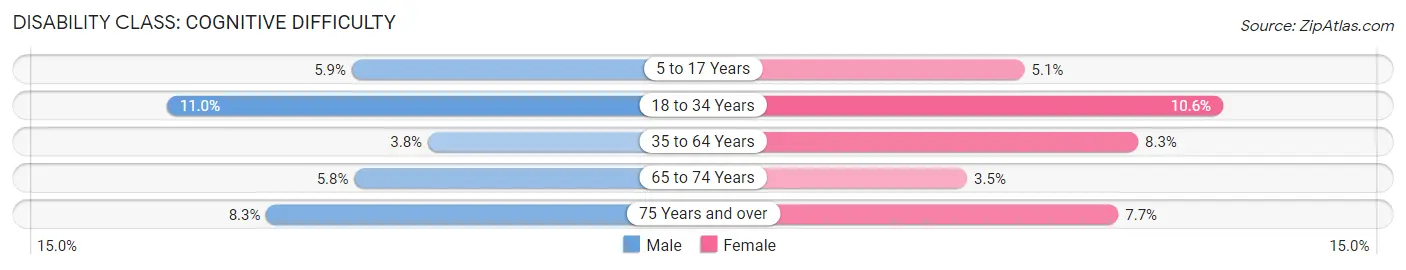
| Age Bracket | Male | Female |
| 5 to 17 Years | 163 (5.9%) | 128 (5.1%) |
| 18 to 34 Years | 318 (11.0%) | 324 (10.6%) |
| 35 to 64 Years | 244 (3.8%) | 583 (8.3%) |
| 65 to 74 Years | 150 (5.8%) | 111 (3.5%) |
| 75 Years and over | 190 (8.3%) | 221 (7.7%) |
Disability Class: Ambulatory Difficulty
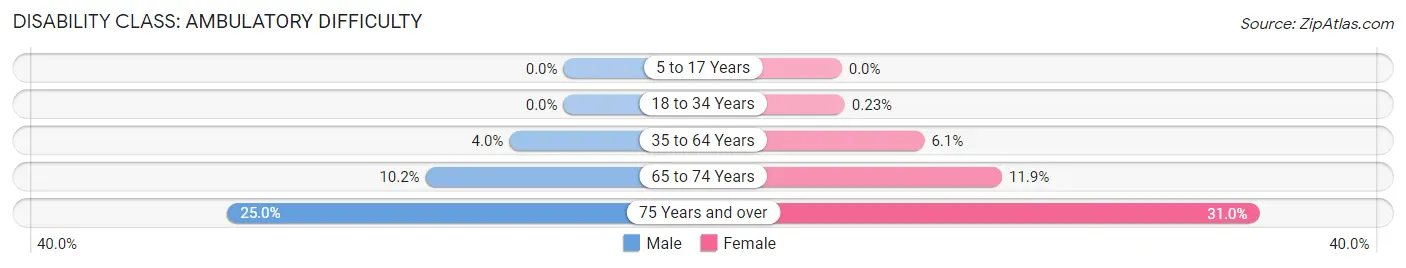
| Age Bracket | Male | Female |
| 5 to 17 Years | 0 (0.0%) | 0 (0.0%) |
| 18 to 34 Years | 0 (0.0%) | 7 (0.2%) |
| 35 to 64 Years | 260 (4.0%) | 434 (6.1%) |
| 65 to 74 Years | 264 (10.2%) | 379 (11.9%) |
| 75 Years and over | 573 (24.9%) | 890 (31.0%) |
Disability Class: Self-Care Difficulty
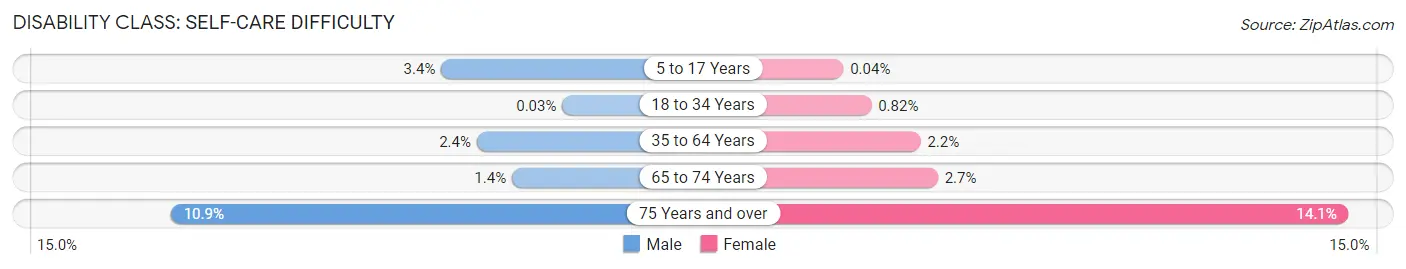
| Age Bracket | Male | Female |
| 5 to 17 Years | 94 (3.4%) | 1 (0.0%) |
| 18 to 34 Years | 1 (0.0%) | 25 (0.8%) |
| 35 to 64 Years | 156 (2.4%) | 155 (2.2%) |
| 65 to 74 Years | 37 (1.4%) | 85 (2.7%) |
| 75 Years and over | 251 (10.9%) | 405 (14.1%) |
Technology Access in Talbot County
Computing Device Access in Talbot County
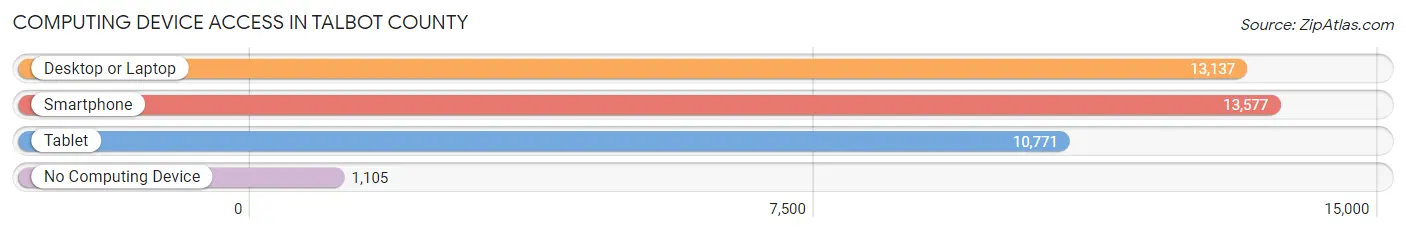
| Device Type | # Households | % Households |
| Desktop or Laptop | 13,137 | 80.7% |
| Smartphone | 13,577 | 83.5% |
| Tablet | 10,771 | 66.2% |
| No Computing Device | 1,105 | 6.8% |
| Total | 16,270 | 100.0% |
Internet Access in Talbot County
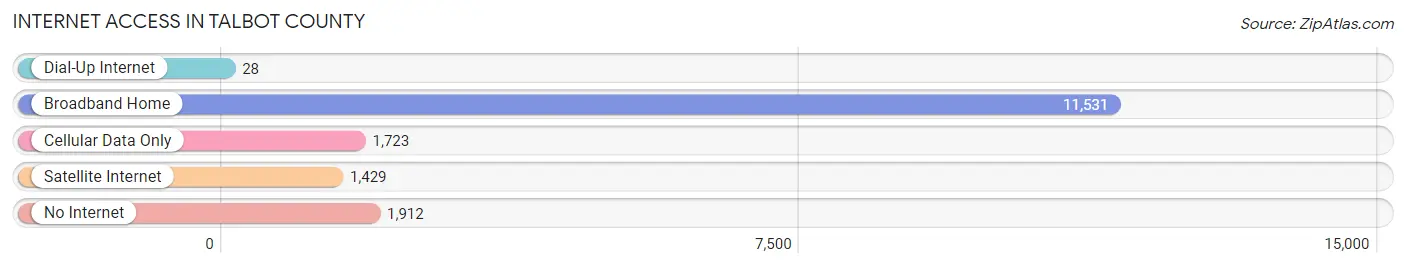
| Internet Type | # Households | % Households |
| Dial-Up Internet | 28 | 0.2% |
| Broadband Home | 11,531 | 70.9% |
| Cellular Data Only | 1,723 | 10.6% |
| Satellite Internet | 1,429 | 8.8% |
| No Internet | 1,912 | 11.7% |
| Total | 16,270 | 100.0% |
Talbot County Summary
Talbot County is located in the Eastern Shore region of Maryland, and is bordered by Caroline, Queen Anne’s, Dorchester, and Kent counties. The county seat is Easton, and the county is home to a population of 37,782 people, according to the 2010 census.
History
Talbot County was established in 1662, and is one of the oldest counties in Maryland. It was named after Lady Grace Talbot, the sister of Lord Baltimore, who was the founder of the Maryland colony. The county was originally part of a larger area known as the Eastern Shore, which was divided into several counties in the late 1600s.
The county was home to a variety of Native American tribes, including the Nanticoke, Assateague, and Choptank. The first European settlers arrived in the area in the early 1600s, and the county was officially established in 1662.
The county was an important center of trade and commerce during the colonial period, and it was home to several prominent families, including the Lloyd, Tilghman, and Lloyd families. The county was also home to a number of prominent plantations, including Wye House, which was owned by the Lloyd family.
During the Revolutionary War, Talbot County was a major center of activity, and it was the site of several battles. After the war, the county continued to be an important center of trade and commerce, and it was home to a number of prominent businesses, including the Easton Foundry and the Easton Iron Works.
Geography
Talbot County is located in the Eastern Shore region of Maryland, and is bordered by Caroline, Queen Anne’s, Dorchester, and Kent counties. The county is located on the western shore of the Chesapeake Bay, and it is home to a variety of landscapes, including forests, wetlands, and agricultural land.
The county is home to a number of rivers, including the Choptank, Tred Avon, and Miles Rivers. The county is also home to a number of parks, including the Blackwater National Wildlife Refuge, which is located on the eastern shore of the Chesapeake Bay.
Economy
The economy of Talbot County is largely based on agriculture, tourism, and manufacturing. The county is home to a number of farms, which produce a variety of crops, including corn, soybeans, wheat, and hay. The county is also home to a number of wineries, which produce a variety of wines.
The county is home to a number of manufacturing companies, including Easton Foundry and Easton Iron Works. The county is also home to a number of tourism-related businesses, including hotels, restaurants, and shops.
Demographics
According to the 2010 census, Talbot County is home to a population of 37,782 people. The population is largely white (90.2%), with African Americans making up 6.2% of the population, and Hispanics making up 2.3% of the population. The median household income in the county is $60,945, and the median age is 44.7 years.
Common Questions
What is the Total Population of Talbot County?
Total Population of Talbot County is 37,663.
What is the Total Male Population of Talbot County?
Total Male Population of Talbot County is 18,023.
What is the Total Female Population of Talbot County?
Total Female Population of Talbot County is 19,640.
What is the Ratio of Males per 100 Females in Talbot County?
There are 91.77 Males per 100 Females in Talbot County.
What is the Ratio of Females per 100 Males in Talbot County?
There are 108.97 Females per 100 Males in Talbot County.
What is the Median Population Age in Talbot County?
Median Population Age in Talbot County is 51.4 Years.
What is the Average Family Size in Talbot County
Average Family Size in Talbot County is 2.9 People.
What is the Average Household Size in Talbot County
Average Household Size in Talbot County is 2.3 People.
What is Per Capita Income in Talbot County?
Per Capita income in Talbot County is $52,555.
What is the Median Family Income in Talbot County?
Median Family Income in Talbot County is $100,321.
What is the Median Household income in Talbot County?
Median Household Income in Talbot County is $81,667.
What is Income or Wage Gap in Talbot County?
Income or Wage Gap in Talbot County is 24.5%.
Women in Talbot County earn 75.5 cents for every dollar earned by a man.
What is Family Income Deficit in Talbot County?
Family Income Deficit in Talbot County is $8,997.
Families that are below poverty line in Talbot County earn $8,997 less on average than the poverty threshold level.
What is Inequality or Gini Index in Talbot County?
Inequality or Gini Index in Talbot County is 0.50.
How Large is the Labor Force in Talbot County?
There are 17,661 People in the Labor Forcein in Talbot County.
What is the Percentage of People in the Labor Force in Talbot County?
55.8% of People are in the Labor Force in Talbot County.
What is the Unemployment Rate in Talbot County?
Unemployment Rate in Talbot County is 3.2%.