St. Mary's County, MD
St. Mary's County Overview
113,814
TOTAL POPULATION
57,408
MALE POPULATION
56,406
FEMALE POPULATION
101.78
MALES / 100 FEMALES
98.25
FEMALES / 100 MALES
37.0
MEDIAN AGE
3.2
AVG FAMILY SIZE
2.7
AVG HOUSEHOLD SIZE
$49,755
PER CAPITA INCOME
$132,926
AVG FAMILY INCOME
$113,668
AVG HOUSEHOLD INCOME
38.8%
WAGE / INCOME GAP [ % ]
61.2¢/ $1
WAGE / INCOME GAP [ $ ]
$11,107
FAMILY INCOME DEFICIT
0.41
INEQUALITY / GINI INDEX
61,544
LABOR FORCE [ PEOPLE ]
68.4%
PERCENT IN LABOR FORCE
3.7%
UNEMPLOYMENT RATE
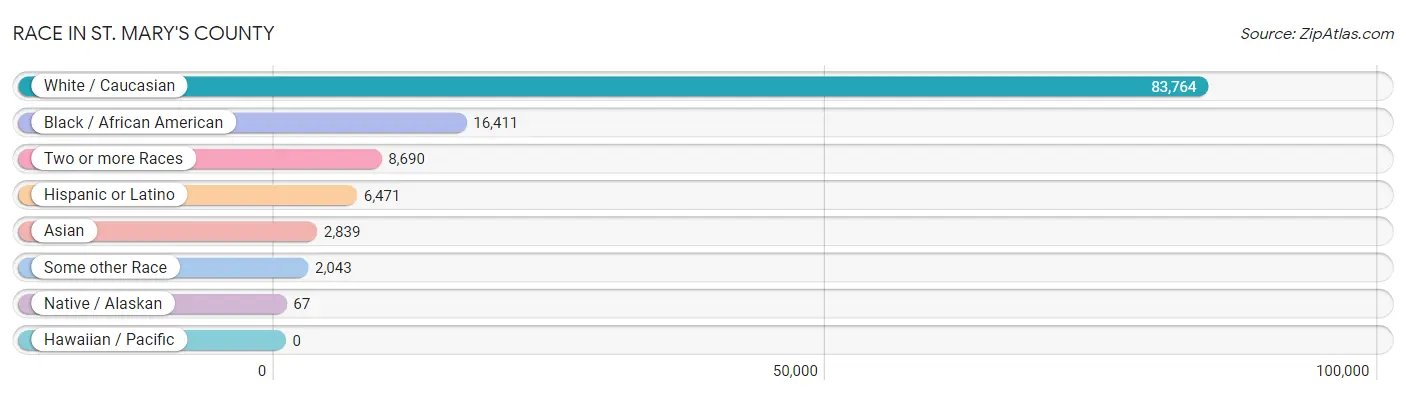
Race in St. Mary's County
The most populous races in St. Mary's County are White / Caucasian (83,764 | 73.6%), Black / African American (16,411 | 14.4%), and Two or more Races (8,690 | 7.6%).
| Race | # Population | % Population |
| Asian | 2,839 | 2.5% |
| Black / African American | 16,411 | 14.4% |
| Hawaiian / Pacific | 0 | 0.0% |
| Hispanic or Latino | 6,471 | 5.7% |
| Native / Alaskan | 67 | 0.1% |
| White / Caucasian | 83,764 | 73.6% |
| Two or more Races | 8,690 | 7.6% |
| Some other Race | 2,043 | 1.8% |
| Total | 113,814 | 100.0% |
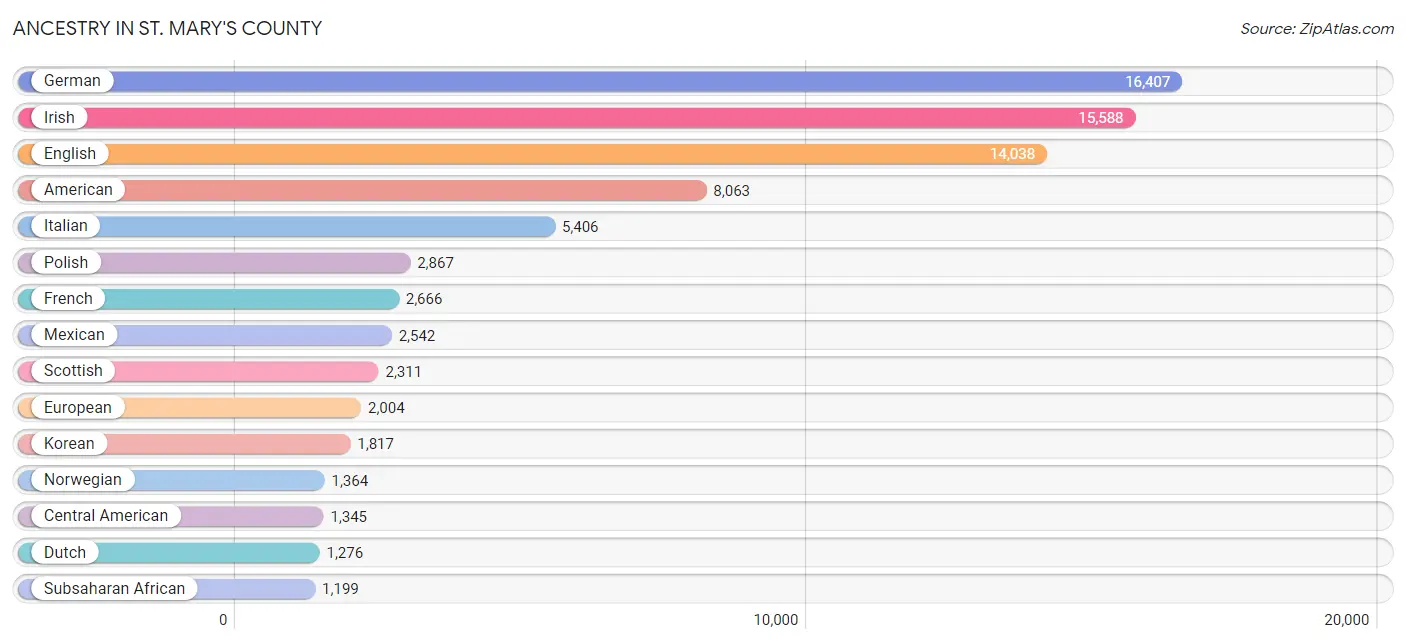
Ancestry in St. Mary's County
The most populous ancestries reported in St. Mary's County are German (16,407 | 14.4%), Irish (15,588 | 13.7%), English (14,038 | 12.3%), American (8,063 | 7.1%), and Italian (5,406 | 4.8%), together accounting for 52.3% of all St. Mary's County residents.
| Ancestry | # Population | % Population |
| African | 689 | 0.6% |
| Aleut | 156 | 0.1% |
| American | 8,063 | 7.1% |
| Arab | 89 | 0.1% |
| Argentinean | 8 | 0.0% |
| Armenian | 110 | 0.1% |
| Australian | 106 | 0.1% |
| Austrian | 137 | 0.1% |
| Barbadian | 63 | 0.1% |
| Belgian | 104 | 0.1% |
| Bhutanese | 690 | 0.6% |
| Blackfeet | 220 | 0.2% |
| Bolivian | 48 | 0.0% |
| Brazilian | 92 | 0.1% |
| British | 1,073 | 0.9% |
| Bulgarian | 171 | 0.2% |
| Burmese | 427 | 0.4% |
| Cajun | 23 | 0.0% |
| Canadian | 97 | 0.1% |
| Celtic | 28 | 0.0% |
| Central American | 1,345 | 1.2% |
| Central American Indian | 19 | 0.0% |
| Cherokee | 581 | 0.5% |
| Chippewa | 20 | 0.0% |
| Colombian | 305 | 0.3% |
| Croatian | 41 | 0.0% |
| Cuban | 74 | 0.1% |
| Czech | 769 | 0.7% |
| Czechoslovakian | 133 | 0.1% |
| Danish | 359 | 0.3% |
| Delaware | 8 | 0.0% |
| Dominican | 24 | 0.0% |
| Dutch | 1,276 | 1.1% |
| Eastern European | 294 | 0.3% |
| Ecuadorian | 141 | 0.1% |
| English | 14,038 | 12.3% |
| Estonian | 8 | 0.0% |
| Ethiopian | 23 | 0.0% |
| European | 2,004 | 1.8% |
| Filipino | 102 | 0.1% |
| Finnish | 67 | 0.1% |
| French | 2,666 | 2.3% |
| French American Indian | 5 | 0.0% |
| French Canadian | 436 | 0.4% |
| German | 16,407 | 14.4% |
| Ghanaian | 41 | 0.0% |
| Greek | 462 | 0.4% |
| Guamanian / Chamorro | 23 | 0.0% |
| Guatemalan | 358 | 0.3% |
| Guyanese | 11 | 0.0% |
| Haitian | 149 | 0.1% |
| Honduran | 22 | 0.0% |
| Hungarian | 529 | 0.5% |
| Icelander | 204 | 0.2% |
| Indian (Asian) | 496 | 0.4% |
| Inupiat | 8 | 0.0% |
| Iranian | 181 | 0.2% |
| Irish | 15,588 | 13.7% |
| Iroquois | 72 | 0.1% |
| Italian | 5,406 | 4.8% |
| Jamaican | 169 | 0.2% |
| Korean | 1,817 | 1.6% |
| Laotian | 22 | 0.0% |
| Latvian | 16 | 0.0% |
| Lebanese | 89 | 0.1% |
| Liberian | 26 | 0.0% |
| Lithuanian | 149 | 0.1% |
| Luxembourger | 27 | 0.0% |
| Macedonian | 13 | 0.0% |
| Mexican | 2,542 | 2.2% |
| Native Hawaiian | 17 | 0.0% |
| Navajo | 2 | 0.0% |
| Nicaraguan | 37 | 0.0% |
| Nigerian | 237 | 0.2% |
| Northern European | 161 | 0.1% |
| Norwegian | 1,364 | 1.2% |
| Pakistani | 90 | 0.1% |
| Panamanian | 83 | 0.1% |
| Pennsylvania German | 103 | 0.1% |
| Peruvian | 188 | 0.2% |
| Polish | 2,867 | 2.5% |
| Portuguese | 170 | 0.2% |
| Puerto Rican | 830 | 0.7% |
| Russian | 865 | 0.8% |
| Salvadoran | 845 | 0.7% |
| Scandinavian | 603 | 0.5% |
| Scotch-Irish | 1,063 | 0.9% |
| Scottish | 2,311 | 2.0% |
| Seminole | 52 | 0.1% |
| Serbian | 65 | 0.1% |
| Sioux | 34 | 0.0% |
| Slavic | 141 | 0.1% |
| Slovak | 296 | 0.3% |
| Somali | 67 | 0.1% |
| South American | 701 | 0.6% |
| South American Indian | 16 | 0.0% |
| Spaniard | 622 | 0.5% |
| Spanish | 200 | 0.2% |
| Sri Lankan | 484 | 0.4% |
| Subsaharan African | 1,199 | 1.1% |
| Swedish | 684 | 0.6% |
| Swiss | 331 | 0.3% |
| Thai | 683 | 0.6% |
| Trinidadian and Tobagonian | 394 | 0.4% |
| Turkish | 41 | 0.0% |
| Ukrainian | 279 | 0.3% |
| Venezuelan | 11 | 0.0% |
| Welsh | 680 | 0.6% |
| West Indian | 32 | 0.0% | View All 109 Rows |
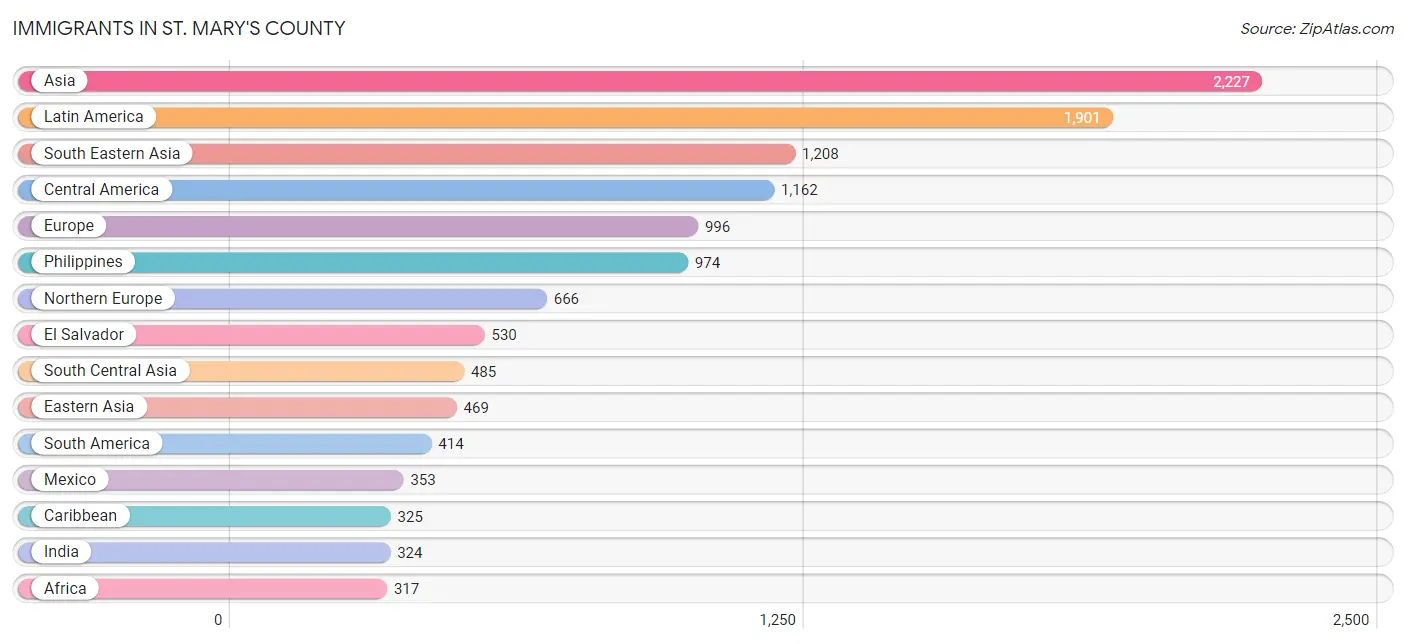
Immigrants in St. Mary's County
The most numerous immigrant groups reported in St. Mary's County came from Asia (2,227 | 2.0%), Latin America (1,901 | 1.7%), South Eastern Asia (1,208 | 1.1%), Central America (1,162 | 1.0%), and Europe (996 | 0.9%), together accounting for 6.6% of all St. Mary's County residents.
| Immigration Origin | # Population | % Population |
| Africa | 317 | 0.3% |
| Argentina | 17 | 0.0% |
| Asia | 2,227 | 2.0% |
| Australia | 93 | 0.1% |
| Austria | 11 | 0.0% |
| Barbados | 63 | 0.1% |
| Belgium | 8 | 0.0% |
| Bolivia | 16 | 0.0% |
| Bulgaria | 136 | 0.1% |
| Cameroon | 1 | 0.0% |
| Canada | 159 | 0.1% |
| Caribbean | 325 | 0.3% |
| Central America | 1,162 | 1.0% |
| China | 211 | 0.2% |
| Colombia | 216 | 0.2% |
| Cuba | 1 | 0.0% |
| Denmark | 65 | 0.1% |
| Dominican Republic | 4 | 0.0% |
| Eastern Africa | 106 | 0.1% |
| Eastern Asia | 469 | 0.4% |
| Eastern Europe | 176 | 0.2% |
| Ecuador | 53 | 0.1% |
| Egypt | 28 | 0.0% |
| El Salvador | 530 | 0.5% |
| England | 114 | 0.1% |
| Ethiopia | 39 | 0.0% |
| Europe | 996 | 0.9% |
| Germany | 94 | 0.1% |
| Ghana | 74 | 0.1% |
| Guatemala | 80 | 0.1% |
| Haiti | 69 | 0.1% |
| Honduras | 22 | 0.0% |
| Hong Kong | 30 | 0.0% |
| India | 324 | 0.3% |
| Indonesia | 9 | 0.0% |
| Iran | 10 | 0.0% |
| Italy | 5 | 0.0% |
| Jamaica | 90 | 0.1% |
| Japan | 88 | 0.1% |
| Korea | 170 | 0.2% |
| Kuwait | 19 | 0.0% |
| Latin America | 1,901 | 1.7% |
| Liberia | 14 | 0.0% |
| Mexico | 353 | 0.3% |
| Middle Africa | 1 | 0.0% |
| Nepal | 21 | 0.0% |
| Netherlands | 12 | 0.0% |
| Nicaragua | 22 | 0.0% |
| Nigeria | 59 | 0.1% |
| Northern Africa | 28 | 0.0% |
| Northern Europe | 666 | 0.6% |
| Norway | 237 | 0.2% |
| Oceania | 93 | 0.1% |
| Pakistan | 107 | 0.1% |
| Panama | 155 | 0.1% |
| Peru | 101 | 0.1% |
| Philippines | 974 | 0.9% |
| Portugal | 14 | 0.0% |
| Russia | 35 | 0.0% |
| Scotland | 20 | 0.0% |
| Sierra Leone | 7 | 0.0% |
| Somalia | 67 | 0.1% |
| South America | 414 | 0.4% |
| South Central Asia | 485 | 0.4% |
| South Eastern Asia | 1,208 | 1.1% |
| Southern Europe | 29 | 0.0% |
| Spain | 10 | 0.0% |
| Sri Lanka | 23 | 0.0% |
| Thailand | 59 | 0.1% |
| Trinidad and Tobago | 98 | 0.1% |
| Turkey | 46 | 0.0% |
| Ukraine | 5 | 0.0% |
| Venezuela | 11 | 0.0% |
| Vietnam | 166 | 0.2% |
| Western Africa | 182 | 0.2% |
| Western Asia | 65 | 0.1% |
| Western Europe | 125 | 0.1% | View All 77 Rows |
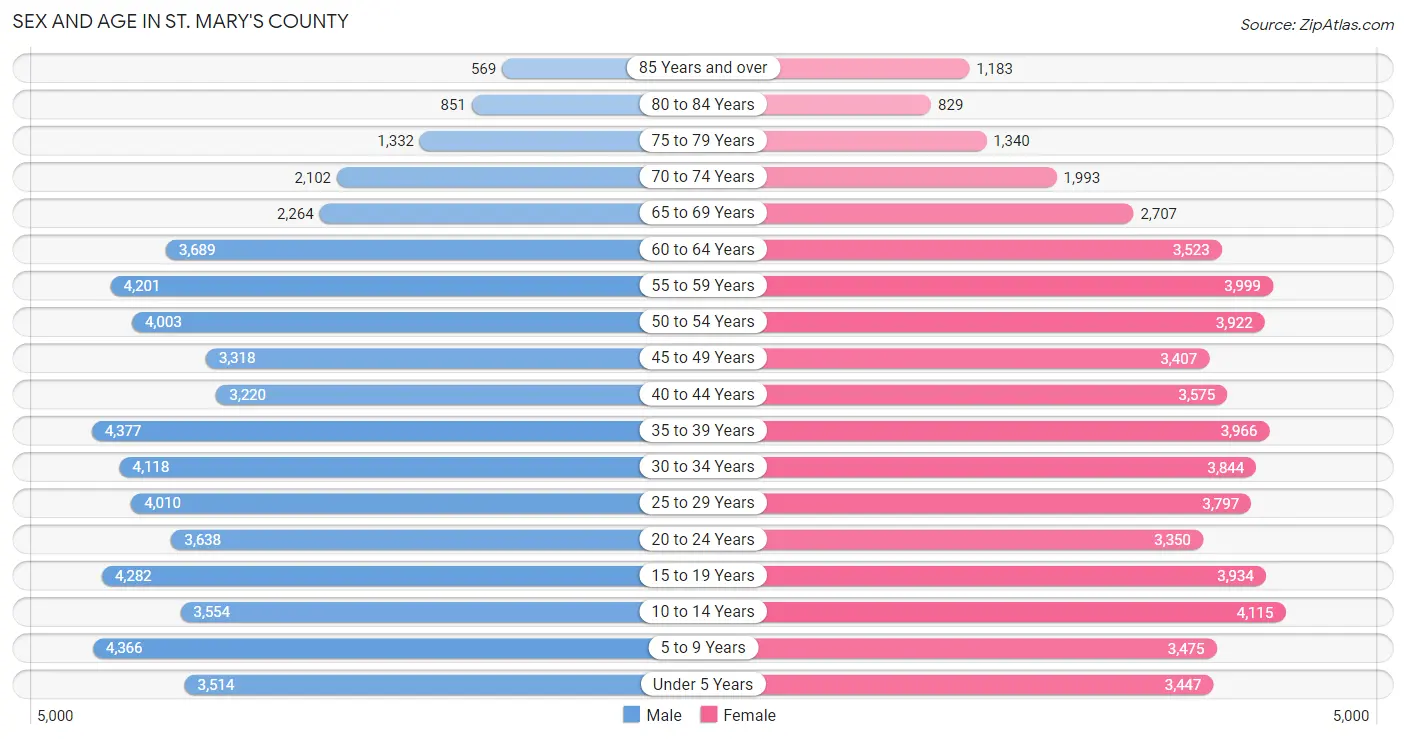
Sex and Age in St. Mary's County
Sex and Age in St. Mary's County
The most populous age groups in St. Mary's County are 35 to 39 Years (4,377 | 7.6%) for men and 10 to 14 Years (4,115 | 7.3%) for women.
| Age Bracket | Male | Female |
| Under 5 Years | 3,514 (6.1%) | 3,447 (6.1%) |
| 5 to 9 Years | 4,366 (7.6%) | 3,475 (6.2%) |
| 10 to 14 Years | 3,554 (6.2%) | 4,115 (7.3%) |
| 15 to 19 Years | 4,282 (7.5%) | 3,934 (7.0%) |
| 20 to 24 Years | 3,638 (6.3%) | 3,350 (5.9%) |
| 25 to 29 Years | 4,010 (7.0%) | 3,797 (6.7%) |
| 30 to 34 Years | 4,118 (7.2%) | 3,844 (6.8%) |
| 35 to 39 Years | 4,377 (7.6%) | 3,966 (7.0%) |
| 40 to 44 Years | 3,220 (5.6%) | 3,575 (6.3%) |
| 45 to 49 Years | 3,318 (5.8%) | 3,407 (6.0%) |
| 50 to 54 Years | 4,003 (7.0%) | 3,922 (7.0%) |
| 55 to 59 Years | 4,201 (7.3%) | 3,999 (7.1%) |
| 60 to 64 Years | 3,689 (6.4%) | 3,523 (6.2%) |
| 65 to 69 Years | 2,264 (3.9%) | 2,707 (4.8%) |
| 70 to 74 Years | 2,102 (3.7%) | 1,993 (3.5%) |
| 75 to 79 Years | 1,332 (2.3%) | 1,340 (2.4%) |
| 80 to 84 Years | 851 (1.5%) | 829 (1.5%) |
| 85 Years and over | 569 (1.0%) | 1,183 (2.1%) |
| Total | 57,408 (100.0%) | 56,406 (100.0%) |
Families and Households in St. Mary's County
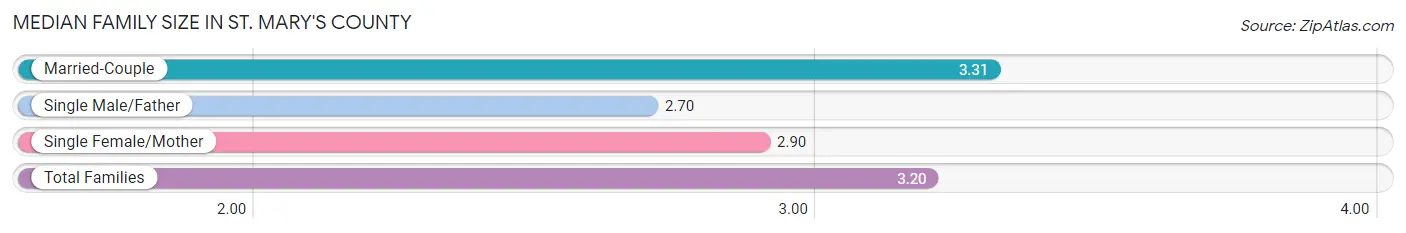
Median Family Size in St. Mary's County
The median family size in St. Mary's County is 3.20 persons per family, with married-couple families (22,000 | 75.5%) accounting for the largest median family size of 3.31 persons per family. On the other hand, single male/father families (1,833 | 6.3%) represent the smallest median family size with 2.70 persons per family.
| Family Type | # Families | Family Size |
| Married-Couple | 22,000 (75.5%) | 3.31 |
| Single Male/Father | 1,833 (6.3%) | 2.70 |
| Single Female/Mother | 5,304 (18.2%) | 2.90 |
| Total Families | 29,137 (100.0%) | 3.20 |
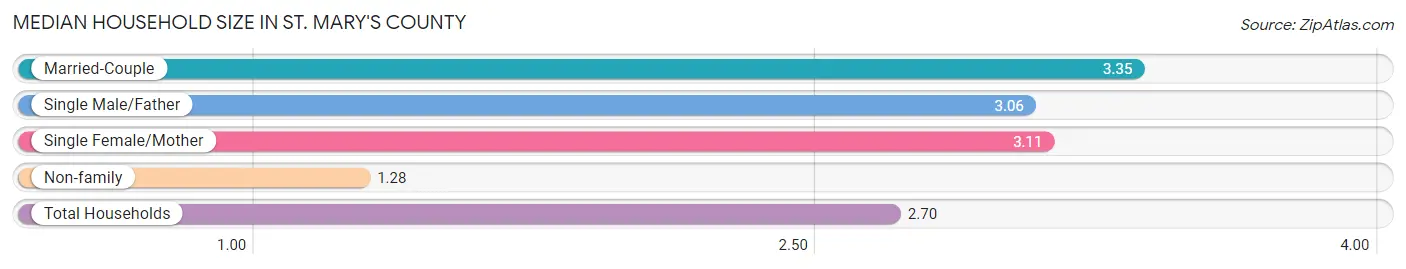
Median Household Size in St. Mary's County
The median household size in St. Mary's County is 2.70 persons per household, with married-couple households (22,000 | 53.4%) accounting for the largest median household size of 3.35 persons per household. non-family households (12,074 | 29.3%) represent the smallest median household size with 1.28 persons per household.
| Household Type | # Households | Household Size |
| Married-Couple | 22,000 (53.4%) | 3.35 |
| Single Male/Father | 1,833 (4.4%) | 3.06 |
| Single Female/Mother | 5,304 (12.9%) | 3.11 |
| Non-family | 12,074 (29.3%) | 1.28 |
| Total Households | 41,211 (100.0%) | 2.70 |
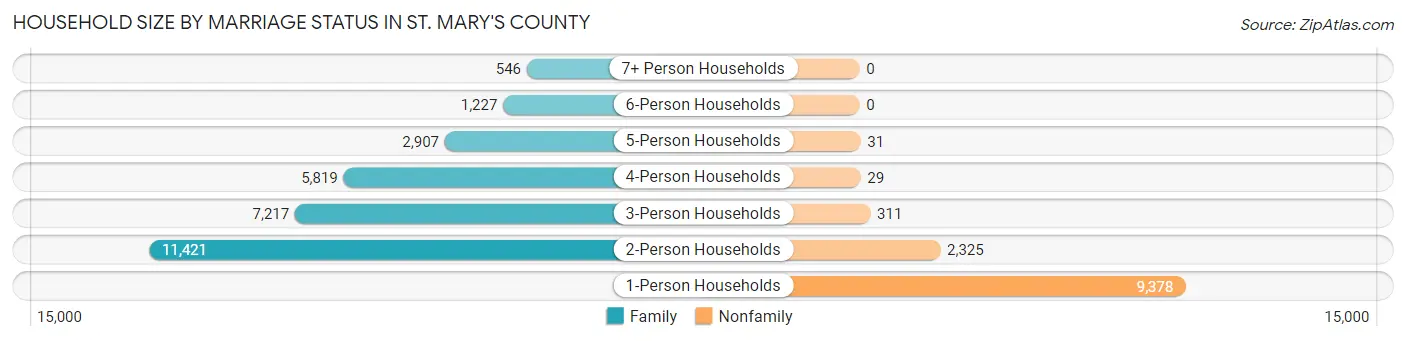
Household Size by Marriage Status in St. Mary's County
Out of a total of 41,211 households in St. Mary's County, 29,137 (70.7%) are family households, while 12,074 (29.3%) are nonfamily households. The most numerous type of family households are 2-person households, comprising 11,421, and the most common type of nonfamily households are 1-person households, comprising 9,378.
| Household Size | Family Households | Nonfamily Households |
| 1-Person Households | - | 9,378 (22.8%) |
| 2-Person Households | 11,421 (27.7%) | 2,325 (5.6%) |
| 3-Person Households | 7,217 (17.5%) | 311 (0.7%) |
| 4-Person Households | 5,819 (14.1%) | 29 (0.1%) |
| 5-Person Households | 2,907 (7.0%) | 31 (0.1%) |
| 6-Person Households | 1,227 (3.0%) | 0 (0.0%) |
| 7+ Person Households | 546 (1.3%) | 0 (0.0%) |
| Total | 29,137 (70.7%) | 12,074 (29.3%) |
Female Fertility in St. Mary's County
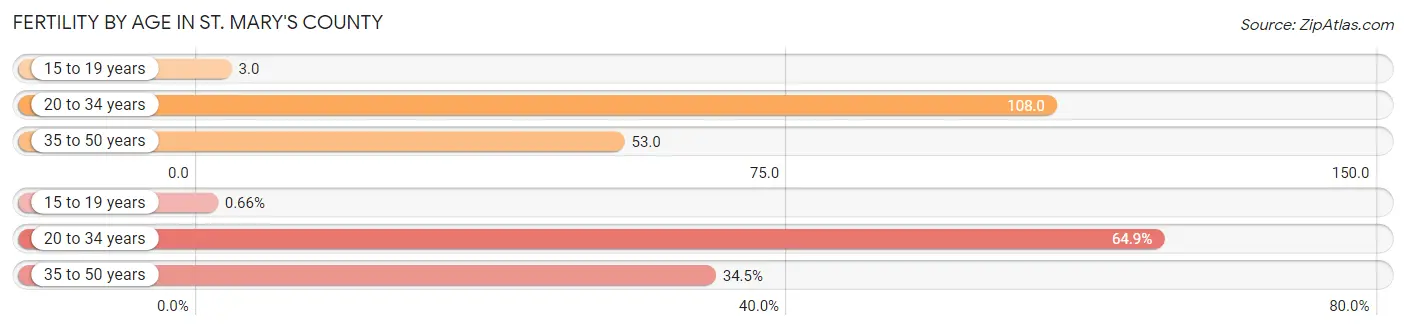
Fertility by Age in St. Mary's County
Average fertility rate in St. Mary's County is 68.0 births per 1,000 women. Women in the age bracket of 20 to 34 years have the highest fertility rate with 108.0 births per 1,000 women. Women in the age bracket of 20 to 34 years acount for 64.9% of all women with births.
| Age Bracket | Women with Births | Births / 1,000 Women |
| 15 to 19 years | 12 (0.7%) | 3.0 |
| 20 to 34 years | 1,188 (64.9%) | 108.0 |
| 35 to 50 years | 631 (34.5%) | 53.0 |
| Total | 1,831 (100.0%) | 68.0 |
Fertility by Age by Marriage Status in St. Mary's County
64.4% of women with births (1,831) in St. Mary's County are married. The highest percentage of unmarried women with births falls into 15 to 19 years age bracket with 100.0% of them unmarried at the time of birth, while the lowest percentage of unmarried women with births belong to 35 to 50 years age bracket with 29.9% of them unmarried.
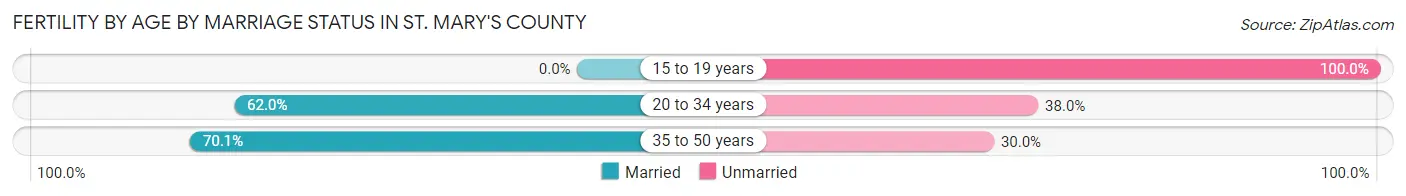
| Age Bracket | Married | Unmarried |
| 15 to 19 years | 0 (0.0%) | 12 (100.0%) |
| 20 to 34 years | 737 (62.0%) | 451 (38.0%) |
| 35 to 50 years | 442 (70.1%) | 189 (29.9%) |
| Total | 1,179 (64.4%) | 652 (35.6%) |
Fertility by Education in St. Mary's County
Average fertility rate in St. Mary's County is 68.0 births per 1,000 women. Women with the education attainment of graduate degree have the highest fertility rate of 108.0 births per 1,000 women, while women with the education attainment of less than high school have the lowest fertility at 32.0 births per 1,000 women. Women with the education attainment of high school diploma represent 26.3% of all women with births.
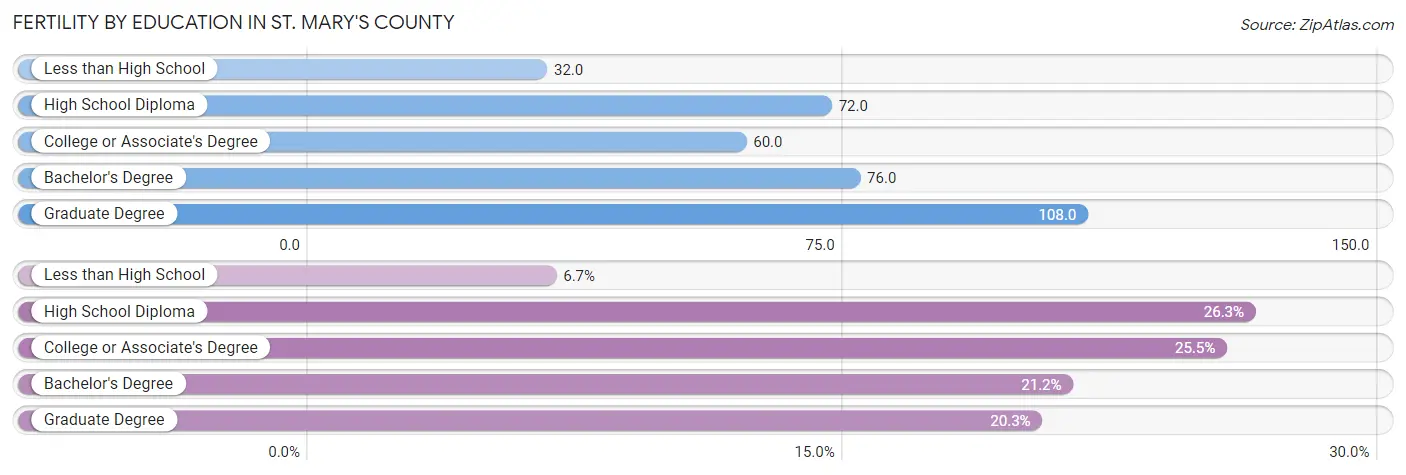
| Educational Attainment | Women with Births | Births / 1,000 Women |
| Less than High School | 122 (6.7%) | 32.0 |
| High School Diploma | 482 (26.3%) | 72.0 |
| College or Associate's Degree | 467 (25.5%) | 60.0 |
| Bachelor's Degree | 388 (21.2%) | 76.0 |
| Graduate Degree | 372 (20.3%) | 108.0 |
| Total | 1,831 (100.0%) | 68.0 |
Fertility by Education by Marriage Status in St. Mary's County
35.6% of women with births in St. Mary's County are unmarried. Women with the educational attainment of graduate degree are most likely to be married with 91.7% of them married at childbirth, while women with the educational attainment of less than high school are least likely to be married with 88.5% of them unmarried at childbirth.
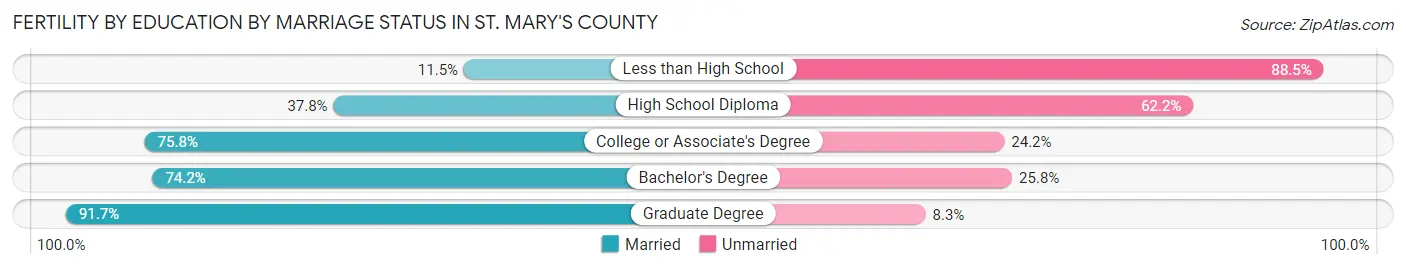
| Educational Attainment | Married | Unmarried |
| Less than High School | 14 (11.5%) | 108 (88.5%) |
| High School Diploma | 182 (37.8%) | 300 (62.2%) |
| College or Associate's Degree | 354 (75.8%) | 113 (24.2%) |
| Bachelor's Degree | 288 (74.2%) | 100 (25.8%) |
| Graduate Degree | 341 (91.7%) | 31 (8.3%) |
| Total | 1,179 (64.4%) | 652 (35.6%) |
Income in St. Mary's County
Income Overview in St. Mary's County
Per Capita Income in St. Mary's County is $49,755, while median incomes of families and households are $132,926 and $113,668 respectively.
| Characteristic | Number | Measure |
| Per Capita Income | 113,814 | $49,755 |
| Median Family Income | 29,137 | $132,926 |
| Mean Family Income | 29,137 | $148,387 |
| Median Household Income | 41,211 | $113,668 |
| Mean Household Income | 41,211 | $134,383 |
| Income Deficit | 29,137 | $11,107 |
| Wage / Income Gap (%) | 113,814 | 38.80% |
| Wage / Income Gap ($) | 113,814 | 61.20¢ per $1 |
| Gini / Inequality Index | 113,814 | 0.41 |
Earnings by Sex in St. Mary's County
Average Earnings in St. Mary's County are $60,329, $74,626 for men and $45,674 for women, a difference of 38.8%.
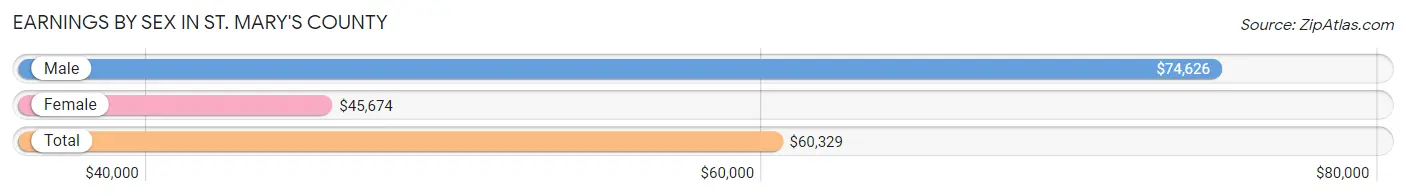
| Sex | Number | Average Earnings |
| Male | 34,772 (54.8%) | $74,626 |
| Female | 28,715 (45.2%) | $45,674 |
| Total | 63,487 (100.0%) | $60,329 |
Earnings by Sex by Income Bracket in St. Mary's County
The most common earnings brackets in St. Mary's County are $100,000+ for men (12,099 | 34.8%) and $100,000+ for women (4,740 | 16.5%).
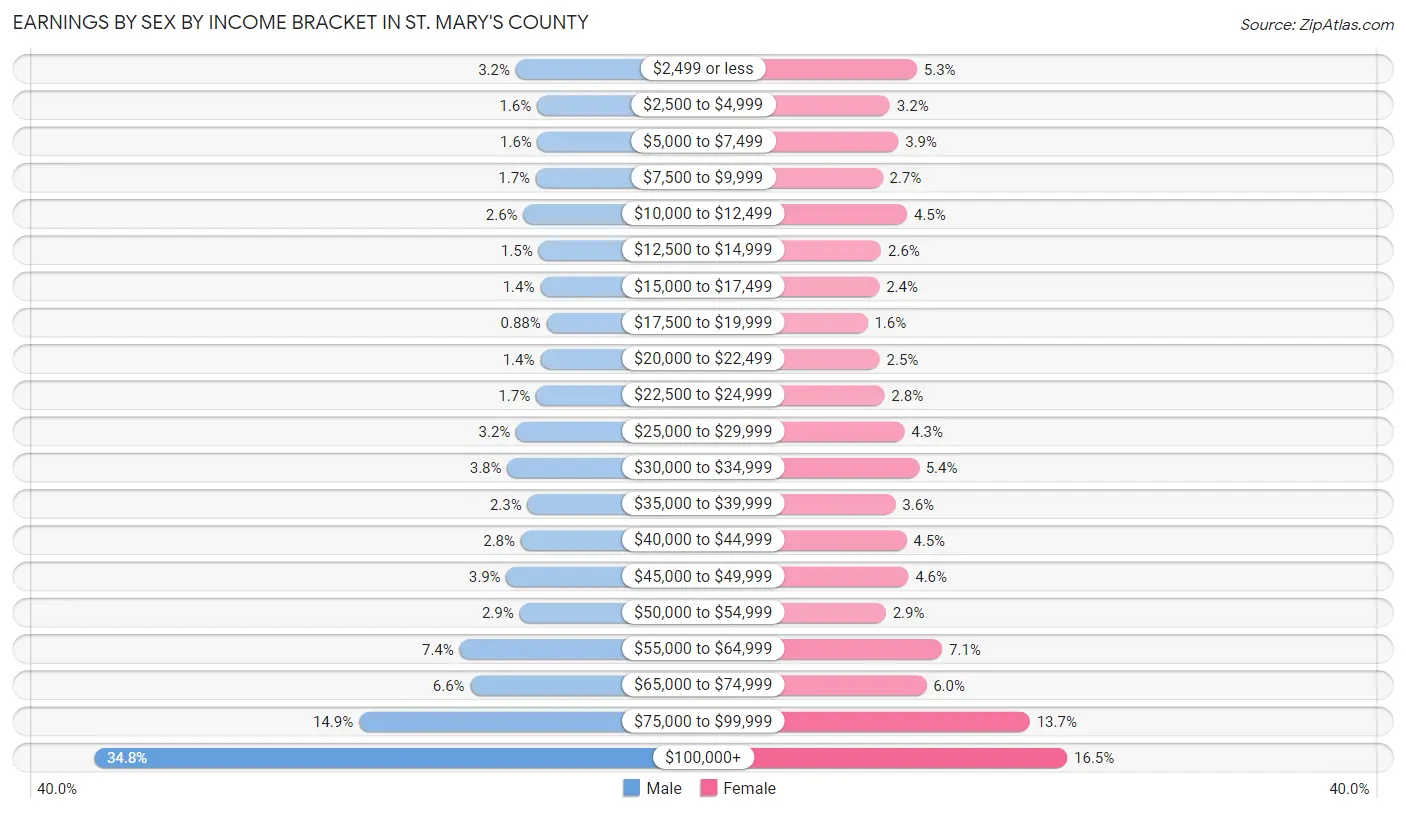
| Income | Male | Female |
| $2,499 or less | 1,109 (3.2%) | 1,508 (5.2%) |
| $2,500 to $4,999 | 553 (1.6%) | 927 (3.2%) |
| $5,000 to $7,499 | 539 (1.5%) | 1,107 (3.9%) |
| $7,500 to $9,999 | 583 (1.7%) | 767 (2.7%) |
| $10,000 to $12,499 | 911 (2.6%) | 1,295 (4.5%) |
| $12,500 to $14,999 | 519 (1.5%) | 739 (2.6%) |
| $15,000 to $17,499 | 470 (1.3%) | 699 (2.4%) |
| $17,500 to $19,999 | 307 (0.9%) | 445 (1.5%) |
| $20,000 to $22,499 | 470 (1.3%) | 706 (2.5%) |
| $22,500 to $24,999 | 579 (1.7%) | 809 (2.8%) |
| $25,000 to $29,999 | 1,098 (3.2%) | 1,238 (4.3%) |
| $30,000 to $34,999 | 1,328 (3.8%) | 1,547 (5.4%) |
| $35,000 to $39,999 | 802 (2.3%) | 1,046 (3.6%) |
| $40,000 to $44,999 | 976 (2.8%) | 1,282 (4.5%) |
| $45,000 to $49,999 | 1,354 (3.9%) | 1,325 (4.6%) |
| $50,000 to $54,999 | 1,012 (2.9%) | 838 (2.9%) |
| $55,000 to $64,999 | 2,574 (7.4%) | 2,051 (7.1%) |
| $65,000 to $74,999 | 2,293 (6.6%) | 1,708 (5.9%) |
| $75,000 to $99,999 | 5,196 (14.9%) | 3,938 (13.7%) |
| $100,000+ | 12,099 (34.8%) | 4,740 (16.5%) |
| Total | 34,772 (100.0%) | 28,715 (100.0%) |
Earnings by Sex by Educational Attainment in St. Mary's County
Average earnings in St. Mary's County are $84,776 for men and $54,190 for women, a difference of 36.1%. Men with an educational attainment of graduate degree enjoy the highest average annual earnings of $143,534, while those with less than high school education earn the least with $50,000. Women with an educational attainment of graduate degree earn the most with the average annual earnings of $90,643, while those with less than high school education have the smallest earnings of $20,503.
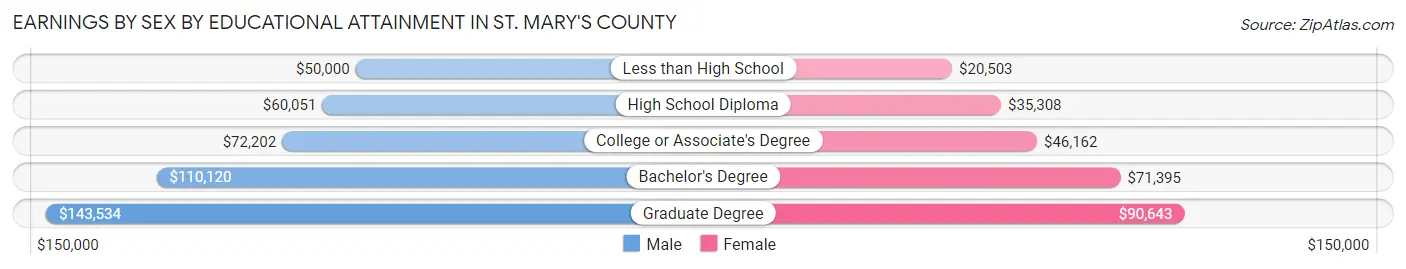
| Educational Attainment | Male Income | Female Income |
| Less than High School | $50,000 | $20,503 |
| High School Diploma | $60,051 | $35,308 |
| College or Associate's Degree | $72,202 | $46,162 |
| Bachelor's Degree | $110,120 | $71,395 |
| Graduate Degree | $143,534 | $90,643 |
| Total | $84,776 | $54,190 |
Family Income in St. Mary's County
Family Income Brackets in St. Mary's County
According to the St. Mary's County family income data, there are 6,818 families falling into the $200,000+ income range, which is the most common income bracket and makes up 23.4% of all families. Conversely, the $10,000 to $14,999 income bracket is the least frequent group with only 408 families (1.4%) belonging to this category.
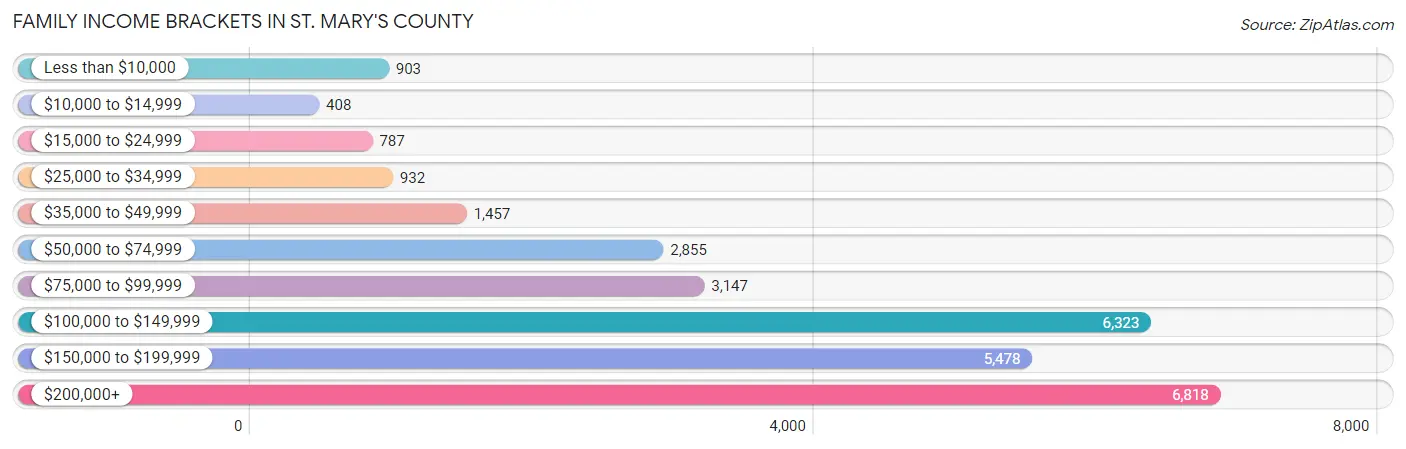
| Income Bracket | # Families | % Families |
| Less than $10,000 | 903 | 3.1% |
| $10,000 to $14,999 | 408 | 1.4% |
| $15,000 to $24,999 | 787 | 2.7% |
| $25,000 to $34,999 | 932 | 3.2% |
| $35,000 to $49,999 | 1,457 | 5.0% |
| $50,000 to $74,999 | 2,855 | 9.8% |
| $75,000 to $99,999 | 3,147 | 10.8% |
| $100,000 to $149,999 | 6,323 | 21.7% |
| $150,000 to $199,999 | 5,478 | 18.8% |
| $200,000+ | 6,818 | 23.4% |
Family Income by Famaliy Size in St. Mary's County
7+ person families (486 | 1.7%) account for the highest median family income in St. Mary's County with $242,610 per family, while 2-person families (12,238 | 42.0%) have the highest median income of $56,472 per family member.
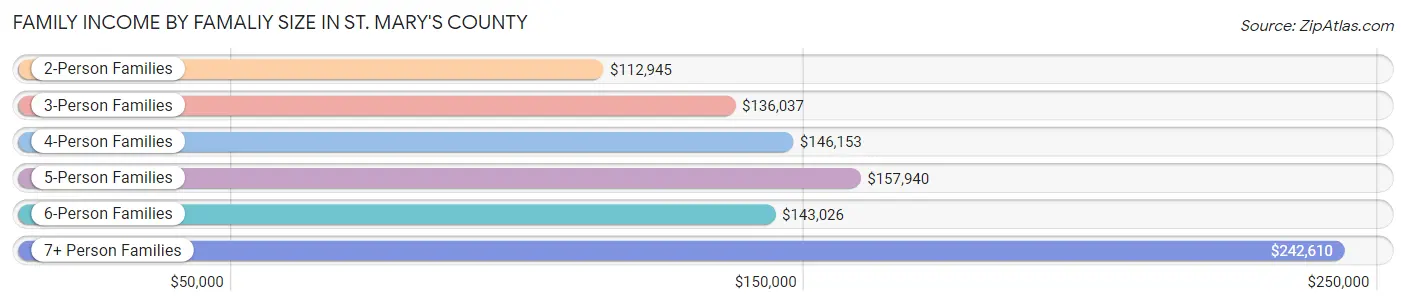
| Income Bracket | # Families | Median Income |
| 2-Person Families | 12,238 (42.0%) | $112,945 |
| 3-Person Families | 6,948 (23.8%) | $136,037 |
| 4-Person Families | 5,661 (19.4%) | $146,153 |
| 5-Person Families | 2,884 (9.9%) | $157,940 |
| 6-Person Families | 920 (3.2%) | $143,026 |
| 7+ Person Families | 486 (1.7%) | $242,610 |
| Total | 29,137 (100.0%) | $132,926 |
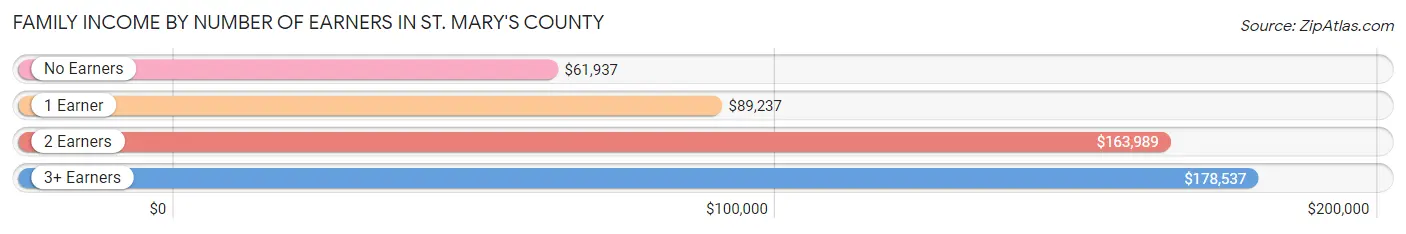
Family Income by Number of Earners in St. Mary's County
The median family income in St. Mary's County is $132,926, with families comprising 3+ earners (4,218) having the highest median family income of $178,537, while families with no earners (3,338) have the lowest median family income of $61,937, accounting for 14.5% and 11.5% of families, respectively.
| Number of Earners | # Families | Median Income |
| No Earners | 3,338 (11.5%) | $61,937 |
| 1 Earner | 9,107 (31.3%) | $89,237 |
| 2 Earners | 12,474 (42.8%) | $163,989 |
| 3+ Earners | 4,218 (14.5%) | $178,537 |
| Total | 29,137 (100.0%) | $132,926 |
Household Income in St. Mary's County
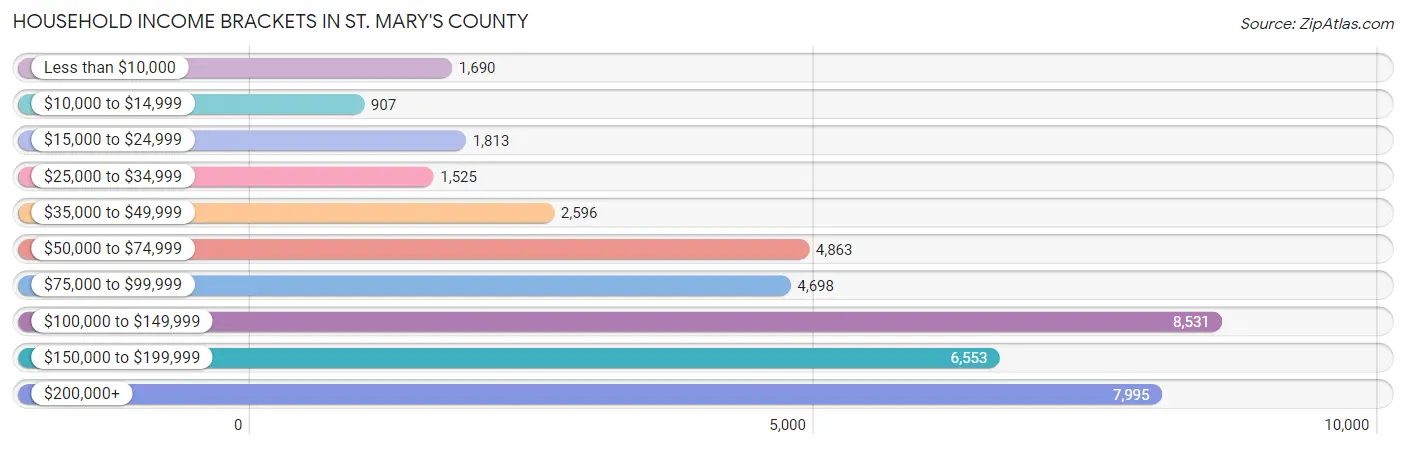
Household Income Brackets in St. Mary's County
With 8,531 households falling in the category, the $100,000 to $149,999 income range is the most frequent in St. Mary's County, accounting for 20.7% of all households. In contrast, only 907 households (2.2%) fall into the $10,000 to $14,999 income bracket, making it the least populous group.
| Income Bracket | # Households | % Households |
| Less than $10,000 | 1,690 | 4.1% |
| $10,000 to $14,999 | 907 | 2.2% |
| $15,000 to $24,999 | 1,813 | 4.4% |
| $25,000 to $34,999 | 1,525 | 3.7% |
| $35,000 to $49,999 | 2,596 | 6.3% |
| $50,000 to $74,999 | 4,863 | 11.8% |
| $75,000 to $99,999 | 4,698 | 11.4% |
| $100,000 to $149,999 | 8,531 | 20.7% |
| $150,000 to $199,999 | 6,553 | 15.9% |
| $200,000+ | 7,995 | 19.4% |
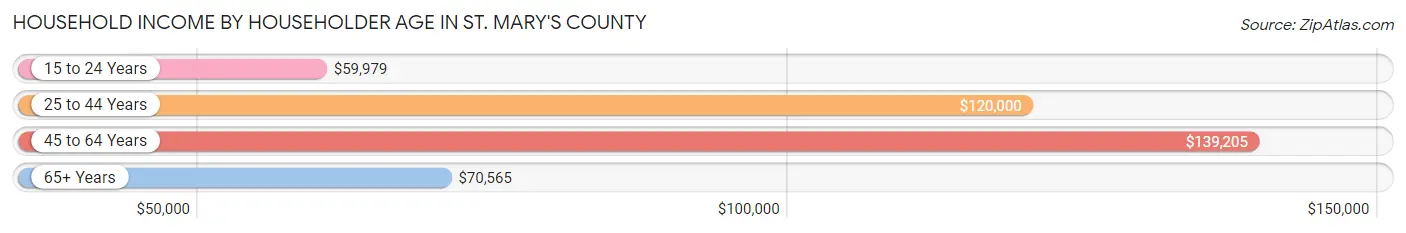
Household Income by Householder Age in St. Mary's County
The median household income in St. Mary's County is $113,668, with the highest median household income of $139,205 found in the 45 to 64 years age bracket for the primary householder. A total of 16,635 households (40.4%) fall into this category. Meanwhile, the 15 to 24 years age bracket for the primary householder has the lowest median household income of $59,979, with 1,445 households (3.5%) in this group.
| Income Bracket | # Households | Median Income |
| 15 to 24 Years | 1,445 (3.5%) | $59,979 |
| 25 to 44 Years | 14,380 (34.9%) | $120,000 |
| 45 to 64 Years | 16,635 (40.4%) | $139,205 |
| 65+ Years | 8,751 (21.2%) | $70,565 |
| Total | 41,211 (100.0%) | $113,668 |
Poverty in St. Mary's County
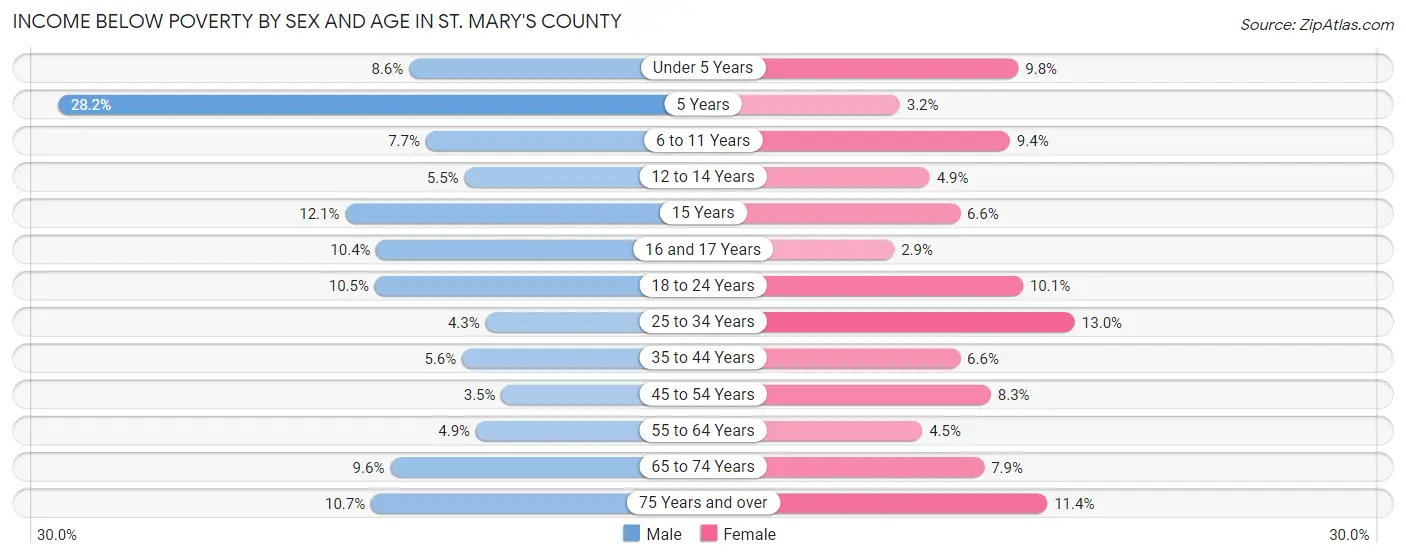
Income Below Poverty by Sex and Age in St. Mary's County
With 6.9% poverty level for males and 8.3% for females among the residents of St. Mary's County, 5 year old males and 25 to 34 year old females are the most vulnerable to poverty, with 239 males (28.1%) and 989 females (13.0%) in their respective age groups living below the poverty level.
| Age Bracket | Male | Female |
| Under 5 Years | 301 (8.6%) | 338 (9.8%) |
| 5 Years | 239 (28.1%) | 25 (3.2%) |
| 6 to 11 Years | 352 (7.7%) | 400 (9.4%) |
| 12 to 14 Years | 130 (5.5%) | 120 (4.9%) |
| 15 Years | 92 (12.1%) | 40 (6.6%) |
| 16 and 17 Years | 184 (10.4%) | 48 (2.9%) |
| 18 to 24 Years | 494 (10.5%) | 447 (10.1%) |
| 25 to 34 Years | 346 (4.3%) | 989 (13.0%) |
| 35 to 44 Years | 425 (5.6%) | 495 (6.6%) |
| 45 to 54 Years | 251 (3.5%) | 607 (8.3%) |
| 55 to 64 Years | 383 (4.9%) | 336 (4.5%) |
| 65 to 74 Years | 414 (9.6%) | 364 (7.9%) |
| 75 Years and over | 275 (10.7%) | 361 (11.4%) |
| Total | 3,886 (6.9%) | 4,570 (8.3%) |
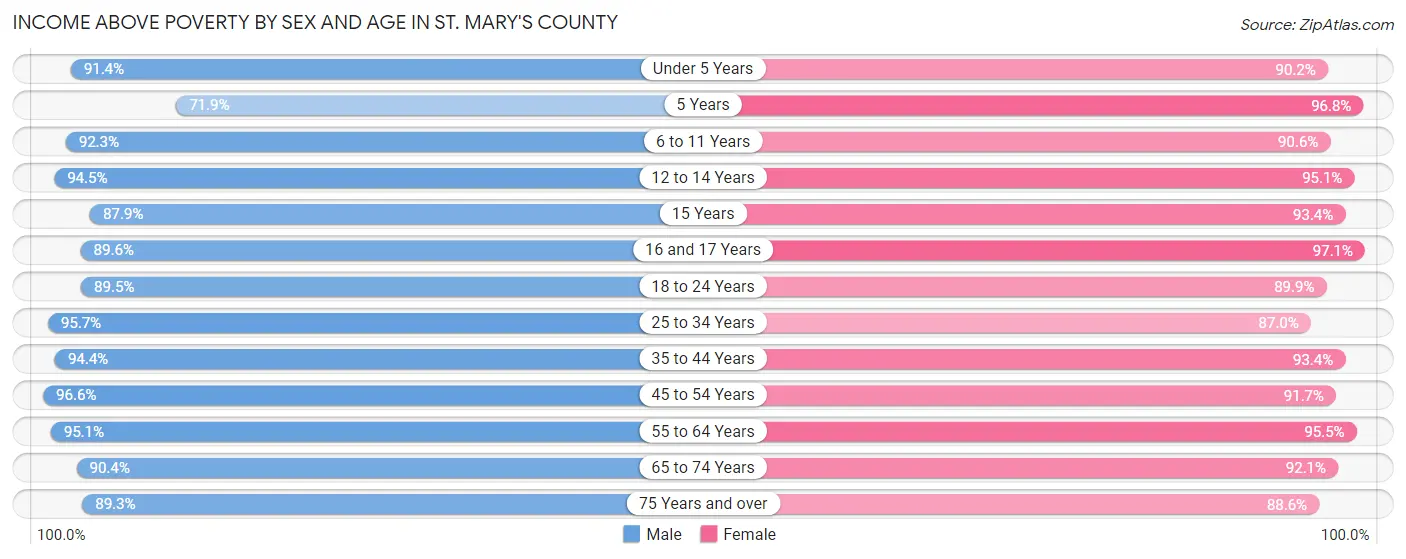
Income Above Poverty by Sex and Age in St. Mary's County
According to the poverty statistics in St. Mary's County, males aged 45 to 54 years and females aged 16 and 17 years are the age groups that are most secure financially, with 96.6% of males and 97.1% of females in these age groups living above the poverty line.
| Age Bracket | Male | Female |
| Under 5 Years | 3,203 (91.4%) | 3,099 (90.2%) |
| 5 Years | 610 (71.9%) | 749 (96.8%) |
| 6 to 11 Years | 4,242 (92.3%) | 3,875 (90.6%) |
| 12 to 14 Years | 2,231 (94.5%) | 2,329 (95.1%) |
| 15 Years | 666 (87.9%) | 568 (93.4%) |
| 16 and 17 Years | 1,584 (89.6%) | 1,595 (97.1%) |
| 18 to 24 Years | 4,211 (89.5%) | 3,985 (89.9%) |
| 25 to 34 Years | 7,652 (95.7%) | 6,631 (87.0%) |
| 35 to 44 Years | 7,113 (94.4%) | 7,022 (93.4%) |
| 45 to 54 Years | 7,021 (96.6%) | 6,702 (91.7%) |
| 55 to 64 Years | 7,476 (95.1%) | 7,157 (95.5%) |
| 65 to 74 Years | 3,879 (90.4%) | 4,227 (92.1%) |
| 75 Years and over | 2,292 (89.3%) | 2,794 (88.6%) |
| Total | 52,180 (93.1%) | 50,733 (91.7%) |
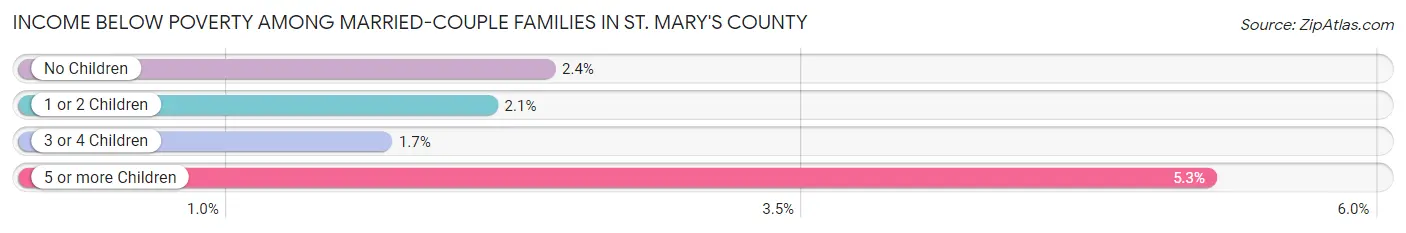
Income Below Poverty Among Married-Couple Families in St. Mary's County
The poverty statistics for married-couple families in St. Mary's County show that 2.2% or 493 of the total 22,000 families live below the poverty line. Families with 5 or more children have the highest poverty rate of 5.3%, comprising of 8 families. On the other hand, families with 3 or 4 children have the lowest poverty rate of 1.7%, which includes 35 families.
| Children | Above Poverty | Below Poverty |
| No Children | 11,492 (97.6%) | 280 (2.4%) |
| 1 or 2 Children | 7,806 (97.9%) | 170 (2.1%) |
| 3 or 4 Children | 2,065 (98.3%) | 35 (1.7%) |
| 5 or more Children | 144 (94.7%) | 8 (5.3%) |
| Total | 21,507 (97.8%) | 493 (2.2%) |
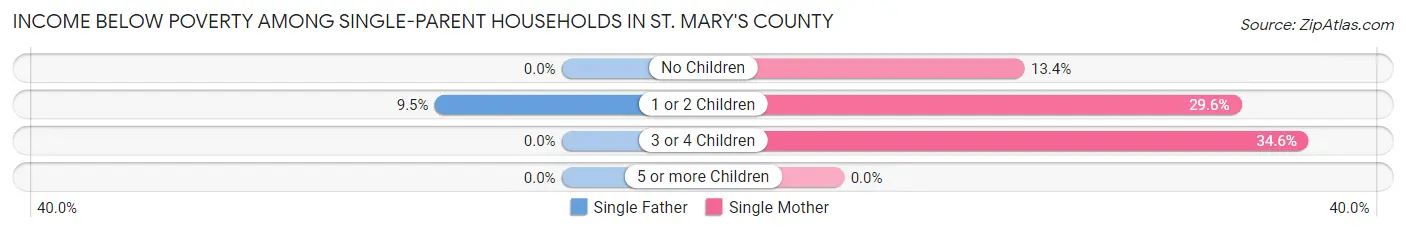
Income Below Poverty Among Single-Parent Households in St. Mary's County
According to the poverty data in St. Mary's County, 5.2% or 96 single-father households and 25.0% or 1,324 single-mother households are living below the poverty line. Among single-father households, those with 1 or 2 children have the highest poverty rate, with 96 households (9.5%) experiencing poverty. Likewise, among single-mother households, those with 3 or 4 children have the highest poverty rate, with 247 households (34.6%) falling below the poverty line.
| Children | Single Father | Single Mother |
| No Children | 0 (0.0%) | 235 (13.4%) |
| 1 or 2 Children | 96 (9.5%) | 842 (29.6%) |
| 3 or 4 Children | 0 (0.0%) | 247 (34.6%) |
| 5 or more Children | 0 (0.0%) | 0 (0.0%) |
| Total | 96 (5.2%) | 1,324 (25.0%) |
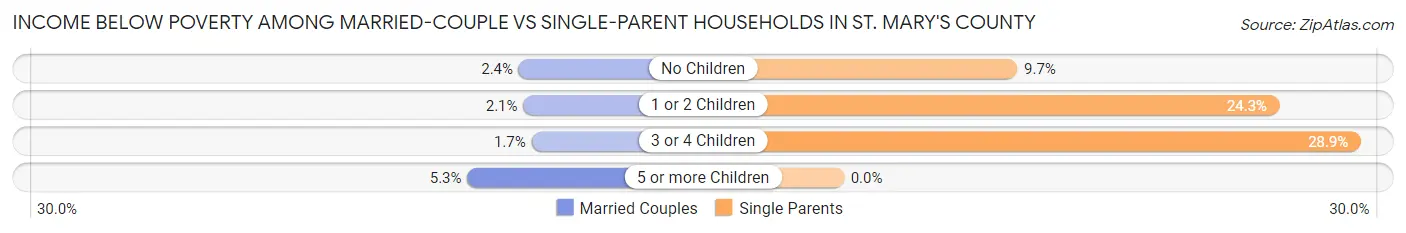
Income Below Poverty Among Married-Couple vs Single-Parent Households in St. Mary's County
The poverty data for St. Mary's County shows that 493 of the married-couple family households (2.2%) and 1,420 of the single-parent households (19.9%) are living below the poverty level. Within the married-couple family households, those with 5 or more children have the highest poverty rate, with 8 households (5.3%) falling below the poverty line. Among the single-parent households, those with 3 or 4 children have the highest poverty rate, with 247 household (28.9%) living below poverty.
| Children | Married-Couple Families | Single-Parent Households |
| No Children | 280 (2.4%) | 235 (9.7%) |
| 1 or 2 Children | 170 (2.1%) | 938 (24.3%) |
| 3 or 4 Children | 35 (1.7%) | 247 (28.9%) |
| 5 or more Children | 8 (5.3%) | 0 (0.0%) |
| Total | 493 (2.2%) | 1,420 (19.9%) |
Employment Characteristics in St. Mary's County
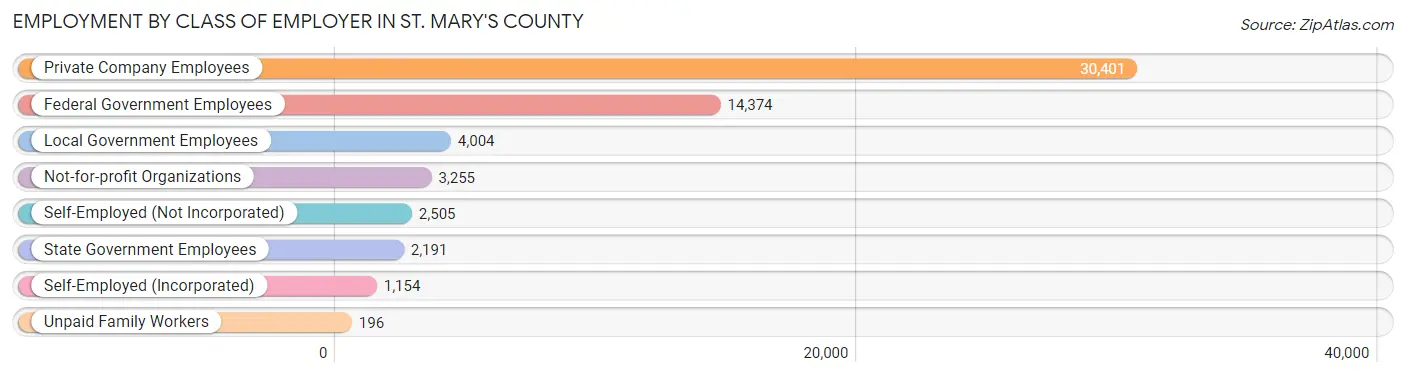
Employment by Class of Employer in St. Mary's County
Among the 58,080 employed individuals in St. Mary's County, private company employees (30,401 | 52.3%), federal government employees (14,374 | 24.7%), and local government employees (4,004 | 6.9%) make up the most common classes of employment.
| Employer Class | # Employees | % Employees |
| Private Company Employees | 30,401 | 52.3% |
| Self-Employed (Incorporated) | 1,154 | 2.0% |
| Self-Employed (Not Incorporated) | 2,505 | 4.3% |
| Not-for-profit Organizations | 3,255 | 5.6% |
| Local Government Employees | 4,004 | 6.9% |
| State Government Employees | 2,191 | 3.8% |
| Federal Government Employees | 14,374 | 24.7% |
| Unpaid Family Workers | 196 | 0.3% |
| Total | 58,080 | 100.0% |
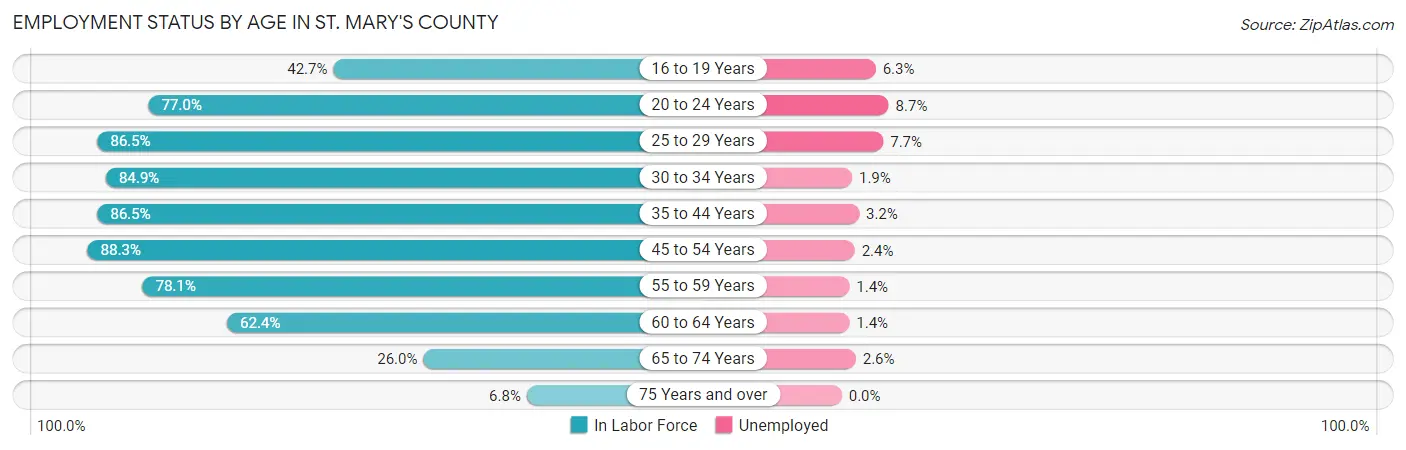
Employment Status by Age in St. Mary's County
According to the labor force statistics for St. Mary's County, out of the total population over 16 years of age (89,977), 68.4% or 61,544 individuals are in the labor force, with 3.7% or 2,277 of them unemployed. The age group with the highest labor force participation rate is 45 to 54 years, with 88.3% or 12,936 individuals in the labor force. Within the labor force, the 20 to 24 years age range has the highest percentage of unemployed individuals, with 8.7% or 468 of them being unemployed.
| Age Bracket | In Labor Force | Unemployed |
| 16 to 19 Years | 2,925 (42.7%) | 184 (6.3%) |
| 20 to 24 Years | 5,381 (77.0%) | 468 (8.7%) |
| 25 to 29 Years | 6,753 (86.5%) | 520 (7.7%) |
| 30 to 34 Years | 6,760 (84.9%) | 128 (1.9%) |
| 35 to 44 Years | 13,094 (86.5%) | 419 (3.2%) |
| 45 to 54 Years | 12,936 (88.3%) | 310 (2.4%) |
| 55 to 59 Years | 6,404 (78.1%) | 90 (1.4%) |
| 60 to 64 Years | 4,500 (62.4%) | 63 (1.4%) |
| 65 to 74 Years | 2,357 (26.0%) | 61 (2.6%) |
| 75 Years and over | 415 (6.8%) | 0 (0.0%) |
| Total | 61,544 (68.4%) | 2,277 (3.7%) |
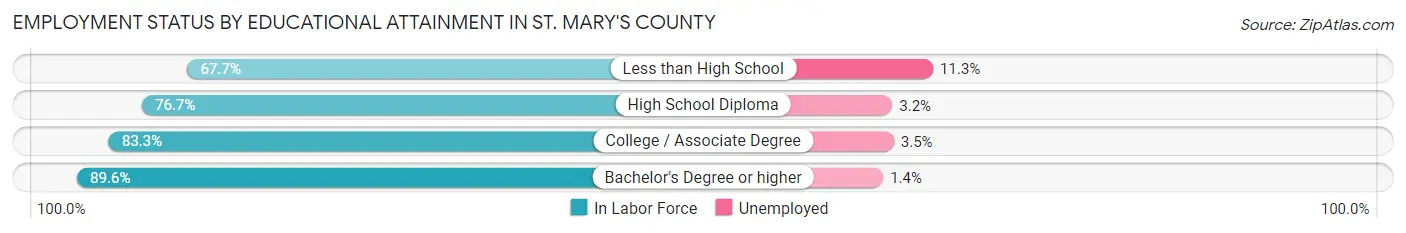
Employment Status by Educational Attainment in St. Mary's County
According to labor force statistics for St. Mary's County, 82.7% of individuals (50,421) out of the total population between 25 and 64 years of age (60,969) are in the labor force, with 3.0% or 1,513 of them being unemployed. The group with the highest labor force participation rate are those with the educational attainment of bachelor's degree or higher, with 89.6% or 20,296 individuals in the labor force. Within the labor force, individuals with less than high school education have the highest percentage of unemployment, with 11.3% or 316 of them being unemployed.
| Educational Attainment | In Labor Force | Unemployed |
| Less than High School | 2,798 (67.7%) | 467 (11.3%) |
| High School Diploma | 13,133 (76.7%) | 548 (3.2%) |
| College / Associate Degree | 14,212 (83.3%) | 597 (3.5%) |
| Bachelor's Degree or higher | 20,296 (89.6%) | 317 (1.4%) |
| Total | 50,421 (82.7%) | 1,829 (3.0%) |
Employment Occupations by Sex in St. Mary's County
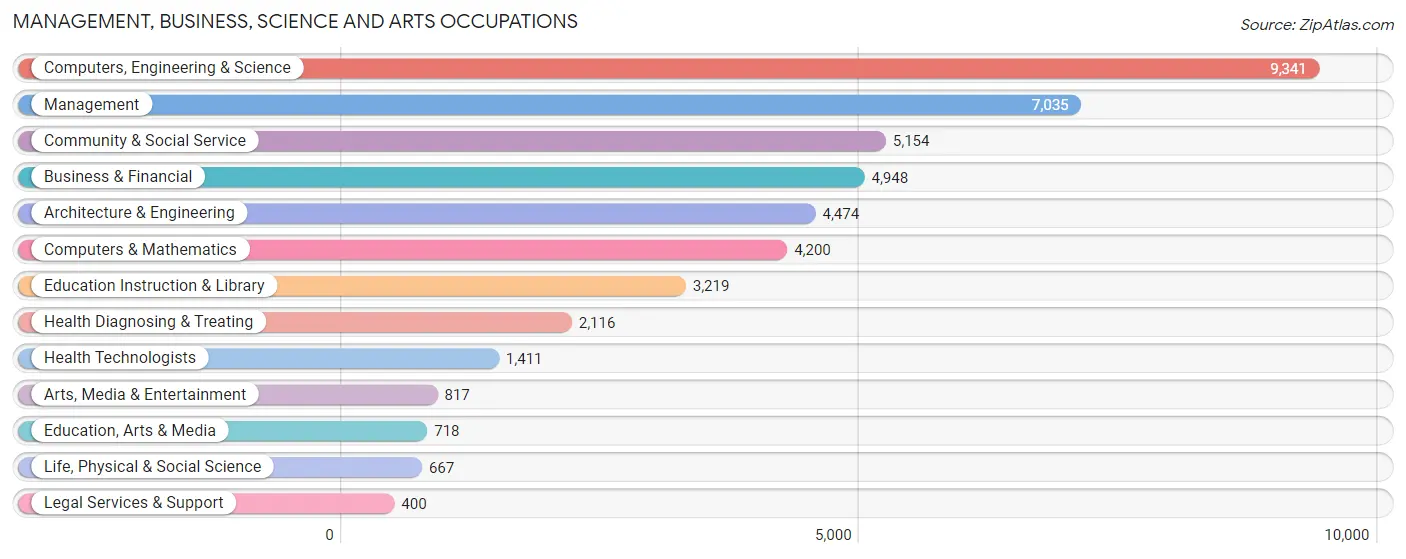
Management, Business, Science and Arts Occupations
The most common Management, Business, Science and Arts occupations in St. Mary's County are Computers, Engineering & Science (9,341 | 16.3%), Management (7,035 | 12.3%), Community & Social Service (5,154 | 9.0%), Business & Financial (4,948 | 8.6%), and Architecture & Engineering (4,474 | 7.8%).
Management, Business, Science and Arts Occupations by Sex
Within the Management, Business, Science and Arts occupations in St. Mary's County, the most male-oriented occupations are Architecture & Engineering (86.0%), Computers, Engineering & Science (74.6%), and Computers & Mathematics (65.7%), while the most female-oriented occupations are Health Diagnosing & Treating (80.9%), Health Technologists (80.7%), and Education Instruction & Library (78.6%).
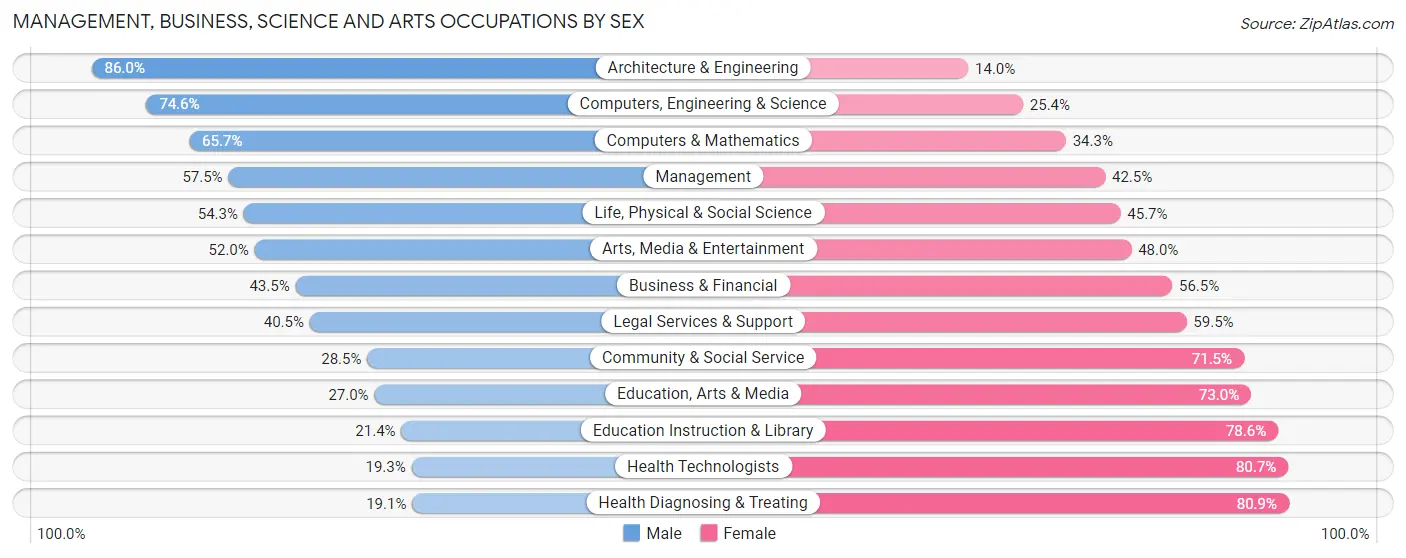
| Occupation | Male | Female |
| Management | 4,044 (57.5%) | 2,991 (42.5%) |
| Business & Financial | 2,152 (43.5%) | 2,796 (56.5%) |
| Computers, Engineering & Science | 6,969 (74.6%) | 2,372 (25.4%) |
| Computers & Mathematics | 2,758 (65.7%) | 1,442 (34.3%) |
| Architecture & Engineering | 3,849 (86.0%) | 625 (14.0%) |
| Life, Physical & Social Science | 362 (54.3%) | 305 (45.7%) |
| Community & Social Service | 1,470 (28.5%) | 3,684 (71.5%) |
| Education, Arts & Media | 194 (27.0%) | 524 (73.0%) |
| Legal Services & Support | 162 (40.5%) | 238 (59.5%) |
| Education Instruction & Library | 689 (21.4%) | 2,530 (78.6%) |
| Arts, Media & Entertainment | 425 (52.0%) | 392 (48.0%) |
| Health Diagnosing & Treating | 405 (19.1%) | 1,711 (80.9%) |
| Health Technologists | 272 (19.3%) | 1,139 (80.7%) |
| Total (Category) | 15,040 (52.6%) | 13,554 (47.4%) |
| Total (Overall) | 31,016 (54.1%) | 26,290 (45.9%) |
Services Occupations
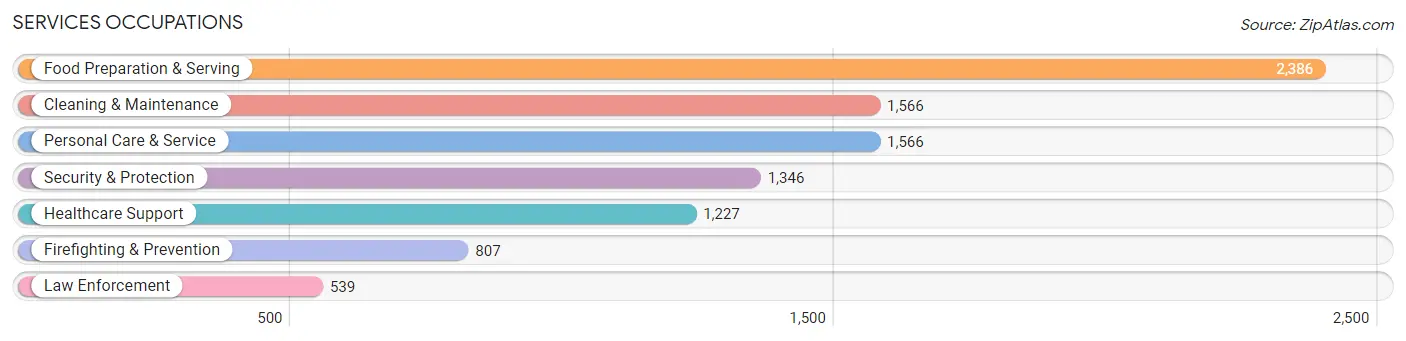
The most common Services occupations in St. Mary's County are Food Preparation & Serving (2,386 | 4.2%), Cleaning & Maintenance (1,566 | 2.7%), Personal Care & Service (1,566 | 2.7%), Security & Protection (1,346 | 2.4%), and Healthcare Support (1,227 | 2.1%).
Services Occupations by Sex
Within the Services occupations in St. Mary's County, the most male-oriented occupations are Firefighting & Prevention (71.1%), Security & Protection (69.8%), and Law Enforcement (67.9%), while the most female-oriented occupations are Healthcare Support (92.7%), Personal Care & Service (84.4%), and Food Preparation & Serving (63.3%).
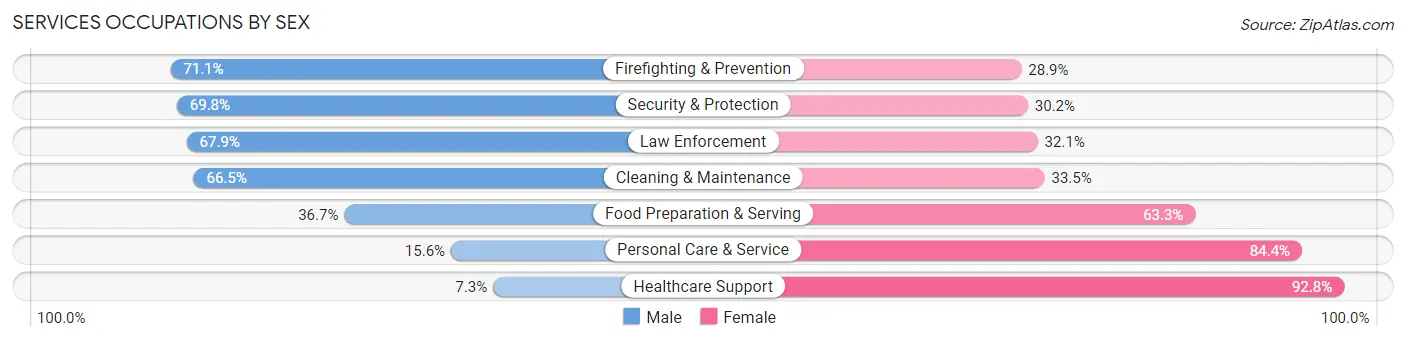
| Occupation | Male | Female |
| Healthcare Support | 89 (7.2%) | 1,138 (92.7%) |
| Security & Protection | 940 (69.8%) | 406 (30.2%) |
| Firefighting & Prevention | 574 (71.1%) | 233 (28.9%) |
| Law Enforcement | 366 (67.9%) | 173 (32.1%) |
| Food Preparation & Serving | 876 (36.7%) | 1,510 (63.3%) |
| Cleaning & Maintenance | 1,042 (66.5%) | 524 (33.5%) |
| Personal Care & Service | 244 (15.6%) | 1,322 (84.4%) |
| Total (Category) | 3,191 (39.4%) | 4,900 (60.6%) |
| Total (Overall) | 31,016 (54.1%) | 26,290 (45.9%) |
Sales and Office Occupations
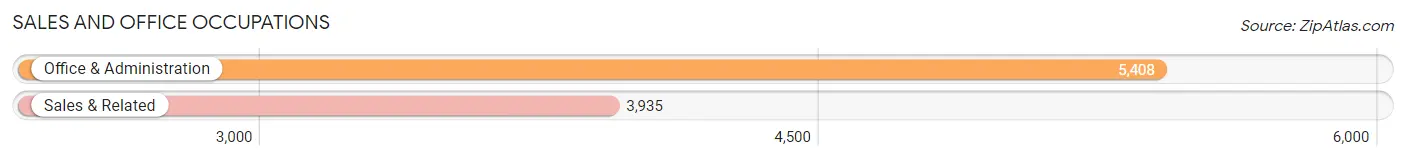
The most common Sales and Office occupations in St. Mary's County are Office & Administration (5,408 | 9.4%), and Sales & Related (3,935 | 6.9%).
Sales and Office Occupations by Sex
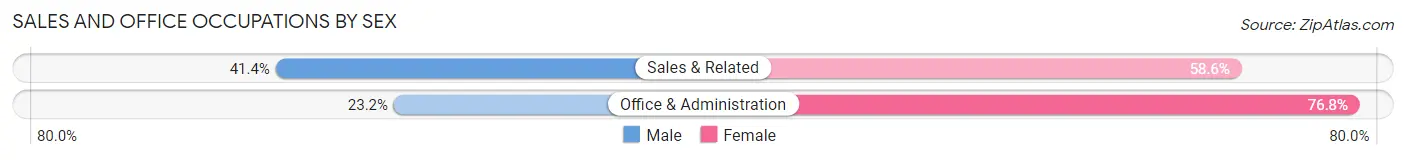
| Occupation | Male | Female |
| Sales & Related | 1,628 (41.4%) | 2,307 (58.6%) |
| Office & Administration | 1,254 (23.2%) | 4,154 (76.8%) |
| Total (Category) | 2,882 (30.8%) | 6,461 (69.2%) |
| Total (Overall) | 31,016 (54.1%) | 26,290 (45.9%) |
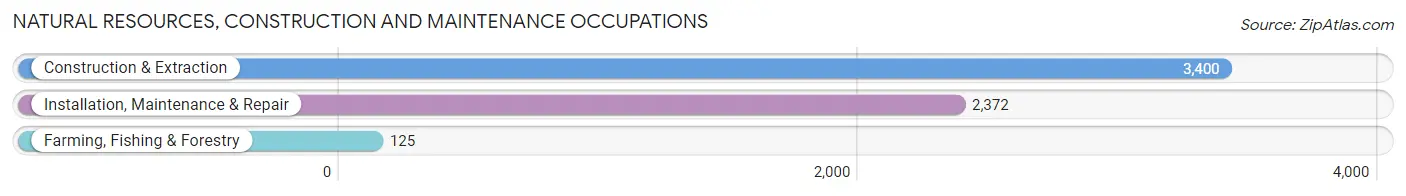
Natural Resources, Construction and Maintenance Occupations
The most common Natural Resources, Construction and Maintenance occupations in St. Mary's County are Construction & Extraction (3,400 | 5.9%), Installation, Maintenance & Repair (2,372 | 4.1%), and Farming, Fishing & Forestry (125 | 0.2%).
Natural Resources, Construction and Maintenance Occupations by Sex
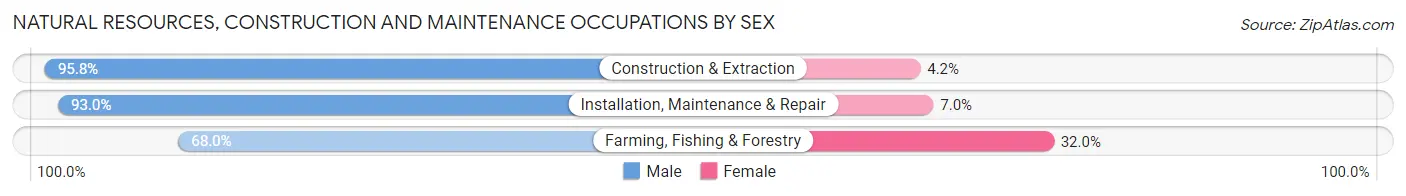
| Occupation | Male | Female |
| Farming, Fishing & Forestry | 85 (68.0%) | 40 (32.0%) |
| Construction & Extraction | 3,256 (95.8%) | 144 (4.2%) |
| Installation, Maintenance & Repair | 2,207 (93.0%) | 165 (7.0%) |
| Total (Category) | 5,548 (94.1%) | 349 (5.9%) |
| Total (Overall) | 31,016 (54.1%) | 26,290 (45.9%) |
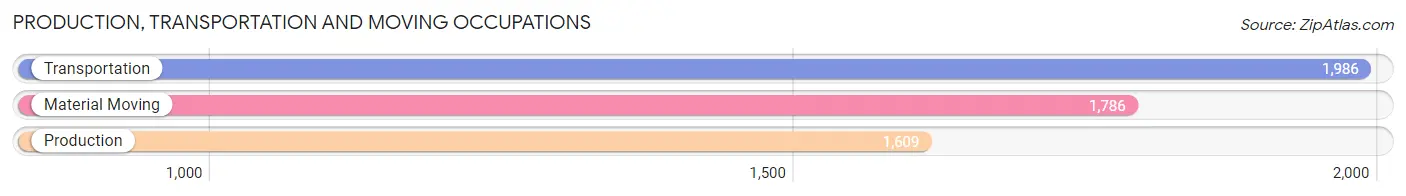
Production, Transportation and Moving Occupations
The most common Production, Transportation and Moving occupations in St. Mary's County are Transportation (1,986 | 3.5%), Material Moving (1,786 | 3.1%), and Production (1,609 | 2.8%).
Production, Transportation and Moving Occupations by Sex
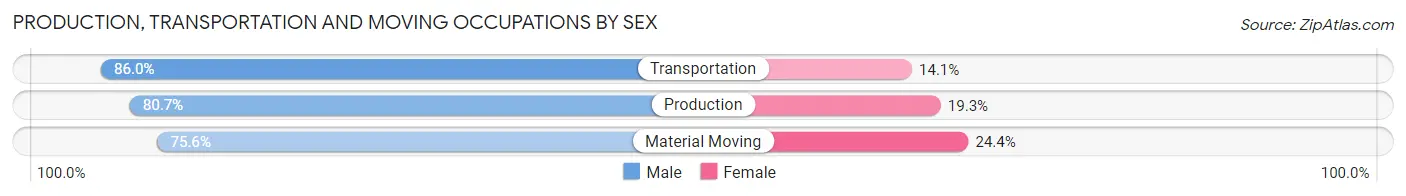
| Occupation | Male | Female |
| Production | 1,298 (80.7%) | 311 (19.3%) |
| Transportation | 1,707 (86.0%) | 279 (14.1%) |
| Material Moving | 1,350 (75.6%) | 436 (24.4%) |
| Total (Category) | 4,355 (80.9%) | 1,026 (19.1%) |
| Total (Overall) | 31,016 (54.1%) | 26,290 (45.9%) |
Employment Industries by Sex in St. Mary's County
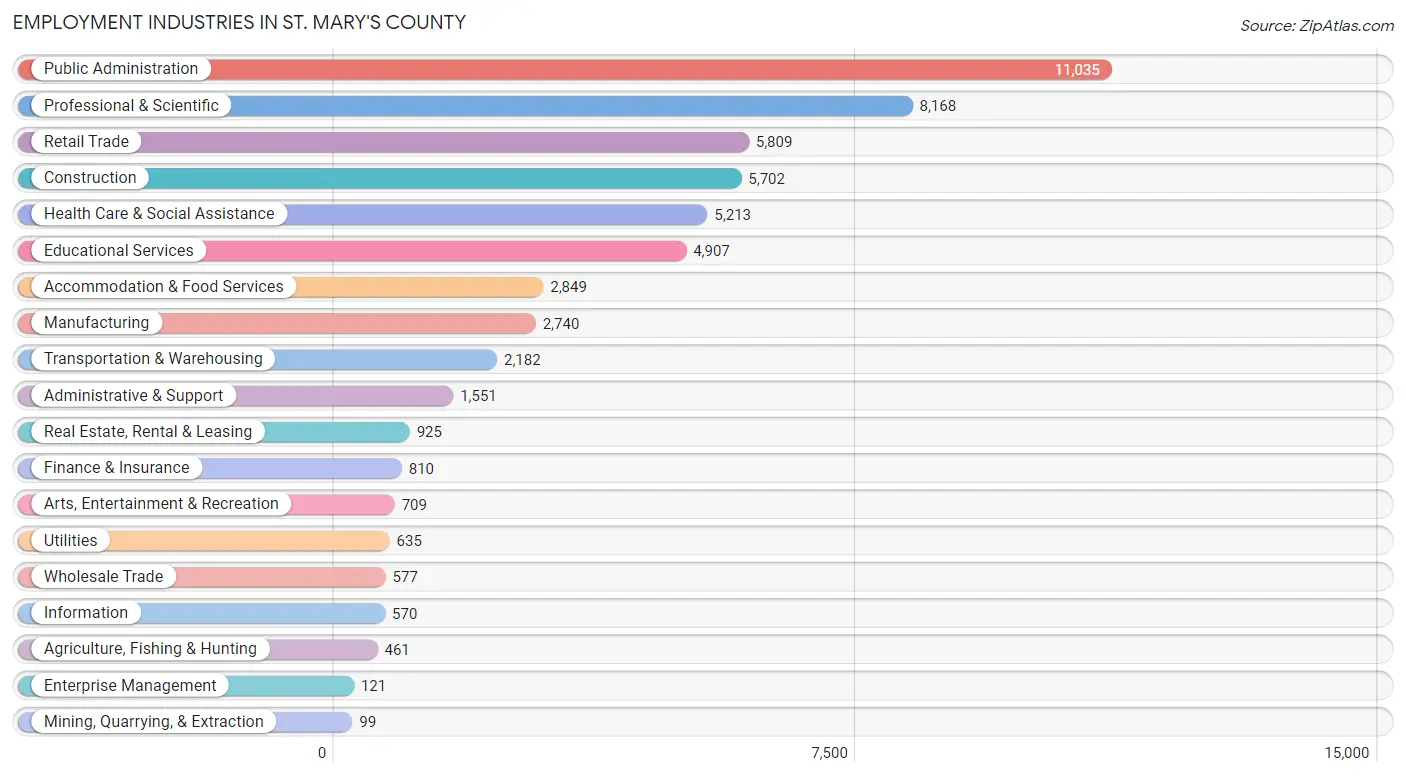
Employment Industries in St. Mary's County
The major employment industries in St. Mary's County include Public Administration (11,035 | 19.3%), Professional & Scientific (8,168 | 14.2%), Retail Trade (5,809 | 10.1%), Construction (5,702 | 10.0%), and Health Care & Social Assistance (5,213 | 9.1%).
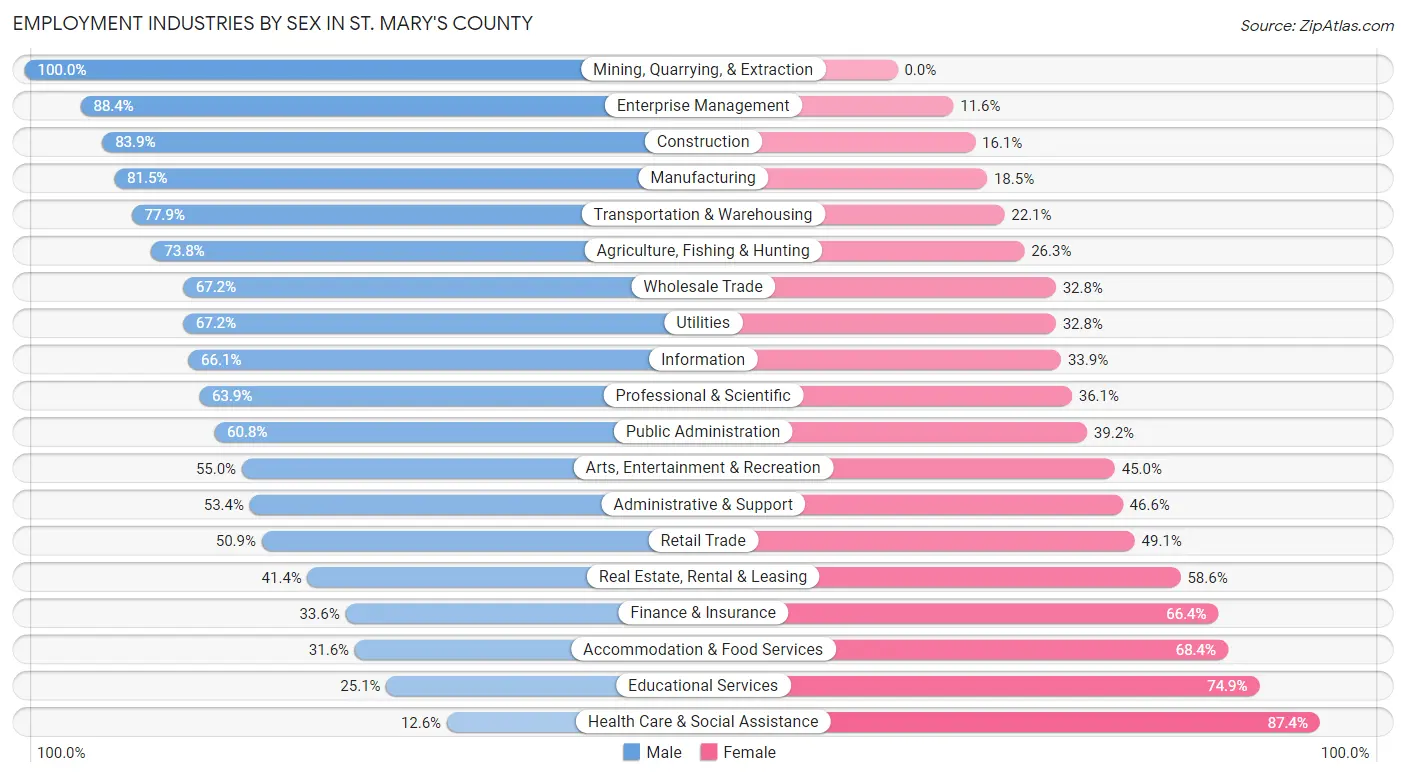
Employment Industries by Sex in St. Mary's County
The St. Mary's County industries that see more men than women are Mining, Quarrying, & Extraction (100.0%), Enterprise Management (88.4%), and Construction (83.9%), whereas the industries that tend to have a higher number of women are Health Care & Social Assistance (87.4%), Educational Services (74.9%), and Accommodation & Food Services (68.4%).
| Industry | Male | Female |
| Agriculture, Fishing & Hunting | 340 (73.8%) | 121 (26.3%) |
| Mining, Quarrying, & Extraction | 99 (100.0%) | 0 (0.0%) |
| Construction | 4,785 (83.9%) | 917 (16.1%) |
| Manufacturing | 2,232 (81.5%) | 508 (18.5%) |
| Wholesale Trade | 388 (67.2%) | 189 (32.8%) |
| Retail Trade | 2,957 (50.9%) | 2,852 (49.1%) |
| Transportation & Warehousing | 1,699 (77.9%) | 483 (22.1%) |
| Utilities | 427 (67.2%) | 208 (32.8%) |
| Information | 377 (66.1%) | 193 (33.9%) |
| Finance & Insurance | 272 (33.6%) | 538 (66.4%) |
| Real Estate, Rental & Leasing | 383 (41.4%) | 542 (58.6%) |
| Professional & Scientific | 5,219 (63.9%) | 2,949 (36.1%) |
| Enterprise Management | 107 (88.4%) | 14 (11.6%) |
| Administrative & Support | 828 (53.4%) | 723 (46.6%) |
| Educational Services | 1,232 (25.1%) | 3,675 (74.9%) |
| Health Care & Social Assistance | 656 (12.6%) | 4,557 (87.4%) |
| Arts, Entertainment & Recreation | 390 (55.0%) | 319 (45.0%) |
| Accommodation & Food Services | 901 (31.6%) | 1,948 (68.4%) |
| Public Administration | 6,707 (60.8%) | 4,328 (39.2%) |
| Total | 31,016 (54.1%) | 26,290 (45.9%) |
Education in St. Mary's County
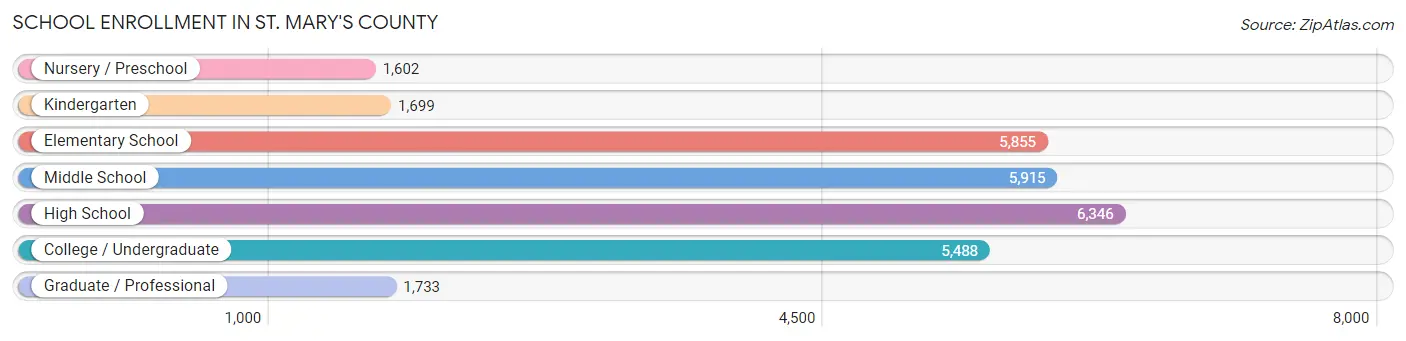
School Enrollment in St. Mary's County
The most common levels of schooling among the 28,638 students in St. Mary's County are high school (6,346 | 22.2%), middle school (5,915 | 20.6%), and elementary school (5,855 | 20.4%).
| School Level | # Students | % Students |
| Nursery / Preschool | 1,602 | 5.6% |
| Kindergarten | 1,699 | 5.9% |
| Elementary School | 5,855 | 20.4% |
| Middle School | 5,915 | 20.6% |
| High School | 6,346 | 22.2% |
| College / Undergraduate | 5,488 | 19.2% |
| Graduate / Professional | 1,733 | 6.0% |
| Total | 28,638 | 100.0% |
School Enrollment by Age by Funding Source in St. Mary's County
Out of a total of 28,638 students who are enrolled in schools in St. Mary's County, 5,269 (18.4%) attend a private institution, while the remaining 23,369 (81.6%) are enrolled in public schools. The age group of 3 to 4 year olds has the highest likelihood of being enrolled in private schools, with 486 (43.2% in the age bracket) enrolled. Conversely, the age group of 15 to 17 year olds has the lowest likelihood of being enrolled in a private school, with 4,042 (88.2% in the age bracket) attending a public institution.
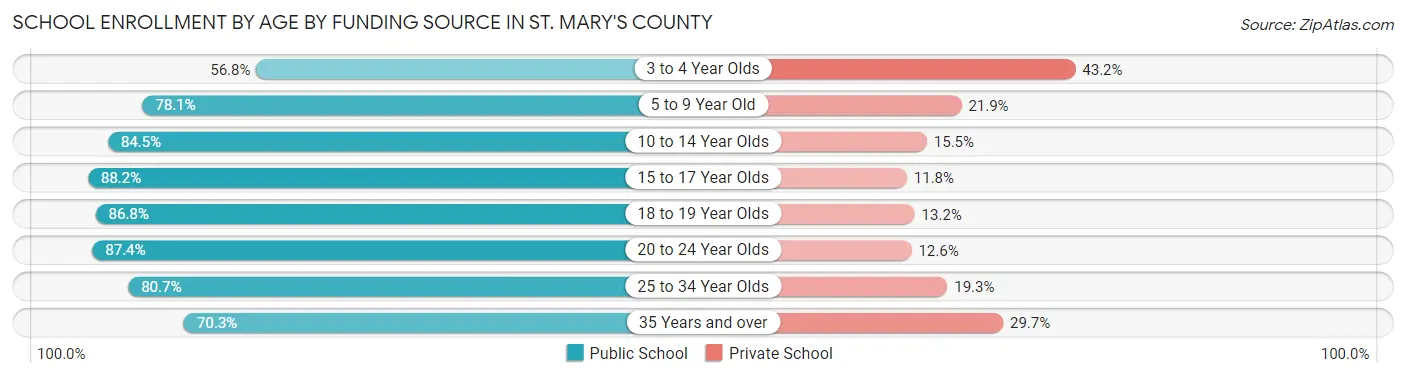
| Age Bracket | Public School | Private School |
| 3 to 4 Year Olds | 640 (56.8%) | 486 (43.2%) |
| 5 to 9 Year Old | 5,702 (78.1%) | 1,603 (21.9%) |
| 10 to 14 Year Olds | 6,288 (84.5%) | 1,153 (15.5%) |
| 15 to 17 Year Olds | 4,042 (88.2%) | 539 (11.8%) |
| 18 to 19 Year Olds | 2,022 (86.8%) | 308 (13.2%) |
| 20 to 24 Year Olds | 1,958 (87.4%) | 283 (12.6%) |
| 25 to 34 Year Olds | 1,429 (80.7%) | 342 (19.3%) |
| 35 Years and over | 1,296 (70.3%) | 547 (29.7%) |
| Total | 23,369 (81.6%) | 5,269 (18.4%) |
Educational Attainment by Field of Study in St. Mary's County
Engineering (4,779 | 16.8%), business (4,327 | 15.2%), arts & humanities (2,696 | 9.5%), education (2,487 | 8.7%), and computers & mathematics (2,284 | 8.0%) are the most common fields of study among 28,539 individuals in St. Mary's County who have obtained a bachelor's degree or higher.
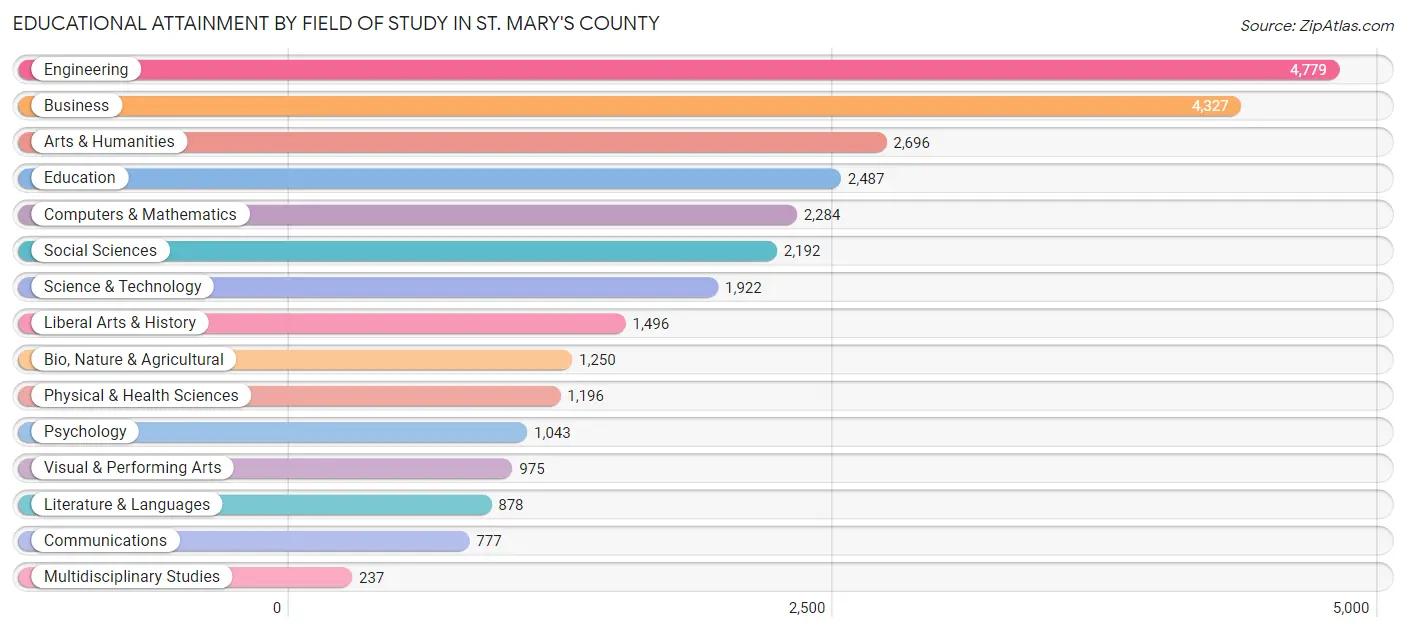
| Field of Study | # Graduates | % Graduates |
| Computers & Mathematics | 2,284 | 8.0% |
| Bio, Nature & Agricultural | 1,250 | 4.4% |
| Physical & Health Sciences | 1,196 | 4.2% |
| Psychology | 1,043 | 3.6% |
| Social Sciences | 2,192 | 7.7% |
| Engineering | 4,779 | 16.8% |
| Multidisciplinary Studies | 237 | 0.8% |
| Science & Technology | 1,922 | 6.7% |
| Business | 4,327 | 15.2% |
| Education | 2,487 | 8.7% |
| Literature & Languages | 878 | 3.1% |
| Liberal Arts & History | 1,496 | 5.2% |
| Visual & Performing Arts | 975 | 3.4% |
| Communications | 777 | 2.7% |
| Arts & Humanities | 2,696 | 9.5% |
| Total | 28,539 | 100.0% |
Transportation & Commute in St. Mary's County
Vehicle Availability by Sex in St. Mary's County
The most prevalent vehicle ownership categories in St. Mary's County are males with 2 vehicles (12,391, accounting for 38.6%) and females with 2 vehicles (9,403, making up 48.5%).
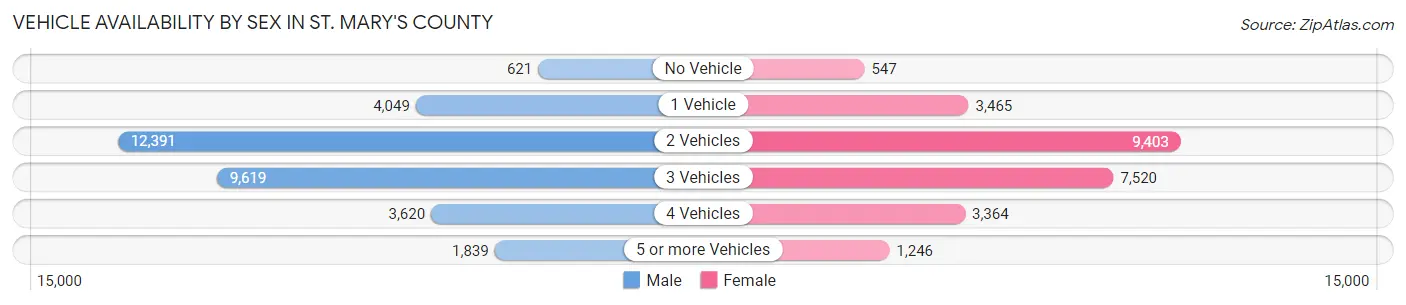
| Vehicles Available | Male | Female |
| No Vehicle | 621 (1.9%) | 547 (2.1%) |
| 1 Vehicle | 4,049 (12.6%) | 3,465 (13.6%) |
| 2 Vehicles | 12,391 (38.6%) | 9,403 (36.8%) |
| 3 Vehicles | 9,619 (29.9%) | 7,520 (29.4%) |
| 4 Vehicles | 3,620 (11.3%) | 3,364 (13.2%) |
| 5 or more Vehicles | 1,839 (5.7%) | 1,246 (4.9%) |
| Total | 32,139 (100.0%) | 25,545 (100.0%) |
Commute Time in St. Mary's County
The most frequently occuring commute durations in St. Mary's County are 15 to 19 minutes (9,169 commuters, 18.3%), 20 to 24 minutes (7,305 commuters, 14.6%), and 10 to 14 minutes (6,808 commuters, 13.6%).
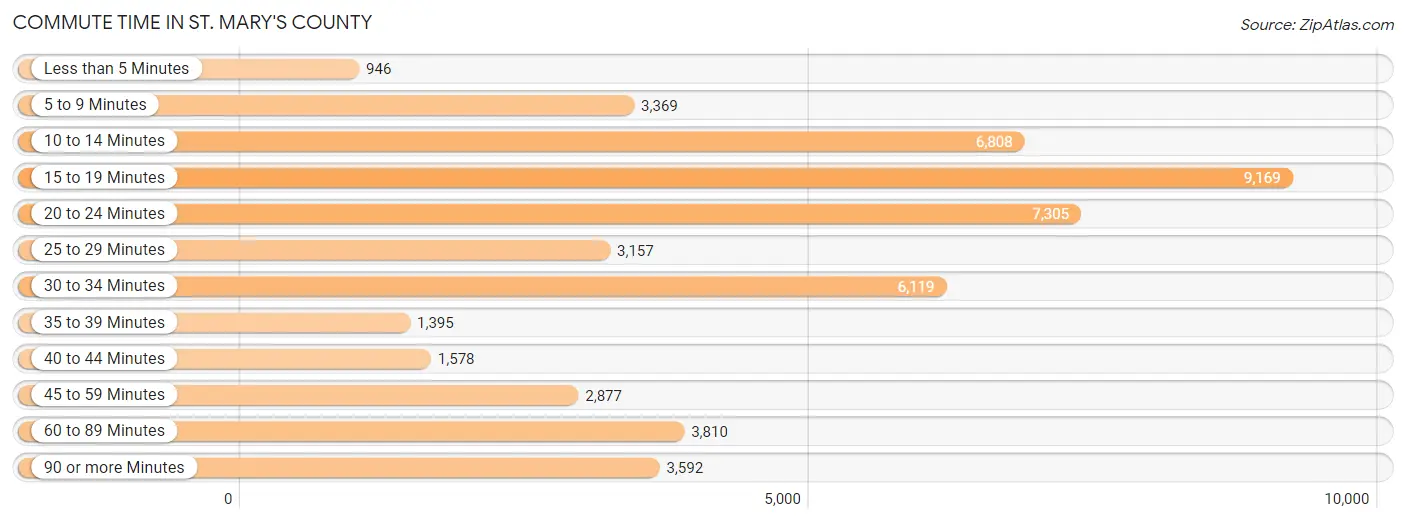
| Commute Time | # Commuters | % Commuters |
| Less than 5 Minutes | 946 | 1.9% |
| 5 to 9 Minutes | 3,369 | 6.7% |
| 10 to 14 Minutes | 6,808 | 13.6% |
| 15 to 19 Minutes | 9,169 | 18.3% |
| 20 to 24 Minutes | 7,305 | 14.6% |
| 25 to 29 Minutes | 3,157 | 6.3% |
| 30 to 34 Minutes | 6,119 | 12.2% |
| 35 to 39 Minutes | 1,395 | 2.8% |
| 40 to 44 Minutes | 1,578 | 3.2% |
| 45 to 59 Minutes | 2,877 | 5.7% |
| 60 to 89 Minutes | 3,810 | 7.6% |
| 90 or more Minutes | 3,592 | 7.2% |
Commute Time by Sex in St. Mary's County
The most common commute times in St. Mary's County are 15 to 19 minutes (4,963 commuters, 17.4%) for males and 15 to 19 minutes (4,206 commuters, 19.5%) for females.
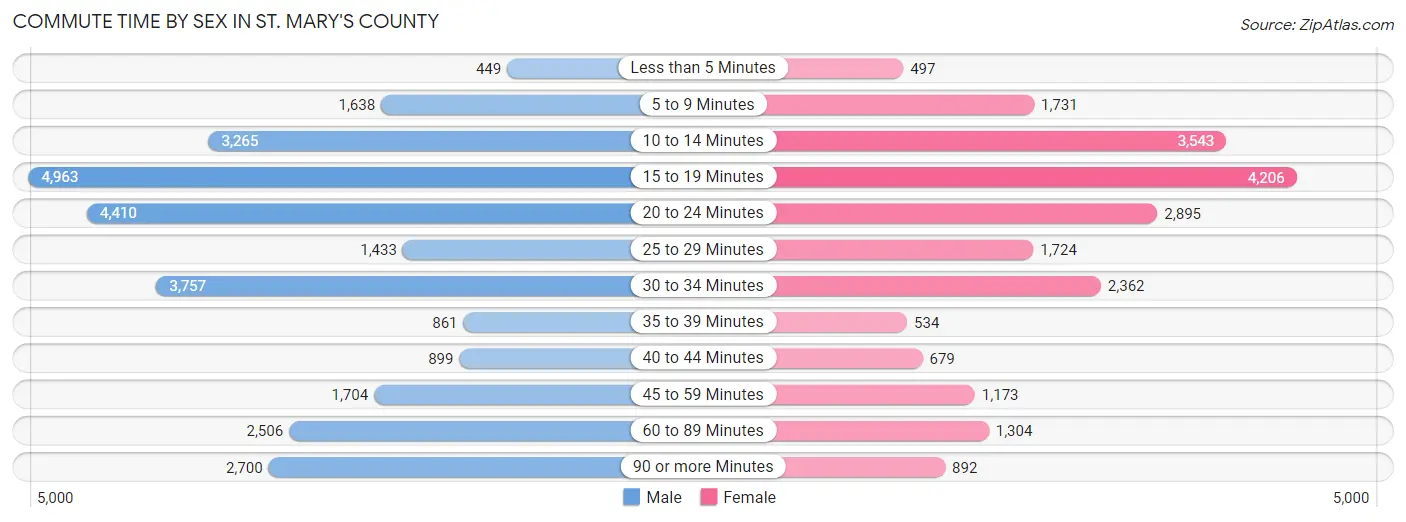
| Commute Time | Male | Female |
| Less than 5 Minutes | 449 (1.6%) | 497 (2.3%) |
| 5 to 9 Minutes | 1,638 (5.7%) | 1,731 (8.0%) |
| 10 to 14 Minutes | 3,265 (11.4%) | 3,543 (16.5%) |
| 15 to 19 Minutes | 4,963 (17.4%) | 4,206 (19.5%) |
| 20 to 24 Minutes | 4,410 (15.4%) | 2,895 (13.4%) |
| 25 to 29 Minutes | 1,433 (5.0%) | 1,724 (8.0%) |
| 30 to 34 Minutes | 3,757 (13.1%) | 2,362 (11.0%) |
| 35 to 39 Minutes | 861 (3.0%) | 534 (2.5%) |
| 40 to 44 Minutes | 899 (3.2%) | 679 (3.2%) |
| 45 to 59 Minutes | 1,704 (6.0%) | 1,173 (5.4%) |
| 60 to 89 Minutes | 2,506 (8.8%) | 1,304 (6.0%) |
| 90 or more Minutes | 2,700 (9.5%) | 892 (4.1%) |
Time of Departure to Work by Sex in St. Mary's County
The most frequent times of departure to work in St. Mary's County are 6:00 AM to 6:29 AM (3,650, 12.8%) for males and 7:30 AM to 7:59 AM (3,426, 15.9%) for females.
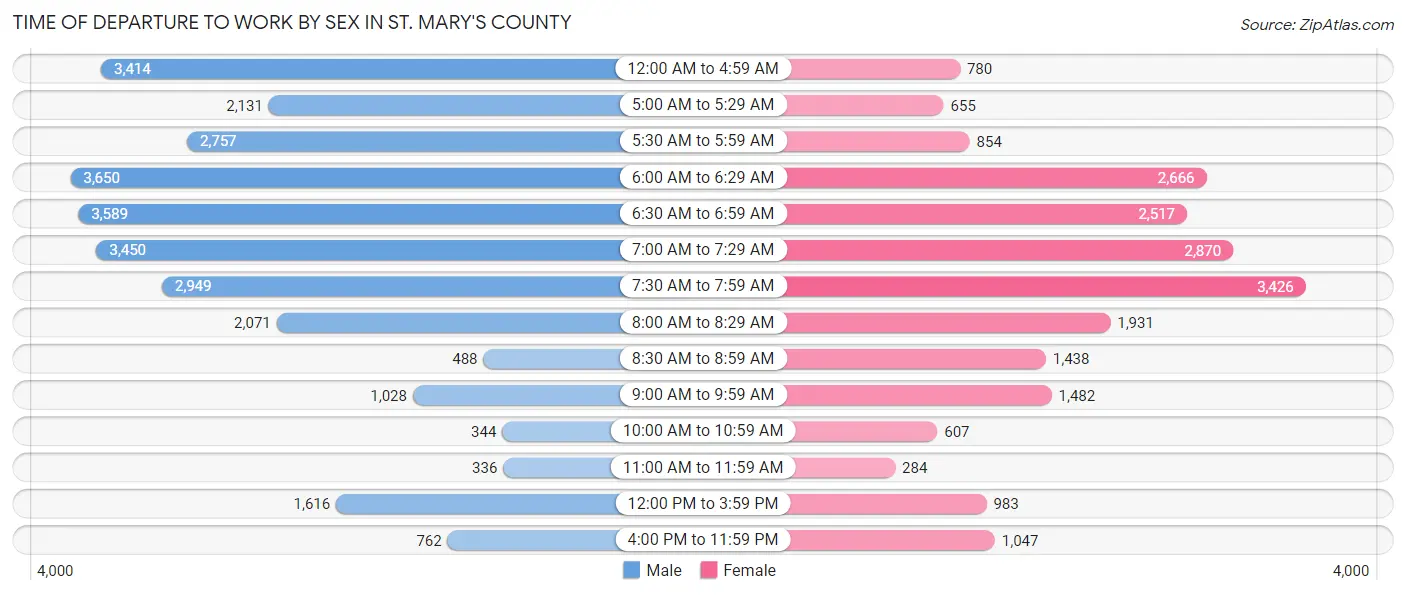
| Time of Departure | Male | Female |
| 12:00 AM to 4:59 AM | 3,414 (11.9%) | 780 (3.6%) |
| 5:00 AM to 5:29 AM | 2,131 (7.4%) | 655 (3.0%) |
| 5:30 AM to 5:59 AM | 2,757 (9.6%) | 854 (4.0%) |
| 6:00 AM to 6:29 AM | 3,650 (12.8%) | 2,666 (12.4%) |
| 6:30 AM to 6:59 AM | 3,589 (12.6%) | 2,517 (11.7%) |
| 7:00 AM to 7:29 AM | 3,450 (12.1%) | 2,870 (13.3%) |
| 7:30 AM to 7:59 AM | 2,949 (10.3%) | 3,426 (15.9%) |
| 8:00 AM to 8:29 AM | 2,071 (7.2%) | 1,931 (9.0%) |
| 8:30 AM to 8:59 AM | 488 (1.7%) | 1,438 (6.7%) |
| 9:00 AM to 9:59 AM | 1,028 (3.6%) | 1,482 (6.9%) |
| 10:00 AM to 10:59 AM | 344 (1.2%) | 607 (2.8%) |
| 11:00 AM to 11:59 AM | 336 (1.2%) | 284 (1.3%) |
| 12:00 PM to 3:59 PM | 1,616 (5.7%) | 983 (4.6%) |
| 4:00 PM to 11:59 PM | 762 (2.7%) | 1,047 (4.9%) |
| Total | 28,585 (100.0%) | 21,540 (100.0%) |
Housing Occupancy in St. Mary's County
Occupancy by Ownership in St. Mary's County
Of the total 41,211 dwellings in St. Mary's County, owner-occupied units account for 29,865 (72.5%), while renter-occupied units make up 11,346 (27.5%).
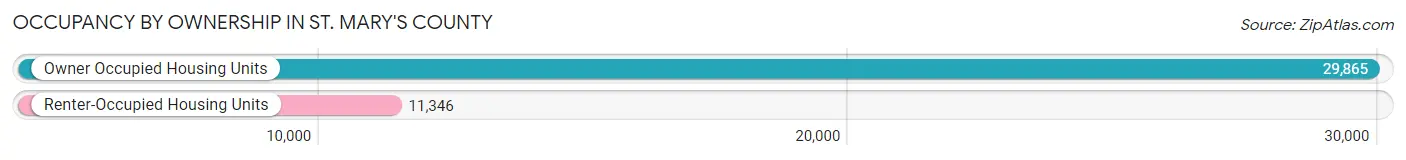
| Occupancy | # Housing Units | % Housing Units |
| Owner Occupied Housing Units | 29,865 | 72.5% |
| Renter-Occupied Housing Units | 11,346 | 27.5% |
| Total Occupied Housing Units | 41,211 | 100.0% |
Occupancy by Household Size in St. Mary's County
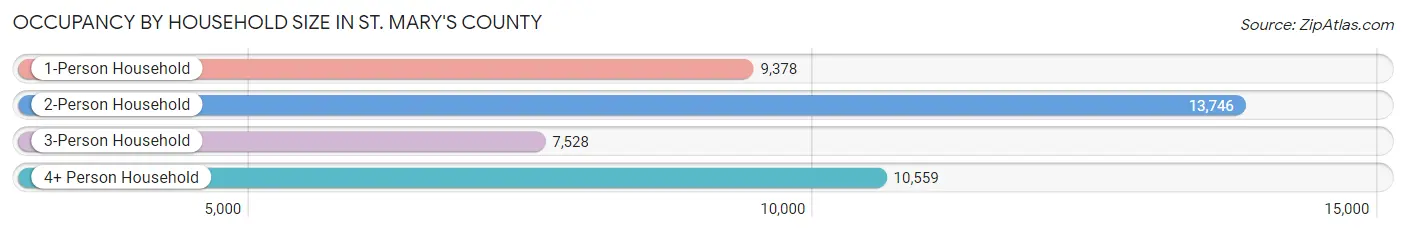
| Household Size | # Housing Units | % Housing Units |
| 1-Person Household | 9,378 | 22.8% |
| 2-Person Household | 13,746 | 33.4% |
| 3-Person Household | 7,528 | 18.3% |
| 4+ Person Household | 10,559 | 25.6% |
| Total Housing Units | 41,211 | 100.0% |
Occupancy by Ownership by Household Size in St. Mary's County
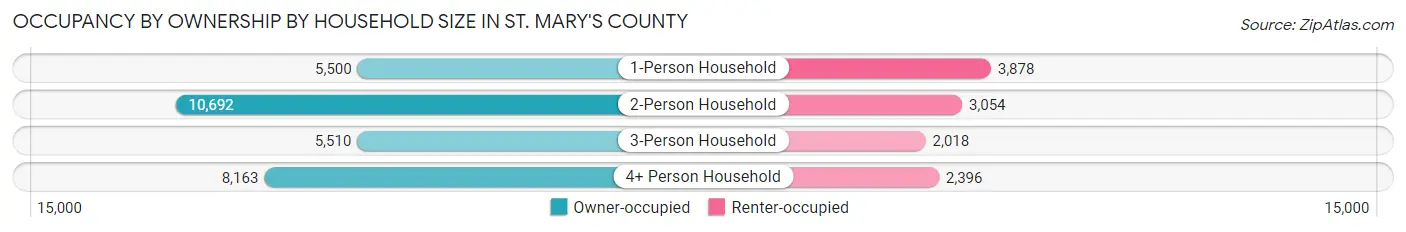
| Household Size | Owner-occupied | Renter-occupied |
| 1-Person Household | 5,500 (58.7%) | 3,878 (41.3%) |
| 2-Person Household | 10,692 (77.8%) | 3,054 (22.2%) |
| 3-Person Household | 5,510 (73.2%) | 2,018 (26.8%) |
| 4+ Person Household | 8,163 (77.3%) | 2,396 (22.7%) |
| Total Housing Units | 29,865 (72.5%) | 11,346 (27.5%) |
Occupancy by Educational Attainment in St. Mary's County
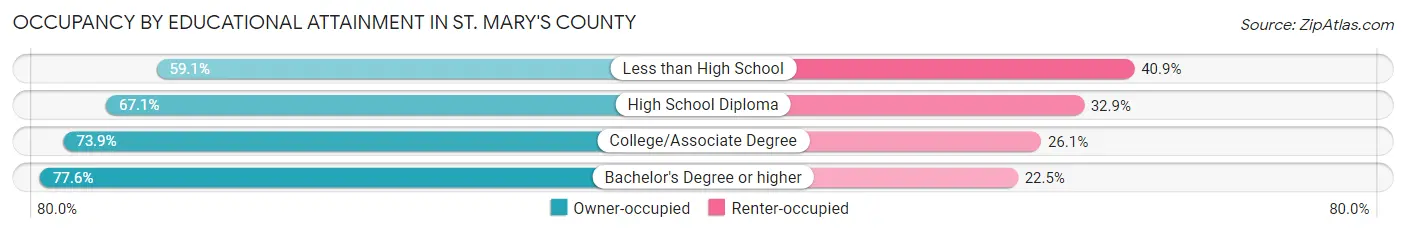
| Household Size | Owner-occupied | Renter-occupied |
| Less than High School | 1,667 (59.1%) | 1,155 (40.9%) |
| High School Diploma | 7,345 (67.1%) | 3,604 (32.9%) |
| College/Associate Degree | 8,537 (73.9%) | 3,021 (26.1%) |
| Bachelor's Degree or higher | 12,316 (77.5%) | 3,566 (22.5%) |
Occupancy by Age of Householder in St. Mary's County
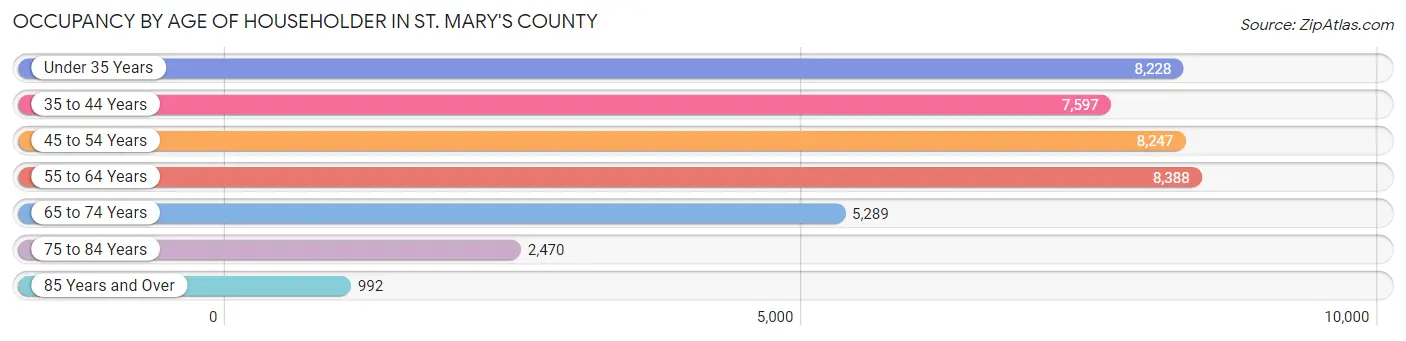
| Age Bracket | # Households | % Households |
| Under 35 Years | 8,228 | 20.0% |
| 35 to 44 Years | 7,597 | 18.4% |
| 45 to 54 Years | 8,247 | 20.0% |
| 55 to 64 Years | 8,388 | 20.3% |
| 65 to 74 Years | 5,289 | 12.8% |
| 75 to 84 Years | 2,470 | 6.0% |
| 85 Years and Over | 992 | 2.4% |
| Total | 41,211 | 100.0% |
Housing Finances in St. Mary's County
Median Income by Occupancy in St. Mary's County
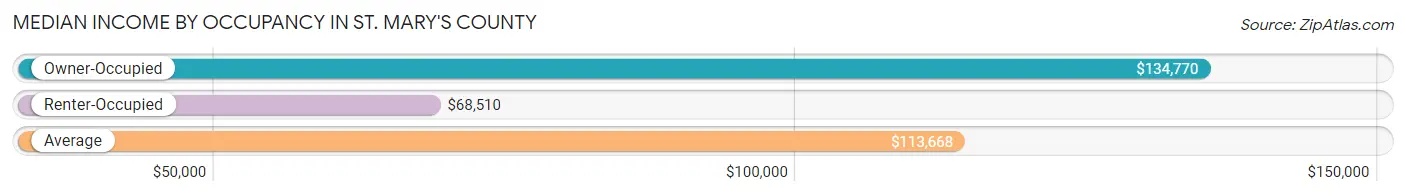
| Occupancy Type | # Households | Median Income |
| Owner-Occupied | 29,865 (72.5%) | $134,770 |
| Renter-Occupied | 11,346 (27.5%) | $68,510 |
| Average | 41,211 (100.0%) | $113,668 |
Occupancy by Householder Income Bracket in St. Mary's County
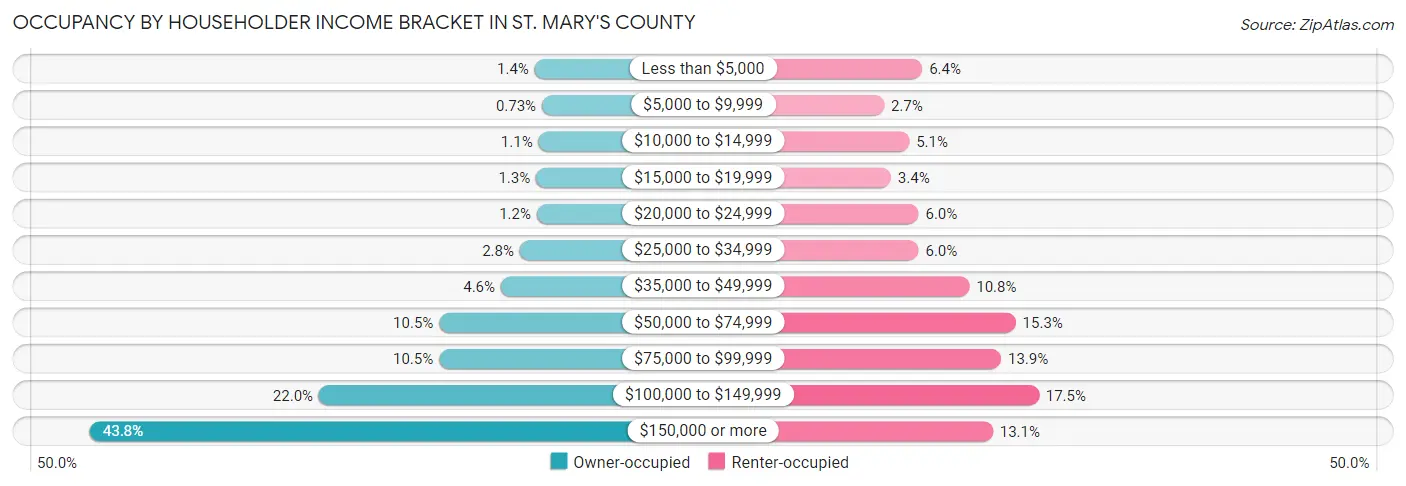
| Income Bracket | Owner-occupied | Renter-occupied |
| Less than $5,000 | 425 (1.4%) | 721 (6.4%) |
| $5,000 to $9,999 | 217 (0.7%) | 307 (2.7%) |
| $10,000 to $14,999 | 316 (1.1%) | 580 (5.1%) |
| $15,000 to $19,999 | 386 (1.3%) | 382 (3.4%) |
| $20,000 to $24,999 | 364 (1.2%) | 681 (6.0%) |
| $25,000 to $34,999 | 849 (2.8%) | 681 (6.0%) |
| $35,000 to $49,999 | 1,386 (4.6%) | 1,229 (10.8%) |
| $50,000 to $74,999 | 3,142 (10.5%) | 1,730 (15.2%) |
| $75,000 to $99,999 | 3,144 (10.5%) | 1,572 (13.9%) |
| $100,000 to $149,999 | 6,561 (22.0%) | 1,980 (17.4%) |
| $150,000 or more | 13,075 (43.8%) | 1,483 (13.1%) |
| Total | 29,865 (100.0%) | 11,346 (100.0%) |
Monthly Housing Cost Tiers in St. Mary's County
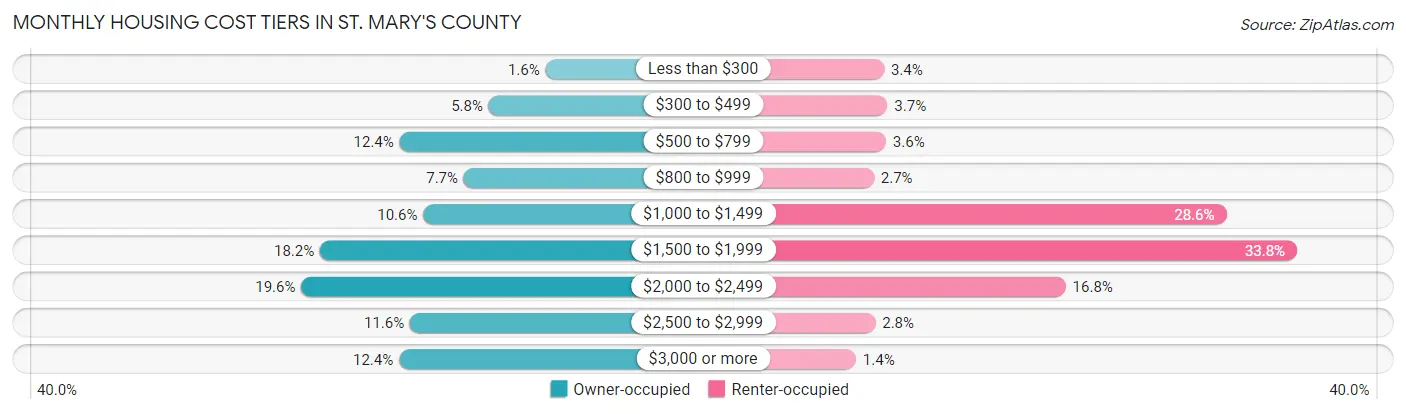
| Monthly Cost | Owner-occupied | Renter-occupied |
| Less than $300 | 487 (1.6%) | 389 (3.4%) |
| $300 to $499 | 1,734 (5.8%) | 417 (3.7%) |
| $500 to $799 | 3,696 (12.4%) | 405 (3.6%) |
| $800 to $999 | 2,286 (7.6%) | 304 (2.7%) |
| $1,000 to $1,499 | 3,179 (10.6%) | 3,249 (28.6%) |
| $1,500 to $1,999 | 5,447 (18.2%) | 3,839 (33.8%) |
| $2,000 to $2,499 | 5,860 (19.6%) | 1,907 (16.8%) |
| $2,500 to $2,999 | 3,467 (11.6%) | 316 (2.8%) |
| $3,000 or more | 3,709 (12.4%) | 154 (1.4%) |
| Total | 29,865 (100.0%) | 11,346 (100.0%) |
Physical Housing Characteristics in St. Mary's County
Housing Structures in St. Mary's County
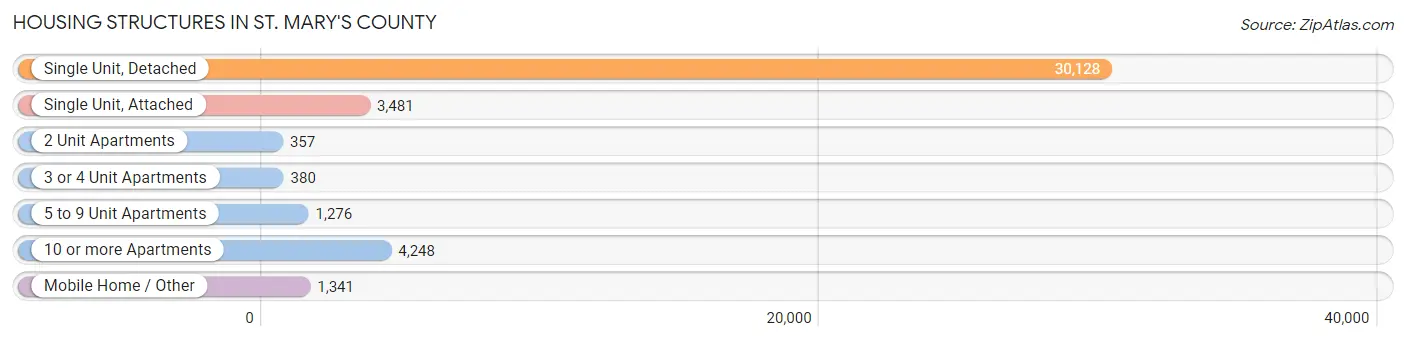
| Structure Type | # Housing Units | % Housing Units |
| Single Unit, Detached | 30,128 | 73.1% |
| Single Unit, Attached | 3,481 | 8.5% |
| 2 Unit Apartments | 357 | 0.9% |
| 3 or 4 Unit Apartments | 380 | 0.9% |
| 5 to 9 Unit Apartments | 1,276 | 3.1% |
| 10 or more Apartments | 4,248 | 10.3% |
| Mobile Home / Other | 1,341 | 3.3% |
| Total | 41,211 | 100.0% |
Housing Structures by Occupancy in St. Mary's County
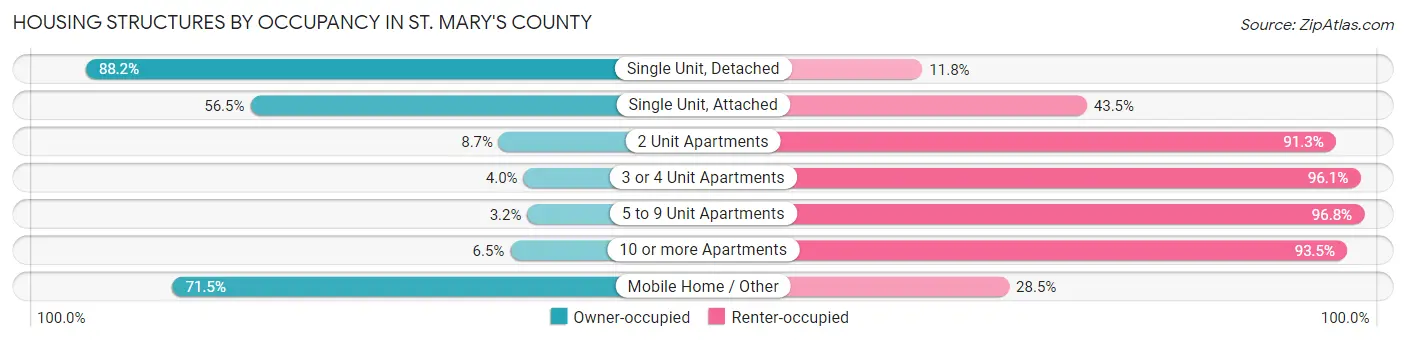
| Structure Type | Owner-occupied | Renter-occupied |
| Single Unit, Detached | 26,575 (88.2%) | 3,553 (11.8%) |
| Single Unit, Attached | 1,968 (56.5%) | 1,513 (43.5%) |
| 2 Unit Apartments | 31 (8.7%) | 326 (91.3%) |
| 3 or 4 Unit Apartments | 15 (4.0%) | 365 (96.1%) |
| 5 to 9 Unit Apartments | 41 (3.2%) | 1,235 (96.8%) |
| 10 or more Apartments | 276 (6.5%) | 3,972 (93.5%) |
| Mobile Home / Other | 959 (71.5%) | 382 (28.5%) |
| Total | 29,865 (72.5%) | 11,346 (27.5%) |
Housing Structures by Number of Rooms in St. Mary's County
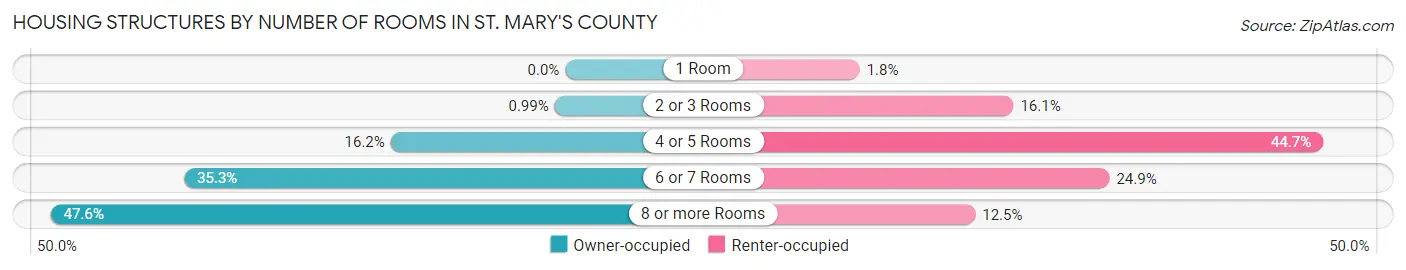
| Number of Rooms | Owner-occupied | Renter-occupied |
| 1 Room | 0 (0.0%) | 208 (1.8%) |
| 2 or 3 Rooms | 296 (1.0%) | 1,821 (16.1%) |
| 4 or 5 Rooms | 4,822 (16.2%) | 5,069 (44.7%) |
| 6 or 7 Rooms | 10,531 (35.3%) | 2,828 (24.9%) |
| 8 or more Rooms | 14,216 (47.6%) | 1,420 (12.5%) |
| Total | 29,865 (100.0%) | 11,346 (100.0%) |
Housing Structure by Heating Type in St. Mary's County
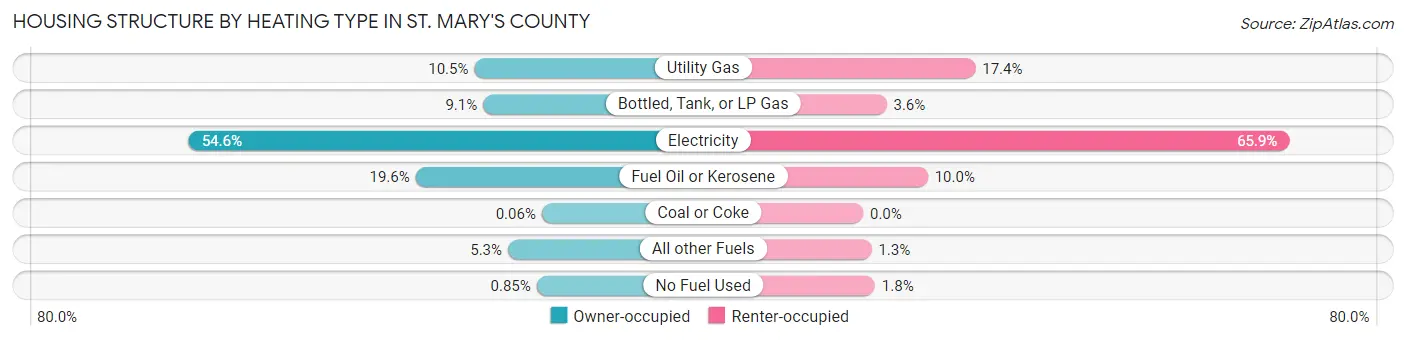
| Heating Type | Owner-occupied | Renter-occupied |
| Utility Gas | 3,131 (10.5%) | 1,969 (17.3%) |
| Bottled, Tank, or LP Gas | 2,728 (9.1%) | 412 (3.6%) |
| Electricity | 16,313 (54.6%) | 7,474 (65.9%) |
| Fuel Oil or Kerosene | 5,841 (19.6%) | 1,135 (10.0%) |
| Coal or Coke | 17 (0.1%) | 0 (0.0%) |
| All other Fuels | 1,580 (5.3%) | 148 (1.3%) |
| No Fuel Used | 255 (0.9%) | 208 (1.8%) |
| Total | 29,865 (100.0%) | 11,346 (100.0%) |
Household Vehicle Usage in St. Mary's County
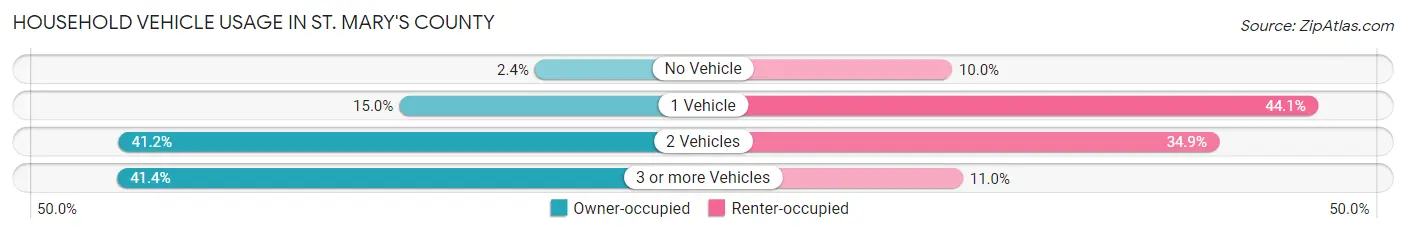
| Vehicles per Household | Owner-occupied | Renter-occupied |
| No Vehicle | 712 (2.4%) | 1,133 (10.0%) |
| 1 Vehicle | 4,493 (15.0%) | 5,006 (44.1%) |
| 2 Vehicles | 12,310 (41.2%) | 3,959 (34.9%) |
| 3 or more Vehicles | 12,350 (41.3%) | 1,248 (11.0%) |
| Total | 29,865 (100.0%) | 11,346 (100.0%) |
Real Estate & Mortgages in St. Mary's County
Real Estate and Mortgage Overview in St. Mary's County
| Characteristic | Without Mortgage | With Mortgage |
| Housing Units | 8,229 | 21,636 |
| Median Property Value | $356,800 | $382,700 |
| Median Household Income | $90,876 | $10,830 |
| Monthly Housing Costs | $651 | $3,683 |
| Real Estate Taxes | $3,224 | $332 |
Property Value by Mortgage Status in St. Mary's County
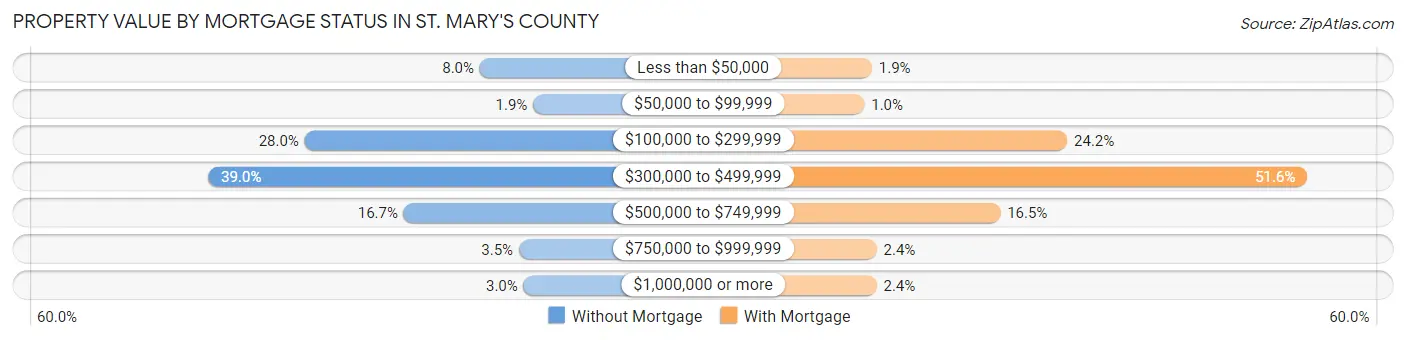
| Property Value | Without Mortgage | With Mortgage |
| Less than $50,000 | 656 (8.0%) | 403 (1.9%) |
| $50,000 to $99,999 | 155 (1.9%) | 217 (1.0%) |
| $100,000 to $299,999 | 2,303 (28.0%) | 5,231 (24.2%) |
| $300,000 to $499,999 | 3,212 (39.0%) | 11,168 (51.6%) |
| $500,000 to $749,999 | 1,371 (16.7%) | 3,576 (16.5%) |
| $750,000 to $999,999 | 288 (3.5%) | 522 (2.4%) |
| $1,000,000 or more | 244 (3.0%) | 519 (2.4%) |
| Total | 8,229 (100.0%) | 21,636 (100.0%) |
Household Income by Mortgage Status in St. Mary's County
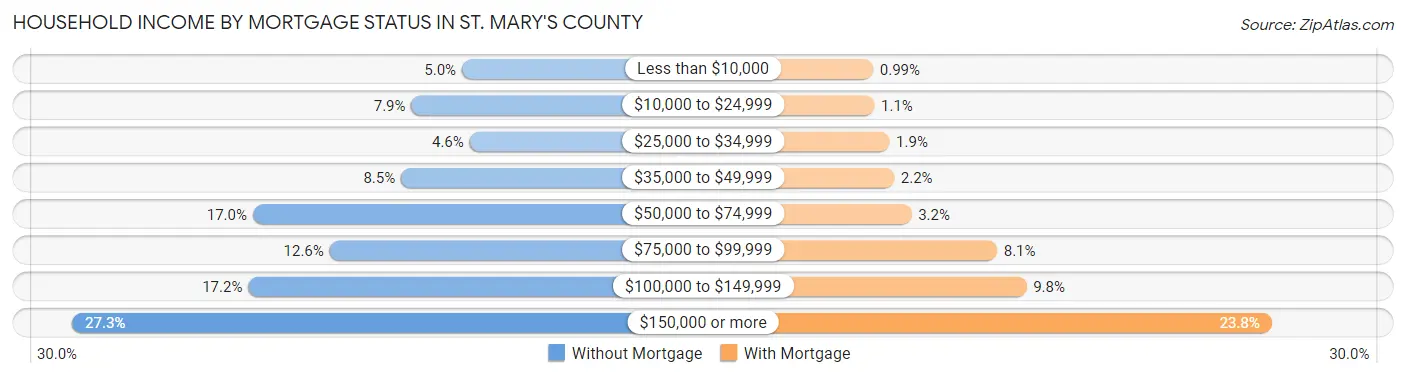
| Household Income | Without Mortgage | With Mortgage |
| Less than $10,000 | 412 (5.0%) | 214 (1.0%) |
| $10,000 to $24,999 | 650 (7.9%) | 230 (1.1%) |
| $25,000 to $34,999 | 376 (4.6%) | 416 (1.9%) |
| $35,000 to $49,999 | 699 (8.5%) | 473 (2.2%) |
| $50,000 to $74,999 | 1,396 (17.0%) | 687 (3.2%) |
| $75,000 to $99,999 | 1,034 (12.6%) | 1,746 (8.1%) |
| $100,000 to $149,999 | 1,417 (17.2%) | 2,110 (9.8%) |
| $150,000 or more | 2,245 (27.3%) | 5,144 (23.8%) |
| Total | 8,229 (100.0%) | 21,636 (100.0%) |
Property Value to Household Income Ratio in St. Mary's County
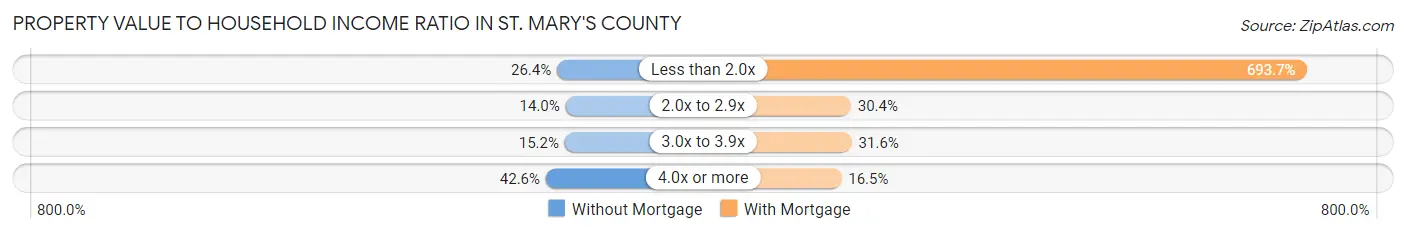
| Value-to-Income Ratio | Without Mortgage | With Mortgage |
| Less than 2.0x | 2,173 (26.4%) | 150,079 (693.6%) |
| 2.0x to 2.9x | 1,149 (14.0%) | 6,570 (30.4%) |
| 3.0x to 3.9x | 1,249 (15.2%) | 6,830 (31.6%) |
| 4.0x or more | 3,509 (42.6%) | 3,561 (16.5%) |
| Total | 8,229 (100.0%) | 21,636 (100.0%) |
Real Estate Taxes by Mortgage Status in St. Mary's County
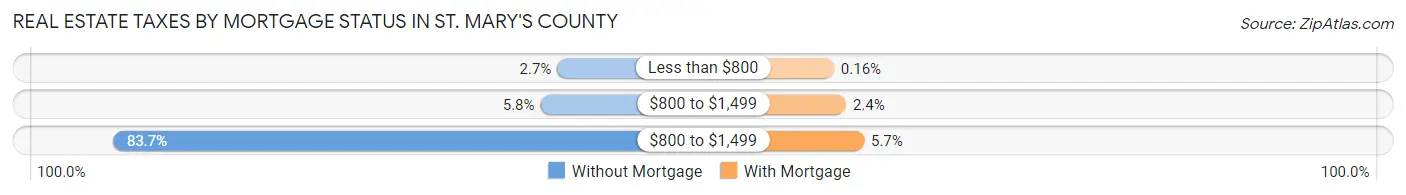
| Property Taxes | Without Mortgage | With Mortgage |
| Less than $800 | 225 (2.7%) | 34 (0.2%) |
| $800 to $1,499 | 477 (5.8%) | 510 (2.4%) |
| $800 to $1,499 | 6,888 (83.7%) | 1,224 (5.7%) |
| Total | 8,229 (100.0%) | 21,636 (100.0%) |
Health & Disability in St. Mary's County
Health Insurance Coverage by Age in St. Mary's County
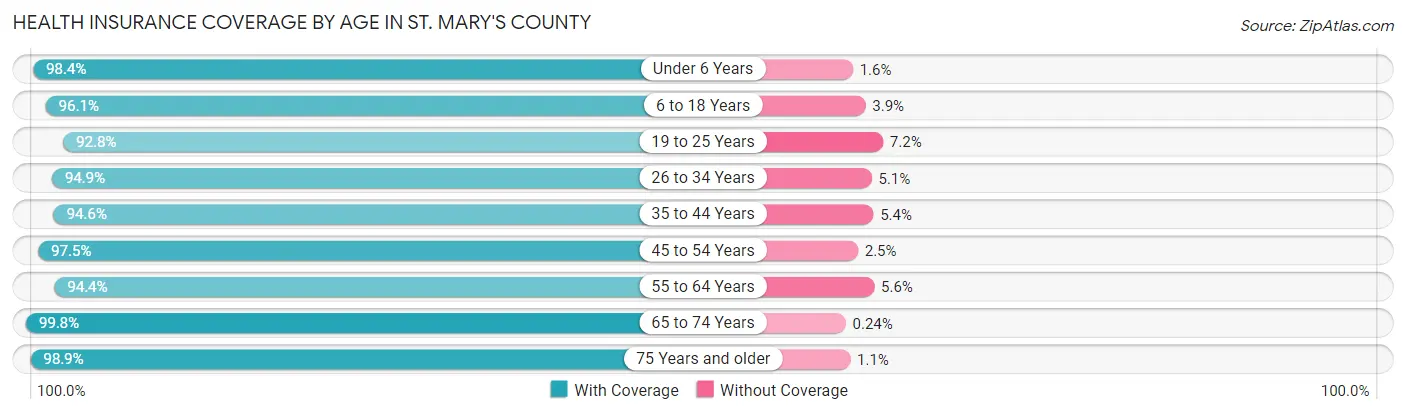
| Age Bracket | With Coverage | Without Coverage |
| Under 6 Years | 8,449 (98.4%) | 135 (1.6%) |
| 6 to 18 Years | 19,722 (96.1%) | 807 (3.9%) |
| 19 to 25 Years | 9,039 (92.8%) | 701 (7.2%) |
| 26 to 34 Years | 12,980 (94.9%) | 695 (5.1%) |
| 35 to 44 Years | 13,391 (94.6%) | 765 (5.4%) |
| 45 to 54 Years | 13,910 (97.5%) | 358 (2.5%) |
| 55 to 64 Years | 14,448 (94.4%) | 850 (5.6%) |
| 65 to 74 Years | 8,863 (99.8%) | 21 (0.2%) |
| 75 Years and older | 5,660 (98.9%) | 62 (1.1%) |
| Total | 106,462 (96.0%) | 4,394 (4.0%) |
Health Insurance Coverage by Citizenship Status in St. Mary's County
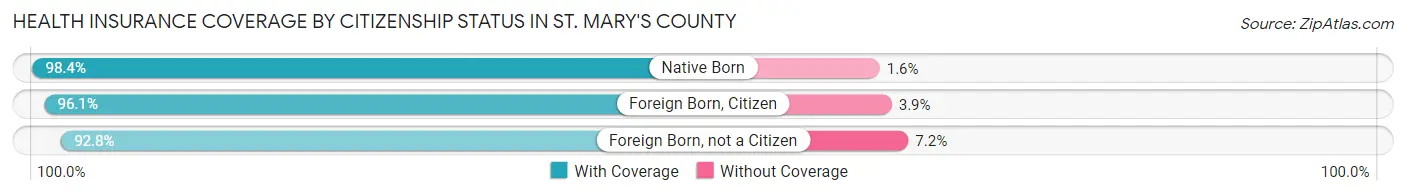
| Citizenship Status | With Coverage | Without Coverage |
| Native Born | 8,449 (98.4%) | 135 (1.6%) |
| Foreign Born, Citizen | 19,722 (96.1%) | 807 (3.9%) |
| Foreign Born, not a Citizen | 9,039 (92.8%) | 701 (7.2%) |
Health Insurance Coverage by Household Income in St. Mary's County
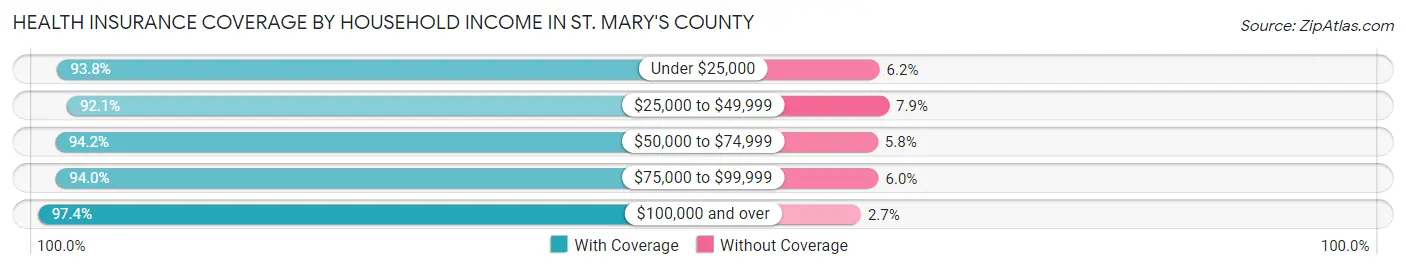
| Household Income | With Coverage | Without Coverage |
| Under $25,000 | 6,976 (93.8%) | 458 (6.2%) |
| $25,000 to $49,999 | 7,743 (92.1%) | 668 (7.9%) |
| $50,000 to $74,999 | 10,976 (94.2%) | 680 (5.8%) |
| $75,000 to $99,999 | 10,861 (94.0%) | 688 (6.0%) |
| $100,000 and over | 68,527 (97.4%) | 1,863 (2.6%) |
Public vs Private Health Insurance Coverage by Age in St. Mary's County
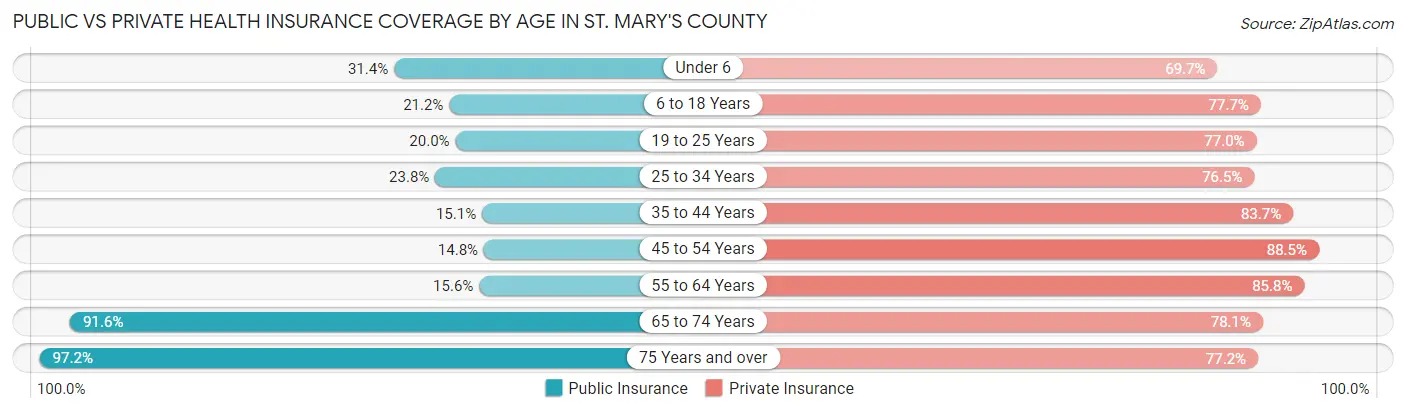
| Age Bracket | Public Insurance | Private Insurance |
| Under 6 | 2,699 (31.4%) | 5,985 (69.7%) |
| 6 to 18 Years | 4,351 (21.2%) | 15,960 (77.7%) |
| 19 to 25 Years | 1,952 (20.0%) | 7,495 (76.9%) |
| 25 to 34 Years | 3,254 (23.8%) | 10,467 (76.5%) |
| 35 to 44 Years | 2,137 (15.1%) | 11,854 (83.7%) |
| 45 to 54 Years | 2,104 (14.7%) | 12,633 (88.5%) |
| 55 to 64 Years | 2,391 (15.6%) | 13,130 (85.8%) |
| 65 to 74 Years | 8,135 (91.6%) | 6,941 (78.1%) |
| 75 Years and over | 5,562 (97.2%) | 4,419 (77.2%) |
| Total | 32,585 (29.4%) | 88,884 (80.2%) |
Disability Status by Sex by Age in St. Mary's County
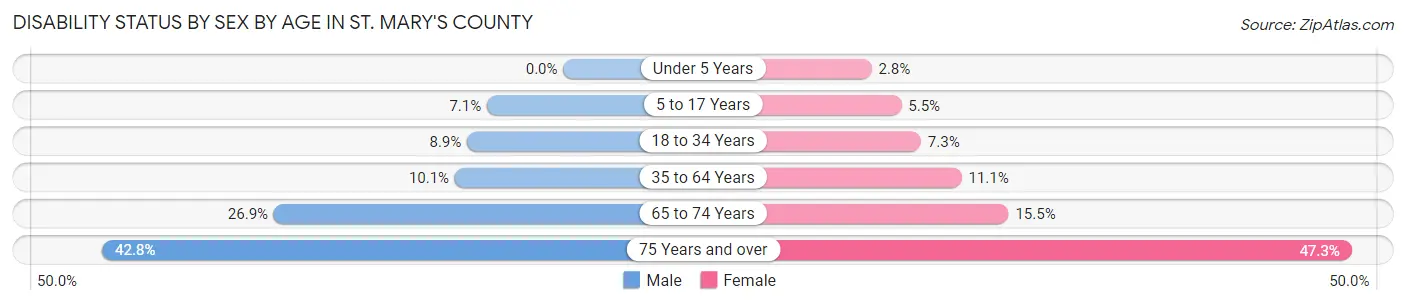
| Age Bracket | Male | Female |
| Under 5 Years | 0 (0.0%) | 95 (2.8%) |
| 5 to 17 Years | 741 (7.1%) | 544 (5.5%) |
| 18 to 34 Years | 1,137 (8.9%) | 920 (7.3%) |
| 35 to 64 Years | 2,160 (10.1%) | 2,473 (11.1%) |
| 65 to 74 Years | 1,153 (26.9%) | 710 (15.5%) |
| 75 Years and over | 1,099 (42.8%) | 1,493 (47.3%) |
Disability Class by Sex by Age in St. Mary's County
Disability Class: Hearing Difficulty
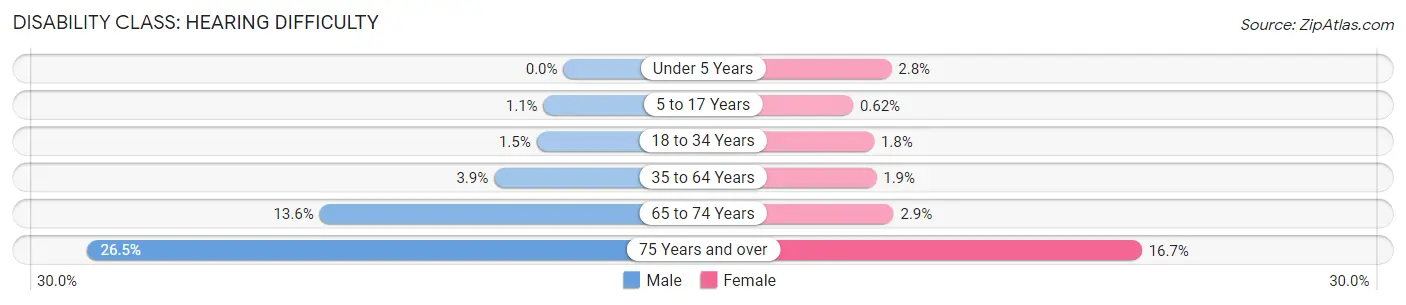
| Age Bracket | Male | Female |
| Under 5 Years | 0 (0.0%) | 95 (2.8%) |
| 5 to 17 Years | 116 (1.1%) | 61 (0.6%) |
| 18 to 34 Years | 190 (1.5%) | 224 (1.8%) |
| 35 to 64 Years | 829 (3.9%) | 427 (1.9%) |
| 65 to 74 Years | 583 (13.6%) | 132 (2.9%) |
| 75 Years and over | 680 (26.5%) | 527 (16.7%) |
Disability Class: Vision Difficulty
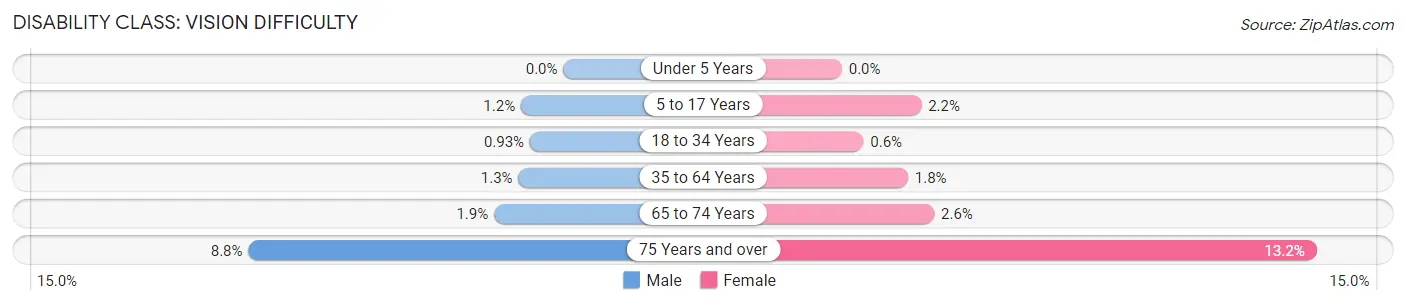
| Age Bracket | Male | Female |
| Under 5 Years | 0 (0.0%) | 0 (0.0%) |
| 5 to 17 Years | 123 (1.2%) | 217 (2.2%) |
| 18 to 34 Years | 119 (0.9%) | 75 (0.6%) |
| 35 to 64 Years | 268 (1.3%) | 409 (1.8%) |
| 65 to 74 Years | 83 (1.9%) | 118 (2.6%) |
| 75 Years and over | 225 (8.8%) | 417 (13.2%) |
Disability Class: Cognitive Difficulty
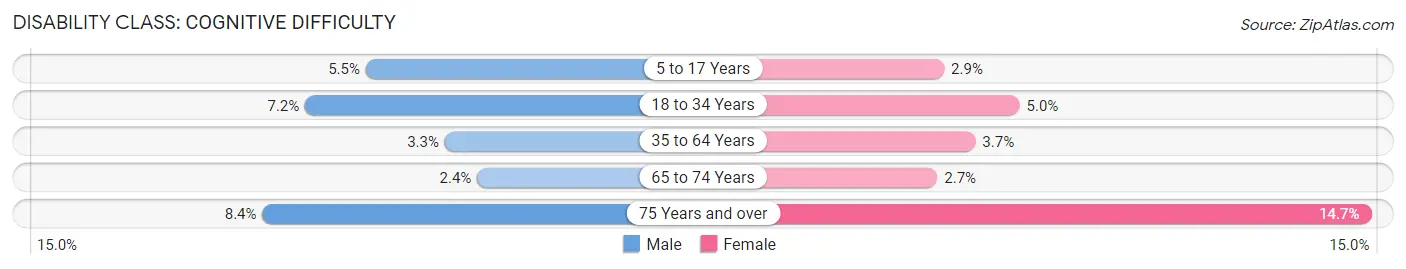
| Age Bracket | Male | Female |
| 5 to 17 Years | 575 (5.5%) | 280 (2.9%) |
| 18 to 34 Years | 915 (7.2%) | 620 (5.0%) |
| 35 to 64 Years | 709 (3.3%) | 829 (3.7%) |
| 65 to 74 Years | 103 (2.4%) | 122 (2.7%) |
| 75 Years and over | 215 (8.4%) | 465 (14.7%) |
Disability Class: Ambulatory Difficulty
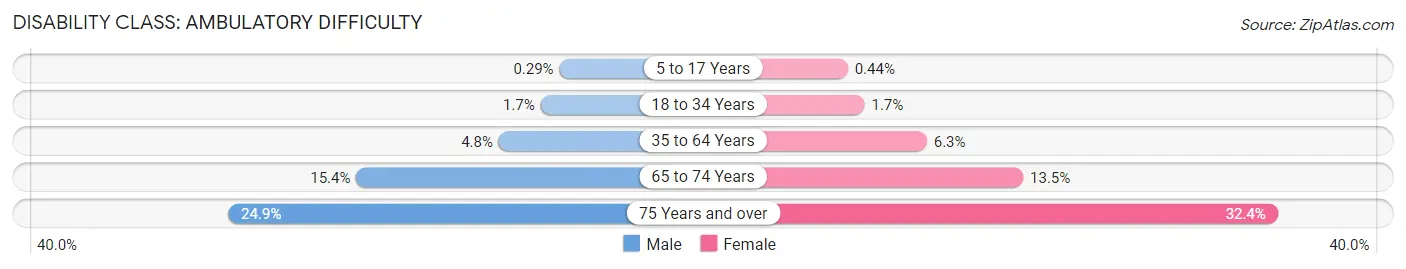
| Age Bracket | Male | Female |
| 5 to 17 Years | 30 (0.3%) | 43 (0.4%) |
| 18 to 34 Years | 215 (1.7%) | 212 (1.7%) |
| 35 to 64 Years | 1,028 (4.8%) | 1,404 (6.3%) |
| 65 to 74 Years | 660 (15.4%) | 618 (13.5%) |
| 75 Years and over | 639 (24.9%) | 1,021 (32.4%) |
Disability Class: Self-Care Difficulty
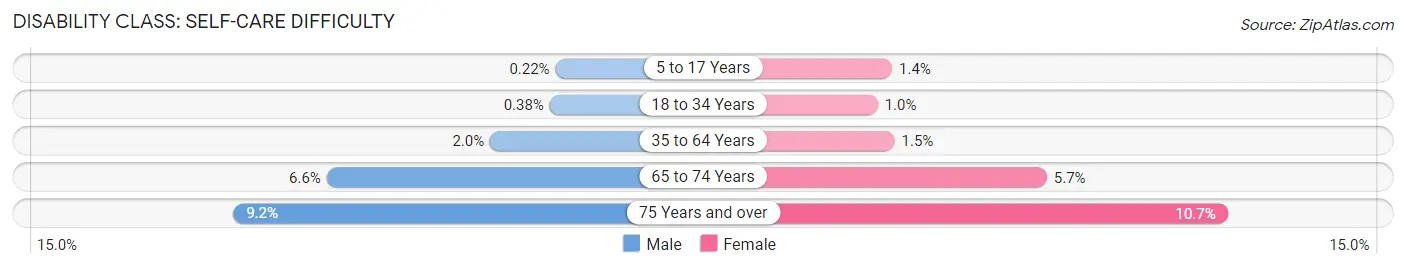
| Age Bracket | Male | Female |
| 5 to 17 Years | 23 (0.2%) | 138 (1.4%) |
| 18 to 34 Years | 49 (0.4%) | 125 (1.0%) |
| 35 to 64 Years | 437 (2.0%) | 327 (1.5%) |
| 65 to 74 Years | 283 (6.6%) | 262 (5.7%) |
| 75 Years and over | 236 (9.2%) | 339 (10.7%) |
Technology Access in St. Mary's County
Computing Device Access in St. Mary's County
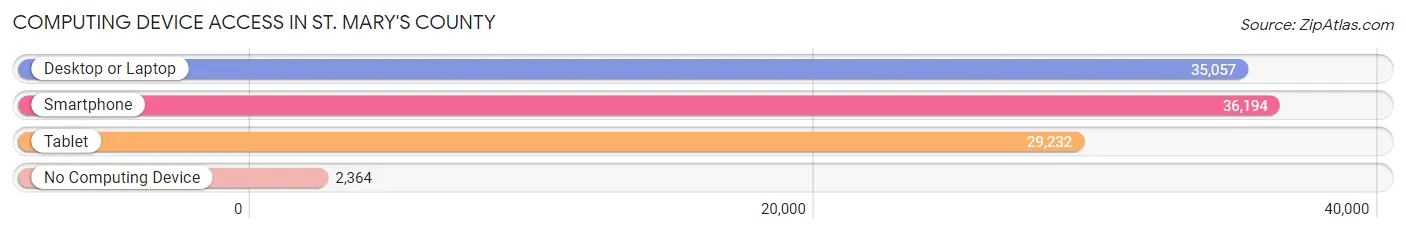
| Device Type | # Households | % Households |
| Desktop or Laptop | 35,057 | 85.1% |
| Smartphone | 36,194 | 87.8% |
| Tablet | 29,232 | 70.9% |
| No Computing Device | 2,364 | 5.7% |
| Total | 41,211 | 100.0% |
Internet Access in St. Mary's County
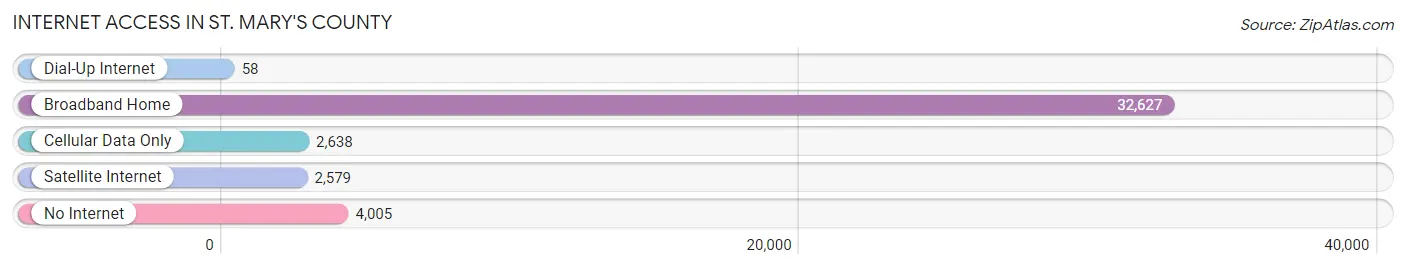
| Internet Type | # Households | % Households |
| Dial-Up Internet | 58 | 0.1% |
| Broadband Home | 32,627 | 79.2% |
| Cellular Data Only | 2,638 | 6.4% |
| Satellite Internet | 2,579 | 6.3% |
| No Internet | 4,005 | 9.7% |
| Total | 41,211 | 100.0% |
St. Mary's County Summary
St. Mary’s County is a county located in the state of Maryland, United States. It is part of the Southern Maryland region and is the largest county in the state by land area. The county seat is Leonardtown. As of the 2010 census, the population was 105,151.
History
St. Mary’s County was established in 1637, making it one of the oldest counties in the United States. It was named after the Virgin Mary, and was one of the original counties of the Province of Maryland. The county was originally part of the larger Calvert County, which was divided into St. Mary’s and Calvert counties in 1654.
The county was home to the first Maryland colony, which was established in 1634 by English settlers led by Leonard Calvert. The colony was located on the St. Mary’s River, which is now known as the Patuxent River. The county was also home to the first Catholic Mass in the United States, which was celebrated in 1641.
Geography
St. Mary’s County is located in the southern part of Maryland, and is bordered by Charles County to the north, Calvert County to the east, and the Potomac River to the south and west. The county is located on the western shore of the Chesapeake Bay.
The county has a total area of 511 square miles, of which 498 square miles is land and 13 square miles is water. The county is divided into five distinct regions: the Patuxent River Valley, the St. Mary’s River Valley, the Chesapeake Bay, the Potomac River, and the Eastern Shore.
The county is home to several state parks, including Point Lookout State Park, St. Clement’s Island State Park, and St. Mary’s River State Park.
Economy
St. Mary’s County is home to a diverse economy, with a mix of agriculture, manufacturing, and service industries. The county is home to several large employers, including the Patuxent River Naval Air Station, the St. Mary’s County Government, and the St. Mary’s College of Maryland.
Agriculture is an important part of the county’s economy, with crops such as corn, soybeans, wheat, and hay being grown in the area. The county is also home to several wineries, including the St. Mary’s County Winery and the Calvert County Winery.
Manufacturing is also an important part of the county’s economy, with companies such as Lockheed Martin, Northrop Grumman, and General Dynamics having a presence in the area.
Demographics
As of the 2010 census, the population of St. Mary’s County was 105,151, with a population density of 209 people per square mile. The racial makeup of the county was 79.3% White, 14.2% African American, 0.5% Native American, 2.2% Asian, 0.1% Pacific Islander, 1.7% from other races, and 2.2% from two or more races. Hispanic or Latino of any race were 4.3% of the population.
The median income for a household in the county was $76,845, and the median income for a family was $90,945. The per capita income for the county was $35,945. About 6.2% of families and 8.3% of the population were below the poverty line, including 10.2% of those under age 18 and 6.2% of those age 65 or over.
St. Mary’s County is a diverse and vibrant county with a rich history and a bright future. The county is home to a diverse economy, with a mix of agriculture, manufacturing, and service industries. The county is also home to a diverse population, with a mix of races and ethnicities. St. Mary’s County is a great place to live, work, and play.
Common Questions
What is the Total Population of St. Mary's County?
Total Population of St. Mary's County is 113,814.
What is the Total Male Population of St. Mary's County?
Total Male Population of St. Mary's County is 57,408.
What is the Total Female Population of St. Mary's County?
Total Female Population of St. Mary's County is 56,406.
What is the Ratio of Males per 100 Females in St. Mary's County?
There are 101.78 Males per 100 Females in St. Mary's County.
What is the Ratio of Females per 100 Males in St. Mary's County?
There are 98.25 Females per 100 Males in St. Mary's County.
What is the Median Population Age in St. Mary's County?
Median Population Age in St. Mary's County is 37.0 Years.
What is the Average Family Size in St. Mary's County
Average Family Size in St. Mary's County is 3.2 People.
What is the Average Household Size in St. Mary's County
Average Household Size in St. Mary's County is 2.7 People.
What is Per Capita Income in St. Mary's County?
Per Capita income in St. Mary's County is $49,755.
What is the Median Family Income in St. Mary's County?
Median Family Income in St. Mary's County is $132,926.
What is the Median Household income in St. Mary's County?
Median Household Income in St. Mary's County is $113,668.
What is Income or Wage Gap in St. Mary's County?
Income or Wage Gap in St. Mary's County is 38.8%.
Women in St. Mary's County earn 61.2 cents for every dollar earned by a man.
What is Family Income Deficit in St. Mary's County?
Family Income Deficit in St. Mary's County is $11,107.
Families that are below poverty line in St. Mary's County earn $11,107 less on average than the poverty threshold level.
What is Inequality or Gini Index in St. Mary's County?
Inequality or Gini Index in St. Mary's County is 0.41.
How Large is the Labor Force in St. Mary's County?
There are 61,544 People in the Labor Forcein in St. Mary's County.
What is the Percentage of People in the Labor Force in St. Mary's County?
68.4% of People are in the Labor Force in St. Mary's County.
What is the Unemployment Rate in St. Mary's County?
Unemployment Rate in St. Mary's County is 3.7%.