Somerset County, MD
Somerset County Map
Somerset County Overview
24,672
TOTAL POPULATION
13,521
MALE POPULATION
11,151
FEMALE POPULATION
121.25
MALES / 100 FEMALES
82.47
FEMALES / 100 MALES
38.0
MEDIAN AGE
2.9
AVG FAMILY SIZE
2.4
AVG HOUSEHOLD SIZE
$24,176
PER CAPITA INCOME
$66,215
AVG FAMILY INCOME
$52,149
AVG HOUSEHOLD INCOME
5.9%
WAGE / INCOME GAP [ % ]
94.1¢/ $1
WAGE / INCOME GAP [ $ ]
$10,341
FAMILY INCOME DEFICIT
0.46
INEQUALITY / GINI INDEX
10,389
LABOR FORCE [ PEOPLE ]
49.3%
PERCENT IN LABOR FORCE
7.0%
UNEMPLOYMENT RATE
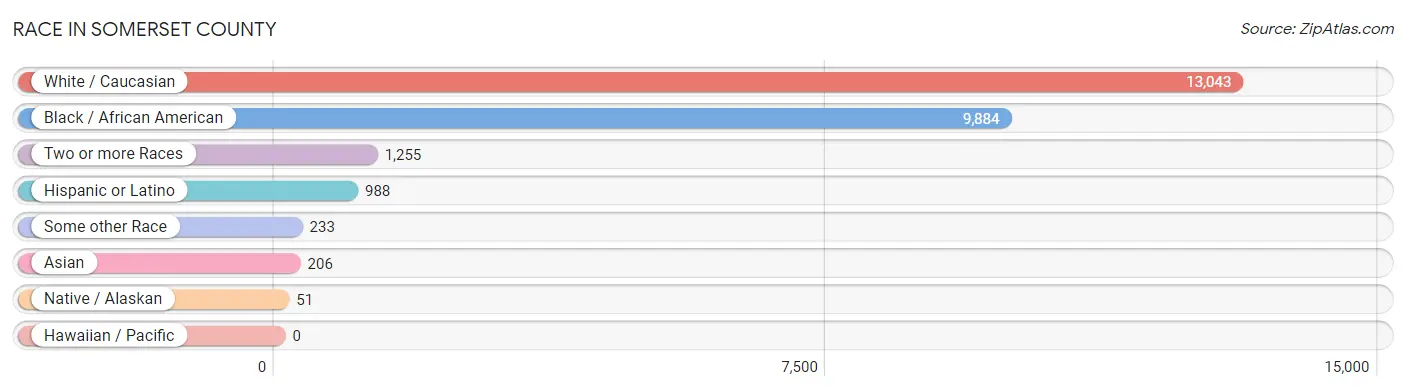
Race in Somerset County
The most populous races in Somerset County are White / Caucasian (13,043 | 52.9%), Black / African American (9,884 | 40.1%), and Two or more Races (1,255 | 5.1%).
| Race | # Population | % Population |
| Asian | 206 | 0.8% |
| Black / African American | 9,884 | 40.1% |
| Hawaiian / Pacific | 0 | 0.0% |
| Hispanic or Latino | 988 | 4.0% |
| Native / Alaskan | 51 | 0.2% |
| White / Caucasian | 13,043 | 52.9% |
| Two or more Races | 1,255 | 5.1% |
| Some other Race | 233 | 0.9% |
| Total | 24,672 | 100.0% |
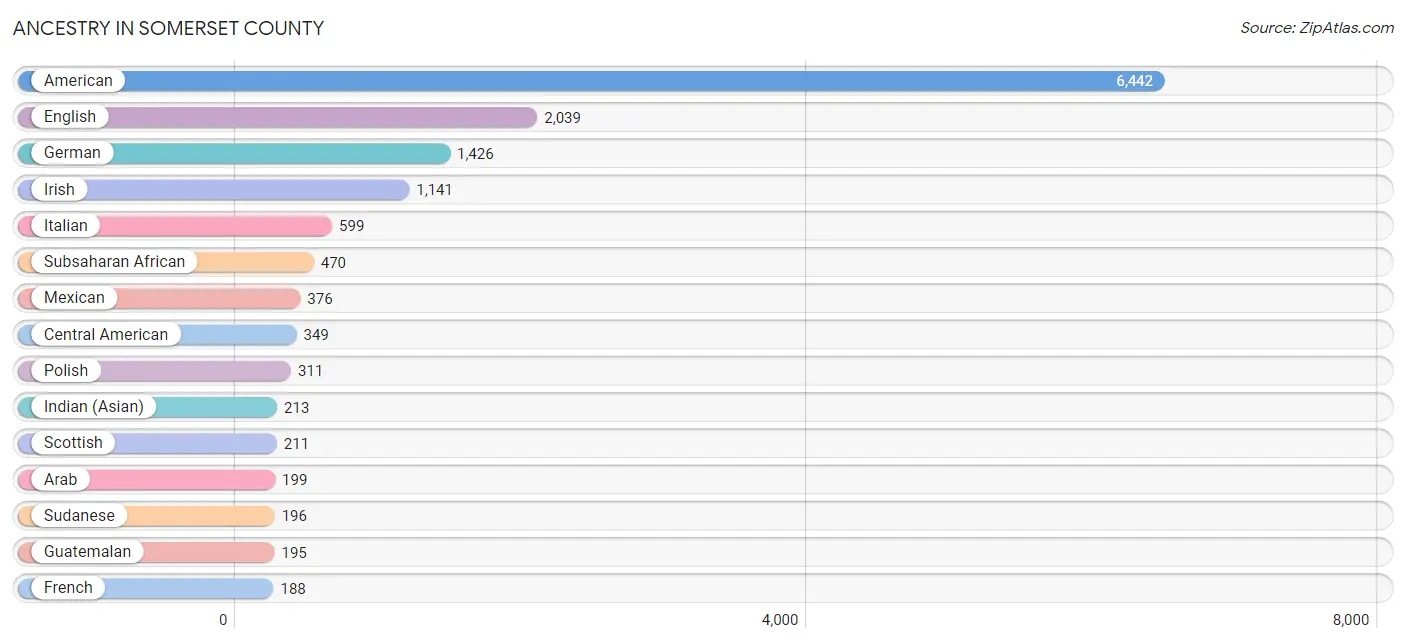
Ancestry in Somerset County
The most populous ancestries reported in Somerset County are American (6,442 | 26.1%), English (2,039 | 8.3%), German (1,426 | 5.8%), Irish (1,141 | 4.6%), and Italian (599 | 2.4%), together accounting for 47.2% of all Somerset County residents.
| Ancestry | # Population | % Population |
| African | 144 | 0.6% |
| American | 6,442 | 26.1% |
| Arab | 199 | 0.8% |
| Austrian | 35 | 0.1% |
| Belgian | 5 | 0.0% |
| Brazilian | 17 | 0.1% |
| British | 104 | 0.4% |
| British West Indian | 9 | 0.0% |
| Burmese | 22 | 0.1% |
| Canadian | 71 | 0.3% |
| Central American | 349 | 1.4% |
| Cherokee | 32 | 0.1% |
| Colombian | 7 | 0.0% |
| Costa Rican | 39 | 0.2% |
| Cuban | 2 | 0.0% |
| Czech | 78 | 0.3% |
| Czechoslovakian | 1 | 0.0% |
| Danish | 4 | 0.0% |
| Dominican | 53 | 0.2% |
| Dutch | 76 | 0.3% |
| Eastern European | 17 | 0.1% |
| English | 2,039 | 8.3% |
| European | 155 | 0.6% |
| Finnish | 4 | 0.0% |
| French | 188 | 0.8% |
| French Canadian | 11 | 0.0% |
| German | 1,426 | 5.8% |
| German Russian | 4 | 0.0% |
| Ghanaian | 116 | 0.5% |
| Greek | 34 | 0.1% |
| Guatemalan | 195 | 0.8% |
| Honduran | 38 | 0.2% |
| Hungarian | 92 | 0.4% |
| Indian (Asian) | 213 | 0.9% |
| Irish | 1,141 | 4.6% |
| Israeli | 63 | 0.3% |
| Italian | 599 | 2.4% |
| Jamaican | 33 | 0.1% |
| Korean | 52 | 0.2% |
| Lithuanian | 23 | 0.1% |
| Lumbee | 40 | 0.2% |
| Mexican | 376 | 1.5% |
| Nicaraguan | 3 | 0.0% |
| Nigerian | 38 | 0.2% |
| Norwegian | 75 | 0.3% |
| Pakistani | 17 | 0.1% |
| Panamanian | 24 | 0.1% |
| Pennsylvania German | 31 | 0.1% |
| Peruvian | 25 | 0.1% |
| Polish | 311 | 1.3% |
| Portuguese | 15 | 0.1% |
| Puerto Rican | 75 | 0.3% |
| Romanian | 80 | 0.3% |
| Russian | 59 | 0.2% |
| Salvadoran | 41 | 0.2% |
| Scandinavian | 59 | 0.2% |
| Scotch-Irish | 97 | 0.4% |
| Scottish | 211 | 0.9% |
| Seminole | 9 | 0.0% |
| Sierra Leonean | 22 | 0.1% |
| Slavic | 8 | 0.0% |
| Slovak | 26 | 0.1% |
| Slovene | 7 | 0.0% |
| South American | 32 | 0.1% |
| Spaniard | 47 | 0.2% |
| Spanish | 5 | 0.0% |
| Spanish American | 25 | 0.1% |
| Sri Lankan | 92 | 0.4% |
| Subsaharan African | 470 | 1.9% |
| Sudanese | 196 | 0.8% |
| Swedish | 94 | 0.4% |
| Swiss | 34 | 0.1% |
| Thai | 25 | 0.1% |
| Turkish | 25 | 0.1% |
| Welsh | 96 | 0.4% |
| West Indian | 8 | 0.0% | View All 76 Rows |
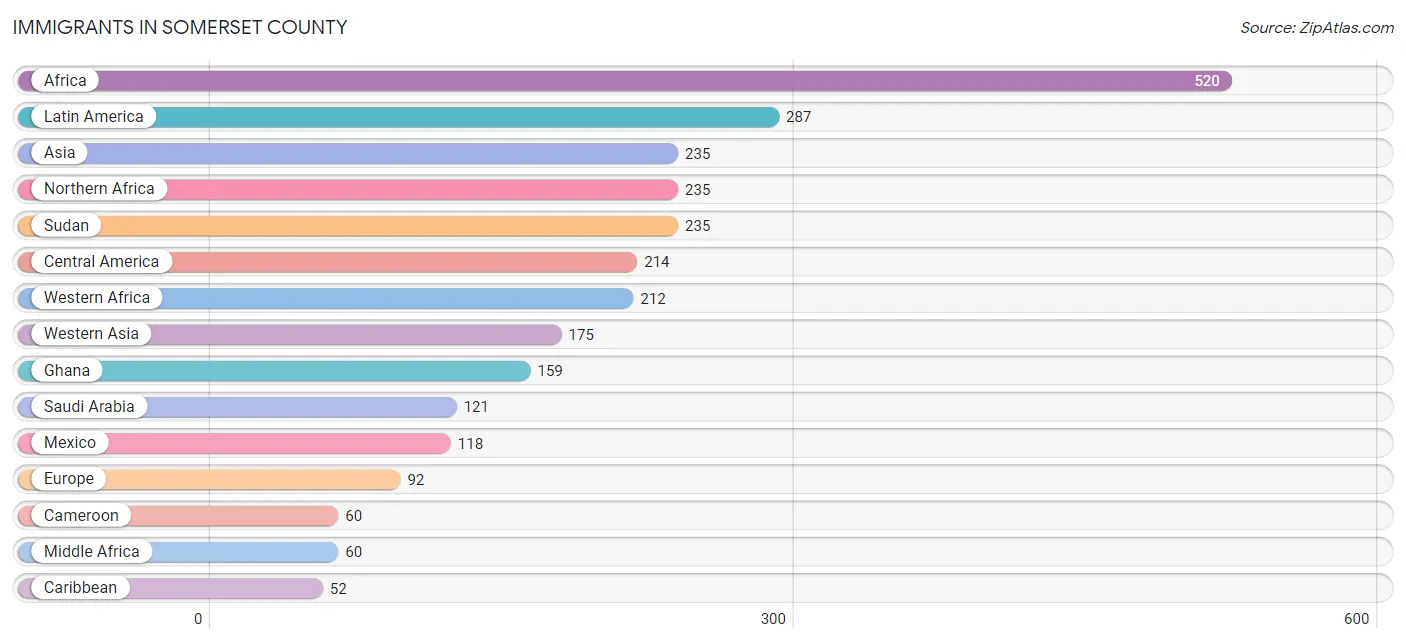
Immigrants in Somerset County
The most numerous immigrant groups reported in Somerset County came from Africa (520 | 2.1%), Latin America (287 | 1.2%), Asia (235 | 0.9%), Northern Africa (235 | 0.9%), and Sudan (235 | 0.9%), together accounting for 6.1% of all Somerset County residents.
| Immigration Origin | # Population | % Population |
| Africa | 520 | 2.1% |
| Argentina | 14 | 0.1% |
| Asia | 235 | 0.9% |
| Cameroon | 60 | 0.2% |
| Caribbean | 52 | 0.2% |
| Central America | 214 | 0.9% |
| China | 10 | 0.0% |
| Cuba | 2 | 0.0% |
| Dominican Republic | 26 | 0.1% |
| Eastern Asia | 10 | 0.0% |
| Eastern Europe | 51 | 0.2% |
| El Salvador | 46 | 0.2% |
| England | 6 | 0.0% |
| Europe | 92 | 0.4% |
| Germany | 10 | 0.0% |
| Ghana | 159 | 0.6% |
| Guatemala | 18 | 0.1% |
| Honduras | 32 | 0.1% |
| India | 11 | 0.0% |
| Jamaica | 24 | 0.1% |
| Latin America | 287 | 1.2% |
| Mexico | 118 | 0.5% |
| Middle Africa | 60 | 0.2% |
| Moldova | 36 | 0.2% |
| Nigeria | 31 | 0.1% |
| Northern Africa | 235 | 0.9% |
| Northern Europe | 24 | 0.1% |
| Peru | 7 | 0.0% |
| Philippines | 4 | 0.0% |
| Romania | 15 | 0.1% |
| Saudi Arabia | 121 | 0.5% |
| Sierra Leone | 22 | 0.1% |
| South America | 21 | 0.1% |
| South Central Asia | 11 | 0.0% |
| South Eastern Asia | 39 | 0.2% |
| Southern Europe | 7 | 0.0% |
| Spain | 2 | 0.0% |
| Sudan | 235 | 0.9% |
| Vietnam | 35 | 0.1% |
| Western Africa | 212 | 0.9% |
| Western Asia | 175 | 0.7% |
| Western Europe | 10 | 0.0% | View All 42 Rows |
Sex and Age in Somerset County
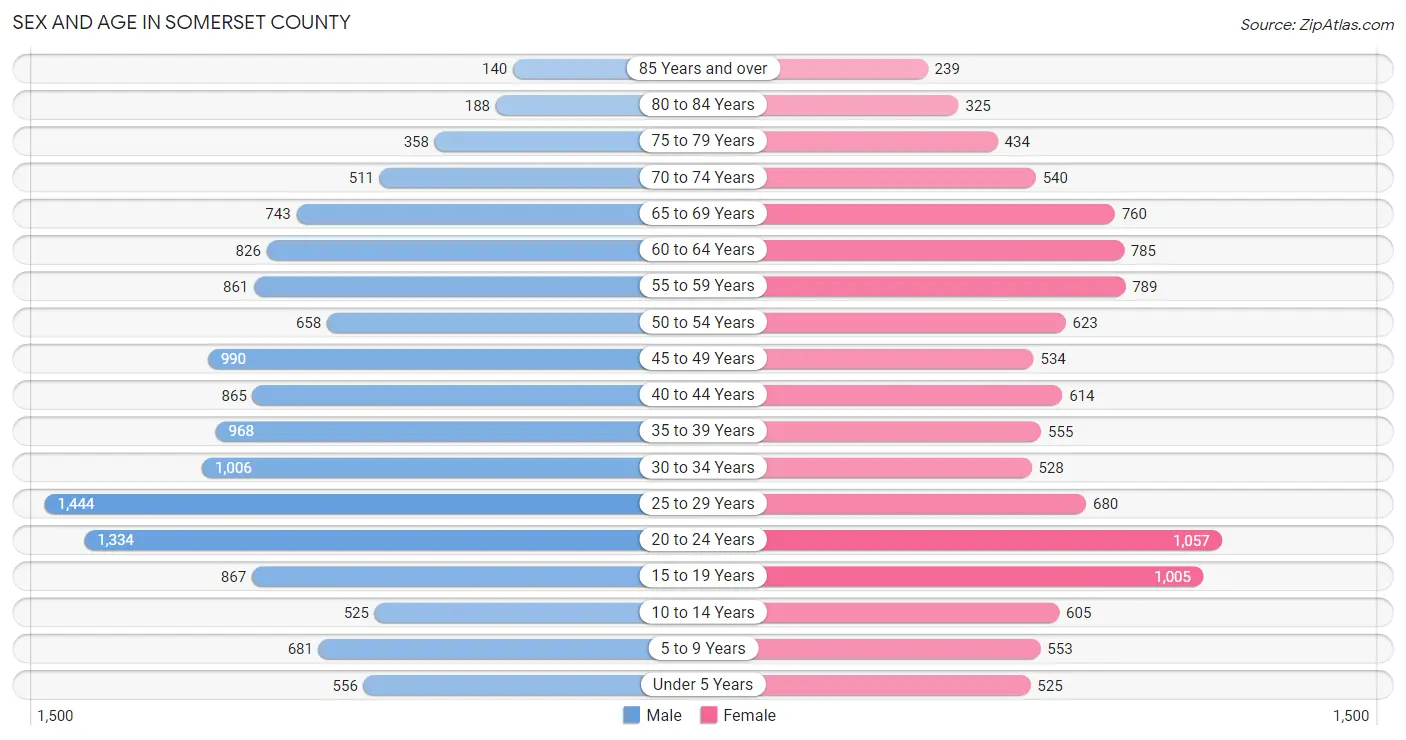
Sex and Age in Somerset County
The most populous age groups in Somerset County are 25 to 29 Years (1,444 | 10.7%) for men and 20 to 24 Years (1,057 | 9.5%) for women.
| Age Bracket | Male | Female |
| Under 5 Years | 556 (4.1%) | 525 (4.7%) |
| 5 to 9 Years | 681 (5.0%) | 553 (5.0%) |
| 10 to 14 Years | 525 (3.9%) | 605 (5.4%) |
| 15 to 19 Years | 867 (6.4%) | 1,005 (9.0%) |
| 20 to 24 Years | 1,334 (9.9%) | 1,057 (9.5%) |
| 25 to 29 Years | 1,444 (10.7%) | 680 (6.1%) |
| 30 to 34 Years | 1,006 (7.4%) | 528 (4.7%) |
| 35 to 39 Years | 968 (7.2%) | 555 (5.0%) |
| 40 to 44 Years | 865 (6.4%) | 614 (5.5%) |
| 45 to 49 Years | 990 (7.3%) | 534 (4.8%) |
| 50 to 54 Years | 658 (4.9%) | 623 (5.6%) |
| 55 to 59 Years | 861 (6.4%) | 789 (7.1%) |
| 60 to 64 Years | 826 (6.1%) | 785 (7.0%) |
| 65 to 69 Years | 743 (5.5%) | 760 (6.8%) |
| 70 to 74 Years | 511 (3.8%) | 540 (4.8%) |
| 75 to 79 Years | 358 (2.6%) | 434 (3.9%) |
| 80 to 84 Years | 188 (1.4%) | 325 (2.9%) |
| 85 Years and over | 140 (1.0%) | 239 (2.1%) |
| Total | 13,521 (100.0%) | 11,151 (100.0%) |
Families and Households in Somerset County
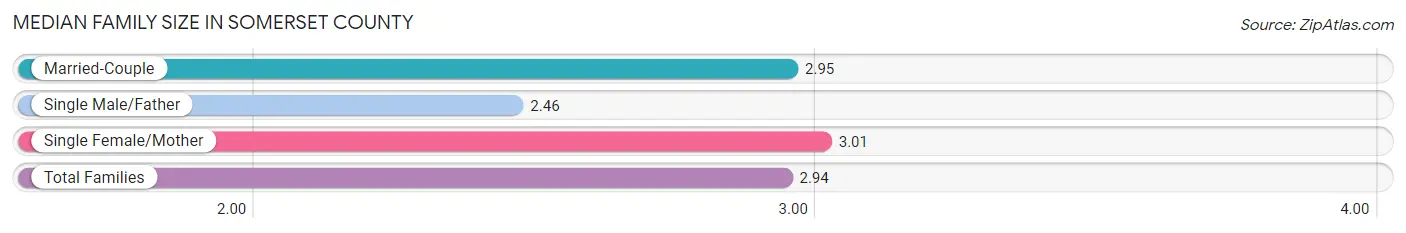
Median Family Size in Somerset County
The median family size in Somerset County is 2.94 persons per family, with single female/mother families (1,366 | 25.7%) accounting for the largest median family size of 3.01 persons per family. On the other hand, single male/father families (313 | 5.9%) represent the smallest median family size with 2.46 persons per family.
| Family Type | # Families | Family Size |
| Married-Couple | 3,637 (68.4%) | 2.95 |
| Single Male/Father | 313 (5.9%) | 2.46 |
| Single Female/Mother | 1,366 (25.7%) | 3.01 |
| Total Families | 5,316 (100.0%) | 2.94 |
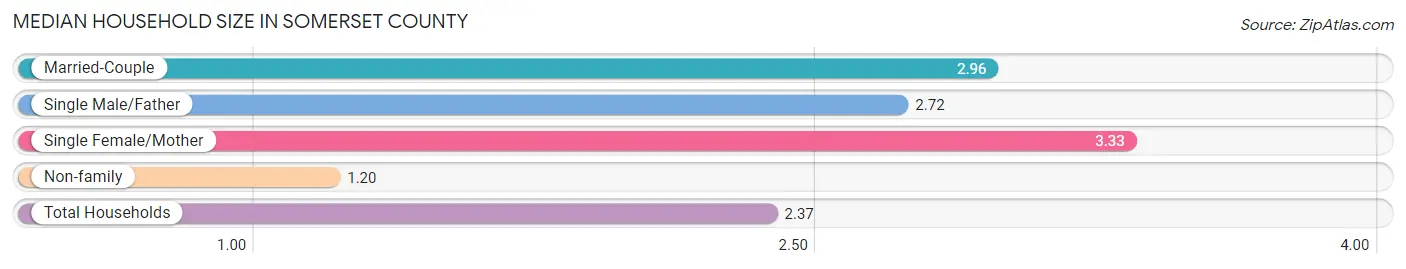
Median Household Size in Somerset County
The median household size in Somerset County is 2.37 persons per household, with single female/mother households (1,366 | 16.4%) accounting for the largest median household size of 3.33 persons per household. non-family households (3,039 | 36.4%) represent the smallest median household size with 1.20 persons per household.
| Household Type | # Households | Household Size |
| Married-Couple | 3,637 (43.5%) | 2.96 |
| Single Male/Father | 313 (3.7%) | 2.72 |
| Single Female/Mother | 1,366 (16.4%) | 3.33 |
| Non-family | 3,039 (36.4%) | 1.20 |
| Total Households | 8,355 (100.0%) | 2.37 |
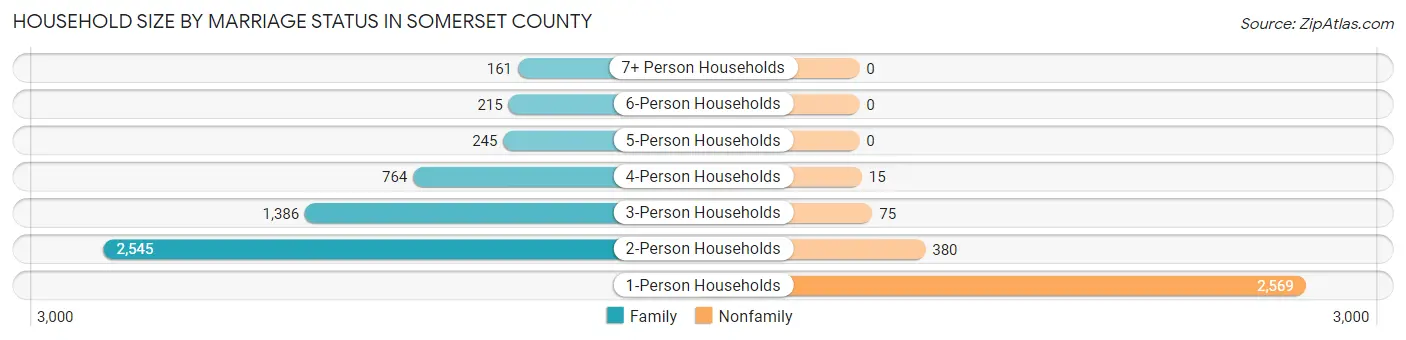
Household Size by Marriage Status in Somerset County
Out of a total of 8,355 households in Somerset County, 5,316 (63.6%) are family households, while 3,039 (36.4%) are nonfamily households. The most numerous type of family households are 2-person households, comprising 2,545, and the most common type of nonfamily households are 1-person households, comprising 2,569.
| Household Size | Family Households | Nonfamily Households |
| 1-Person Households | - | 2,569 (30.7%) |
| 2-Person Households | 2,545 (30.5%) | 380 (4.5%) |
| 3-Person Households | 1,386 (16.6%) | 75 (0.9%) |
| 4-Person Households | 764 (9.1%) | 15 (0.2%) |
| 5-Person Households | 245 (2.9%) | 0 (0.0%) |
| 6-Person Households | 215 (2.6%) | 0 (0.0%) |
| 7+ Person Households | 161 (1.9%) | 0 (0.0%) |
| Total | 5,316 (63.6%) | 3,039 (36.4%) |
Female Fertility in Somerset County
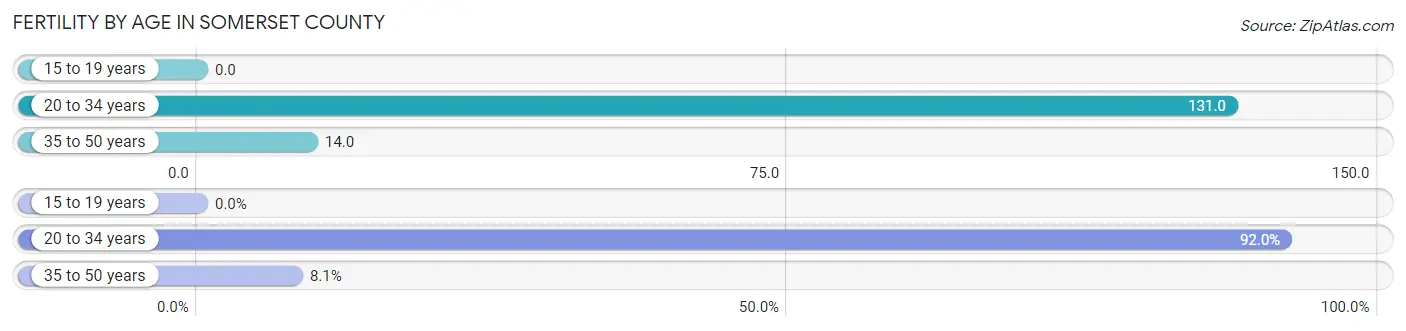
Fertility by Age in Somerset County
Average fertility rate in Somerset County is 63.0 births per 1,000 women. Women in the age bracket of 20 to 34 years have the highest fertility rate with 131.0 births per 1,000 women. Women in the age bracket of 20 to 34 years acount for 91.9% of all women with births.
| Age Bracket | Women with Births | Births / 1,000 Women |
| 15 to 19 years | 0 (0.0%) | 0.0 |
| 20 to 34 years | 297 (91.9%) | 131.0 |
| 35 to 50 years | 26 (8.1%) | 14.0 |
| Total | 323 (100.0%) | 63.0 |
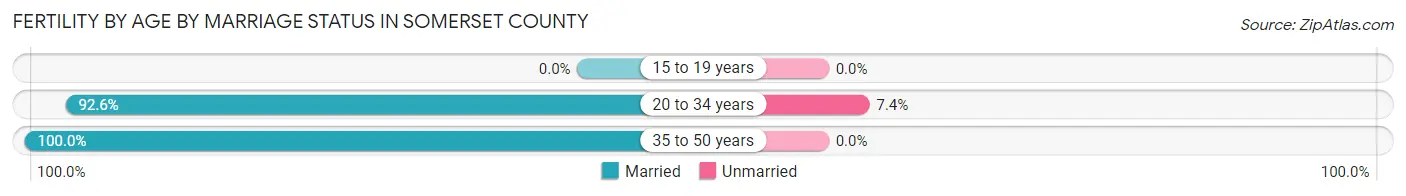
Fertility by Age by Marriage Status in Somerset County
93.2% of women with births (323) in Somerset County are married. The highest percentage of unmarried women with births falls into 20 to 34 years age bracket with 7.4% of them unmarried at the time of birth, while the lowest percentage of unmarried women with births belong to 35 to 50 years age bracket with 0.0% of them unmarried.
| Age Bracket | Married | Unmarried |
| 15 to 19 years | 0 (0.0%) | 0 (0.0%) |
| 20 to 34 years | 275 (92.6%) | 22 (7.4%) |
| 35 to 50 years | 26 (100.0%) | 0 (0.0%) |
| Total | 301 (93.2%) | 22 (6.8%) |
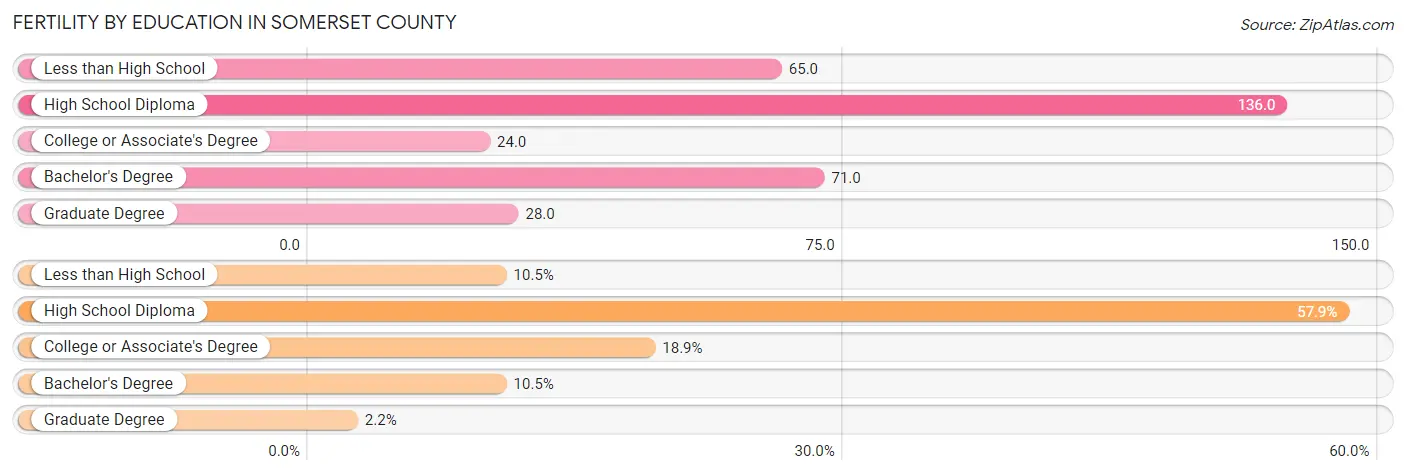
Fertility by Education in Somerset County
Average fertility rate in Somerset County is 63.0 births per 1,000 women. Women with the education attainment of high school diploma have the highest fertility rate of 136.0 births per 1,000 women, while women with the education attainment of college or associate's degree have the lowest fertility at 24.0 births per 1,000 women. Women with the education attainment of high school diploma represent 57.9% of all women with births.
| Educational Attainment | Women with Births | Births / 1,000 Women |
| Less than High School | 34 (10.5%) | 65.0 |
| High School Diploma | 187 (57.9%) | 136.0 |
| College or Associate's Degree | 61 (18.9%) | 24.0 |
| Bachelor's Degree | 34 (10.5%) | 71.0 |
| Graduate Degree | 7 (2.2%) | 28.0 |
| Total | 323 (100.0%) | 63.0 |
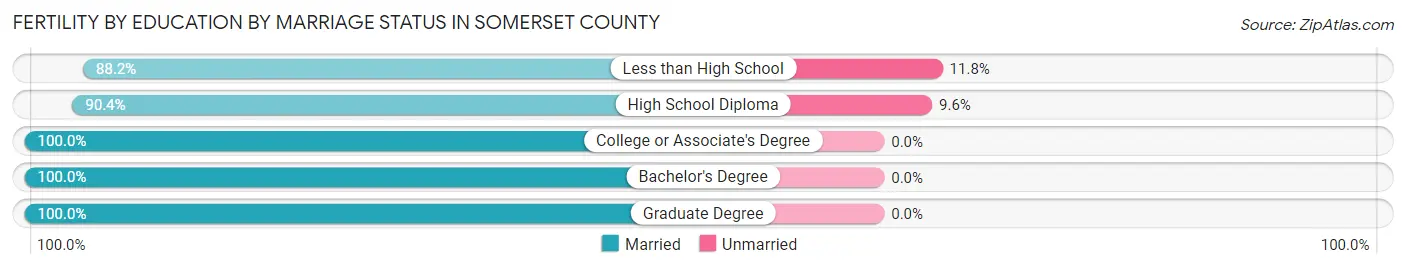
Fertility by Education by Marriage Status in Somerset County
6.8% of women with births in Somerset County are unmarried. Women with the educational attainment of college or associate's degree are most likely to be married with 100.0% of them married at childbirth, while women with the educational attainment of less than high school are least likely to be married with 11.8% of them unmarried at childbirth.
| Educational Attainment | Married | Unmarried |
| Less than High School | 30 (88.2%) | 4 (11.8%) |
| High School Diploma | 169 (90.4%) | 18 (9.6%) |
| College or Associate's Degree | 61 (100.0%) | 0 (0.0%) |
| Bachelor's Degree | 34 (100.0%) | 0 (0.0%) |
| Graduate Degree | 7 (100.0%) | 0 (0.0%) |
| Total | 301 (93.2%) | 22 (6.8%) |
Income in Somerset County
Income Overview in Somerset County
Per Capita Income in Somerset County is $24,176, while median incomes of families and households are $66,215 and $52,149 respectively.
| Characteristic | Number | Measure |
| Per Capita Income | 24,672 | $24,176 |
| Median Family Income | 5,316 | $66,215 |
| Mean Family Income | 5,316 | $80,666 |
| Median Household Income | 8,355 | $52,149 |
| Mean Household Income | 8,355 | $66,829 |
| Income Deficit | 5,316 | $10,341 |
| Wage / Income Gap (%) | 24,672 | 5.93% |
| Wage / Income Gap ($) | 24,672 | 94.07¢ per $1 |
| Gini / Inequality Index | 24,672 | 0.46 |
Earnings by Sex in Somerset County
Average Earnings in Somerset County are $27,406, $26,410 for men and $28,075 for women, a difference of 5.9%.
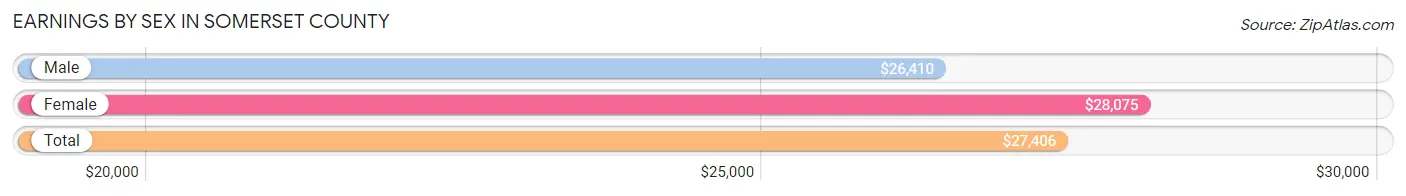
| Sex | Number | Average Earnings |
| Male | 6,310 (53.3%) | $26,410 |
| Female | 5,527 (46.7%) | $28,075 |
| Total | 11,837 (100.0%) | $27,406 |
Earnings by Sex by Income Bracket in Somerset County
The most common earnings brackets in Somerset County are $2,499 or less for men (968 | 15.3%) and $25,000 to $29,999 for women (440 | 8.0%).
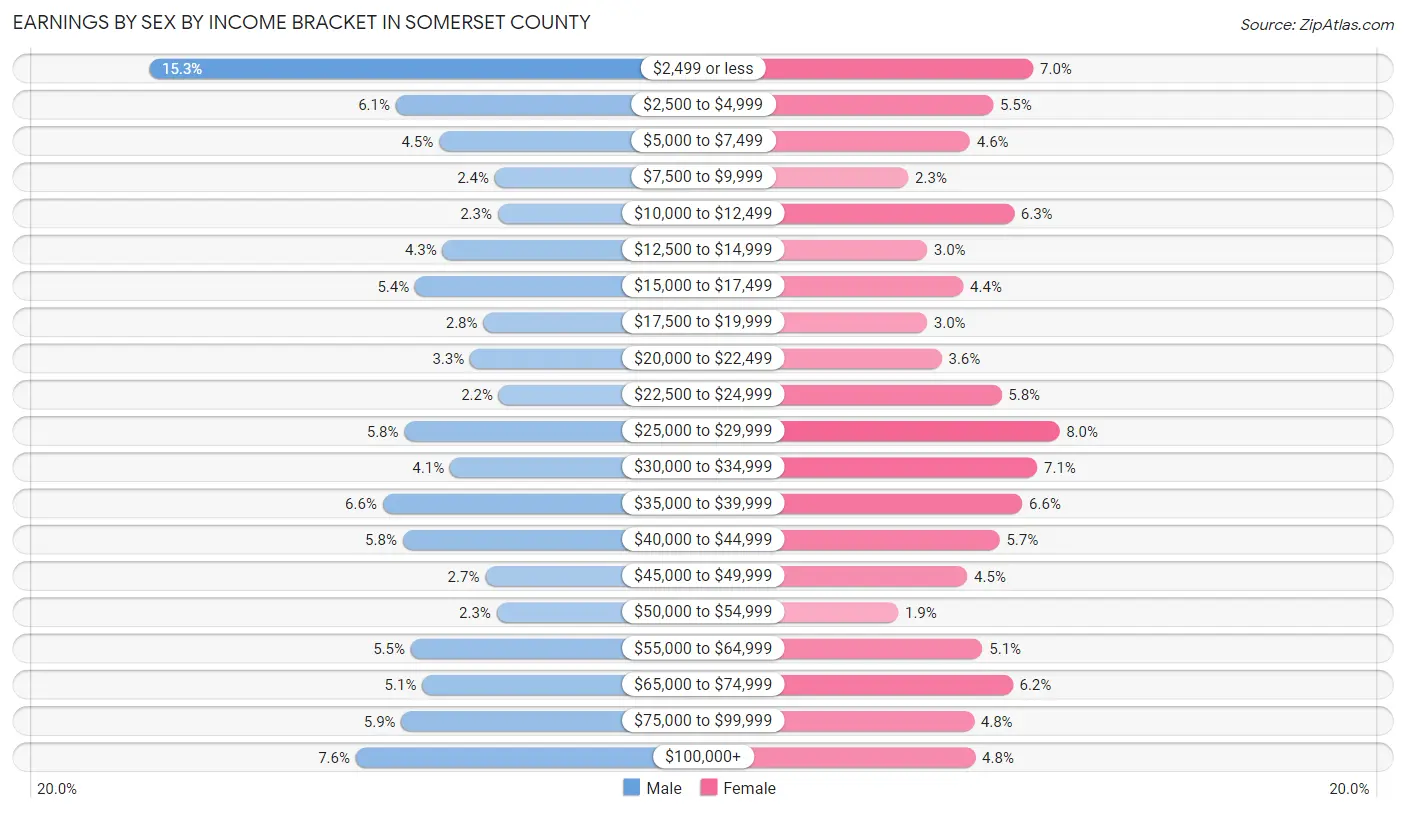
| Income | Male | Female |
| $2,499 or less | 968 (15.3%) | 386 (7.0%) |
| $2,500 to $4,999 | 384 (6.1%) | 303 (5.5%) |
| $5,000 to $7,499 | 282 (4.5%) | 255 (4.6%) |
| $7,500 to $9,999 | 150 (2.4%) | 127 (2.3%) |
| $10,000 to $12,499 | 143 (2.3%) | 346 (6.3%) |
| $12,500 to $14,999 | 274 (4.3%) | 166 (3.0%) |
| $15,000 to $17,499 | 339 (5.4%) | 241 (4.4%) |
| $17,500 to $19,999 | 177 (2.8%) | 166 (3.0%) |
| $20,000 to $22,499 | 209 (3.3%) | 196 (3.5%) |
| $22,500 to $24,999 | 141 (2.2%) | 320 (5.8%) |
| $25,000 to $29,999 | 364 (5.8%) | 440 (8.0%) |
| $30,000 to $34,999 | 256 (4.1%) | 394 (7.1%) |
| $35,000 to $39,999 | 415 (6.6%) | 363 (6.6%) |
| $40,000 to $44,999 | 368 (5.8%) | 316 (5.7%) |
| $45,000 to $49,999 | 173 (2.7%) | 249 (4.5%) |
| $50,000 to $54,999 | 146 (2.3%) | 106 (1.9%) |
| $55,000 to $64,999 | 349 (5.5%) | 281 (5.1%) |
| $65,000 to $74,999 | 322 (5.1%) | 343 (6.2%) |
| $75,000 to $99,999 | 371 (5.9%) | 263 (4.8%) |
| $100,000+ | 479 (7.6%) | 266 (4.8%) |
| Total | 6,310 (100.0%) | 5,527 (100.0%) |
Earnings by Sex by Educational Attainment in Somerset County
Average earnings in Somerset County are $35,825 for men and $34,559 for women, a difference of 3.5%. Men with an educational attainment of graduate degree enjoy the highest average annual earnings of $53,702, while those with less than high school education earn the least with $15,253. Women with an educational attainment of graduate degree earn the most with the average annual earnings of $64,375, while those with less than high school education have the smallest earnings of $18,500.
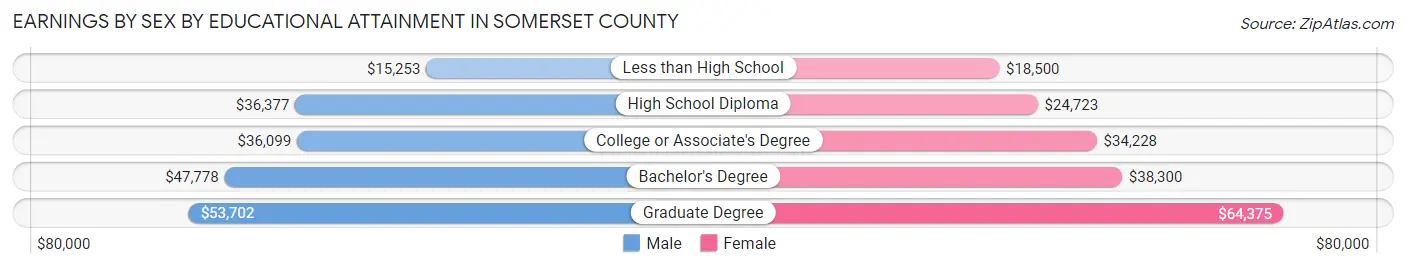
| Educational Attainment | Male Income | Female Income |
| Less than High School | $15,253 | $18,500 |
| High School Diploma | $36,377 | $24,723 |
| College or Associate's Degree | $36,099 | $34,228 |
| Bachelor's Degree | $47,778 | $38,300 |
| Graduate Degree | $53,702 | $64,375 |
| Total | $35,825 | $34,559 |
Family Income in Somerset County
Family Income Brackets in Somerset County
According to the Somerset County family income data, there are 909 families falling into the $50,000 to $74,999 income range, which is the most common income bracket and makes up 17.1% of all families. Conversely, the $10,000 to $14,999 income bracket is the least frequent group with only 122 families (2.3%) belonging to this category.
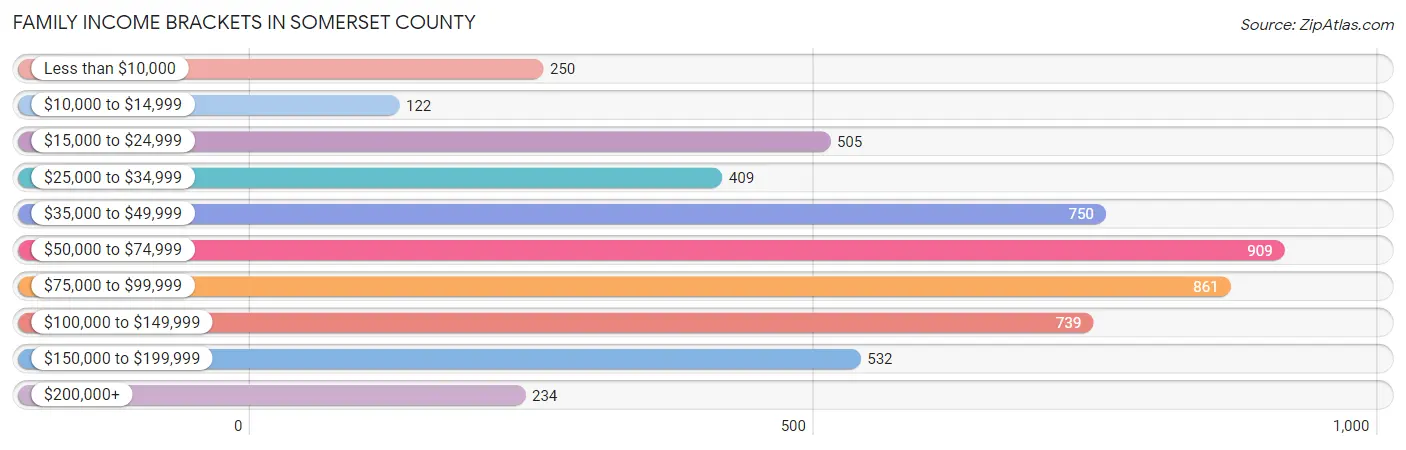
| Income Bracket | # Families | % Families |
| Less than $10,000 | 250 | 4.7% |
| $10,000 to $14,999 | 122 | 2.3% |
| $15,000 to $24,999 | 505 | 9.5% |
| $25,000 to $34,999 | 409 | 7.7% |
| $35,000 to $49,999 | 750 | 14.1% |
| $50,000 to $74,999 | 909 | 17.1% |
| $75,000 to $99,999 | 861 | 16.2% |
| $100,000 to $149,999 | 739 | 13.9% |
| $150,000 to $199,999 | 532 | 10.0% |
| $200,000+ | 234 | 4.4% |
Family Income by Famaliy Size in Somerset County
6-person families (92 | 1.7%) account for the highest median family income in Somerset County with $94,444 per family, while 2-person families (2,751 | 51.7%) have the highest median income of $30,720 per family member.
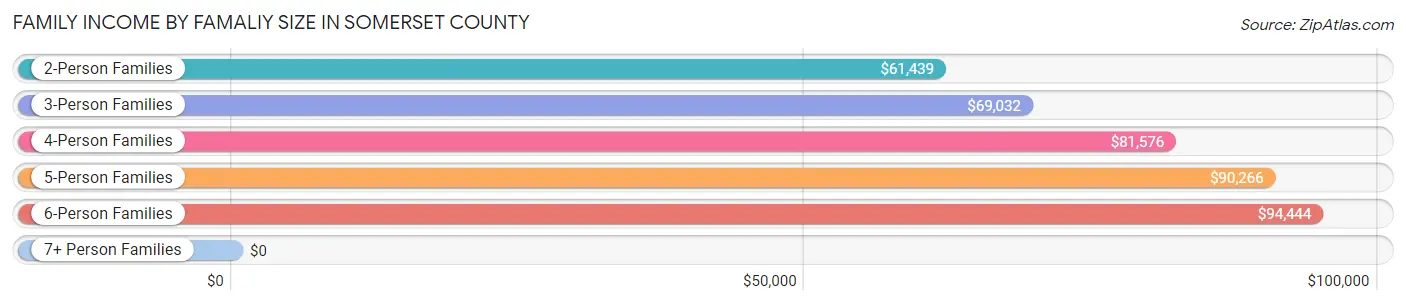
| Income Bracket | # Families | Median Income |
| 2-Person Families | 2,751 (51.7%) | $61,439 |
| 3-Person Families | 1,230 (23.1%) | $69,032 |
| 4-Person Families | 827 (15.6%) | $81,576 |
| 5-Person Families | 269 (5.1%) | $90,266 |
| 6-Person Families | 92 (1.7%) | $94,444 |
| 7+ Person Families | 147 (2.8%) | $0 |
| Total | 5,316 (100.0%) | $66,215 |
Family Income by Number of Earners in Somerset County
The median family income in Somerset County is $66,215, with families comprising 3+ earners (392) having the highest median family income of $153,088, while families with no earners (795) have the lowest median family income of $42,338, accounting for 7.4% and 14.9% of families, respectively.
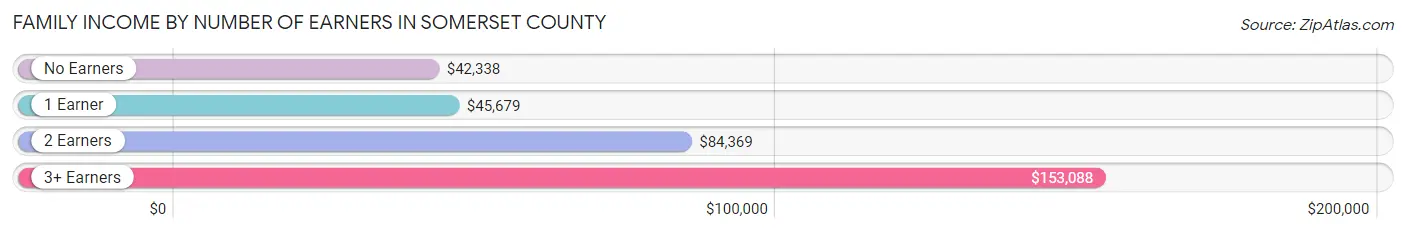
| Number of Earners | # Families | Median Income |
| No Earners | 795 (14.9%) | $42,338 |
| 1 Earner | 1,817 (34.2%) | $45,679 |
| 2 Earners | 2,312 (43.5%) | $84,369 |
| 3+ Earners | 392 (7.4%) | $153,088 |
| Total | 5,316 (100.0%) | $66,215 |
Household Income in Somerset County
Household Income Brackets in Somerset County
With 1,487 households falling in the category, the $50,000 to $74,999 income range is the most frequent in Somerset County, accounting for 17.8% of all households. In contrast, only 267 households (3.2%) fall into the $200,000+ income bracket, making it the least populous group.
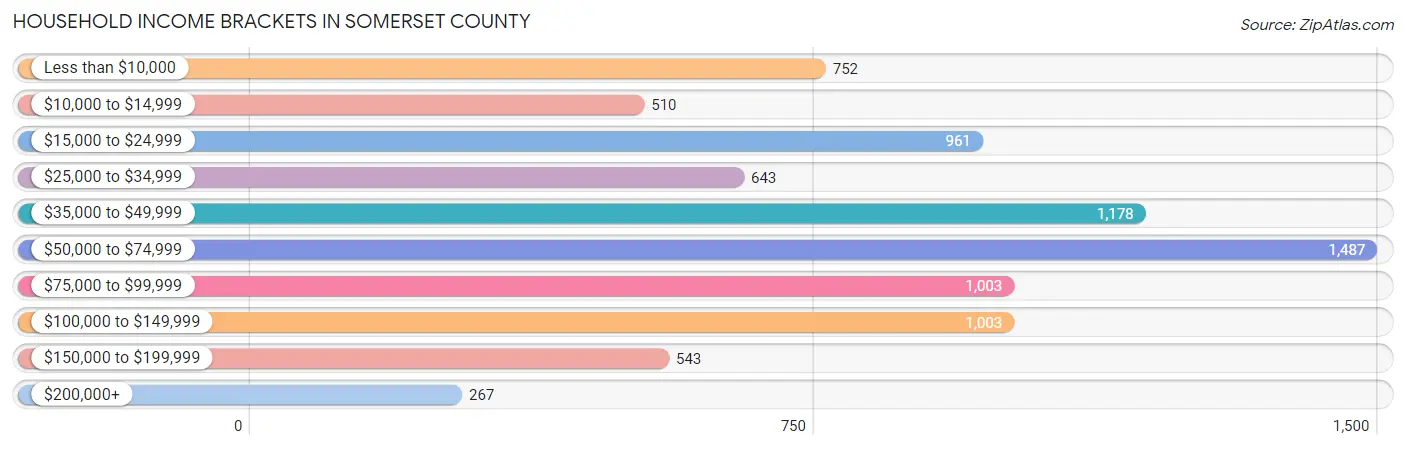
| Income Bracket | # Households | % Households |
| Less than $10,000 | 752 | 9.0% |
| $10,000 to $14,999 | 510 | 6.1% |
| $15,000 to $24,999 | 961 | 11.5% |
| $25,000 to $34,999 | 643 | 7.7% |
| $35,000 to $49,999 | 1,178 | 14.1% |
| $50,000 to $74,999 | 1,487 | 17.8% |
| $75,000 to $99,999 | 1,003 | 12.0% |
| $100,000 to $149,999 | 1,003 | 12.0% |
| $150,000 to $199,999 | 543 | 6.5% |
| $200,000+ | 267 | 3.2% |
Household Income by Householder Age in Somerset County
The median household income in Somerset County is $52,149, with the highest median household income of $67,896 found in the 45 to 64 years age bracket for the primary householder. A total of 2,825 households (33.8%) fall into this category. Meanwhile, the 15 to 24 years age bracket for the primary householder has the lowest median household income of $0, with 644 households (7.7%) in this group.
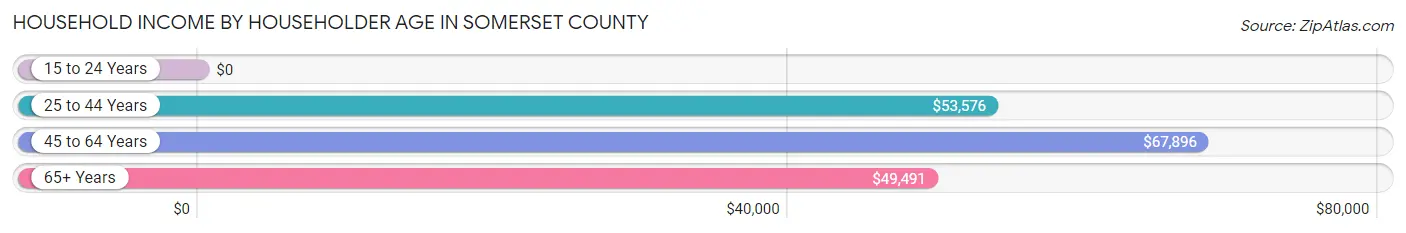
| Income Bracket | # Households | Median Income |
| 15 to 24 Years | 644 (7.7%) | $0 |
| 25 to 44 Years | 2,147 (25.7%) | $53,576 |
| 45 to 64 Years | 2,825 (33.8%) | $67,896 |
| 65+ Years | 2,739 (32.8%) | $49,491 |
| Total | 8,355 (100.0%) | $52,149 |
Poverty in Somerset County
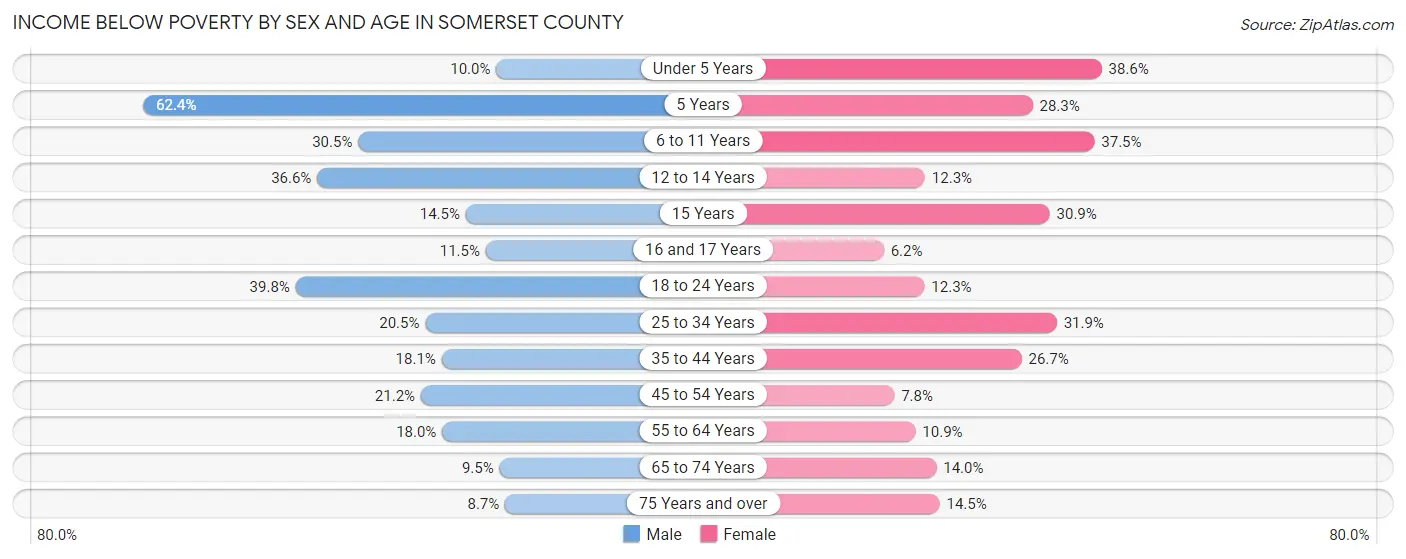
Income Below Poverty by Sex and Age in Somerset County
With 20.4% poverty level for males and 19.3% for females among the residents of Somerset County, 5 year old males and under 5 year old females are the most vulnerable to poverty, with 78 males (62.4%) and 196 females (38.6%) in their respective age groups living below the poverty level.
| Age Bracket | Male | Female |
| Under 5 Years | 54 (10.0%) | 196 (38.6%) |
| 5 Years | 78 (62.4%) | 32 (28.3%) |
| 6 to 11 Years | 247 (30.5%) | 294 (37.5%) |
| 12 to 14 Years | 87 (36.5%) | 29 (12.3%) |
| 15 Years | 10 (14.5%) | 25 (30.9%) |
| 16 and 17 Years | 31 (11.5%) | 14 (6.2%) |
| 18 to 24 Years | 324 (39.8%) | 127 (12.3%) |
| 25 to 34 Years | 254 (20.5%) | 380 (31.9%) |
| 35 to 44 Years | 195 (18.1%) | 312 (26.7%) |
| 45 to 54 Years | 250 (21.1%) | 90 (7.8%) |
| 55 to 64 Years | 249 (18.0%) | 172 (10.9%) |
| 65 to 74 Years | 109 (9.5%) | 178 (14.0%) |
| 75 Years and over | 54 (8.6%) | 131 (14.5%) |
| Total | 1,942 (20.4%) | 1,980 (19.3%) |
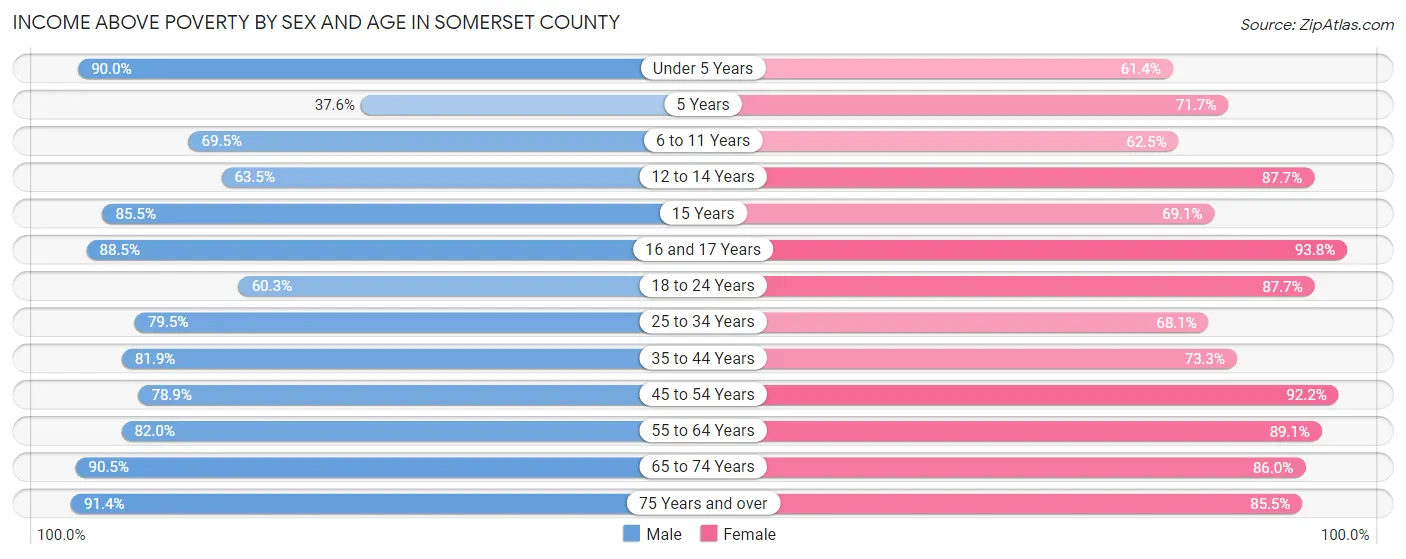
Income Above Poverty by Sex and Age in Somerset County
According to the poverty statistics in Somerset County, males aged 75 years and over and females aged 16 and 17 years are the age groups that are most secure financially, with 91.3% of males and 93.8% of females in these age groups living above the poverty line.
| Age Bracket | Male | Female |
| Under 5 Years | 488 (90.0%) | 312 (61.4%) |
| 5 Years | 47 (37.6%) | 81 (71.7%) |
| 6 to 11 Years | 564 (69.5%) | 490 (62.5%) |
| 12 to 14 Years | 151 (63.4%) | 206 (87.7%) |
| 15 Years | 59 (85.5%) | 56 (69.1%) |
| 16 and 17 Years | 238 (88.5%) | 211 (93.8%) |
| 18 to 24 Years | 491 (60.3%) | 908 (87.7%) |
| 25 to 34 Years | 985 (79.5%) | 811 (68.1%) |
| 35 to 44 Years | 884 (81.9%) | 857 (73.3%) |
| 45 to 54 Years | 932 (78.8%) | 1,067 (92.2%) |
| 55 to 64 Years | 1,135 (82.0%) | 1,402 (89.1%) |
| 65 to 74 Years | 1,042 (90.5%) | 1,091 (86.0%) |
| 75 Years and over | 570 (91.3%) | 771 (85.5%) |
| Total | 7,586 (79.6%) | 8,263 (80.7%) |
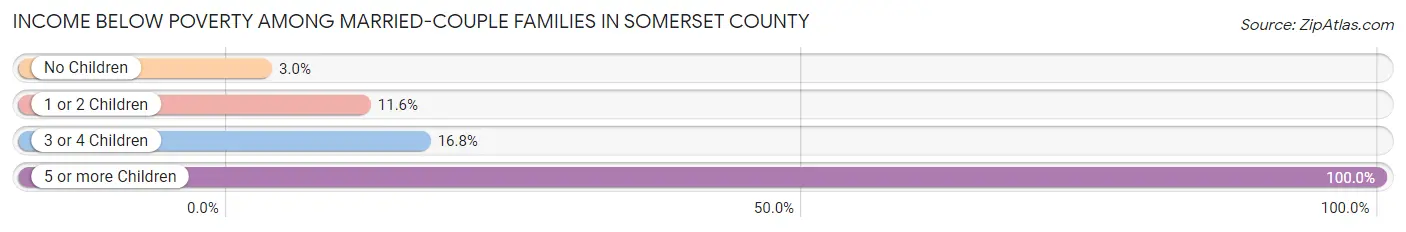
Income Below Poverty Among Married-Couple Families in Somerset County
The poverty statistics for married-couple families in Somerset County show that 9.2% or 333 of the total 3,637 families live below the poverty line. Families with 5 or more children have the highest poverty rate of 100.0%, comprising of 94 families. On the other hand, families with no children have the lowest poverty rate of 3.0%, which includes 62 families.
| Children | Above Poverty | Below Poverty |
| No Children | 2,025 (97.0%) | 62 (3.0%) |
| 1 or 2 Children | 1,140 (88.4%) | 149 (11.6%) |
| 3 or 4 Children | 139 (83.2%) | 28 (16.8%) |
| 5 or more Children | 0 (0.0%) | 94 (100.0%) |
| Total | 3,304 (90.8%) | 333 (9.2%) |
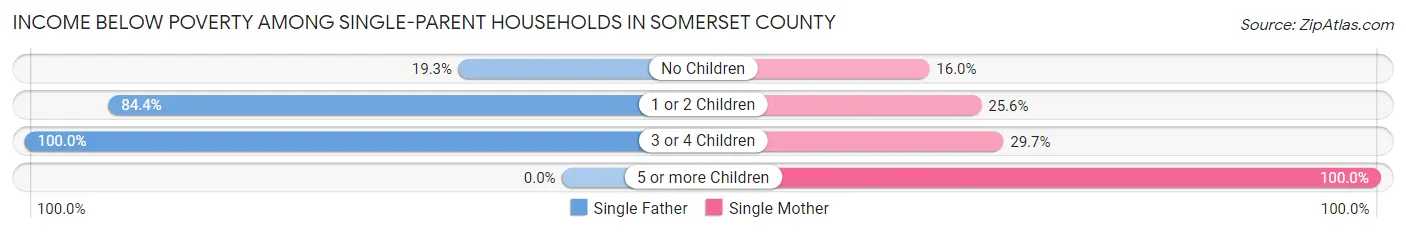
Income Below Poverty Among Single-Parent Households in Somerset County
According to the poverty data in Somerset County, 61.0% or 191 single-father households and 22.3% or 305 single-mother households are living below the poverty line. Among single-father households, those with 3 or 4 children have the highest poverty rate, with 7 households (100.0%) experiencing poverty. Likewise, among single-mother households, those with 5 or more children have the highest poverty rate, with 4 households (100.0%) falling below the poverty line.
| Children | Single Father | Single Mother |
| No Children | 22 (19.3%) | 87 (16.0%) |
| 1 or 2 Children | 162 (84.4%) | 181 (25.6%) |
| 3 or 4 Children | 7 (100.0%) | 33 (29.7%) |
| 5 or more Children | 0 (0.0%) | 4 (100.0%) |
| Total | 191 (61.0%) | 305 (22.3%) |
Income Below Poverty Among Married-Couple vs Single-Parent Households in Somerset County
The poverty data for Somerset County shows that 333 of the married-couple family households (9.2%) and 496 of the single-parent households (29.5%) are living below the poverty level. Within the married-couple family households, those with 5 or more children have the highest poverty rate, with 94 households (100.0%) falling below the poverty line. Among the single-parent households, those with 5 or more children have the highest poverty rate, with 4 household (100.0%) living below poverty.
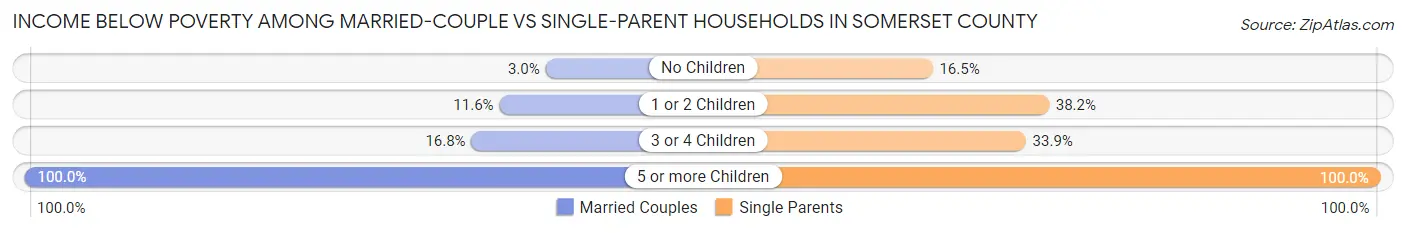
| Children | Married-Couple Families | Single-Parent Households |
| No Children | 62 (3.0%) | 109 (16.5%) |
| 1 or 2 Children | 149 (11.6%) | 343 (38.2%) |
| 3 or 4 Children | 28 (16.8%) | 40 (33.9%) |
| 5 or more Children | 94 (100.0%) | 4 (100.0%) |
| Total | 333 (9.2%) | 496 (29.5%) |
Employment Characteristics in Somerset County
Employment by Class of Employer in Somerset County
Among the 9,396 employed individuals in Somerset County, private company employees (5,180 | 55.1%), state government employees (1,073 | 11.4%), and local government employees (1,031 | 11.0%) make up the most common classes of employment.
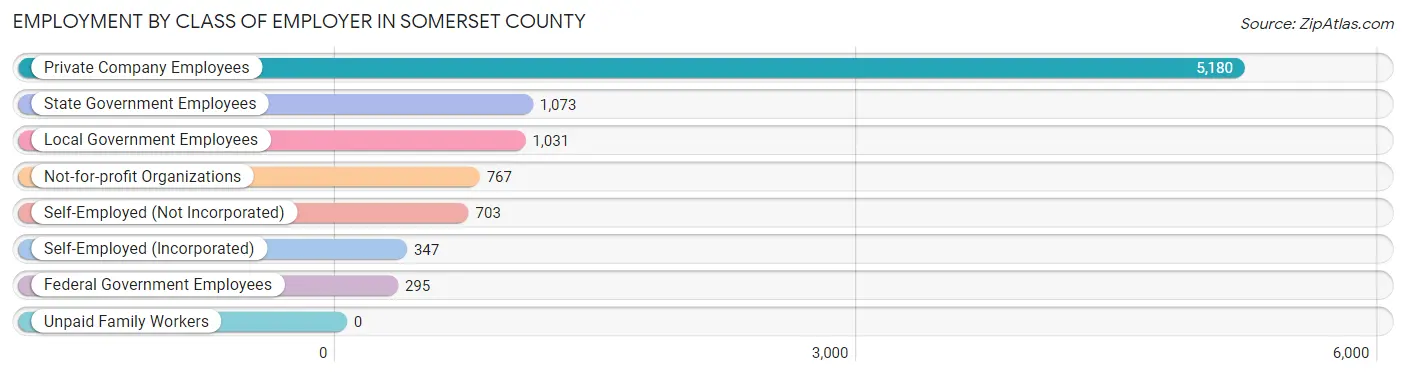
| Employer Class | # Employees | % Employees |
| Private Company Employees | 5,180 | 55.1% |
| Self-Employed (Incorporated) | 347 | 3.7% |
| Self-Employed (Not Incorporated) | 703 | 7.5% |
| Not-for-profit Organizations | 767 | 8.2% |
| Local Government Employees | 1,031 | 11.0% |
| State Government Employees | 1,073 | 11.4% |
| Federal Government Employees | 295 | 3.1% |
| Unpaid Family Workers | 0 | 0.0% |
| Total | 9,396 | 100.0% |
Employment Status by Age in Somerset County
According to the labor force statistics for Somerset County, out of the total population over 16 years of age (21,073), 49.3% or 10,389 individuals are in the labor force, with 7.0% or 727 of them unemployed. The age group with the highest labor force participation rate is 55 to 59 years, with 66.0% or 1,089 individuals in the labor force. Within the labor force, the 16 to 19 years age range has the highest percentage of unemployed individuals, with 22.8% or 117 of them being unemployed.
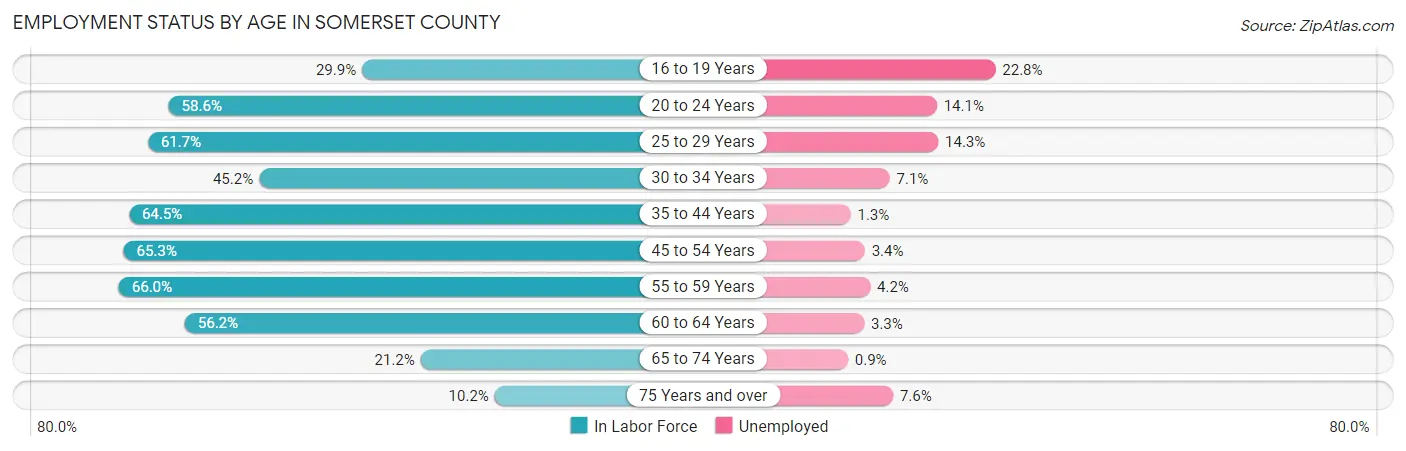
| Age Bracket | In Labor Force | Unemployed |
| 16 to 19 Years | 514 (29.9%) | 117 (22.8%) |
| 20 to 24 Years | 1,401 (58.6%) | 198 (14.1%) |
| 25 to 29 Years | 1,311 (61.7%) | 187 (14.3%) |
| 30 to 34 Years | 693 (45.2%) | 49 (7.1%) |
| 35 to 44 Years | 1,936 (64.5%) | 25 (1.3%) |
| 45 to 54 Years | 1,832 (65.3%) | 62 (3.4%) |
| 55 to 59 Years | 1,089 (66.0%) | 46 (4.2%) |
| 60 to 64 Years | 905 (56.2%) | 30 (3.3%) |
| 65 to 74 Years | 541 (21.2%) | 5 (0.9%) |
| 75 Years and over | 172 (10.2%) | 13 (7.6%) |
| Total | 10,389 (49.3%) | 727 (7.0%) |
Employment Status by Educational Attainment in Somerset County
According to labor force statistics for Somerset County, 61.0% of individuals (7,763) out of the total population between 25 and 64 years of age (12,726) are in the labor force, with 5.2% or 404 of them being unemployed. The group with the highest labor force participation rate are those with the educational attainment of bachelor's degree or higher, with 84.4% or 1,850 individuals in the labor force. Within the labor force, individuals with high school diploma education have the highest percentage of unemployment, with 9.1% or 241 of them being unemployed.
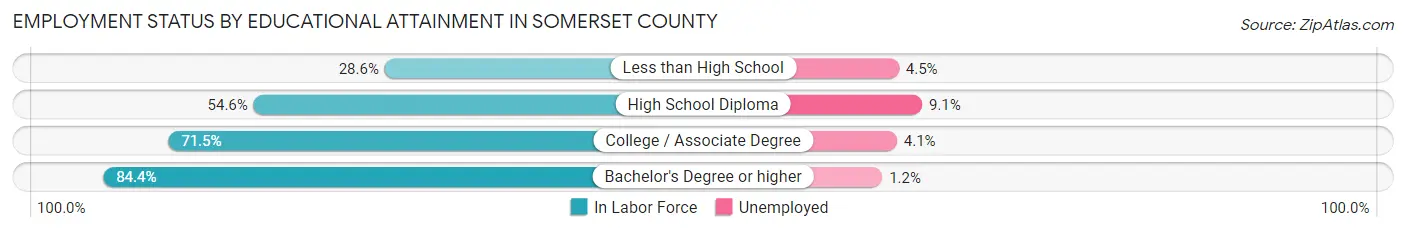
| Educational Attainment | In Labor Force | Unemployed |
| Less than High School | 529 (28.6%) | 83 (4.5%) |
| High School Diploma | 2,652 (54.6%) | 442 (9.1%) |
| College / Associate Degree | 2,737 (71.5%) | 157 (4.1%) |
| Bachelor's Degree or higher | 1,850 (84.4%) | 26 (1.2%) |
| Total | 7,763 (61.0%) | 662 (5.2%) |
Employment Occupations by Sex in Somerset County
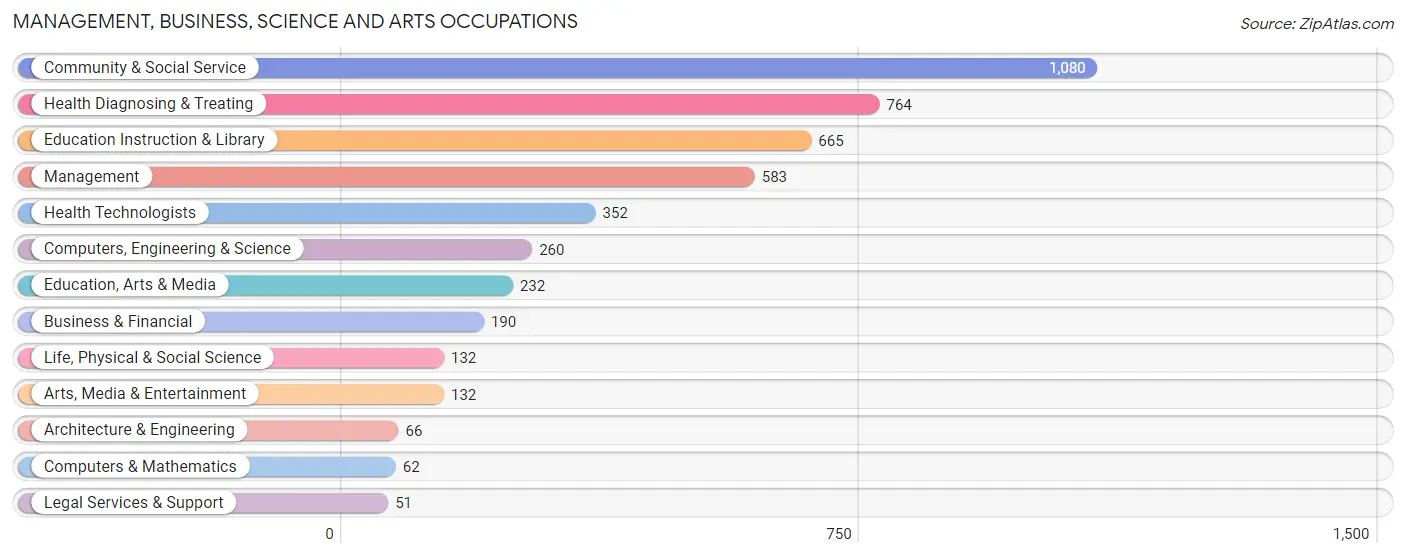
Management, Business, Science and Arts Occupations
The most common Management, Business, Science and Arts occupations in Somerset County are Community & Social Service (1,080 | 11.2%), Health Diagnosing & Treating (764 | 7.9%), Education Instruction & Library (665 | 6.9%), Management (583 | 6.0%), and Health Technologists (352 | 3.6%).
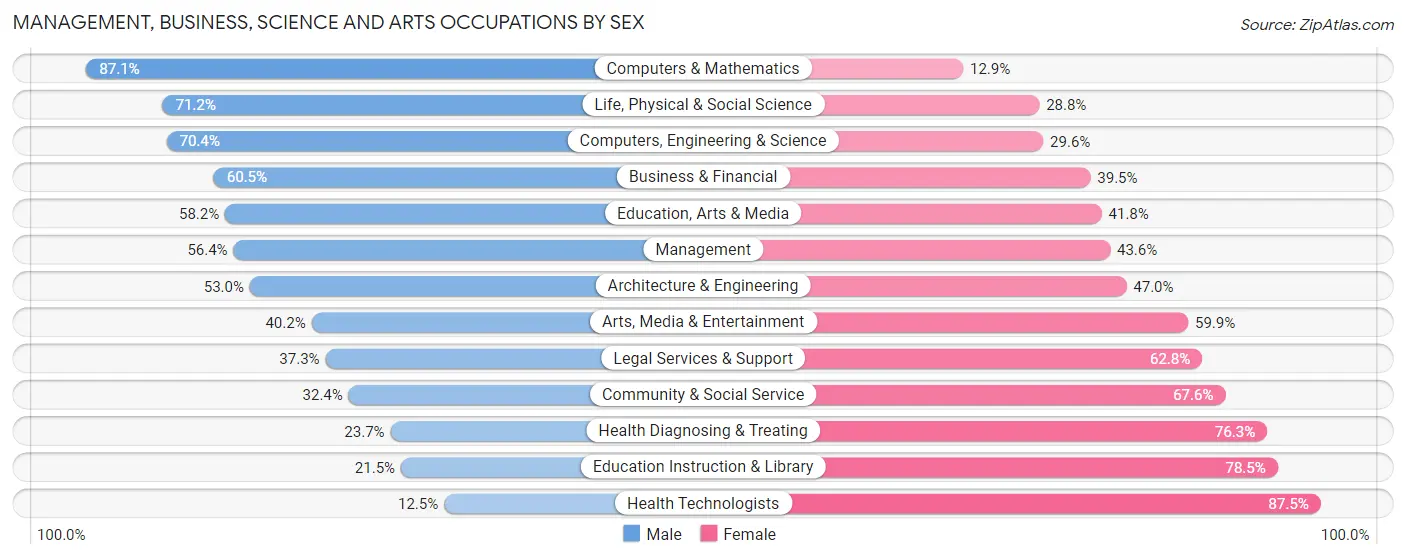
Management, Business, Science and Arts Occupations by Sex
Within the Management, Business, Science and Arts occupations in Somerset County, the most male-oriented occupations are Computers & Mathematics (87.1%), Life, Physical & Social Science (71.2%), and Computers, Engineering & Science (70.4%), while the most female-oriented occupations are Health Technologists (87.5%), Education Instruction & Library (78.5%), and Health Diagnosing & Treating (76.3%).
| Occupation | Male | Female |
| Management | 329 (56.4%) | 254 (43.6%) |
| Business & Financial | 115 (60.5%) | 75 (39.5%) |
| Computers, Engineering & Science | 183 (70.4%) | 77 (29.6%) |
| Computers & Mathematics | 54 (87.1%) | 8 (12.9%) |
| Architecture & Engineering | 35 (53.0%) | 31 (47.0%) |
| Life, Physical & Social Science | 94 (71.2%) | 38 (28.8%) |
| Community & Social Service | 350 (32.4%) | 730 (67.6%) |
| Education, Arts & Media | 135 (58.2%) | 97 (41.8%) |
| Legal Services & Support | 19 (37.2%) | 32 (62.7%) |
| Education Instruction & Library | 143 (21.5%) | 522 (78.5%) |
| Arts, Media & Entertainment | 53 (40.2%) | 79 (59.9%) |
| Health Diagnosing & Treating | 181 (23.7%) | 583 (76.3%) |
| Health Technologists | 44 (12.5%) | 308 (87.5%) |
| Total (Category) | 1,158 (40.3%) | 1,719 (59.8%) |
| Total (Overall) | 4,781 (49.5%) | 4,880 (50.5%) |
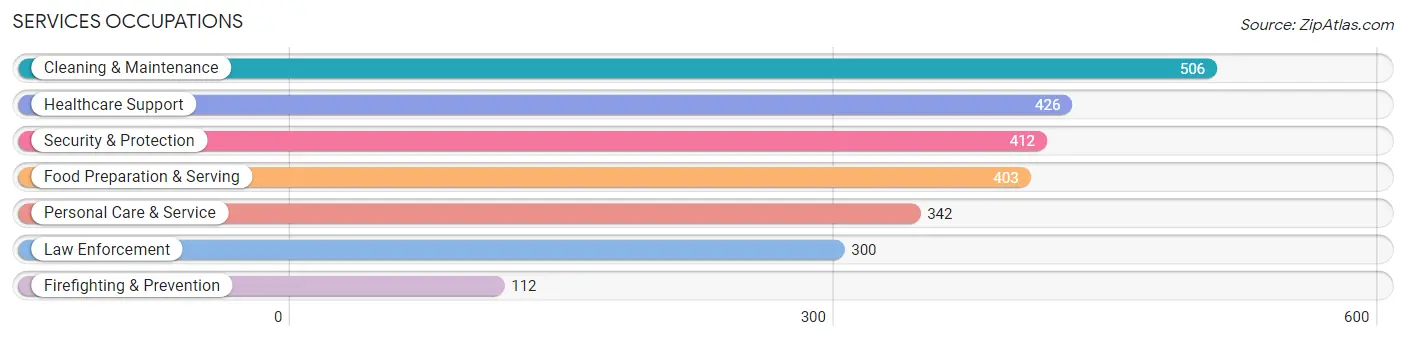
Services Occupations
The most common Services occupations in Somerset County are Cleaning & Maintenance (506 | 5.2%), Healthcare Support (426 | 4.4%), Security & Protection (412 | 4.3%), Food Preparation & Serving (403 | 4.2%), and Personal Care & Service (342 | 3.5%).
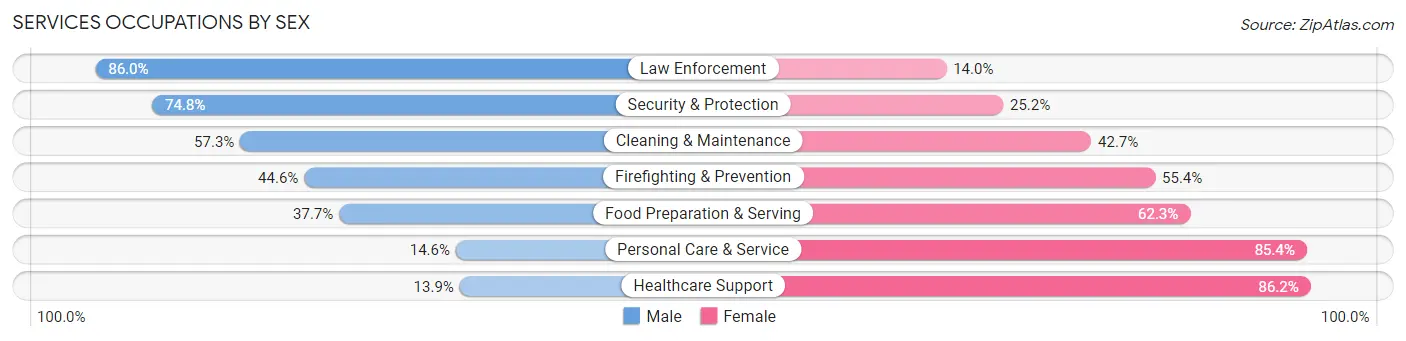
Services Occupations by Sex
Within the Services occupations in Somerset County, the most male-oriented occupations are Law Enforcement (86.0%), Security & Protection (74.8%), and Cleaning & Maintenance (57.3%), while the most female-oriented occupations are Healthcare Support (86.2%), Personal Care & Service (85.4%), and Food Preparation & Serving (62.3%).
| Occupation | Male | Female |
| Healthcare Support | 59 (13.9%) | 367 (86.2%) |
| Security & Protection | 308 (74.8%) | 104 (25.2%) |
| Firefighting & Prevention | 50 (44.6%) | 62 (55.4%) |
| Law Enforcement | 258 (86.0%) | 42 (14.0%) |
| Food Preparation & Serving | 152 (37.7%) | 251 (62.3%) |
| Cleaning & Maintenance | 290 (57.3%) | 216 (42.7%) |
| Personal Care & Service | 50 (14.6%) | 292 (85.4%) |
| Total (Category) | 859 (41.1%) | 1,230 (58.9%) |
| Total (Overall) | 4,781 (49.5%) | 4,880 (50.5%) |
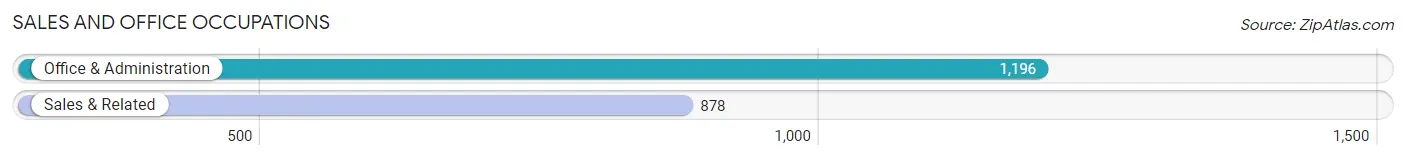
Sales and Office Occupations
The most common Sales and Office occupations in Somerset County are Office & Administration (1,196 | 12.4%), and Sales & Related (878 | 9.1%).
Sales and Office Occupations by Sex
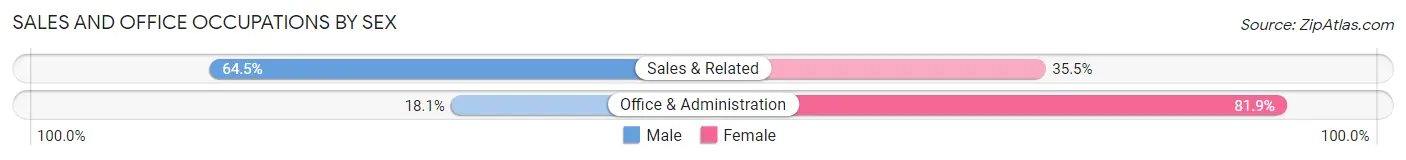
| Occupation | Male | Female |
| Sales & Related | 566 (64.5%) | 312 (35.5%) |
| Office & Administration | 216 (18.1%) | 980 (81.9%) |
| Total (Category) | 782 (37.7%) | 1,292 (62.3%) |
| Total (Overall) | 4,781 (49.5%) | 4,880 (50.5%) |
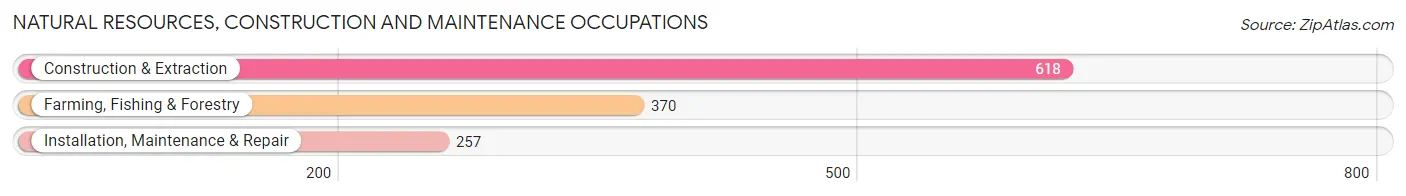
Natural Resources, Construction and Maintenance Occupations
The most common Natural Resources, Construction and Maintenance occupations in Somerset County are Construction & Extraction (618 | 6.4%), Farming, Fishing & Forestry (370 | 3.8%), and Installation, Maintenance & Repair (257 | 2.7%).
Natural Resources, Construction and Maintenance Occupations by Sex
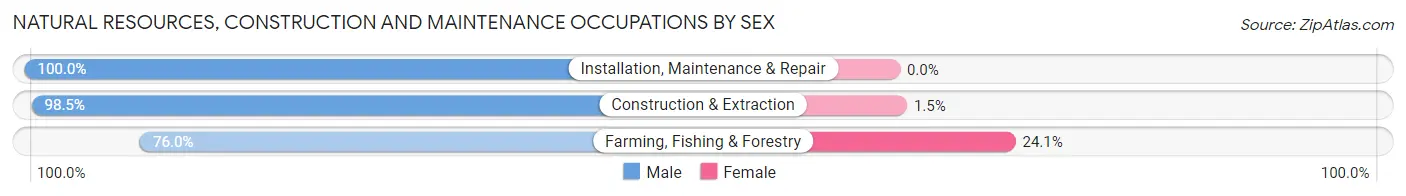
| Occupation | Male | Female |
| Farming, Fishing & Forestry | 281 (75.9%) | 89 (24.0%) |
| Construction & Extraction | 609 (98.5%) | 9 (1.5%) |
| Installation, Maintenance & Repair | 257 (100.0%) | 0 (0.0%) |
| Total (Category) | 1,147 (92.1%) | 98 (7.9%) |
| Total (Overall) | 4,781 (49.5%) | 4,880 (50.5%) |
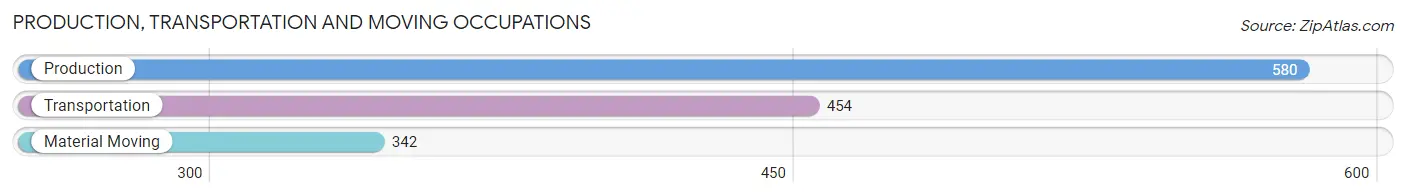
Production, Transportation and Moving Occupations
The most common Production, Transportation and Moving occupations in Somerset County are Production (580 | 6.0%), Transportation (454 | 4.7%), and Material Moving (342 | 3.5%).
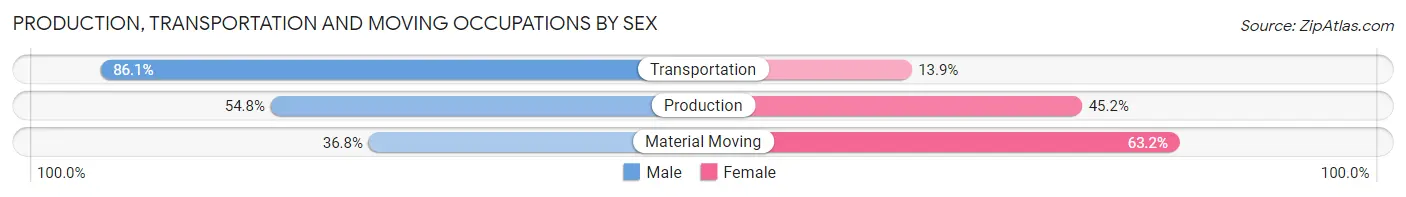
Production, Transportation and Moving Occupations by Sex
| Occupation | Male | Female |
| Production | 318 (54.8%) | 262 (45.2%) |
| Transportation | 391 (86.1%) | 63 (13.9%) |
| Material Moving | 126 (36.8%) | 216 (63.2%) |
| Total (Category) | 835 (60.7%) | 541 (39.3%) |
| Total (Overall) | 4,781 (49.5%) | 4,880 (50.5%) |
Employment Industries by Sex in Somerset County
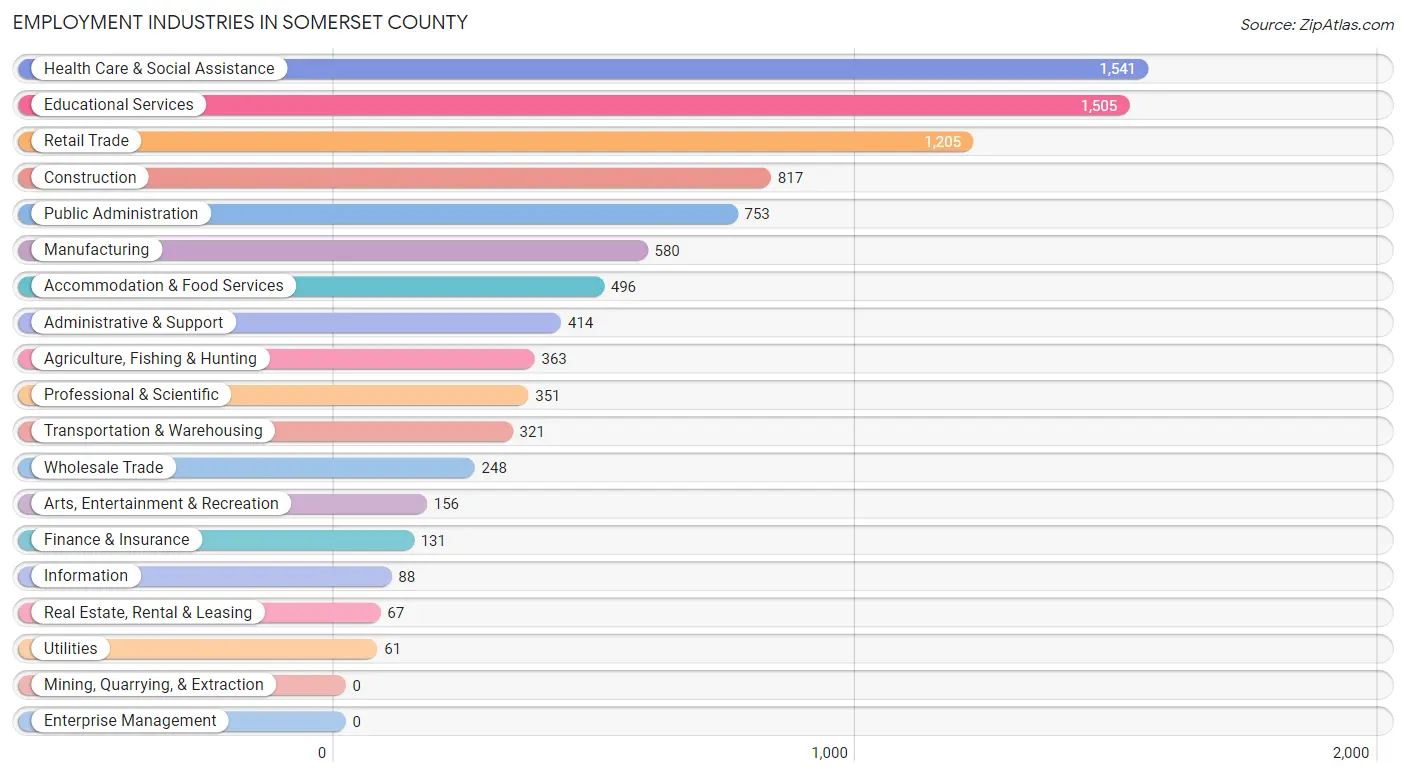
Employment Industries in Somerset County
The major employment industries in Somerset County include Health Care & Social Assistance (1,541 | 16.0%), Educational Services (1,505 | 15.6%), Retail Trade (1,205 | 12.5%), Construction (817 | 8.5%), and Public Administration (753 | 7.8%).
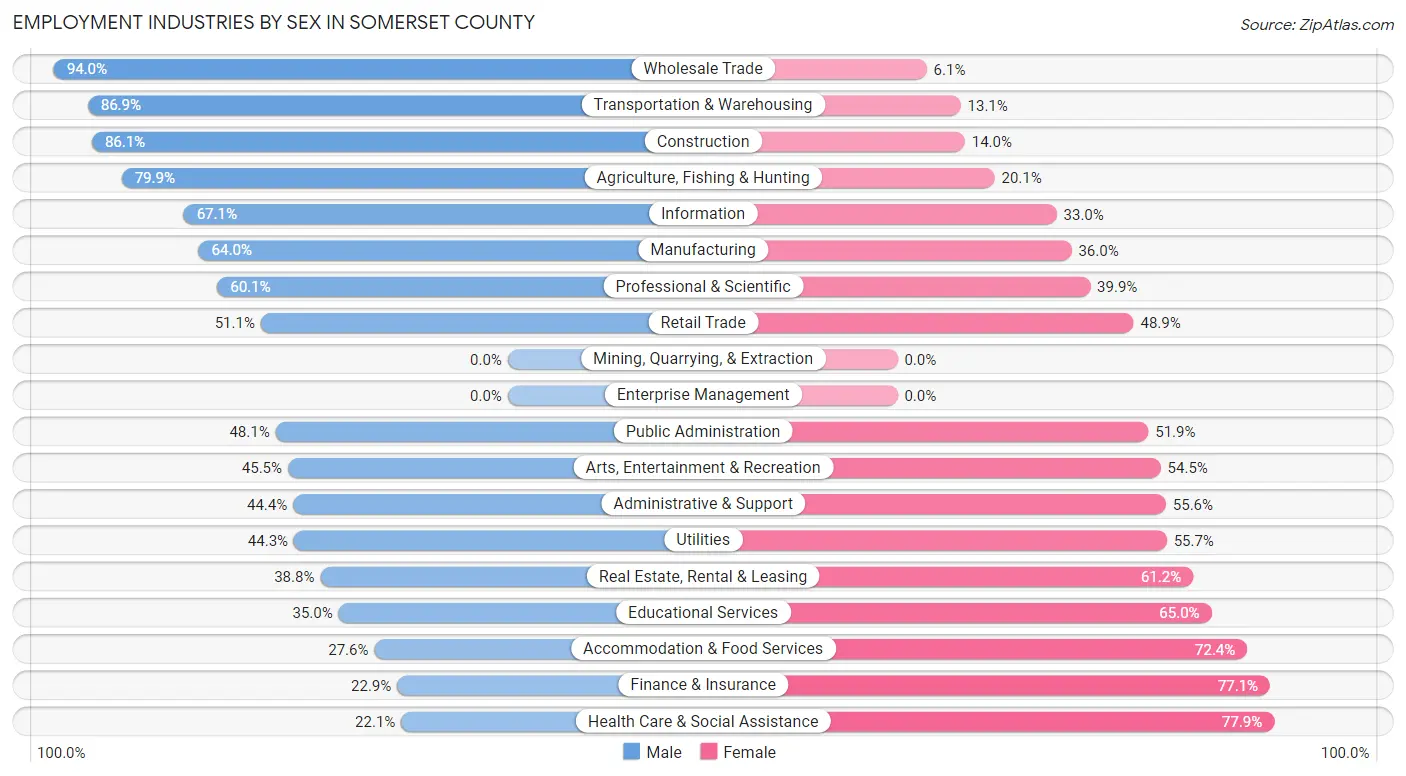
Employment Industries by Sex in Somerset County
The Somerset County industries that see more men than women are Wholesale Trade (94.0%), Transportation & Warehousing (86.9%), and Construction (86.1%), whereas the industries that tend to have a higher number of women are Health Care & Social Assistance (77.9%), Finance & Insurance (77.1%), and Accommodation & Food Services (72.4%).
| Industry | Male | Female |
| Agriculture, Fishing & Hunting | 290 (79.9%) | 73 (20.1%) |
| Mining, Quarrying, & Extraction | 0 (0.0%) | 0 (0.0%) |
| Construction | 703 (86.1%) | 114 (14.0%) |
| Manufacturing | 371 (64.0%) | 209 (36.0%) |
| Wholesale Trade | 233 (94.0%) | 15 (6.0%) |
| Retail Trade | 616 (51.1%) | 589 (48.9%) |
| Transportation & Warehousing | 279 (86.9%) | 42 (13.1%) |
| Utilities | 27 (44.3%) | 34 (55.7%) |
| Information | 59 (67.0%) | 29 (33.0%) |
| Finance & Insurance | 30 (22.9%) | 101 (77.1%) |
| Real Estate, Rental & Leasing | 26 (38.8%) | 41 (61.2%) |
| Professional & Scientific | 211 (60.1%) | 140 (39.9%) |
| Enterprise Management | 0 (0.0%) | 0 (0.0%) |
| Administrative & Support | 184 (44.4%) | 230 (55.6%) |
| Educational Services | 527 (35.0%) | 978 (65.0%) |
| Health Care & Social Assistance | 340 (22.1%) | 1,201 (77.9%) |
| Arts, Entertainment & Recreation | 71 (45.5%) | 85 (54.5%) |
| Accommodation & Food Services | 137 (27.6%) | 359 (72.4%) |
| Public Administration | 362 (48.1%) | 391 (51.9%) |
| Total | 4,781 (49.5%) | 4,880 (50.5%) |
Education in Somerset County
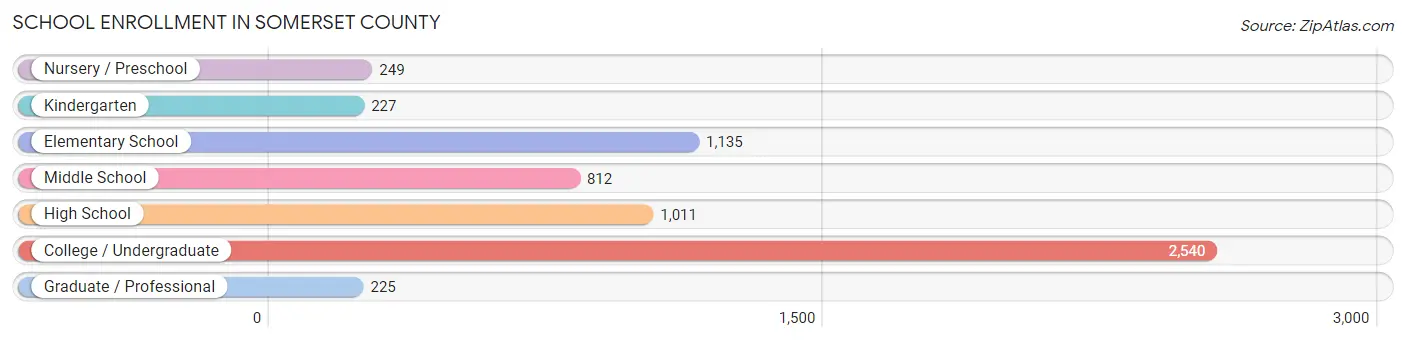
School Enrollment in Somerset County
The most common levels of schooling among the 6,199 students in Somerset County are college / undergraduate (2,540 | 41.0%), elementary school (1,135 | 18.3%), and high school (1,011 | 16.3%).
| School Level | # Students | % Students |
| Nursery / Preschool | 249 | 4.0% |
| Kindergarten | 227 | 3.7% |
| Elementary School | 1,135 | 18.3% |
| Middle School | 812 | 13.1% |
| High School | 1,011 | 16.3% |
| College / Undergraduate | 2,540 | 41.0% |
| Graduate / Professional | 225 | 3.6% |
| Total | 6,199 | 100.0% |
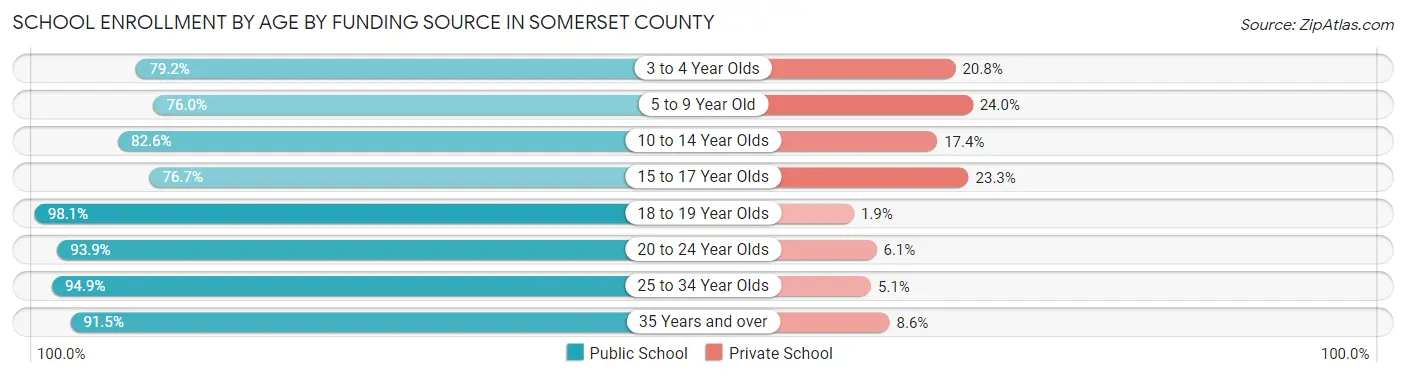
School Enrollment by Age by Funding Source in Somerset County
Out of a total of 6,199 students who are enrolled in schools in Somerset County, 818 (13.2%) attend a private institution, while the remaining 5,381 (86.8%) are enrolled in public schools. The age group of 5 to 9 year old has the highest likelihood of being enrolled in private schools, with 276 (24.0% in the age bracket) enrolled. Conversely, the age group of 18 to 19 year olds has the lowest likelihood of being enrolled in a private school, with 1,019 (98.1% in the age bracket) attending a public institution.
| Age Bracket | Public School | Private School |
| 3 to 4 Year Olds | 171 (79.2%) | 45 (20.8%) |
| 5 to 9 Year Old | 872 (76.0%) | 276 (24.0%) |
| 10 to 14 Year Olds | 933 (82.6%) | 197 (17.4%) |
| 15 to 17 Year Olds | 511 (76.7%) | 155 (23.3%) |
| 18 to 19 Year Olds | 1,019 (98.1%) | 20 (1.9%) |
| 20 to 24 Year Olds | 1,151 (93.9%) | 75 (6.1%) |
| 25 to 34 Year Olds | 446 (94.9%) | 24 (5.1%) |
| 35 Years and over | 278 (91.4%) | 26 (8.6%) |
| Total | 5,381 (86.8%) | 818 (13.2%) |
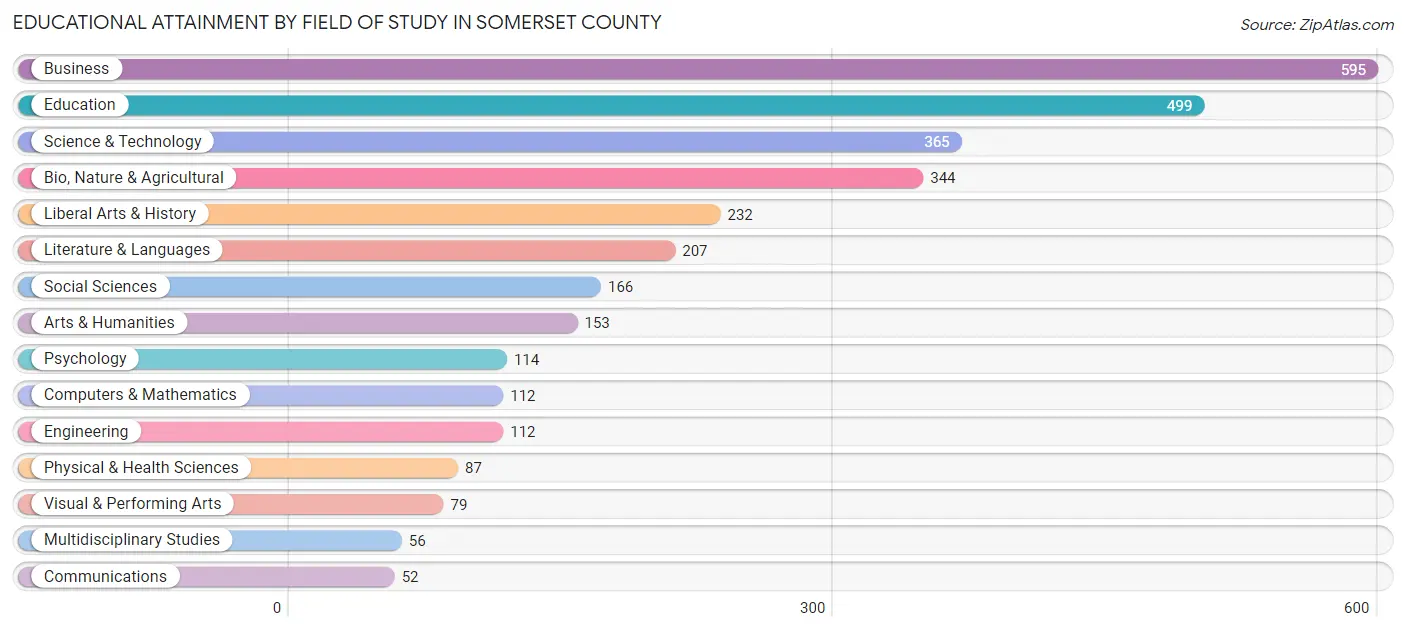
Educational Attainment by Field of Study in Somerset County
Business (595 | 18.8%), education (499 | 15.7%), science & technology (365 | 11.5%), bio, nature & agricultural (344 | 10.8%), and liberal arts & history (232 | 7.3%) are the most common fields of study among 3,173 individuals in Somerset County who have obtained a bachelor's degree or higher.
| Field of Study | # Graduates | % Graduates |
| Computers & Mathematics | 112 | 3.5% |
| Bio, Nature & Agricultural | 344 | 10.8% |
| Physical & Health Sciences | 87 | 2.7% |
| Psychology | 114 | 3.6% |
| Social Sciences | 166 | 5.2% |
| Engineering | 112 | 3.5% |
| Multidisciplinary Studies | 56 | 1.8% |
| Science & Technology | 365 | 11.5% |
| Business | 595 | 18.8% |
| Education | 499 | 15.7% |
| Literature & Languages | 207 | 6.5% |
| Liberal Arts & History | 232 | 7.3% |
| Visual & Performing Arts | 79 | 2.5% |
| Communications | 52 | 1.6% |
| Arts & Humanities | 153 | 4.8% |
| Total | 3,173 | 100.0% |
Transportation & Commute in Somerset County
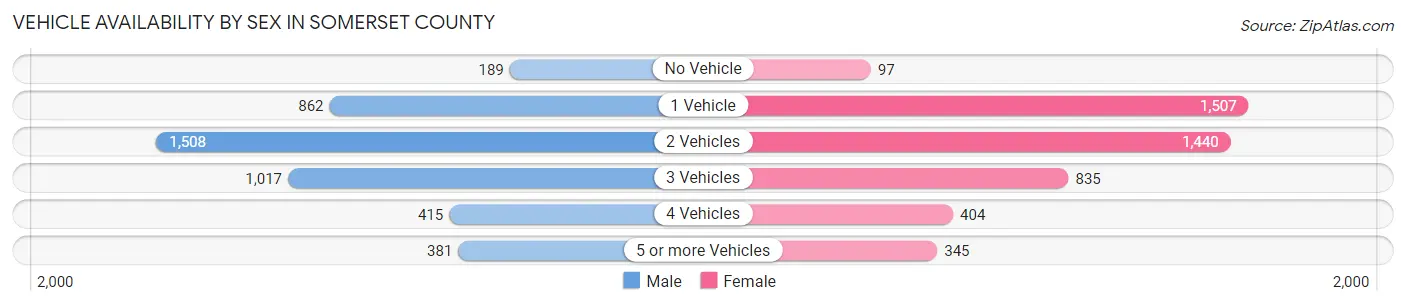
Vehicle Availability by Sex in Somerset County
The most prevalent vehicle ownership categories in Somerset County are males with 2 vehicles (1,508, accounting for 34.5%) and females with 2 vehicles (1,440, making up 32.6%).
| Vehicles Available | Male | Female |
| No Vehicle | 189 (4.3%) | 97 (2.1%) |
| 1 Vehicle | 862 (19.7%) | 1,507 (32.6%) |
| 2 Vehicles | 1,508 (34.5%) | 1,440 (31.1%) |
| 3 Vehicles | 1,017 (23.3%) | 835 (18.0%) |
| 4 Vehicles | 415 (9.5%) | 404 (8.7%) |
| 5 or more Vehicles | 381 (8.7%) | 345 (7.4%) |
| Total | 4,372 (100.0%) | 4,628 (100.0%) |
Commute Time in Somerset County
The most frequently occuring commute durations in Somerset County are 5 to 9 minutes (1,356 commuters, 15.5%), 10 to 14 minutes (1,304 commuters, 14.9%), and 30 to 34 minutes (1,214 commuters, 13.9%).
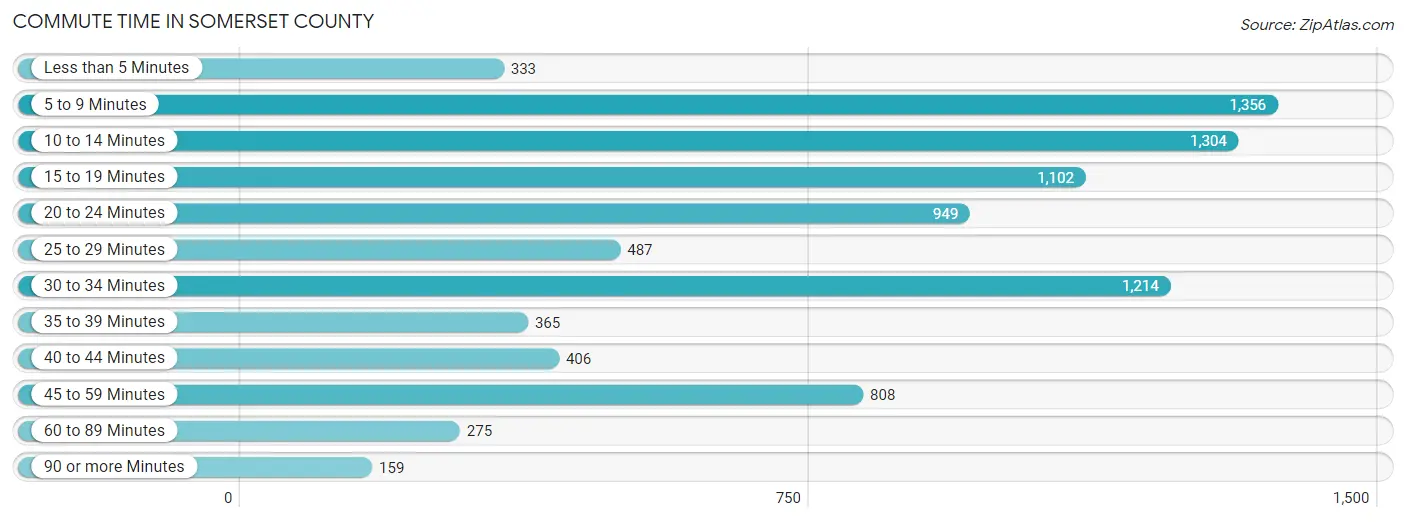
| Commute Time | # Commuters | % Commuters |
| Less than 5 Minutes | 333 | 3.8% |
| 5 to 9 Minutes | 1,356 | 15.5% |
| 10 to 14 Minutes | 1,304 | 14.9% |
| 15 to 19 Minutes | 1,102 | 12.6% |
| 20 to 24 Minutes | 949 | 10.8% |
| 25 to 29 Minutes | 487 | 5.6% |
| 30 to 34 Minutes | 1,214 | 13.9% |
| 35 to 39 Minutes | 365 | 4.2% |
| 40 to 44 Minutes | 406 | 4.6% |
| 45 to 59 Minutes | 808 | 9.2% |
| 60 to 89 Minutes | 275 | 3.1% |
| 90 or more Minutes | 159 | 1.8% |
Commute Time by Sex in Somerset County
The most common commute times in Somerset County are 10 to 14 minutes (657 commuters, 14.9%) for males and 5 to 9 minutes (715 commuters, 16.4%) for females.
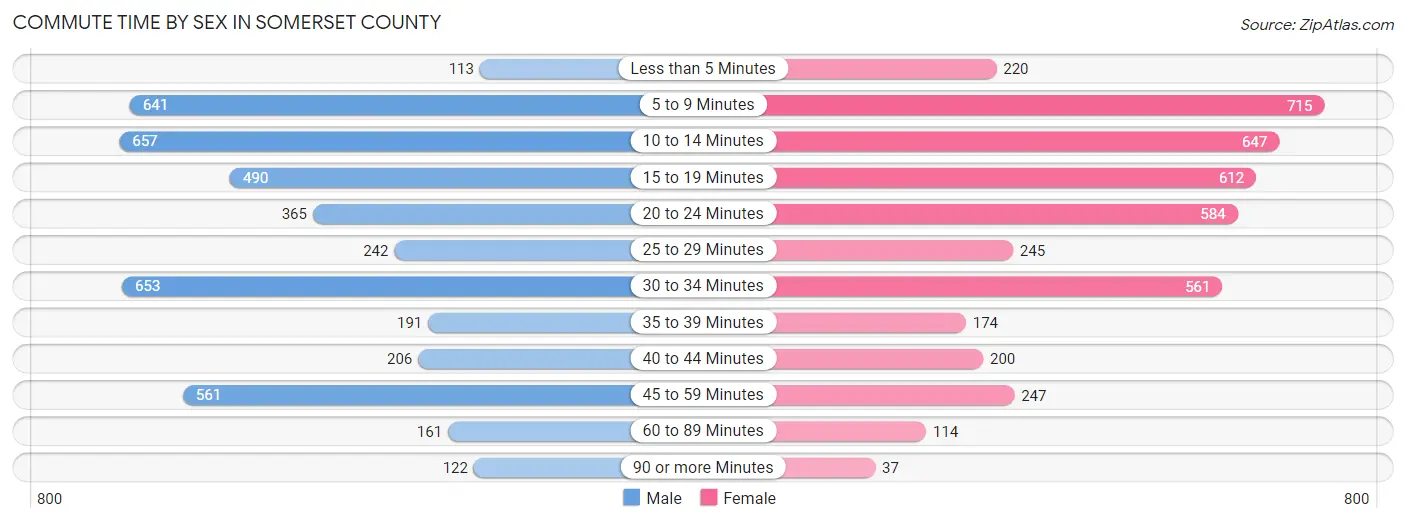
| Commute Time | Male | Female |
| Less than 5 Minutes | 113 (2.6%) | 220 (5.1%) |
| 5 to 9 Minutes | 641 (14.6%) | 715 (16.4%) |
| 10 to 14 Minutes | 657 (14.9%) | 647 (14.8%) |
| 15 to 19 Minutes | 490 (11.1%) | 612 (14.1%) |
| 20 to 24 Minutes | 365 (8.3%) | 584 (13.4%) |
| 25 to 29 Minutes | 242 (5.5%) | 245 (5.6%) |
| 30 to 34 Minutes | 653 (14.8%) | 561 (12.9%) |
| 35 to 39 Minutes | 191 (4.3%) | 174 (4.0%) |
| 40 to 44 Minutes | 206 (4.7%) | 200 (4.6%) |
| 45 to 59 Minutes | 561 (12.7%) | 247 (5.7%) |
| 60 to 89 Minutes | 161 (3.7%) | 114 (2.6%) |
| 90 or more Minutes | 122 (2.8%) | 37 (0.9%) |
Time of Departure to Work by Sex in Somerset County
The most frequent times of departure to work in Somerset County are 6:30 AM to 6:59 AM (571, 13.0%) for males and 7:30 AM to 7:59 AM (789, 18.1%) for females.
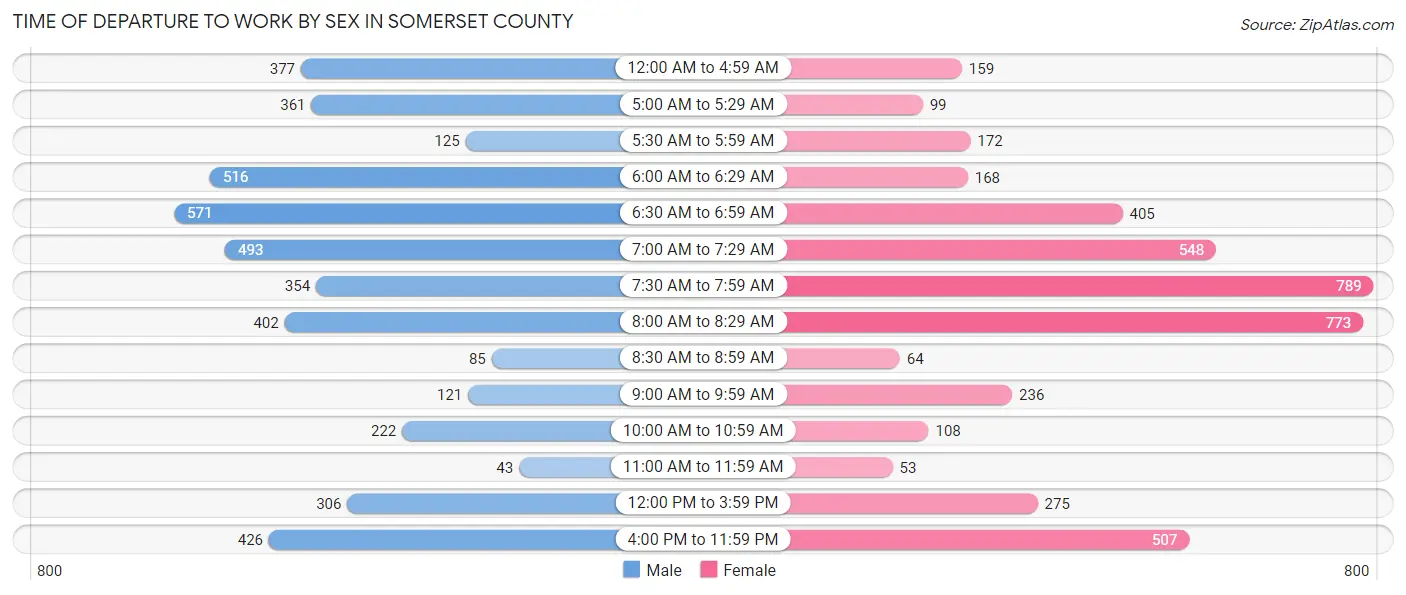
| Time of Departure | Male | Female |
| 12:00 AM to 4:59 AM | 377 (8.6%) | 159 (3.6%) |
| 5:00 AM to 5:29 AM | 361 (8.2%) | 99 (2.3%) |
| 5:30 AM to 5:59 AM | 125 (2.8%) | 172 (4.0%) |
| 6:00 AM to 6:29 AM | 516 (11.7%) | 168 (3.9%) |
| 6:30 AM to 6:59 AM | 571 (13.0%) | 405 (9.3%) |
| 7:00 AM to 7:29 AM | 493 (11.2%) | 548 (12.6%) |
| 7:30 AM to 7:59 AM | 354 (8.0%) | 789 (18.1%) |
| 8:00 AM to 8:29 AM | 402 (9.1%) | 773 (17.7%) |
| 8:30 AM to 8:59 AM | 85 (1.9%) | 64 (1.5%) |
| 9:00 AM to 9:59 AM | 121 (2.8%) | 236 (5.4%) |
| 10:00 AM to 10:59 AM | 222 (5.0%) | 108 (2.5%) |
| 11:00 AM to 11:59 AM | 43 (1.0%) | 53 (1.2%) |
| 12:00 PM to 3:59 PM | 306 (7.0%) | 275 (6.3%) |
| 4:00 PM to 11:59 PM | 426 (9.7%) | 507 (11.6%) |
| Total | 4,402 (100.0%) | 4,356 (100.0%) |
Housing Occupancy in Somerset County
Occupancy by Ownership in Somerset County
Of the total 8,355 dwellings in Somerset County, owner-occupied units account for 5,642 (67.5%), while renter-occupied units make up 2,713 (32.5%).
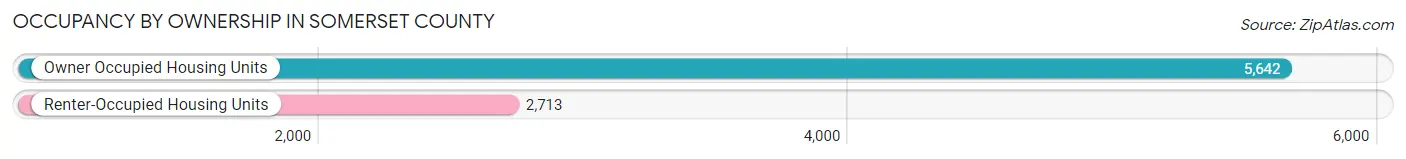
| Occupancy | # Housing Units | % Housing Units |
| Owner Occupied Housing Units | 5,642 | 67.5% |
| Renter-Occupied Housing Units | 2,713 | 32.5% |
| Total Occupied Housing Units | 8,355 | 100.0% |
Occupancy by Household Size in Somerset County
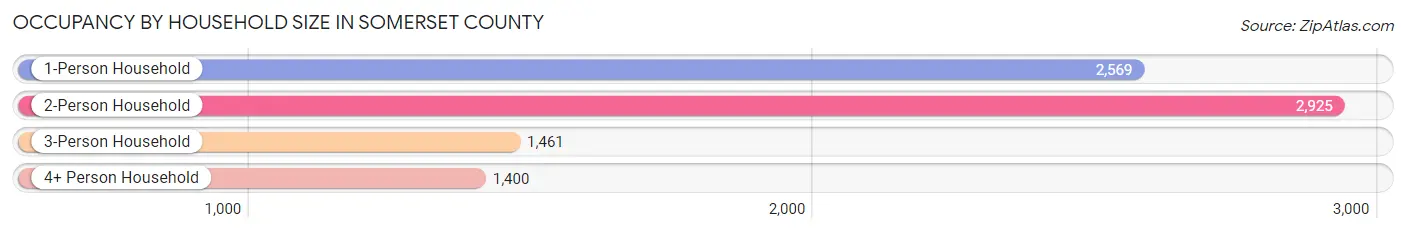
| Household Size | # Housing Units | % Housing Units |
| 1-Person Household | 2,569 | 30.7% |
| 2-Person Household | 2,925 | 35.0% |
| 3-Person Household | 1,461 | 17.5% |
| 4+ Person Household | 1,400 | 16.8% |
| Total Housing Units | 8,355 | 100.0% |
Occupancy by Ownership by Household Size in Somerset County
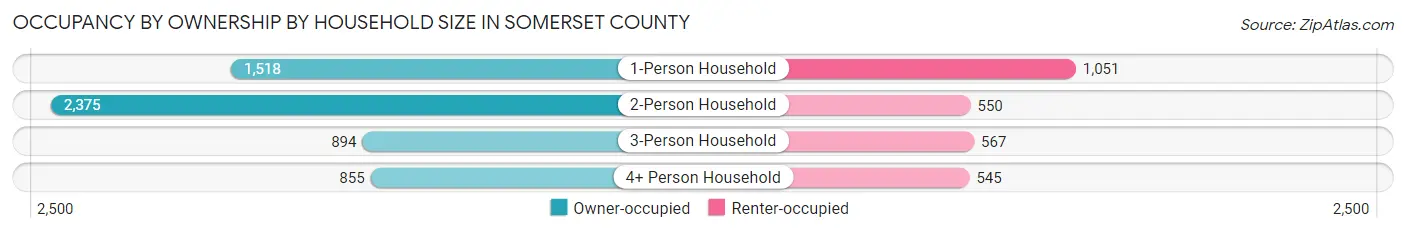
| Household Size | Owner-occupied | Renter-occupied |
| 1-Person Household | 1,518 (59.1%) | 1,051 (40.9%) |
| 2-Person Household | 2,375 (81.2%) | 550 (18.8%) |
| 3-Person Household | 894 (61.2%) | 567 (38.8%) |
| 4+ Person Household | 855 (61.1%) | 545 (38.9%) |
| Total Housing Units | 5,642 (67.5%) | 2,713 (32.5%) |
Occupancy by Educational Attainment in Somerset County
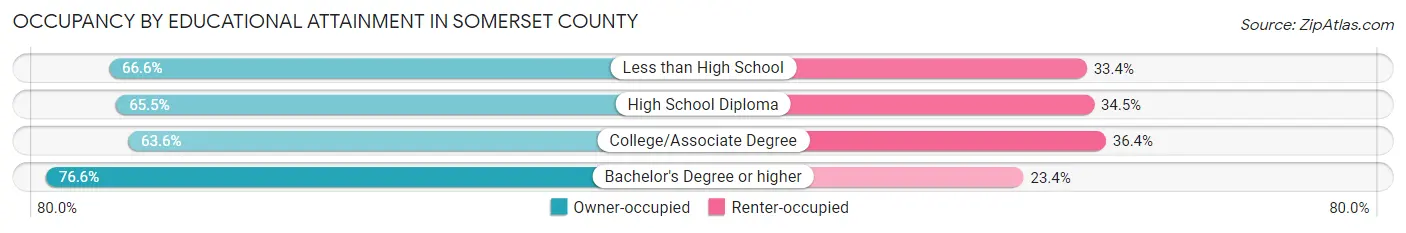
| Household Size | Owner-occupied | Renter-occupied |
| Less than High School | 622 (66.6%) | 312 (33.4%) |
| High School Diploma | 1,829 (65.5%) | 965 (34.5%) |
| College/Associate Degree | 1,726 (63.6%) | 989 (36.4%) |
| Bachelor's Degree or higher | 1,465 (76.6%) | 447 (23.4%) |
Occupancy by Age of Householder in Somerset County
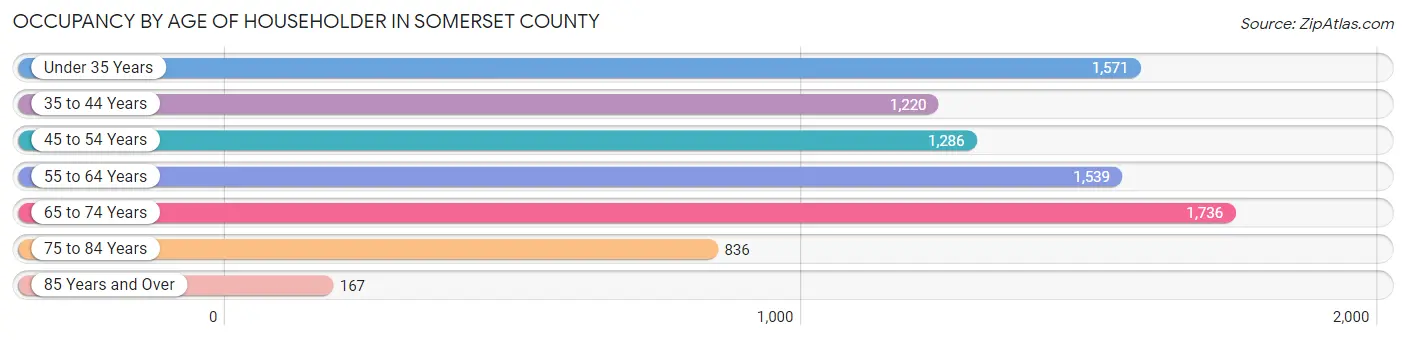
| Age Bracket | # Households | % Households |
| Under 35 Years | 1,571 | 18.8% |
| 35 to 44 Years | 1,220 | 14.6% |
| 45 to 54 Years | 1,286 | 15.4% |
| 55 to 64 Years | 1,539 | 18.4% |
| 65 to 74 Years | 1,736 | 20.8% |
| 75 to 84 Years | 836 | 10.0% |
| 85 Years and Over | 167 | 2.0% |
| Total | 8,355 | 100.0% |
Housing Finances in Somerset County
Median Income by Occupancy in Somerset County
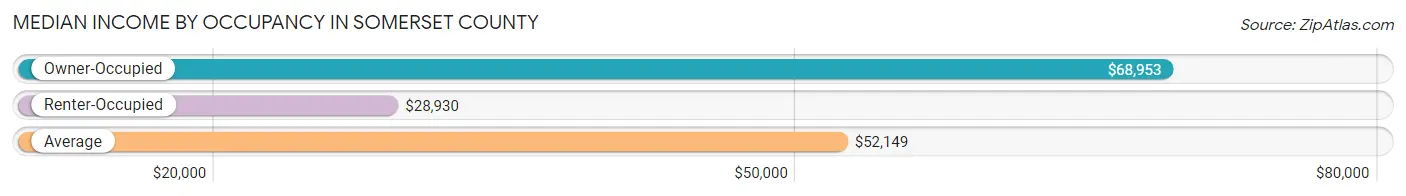
| Occupancy Type | # Households | Median Income |
| Owner-Occupied | 5,642 (67.5%) | $68,953 |
| Renter-Occupied | 2,713 (32.5%) | $28,930 |
| Average | 8,355 (100.0%) | $52,149 |
Occupancy by Householder Income Bracket in Somerset County
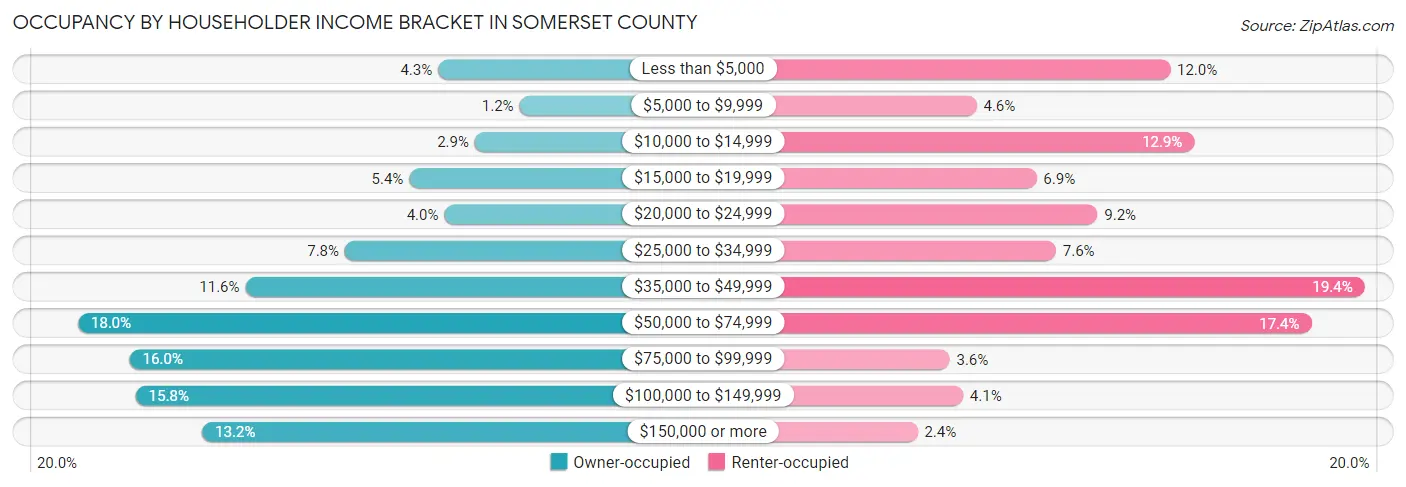
| Income Bracket | Owner-occupied | Renter-occupied |
| Less than $5,000 | 240 (4.3%) | 325 (12.0%) |
| $5,000 to $9,999 | 65 (1.1%) | 125 (4.6%) |
| $10,000 to $14,999 | 161 (2.9%) | 350 (12.9%) |
| $15,000 to $19,999 | 302 (5.3%) | 187 (6.9%) |
| $20,000 to $24,999 | 226 (4.0%) | 250 (9.2%) |
| $25,000 to $34,999 | 440 (7.8%) | 207 (7.6%) |
| $35,000 to $49,999 | 654 (11.6%) | 526 (19.4%) |
| $50,000 to $74,999 | 1,014 (18.0%) | 471 (17.4%) |
| $75,000 to $99,999 | 903 (16.0%) | 97 (3.6%) |
| $100,000 to $149,999 | 890 (15.8%) | 111 (4.1%) |
| $150,000 or more | 747 (13.2%) | 64 (2.4%) |
| Total | 5,642 (100.0%) | 2,713 (100.0%) |
Monthly Housing Cost Tiers in Somerset County
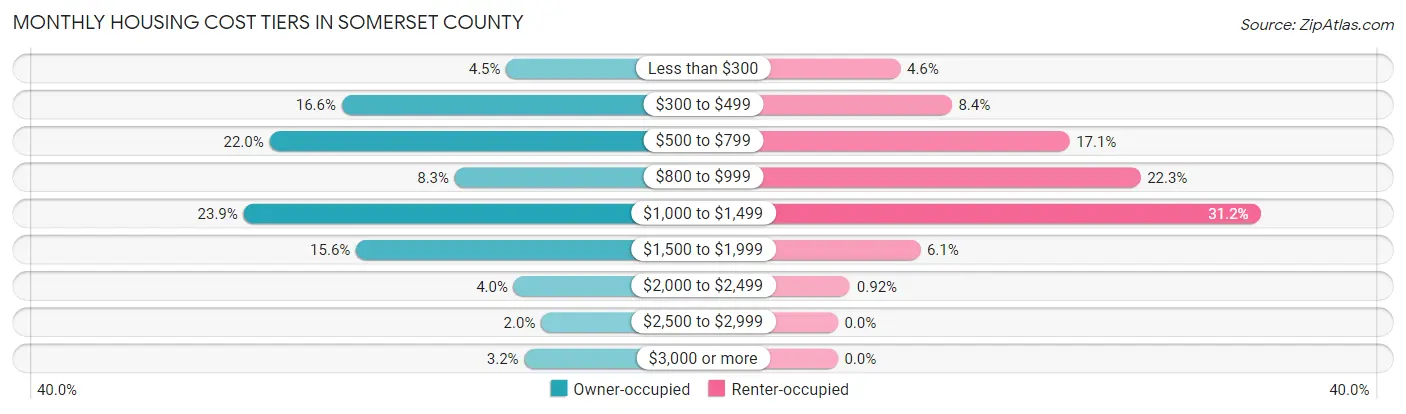
| Monthly Cost | Owner-occupied | Renter-occupied |
| Less than $300 | 255 (4.5%) | 125 (4.6%) |
| $300 to $499 | 939 (16.6%) | 228 (8.4%) |
| $500 to $799 | 1,239 (22.0%) | 463 (17.1%) |
| $800 to $999 | 469 (8.3%) | 605 (22.3%) |
| $1,000 to $1,499 | 1,347 (23.9%) | 845 (31.1%) |
| $1,500 to $1,999 | 879 (15.6%) | 165 (6.1%) |
| $2,000 to $2,499 | 224 (4.0%) | 25 (0.9%) |
| $2,500 to $2,999 | 110 (1.9%) | 0 (0.0%) |
| $3,000 or more | 180 (3.2%) | 0 (0.0%) |
| Total | 5,642 (100.0%) | 2,713 (100.0%) |
Physical Housing Characteristics in Somerset County
Housing Structures in Somerset County
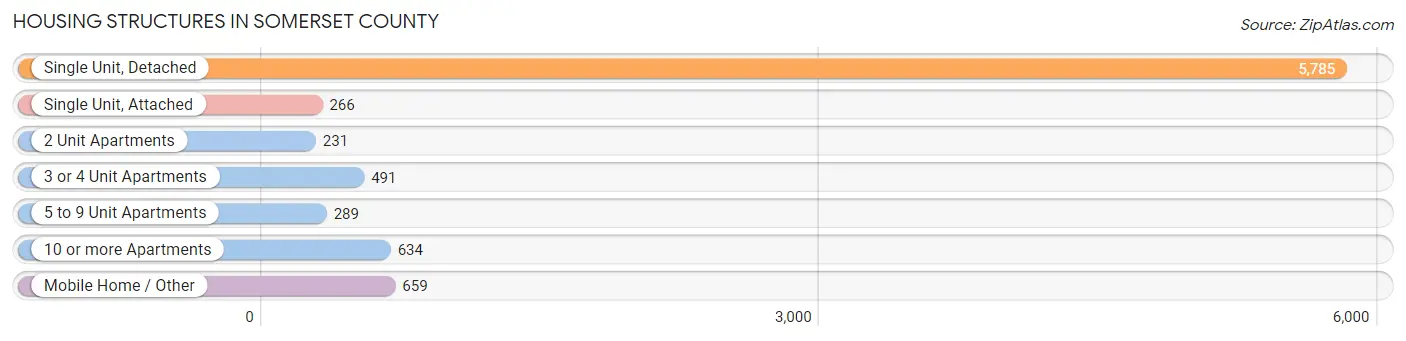
| Structure Type | # Housing Units | % Housing Units |
| Single Unit, Detached | 5,785 | 69.2% |
| Single Unit, Attached | 266 | 3.2% |
| 2 Unit Apartments | 231 | 2.8% |
| 3 or 4 Unit Apartments | 491 | 5.9% |
| 5 to 9 Unit Apartments | 289 | 3.5% |
| 10 or more Apartments | 634 | 7.6% |
| Mobile Home / Other | 659 | 7.9% |
| Total | 8,355 | 100.0% |
Housing Structures by Occupancy in Somerset County
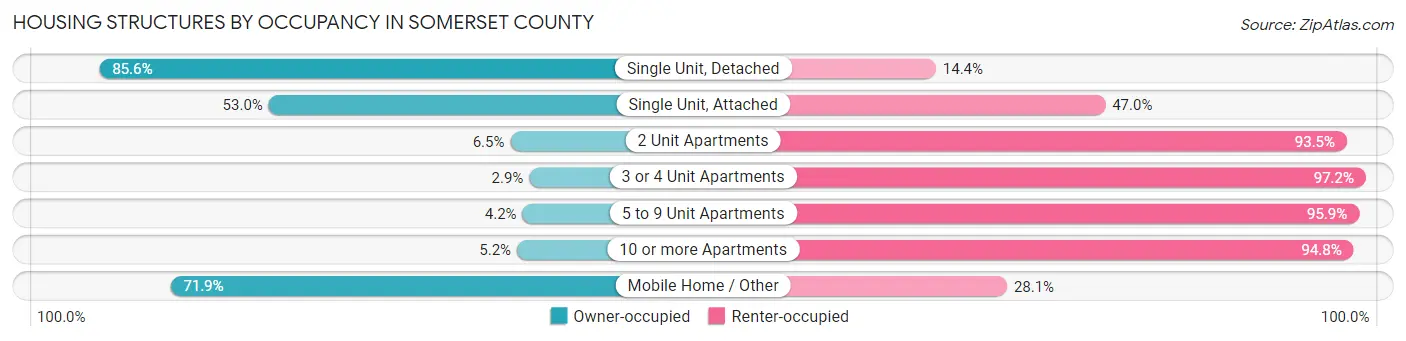
| Structure Type | Owner-occupied | Renter-occupied |
| Single Unit, Detached | 4,953 (85.6%) | 832 (14.4%) |
| Single Unit, Attached | 141 (53.0%) | 125 (47.0%) |
| 2 Unit Apartments | 15 (6.5%) | 216 (93.5%) |
| 3 or 4 Unit Apartments | 14 (2.9%) | 477 (97.2%) |
| 5 to 9 Unit Apartments | 12 (4.2%) | 277 (95.9%) |
| 10 or more Apartments | 33 (5.2%) | 601 (94.8%) |
| Mobile Home / Other | 474 (71.9%) | 185 (28.1%) |
| Total | 5,642 (67.5%) | 2,713 (32.5%) |
Housing Structures by Number of Rooms in Somerset County
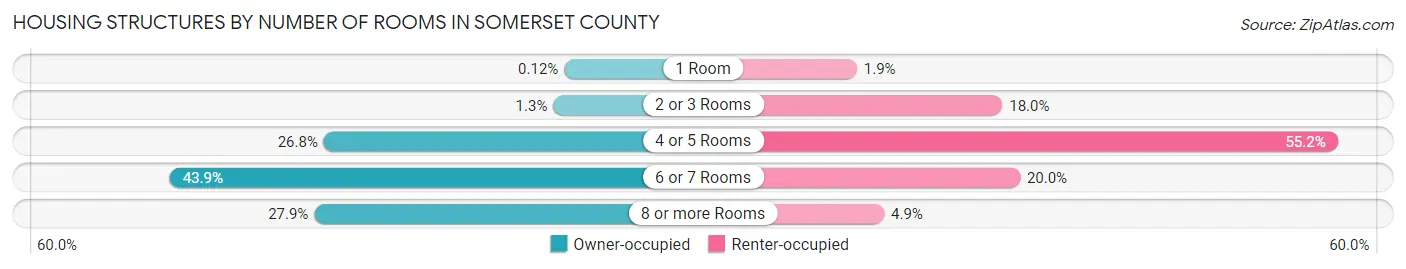
| Number of Rooms | Owner-occupied | Renter-occupied |
| 1 Room | 7 (0.1%) | 51 (1.9%) |
| 2 or 3 Rooms | 75 (1.3%) | 489 (18.0%) |
| 4 or 5 Rooms | 1,512 (26.8%) | 1,498 (55.2%) |
| 6 or 7 Rooms | 2,476 (43.9%) | 542 (20.0%) |
| 8 or more Rooms | 1,572 (27.9%) | 133 (4.9%) |
| Total | 5,642 (100.0%) | 2,713 (100.0%) |
Housing Structure by Heating Type in Somerset County
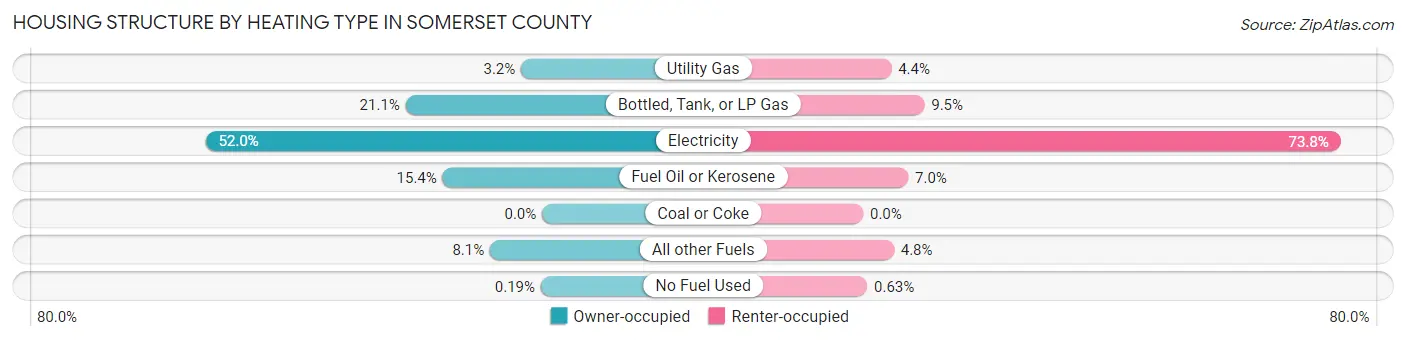
| Heating Type | Owner-occupied | Renter-occupied |
| Utility Gas | 183 (3.2%) | 118 (4.3%) |
| Bottled, Tank, or LP Gas | 1,190 (21.1%) | 257 (9.5%) |
| Electricity | 2,936 (52.0%) | 2,003 (73.8%) |
| Fuel Oil or Kerosene | 868 (15.4%) | 189 (7.0%) |
| Coal or Coke | 0 (0.0%) | 0 (0.0%) |
| All other Fuels | 454 (8.1%) | 129 (4.8%) |
| No Fuel Used | 11 (0.2%) | 17 (0.6%) |
| Total | 5,642 (100.0%) | 2,713 (100.0%) |
Household Vehicle Usage in Somerset County
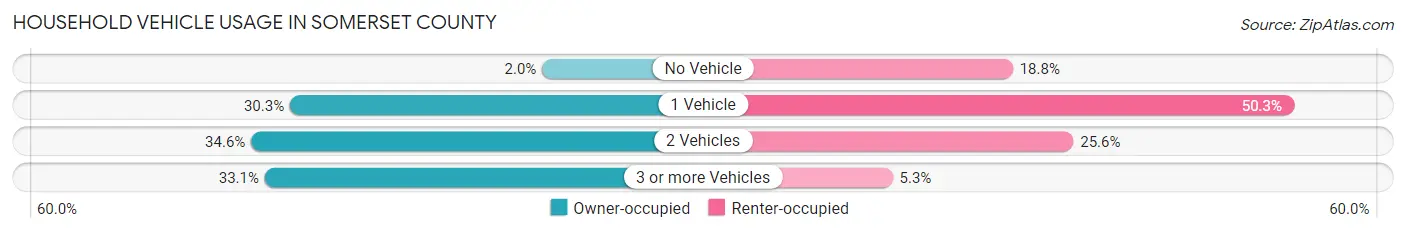
| Vehicles per Household | Owner-occupied | Renter-occupied |
| No Vehicle | 114 (2.0%) | 510 (18.8%) |
| 1 Vehicle | 1,708 (30.3%) | 1,364 (50.3%) |
| 2 Vehicles | 1,953 (34.6%) | 694 (25.6%) |
| 3 or more Vehicles | 1,867 (33.1%) | 145 (5.3%) |
| Total | 5,642 (100.0%) | 2,713 (100.0%) |
Real Estate & Mortgages in Somerset County
Real Estate and Mortgage Overview in Somerset County
| Characteristic | Without Mortgage | With Mortgage |
| Housing Units | 2,326 | 3,316 |
| Median Property Value | $148,400 | $164,100 |
| Median Household Income | $49,704 | $618 |
| Monthly Housing Costs | $504 | $180 |
| Real Estate Taxes | $1,378 | $89 |
Property Value by Mortgage Status in Somerset County
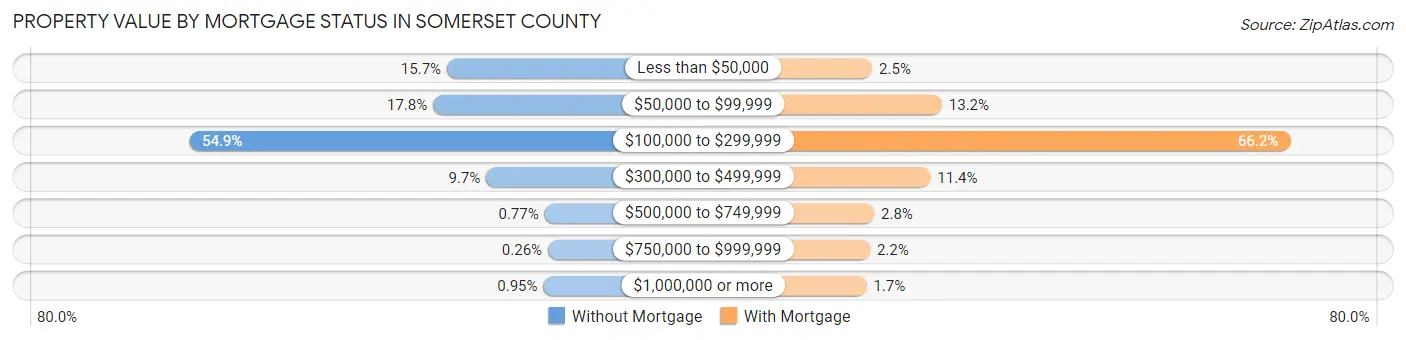
| Property Value | Without Mortgage | With Mortgage |
| Less than $50,000 | 364 (15.7%) | 84 (2.5%) |
| $50,000 to $99,999 | 413 (17.8%) | 436 (13.2%) |
| $100,000 to $299,999 | 1,278 (54.9%) | 2,196 (66.2%) |
| $300,000 to $499,999 | 225 (9.7%) | 378 (11.4%) |
| $500,000 to $749,999 | 18 (0.8%) | 94 (2.8%) |
| $750,000 to $999,999 | 6 (0.3%) | 73 (2.2%) |
| $1,000,000 or more | 22 (0.9%) | 55 (1.7%) |
| Total | 2,326 (100.0%) | 3,316 (100.0%) |
Household Income by Mortgage Status in Somerset County
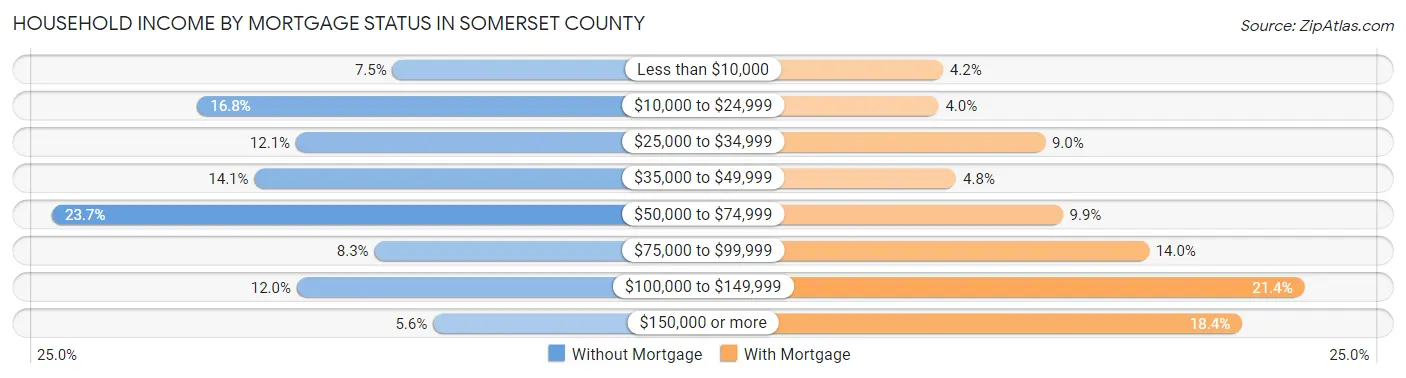
| Household Income | Without Mortgage | With Mortgage |
| Less than $10,000 | 174 (7.5%) | 138 (4.2%) |
| $10,000 to $24,999 | 390 (16.8%) | 131 (4.0%) |
| $25,000 to $34,999 | 281 (12.1%) | 299 (9.0%) |
| $35,000 to $49,999 | 327 (14.1%) | 159 (4.8%) |
| $50,000 to $74,999 | 551 (23.7%) | 327 (9.9%) |
| $75,000 to $99,999 | 194 (8.3%) | 463 (14.0%) |
| $100,000 to $149,999 | 280 (12.0%) | 709 (21.4%) |
| $150,000 or more | 129 (5.6%) | 610 (18.4%) |
| Total | 2,326 (100.0%) | 3,316 (100.0%) |
Property Value to Household Income Ratio in Somerset County
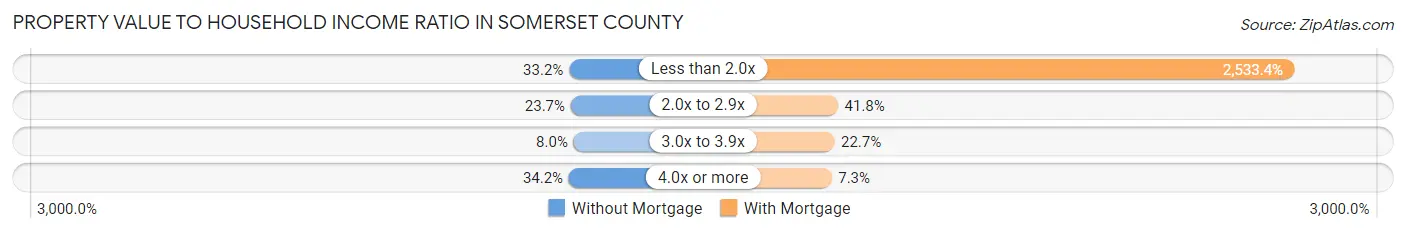
| Value-to-Income Ratio | Without Mortgage | With Mortgage |
| Less than 2.0x | 772 (33.2%) | 84,009 (2,533.4%) |
| 2.0x to 2.9x | 550 (23.6%) | 1,386 (41.8%) |
| 3.0x to 3.9x | 187 (8.0%) | 751 (22.7%) |
| 4.0x or more | 795 (34.2%) | 243 (7.3%) |
| Total | 2,326 (100.0%) | 3,316 (100.0%) |
Real Estate Taxes by Mortgage Status in Somerset County
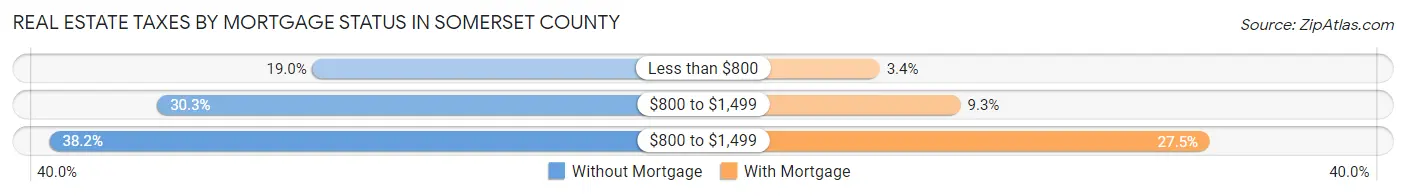
| Property Taxes | Without Mortgage | With Mortgage |
| Less than $800 | 441 (19.0%) | 113 (3.4%) |
| $800 to $1,499 | 705 (30.3%) | 309 (9.3%) |
| $800 to $1,499 | 888 (38.2%) | 913 (27.5%) |
| Total | 2,326 (100.0%) | 3,316 (100.0%) |
Health & Disability in Somerset County
Health Insurance Coverage by Age in Somerset County
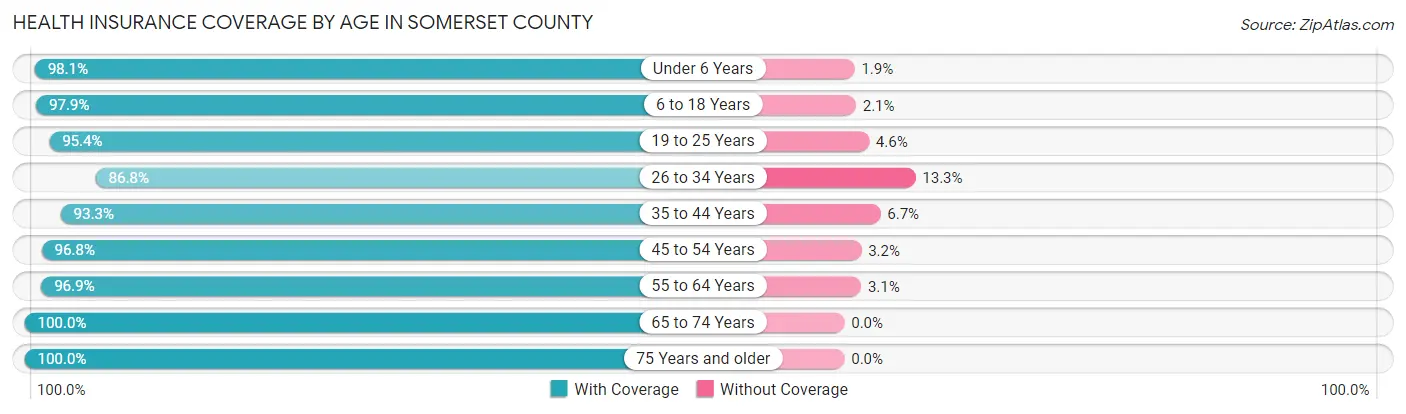
| Age Bracket | With Coverage | Without Coverage |
| Under 6 Years | 1,294 (98.1%) | 25 (1.9%) |
| 6 to 18 Years | 3,381 (97.9%) | 74 (2.1%) |
| 19 to 25 Years | 2,703 (95.4%) | 130 (4.6%) |
| 26 to 34 Years | 1,925 (86.8%) | 294 (13.3%) |
| 35 to 44 Years | 2,097 (93.3%) | 151 (6.7%) |
| 45 to 54 Years | 2,265 (96.8%) | 74 (3.2%) |
| 55 to 64 Years | 2,866 (96.9%) | 92 (3.1%) |
| 65 to 74 Years | 2,420 (100.0%) | 0 (0.0%) |
| 75 Years and older | 1,526 (100.0%) | 0 (0.0%) |
| Total | 20,477 (96.1%) | 840 (3.9%) |
Health Insurance Coverage by Citizenship Status in Somerset County
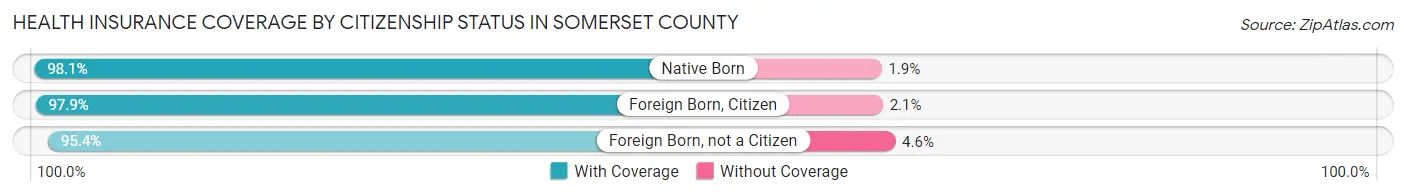
| Citizenship Status | With Coverage | Without Coverage |
| Native Born | 1,294 (98.1%) | 25 (1.9%) |
| Foreign Born, Citizen | 3,381 (97.9%) | 74 (2.1%) |
| Foreign Born, not a Citizen | 2,703 (95.4%) | 130 (4.6%) |
Health Insurance Coverage by Household Income in Somerset County
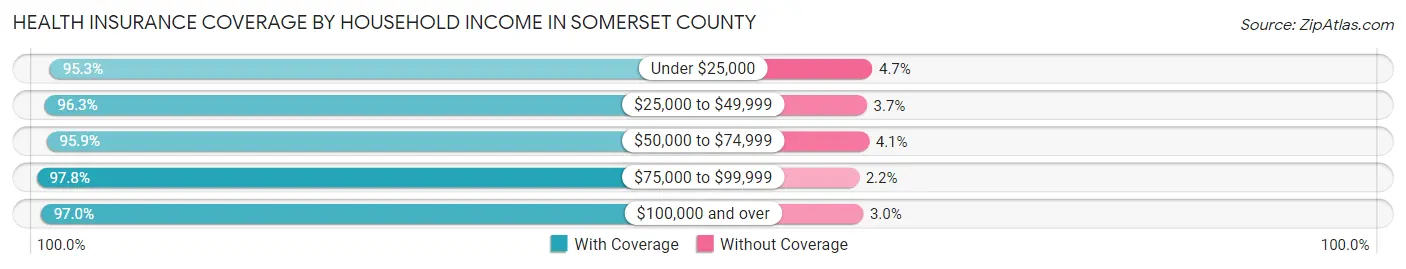
| Household Income | With Coverage | Without Coverage |
| Under $25,000 | 3,804 (95.3%) | 189 (4.7%) |
| $25,000 to $49,999 | 3,820 (96.3%) | 147 (3.7%) |
| $50,000 to $74,999 | 3,306 (95.9%) | 142 (4.1%) |
| $75,000 to $99,999 | 2,460 (97.8%) | 56 (2.2%) |
| $100,000 and over | 5,689 (97.0%) | 178 (3.0%) |
Public vs Private Health Insurance Coverage by Age in Somerset County
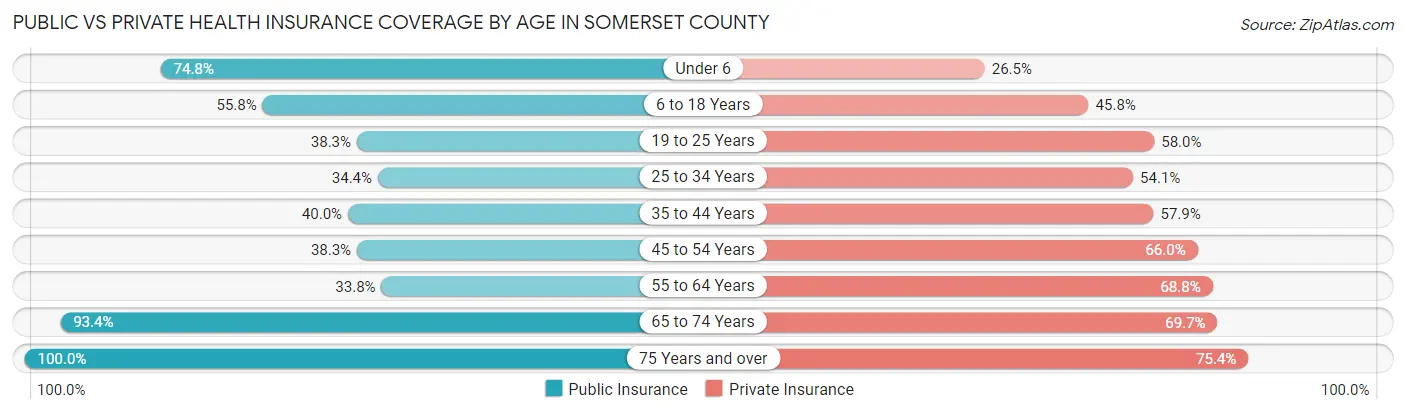
| Age Bracket | Public Insurance | Private Insurance |
| Under 6 | 986 (74.8%) | 350 (26.5%) |
| 6 to 18 Years | 1,929 (55.8%) | 1,583 (45.8%) |
| 19 to 25 Years | 1,086 (38.3%) | 1,643 (58.0%) |
| 25 to 34 Years | 764 (34.4%) | 1,200 (54.1%) |
| 35 to 44 Years | 899 (40.0%) | 1,301 (57.9%) |
| 45 to 54 Years | 896 (38.3%) | 1,544 (66.0%) |
| 55 to 64 Years | 999 (33.8%) | 2,035 (68.8%) |
| 65 to 74 Years | 2,260 (93.4%) | 1,687 (69.7%) |
| 75 Years and over | 1,526 (100.0%) | 1,151 (75.4%) |
| Total | 11,345 (53.2%) | 12,494 (58.6%) |
Disability Status by Sex by Age in Somerset County
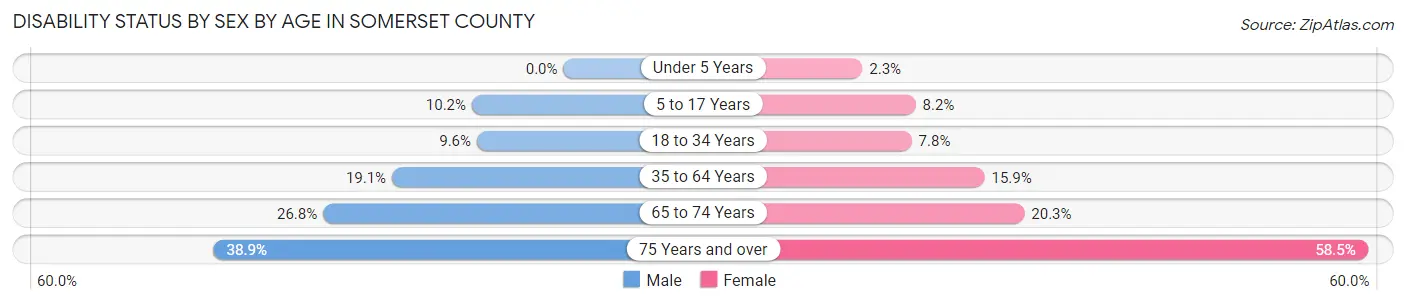
| Age Bracket | Male | Female |
| Under 5 Years | 0 (0.0%) | 12 (2.3%) |
| 5 to 17 Years | 158 (10.2%) | 122 (8.2%) |
| 18 to 34 Years | 269 (9.6%) | 227 (7.8%) |
| 35 to 64 Years | 696 (19.1%) | 620 (15.9%) |
| 65 to 74 Years | 308 (26.8%) | 258 (20.3%) |
| 75 Years and over | 243 (38.9%) | 528 (58.5%) |
Disability Class by Sex by Age in Somerset County
Disability Class: Hearing Difficulty
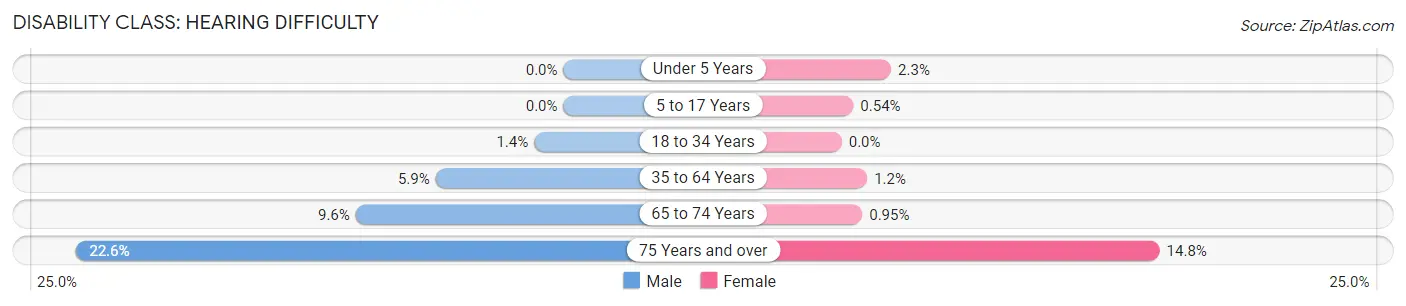
| Age Bracket | Male | Female |
| Under 5 Years | 0 (0.0%) | 12 (2.3%) |
| 5 to 17 Years | 0 (0.0%) | 8 (0.5%) |
| 18 to 34 Years | 38 (1.4%) | 0 (0.0%) |
| 35 to 64 Years | 216 (5.9%) | 46 (1.2%) |
| 65 to 74 Years | 111 (9.6%) | 12 (0.9%) |
| 75 Years and over | 141 (22.6%) | 133 (14.7%) |
Disability Class: Vision Difficulty
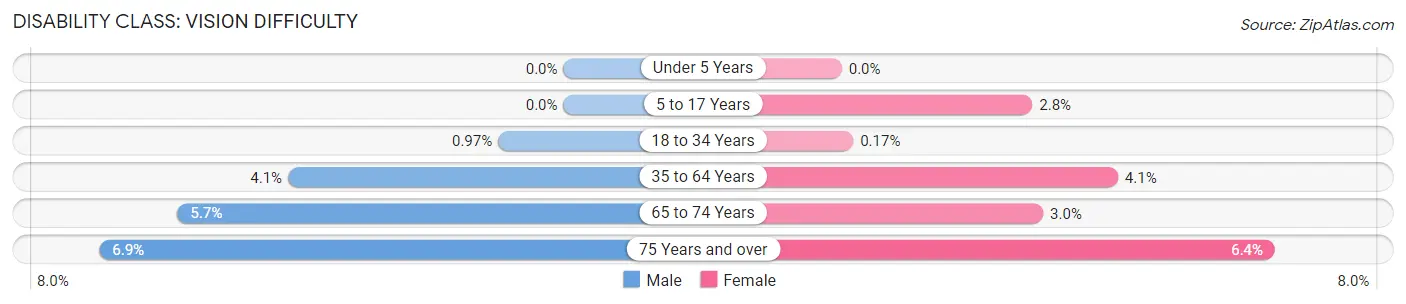
| Age Bracket | Male | Female |
| Under 5 Years | 0 (0.0%) | 0 (0.0%) |
| 5 to 17 Years | 0 (0.0%) | 42 (2.8%) |
| 18 to 34 Years | 27 (1.0%) | 5 (0.2%) |
| 35 to 64 Years | 149 (4.1%) | 160 (4.1%) |
| 65 to 74 Years | 66 (5.7%) | 38 (3.0%) |
| 75 Years and over | 43 (6.9%) | 58 (6.4%) |
Disability Class: Cognitive Difficulty
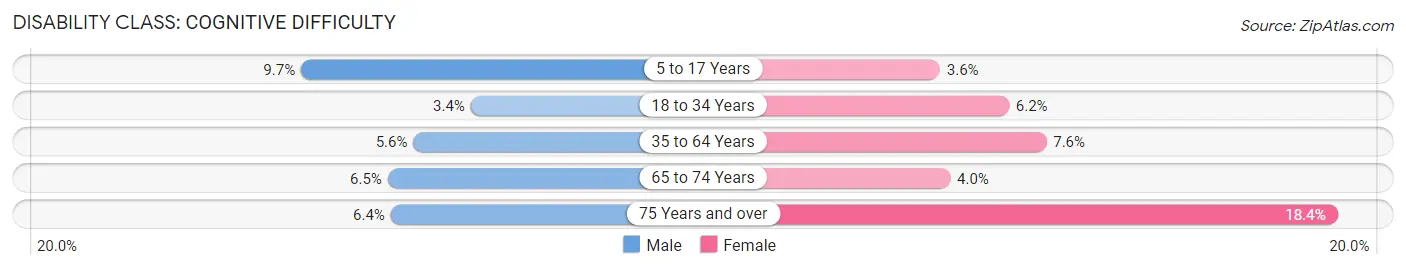
| Age Bracket | Male | Female |
| 5 to 17 Years | 151 (9.7%) | 54 (3.6%) |
| 18 to 34 Years | 96 (3.4%) | 181 (6.2%) |
| 35 to 64 Years | 203 (5.6%) | 296 (7.6%) |
| 65 to 74 Years | 75 (6.5%) | 51 (4.0%) |
| 75 Years and over | 40 (6.4%) | 166 (18.4%) |
Disability Class: Ambulatory Difficulty
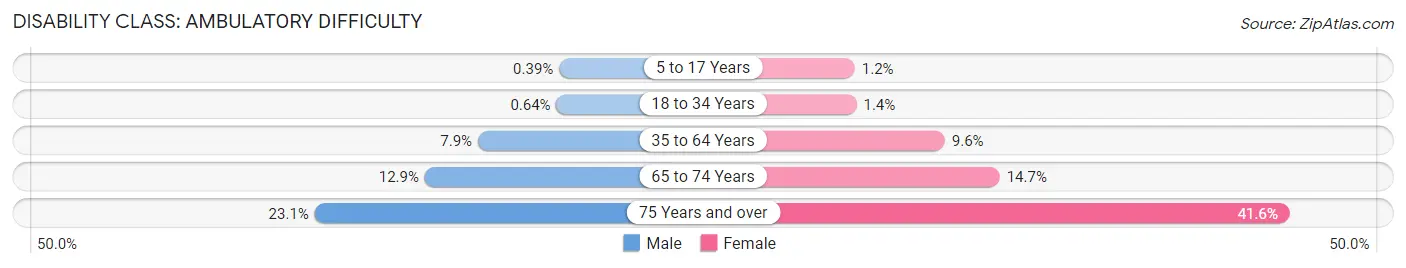
| Age Bracket | Male | Female |
| 5 to 17 Years | 6 (0.4%) | 18 (1.2%) |
| 18 to 34 Years | 18 (0.6%) | 40 (1.4%) |
| 35 to 64 Years | 289 (7.9%) | 373 (9.6%) |
| 65 to 74 Years | 148 (12.9%) | 186 (14.7%) |
| 75 Years and over | 144 (23.1%) | 375 (41.6%) |
Disability Class: Self-Care Difficulty
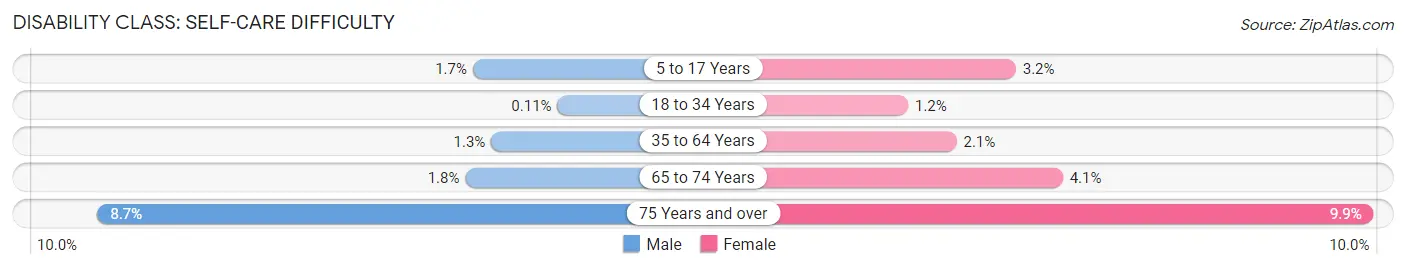
| Age Bracket | Male | Female |
| 5 to 17 Years | 26 (1.7%) | 48 (3.2%) |
| 18 to 34 Years | 3 (0.1%) | 36 (1.2%) |
| 35 to 64 Years | 49 (1.3%) | 83 (2.1%) |
| 65 to 74 Years | 21 (1.8%) | 52 (4.1%) |
| 75 Years and over | 54 (8.6%) | 89 (9.9%) |
Technology Access in Somerset County
Computing Device Access in Somerset County
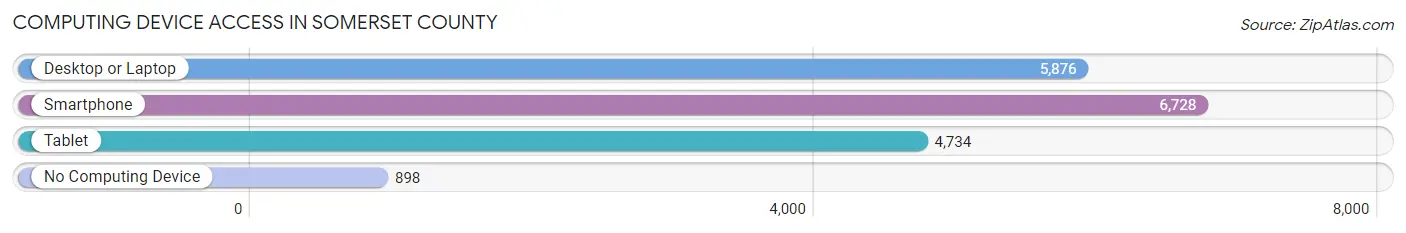
| Device Type | # Households | % Households |
| Desktop or Laptop | 5,876 | 70.3% |
| Smartphone | 6,728 | 80.5% |
| Tablet | 4,734 | 56.7% |
| No Computing Device | 898 | 10.7% |
| Total | 8,355 | 100.0% |
Internet Access in Somerset County
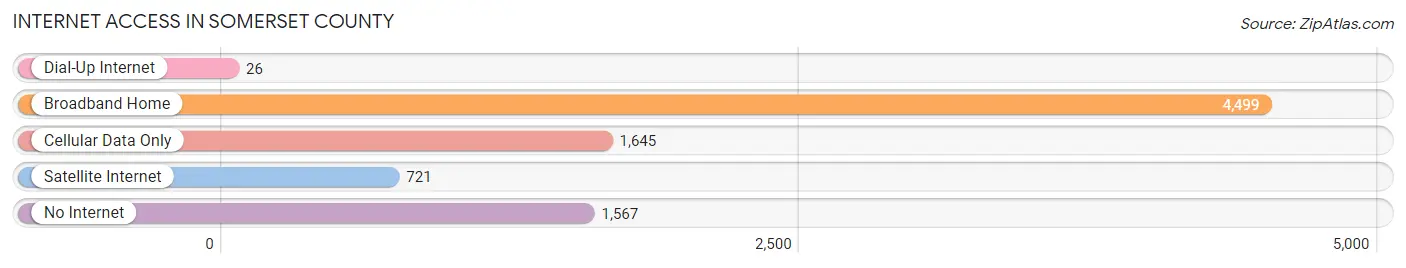
| Internet Type | # Households | % Households |
| Dial-Up Internet | 26 | 0.3% |
| Broadband Home | 4,499 | 53.8% |
| Cellular Data Only | 1,645 | 19.7% |
| Satellite Internet | 721 | 8.6% |
| No Internet | 1,567 | 18.8% |
| Total | 8,355 | 100.0% |
Somerset County Summary
Somerset County is a county located in the state of Maryland, United States. As of the 2010 census, the population was 26,470. Its county seat is Princess Anne. The county was named for Mary, Lady Somerset, the wife of Sir John Somerset, a son of Henry Somerset, 1st Marquess of Worcester.
History
Somerset County was established in 1666, when it was part of the Province of Maryland. It was one of the original counties of the Province of Maryland, and was created from parts of St. Mary's and Worcester counties. The county was named for Mary, Lady Somerset, the wife of Sir John Somerset, a son of Henry Somerset, 1st Marquess of Worcester.
The county was divided into three districts in 1672, and the county seat was established at Princess Anne in 1706. The county was divided into five districts in 1776, and the county seat was moved to Princess Anne in 1791.
Geography
Somerset County is located in the eastern part of the state of Maryland, on the Atlantic coast. It is bordered by Wicomico County to the north, Worcester County to the east, and Accomack County, Virginia to the south. The county has a total area of 517 square miles, of which 498 square miles is land and 19 square miles is water.
The county is located in the Atlantic Coastal Plain region of Maryland, and is mostly flat and low-lying. The highest point in the county is a hill near the town of Westover, which has an elevation of 75 feet. The county is drained by the Manokin River and the Nanticoke River.
Economy
Somerset County has a diverse economy, with a mix of agriculture, manufacturing, and tourism. The county is home to several large poultry farms, as well as a number of smaller farms that produce vegetables, fruits, and other crops. The county is also home to several manufacturing companies, including a large paper mill in Princess Anne.
Tourism is an important part of the county's economy, with many visitors coming to the area to enjoy the beaches, fishing, and other outdoor activities. The county is also home to several historic sites, including the Somerset County Courthouse, the Somerset County Jail, and the Somerset County Museum.
Demographics
As of the 2010 census, there were 26,470 people, 9,945 households, and 6,945 families living in the county. The population density was 53 people per square mile. There were 11,093 housing units at an average density of 22 per square mile. The racial makeup of the county was 68.2% White, 28.2% African American, 0.4% Native American, 0.7% Asian, 0.1% Pacific Islander, 0.7% from other races, and 1.7% from two or more races. Hispanic or Latino of any race were 2.3% of the population.
The median income for a household in the county was $37,945, and the median income for a family was $45,945. Males had a median income of $35,945 versus $27,945 for females. The per capita income for the county was $18,945. About 11.2% of families and 14.2% of the population were below the poverty line, including 19.2% of those under age 18 and 10.2% of those age 65 or over.
Common Questions
What is the Total Population of Somerset County?
Total Population of Somerset County is 24,672.
What is the Total Male Population of Somerset County?
Total Male Population of Somerset County is 13,521.
What is the Total Female Population of Somerset County?
Total Female Population of Somerset County is 11,151.
What is the Ratio of Males per 100 Females in Somerset County?
There are 121.25 Males per 100 Females in Somerset County.
What is the Ratio of Females per 100 Males in Somerset County?
There are 82.47 Females per 100 Males in Somerset County.
What is the Median Population Age in Somerset County?
Median Population Age in Somerset County is 38.0 Years.
What is the Average Family Size in Somerset County
Average Family Size in Somerset County is 2.9 People.
What is the Average Household Size in Somerset County
Average Household Size in Somerset County is 2.4 People.
What is Per Capita Income in Somerset County?
Per Capita income in Somerset County is $24,176.
What is the Median Family Income in Somerset County?
Median Family Income in Somerset County is $66,215.
What is the Median Household income in Somerset County?
Median Household Income in Somerset County is $52,149.
What is Income or Wage Gap in Somerset County?
Income or Wage Gap in Somerset County is 5.9%.
Women in Somerset County earn 94.1 cents for every dollar earned by a man.
What is Family Income Deficit in Somerset County?
Family Income Deficit in Somerset County is $10,341.
Families that are below poverty line in Somerset County earn $10,341 less on average than the poverty threshold level.
What is Inequality or Gini Index in Somerset County?
Inequality or Gini Index in Somerset County is 0.46.
How Large is the Labor Force in Somerset County?
There are 10,389 People in the Labor Forcein in Somerset County.
What is the Percentage of People in the Labor Force in Somerset County?
49.3% of People are in the Labor Force in Somerset County.
What is the Unemployment Rate in Somerset County?
Unemployment Rate in Somerset County is 7.0%.