Queen Anne's County, MD
Queen Anne's County Overview
50,316
TOTAL POPULATION
25,045
MALE POPULATION
25,271
FEMALE POPULATION
99.11
MALES / 100 FEMALES
100.90
FEMALES / 100 MALES
44.6
MEDIAN AGE
3.0
AVG FAMILY SIZE
2.6
AVG HOUSEHOLD SIZE
$52,652
PER CAPITA INCOME
$124,326
AVG FAMILY INCOME
$108,332
AVG HOUSEHOLD INCOME
35.2%
WAGE / INCOME GAP [ % ]
64.8¢/ $1
WAGE / INCOME GAP [ $ ]
0.43
INEQUALITY / GINI INDEX
27,243
LABOR FORCE [ PEOPLE ]
66.6%
PERCENT IN LABOR FORCE
3.6%
UNEMPLOYMENT RATE
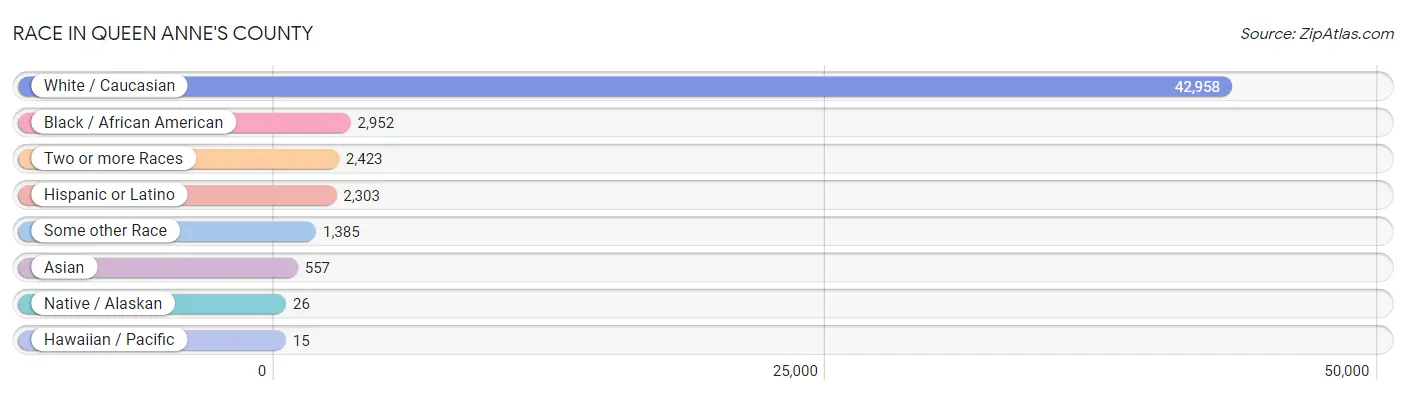
Race in Queen Anne's County
The most populous races in Queen Anne's County are White / Caucasian (42,958 | 85.4%), Black / African American (2,952 | 5.9%), and Two or more Races (2,423 | 4.8%).
| Race | # Population | % Population |
| Asian | 557 | 1.1% |
| Black / African American | 2,952 | 5.9% |
| Hawaiian / Pacific | 15 | 0.0% |
| Hispanic or Latino | 2,303 | 4.6% |
| Native / Alaskan | 26 | 0.1% |
| White / Caucasian | 42,958 | 85.4% |
| Two or more Races | 2,423 | 4.8% |
| Some other Race | 1,385 | 2.8% |
| Total | 50,316 | 100.0% |
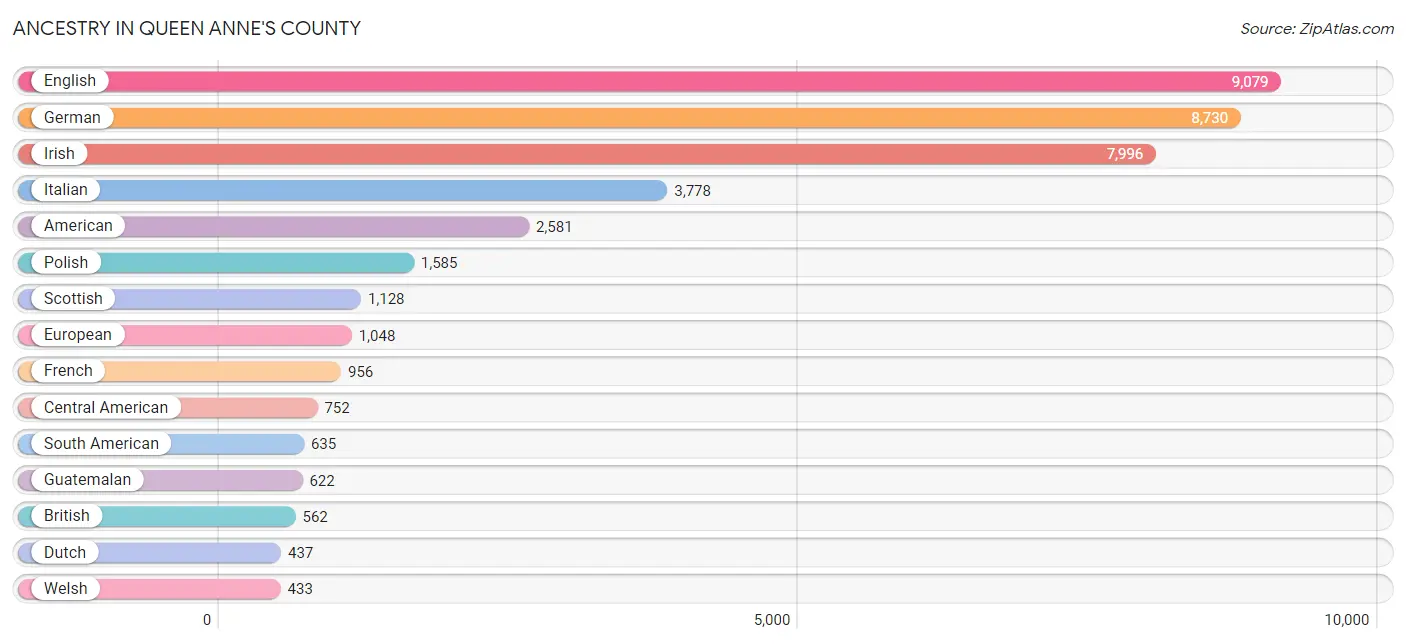
Ancestry in Queen Anne's County
The most populous ancestries reported in Queen Anne's County are English (9,079 | 18.0%), German (8,730 | 17.3%), Irish (7,996 | 15.9%), Italian (3,778 | 7.5%), and American (2,581 | 5.1%), together accounting for 63.9% of all Queen Anne's County residents.
| Ancestry | # Population | % Population |
| African | 88 | 0.2% |
| Albanian | 18 | 0.0% |
| American | 2,581 | 5.1% |
| Arab | 15 | 0.0% |
| Argentinean | 16 | 0.0% |
| Armenian | 41 | 0.1% |
| Australian | 11 | 0.0% |
| Austrian | 182 | 0.4% |
| Basque | 15 | 0.0% |
| Belgian | 19 | 0.0% |
| Belizean | 4 | 0.0% |
| Bhutanese | 143 | 0.3% |
| Blackfeet | 53 | 0.1% |
| Brazilian | 28 | 0.1% |
| British | 562 | 1.1% |
| Burmese | 187 | 0.4% |
| Canadian | 30 | 0.1% |
| Central American | 752 | 1.5% |
| Central American Indian | 16 | 0.0% |
| Cherokee | 26 | 0.1% |
| Chilean | 4 | 0.0% |
| Chinese | 25 | 0.1% |
| Choctaw | 5 | 0.0% |
| Colombian | 20 | 0.0% |
| Croatian | 11 | 0.0% |
| Cuban | 86 | 0.2% |
| Czech | 116 | 0.2% |
| Czechoslovakian | 15 | 0.0% |
| Danish | 45 | 0.1% |
| Dominican | 9 | 0.0% |
| Dutch | 437 | 0.9% |
| Eastern European | 239 | 0.5% |
| Ecuadorian | 267 | 0.5% |
| English | 9,079 | 18.0% |
| Estonian | 29 | 0.1% |
| Ethiopian | 119 | 0.2% |
| European | 1,048 | 2.1% |
| Finnish | 3 | 0.0% |
| French | 956 | 1.9% |
| French Canadian | 201 | 0.4% |
| German | 8,730 | 17.3% |
| Greek | 353 | 0.7% |
| Guatemalan | 622 | 1.2% |
| Hungarian | 357 | 0.7% |
| Indian (Asian) | 235 | 0.5% |
| Irish | 7,996 | 15.9% |
| Italian | 3,778 | 7.5% |
| Jamaican | 25 | 0.1% |
| Korean | 276 | 0.5% |
| Laotian | 31 | 0.1% |
| Latvian | 48 | 0.1% |
| Lebanese | 2 | 0.0% |
| Lithuanian | 233 | 0.5% |
| Lumbee | 15 | 0.0% |
| Macedonian | 7 | 0.0% |
| Mexican | 382 | 0.8% |
| Mexican American Indian | 2 | 0.0% |
| Moroccan | 13 | 0.0% |
| Native Hawaiian | 15 | 0.0% |
| Navajo | 2 | 0.0% |
| Nigerian | 6 | 0.0% |
| Northern European | 138 | 0.3% |
| Norwegian | 415 | 0.8% |
| Panamanian | 20 | 0.0% |
| Pennsylvania German | 71 | 0.1% |
| Peruvian | 253 | 0.5% |
| Polish | 1,585 | 3.2% |
| Portuguese | 16 | 0.0% |
| Puerto Rican | 108 | 0.2% |
| Romanian | 12 | 0.0% |
| Russian | 208 | 0.4% |
| Salvadoran | 110 | 0.2% |
| Scandinavian | 61 | 0.1% |
| Scotch-Irish | 376 | 0.7% |
| Scottish | 1,128 | 2.2% |
| Sierra Leonean | 4 | 0.0% |
| Slovak | 162 | 0.3% |
| Slovene | 21 | 0.0% |
| South American | 635 | 1.3% |
| Spaniard | 81 | 0.2% |
| Spanish | 132 | 0.3% |
| Subsaharan African | 234 | 0.5% |
| Swedish | 404 | 0.8% |
| Swiss | 52 | 0.1% |
| Thai | 38 | 0.1% |
| Turkish | 44 | 0.1% |
| Ukrainian | 182 | 0.4% |
| Venezuelan | 75 | 0.2% |
| Welsh | 433 | 0.9% |
| West Indian | 5 | 0.0% | View All 90 Rows |
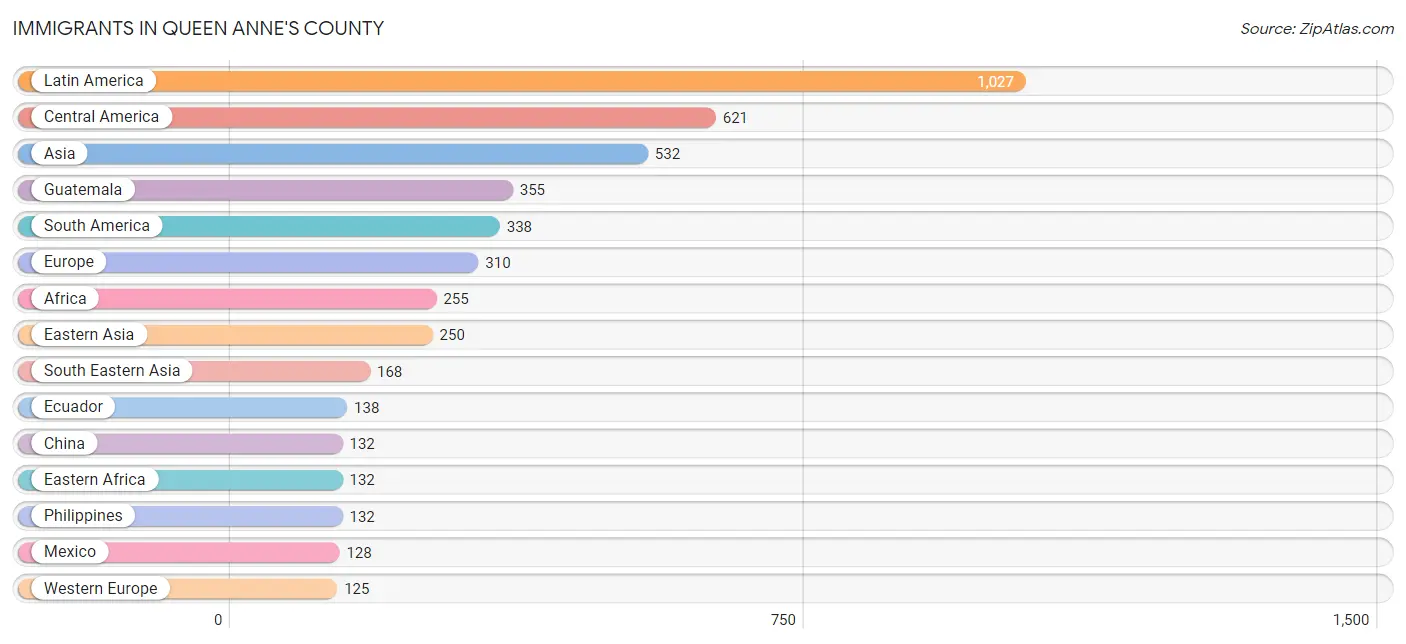
Immigrants in Queen Anne's County
The most numerous immigrant groups reported in Queen Anne's County came from Latin America (1,027 | 2.0%), Central America (621 | 1.2%), Asia (532 | 1.1%), Guatemala (355 | 0.7%), and South America (338 | 0.7%), together accounting for 5.7% of all Queen Anne's County residents.
| Immigration Origin | # Population | % Population |
| Africa | 255 | 0.5% |
| Argentina | 23 | 0.1% |
| Asia | 532 | 1.1% |
| Australia | 11 | 0.0% |
| Austria | 11 | 0.0% |
| Bangladesh | 14 | 0.0% |
| Belize | 4 | 0.0% |
| Brazil | 19 | 0.0% |
| Canada | 13 | 0.0% |
| Caribbean | 68 | 0.1% |
| Central America | 621 | 1.2% |
| Chile | 4 | 0.0% |
| China | 132 | 0.3% |
| Colombia | 5 | 0.0% |
| Cuba | 45 | 0.1% |
| Denmark | 6 | 0.0% |
| Dominican Republic | 9 | 0.0% |
| Eastern Africa | 132 | 0.3% |
| Eastern Asia | 250 | 0.5% |
| Eastern Europe | 16 | 0.0% |
| Ecuador | 138 | 0.3% |
| El Salvador | 93 | 0.2% |
| England | 22 | 0.0% |
| Ethiopia | 119 | 0.2% |
| Europe | 310 | 0.6% |
| Germany | 89 | 0.2% |
| Greece | 8 | 0.0% |
| Guatemala | 355 | 0.7% |
| India | 20 | 0.0% |
| Indonesia | 36 | 0.1% |
| Ireland | 10 | 0.0% |
| Israel | 10 | 0.0% |
| Italy | 65 | 0.1% |
| Jamaica | 9 | 0.0% |
| Japan | 30 | 0.1% |
| Korea | 88 | 0.2% |
| Latin America | 1,027 | 2.0% |
| Mexico | 128 | 0.3% |
| Morocco | 13 | 0.0% |
| Netherlands | 25 | 0.1% |
| Nicaragua | 21 | 0.0% |
| Nigeria | 22 | 0.0% |
| Northern Africa | 13 | 0.0% |
| Northern Europe | 51 | 0.1% |
| Oceania | 11 | 0.0% |
| Panama | 20 | 0.0% |
| Peru | 114 | 0.2% |
| Philippines | 132 | 0.3% |
| Poland | 16 | 0.0% |
| Portugal | 10 | 0.0% |
| South Africa | 52 | 0.1% |
| South America | 338 | 0.7% |
| South Central Asia | 34 | 0.1% |
| South Eastern Asia | 168 | 0.3% |
| Southern Europe | 118 | 0.2% |
| Spain | 35 | 0.1% |
| Trinidad and Tobago | 5 | 0.0% |
| Turkey | 44 | 0.1% |
| Venezuela | 35 | 0.1% |
| Western Africa | 22 | 0.0% |
| Western Asia | 80 | 0.2% |
| Western Europe | 125 | 0.3% | View All 62 Rows |
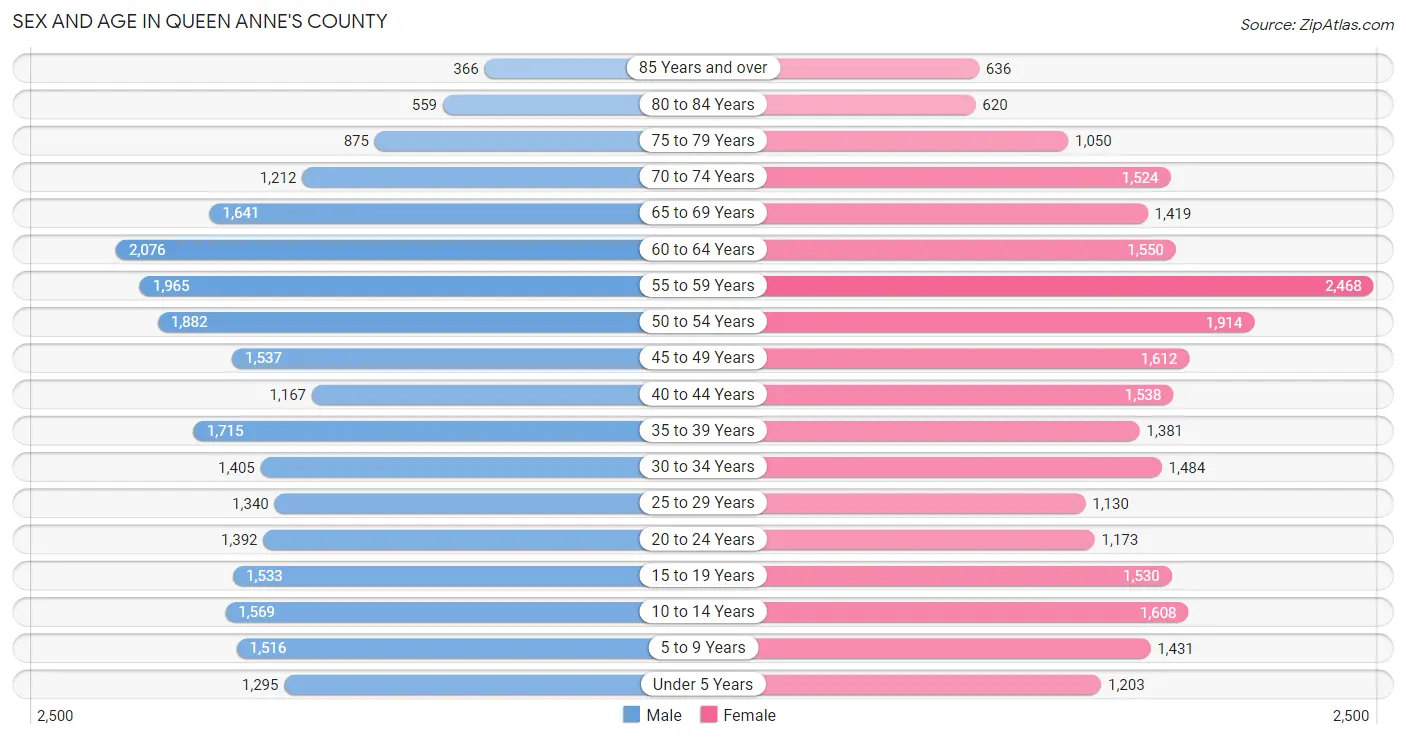
Sex and Age in Queen Anne's County
Sex and Age in Queen Anne's County
The most populous age groups in Queen Anne's County are 60 to 64 Years (2,076 | 8.3%) for men and 55 to 59 Years (2,468 | 9.8%) for women.
| Age Bracket | Male | Female |
| Under 5 Years | 1,295 (5.2%) | 1,203 (4.8%) |
| 5 to 9 Years | 1,516 (6.0%) | 1,431 (5.7%) |
| 10 to 14 Years | 1,569 (6.3%) | 1,608 (6.4%) |
| 15 to 19 Years | 1,533 (6.1%) | 1,530 (6.0%) |
| 20 to 24 Years | 1,392 (5.6%) | 1,173 (4.6%) |
| 25 to 29 Years | 1,340 (5.3%) | 1,130 (4.5%) |
| 30 to 34 Years | 1,405 (5.6%) | 1,484 (5.9%) |
| 35 to 39 Years | 1,715 (6.9%) | 1,381 (5.5%) |
| 40 to 44 Years | 1,167 (4.7%) | 1,538 (6.1%) |
| 45 to 49 Years | 1,537 (6.1%) | 1,612 (6.4%) |
| 50 to 54 Years | 1,882 (7.5%) | 1,914 (7.6%) |
| 55 to 59 Years | 1,965 (7.9%) | 2,468 (9.8%) |
| 60 to 64 Years | 2,076 (8.3%) | 1,550 (6.1%) |
| 65 to 69 Years | 1,641 (6.6%) | 1,419 (5.6%) |
| 70 to 74 Years | 1,212 (4.8%) | 1,524 (6.0%) |
| 75 to 79 Years | 875 (3.5%) | 1,050 (4.2%) |
| 80 to 84 Years | 559 (2.2%) | 620 (2.5%) |
| 85 Years and over | 366 (1.5%) | 636 (2.5%) |
| Total | 25,045 (100.0%) | 25,271 (100.0%) |
Families and Households in Queen Anne's County
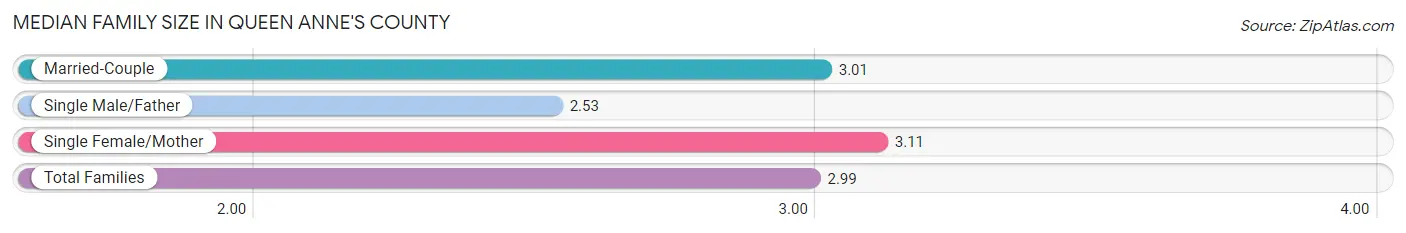
Median Family Size in Queen Anne's County
The median family size in Queen Anne's County is 2.99 persons per family, with single female/mother families (1,748 | 12.2%) accounting for the largest median family size of 3.11 persons per family. On the other hand, single male/father families (963 | 6.7%) represent the smallest median family size with 2.53 persons per family.
| Family Type | # Families | Family Size |
| Married-Couple | 11,588 (81.0%) | 3.01 |
| Single Male/Father | 963 (6.7%) | 2.53 |
| Single Female/Mother | 1,748 (12.2%) | 3.11 |
| Total Families | 14,299 (100.0%) | 2.99 |
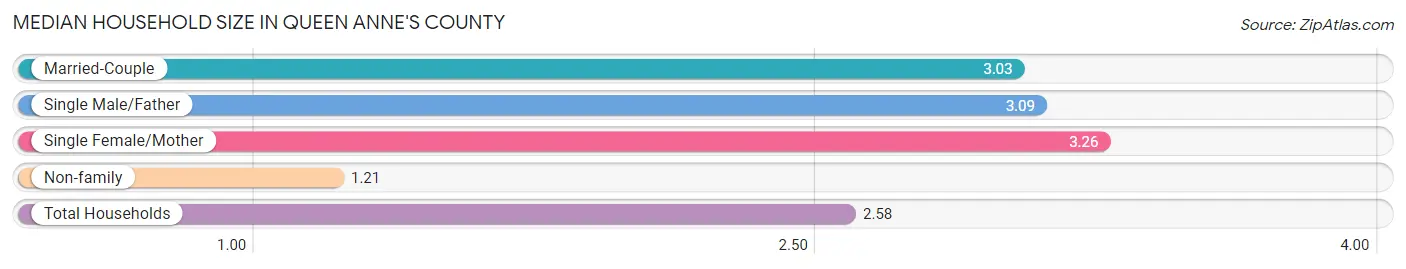
Median Household Size in Queen Anne's County
The median household size in Queen Anne's County is 2.58 persons per household, with single female/mother households (1,748 | 9.0%) accounting for the largest median household size of 3.26 persons per household. non-family households (5,052 | 26.1%) represent the smallest median household size with 1.21 persons per household.
| Household Type | # Households | Household Size |
| Married-Couple | 11,588 (59.9%) | 3.03 |
| Single Male/Father | 963 (5.0%) | 3.09 |
| Single Female/Mother | 1,748 (9.0%) | 3.26 |
| Non-family | 5,052 (26.1%) | 1.21 |
| Total Households | 19,351 (100.0%) | 2.58 |
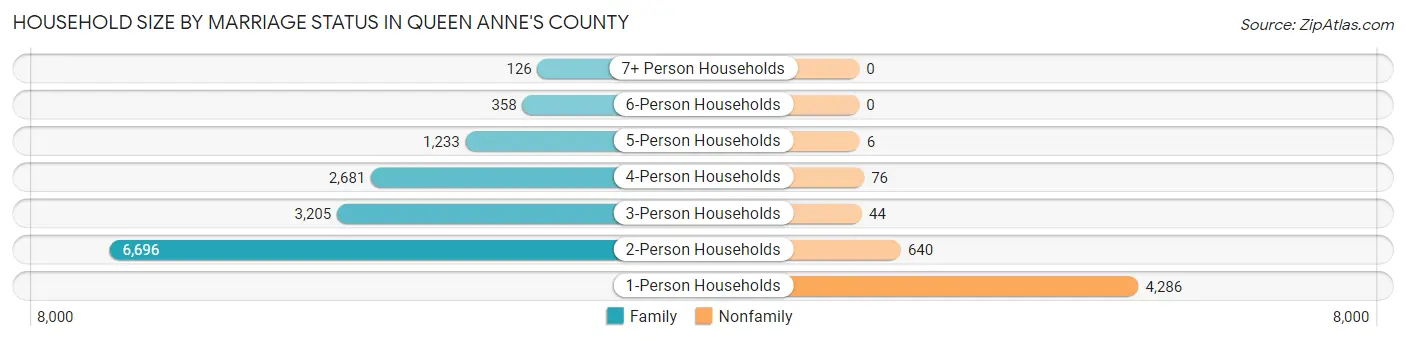
Household Size by Marriage Status in Queen Anne's County
Out of a total of 19,351 households in Queen Anne's County, 14,299 (73.9%) are family households, while 5,052 (26.1%) are nonfamily households. The most numerous type of family households are 2-person households, comprising 6,696, and the most common type of nonfamily households are 1-person households, comprising 4,286.
| Household Size | Family Households | Nonfamily Households |
| 1-Person Households | - | 4,286 (22.2%) |
| 2-Person Households | 6,696 (34.6%) | 640 (3.3%) |
| 3-Person Households | 3,205 (16.6%) | 44 (0.2%) |
| 4-Person Households | 2,681 (13.9%) | 76 (0.4%) |
| 5-Person Households | 1,233 (6.4%) | 6 (0.0%) |
| 6-Person Households | 358 (1.8%) | 0 (0.0%) |
| 7+ Person Households | 126 (0.6%) | 0 (0.0%) |
| Total | 14,299 (73.9%) | 5,052 (26.1%) |
Female Fertility in Queen Anne's County
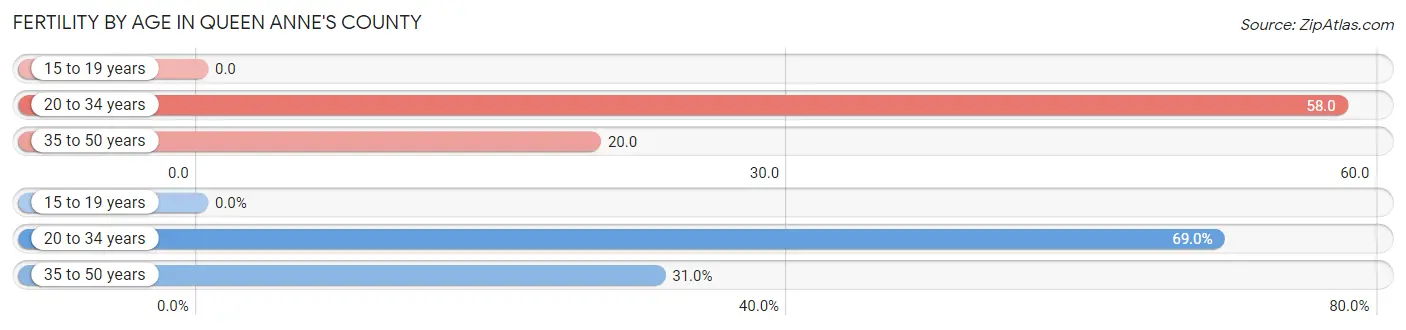
Fertility by Age in Queen Anne's County
Average fertility rate in Queen Anne's County is 31.0 births per 1,000 women. Women in the age bracket of 20 to 34 years have the highest fertility rate with 58.0 births per 1,000 women. Women in the age bracket of 20 to 34 years acount for 69.0% of all women with births.
| Age Bracket | Women with Births | Births / 1,000 Women |
| 15 to 19 years | 0 (0.0%) | 0.0 |
| 20 to 34 years | 220 (69.0%) | 58.0 |
| 35 to 50 years | 99 (31.0%) | 20.0 |
| Total | 319 (100.0%) | 31.0 |
Fertility by Age by Marriage Status in Queen Anne's County
95.0% of women with births (319) in Queen Anne's County are married. The highest percentage of unmarried women with births falls into 20 to 34 years age bracket with 7.3% of them unmarried at the time of birth, while the lowest percentage of unmarried women with births belong to 35 to 50 years age bracket with 0.0% of them unmarried.
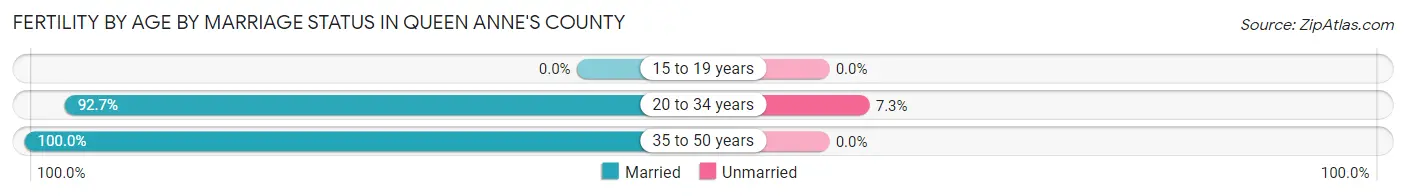
| Age Bracket | Married | Unmarried |
| 15 to 19 years | 0 (0.0%) | 0 (0.0%) |
| 20 to 34 years | 204 (92.7%) | 16 (7.3%) |
| 35 to 50 years | 99 (100.0%) | 0 (0.0%) |
| Total | 303 (95.0%) | 16 (5.0%) |
Fertility by Education in Queen Anne's County
Average fertility rate in Queen Anne's County is 31.0 births per 1,000 women. Women with the education attainment of graduate degree have the highest fertility rate of 59.0 births per 1,000 women, while women with the education attainment of less than high school have the lowest fertility at 8.0 births per 1,000 women. Women with the education attainment of bachelor's degree represent 41.1% of all women with births.
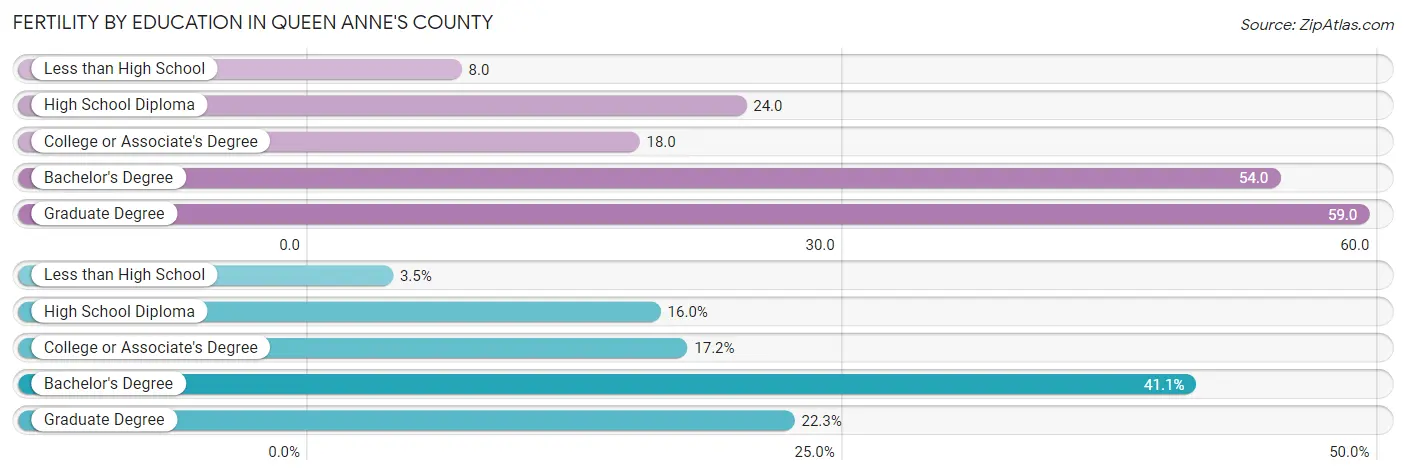
| Educational Attainment | Women with Births | Births / 1,000 Women |
| Less than High School | 11 (3.5%) | 8.0 |
| High School Diploma | 51 (16.0%) | 24.0 |
| College or Associate's Degree | 55 (17.2%) | 18.0 |
| Bachelor's Degree | 131 (41.1%) | 54.0 |
| Graduate Degree | 71 (22.3%) | 59.0 |
| Total | 319 (100.0%) | 31.0 |
Fertility by Education by Marriage Status in Queen Anne's County
5.0% of women with births in Queen Anne's County are unmarried. Women with the educational attainment of college or associate's degree are most likely to be married with 100.0% of them married at childbirth, while women with the educational attainment of high school diploma are least likely to be married with 29.4% of them unmarried at childbirth.
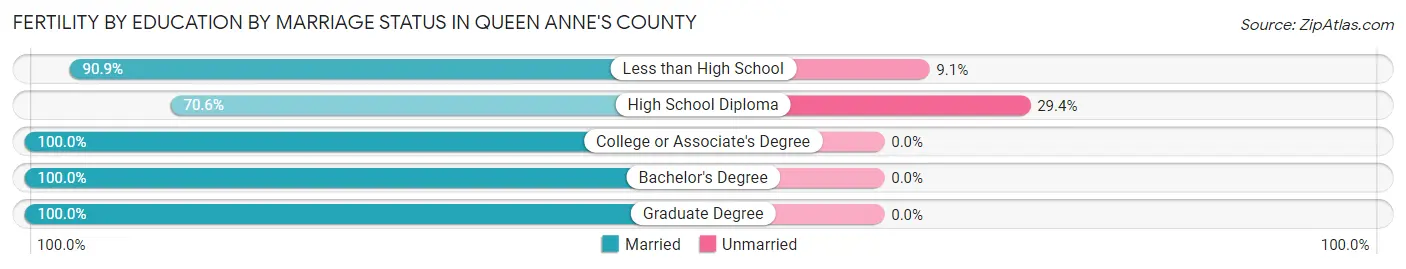
| Educational Attainment | Married | Unmarried |
| Less than High School | 10 (90.9%) | 1 (9.1%) |
| High School Diploma | 36 (70.6%) | 15 (29.4%) |
| College or Associate's Degree | 55 (100.0%) | 0 (0.0%) |
| Bachelor's Degree | 131 (100.0%) | 0 (0.0%) |
| Graduate Degree | 71 (100.0%) | 0 (0.0%) |
| Total | 303 (95.0%) | 16 (5.0%) |
Income in Queen Anne's County
Income Overview in Queen Anne's County
Per Capita Income in Queen Anne's County is $52,652, while median incomes of families and households are $124,326 and $108,332 respectively.
| Characteristic | Number | Measure |
| Per Capita Income | 50,316 | $52,652 |
| Median Family Income | 14,299 | $124,326 |
| Mean Family Income | 14,299 | $155,284 |
| Median Household Income | 19,351 | $108,332 |
| Mean Household Income | 19,351 | $134,896 |
| Income Deficit | 14,299 | $0 |
| Wage / Income Gap (%) | 50,316 | 35.22% |
| Wage / Income Gap ($) | 50,316 | 64.78¢ per $1 |
| Gini / Inequality Index | 50,316 | 0.43 |
Earnings by Sex in Queen Anne's County
Average Earnings in Queen Anne's County are $54,721, $65,781 for men and $42,610 for women, a difference of 35.2%.
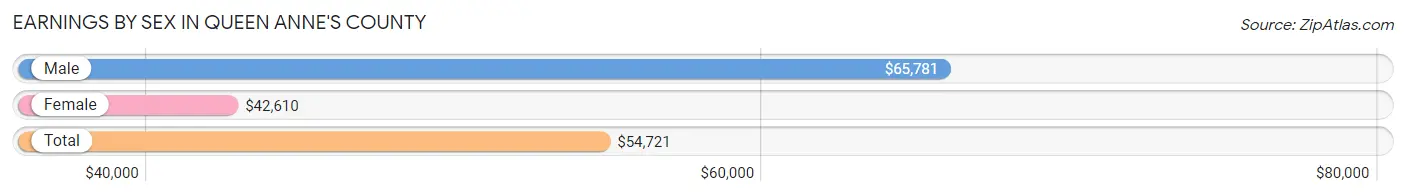
| Sex | Number | Average Earnings |
| Male | 15,024 (52.7%) | $65,781 |
| Female | 13,480 (47.3%) | $42,610 |
| Total | 28,504 (100.0%) | $54,721 |
Earnings by Sex by Income Bracket in Queen Anne's County
The most common earnings brackets in Queen Anne's County are $100,000+ for men (4,594 | 30.6%) and $100,000+ for women (1,702 | 12.6%).
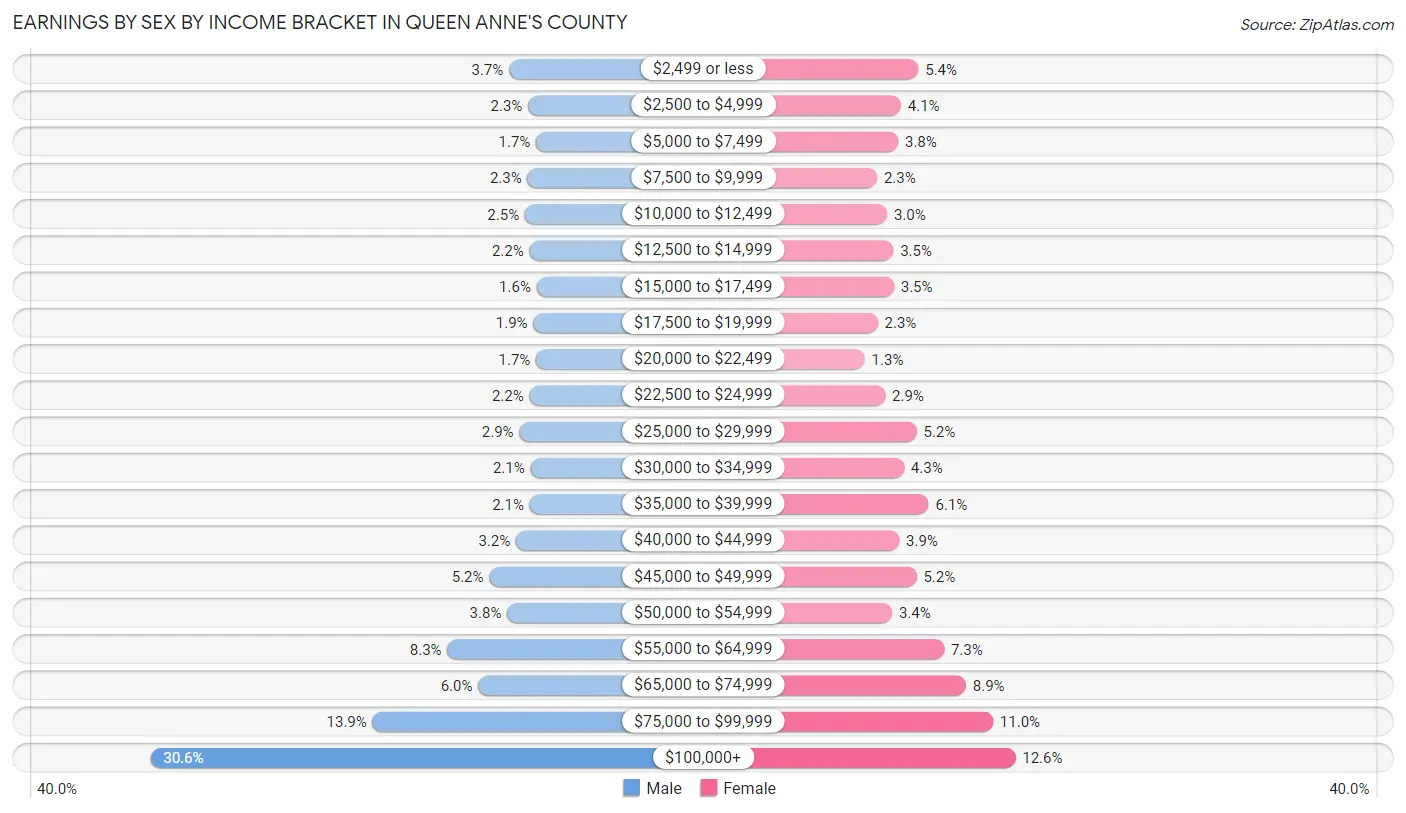
| Income | Male | Female |
| $2,499 or less | 554 (3.7%) | 722 (5.4%) |
| $2,500 to $4,999 | 340 (2.3%) | 546 (4.1%) |
| $5,000 to $7,499 | 249 (1.7%) | 518 (3.8%) |
| $7,500 to $9,999 | 347 (2.3%) | 305 (2.3%) |
| $10,000 to $12,499 | 375 (2.5%) | 406 (3.0%) |
| $12,500 to $14,999 | 324 (2.2%) | 469 (3.5%) |
| $15,000 to $17,499 | 243 (1.6%) | 475 (3.5%) |
| $17,500 to $19,999 | 281 (1.9%) | 312 (2.3%) |
| $20,000 to $22,499 | 250 (1.7%) | 180 (1.3%) |
| $22,500 to $24,999 | 324 (2.2%) | 387 (2.9%) |
| $25,000 to $29,999 | 438 (2.9%) | 705 (5.2%) |
| $30,000 to $34,999 | 312 (2.1%) | 577 (4.3%) |
| $35,000 to $39,999 | 322 (2.1%) | 826 (6.1%) |
| $40,000 to $44,999 | 476 (3.2%) | 529 (3.9%) |
| $45,000 to $49,999 | 777 (5.2%) | 704 (5.2%) |
| $50,000 to $54,999 | 576 (3.8%) | 457 (3.4%) |
| $55,000 to $64,999 | 1,249 (8.3%) | 982 (7.3%) |
| $65,000 to $74,999 | 901 (6.0%) | 1,202 (8.9%) |
| $75,000 to $99,999 | 2,092 (13.9%) | 1,476 (11.0%) |
| $100,000+ | 4,594 (30.6%) | 1,702 (12.6%) |
| Total | 15,024 (100.0%) | 13,480 (100.0%) |
Earnings by Sex by Educational Attainment in Queen Anne's County
Average earnings in Queen Anne's County are $76,181 for men and $47,640 for women, a difference of 37.5%. Men with an educational attainment of graduate degree enjoy the highest average annual earnings of $116,414, while those with less than high school education earn the least with $43,030. Women with an educational attainment of graduate degree earn the most with the average annual earnings of $71,021, while those with less than high school education have the smallest earnings of $25,024.
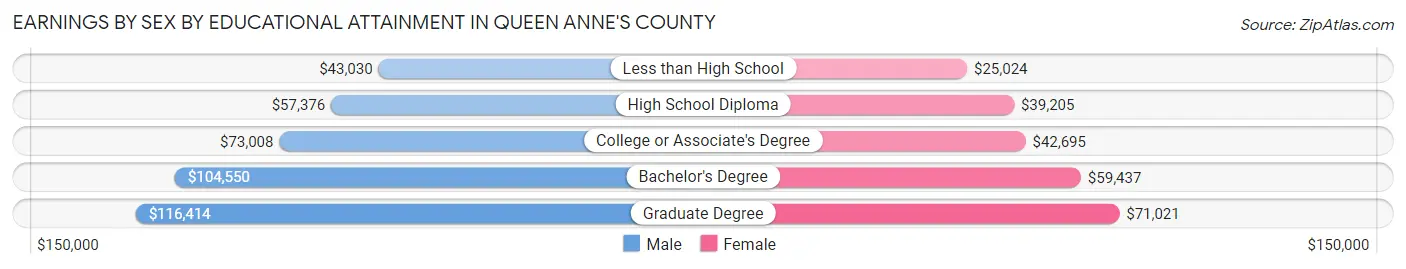
| Educational Attainment | Male Income | Female Income |
| Less than High School | $43,030 | $25,024 |
| High School Diploma | $57,376 | $39,205 |
| College or Associate's Degree | $73,008 | $42,695 |
| Bachelor's Degree | $104,550 | $59,437 |
| Graduate Degree | $116,414 | $71,021 |
| Total | $76,181 | $47,640 |
Family Income in Queen Anne's County
Family Income Brackets in Queen Anne's County
According to the Queen Anne's County family income data, there are 3,403 families falling into the $100,000 to $149,999 income range, which is the most common income bracket and makes up 23.8% of all families. Conversely, the $10,000 to $14,999 income bracket is the least frequent group with only 100 families (0.7%) belonging to this category.
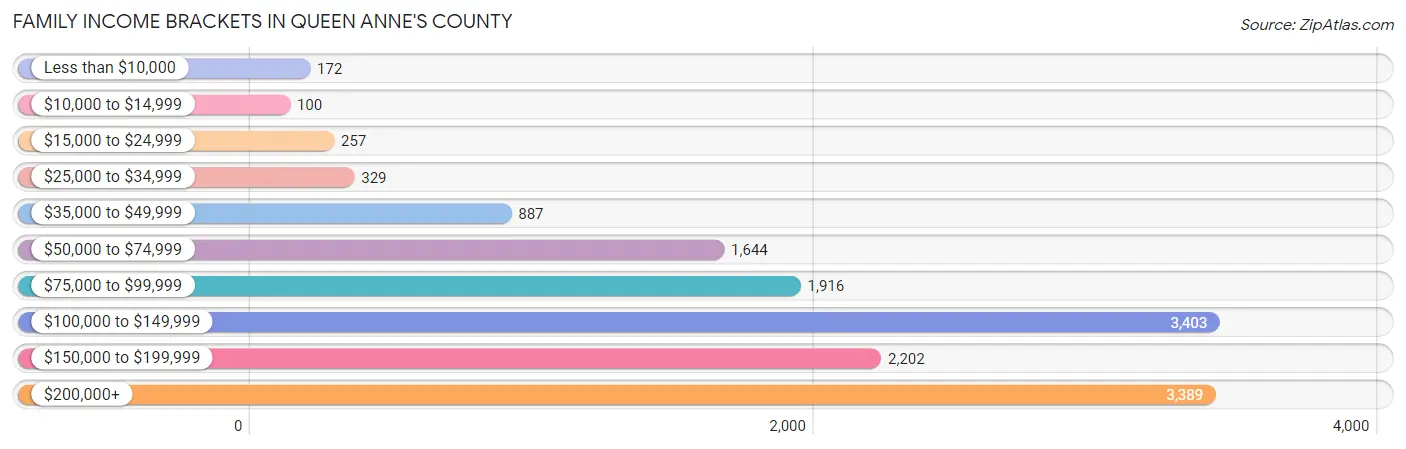
| Income Bracket | # Families | % Families |
| Less than $10,000 | 172 | 1.2% |
| $10,000 to $14,999 | 100 | 0.7% |
| $15,000 to $24,999 | 257 | 1.8% |
| $25,000 to $34,999 | 329 | 2.3% |
| $35,000 to $49,999 | 887 | 6.2% |
| $50,000 to $74,999 | 1,644 | 11.5% |
| $75,000 to $99,999 | 1,916 | 13.4% |
| $100,000 to $149,999 | 3,403 | 23.8% |
| $150,000 to $199,999 | 2,202 | 15.4% |
| $200,000+ | 3,389 | 23.7% |
Family Income by Famaliy Size in Queen Anne's County
6-person families (295 | 2.1%) account for the highest median family income in Queen Anne's County with $190,781 per family, while 2-person families (7,097 | 49.6%) have the highest median income of $57,181 per family member.
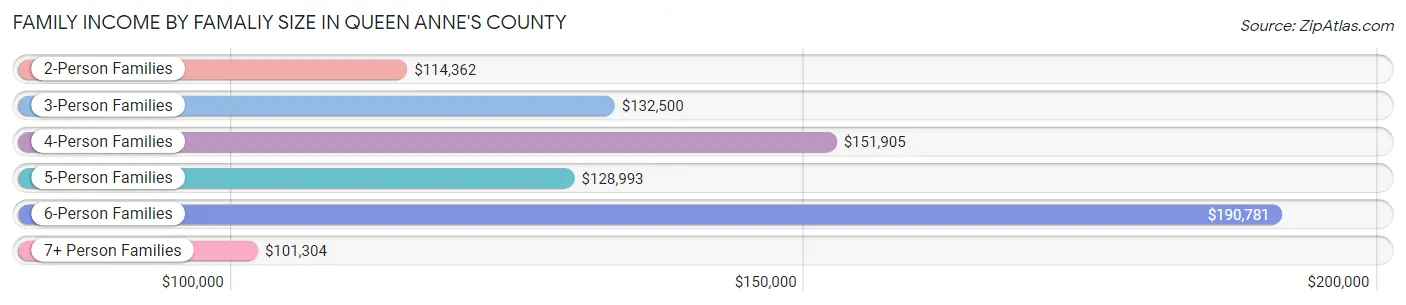
| Income Bracket | # Families | Median Income |
| 2-Person Families | 7,097 (49.6%) | $114,362 |
| 3-Person Families | 3,216 (22.5%) | $132,500 |
| 4-Person Families | 2,416 (16.9%) | $151,905 |
| 5-Person Families | 1,149 (8.0%) | $128,993 |
| 6-Person Families | 295 (2.1%) | $190,781 |
| 7+ Person Families | 126 (0.9%) | $101,304 |
| Total | 14,299 (100.0%) | $124,326 |
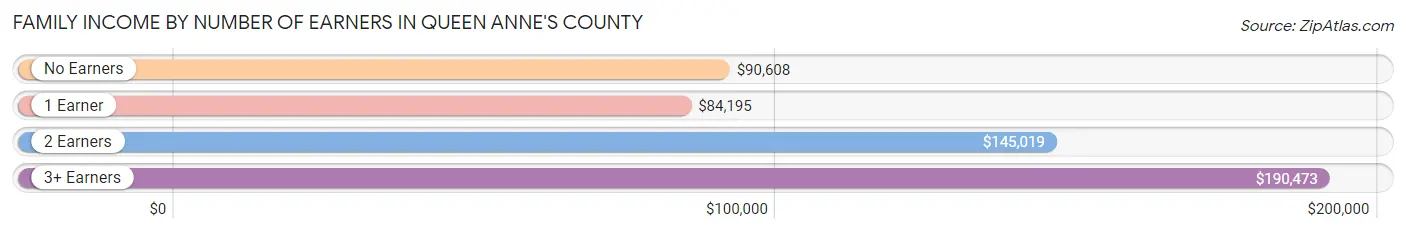
Family Income by Number of Earners in Queen Anne's County
The median family income in Queen Anne's County is $124,326, with families comprising 3+ earners (1,978) having the highest median family income of $190,473, while families with 1 earner (3,666) have the lowest median family income of $84,195, accounting for 13.8% and 25.6% of families, respectively.
| Number of Earners | # Families | Median Income |
| No Earners | 1,922 (13.4%) | $90,608 |
| 1 Earner | 3,666 (25.6%) | $84,195 |
| 2 Earners | 6,733 (47.1%) | $145,019 |
| 3+ Earners | 1,978 (13.8%) | $190,473 |
| Total | 14,299 (100.0%) | $124,326 |
Household Income in Queen Anne's County
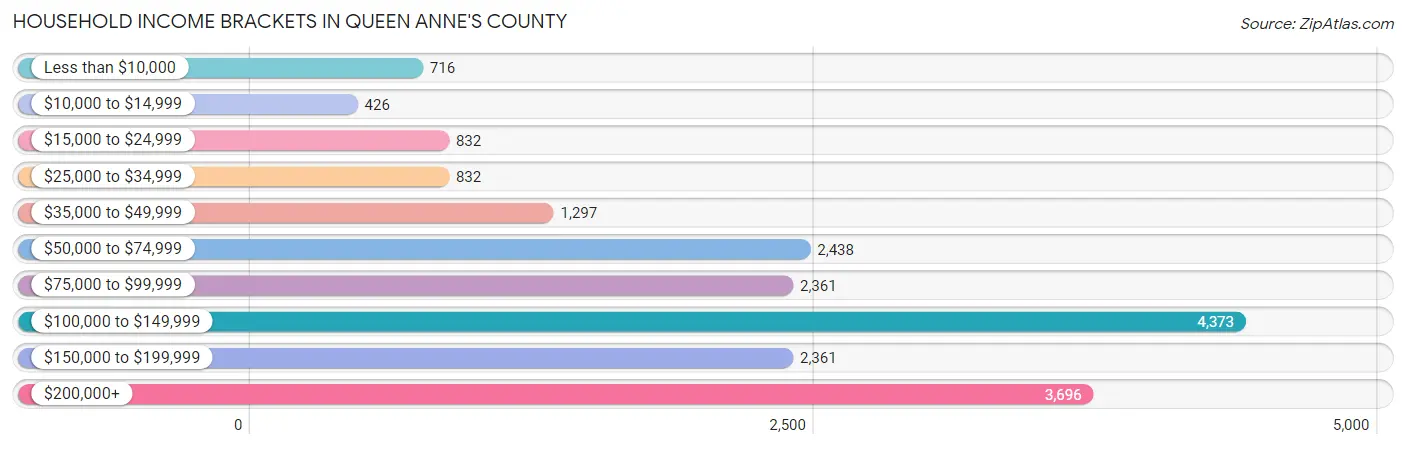
Household Income Brackets in Queen Anne's County
With 4,373 households falling in the category, the $100,000 to $149,999 income range is the most frequent in Queen Anne's County, accounting for 22.6% of all households. In contrast, only 426 households (2.2%) fall into the $10,000 to $14,999 income bracket, making it the least populous group.
| Income Bracket | # Households | % Households |
| Less than $10,000 | 716 | 3.7% |
| $10,000 to $14,999 | 426 | 2.2% |
| $15,000 to $24,999 | 832 | 4.3% |
| $25,000 to $34,999 | 832 | 4.3% |
| $35,000 to $49,999 | 1,297 | 6.7% |
| $50,000 to $74,999 | 2,438 | 12.6% |
| $75,000 to $99,999 | 2,361 | 12.2% |
| $100,000 to $149,999 | 4,373 | 22.6% |
| $150,000 to $199,999 | 2,361 | 12.2% |
| $200,000+ | 3,696 | 19.1% |
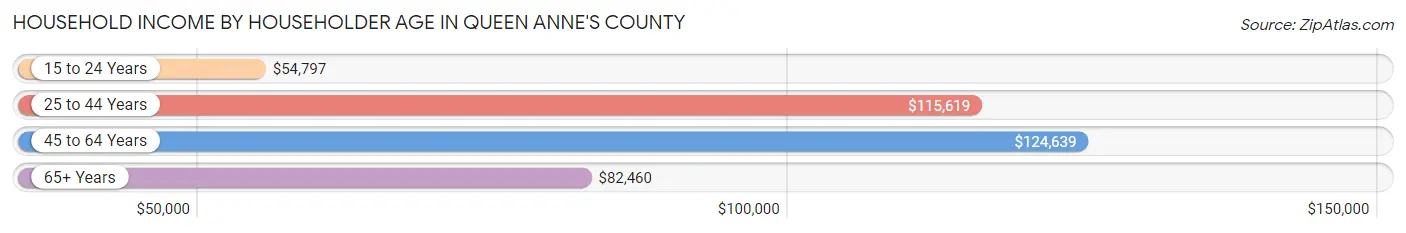
Household Income by Householder Age in Queen Anne's County
The median household income in Queen Anne's County is $108,332, with the highest median household income of $124,639 found in the 45 to 64 years age bracket for the primary householder. A total of 8,092 households (41.8%) fall into this category. Meanwhile, the 15 to 24 years age bracket for the primary householder has the lowest median household income of $54,797, with 195 households (1.0%) in this group.
| Income Bracket | # Households | Median Income |
| 15 to 24 Years | 195 (1.0%) | $54,797 |
| 25 to 44 Years | 5,074 (26.2%) | $115,619 |
| 45 to 64 Years | 8,092 (41.8%) | $124,639 |
| 65+ Years | 5,990 (30.9%) | $82,460 |
| Total | 19,351 (100.0%) | $108,332 |
Poverty in Queen Anne's County
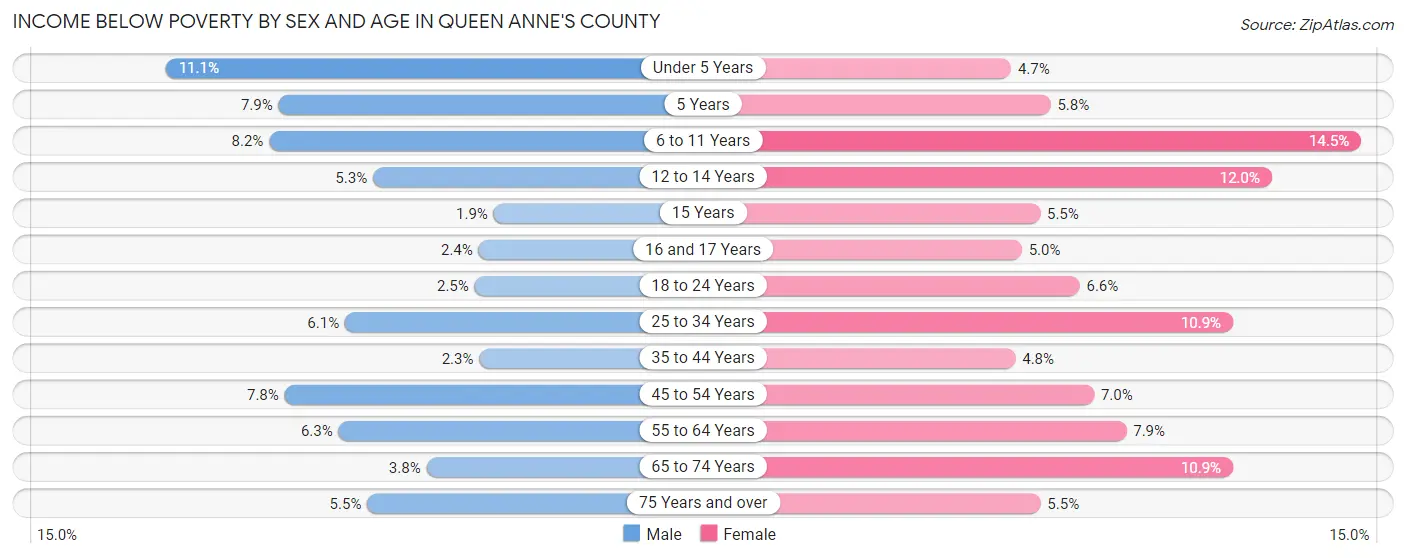
Income Below Poverty by Sex and Age in Queen Anne's County
With 5.6% poverty level for males and 8.1% for females among the residents of Queen Anne's County, under 5 year old males and 6 to 11 year old females are the most vulnerable to poverty, with 143 males (11.1%) and 248 females (14.5%) in their respective age groups living below the poverty level.
| Age Bracket | Male | Female |
| Under 5 Years | 143 (11.1%) | 53 (4.7%) |
| 5 Years | 31 (7.9%) | 14 (5.8%) |
| 6 to 11 Years | 138 (8.2%) | 248 (14.5%) |
| 12 to 14 Years | 52 (5.3%) | 127 (12.0%) |
| 15 Years | 9 (1.9%) | 18 (5.5%) |
| 16 and 17 Years | 14 (2.4%) | 32 (5.0%) |
| 18 to 24 Years | 46 (2.5%) | 115 (6.6%) |
| 25 to 34 Years | 161 (6.1%) | 284 (10.9%) |
| 35 to 44 Years | 66 (2.3%) | 141 (4.8%) |
| 45 to 54 Years | 261 (7.8%) | 247 (7.0%) |
| 55 to 64 Years | 251 (6.3%) | 318 (7.9%) |
| 65 to 74 Years | 108 (3.8%) | 318 (10.9%) |
| 75 Years and over | 97 (5.5%) | 127 (5.5%) |
| Total | 1,377 (5.6%) | 2,042 (8.1%) |
Income Above Poverty by Sex and Age in Queen Anne's County
According to the poverty statistics in Queen Anne's County, males aged 15 years and females aged under 5 years are the age groups that are most secure financially, with 98.1% of males and 95.3% of females in these age groups living above the poverty line.
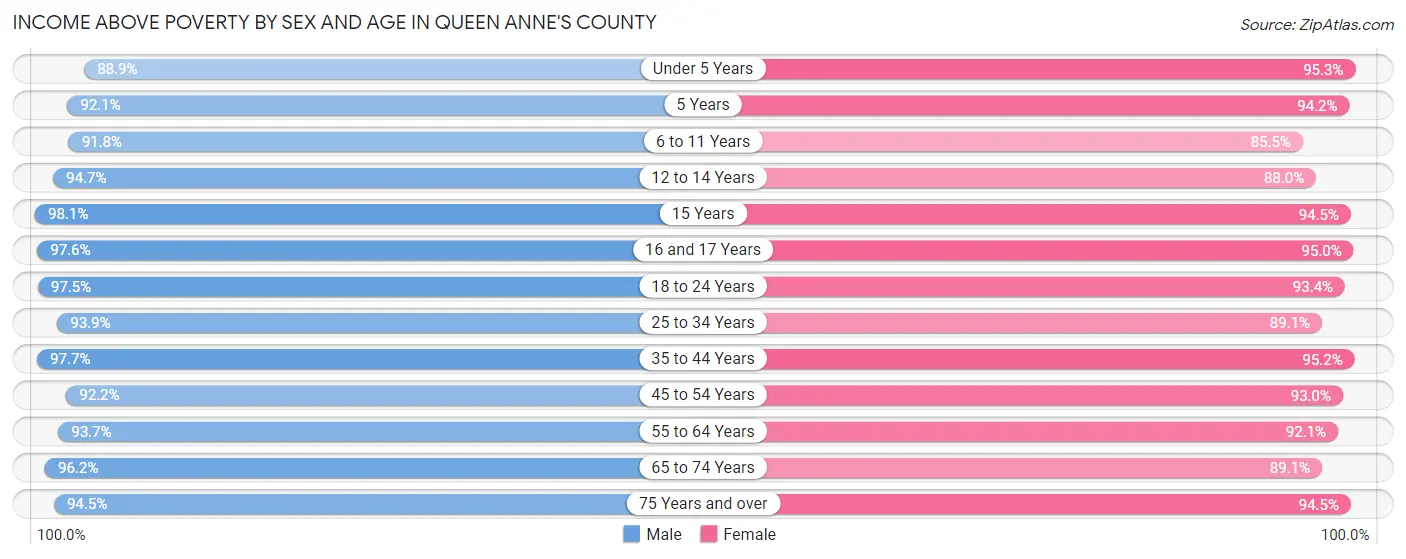
| Age Bracket | Male | Female |
| Under 5 Years | 1,149 (88.9%) | 1,072 (95.3%) |
| 5 Years | 360 (92.1%) | 227 (94.2%) |
| 6 to 11 Years | 1,546 (91.8%) | 1,467 (85.5%) |
| 12 to 14 Years | 930 (94.7%) | 934 (88.0%) |
| 15 Years | 454 (98.1%) | 308 (94.5%) |
| 16 and 17 Years | 579 (97.6%) | 607 (95.0%) |
| 18 to 24 Years | 1,818 (97.5%) | 1,621 (93.4%) |
| 25 to 34 Years | 2,489 (93.9%) | 2,324 (89.1%) |
| 35 to 44 Years | 2,759 (97.7%) | 2,778 (95.2%) |
| 45 to 54 Years | 3,102 (92.2%) | 3,274 (93.0%) |
| 55 to 64 Years | 3,760 (93.7%) | 3,698 (92.1%) |
| 65 to 74 Years | 2,727 (96.2%) | 2,602 (89.1%) |
| 75 Years and over | 1,679 (94.5%) | 2,168 (94.5%) |
| Total | 23,352 (94.4%) | 23,080 (91.9%) |
Income Below Poverty Among Married-Couple Families in Queen Anne's County
The poverty statistics for married-couple families in Queen Anne's County show that 1.6% or 183 of the total 11,588 families live below the poverty line. Families with 1 or 2 children have the highest poverty rate of 2.6%, comprising of 85 families. On the other hand, families with 5 or more children have the lowest poverty rate of 0.0%, which includes 0 families.
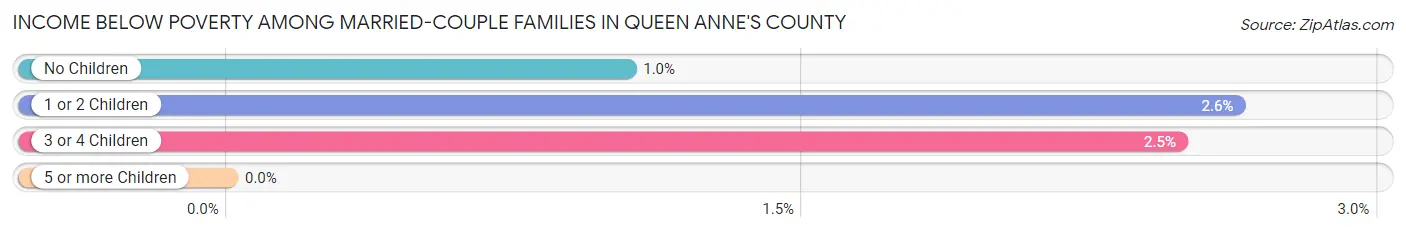
| Children | Above Poverty | Below Poverty |
| No Children | 7,356 (99.0%) | 77 (1.0%) |
| 1 or 2 Children | 3,150 (97.4%) | 85 (2.6%) |
| 3 or 4 Children | 825 (97.5%) | 21 (2.5%) |
| 5 or more Children | 74 (100.0%) | 0 (0.0%) |
| Total | 11,405 (98.4%) | 183 (1.6%) |
Income Below Poverty Among Single-Parent Households in Queen Anne's County
According to the poverty data in Queen Anne's County, 1.8% or 17 single-father households and 18.9% or 330 single-mother households are living below the poverty line. Among single-father households, those with 1 or 2 children have the highest poverty rate, with 17 households (3.6%) experiencing poverty. Likewise, among single-mother households, those with 5 or more children have the highest poverty rate, with 23 households (100.0%) falling below the poverty line.
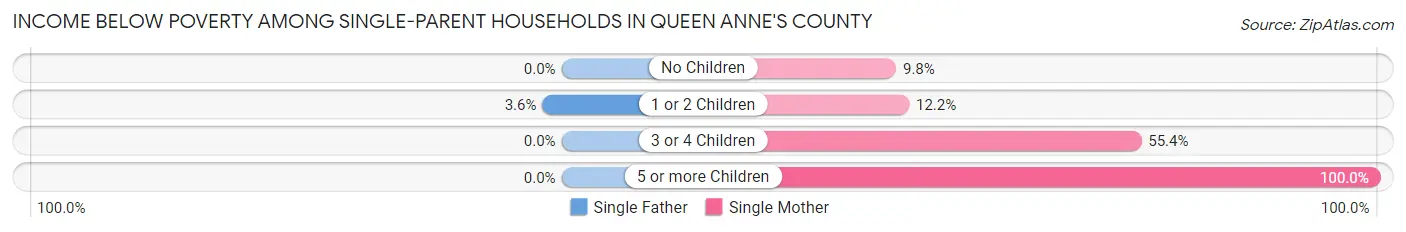
| Children | Single Father | Single Mother |
| No Children | 0 (0.0%) | 59 (9.8%) |
| 1 or 2 Children | 17 (3.6%) | 105 (12.2%) |
| 3 or 4 Children | 0 (0.0%) | 143 (55.4%) |
| 5 or more Children | 0 (0.0%) | 23 (100.0%) |
| Total | 17 (1.8%) | 330 (18.9%) |
Income Below Poverty Among Married-Couple vs Single-Parent Households in Queen Anne's County
The poverty data for Queen Anne's County shows that 183 of the married-couple family households (1.6%) and 347 of the single-parent households (12.8%) are living below the poverty level. Within the married-couple family households, those with 1 or 2 children have the highest poverty rate, with 85 households (2.6%) falling below the poverty line. Among the single-parent households, those with 5 or more children have the highest poverty rate, with 23 household (100.0%) living below poverty.
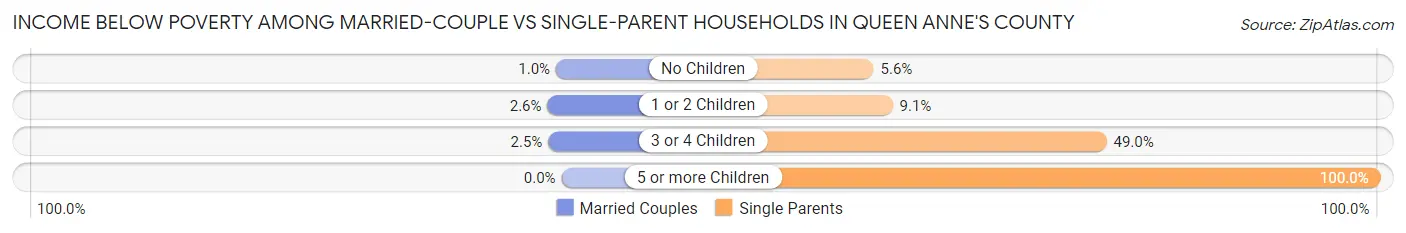
| Children | Married-Couple Families | Single-Parent Households |
| No Children | 77 (1.0%) | 59 (5.6%) |
| 1 or 2 Children | 85 (2.6%) | 122 (9.1%) |
| 3 or 4 Children | 21 (2.5%) | 143 (49.0%) |
| 5 or more Children | 0 (0.0%) | 23 (100.0%) |
| Total | 183 (1.6%) | 347 (12.8%) |
Employment Characteristics in Queen Anne's County
Employment by Class of Employer in Queen Anne's County
Among the 25,693 employed individuals in Queen Anne's County, private company employees (15,572 | 60.6%), local government employees (2,395 | 9.3%), and not-for-profit organizations (2,030 | 7.9%) make up the most common classes of employment.
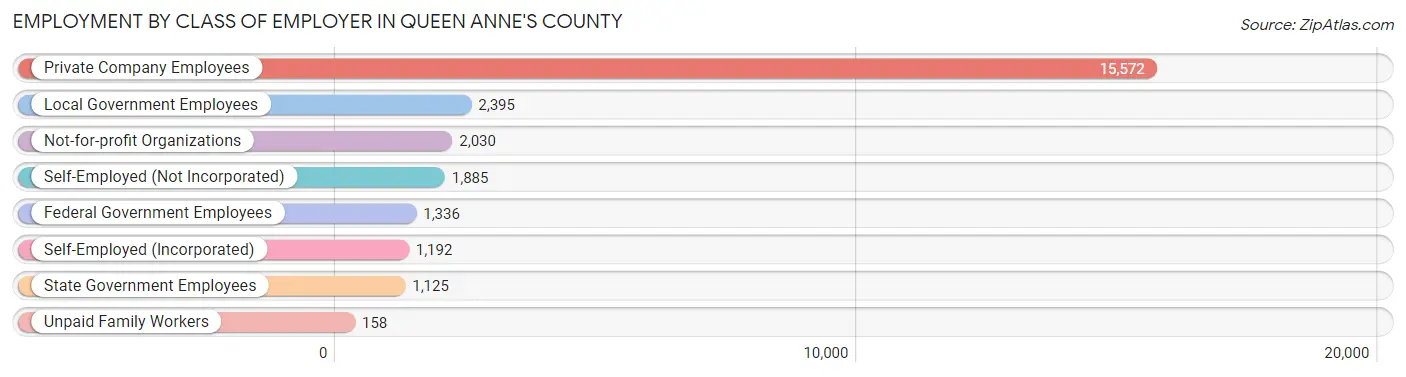
| Employer Class | # Employees | % Employees |
| Private Company Employees | 15,572 | 60.6% |
| Self-Employed (Incorporated) | 1,192 | 4.6% |
| Self-Employed (Not Incorporated) | 1,885 | 7.3% |
| Not-for-profit Organizations | 2,030 | 7.9% |
| Local Government Employees | 2,395 | 9.3% |
| State Government Employees | 1,125 | 4.4% |
| Federal Government Employees | 1,336 | 5.2% |
| Unpaid Family Workers | 158 | 0.6% |
| Total | 25,693 | 100.0% |
Employment Status by Age in Queen Anne's County
According to the labor force statistics for Queen Anne's County, out of the total population over 16 years of age (40,905), 66.6% or 27,243 individuals are in the labor force, with 3.6% or 981 of them unemployed. The age group with the highest labor force participation rate is 35 to 44 years, with 89.2% or 5,174 individuals in the labor force. Within the labor force, the 25 to 29 years age range has the highest percentage of unemployed individuals, with 10.0% or 210 of them being unemployed.
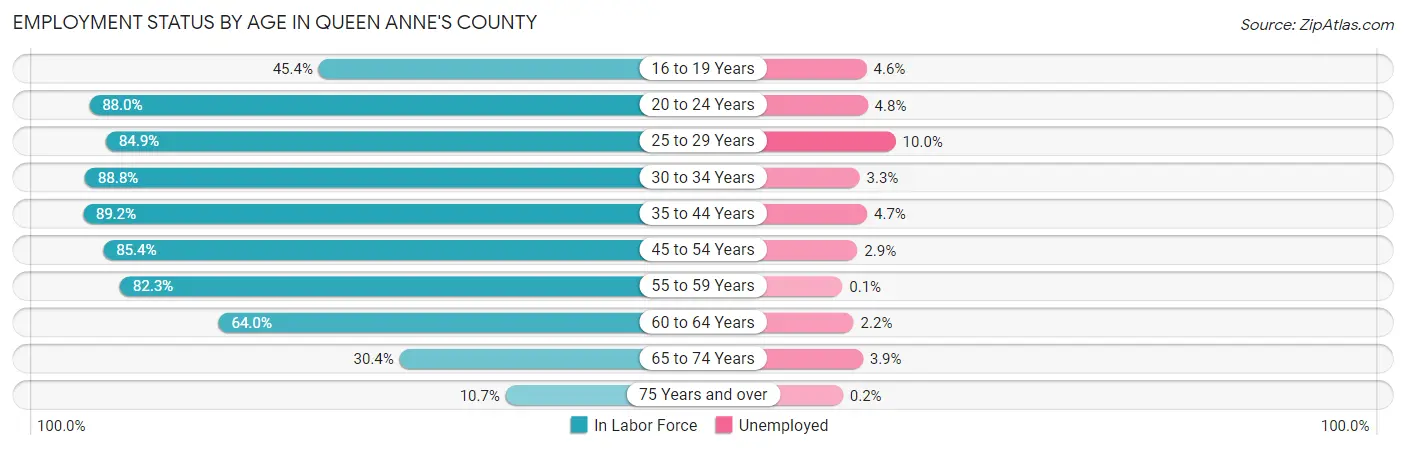
| Age Bracket | In Labor Force | Unemployed |
| 16 to 19 Years | 1,032 (45.4%) | 47 (4.6%) |
| 20 to 24 Years | 2,257 (88.0%) | 108 (4.8%) |
| 25 to 29 Years | 2,097 (84.9%) | 210 (10.0%) |
| 30 to 34 Years | 2,565 (88.8%) | 85 (3.3%) |
| 35 to 44 Years | 5,174 (89.2%) | 243 (4.7%) |
| 45 to 54 Years | 5,931 (85.4%) | 172 (2.9%) |
| 55 to 59 Years | 3,648 (82.3%) | 4 (0.1%) |
| 60 to 64 Years | 2,321 (64.0%) | 51 (2.2%) |
| 65 to 74 Years | 1,762 (30.4%) | 69 (3.9%) |
| 75 Years and over | 439 (10.7%) | 1 (0.2%) |
| Total | 27,243 (66.6%) | 981 (3.6%) |
Employment Status by Educational Attainment in Queen Anne's County
According to labor force statistics for Queen Anne's County, 83.1% of individuals (21,742) out of the total population between 25 and 64 years of age (26,164) are in the labor force, with 3.5% or 761 of them being unemployed. The group with the highest labor force participation rate are those with the educational attainment of bachelor's degree or higher, with 88.6% or 8,620 individuals in the labor force. Within the labor force, individuals with less than high school education have the highest percentage of unemployment, with 14.1% or 135 of them being unemployed.
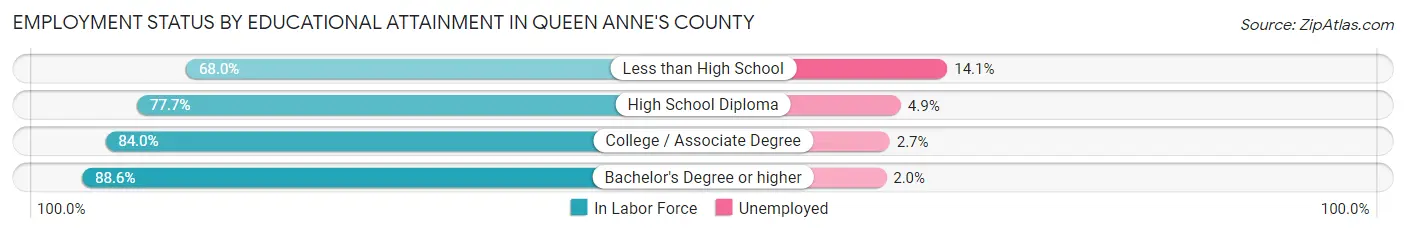
| Educational Attainment | In Labor Force | Unemployed |
| Less than High School | 960 (68.0%) | 199 (14.1%) |
| High School Diploma | 5,708 (77.7%) | 360 (4.9%) |
| College / Associate Degree | 6,449 (84.0%) | 207 (2.7%) |
| Bachelor's Degree or higher | 8,620 (88.6%) | 195 (2.0%) |
| Total | 21,742 (83.1%) | 916 (3.5%) |
Employment Occupations by Sex in Queen Anne's County
Management, Business, Science and Arts Occupations
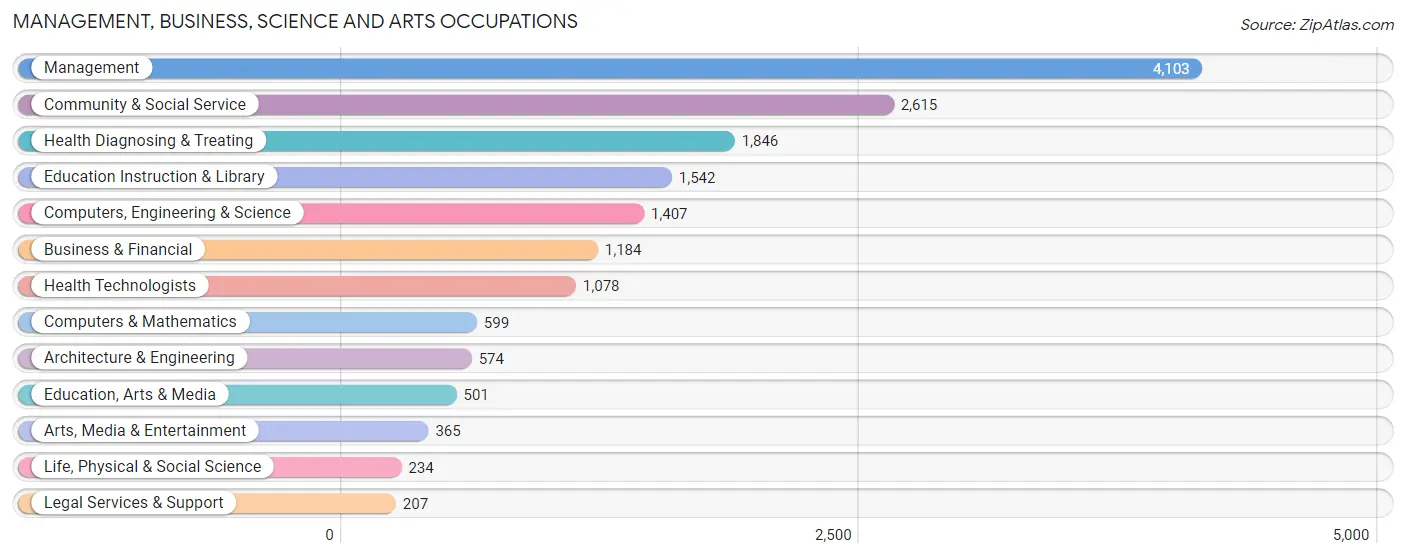
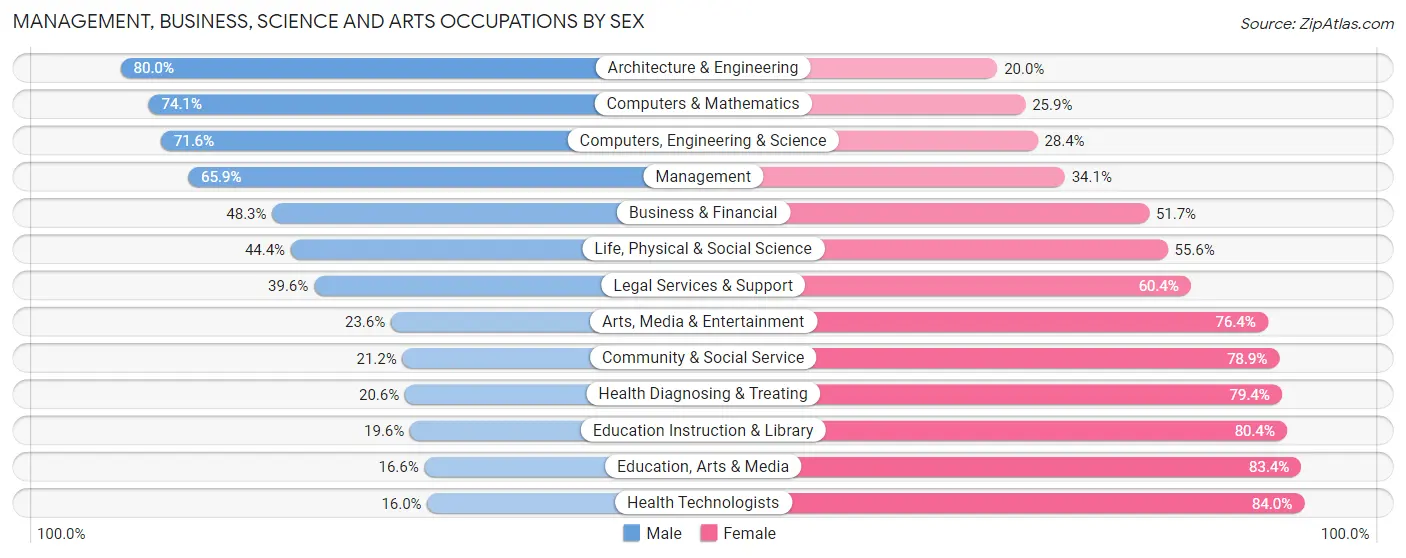
The most common Management, Business, Science and Arts occupations in Queen Anne's County are Management (4,103 | 15.7%), Community & Social Service (2,615 | 10.0%), Health Diagnosing & Treating (1,846 | 7.0%), Education Instruction & Library (1,542 | 5.9%), and Computers, Engineering & Science (1,407 | 5.4%).
Management, Business, Science and Arts Occupations by Sex
Within the Management, Business, Science and Arts occupations in Queen Anne's County, the most male-oriented occupations are Architecture & Engineering (80.0%), Computers & Mathematics (74.1%), and Computers, Engineering & Science (71.6%), while the most female-oriented occupations are Health Technologists (84.0%), Education, Arts & Media (83.4%), and Education Instruction & Library (80.4%).
| Occupation | Male | Female |
| Management | 2,703 (65.9%) | 1,400 (34.1%) |
| Business & Financial | 572 (48.3%) | 612 (51.7%) |
| Computers, Engineering & Science | 1,007 (71.6%) | 400 (28.4%) |
| Computers & Mathematics | 444 (74.1%) | 155 (25.9%) |
| Architecture & Engineering | 459 (80.0%) | 115 (20.0%) |
| Life, Physical & Social Science | 104 (44.4%) | 130 (55.6%) |
| Community & Social Service | 553 (21.1%) | 2,062 (78.8%) |
| Education, Arts & Media | 83 (16.6%) | 418 (83.4%) |
| Legal Services & Support | 82 (39.6%) | 125 (60.4%) |
| Education Instruction & Library | 302 (19.6%) | 1,240 (80.4%) |
| Arts, Media & Entertainment | 86 (23.6%) | 279 (76.4%) |
| Health Diagnosing & Treating | 381 (20.6%) | 1,465 (79.4%) |
| Health Technologists | 172 (16.0%) | 906 (84.0%) |
| Total (Category) | 5,216 (46.8%) | 5,939 (53.2%) |
| Total (Overall) | 13,788 (52.7%) | 12,392 (47.3%) |
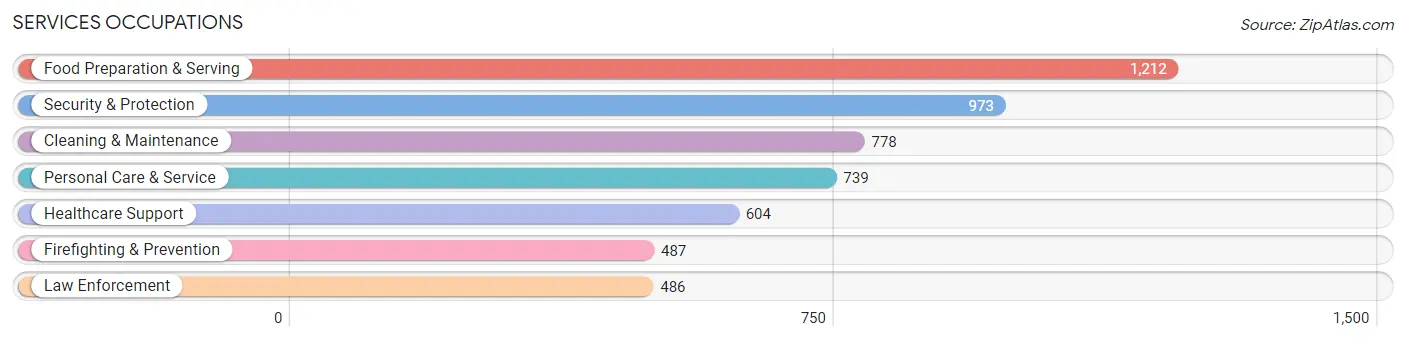
Services Occupations
The most common Services occupations in Queen Anne's County are Food Preparation & Serving (1,212 | 4.6%), Security & Protection (973 | 3.7%), Cleaning & Maintenance (778 | 3.0%), Personal Care & Service (739 | 2.8%), and Healthcare Support (604 | 2.3%).
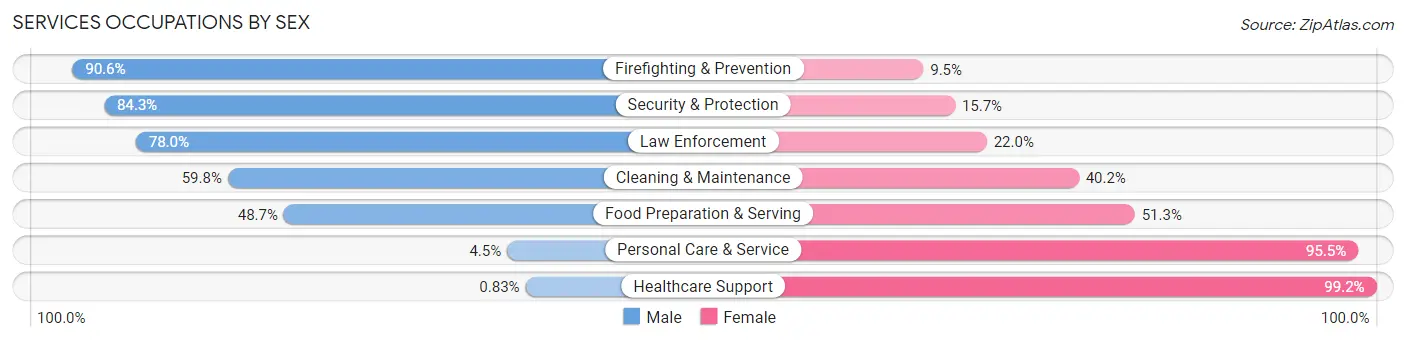
Services Occupations by Sex
Within the Services occupations in Queen Anne's County, the most male-oriented occupations are Firefighting & Prevention (90.5%), Security & Protection (84.3%), and Law Enforcement (78.0%), while the most female-oriented occupations are Healthcare Support (99.2%), Personal Care & Service (95.5%), and Food Preparation & Serving (51.3%).
| Occupation | Male | Female |
| Healthcare Support | 5 (0.8%) | 599 (99.2%) |
| Security & Protection | 820 (84.3%) | 153 (15.7%) |
| Firefighting & Prevention | 441 (90.5%) | 46 (9.5%) |
| Law Enforcement | 379 (78.0%) | 107 (22.0%) |
| Food Preparation & Serving | 590 (48.7%) | 622 (51.3%) |
| Cleaning & Maintenance | 465 (59.8%) | 313 (40.2%) |
| Personal Care & Service | 33 (4.5%) | 706 (95.5%) |
| Total (Category) | 1,913 (44.4%) | 2,393 (55.6%) |
| Total (Overall) | 13,788 (52.7%) | 12,392 (47.3%) |
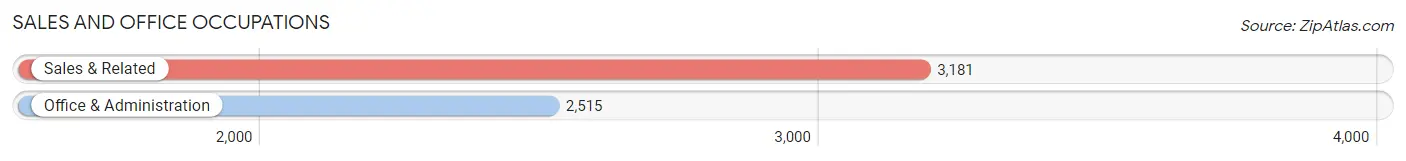
Sales and Office Occupations
The most common Sales and Office occupations in Queen Anne's County are Sales & Related (3,181 | 12.1%), and Office & Administration (2,515 | 9.6%).
Sales and Office Occupations by Sex
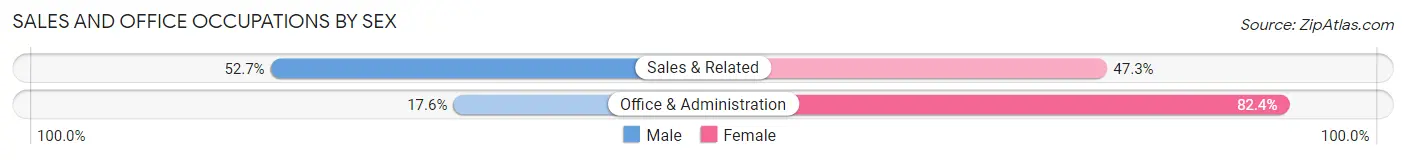
| Occupation | Male | Female |
| Sales & Related | 1,677 (52.7%) | 1,504 (47.3%) |
| Office & Administration | 442 (17.6%) | 2,073 (82.4%) |
| Total (Category) | 2,119 (37.2%) | 3,577 (62.8%) |
| Total (Overall) | 13,788 (52.7%) | 12,392 (47.3%) |
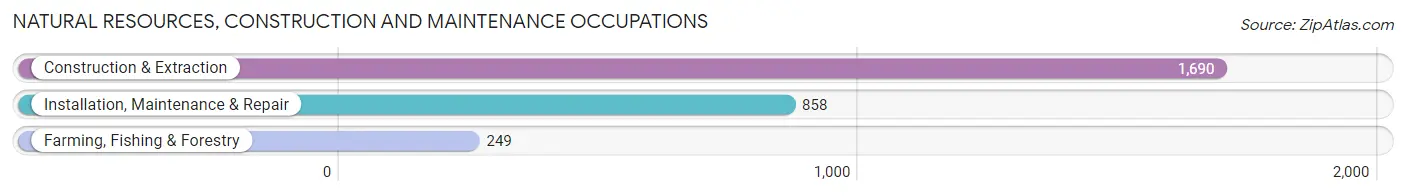
Natural Resources, Construction and Maintenance Occupations
The most common Natural Resources, Construction and Maintenance occupations in Queen Anne's County are Construction & Extraction (1,690 | 6.5%), Installation, Maintenance & Repair (858 | 3.3%), and Farming, Fishing & Forestry (249 | 0.9%).
Natural Resources, Construction and Maintenance Occupations by Sex
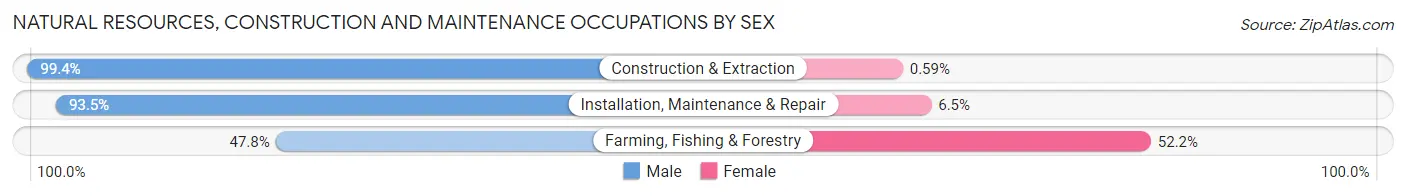
| Occupation | Male | Female |
| Farming, Fishing & Forestry | 119 (47.8%) | 130 (52.2%) |
| Construction & Extraction | 1,680 (99.4%) | 10 (0.6%) |
| Installation, Maintenance & Repair | 802 (93.5%) | 56 (6.5%) |
| Total (Category) | 2,601 (93.0%) | 196 (7.0%) |
| Total (Overall) | 13,788 (52.7%) | 12,392 (47.3%) |
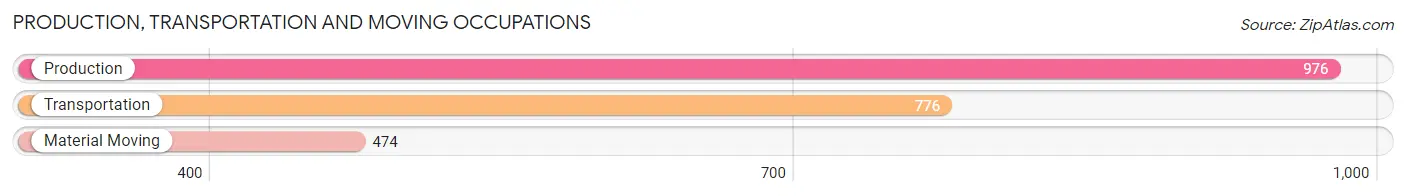
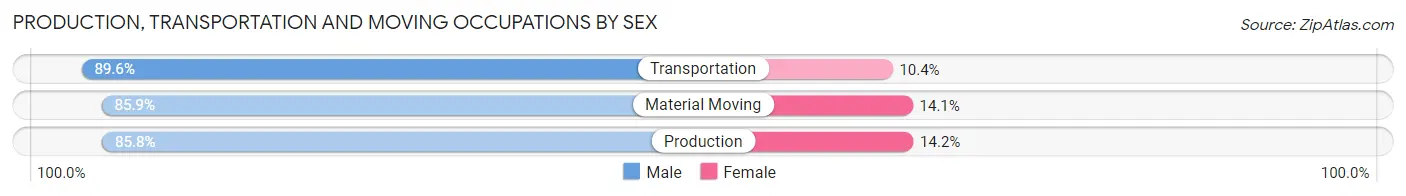
Production, Transportation and Moving Occupations
The most common Production, Transportation and Moving occupations in Queen Anne's County are Production (976 | 3.7%), Transportation (776 | 3.0%), and Material Moving (474 | 1.8%).
Production, Transportation and Moving Occupations by Sex
| Occupation | Male | Female |
| Production | 837 (85.8%) | 139 (14.2%) |
| Transportation | 695 (89.6%) | 81 (10.4%) |
| Material Moving | 407 (85.9%) | 67 (14.1%) |
| Total (Category) | 1,939 (87.1%) | 287 (12.9%) |
| Total (Overall) | 13,788 (52.7%) | 12,392 (47.3%) |
Employment Industries by Sex in Queen Anne's County
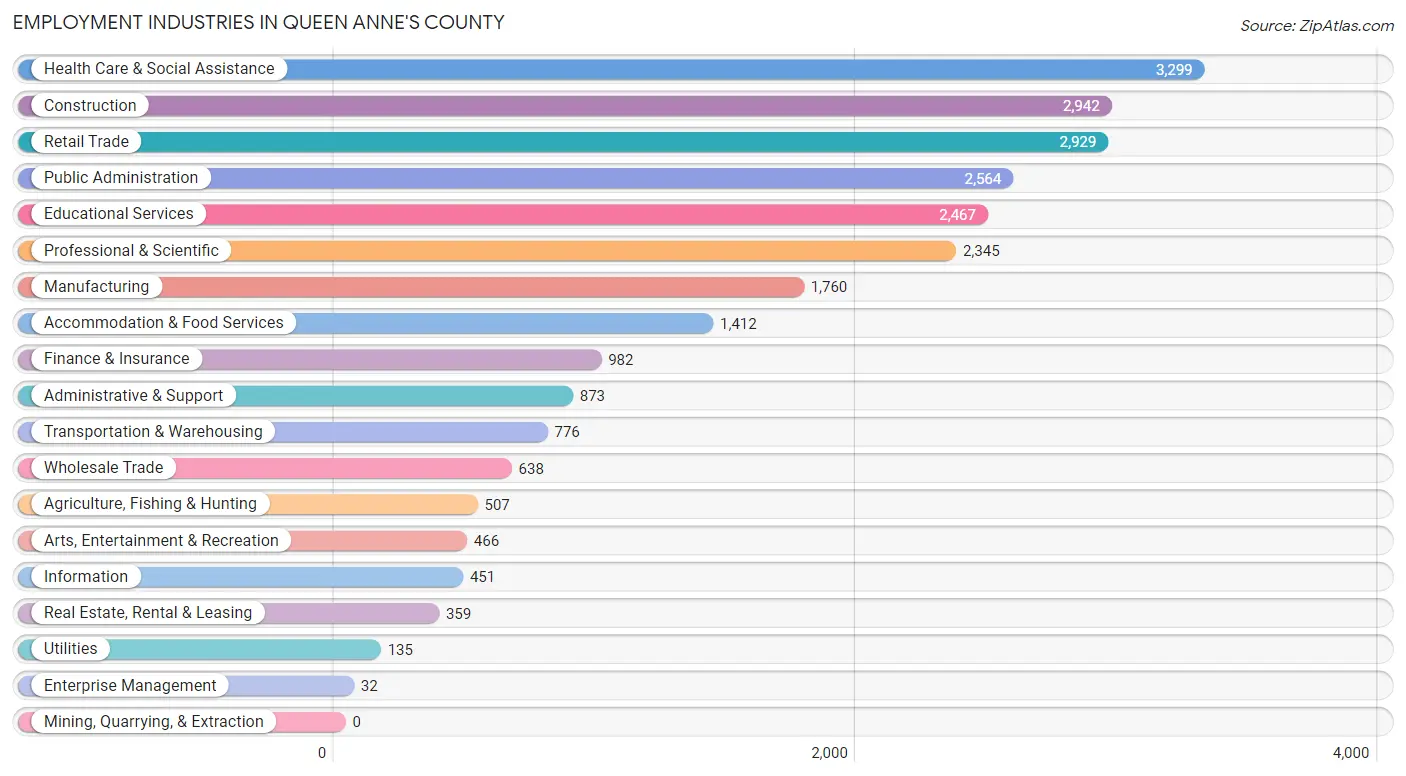
Employment Industries in Queen Anne's County
The major employment industries in Queen Anne's County include Health Care & Social Assistance (3,299 | 12.6%), Construction (2,942 | 11.2%), Retail Trade (2,929 | 11.2%), Public Administration (2,564 | 9.8%), and Educational Services (2,467 | 9.4%).
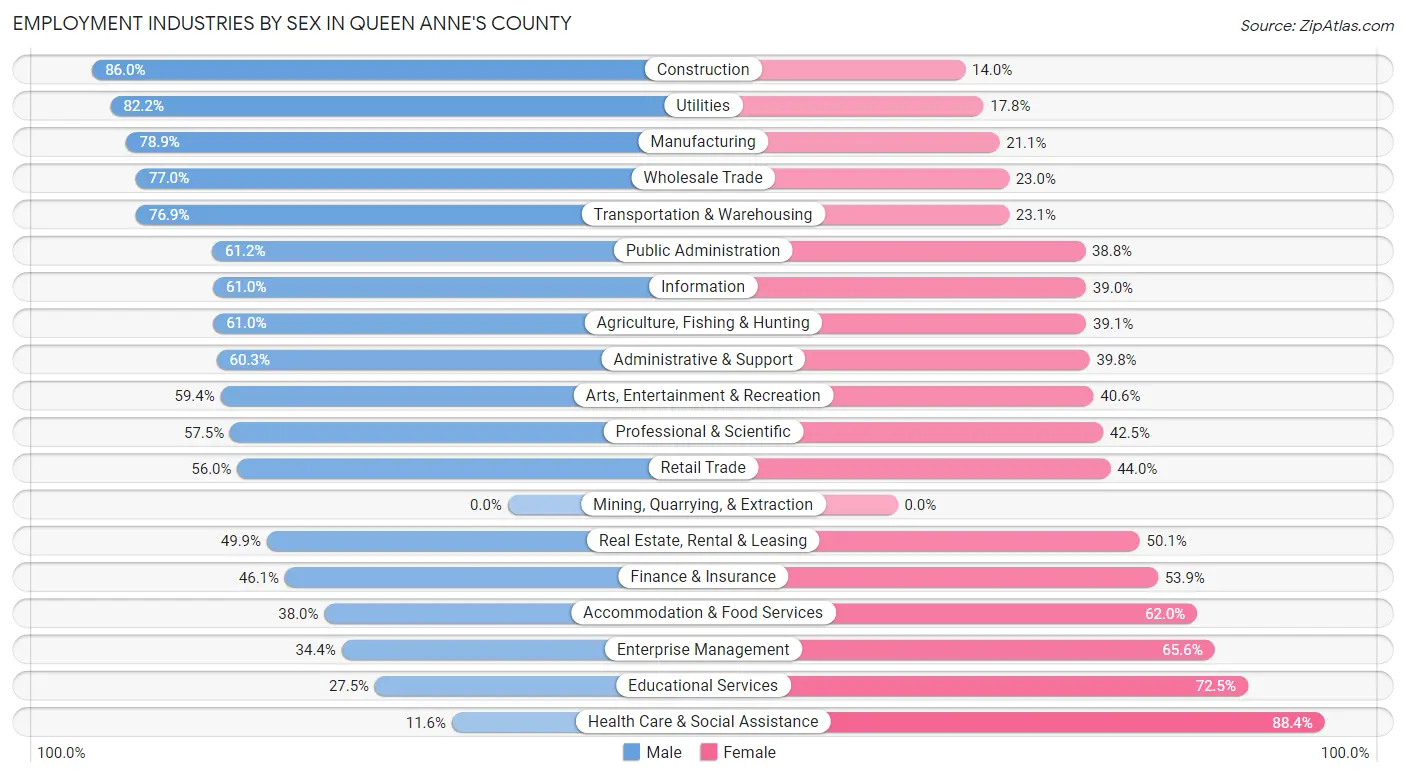
Employment Industries by Sex in Queen Anne's County
The Queen Anne's County industries that see more men than women are Construction (86.0%), Utilities (82.2%), and Manufacturing (78.9%), whereas the industries that tend to have a higher number of women are Health Care & Social Assistance (88.4%), Educational Services (72.5%), and Enterprise Management (65.6%).
| Industry | Male | Female |
| Agriculture, Fishing & Hunting | 309 (61.0%) | 198 (39.1%) |
| Mining, Quarrying, & Extraction | 0 (0.0%) | 0 (0.0%) |
| Construction | 2,530 (86.0%) | 412 (14.0%) |
| Manufacturing | 1,389 (78.9%) | 371 (21.1%) |
| Wholesale Trade | 491 (77.0%) | 147 (23.0%) |
| Retail Trade | 1,639 (56.0%) | 1,290 (44.0%) |
| Transportation & Warehousing | 597 (76.9%) | 179 (23.1%) |
| Utilities | 111 (82.2%) | 24 (17.8%) |
| Information | 275 (61.0%) | 176 (39.0%) |
| Finance & Insurance | 453 (46.1%) | 529 (53.9%) |
| Real Estate, Rental & Leasing | 179 (49.9%) | 180 (50.1%) |
| Professional & Scientific | 1,348 (57.5%) | 997 (42.5%) |
| Enterprise Management | 11 (34.4%) | 21 (65.6%) |
| Administrative & Support | 526 (60.3%) | 347 (39.8%) |
| Educational Services | 678 (27.5%) | 1,789 (72.5%) |
| Health Care & Social Assistance | 382 (11.6%) | 2,917 (88.4%) |
| Arts, Entertainment & Recreation | 277 (59.4%) | 189 (40.6%) |
| Accommodation & Food Services | 536 (38.0%) | 876 (62.0%) |
| Public Administration | 1,569 (61.2%) | 995 (38.8%) |
| Total | 13,788 (52.7%) | 12,392 (47.3%) |
Education in Queen Anne's County
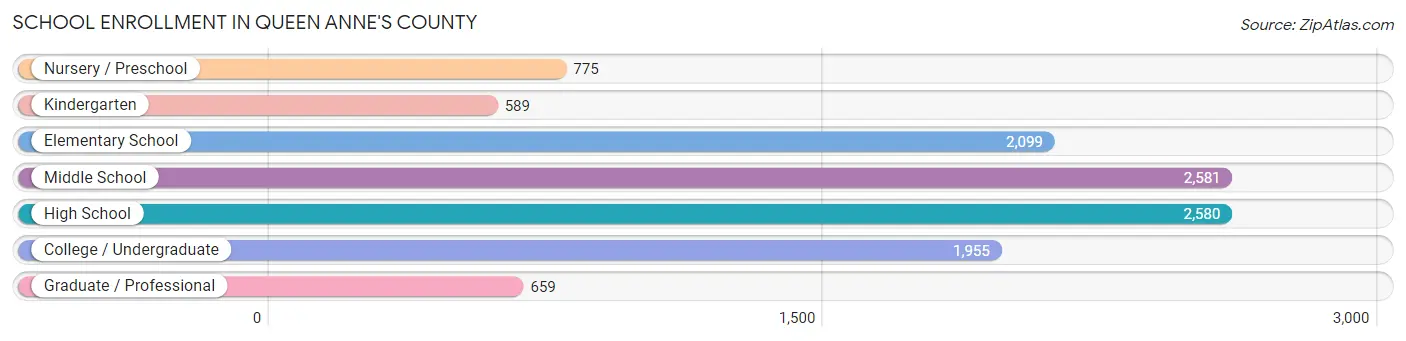
School Enrollment in Queen Anne's County
The most common levels of schooling among the 11,238 students in Queen Anne's County are middle school (2,581 | 23.0%), high school (2,580 | 23.0%), and elementary school (2,099 | 18.7%).
| School Level | # Students | % Students |
| Nursery / Preschool | 775 | 6.9% |
| Kindergarten | 589 | 5.2% |
| Elementary School | 2,099 | 18.7% |
| Middle School | 2,581 | 23.0% |
| High School | 2,580 | 23.0% |
| College / Undergraduate | 1,955 | 17.4% |
| Graduate / Professional | 659 | 5.9% |
| Total | 11,238 | 100.0% |
School Enrollment by Age by Funding Source in Queen Anne's County
Out of a total of 11,238 students who are enrolled in schools in Queen Anne's County, 2,146 (19.1%) attend a private institution, while the remaining 9,092 (80.9%) are enrolled in public schools. The age group of 25 to 34 year olds has the highest likelihood of being enrolled in private schools, with 217 (37.9% in the age bracket) enrolled. Conversely, the age group of 15 to 17 year olds has the lowest likelihood of being enrolled in a private school, with 1,719 (86.7% in the age bracket) attending a public institution.
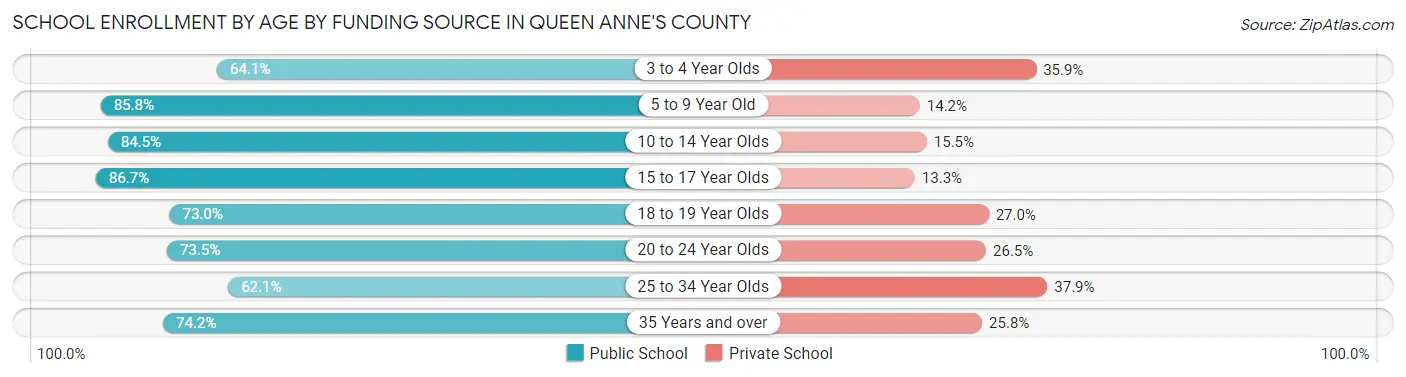
| Age Bracket | Public School | Private School |
| 3 to 4 Year Olds | 304 (64.1%) | 170 (35.9%) |
| 5 to 9 Year Old | 2,329 (85.8%) | 385 (14.2%) |
| 10 to 14 Year Olds | 2,666 (84.5%) | 489 (15.5%) |
| 15 to 17 Year Olds | 1,719 (86.7%) | 263 (13.3%) |
| 18 to 19 Year Olds | 535 (73.0%) | 198 (27.0%) |
| 20 to 24 Year Olds | 626 (73.5%) | 226 (26.5%) |
| 25 to 34 Year Olds | 355 (62.1%) | 217 (37.9%) |
| 35 Years and over | 561 (74.2%) | 195 (25.8%) |
| Total | 9,092 (80.9%) | 2,146 (19.1%) |
Educational Attainment by Field of Study in Queen Anne's County
Business (2,572 | 18.0%), education (1,653 | 11.6%), social sciences (1,500 | 10.5%), science & technology (1,383 | 9.7%), and bio, nature & agricultural (1,104 | 7.7%) are the most common fields of study among 14,317 individuals in Queen Anne's County who have obtained a bachelor's degree or higher.
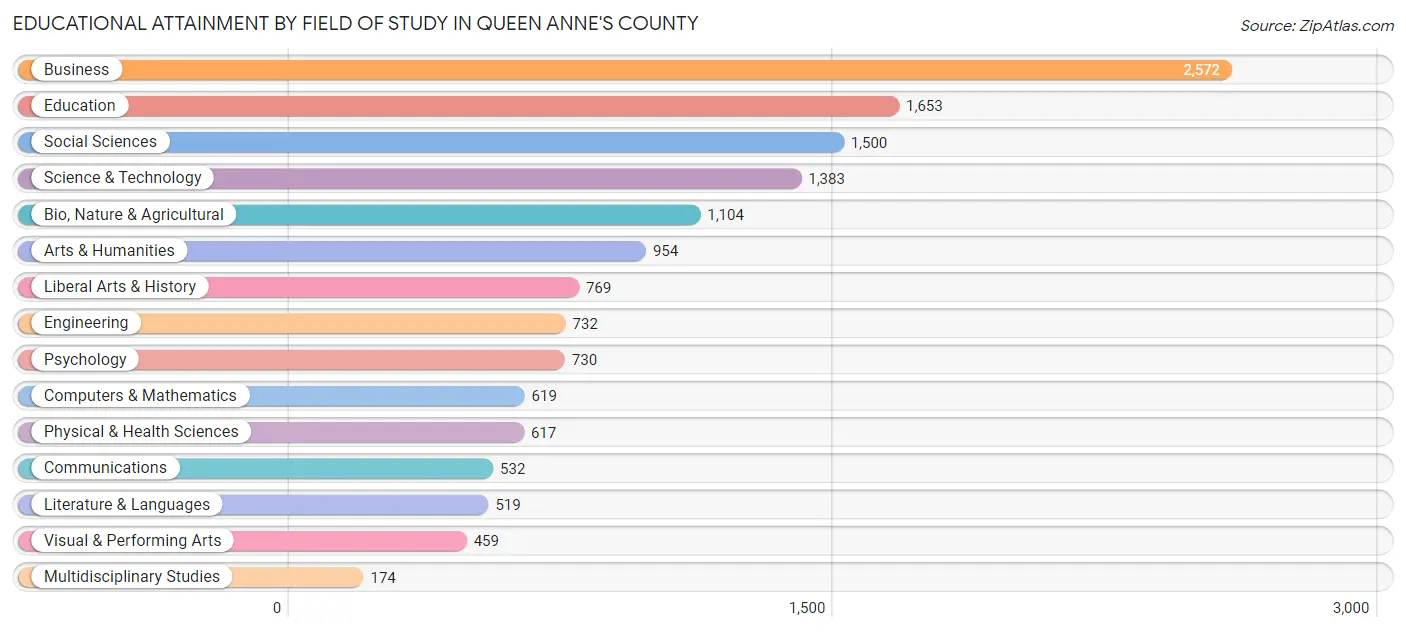
| Field of Study | # Graduates | % Graduates |
| Computers & Mathematics | 619 | 4.3% |
| Bio, Nature & Agricultural | 1,104 | 7.7% |
| Physical & Health Sciences | 617 | 4.3% |
| Psychology | 730 | 5.1% |
| Social Sciences | 1,500 | 10.5% |
| Engineering | 732 | 5.1% |
| Multidisciplinary Studies | 174 | 1.2% |
| Science & Technology | 1,383 | 9.7% |
| Business | 2,572 | 18.0% |
| Education | 1,653 | 11.6% |
| Literature & Languages | 519 | 3.6% |
| Liberal Arts & History | 769 | 5.4% |
| Visual & Performing Arts | 459 | 3.2% |
| Communications | 532 | 3.7% |
| Arts & Humanities | 954 | 6.7% |
| Total | 14,317 | 100.0% |
Transportation & Commute in Queen Anne's County
Vehicle Availability by Sex in Queen Anne's County
The most prevalent vehicle ownership categories in Queen Anne's County are males with 2 vehicles (4,909, accounting for 36.0%) and females with 2 vehicles (4,349, making up 40.7%).
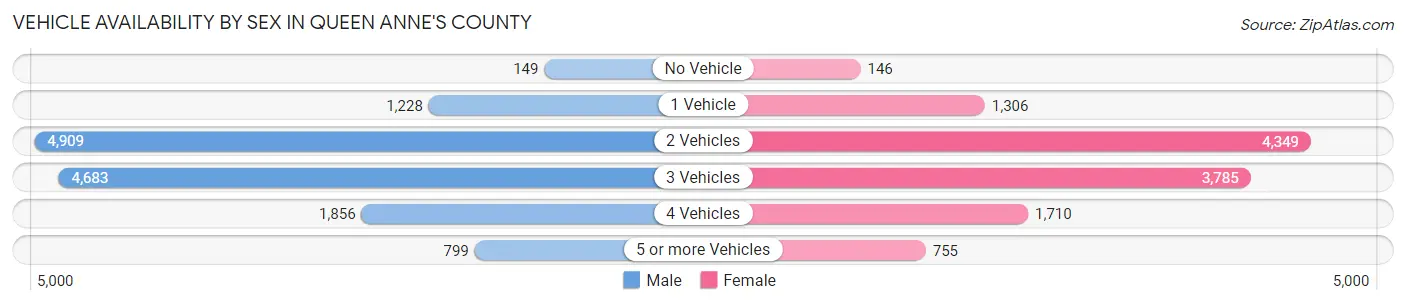
| Vehicles Available | Male | Female |
| No Vehicle | 149 (1.1%) | 146 (1.2%) |
| 1 Vehicle | 1,228 (9.0%) | 1,306 (10.8%) |
| 2 Vehicles | 4,909 (36.0%) | 4,349 (36.1%) |
| 3 Vehicles | 4,683 (34.4%) | 3,785 (31.4%) |
| 4 Vehicles | 1,856 (13.6%) | 1,710 (14.2%) |
| 5 or more Vehicles | 799 (5.9%) | 755 (6.3%) |
| Total | 13,624 (100.0%) | 12,051 (100.0%) |
Commute Time in Queen Anne's County
The most frequently occuring commute durations in Queen Anne's County are 60 to 89 minutes (3,089 commuters, 13.6%), 45 to 59 minutes (2,926 commuters, 12.9%), and 10 to 14 minutes (2,772 commuters, 12.2%).
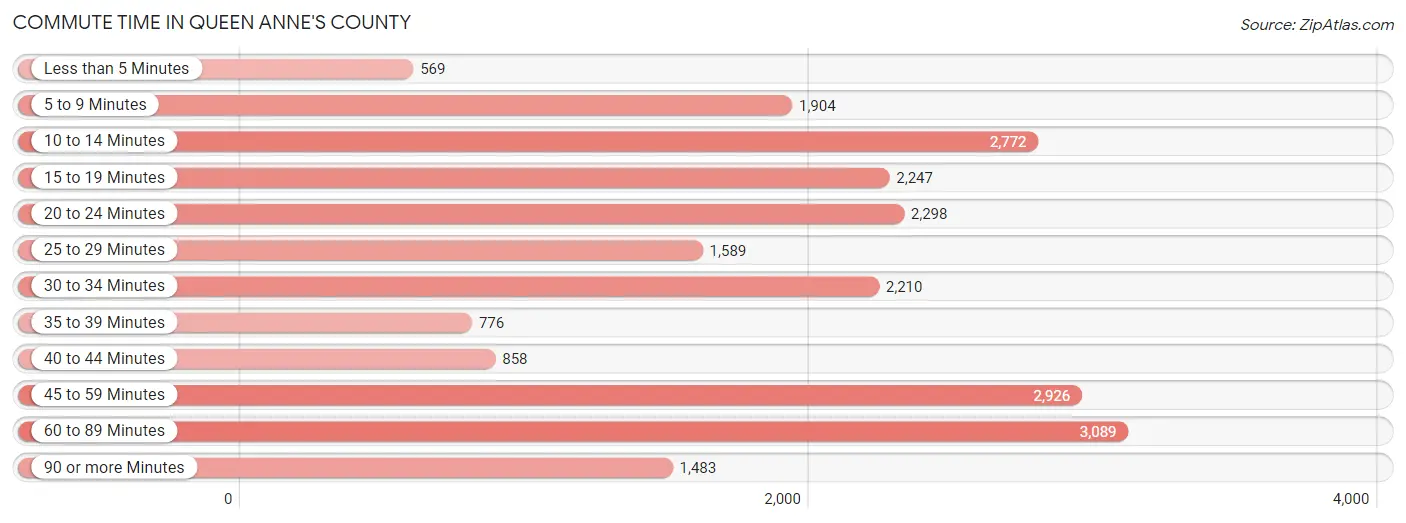
| Commute Time | # Commuters | % Commuters |
| Less than 5 Minutes | 569 | 2.5% |
| 5 to 9 Minutes | 1,904 | 8.4% |
| 10 to 14 Minutes | 2,772 | 12.2% |
| 15 to 19 Minutes | 2,247 | 9.9% |
| 20 to 24 Minutes | 2,298 | 10.1% |
| 25 to 29 Minutes | 1,589 | 7.0% |
| 30 to 34 Minutes | 2,210 | 9.7% |
| 35 to 39 Minutes | 776 | 3.4% |
| 40 to 44 Minutes | 858 | 3.8% |
| 45 to 59 Minutes | 2,926 | 12.9% |
| 60 to 89 Minutes | 3,089 | 13.6% |
| 90 or more Minutes | 1,483 | 6.5% |
Commute Time by Sex in Queen Anne's County
The most common commute times in Queen Anne's County are 60 to 89 minutes (2,120 commuters, 17.3%) for males and 20 to 24 minutes (1,405 commuters, 13.4%) for females.
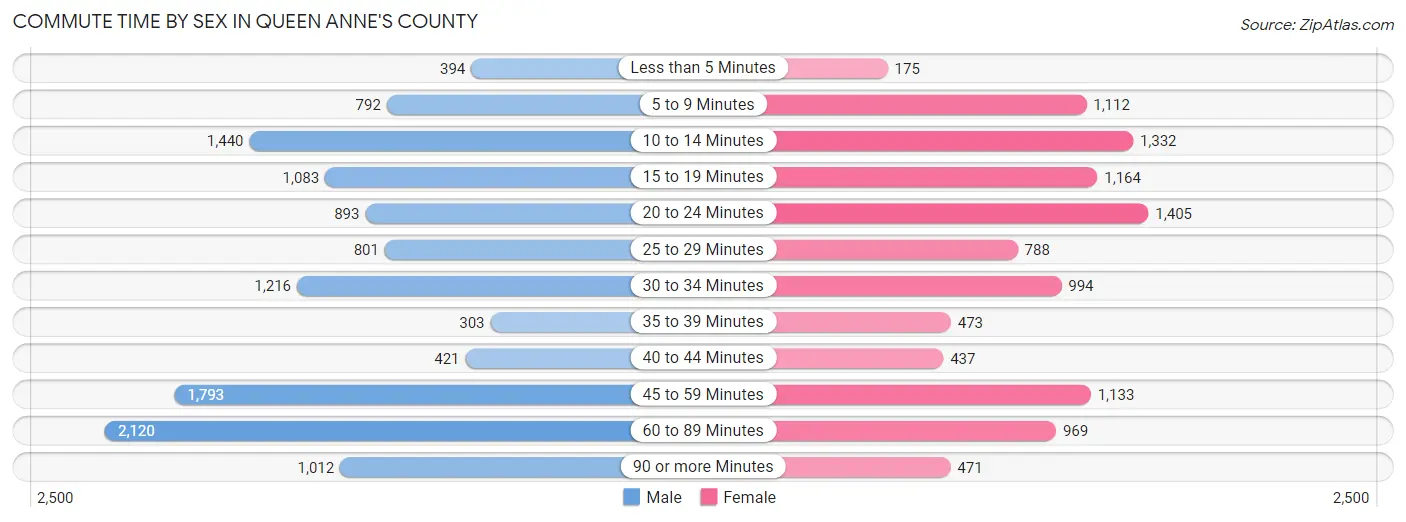
| Commute Time | Male | Female |
| Less than 5 Minutes | 394 (3.2%) | 175 (1.7%) |
| 5 to 9 Minutes | 792 (6.5%) | 1,112 (10.6%) |
| 10 to 14 Minutes | 1,440 (11.7%) | 1,332 (12.7%) |
| 15 to 19 Minutes | 1,083 (8.8%) | 1,164 (11.1%) |
| 20 to 24 Minutes | 893 (7.3%) | 1,405 (13.4%) |
| 25 to 29 Minutes | 801 (6.5%) | 788 (7.5%) |
| 30 to 34 Minutes | 1,216 (9.9%) | 994 (9.5%) |
| 35 to 39 Minutes | 303 (2.5%) | 473 (4.5%) |
| 40 to 44 Minutes | 421 (3.4%) | 437 (4.2%) |
| 45 to 59 Minutes | 1,793 (14.6%) | 1,133 (10.8%) |
| 60 to 89 Minutes | 2,120 (17.3%) | 969 (9.3%) |
| 90 or more Minutes | 1,012 (8.3%) | 471 (4.5%) |
Time of Departure to Work by Sex in Queen Anne's County
The most frequent times of departure to work in Queen Anne's County are 7:00 AM to 7:29 AM (1,634, 13.3%) for males and 7:00 AM to 7:29 AM (1,607, 15.4%) for females.
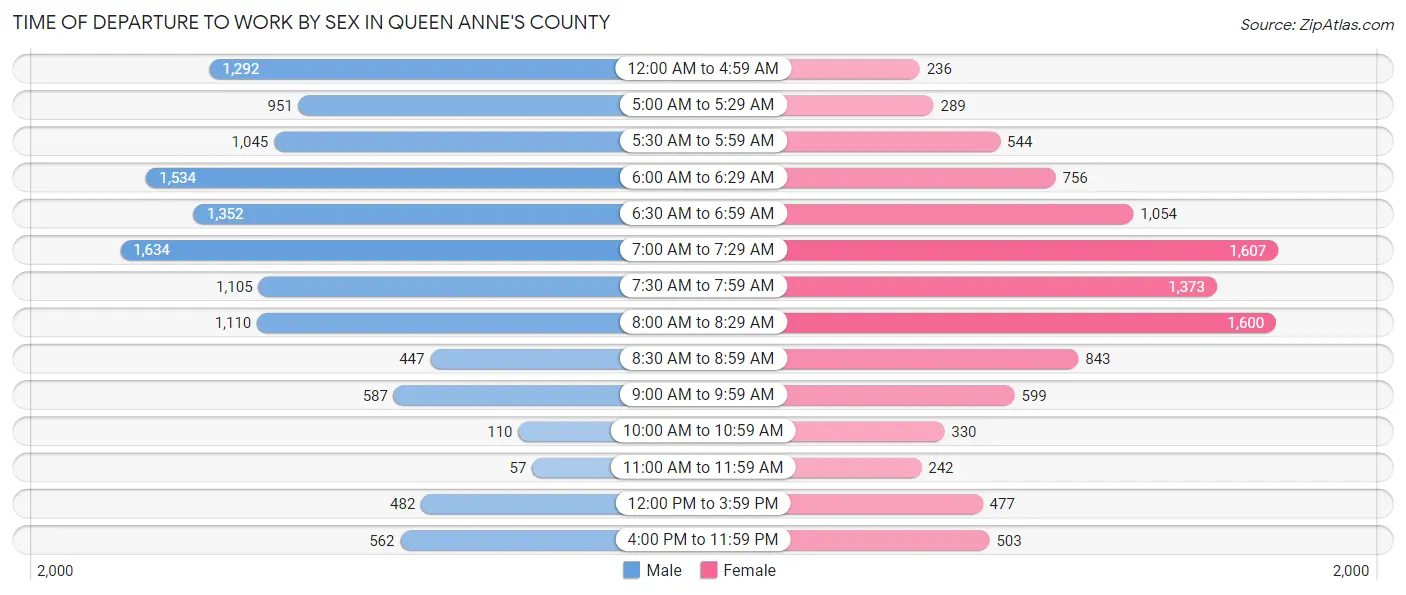
| Time of Departure | Male | Female |
| 12:00 AM to 4:59 AM | 1,292 (10.5%) | 236 (2.3%) |
| 5:00 AM to 5:29 AM | 951 (7.7%) | 289 (2.8%) |
| 5:30 AM to 5:59 AM | 1,045 (8.5%) | 544 (5.2%) |
| 6:00 AM to 6:29 AM | 1,534 (12.5%) | 756 (7.2%) |
| 6:30 AM to 6:59 AM | 1,352 (11.0%) | 1,054 (10.1%) |
| 7:00 AM to 7:29 AM | 1,634 (13.3%) | 1,607 (15.4%) |
| 7:30 AM to 7:59 AM | 1,105 (9.0%) | 1,373 (13.1%) |
| 8:00 AM to 8:29 AM | 1,110 (9.0%) | 1,600 (15.3%) |
| 8:30 AM to 8:59 AM | 447 (3.6%) | 843 (8.1%) |
| 9:00 AM to 9:59 AM | 587 (4.8%) | 599 (5.7%) |
| 10:00 AM to 10:59 AM | 110 (0.9%) | 330 (3.2%) |
| 11:00 AM to 11:59 AM | 57 (0.5%) | 242 (2.3%) |
| 12:00 PM to 3:59 PM | 482 (3.9%) | 477 (4.6%) |
| 4:00 PM to 11:59 PM | 562 (4.6%) | 503 (4.8%) |
| Total | 12,268 (100.0%) | 10,453 (100.0%) |
Housing Occupancy in Queen Anne's County
Occupancy by Ownership in Queen Anne's County
Of the total 19,351 dwellings in Queen Anne's County, owner-occupied units account for 15,760 (81.4%), while renter-occupied units make up 3,591 (18.6%).
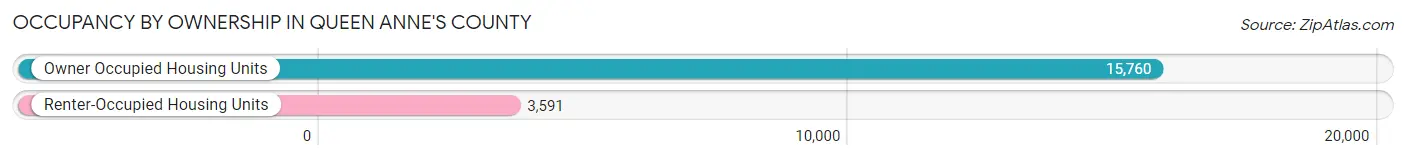
| Occupancy | # Housing Units | % Housing Units |
| Owner Occupied Housing Units | 15,760 | 81.4% |
| Renter-Occupied Housing Units | 3,591 | 18.6% |
| Total Occupied Housing Units | 19,351 | 100.0% |
Occupancy by Household Size in Queen Anne's County
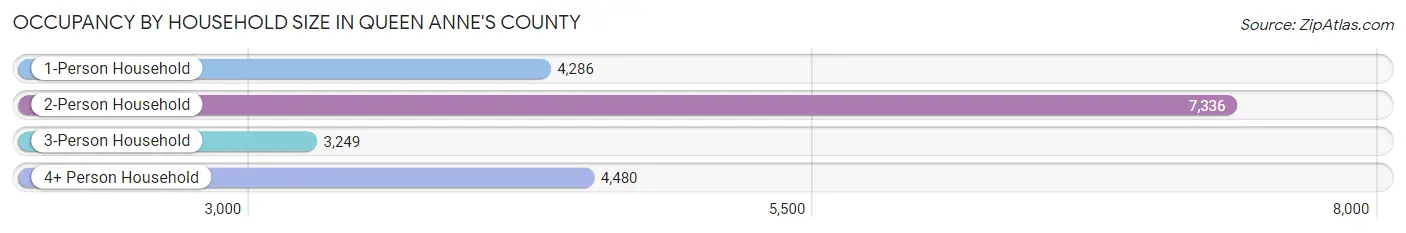
| Household Size | # Housing Units | % Housing Units |
| 1-Person Household | 4,286 | 22.2% |
| 2-Person Household | 7,336 | 37.9% |
| 3-Person Household | 3,249 | 16.8% |
| 4+ Person Household | 4,480 | 23.2% |
| Total Housing Units | 19,351 | 100.0% |
Occupancy by Ownership by Household Size in Queen Anne's County
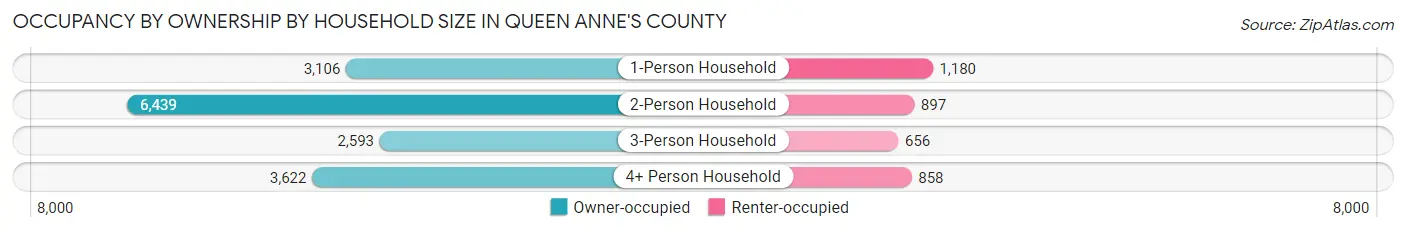
| Household Size | Owner-occupied | Renter-occupied |
| 1-Person Household | 3,106 (72.5%) | 1,180 (27.5%) |
| 2-Person Household | 6,439 (87.8%) | 897 (12.2%) |
| 3-Person Household | 2,593 (79.8%) | 656 (20.2%) |
| 4+ Person Household | 3,622 (80.8%) | 858 (19.2%) |
| Total Housing Units | 15,760 (81.4%) | 3,591 (18.6%) |
Occupancy by Educational Attainment in Queen Anne's County
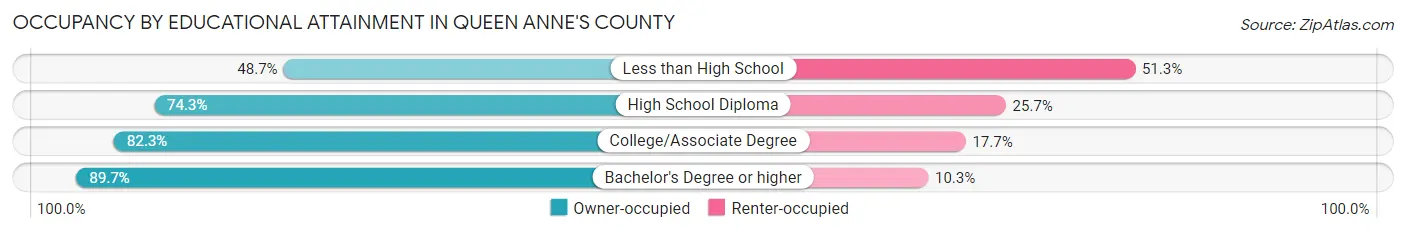
| Household Size | Owner-occupied | Renter-occupied |
| Less than High School | 558 (48.7%) | 588 (51.3%) |
| High School Diploma | 3,420 (74.3%) | 1,181 (25.7%) |
| College/Associate Degree | 4,694 (82.3%) | 1,010 (17.7%) |
| Bachelor's Degree or higher | 7,088 (89.7%) | 812 (10.3%) |
Occupancy by Age of Householder in Queen Anne's County
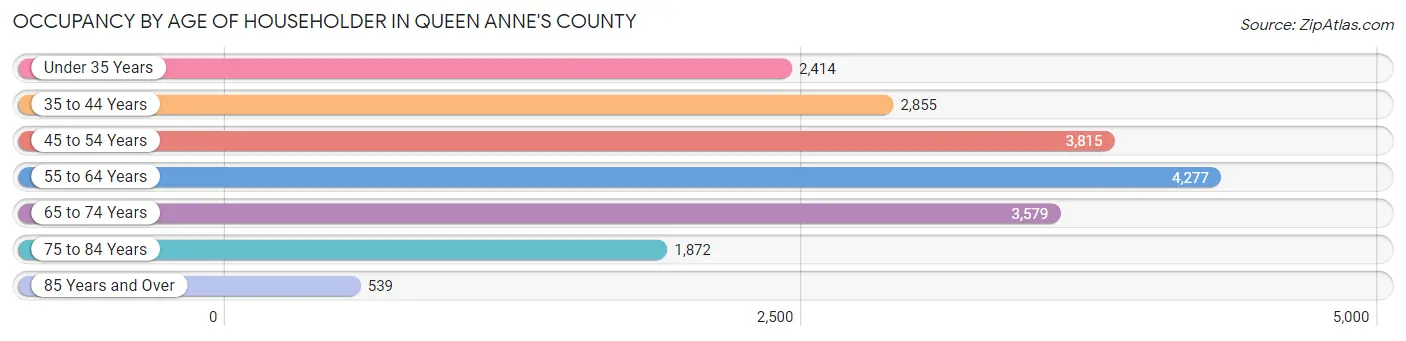
| Age Bracket | # Households | % Households |
| Under 35 Years | 2,414 | 12.5% |
| 35 to 44 Years | 2,855 | 14.7% |
| 45 to 54 Years | 3,815 | 19.7% |
| 55 to 64 Years | 4,277 | 22.1% |
| 65 to 74 Years | 3,579 | 18.5% |
| 75 to 84 Years | 1,872 | 9.7% |
| 85 Years and Over | 539 | 2.8% |
| Total | 19,351 | 100.0% |
Housing Finances in Queen Anne's County
Median Income by Occupancy in Queen Anne's County
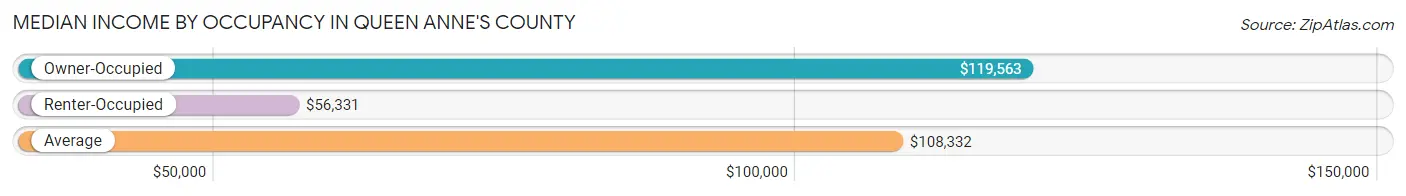
| Occupancy Type | # Households | Median Income |
| Owner-Occupied | 15,760 (81.4%) | $119,563 |
| Renter-Occupied | 3,591 (18.6%) | $56,331 |
| Average | 19,351 (100.0%) | $108,332 |
Occupancy by Householder Income Bracket in Queen Anne's County
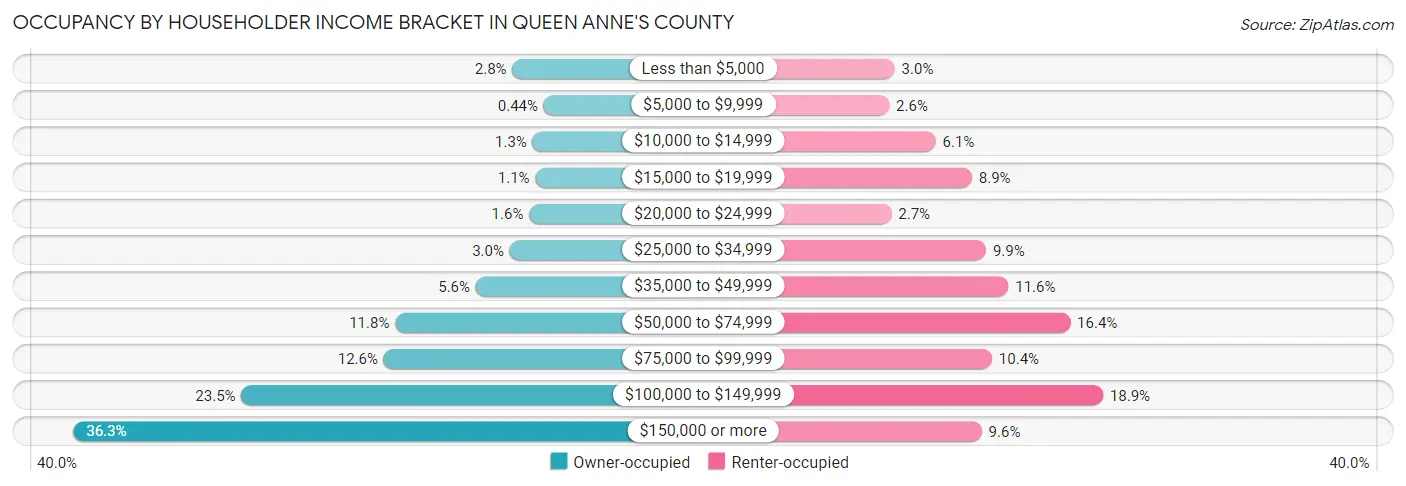
| Income Bracket | Owner-occupied | Renter-occupied |
| Less than $5,000 | 446 (2.8%) | 107 (3.0%) |
| $5,000 to $9,999 | 69 (0.4%) | 92 (2.6%) |
| $10,000 to $14,999 | 203 (1.3%) | 219 (6.1%) |
| $15,000 to $19,999 | 170 (1.1%) | 318 (8.9%) |
| $20,000 to $24,999 | 245 (1.5%) | 98 (2.7%) |
| $25,000 to $34,999 | 477 (3.0%) | 357 (9.9%) |
| $35,000 to $49,999 | 886 (5.6%) | 418 (11.6%) |
| $50,000 to $74,999 | 1,854 (11.8%) | 587 (16.4%) |
| $75,000 to $99,999 | 1,991 (12.6%) | 373 (10.4%) |
| $100,000 to $149,999 | 3,700 (23.5%) | 677 (18.9%) |
| $150,000 or more | 5,719 (36.3%) | 345 (9.6%) |
| Total | 15,760 (100.0%) | 3,591 (100.0%) |
Monthly Housing Cost Tiers in Queen Anne's County
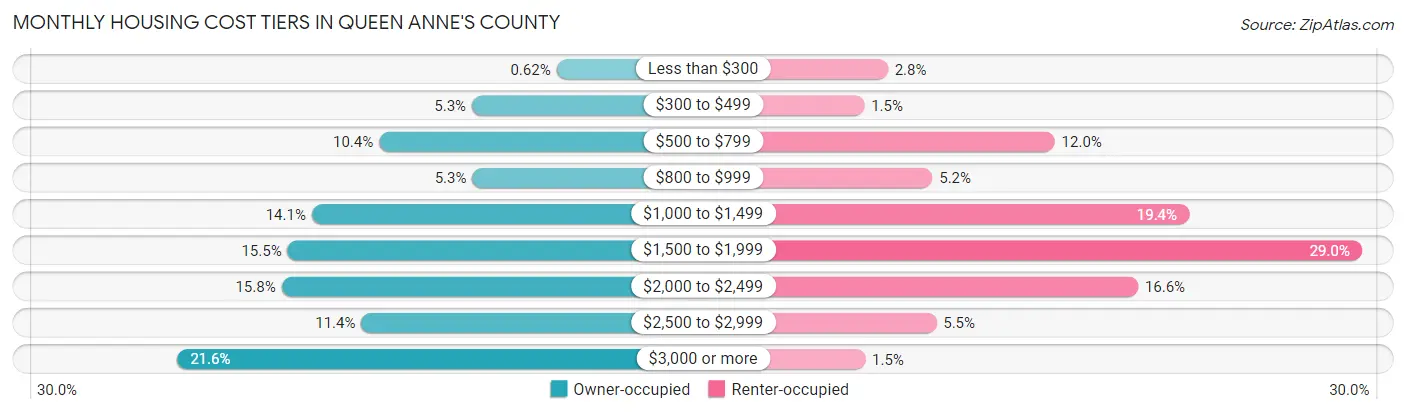
| Monthly Cost | Owner-occupied | Renter-occupied |
| Less than $300 | 97 (0.6%) | 100 (2.8%) |
| $300 to $499 | 834 (5.3%) | 53 (1.5%) |
| $500 to $799 | 1,642 (10.4%) | 431 (12.0%) |
| $800 to $999 | 831 (5.3%) | 188 (5.2%) |
| $1,000 to $1,499 | 2,228 (14.1%) | 697 (19.4%) |
| $1,500 to $1,999 | 2,440 (15.5%) | 1,040 (29.0%) |
| $2,000 to $2,499 | 2,491 (15.8%) | 596 (16.6%) |
| $2,500 to $2,999 | 1,797 (11.4%) | 196 (5.5%) |
| $3,000 or more | 3,400 (21.6%) | 55 (1.5%) |
| Total | 15,760 (100.0%) | 3,591 (100.0%) |
Physical Housing Characteristics in Queen Anne's County
Housing Structures in Queen Anne's County
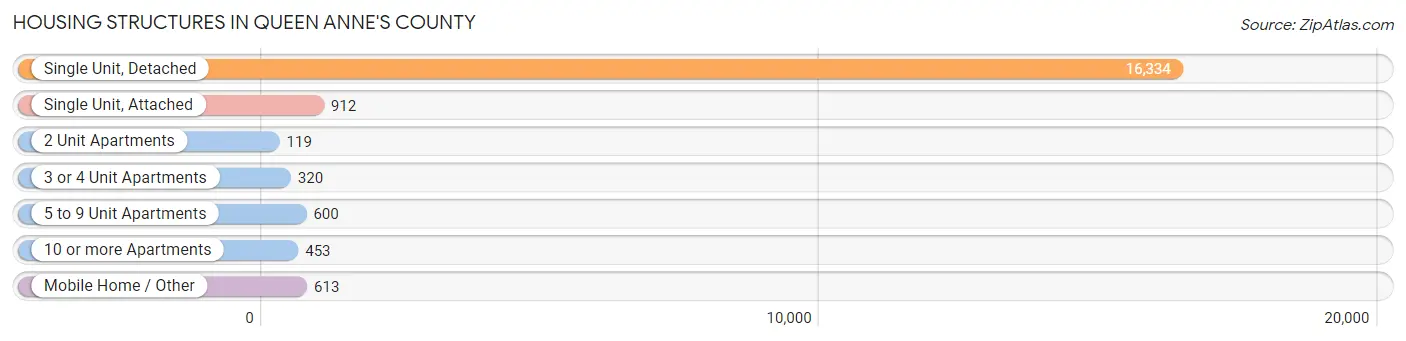
| Structure Type | # Housing Units | % Housing Units |
| Single Unit, Detached | 16,334 | 84.4% |
| Single Unit, Attached | 912 | 4.7% |
| 2 Unit Apartments | 119 | 0.6% |
| 3 or 4 Unit Apartments | 320 | 1.7% |
| 5 to 9 Unit Apartments | 600 | 3.1% |
| 10 or more Apartments | 453 | 2.3% |
| Mobile Home / Other | 613 | 3.2% |
| Total | 19,351 | 100.0% |
Housing Structures by Occupancy in Queen Anne's County
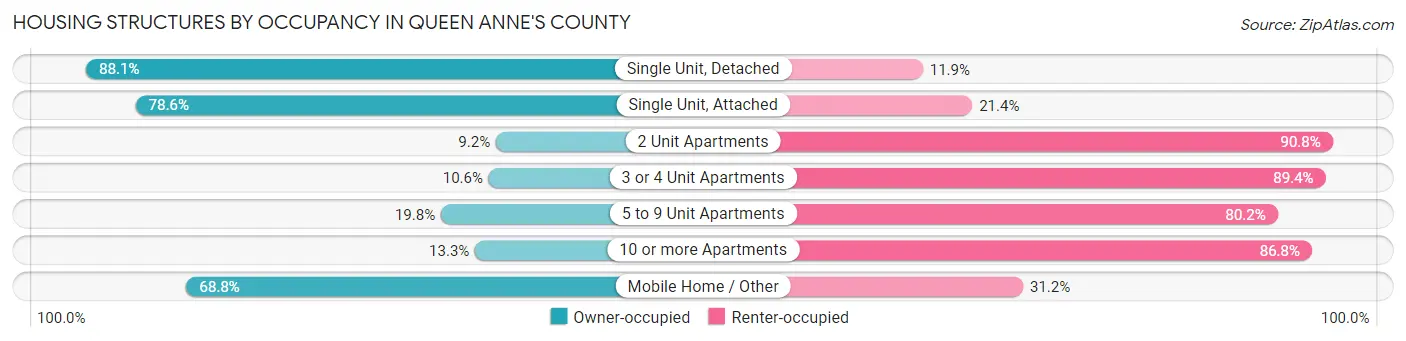
| Structure Type | Owner-occupied | Renter-occupied |
| Single Unit, Detached | 14,397 (88.1%) | 1,937 (11.9%) |
| Single Unit, Attached | 717 (78.6%) | 195 (21.4%) |
| 2 Unit Apartments | 11 (9.2%) | 108 (90.8%) |
| 3 or 4 Unit Apartments | 34 (10.6%) | 286 (89.4%) |
| 5 to 9 Unit Apartments | 119 (19.8%) | 481 (80.2%) |
| 10 or more Apartments | 60 (13.3%) | 393 (86.8%) |
| Mobile Home / Other | 422 (68.8%) | 191 (31.2%) |
| Total | 15,760 (81.4%) | 3,591 (18.6%) |
Housing Structures by Number of Rooms in Queen Anne's County
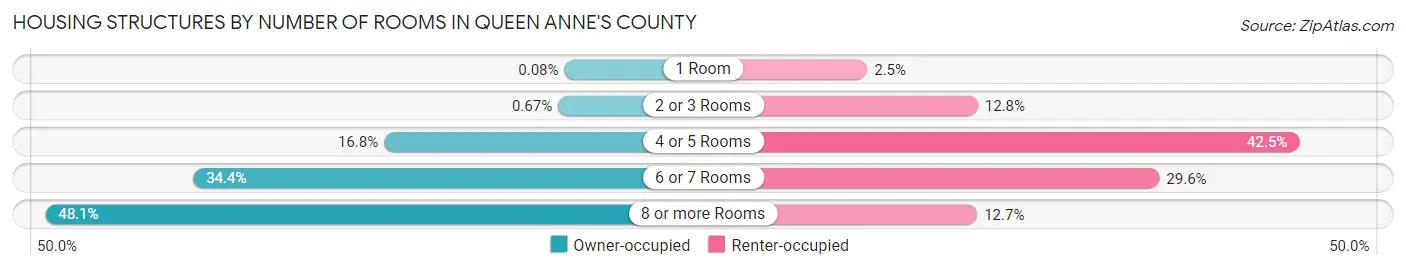
| Number of Rooms | Owner-occupied | Renter-occupied |
| 1 Room | 13 (0.1%) | 91 (2.5%) |
| 2 or 3 Rooms | 106 (0.7%) | 458 (12.8%) |
| 4 or 5 Rooms | 2,642 (16.8%) | 1,525 (42.5%) |
| 6 or 7 Rooms | 5,422 (34.4%) | 1,061 (29.5%) |
| 8 or more Rooms | 7,577 (48.1%) | 456 (12.7%) |
| Total | 15,760 (100.0%) | 3,591 (100.0%) |
Housing Structure by Heating Type in Queen Anne's County
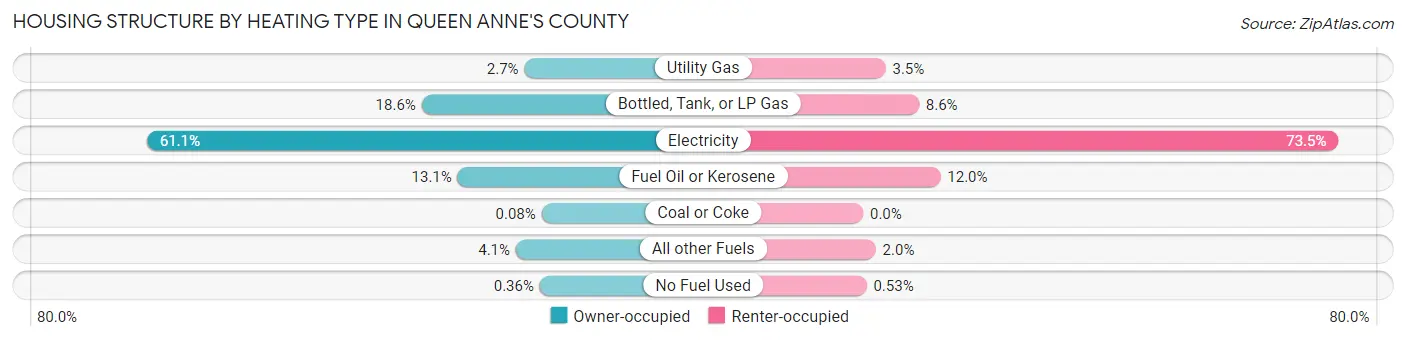
| Heating Type | Owner-occupied | Renter-occupied |
| Utility Gas | 430 (2.7%) | 125 (3.5%) |
| Bottled, Tank, or LP Gas | 2,934 (18.6%) | 310 (8.6%) |
| Electricity | 9,630 (61.1%) | 2,638 (73.5%) |
| Fuel Oil or Kerosene | 2,058 (13.1%) | 429 (11.9%) |
| Coal or Coke | 12 (0.1%) | 0 (0.0%) |
| All other Fuels | 640 (4.1%) | 70 (1.9%) |
| No Fuel Used | 56 (0.4%) | 19 (0.5%) |
| Total | 15,760 (100.0%) | 3,591 (100.0%) |
Household Vehicle Usage in Queen Anne's County
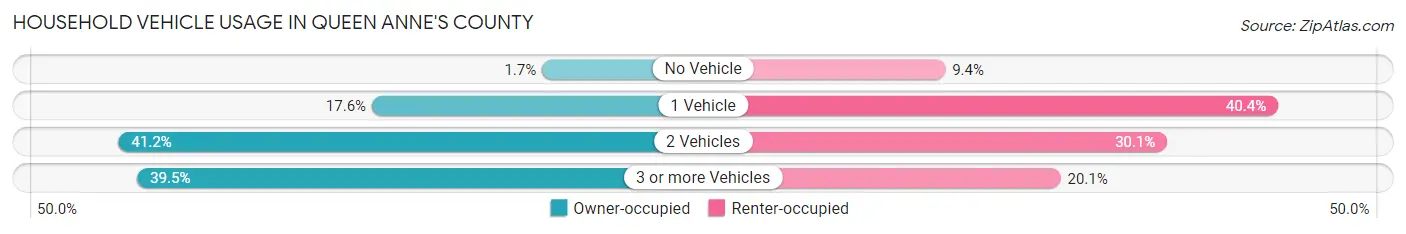
| Vehicles per Household | Owner-occupied | Renter-occupied |
| No Vehicle | 268 (1.7%) | 336 (9.4%) |
| 1 Vehicle | 2,770 (17.6%) | 1,452 (40.4%) |
| 2 Vehicles | 6,499 (41.2%) | 1,080 (30.1%) |
| 3 or more Vehicles | 6,223 (39.5%) | 723 (20.1%) |
| Total | 15,760 (100.0%) | 3,591 (100.0%) |
Real Estate & Mortgages in Queen Anne's County
Real Estate and Mortgage Overview in Queen Anne's County
| Characteristic | Without Mortgage | With Mortgage |
| Housing Units | 4,124 | 11,636 |
| Median Property Value | $412,900 | $424,900 |
| Median Household Income | $95,399 | $4,727 |
| Monthly Housing Costs | $737 | $3,399 |
| Real Estate Taxes | $3,480 | $292 |
Property Value by Mortgage Status in Queen Anne's County
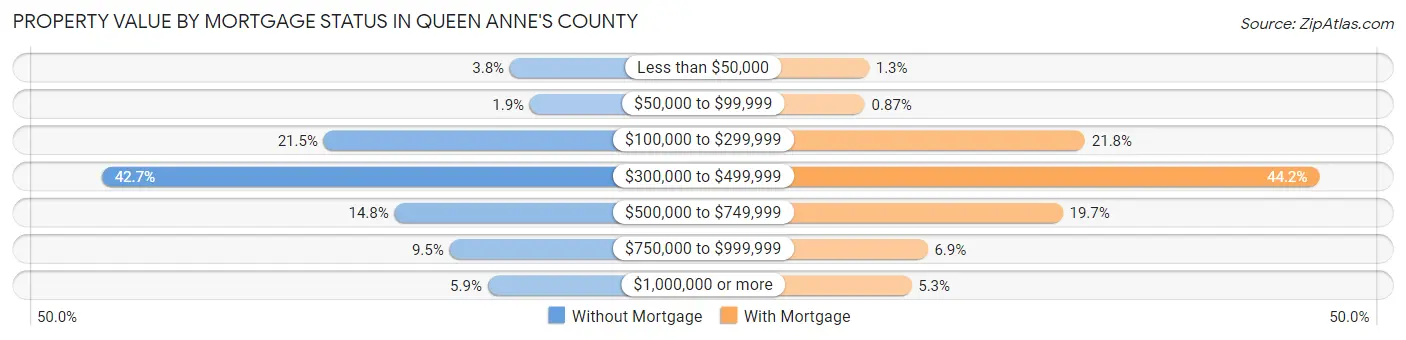
| Property Value | Without Mortgage | With Mortgage |
| Less than $50,000 | 156 (3.8%) | 147 (1.3%) |
| $50,000 to $99,999 | 77 (1.9%) | 101 (0.9%) |
| $100,000 to $299,999 | 887 (21.5%) | 2,541 (21.8%) |
| $300,000 to $499,999 | 1,759 (42.6%) | 5,138 (44.2%) |
| $500,000 to $749,999 | 609 (14.8%) | 2,294 (19.7%) |
| $750,000 to $999,999 | 393 (9.5%) | 797 (6.9%) |
| $1,000,000 or more | 243 (5.9%) | 618 (5.3%) |
| Total | 4,124 (100.0%) | 11,636 (100.0%) |
Household Income by Mortgage Status in Queen Anne's County
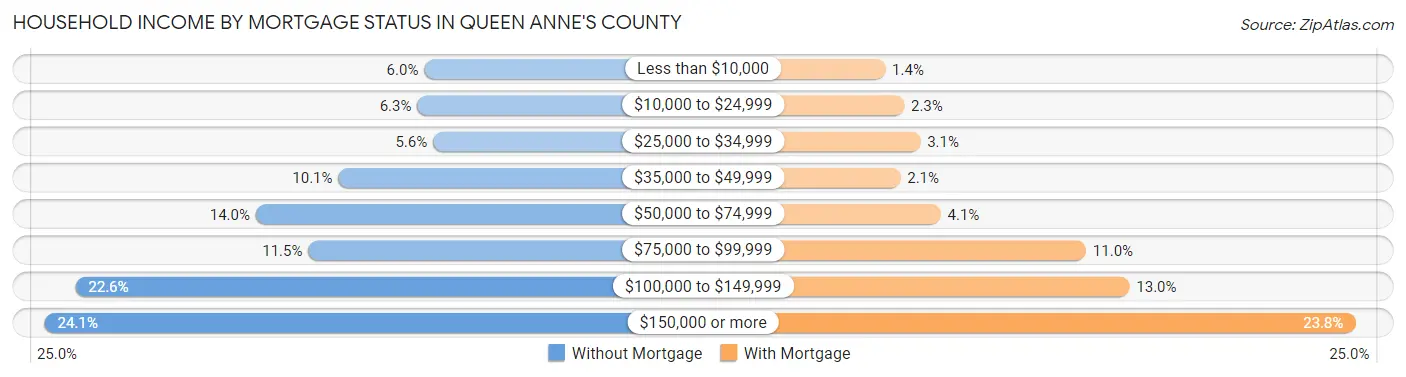
| Household Income | Without Mortgage | With Mortgage |
| Less than $10,000 | 246 (6.0%) | 164 (1.4%) |
| $10,000 to $24,999 | 260 (6.3%) | 269 (2.3%) |
| $25,000 to $34,999 | 229 (5.6%) | 358 (3.1%) |
| $35,000 to $49,999 | 415 (10.1%) | 248 (2.1%) |
| $50,000 to $74,999 | 577 (14.0%) | 471 (4.1%) |
| $75,000 to $99,999 | 474 (11.5%) | 1,277 (11.0%) |
| $100,000 to $149,999 | 931 (22.6%) | 1,517 (13.0%) |
| $150,000 or more | 992 (24.0%) | 2,769 (23.8%) |
| Total | 4,124 (100.0%) | 11,636 (100.0%) |
Property Value to Household Income Ratio in Queen Anne's County
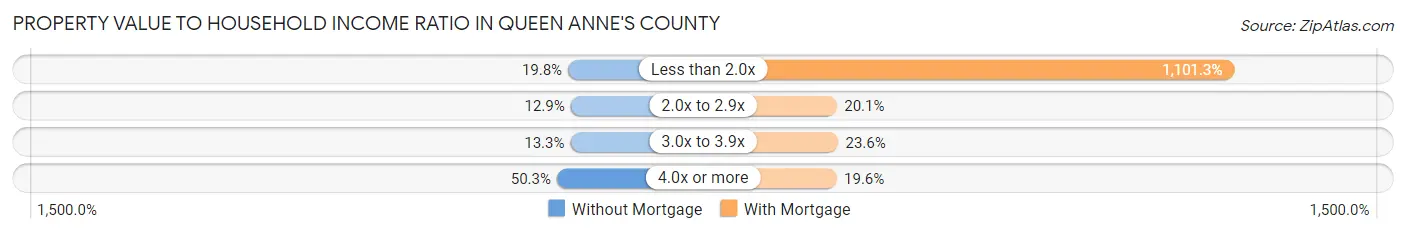
| Value-to-Income Ratio | Without Mortgage | With Mortgage |
| Less than 2.0x | 818 (19.8%) | 128,150 (1,101.3%) |
| 2.0x to 2.9x | 530 (12.9%) | 2,339 (20.1%) |
| 3.0x to 3.9x | 550 (13.3%) | 2,742 (23.6%) |
| 4.0x or more | 2,074 (50.3%) | 2,281 (19.6%) |
| Total | 4,124 (100.0%) | 11,636 (100.0%) |
Real Estate Taxes by Mortgage Status in Queen Anne's County
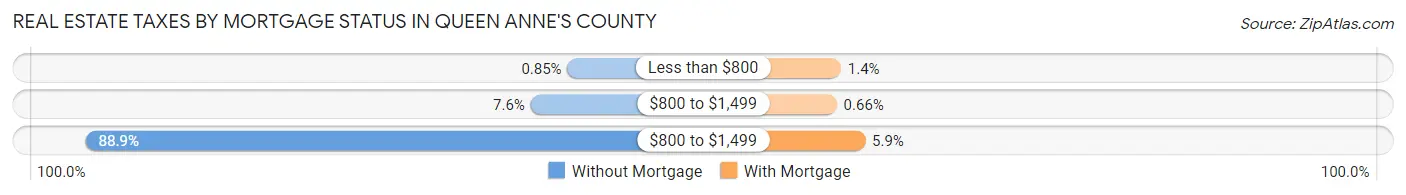
| Property Taxes | Without Mortgage | With Mortgage |
| Less than $800 | 35 (0.9%) | 165 (1.4%) |
| $800 to $1,499 | 312 (7.6%) | 77 (0.7%) |
| $800 to $1,499 | 3,664 (88.8%) | 681 (5.9%) |
| Total | 4,124 (100.0%) | 11,636 (100.0%) |
Health & Disability in Queen Anne's County
Health Insurance Coverage by Age in Queen Anne's County
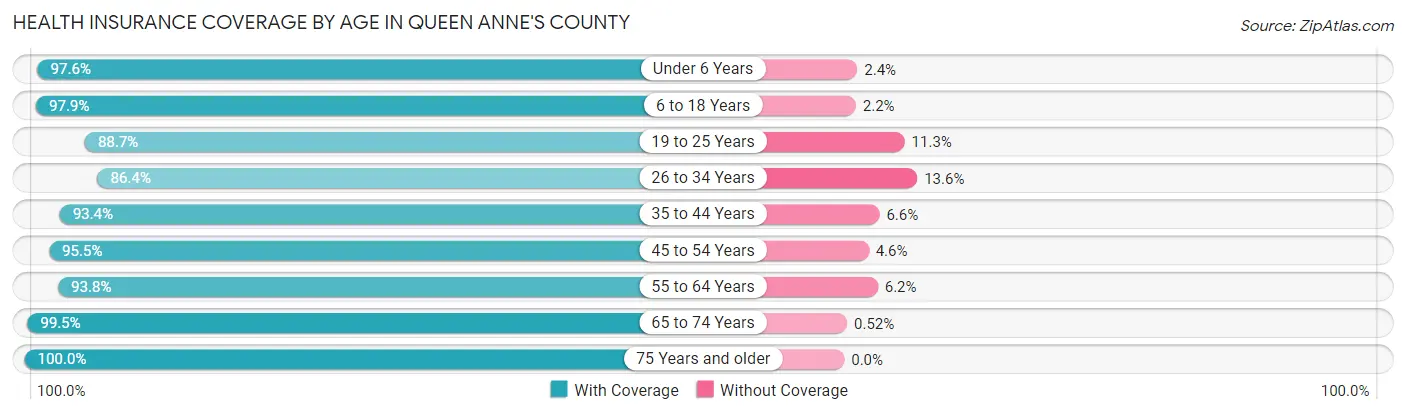
| Age Bracket | With Coverage | Without Coverage |
| Under 6 Years | 3,075 (97.6%) | 77 (2.4%) |
| 6 to 18 Years | 7,788 (97.9%) | 171 (2.1%) |
| 19 to 25 Years | 3,231 (88.7%) | 410 (11.3%) |
| 26 to 34 Years | 4,091 (86.4%) | 644 (13.6%) |
| 35 to 44 Years | 5,359 (93.4%) | 376 (6.6%) |
| 45 to 54 Years | 6,538 (95.5%) | 312 (4.5%) |
| 55 to 64 Years | 7,526 (93.8%) | 501 (6.2%) |
| 65 to 74 Years | 5,725 (99.5%) | 30 (0.5%) |
| 75 Years and older | 4,071 (100.0%) | 0 (0.0%) |
| Total | 47,404 (95.0%) | 2,521 (5.1%) |
Health Insurance Coverage by Citizenship Status in Queen Anne's County
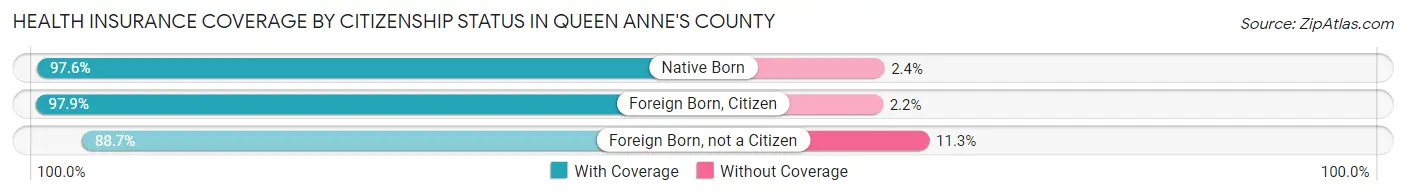
| Citizenship Status | With Coverage | Without Coverage |
| Native Born | 3,075 (97.6%) | 77 (2.4%) |
| Foreign Born, Citizen | 7,788 (97.9%) | 171 (2.1%) |
| Foreign Born, not a Citizen | 3,231 (88.7%) | 410 (11.3%) |
Health Insurance Coverage by Household Income in Queen Anne's County
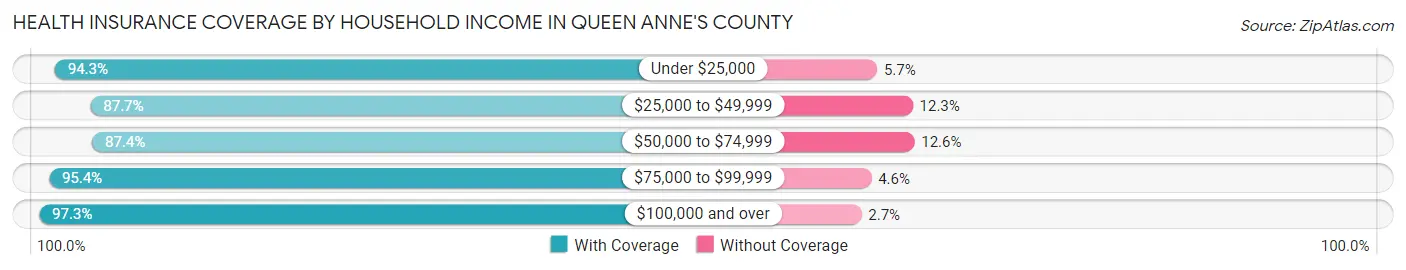
| Household Income | With Coverage | Without Coverage |
| Under $25,000 | 2,583 (94.3%) | 155 (5.7%) |
| $25,000 to $49,999 | 3,959 (87.7%) | 557 (12.3%) |
| $50,000 to $74,999 | 4,691 (87.4%) | 679 (12.6%) |
| $75,000 to $99,999 | 5,908 (95.4%) | 283 (4.6%) |
| $100,000 and over | 30,164 (97.3%) | 842 (2.7%) |
Public vs Private Health Insurance Coverage by Age in Queen Anne's County
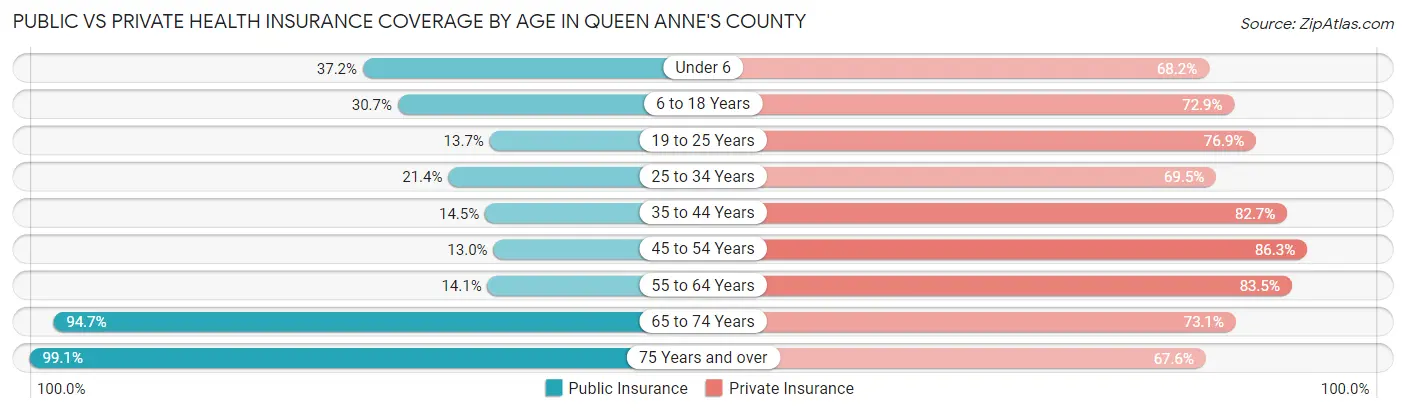
| Age Bracket | Public Insurance | Private Insurance |
| Under 6 | 1,173 (37.2%) | 2,148 (68.1%) |
| 6 to 18 Years | 2,446 (30.7%) | 5,799 (72.9%) |
| 19 to 25 Years | 498 (13.7%) | 2,800 (76.9%) |
| 25 to 34 Years | 1,011 (21.3%) | 3,290 (69.5%) |
| 35 to 44 Years | 834 (14.5%) | 4,740 (82.7%) |
| 45 to 54 Years | 889 (13.0%) | 5,914 (86.3%) |
| 55 to 64 Years | 1,130 (14.1%) | 6,703 (83.5%) |
| 65 to 74 Years | 5,448 (94.7%) | 4,208 (73.1%) |
| 75 Years and over | 4,034 (99.1%) | 2,750 (67.5%) |
| Total | 17,463 (35.0%) | 38,352 (76.8%) |
Disability Status by Sex by Age in Queen Anne's County
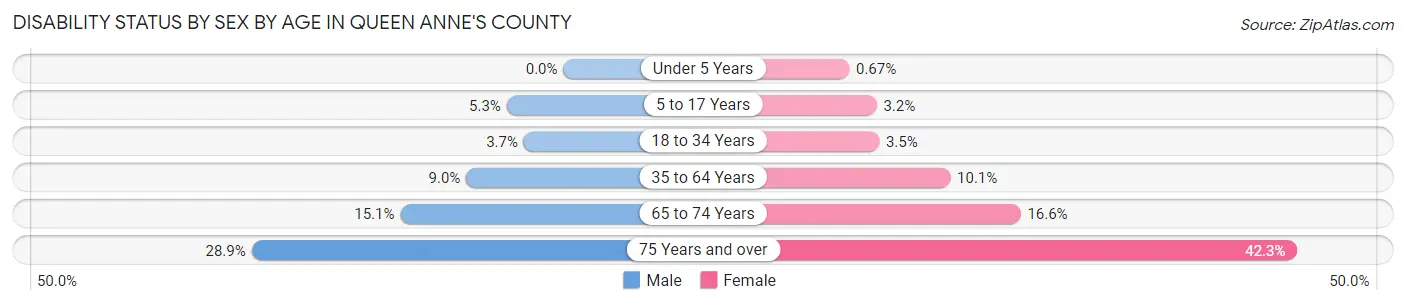
| Age Bracket | Male | Female |
| Under 5 Years | 0 (0.0%) | 8 (0.7%) |
| 5 to 17 Years | 218 (5.3%) | 129 (3.2%) |
| 18 to 34 Years | 165 (3.7%) | 150 (3.5%) |
| 35 to 64 Years | 917 (9.0%) | 1,050 (10.1%) |
| 65 to 74 Years | 429 (15.1%) | 484 (16.6%) |
| 75 Years and over | 514 (28.9%) | 970 (42.3%) |
Disability Class by Sex by Age in Queen Anne's County
Disability Class: Hearing Difficulty
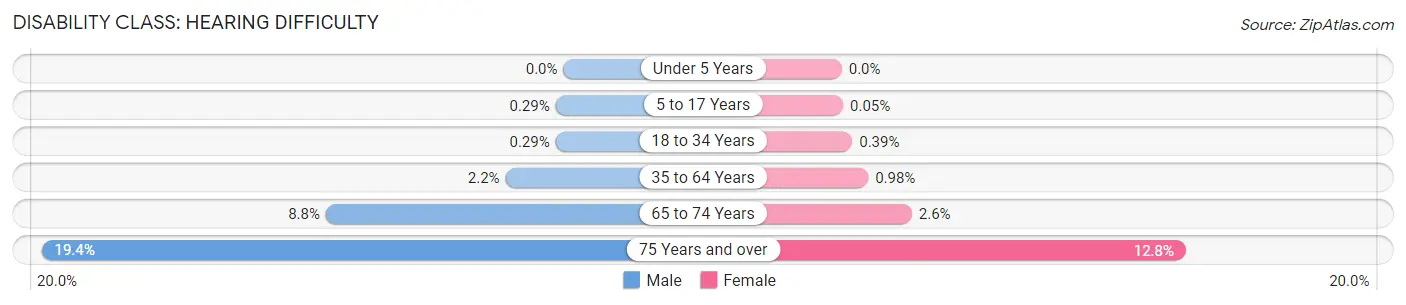
| Age Bracket | Male | Female |
| Under 5 Years | 0 (0.0%) | 0 (0.0%) |
| 5 to 17 Years | 12 (0.3%) | 2 (0.1%) |
| 18 to 34 Years | 13 (0.3%) | 17 (0.4%) |
| 35 to 64 Years | 219 (2.1%) | 102 (1.0%) |
| 65 to 74 Years | 250 (8.8%) | 76 (2.6%) |
| 75 Years and over | 344 (19.4%) | 293 (12.8%) |
Disability Class: Vision Difficulty
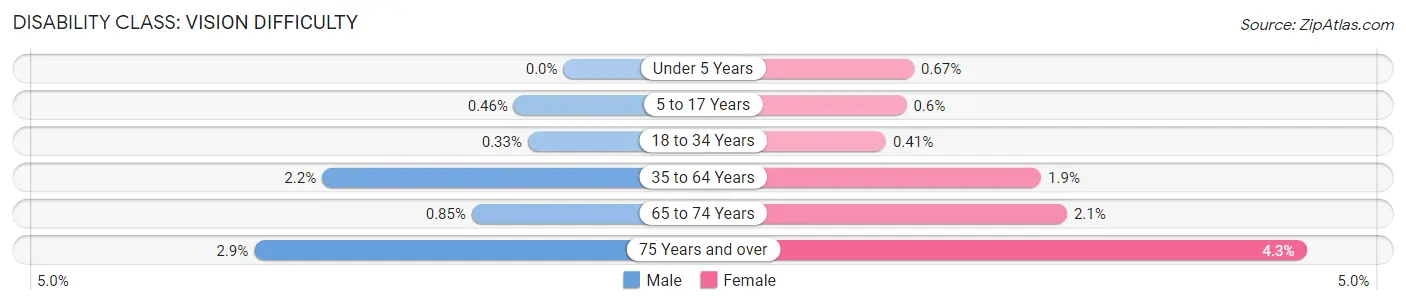
| Age Bracket | Male | Female |
| Under 5 Years | 0 (0.0%) | 8 (0.7%) |
| 5 to 17 Years | 19 (0.5%) | 24 (0.6%) |
| 18 to 34 Years | 15 (0.3%) | 18 (0.4%) |
| 35 to 64 Years | 228 (2.2%) | 193 (1.8%) |
| 65 to 74 Years | 24 (0.9%) | 61 (2.1%) |
| 75 Years and over | 51 (2.9%) | 99 (4.3%) |
Disability Class: Cognitive Difficulty
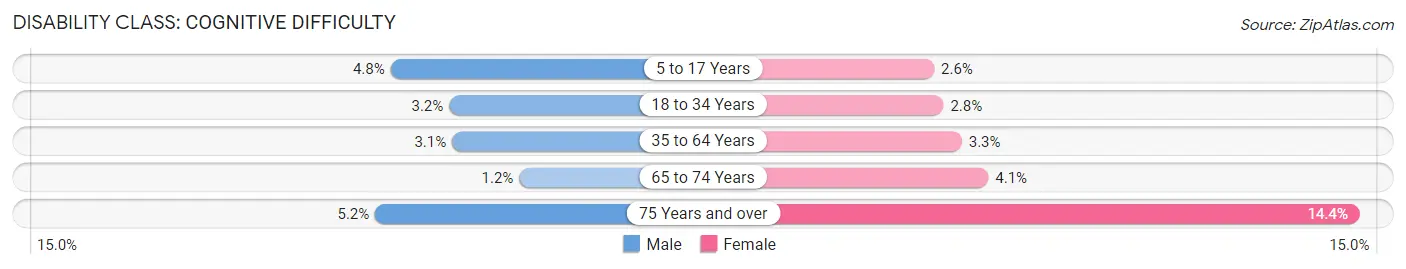
| Age Bracket | Male | Female |
| 5 to 17 Years | 199 (4.8%) | 103 (2.6%) |
| 18 to 34 Years | 143 (3.2%) | 123 (2.8%) |
| 35 to 64 Years | 315 (3.1%) | 349 (3.3%) |
| 65 to 74 Years | 35 (1.2%) | 119 (4.1%) |
| 75 Years and over | 93 (5.2%) | 331 (14.4%) |
Disability Class: Ambulatory Difficulty
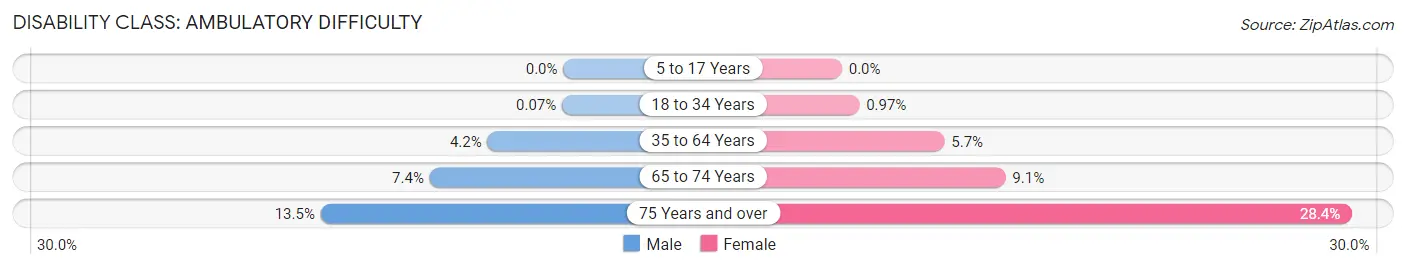
| Age Bracket | Male | Female |
| 5 to 17 Years | 0 (0.0%) | 0 (0.0%) |
| 18 to 34 Years | 3 (0.1%) | 42 (1.0%) |
| 35 to 64 Years | 429 (4.2%) | 597 (5.7%) |
| 65 to 74 Years | 211 (7.4%) | 266 (9.1%) |
| 75 Years and over | 240 (13.5%) | 652 (28.4%) |
Disability Class: Self-Care Difficulty
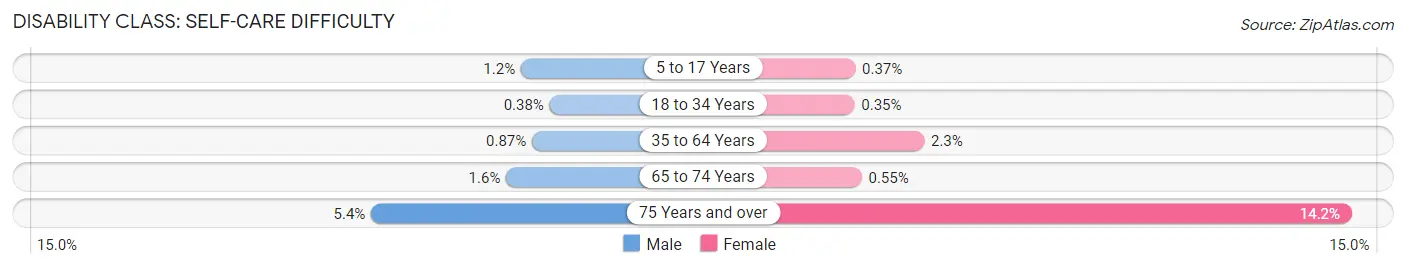
| Age Bracket | Male | Female |
| 5 to 17 Years | 49 (1.2%) | 15 (0.4%) |
| 18 to 34 Years | 17 (0.4%) | 15 (0.4%) |
| 35 to 64 Years | 88 (0.9%) | 239 (2.3%) |
| 65 to 74 Years | 45 (1.6%) | 16 (0.5%) |
| 75 Years and over | 95 (5.3%) | 326 (14.2%) |
Technology Access in Queen Anne's County
Computing Device Access in Queen Anne's County
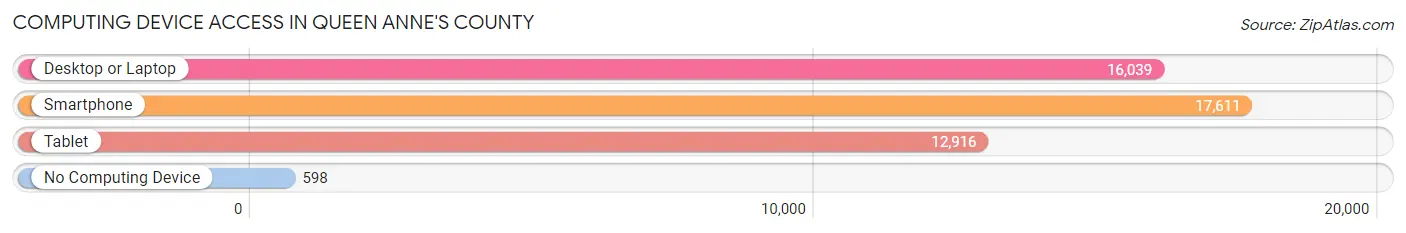
| Device Type | # Households | % Households |
| Desktop or Laptop | 16,039 | 82.9% |
| Smartphone | 17,611 | 91.0% |
| Tablet | 12,916 | 66.7% |
| No Computing Device | 598 | 3.1% |
| Total | 19,351 | 100.0% |
Internet Access in Queen Anne's County
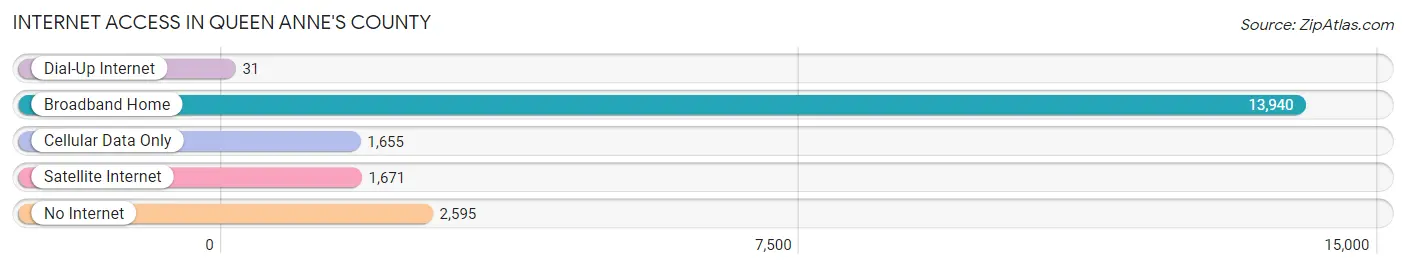
| Internet Type | # Households | % Households |
| Dial-Up Internet | 31 | 0.2% |
| Broadband Home | 13,940 | 72.0% |
| Cellular Data Only | 1,655 | 8.6% |
| Satellite Internet | 1,671 | 8.6% |
| No Internet | 2,595 | 13.4% |
| Total | 19,351 | 100.0% |
Queen Anne's County Summary
Queen Anne’s County is located in the Eastern Shore region of Maryland, and is bordered by Kent County to the north, Talbot County to the east, and the Chesapeake Bay to the west. The county seat is Centreville, and the county is named for Queen Anne of Great Britain, who reigned from 1702 to 1714. Queen Anne’s County is home to a population of approximately 48,000 people, and is the second least populous county in Maryland.
History
Queen Anne’s County was established in 1706, and was one of the original counties of Maryland. The county was named for Queen Anne of Great Britain, who reigned from 1702 to 1714. The county was originally part of Talbot County, and was created to provide a more convenient court location for the residents of the area.
The county was home to a number of prominent historical figures, including William Paca, a signer of the Declaration of Independence, and Thomas Stone, a signer of the United States Constitution. The county was also home to the first African-American church in Maryland, the African Union Church, which was founded in 1791.
Geography
Queen Anne’s County is located in the Eastern Shore region of Maryland, and is bordered by Kent County to the north, Talbot County to the east, and the Chesapeake Bay to the west. The county is approximately 545 square miles in size, and is the second least populous county in Maryland.
The county is divided into two distinct regions, the Eastern Shore and the Western Shore. The Eastern Shore is characterized by flat, low-lying terrain, while the Western Shore is more hilly and wooded. The county is home to a number of rivers, including the Chester, Choptank, and Wye Rivers.
Economy
Queen Anne’s County is home to a diverse economy, with a number of industries providing employment opportunities for its residents. The county’s largest employers include the University of Maryland Medical Center, the Queen Anne’s County Public Schools, and the Queen Anne’s County Government.
The county is also home to a number of agricultural operations, including poultry, dairy, and grain farming. The county is also home to a number of wineries, breweries, and distilleries, as well as a number of seafood processing plants.
Demographics
As of the 2010 census, Queen Anne’s County had a population of 47,798 people. The racial makeup of the county was 87.3% White, 8.2% African American, 0.7% Native American, 0.9% Asian, 0.1% Pacific Islander, 1.2% from other races, and 1.7% from two or more races. Hispanic or Latino of any race were 3.2% of the population.
The median household income in the county was $68,945, and the median family income was $77,845. The per capita income for the county was $30,945. Approximately 8.7% of the population was below the poverty line.
Queen Anne’s County is home to a number of educational institutions, including Chesapeake College, the University of Maryland Eastern Shore, and Washington College. The county is also home to a number of historical sites, including the Queen Anne’s County Courthouse, the Queen Anne’s County Historical Society, and the Queen Anne’s County Museum.
Common Questions
What is the Total Population of Queen Anne's County?
Total Population of Queen Anne's County is 50,316.
What is the Total Male Population of Queen Anne's County?
Total Male Population of Queen Anne's County is 25,045.
What is the Total Female Population of Queen Anne's County?
Total Female Population of Queen Anne's County is 25,271.
What is the Ratio of Males per 100 Females in Queen Anne's County?
There are 99.11 Males per 100 Females in Queen Anne's County.
What is the Ratio of Females per 100 Males in Queen Anne's County?
There are 100.90 Females per 100 Males in Queen Anne's County.
What is the Median Population Age in Queen Anne's County?
Median Population Age in Queen Anne's County is 44.6 Years.
What is the Average Family Size in Queen Anne's County
Average Family Size in Queen Anne's County is 3.0 People.
What is the Average Household Size in Queen Anne's County
Average Household Size in Queen Anne's County is 2.6 People.
What is Per Capita Income in Queen Anne's County?
Per Capita income in Queen Anne's County is $52,652.
What is the Median Family Income in Queen Anne's County?
Median Family Income in Queen Anne's County is $124,326.
What is the Median Household income in Queen Anne's County?
Median Household Income in Queen Anne's County is $108,332.
What is Income or Wage Gap in Queen Anne's County?
Income or Wage Gap in Queen Anne's County is 35.2%.
Women in Queen Anne's County earn 64.8 cents for every dollar earned by a man.
What is Inequality or Gini Index in Queen Anne's County?
Inequality or Gini Index in Queen Anne's County is 0.43.
How Large is the Labor Force in Queen Anne's County?
There are 27,243 People in the Labor Forcein in Queen Anne's County.
What is the Percentage of People in the Labor Force in Queen Anne's County?
66.6% of People are in the Labor Force in Queen Anne's County.
What is the Unemployment Rate in Queen Anne's County?
Unemployment Rate in Queen Anne's County is 3.6%.