Prince George's County, MD
Prince George's County Overview
957,189
TOTAL POPULATION
463,483
MALE POPULATION
493,706
FEMALE POPULATION
93.88
MALES / 100 FEMALES
106.52
FEMALES / 100 MALES
38.2
MEDIAN AGE
3.4
AVG FAMILY SIZE
2.8
AVG HOUSEHOLD SIZE
$43,833
PER CAPITA INCOME
$115,235
AVG FAMILY INCOME
$97,935
AVG HOUSEHOLD INCOME
3.4%
WAGE / INCOME GAP [ % ]
96.6¢/ $1
WAGE / INCOME GAP [ $ ]
$11,184
FAMILY INCOME DEFICIT
0.41
INEQUALITY / GINI INDEX
539,898
LABOR FORCE [ PEOPLE ]
70.3%
PERCENT IN LABOR FORCE
6.7%
UNEMPLOYMENT RATE
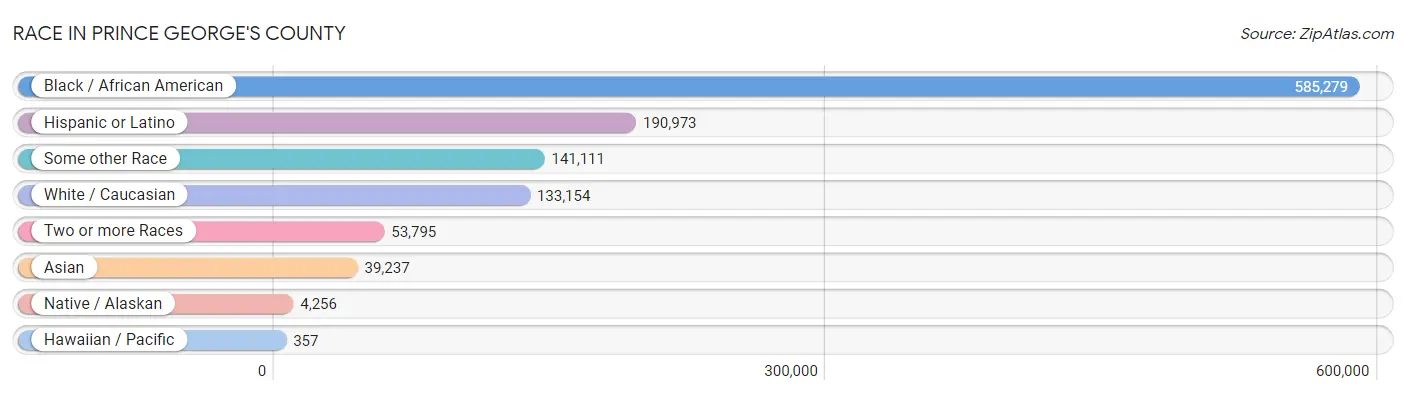
Race in Prince George's County
The most populous races in Prince George's County are Black / African American (585,279 | 61.2%), Hispanic or Latino (190,973 | 20.0%), and Some other Race (141,111 | 14.7%).
| Race | # Population | % Population |
| Asian | 39,237 | 4.1% |
| Black / African American | 585,279 | 61.2% |
| Hawaiian / Pacific | 357 | 0.0% |
| Hispanic or Latino | 190,973 | 20.0% |
| Native / Alaskan | 4,256 | 0.4% |
| White / Caucasian | 133,154 | 13.9% |
| Two or more Races | 53,795 | 5.6% |
| Some other Race | 141,111 | 14.7% |
| Total | 957,189 | 100.0% |
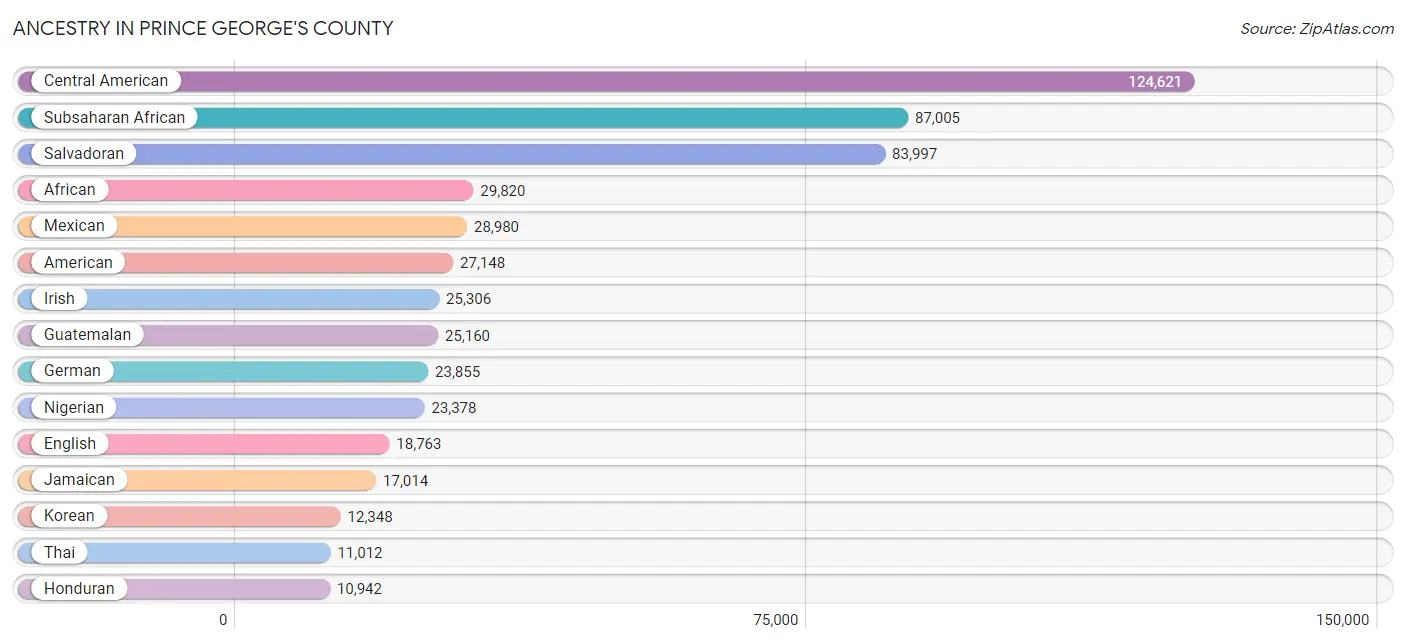
Ancestry in Prince George's County
The most populous ancestries reported in Prince George's County are Central American (124,621 | 13.0%), Subsaharan African (87,005 | 9.1%), Salvadoran (83,997 | 8.8%), African (29,820 | 3.1%), and Mexican (28,980 | 3.0%), together accounting for 37.0% of all Prince George's County residents.
| Ancestry | # Population | % Population |
| Afghan | 1,748 | 0.2% |
| African | 29,820 | 3.1% |
| Alaska Native | 9 | 0.0% |
| Albanian | 141 | 0.0% |
| Alsatian | 31 | 0.0% |
| American | 27,148 | 2.8% |
| Apache | 96 | 0.0% |
| Arab | 4,041 | 0.4% |
| Arapaho | 24 | 0.0% |
| Argentinean | 974 | 0.1% |
| Armenian | 338 | 0.0% |
| Australian | 132 | 0.0% |
| Austrian | 576 | 0.1% |
| Bahamian | 495 | 0.1% |
| Bangladeshi | 37 | 0.0% |
| Barbadian | 656 | 0.1% |
| Basque | 83 | 0.0% |
| Belgian | 202 | 0.0% |
| Belizean | 178 | 0.0% |
| Bermudan | 174 | 0.0% |
| Bhutanese | 1,601 | 0.2% |
| Blackfeet | 1,071 | 0.1% |
| Bolivian | 2,041 | 0.2% |
| Brazilian | 1,134 | 0.1% |
| British | 1,909 | 0.2% |
| British West Indian | 1,482 | 0.2% |
| Bulgarian | 56 | 0.0% |
| Burmese | 4,142 | 0.4% |
| Cajun | 8 | 0.0% |
| Canadian | 364 | 0.0% |
| Cape Verdean | 420 | 0.0% |
| Carpatho Rusyn | 43 | 0.0% |
| Celtic | 29 | 0.0% |
| Central American | 124,621 | 13.0% |
| Central American Indian | 2,117 | 0.2% |
| Cherokee | 2,185 | 0.2% |
| Cheyenne | 87 | 0.0% |
| Chickasaw | 10 | 0.0% |
| Chilean | 516 | 0.1% |
| Chinese | 13 | 0.0% |
| Chippewa | 59 | 0.0% |
| Choctaw | 109 | 0.0% |
| Colombian | 2,268 | 0.2% |
| Costa Rican | 439 | 0.1% |
| Cree | 40 | 0.0% |
| Creek | 133 | 0.0% |
| Croatian | 184 | 0.0% |
| Cuban | 1,570 | 0.2% |
| Cypriot | 42 | 0.0% |
| Czech | 663 | 0.1% |
| Czechoslovakian | 96 | 0.0% |
| Danish | 581 | 0.1% |
| Delaware | 110 | 0.0% |
| Dominican | 8,559 | 0.9% |
| Dutch | 1,600 | 0.2% |
| Dutch West Indian | 10 | 0.0% |
| Eastern European | 1,110 | 0.1% |
| Ecuadorian | 1,090 | 0.1% |
| Egyptian | 1,638 | 0.2% |
| English | 18,763 | 2.0% |
| Estonian | 88 | 0.0% |
| Ethiopian | 6,443 | 0.7% |
| European | 4,665 | 0.5% |
| Filipino | 437 | 0.1% |
| Finnish | 287 | 0.0% |
| French | 4,027 | 0.4% |
| French American Indian | 6 | 0.0% |
| French Canadian | 985 | 0.1% |
| German | 23,855 | 2.5% |
| German Russian | 112 | 0.0% |
| Ghanaian | 4,790 | 0.5% |
| Greek | 979 | 0.1% |
| Guamanian / Chamorro | 139 | 0.0% |
| Guatemalan | 25,160 | 2.6% |
| Guyanese | 4,330 | 0.4% |
| Haitian | 5,389 | 0.6% |
| Honduran | 10,942 | 1.1% |
| Hungarian | 664 | 0.1% |
| Icelander | 32 | 0.0% |
| Indian (Asian) | 7,138 | 0.7% |
| Indonesian | 390 | 0.0% |
| Inupiat | 25 | 0.0% |
| Iranian | 594 | 0.1% |
| Iraqi | 88 | 0.0% |
| Irish | 25,306 | 2.6% |
| Iroquois | 151 | 0.0% |
| Israeli | 177 | 0.0% |
| Italian | 10,860 | 1.1% |
| Jamaican | 17,014 | 1.8% |
| Japanese | 752 | 0.1% |
| Jordanian | 74 | 0.0% |
| Kenyan | 882 | 0.1% |
| Korean | 12,348 | 1.3% |
| Laotian | 181 | 0.0% |
| Latvian | 29 | 0.0% |
| Lebanese | 314 | 0.0% |
| Liberian | 2,009 | 0.2% |
| Lithuanian | 739 | 0.1% |
| Lumbee | 139 | 0.0% |
| Luxembourger | 4 | 0.0% |
| Macedonian | 41 | 0.0% |
| Malaysian | 538 | 0.1% |
| Maltese | 34 | 0.0% |
| Mexican | 28,980 | 3.0% |
| Mexican American Indian | 587 | 0.1% |
| Mongolian | 38 | 0.0% |
| Moroccan | 556 | 0.1% |
| Native Hawaiian | 211 | 0.0% |
| Navajo | 29 | 0.0% |
| New Zealander | 35 | 0.0% |
| Nicaraguan | 2,775 | 0.3% |
| Nigerian | 23,378 | 2.4% |
| Northern European | 402 | 0.0% |
| Norwegian | 1,592 | 0.2% |
| Okinawan | 13 | 0.0% |
| Osage | 67 | 0.0% |
| Paiute | 46 | 0.0% |
| Pakistani | 560 | 0.1% |
| Palestinian | 122 | 0.0% |
| Panamanian | 1,116 | 0.1% |
| Paraguayan | 75 | 0.0% |
| Pennsylvania German | 284 | 0.0% |
| Peruvian | 2,591 | 0.3% |
| Polish | 4,964 | 0.5% |
| Portuguese | 1,008 | 0.1% |
| Puerto Rican | 7,657 | 0.8% |
| Puget Sound Salish | 16 | 0.0% |
| Romanian | 469 | 0.1% |
| Russian | 1,994 | 0.2% |
| Salvadoran | 83,997 | 8.8% |
| Samoan | 337 | 0.0% |
| Scandinavian | 501 | 0.1% |
| Scotch-Irish | 1,825 | 0.2% |
| Scottish | 3,696 | 0.4% |
| Seminole | 141 | 0.0% |
| Senegalese | 823 | 0.1% |
| Serbian | 125 | 0.0% |
| Sierra Leonean | 3,488 | 0.4% |
| Sioux | 152 | 0.0% |
| Slavic | 173 | 0.0% |
| Slovak | 477 | 0.1% |
| Slovene | 132 | 0.0% |
| Somali | 26 | 0.0% |
| South African | 867 | 0.1% |
| South American | 10,403 | 1.1% |
| South American Indian | 146 | 0.0% |
| Spaniard | 925 | 0.1% |
| Spanish | 898 | 0.1% |
| Spanish American | 33 | 0.0% |
| Spanish American Indian | 10 | 0.0% |
| Sri Lankan | 3,526 | 0.4% |
| Subsaharan African | 87,005 | 9.1% |
| Sudanese | 147 | 0.0% |
| Swedish | 1,821 | 0.2% |
| Swiss | 458 | 0.1% |
| Syrian | 113 | 0.0% |
| Thai | 11,012 | 1.1% |
| Trinidadian and Tobagonian | 3,902 | 0.4% |
| Turkish | 376 | 0.0% |
| U.S. Virgin Islander | 403 | 0.0% |
| Ugandan | 215 | 0.0% |
| Ukrainian | 673 | 0.1% |
| Uruguayan | 39 | 0.0% |
| Venezuelan | 770 | 0.1% |
| Vietnamese | 836 | 0.1% |
| Welsh | 1,287 | 0.1% |
| West Indian | 2,983 | 0.3% |
| Yugoslavian | 43 | 0.0% |
| Yup'ik | 9 | 0.0% |
| Zimbabwean | 498 | 0.1% | View All 170 Rows |
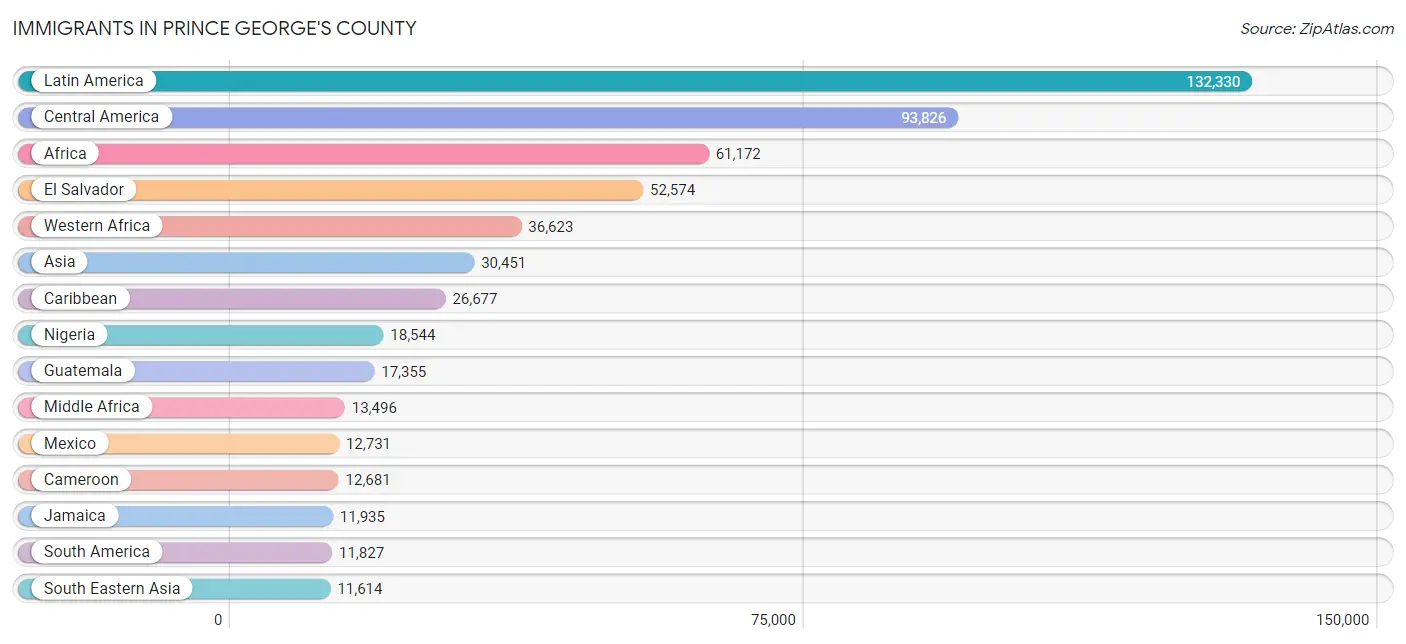
Immigrants in Prince George's County
The most numerous immigrant groups reported in Prince George's County came from Latin America (132,330 | 13.8%), Central America (93,826 | 9.8%), Africa (61,172 | 6.4%), El Salvador (52,574 | 5.5%), and Western Africa (36,623 | 3.8%), together accounting for 39.3% of all Prince George's County residents.
| Immigration Origin | # Population | % Population |
| Afghanistan | 1,755 | 0.2% |
| Africa | 61,172 | 6.4% |
| Albania | 11 | 0.0% |
| Argentina | 477 | 0.1% |
| Asia | 30,451 | 3.2% |
| Australia | 145 | 0.0% |
| Austria | 58 | 0.0% |
| Bahamas | 246 | 0.0% |
| Bangladesh | 1,036 | 0.1% |
| Barbados | 706 | 0.1% |
| Belarus | 14 | 0.0% |
| Belgium | 85 | 0.0% |
| Belize | 117 | 0.0% |
| Bolivia | 1,377 | 0.1% |
| Bosnia and Herzegovina | 45 | 0.0% |
| Brazil | 1,003 | 0.1% |
| Bulgaria | 65 | 0.0% |
| Cabo Verde | 68 | 0.0% |
| Cambodia | 334 | 0.0% |
| Cameroon | 12,681 | 1.3% |
| Canada | 546 | 0.1% |
| Caribbean | 26,677 | 2.8% |
| Central America | 93,826 | 9.8% |
| Chile | 162 | 0.0% |
| China | 3,737 | 0.4% |
| Colombia | 1,918 | 0.2% |
| Congo | 209 | 0.0% |
| Costa Rica | 221 | 0.0% |
| Cuba | 436 | 0.1% |
| Czechoslovakia | 93 | 0.0% |
| Denmark | 32 | 0.0% |
| Dominica | 145 | 0.0% |
| Dominican Republic | 4,991 | 0.5% |
| Eastern Africa | 7,748 | 0.8% |
| Eastern Asia | 6,643 | 0.7% |
| Eastern Europe | 1,678 | 0.2% |
| Ecuador | 551 | 0.1% |
| Egypt | 691 | 0.1% |
| El Salvador | 52,574 | 5.5% |
| England | 542 | 0.1% |
| Eritrea | 851 | 0.1% |
| Ethiopia | 4,734 | 0.5% |
| Europe | 5,904 | 0.6% |
| Fiji | 3 | 0.0% |
| France | 524 | 0.1% |
| Germany | 861 | 0.1% |
| Ghana | 5,361 | 0.6% |
| Greece | 11 | 0.0% |
| Grenada | 418 | 0.0% |
| Guatemala | 17,355 | 1.8% |
| Guyana | 3,764 | 0.4% |
| Haiti | 2,607 | 0.3% |
| Honduras | 8,331 | 0.9% |
| Hong Kong | 133 | 0.0% |
| Hungary | 35 | 0.0% |
| India | 5,220 | 0.5% |
| Indonesia | 154 | 0.0% |
| Iran | 436 | 0.1% |
| Iraq | 139 | 0.0% |
| Ireland | 225 | 0.0% |
| Israel | 438 | 0.1% |
| Italy | 567 | 0.1% |
| Jamaica | 11,935 | 1.3% |
| Japan | 396 | 0.0% |
| Jordan | 138 | 0.0% |
| Kazakhstan | 17 | 0.0% |
| Kenya | 746 | 0.1% |
| Korea | 2,510 | 0.3% |
| Kuwait | 60 | 0.0% |
| Laos | 657 | 0.1% |
| Latin America | 132,330 | 13.8% |
| Latvia | 314 | 0.0% |
| Lebanon | 34 | 0.0% |
| Liberia | 1,968 | 0.2% |
| Malaysia | 73 | 0.0% |
| Mexico | 12,731 | 1.3% |
| Middle Africa | 13,496 | 1.4% |
| Morocco | 167 | 0.0% |
| Nepal | 289 | 0.0% |
| Netherlands | 20 | 0.0% |
| Nicaragua | 1,948 | 0.2% |
| Nigeria | 18,544 | 1.9% |
| North Macedonia | 4 | 0.0% |
| Northern Africa | 1,124 | 0.1% |
| Northern Europe | 1,345 | 0.1% |
| Norway | 2 | 0.0% |
| Oceania | 247 | 0.0% |
| Pakistan | 1,637 | 0.2% |
| Panama | 467 | 0.1% |
| Peru | 1,862 | 0.2% |
| Philippines | 7,768 | 0.8% |
| Poland | 81 | 0.0% |
| Portugal | 72 | 0.0% |
| Romania | 292 | 0.0% |
| Russia | 327 | 0.0% |
| Saudi Arabia | 144 | 0.0% |
| Scotland | 40 | 0.0% |
| Senegal | 775 | 0.1% |
| Serbia | 47 | 0.0% |
| Sierra Leone | 5,781 | 0.6% |
| Singapore | 51 | 0.0% |
| Somalia | 33 | 0.0% |
| South Africa | 584 | 0.1% |
| South America | 11,827 | 1.2% |
| South Central Asia | 10,614 | 1.1% |
| South Eastern Asia | 11,614 | 1.2% |
| Southern Europe | 1,124 | 0.1% |
| Spain | 474 | 0.1% |
| Sri Lanka | 195 | 0.0% |
| St. Vincent and the Grenadines | 265 | 0.0% |
| Sudan | 117 | 0.0% |
| Sweden | 37 | 0.0% |
| Switzerland | 134 | 0.0% |
| Syria | 20 | 0.0% |
| Taiwan | 357 | 0.0% |
| Thailand | 222 | 0.0% |
| Trinidad and Tobago | 3,848 | 0.4% |
| Turkey | 364 | 0.0% |
| Uganda | 342 | 0.0% |
| Ukraine | 79 | 0.0% |
| Uruguay | 60 | 0.0% |
| Uzbekistan | 4 | 0.0% |
| Venezuela | 455 | 0.1% |
| Vietnam | 1,870 | 0.2% |
| West Indies | 182 | 0.0% |
| Western Africa | 36,623 | 3.8% |
| Western Asia | 1,489 | 0.2% |
| Western Europe | 1,741 | 0.2% |
| Yemen | 112 | 0.0% |
| Zaire | 326 | 0.0% |
| Zimbabwe | 294 | 0.0% | View All 131 Rows |
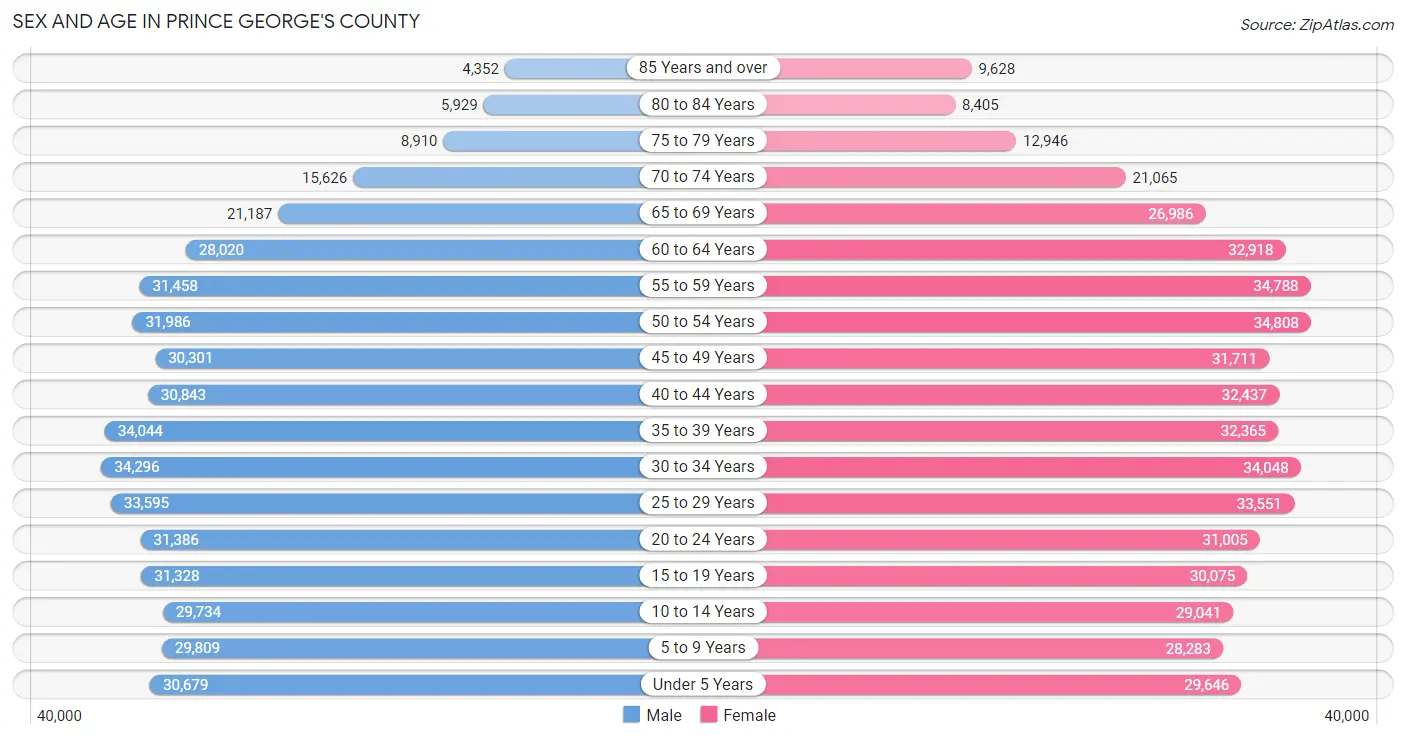
Sex and Age in Prince George's County
Sex and Age in Prince George's County
The most populous age groups in Prince George's County are 30 to 34 Years (34,296 | 7.4%) for men and 50 to 54 Years (34,808 | 7.0%) for women.
| Age Bracket | Male | Female |
| Under 5 Years | 30,679 (6.6%) | 29,646 (6.0%) |
| 5 to 9 Years | 29,809 (6.4%) | 28,283 (5.7%) |
| 10 to 14 Years | 29,734 (6.4%) | 29,041 (5.9%) |
| 15 to 19 Years | 31,328 (6.8%) | 30,075 (6.1%) |
| 20 to 24 Years | 31,386 (6.8%) | 31,005 (6.3%) |
| 25 to 29 Years | 33,595 (7.2%) | 33,551 (6.8%) |
| 30 to 34 Years | 34,296 (7.4%) | 34,048 (6.9%) |
| 35 to 39 Years | 34,044 (7.3%) | 32,365 (6.6%) |
| 40 to 44 Years | 30,843 (6.7%) | 32,437 (6.6%) |
| 45 to 49 Years | 30,301 (6.5%) | 31,711 (6.4%) |
| 50 to 54 Years | 31,986 (6.9%) | 34,808 (7.0%) |
| 55 to 59 Years | 31,458 (6.8%) | 34,788 (7.0%) |
| 60 to 64 Years | 28,020 (6.0%) | 32,918 (6.7%) |
| 65 to 69 Years | 21,187 (4.6%) | 26,986 (5.5%) |
| 70 to 74 Years | 15,626 (3.4%) | 21,065 (4.3%) |
| 75 to 79 Years | 8,910 (1.9%) | 12,946 (2.6%) |
| 80 to 84 Years | 5,929 (1.3%) | 8,405 (1.7%) |
| 85 Years and over | 4,352 (0.9%) | 9,628 (1.9%) |
| Total | 463,483 (100.0%) | 493,706 (100.0%) |
Families and Households in Prince George's County
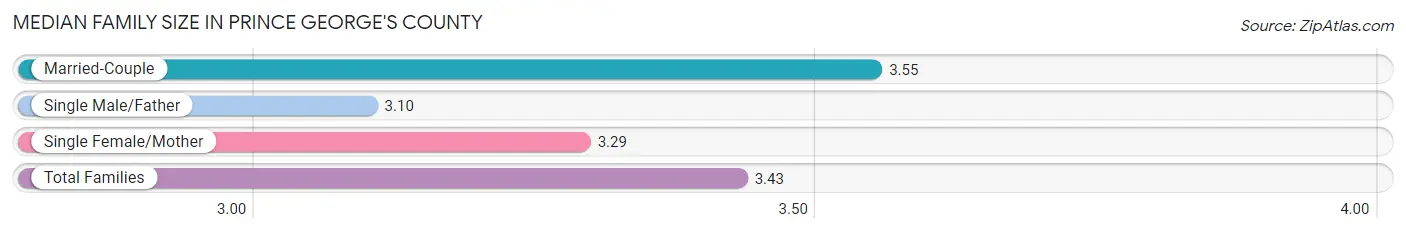
Median Family Size in Prince George's County
The median family size in Prince George's County is 3.43 persons per family, with married-couple families (133,204 | 60.9%) accounting for the largest median family size of 3.55 persons per family. On the other hand, single male/father families (22,761 | 10.4%) represent the smallest median family size with 3.10 persons per family.
| Family Type | # Families | Family Size |
| Married-Couple | 133,204 (60.9%) | 3.55 |
| Single Male/Father | 22,761 (10.4%) | 3.10 |
| Single Female/Mother | 62,873 (28.7%) | 3.29 |
| Total Families | 218,838 (100.0%) | 3.43 |
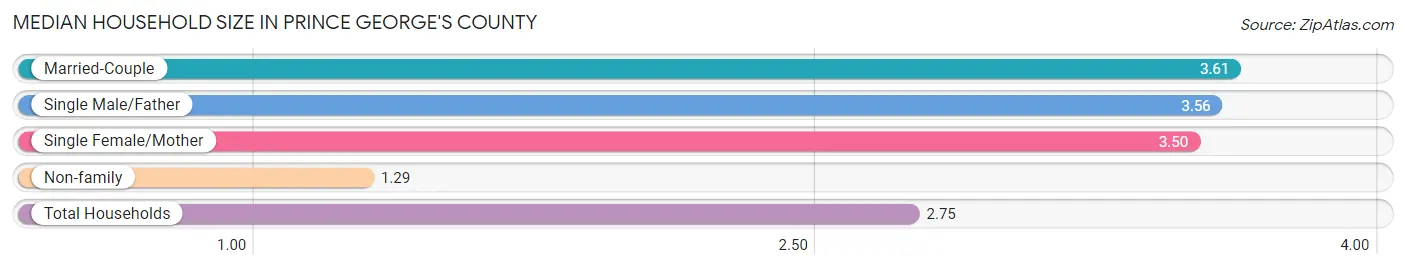
Median Household Size in Prince George's County
The median household size in Prince George's County is 2.75 persons per household, with married-couple households (133,204 | 39.1%) accounting for the largest median household size of 3.61 persons per household. non-family households (122,219 | 35.8%) represent the smallest median household size with 1.29 persons per household.
| Household Type | # Households | Household Size |
| Married-Couple | 133,204 (39.1%) | 3.61 |
| Single Male/Father | 22,761 (6.7%) | 3.56 |
| Single Female/Mother | 62,873 (18.4%) | 3.50 |
| Non-family | 122,219 (35.8%) | 1.29 |
| Total Households | 341,057 (100.0%) | 2.75 |
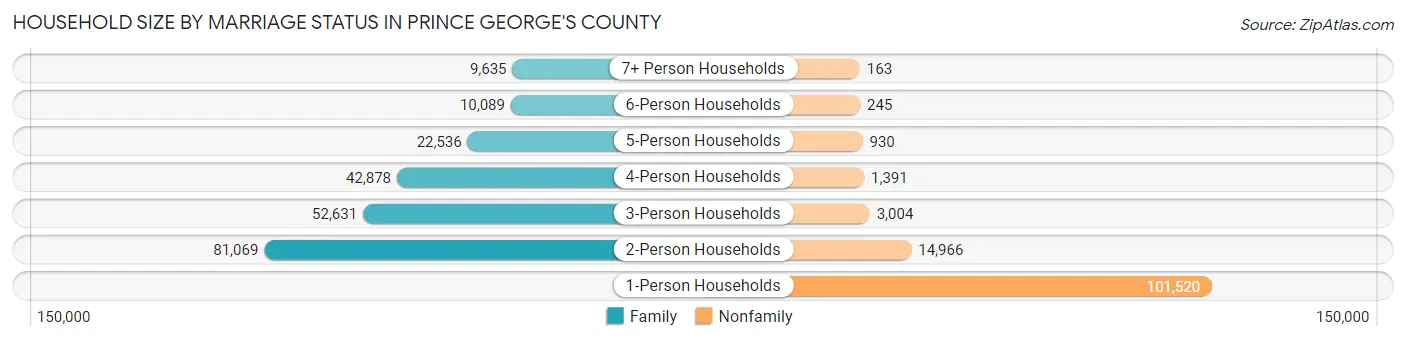
Household Size by Marriage Status in Prince George's County
Out of a total of 341,057 households in Prince George's County, 218,838 (64.2%) are family households, while 122,219 (35.8%) are nonfamily households. The most numerous type of family households are 2-person households, comprising 81,069, and the most common type of nonfamily households are 1-person households, comprising 101,520.
| Household Size | Family Households | Nonfamily Households |
| 1-Person Households | - | 101,520 (29.8%) |
| 2-Person Households | 81,069 (23.8%) | 14,966 (4.4%) |
| 3-Person Households | 52,631 (15.4%) | 3,004 (0.9%) |
| 4-Person Households | 42,878 (12.6%) | 1,391 (0.4%) |
| 5-Person Households | 22,536 (6.6%) | 930 (0.3%) |
| 6-Person Households | 10,089 (3.0%) | 245 (0.1%) |
| 7+ Person Households | 9,635 (2.8%) | 163 (0.1%) |
| Total | 218,838 (64.2%) | 122,219 (35.8%) |
Female Fertility in Prince George's County
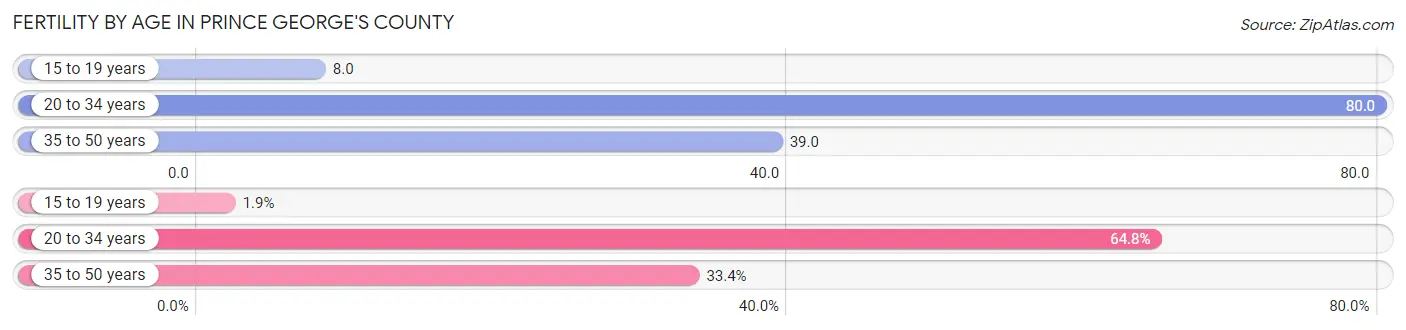
Fertility by Age in Prince George's County
Average fertility rate in Prince George's County is 52.0 births per 1,000 women. Women in the age bracket of 20 to 34 years have the highest fertility rate with 80.0 births per 1,000 women. Women in the age bracket of 20 to 34 years acount for 64.8% of all women with births.
| Age Bracket | Women with Births | Births / 1,000 Women |
| 15 to 19 years | 229 (1.9%) | 8.0 |
| 20 to 34 years | 7,868 (64.8%) | 80.0 |
| 35 to 50 years | 4,052 (33.4%) | 39.0 |
| Total | 12,149 (100.0%) | 52.0 |
Fertility by Age by Marriage Status in Prince George's County
57.3% of women with births (12,149) in Prince George's County are married. The highest percentage of unmarried women with births falls into 15 to 19 years age bracket with 96.9% of them unmarried at the time of birth, while the lowest percentage of unmarried women with births belong to 35 to 50 years age bracket with 21.7% of them unmarried.
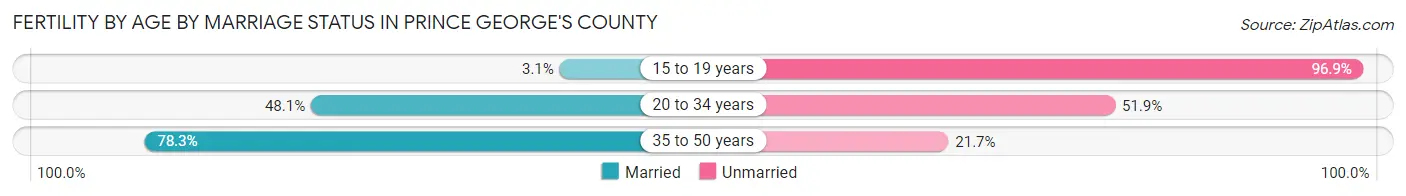
| Age Bracket | Married | Unmarried |
| 15 to 19 years | 7 (3.1%) | 222 (96.9%) |
| 20 to 34 years | 3,785 (48.1%) | 4,083 (51.9%) |
| 35 to 50 years | 3,173 (78.3%) | 879 (21.7%) |
| Total | 6,961 (57.3%) | 5,188 (42.7%) |
Fertility by Education in Prince George's County
Average fertility rate in Prince George's County is 52.0 births per 1,000 women. Women with the education attainment of bachelor's degree have the highest fertility rate of 62.0 births per 1,000 women, while women with the education attainment of less than high school have the lowest fertility at 44.0 births per 1,000 women. Women with the education attainment of college or associate's degree represent 24.6% of all women with births.
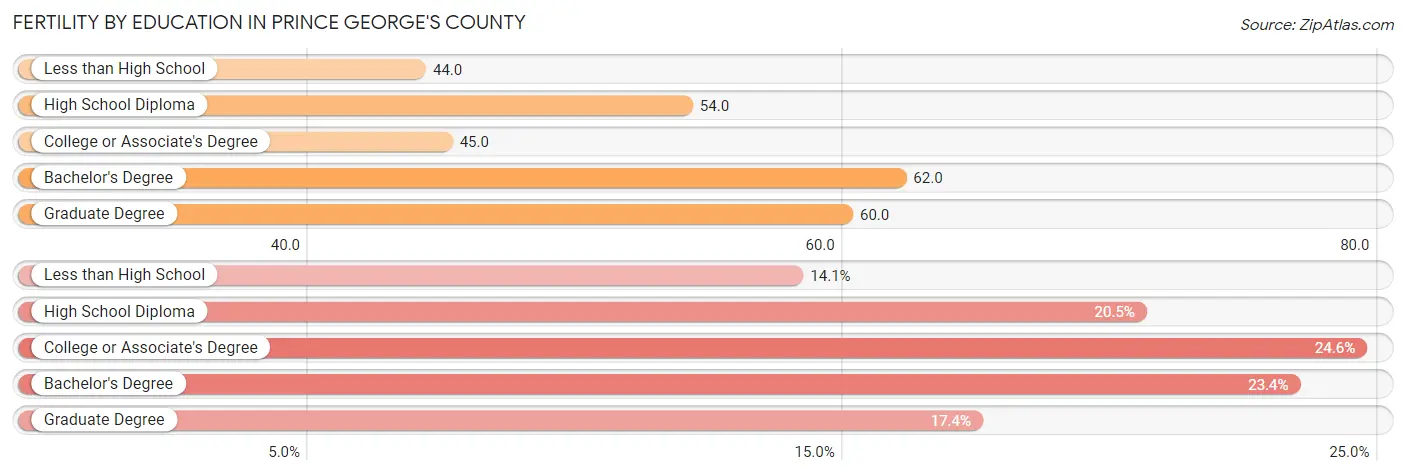
| Educational Attainment | Women with Births | Births / 1,000 Women |
| Less than High School | 1,709 (14.1%) | 44.0 |
| High School Diploma | 2,490 (20.5%) | 54.0 |
| College or Associate's Degree | 2,992 (24.6%) | 45.0 |
| Bachelor's Degree | 2,840 (23.4%) | 62.0 |
| Graduate Degree | 2,118 (17.4%) | 60.0 |
| Total | 12,149 (100.0%) | 52.0 |
Fertility by Education by Marriage Status in Prince George's County
42.7% of women with births in Prince George's County are unmarried. Women with the educational attainment of graduate degree are most likely to be married with 90.9% of them married at childbirth, while women with the educational attainment of high school diploma are least likely to be married with 54.6% of them unmarried at childbirth.
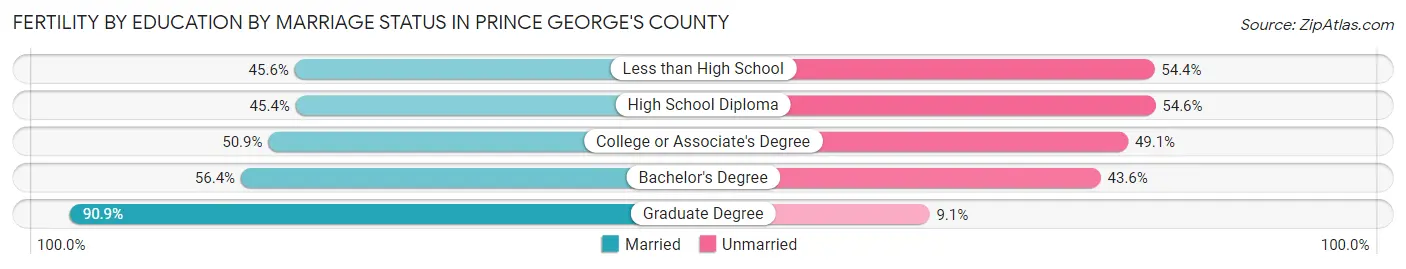
| Educational Attainment | Married | Unmarried |
| Less than High School | 779 (45.6%) | 930 (54.4%) |
| High School Diploma | 1,130 (45.4%) | 1,360 (54.6%) |
| College or Associate's Degree | 1,523 (50.9%) | 1,469 (49.1%) |
| Bachelor's Degree | 1,602 (56.4%) | 1,238 (43.6%) |
| Graduate Degree | 1,925 (90.9%) | 193 (9.1%) |
| Total | 6,961 (57.3%) | 5,188 (42.7%) |
Income in Prince George's County
Income Overview in Prince George's County
Per Capita Income in Prince George's County is $43,833, while median incomes of families and households are $115,235 and $97,935 respectively.
| Characteristic | Number | Measure |
| Per Capita Income | 957,189 | $43,833 |
| Median Family Income | 218,838 | $115,235 |
| Mean Family Income | 218,838 | $136,441 |
| Median Household Income | 341,057 | $97,935 |
| Mean Household Income | 341,057 | $118,777 |
| Income Deficit | 218,838 | $11,184 |
| Wage / Income Gap (%) | 957,189 | 3.36% |
| Wage / Income Gap ($) | 957,189 | 96.64¢ per $1 |
| Gini / Inequality Index | 957,189 | 0.41 |
Earnings by Sex in Prince George's County
Average Earnings in Prince George's County are $49,051, $49,827 for men and $48,153 for women, a difference of 3.4%.
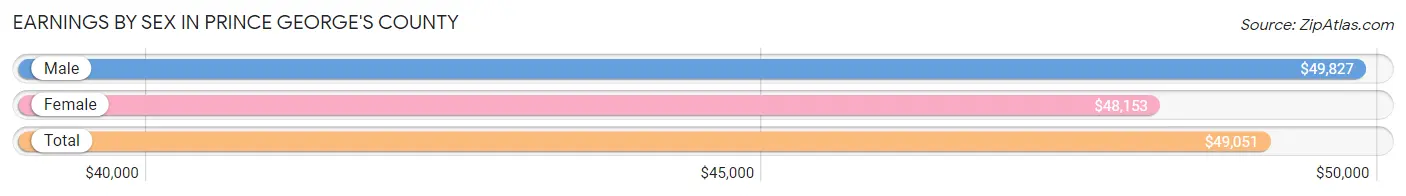
| Sex | Number | Average Earnings |
| Male | 278,081 (50.4%) | $49,827 |
| Female | 273,250 (49.6%) | $48,153 |
| Total | 551,331 (100.0%) | $49,051 |
Earnings by Sex by Income Bracket in Prince George's County
The most common earnings brackets in Prince George's County are $100,000+ for men (50,647 | 18.2%) and $100,000+ for women (51,572 | 18.9%).
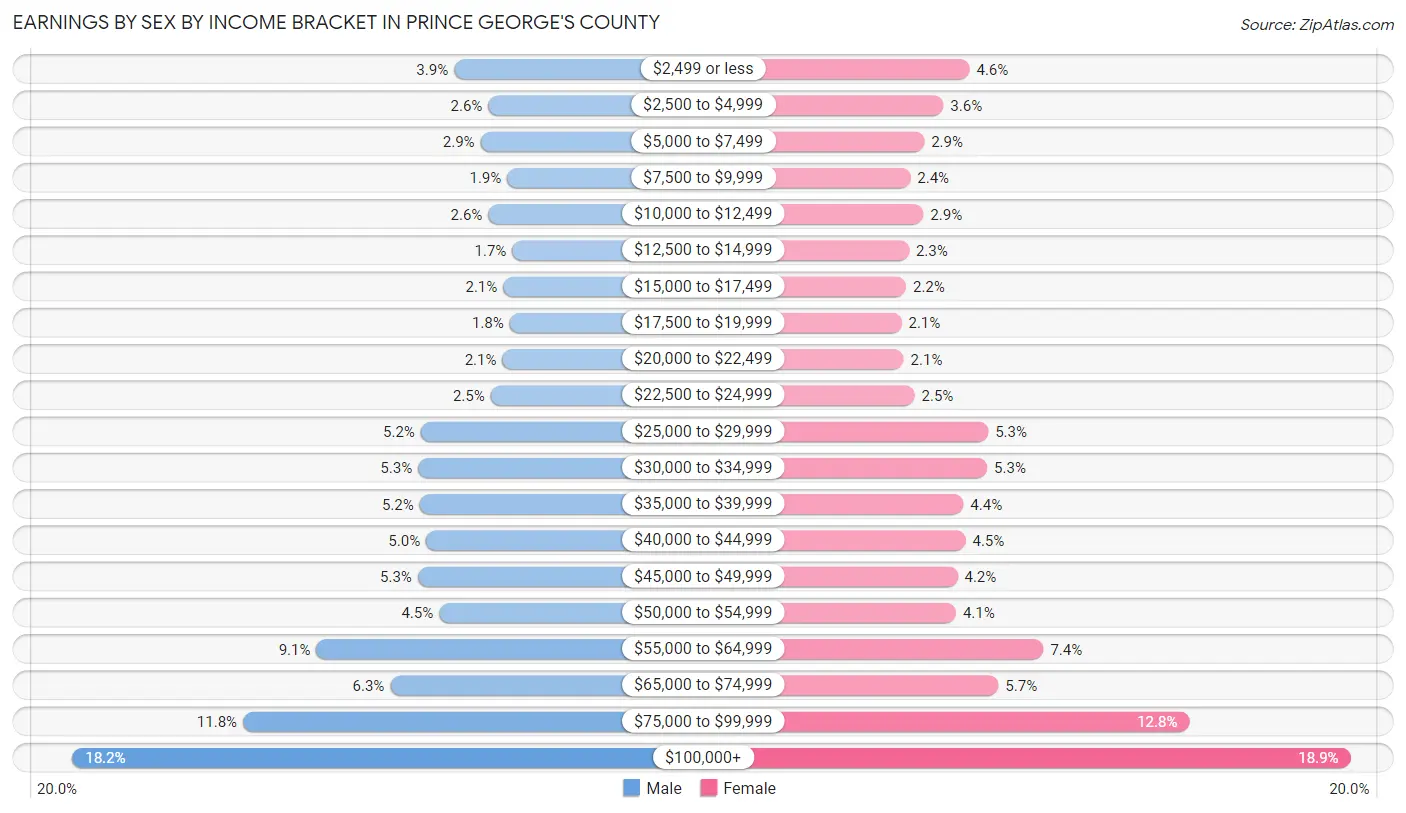
| Income | Male | Female |
| $2,499 or less | 10,885 (3.9%) | 12,562 (4.6%) |
| $2,500 to $4,999 | 7,321 (2.6%) | 9,891 (3.6%) |
| $5,000 to $7,499 | 8,129 (2.9%) | 7,934 (2.9%) |
| $7,500 to $9,999 | 5,341 (1.9%) | 6,509 (2.4%) |
| $10,000 to $12,499 | 7,315 (2.6%) | 7,838 (2.9%) |
| $12,500 to $14,999 | 4,805 (1.7%) | 6,362 (2.3%) |
| $15,000 to $17,499 | 5,749 (2.1%) | 6,058 (2.2%) |
| $17,500 to $19,999 | 5,088 (1.8%) | 5,592 (2.1%) |
| $20,000 to $22,499 | 5,833 (2.1%) | 5,820 (2.1%) |
| $22,500 to $24,999 | 7,054 (2.5%) | 6,932 (2.5%) |
| $25,000 to $29,999 | 14,337 (5.2%) | 14,472 (5.3%) |
| $30,000 to $34,999 | 14,627 (5.3%) | 14,381 (5.3%) |
| $35,000 to $39,999 | 14,450 (5.2%) | 11,954 (4.4%) |
| $40,000 to $44,999 | 13,791 (5.0%) | 12,153 (4.4%) |
| $45,000 to $49,999 | 14,659 (5.3%) | 11,328 (4.2%) |
| $50,000 to $54,999 | 12,433 (4.5%) | 11,179 (4.1%) |
| $55,000 to $64,999 | 25,234 (9.1%) | 20,133 (7.4%) |
| $65,000 to $74,999 | 17,524 (6.3%) | 15,518 (5.7%) |
| $75,000 to $99,999 | 32,859 (11.8%) | 35,062 (12.8%) |
| $100,000+ | 50,647 (18.2%) | 51,572 (18.9%) |
| Total | 278,081 (100.0%) | 273,250 (100.0%) |
Earnings by Sex by Educational Attainment in Prince George's County
Average earnings in Prince George's County are $56,072 for men and $55,948 for women, a difference of 0.2%. Men with an educational attainment of graduate degree enjoy the highest average annual earnings of $99,209, while those with less than high school education earn the least with $41,386. Women with an educational attainment of graduate degree earn the most with the average annual earnings of $92,420, while those with less than high school education have the smallest earnings of $25,438.
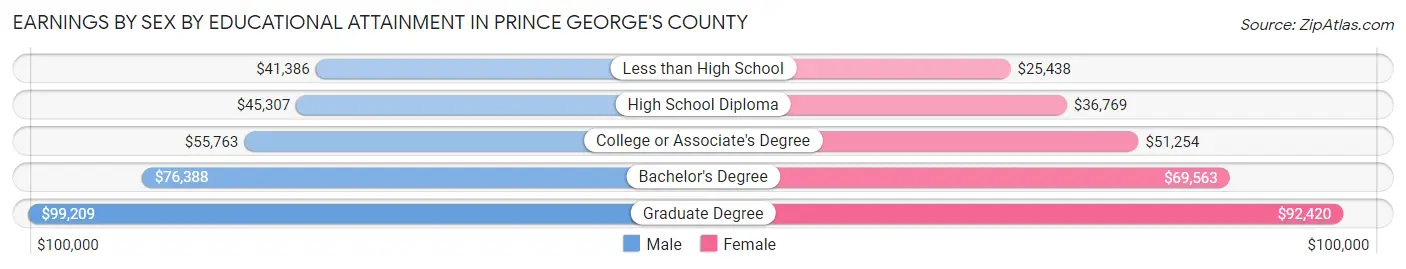
| Educational Attainment | Male Income | Female Income |
| Less than High School | $41,386 | $25,438 |
| High School Diploma | $45,307 | $36,769 |
| College or Associate's Degree | $55,763 | $51,254 |
| Bachelor's Degree | $76,388 | $69,563 |
| Graduate Degree | $99,209 | $92,420 |
| Total | $56,072 | $55,948 |
Family Income in Prince George's County
Family Income Brackets in Prince George's County
According to the Prince George's County family income data, there are 51,208 families falling into the $100,000 to $149,999 income range, which is the most common income bracket and makes up 23.4% of all families. Conversely, the $10,000 to $14,999 income bracket is the least frequent group with only 2,407 families (1.1%) belonging to this category.
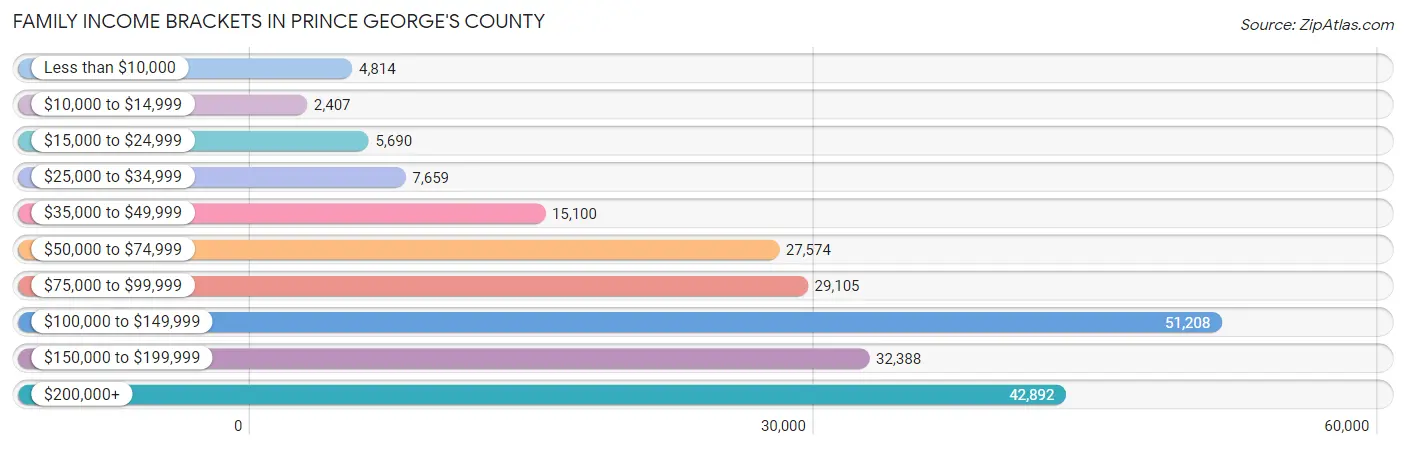
| Income Bracket | # Families | % Families |
| Less than $10,000 | 4,814 | 2.2% |
| $10,000 to $14,999 | 2,407 | 1.1% |
| $15,000 to $24,999 | 5,690 | 2.6% |
| $25,000 to $34,999 | 7,659 | 3.5% |
| $35,000 to $49,999 | 15,100 | 6.9% |
| $50,000 to $74,999 | 27,574 | 12.6% |
| $75,000 to $99,999 | 29,105 | 13.3% |
| $100,000 to $149,999 | 51,208 | 23.4% |
| $150,000 to $199,999 | 32,388 | 14.8% |
| $200,000+ | 42,892 | 19.6% |
Family Income by Famaliy Size in Prince George's County
7+ person families (7,778 | 3.5%) account for the highest median family income in Prince George's County with $145,433 per family, while 2-person families (89,654 | 41.0%) have the highest median income of $51,606 per family member.
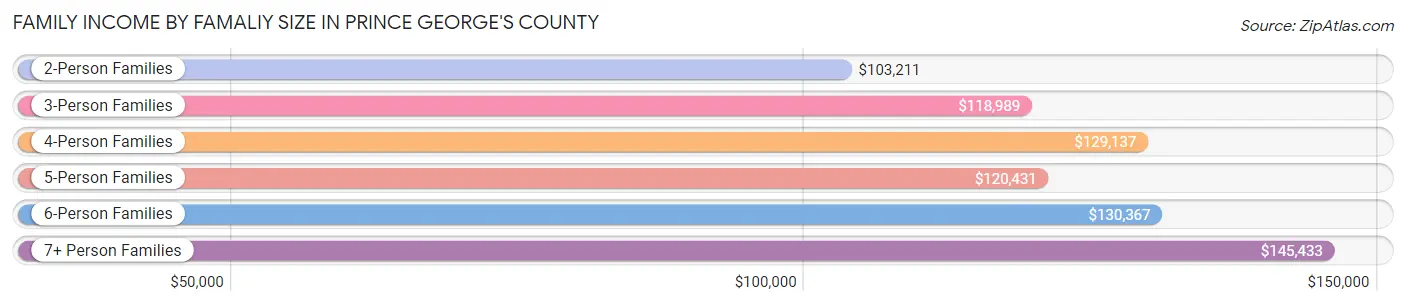
| Income Bracket | # Families | Median Income |
| 2-Person Families | 89,654 (41.0%) | $103,211 |
| 3-Person Families | 51,897 (23.7%) | $118,989 |
| 4-Person Families | 40,209 (18.4%) | $129,137 |
| 5-Person Families | 20,590 (9.4%) | $120,431 |
| 6-Person Families | 8,710 (4.0%) | $130,367 |
| 7+ Person Families | 7,778 (3.5%) | $145,433 |
| Total | 218,838 (100.0%) | $115,235 |
Family Income by Number of Earners in Prince George's County
The median family income in Prince George's County is $115,235, with families comprising 3+ earners (41,255) having the highest median family income of $166,448, while families with no earners (18,940) have the lowest median family income of $68,048, accounting for 18.9% and 8.6% of families, respectively.
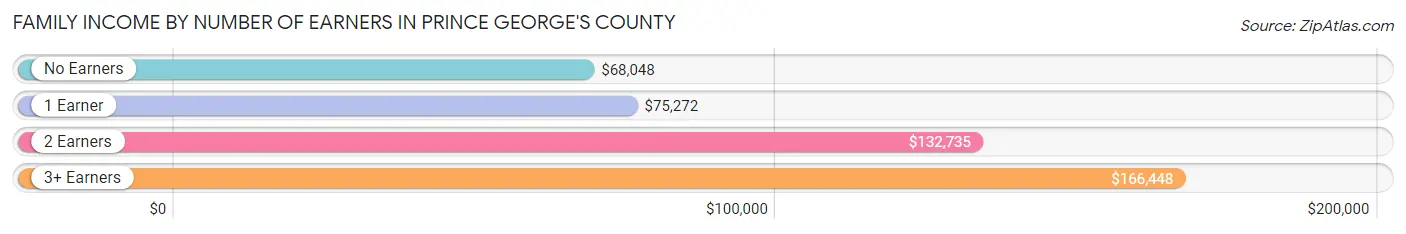
| Number of Earners | # Families | Median Income |
| No Earners | 18,940 (8.6%) | $68,048 |
| 1 Earner | 67,740 (30.9%) | $75,272 |
| 2 Earners | 90,903 (41.5%) | $132,735 |
| 3+ Earners | 41,255 (18.9%) | $166,448 |
| Total | 218,838 (100.0%) | $115,235 |
Household Income in Prince George's County
Household Income Brackets in Prince George's County
With 73,327 households falling in the category, the $100,000 to $149,999 income range is the most frequent in Prince George's County, accounting for 21.5% of all households. In contrast, only 7,503 households (2.2%) fall into the $10,000 to $14,999 income bracket, making it the least populous group.
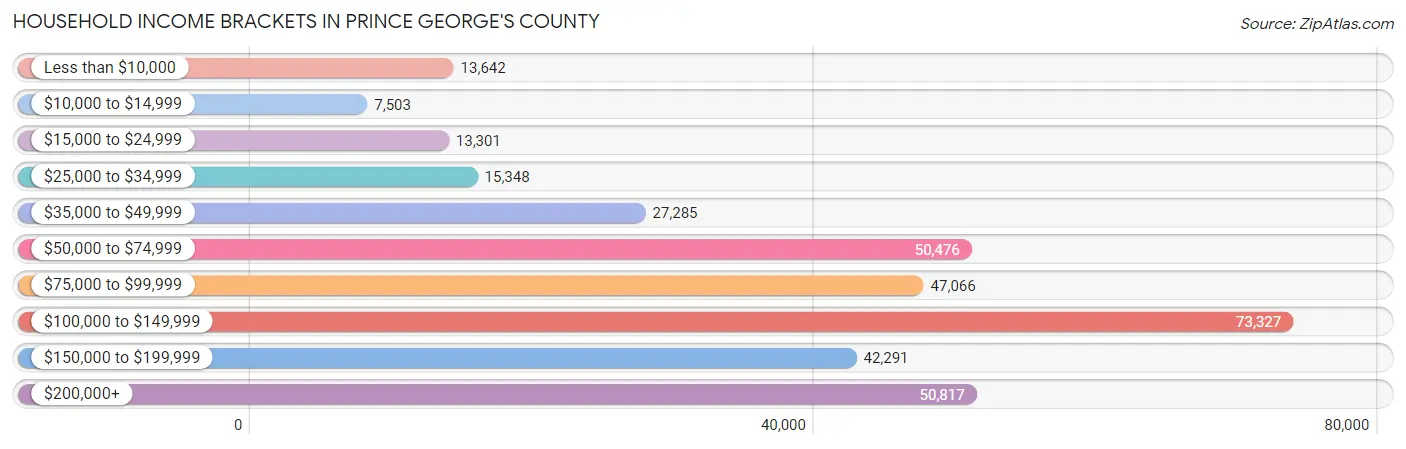
| Income Bracket | # Households | % Households |
| Less than $10,000 | 13,642 | 4.0% |
| $10,000 to $14,999 | 7,503 | 2.2% |
| $15,000 to $24,999 | 13,301 | 3.9% |
| $25,000 to $34,999 | 15,348 | 4.5% |
| $35,000 to $49,999 | 27,285 | 8.0% |
| $50,000 to $74,999 | 50,476 | 14.8% |
| $75,000 to $99,999 | 47,066 | 13.8% |
| $100,000 to $149,999 | 73,327 | 21.5% |
| $150,000 to $199,999 | 42,291 | 12.4% |
| $200,000+ | 50,817 | 14.9% |
Household Income by Householder Age in Prince George's County
The median household income in Prince George's County is $97,935, with the highest median household income of $115,906 found in the 45 to 64 years age bracket for the primary householder. A total of 141,924 households (41.6%) fall into this category. Meanwhile, the 15 to 24 years age bracket for the primary householder has the lowest median household income of $45,989, with 8,395 households (2.5%) in this group.
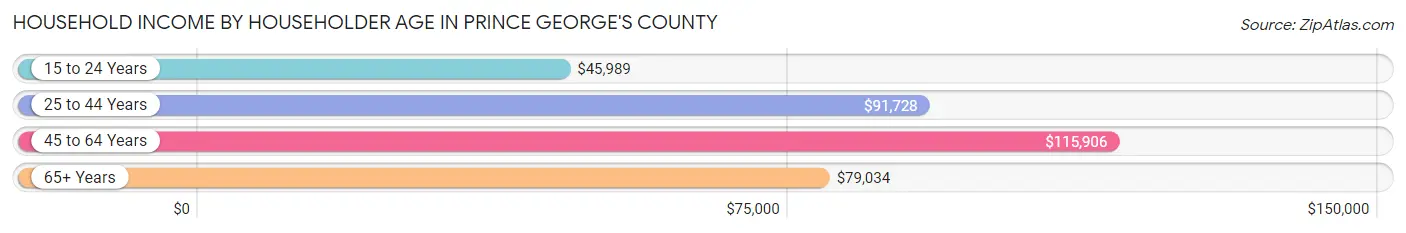
| Income Bracket | # Households | Median Income |
| 15 to 24 Years | 8,395 (2.5%) | $45,989 |
| 25 to 44 Years | 109,309 (32.1%) | $91,728 |
| 45 to 64 Years | 141,924 (41.6%) | $115,906 |
| 65+ Years | 81,429 (23.9%) | $79,034 |
| Total | 341,057 (100.0%) | $97,935 |
Poverty in Prince George's County
Income Below Poverty by Sex and Age in Prince George's County
With 8.5% poverty level for males and 10.6% for females among the residents of Prince George's County, 16 and 17 year old males and 15 year old females are the most vulnerable to poverty, with 1,556 males (14.1%) and 1,148 females (19.7%) in their respective age groups living below the poverty level.
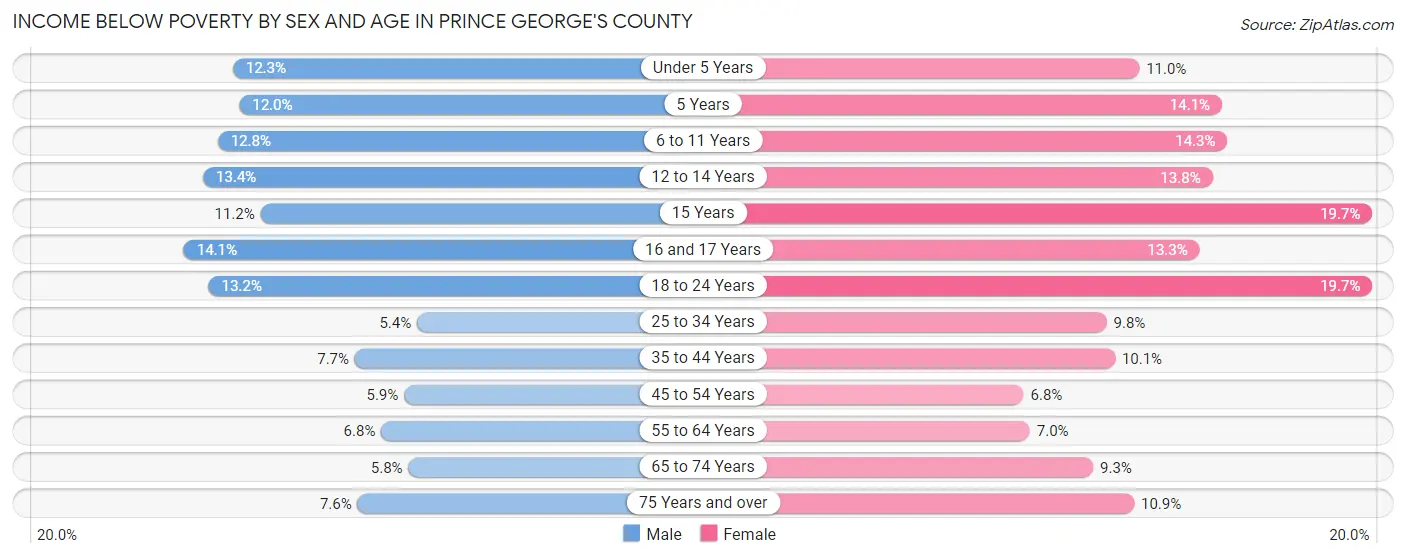
| Age Bracket | Male | Female |
| Under 5 Years | 3,626 (12.3%) | 3,213 (11.0%) |
| 5 Years | 685 (12.0%) | 765 (14.1%) |
| 6 to 11 Years | 4,508 (12.8%) | 4,762 (14.3%) |
| 12 to 14 Years | 2,237 (13.4%) | 2,354 (13.8%) |
| 15 Years | 694 (11.2%) | 1,148 (19.7%) |
| 16 and 17 Years | 1,556 (14.1%) | 1,431 (13.3%) |
| 18 to 24 Years | 5,170 (13.2%) | 7,576 (19.7%) |
| 25 to 34 Years | 3,663 (5.4%) | 6,632 (9.8%) |
| 35 to 44 Years | 5,010 (7.7%) | 6,571 (10.1%) |
| 45 to 54 Years | 3,664 (5.9%) | 4,480 (6.8%) |
| 55 to 64 Years | 3,999 (6.8%) | 4,707 (7.0%) |
| 65 to 74 Years | 2,089 (5.8%) | 4,440 (9.3%) |
| 75 Years and over | 1,426 (7.6%) | 3,245 (10.8%) |
| Total | 38,327 (8.5%) | 51,324 (10.6%) |
Income Above Poverty by Sex and Age in Prince George's County
According to the poverty statistics in Prince George's County, males aged 25 to 34 years and females aged 45 to 54 years are the age groups that are most secure financially, with 94.6% of males and 93.2% of females in these age groups living above the poverty line.
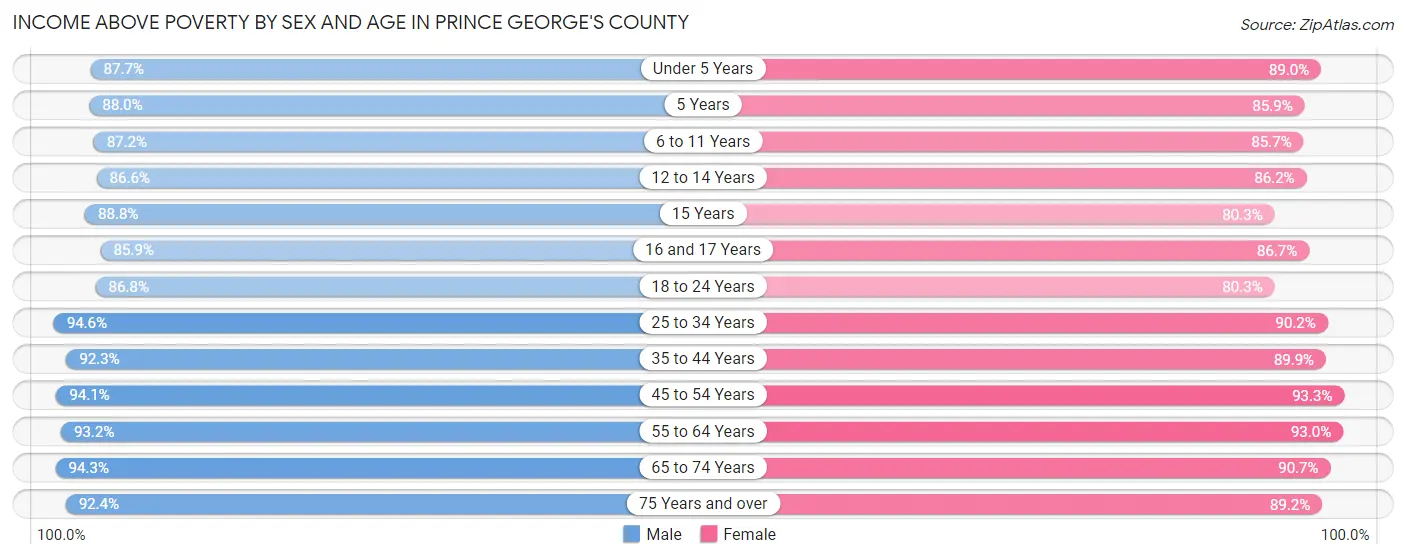
| Age Bracket | Male | Female |
| Under 5 Years | 25,924 (87.7%) | 25,893 (89.0%) |
| 5 Years | 5,009 (88.0%) | 4,656 (85.9%) |
| 6 to 11 Years | 30,637 (87.2%) | 28,507 (85.7%) |
| 12 to 14 Years | 14,486 (86.6%) | 14,752 (86.2%) |
| 15 Years | 5,478 (88.8%) | 4,683 (80.3%) |
| 16 and 17 Years | 9,487 (85.9%) | 9,342 (86.7%) |
| 18 to 24 Years | 34,078 (86.8%) | 30,902 (80.3%) |
| 25 to 34 Years | 63,843 (94.6%) | 60,850 (90.2%) |
| 35 to 44 Years | 59,720 (92.3%) | 58,217 (89.9%) |
| 45 to 54 Years | 58,343 (94.1%) | 61,927 (93.2%) |
| 55 to 64 Years | 55,133 (93.2%) | 62,758 (93.0%) |
| 65 to 74 Years | 34,253 (94.3%) | 43,151 (90.7%) |
| 75 Years and over | 17,247 (92.4%) | 26,674 (89.1%) |
| Total | 413,638 (91.5%) | 432,312 (89.4%) |
Income Below Poverty Among Married-Couple Families in Prince George's County
The poverty statistics for married-couple families in Prince George's County show that 3.4% or 4,550 of the total 133,204 families live below the poverty line. Families with 5 or more children have the highest poverty rate of 13.4%, comprising of 168 families. On the other hand, families with no children have the lowest poverty rate of 2.3%, which includes 1,727 families.
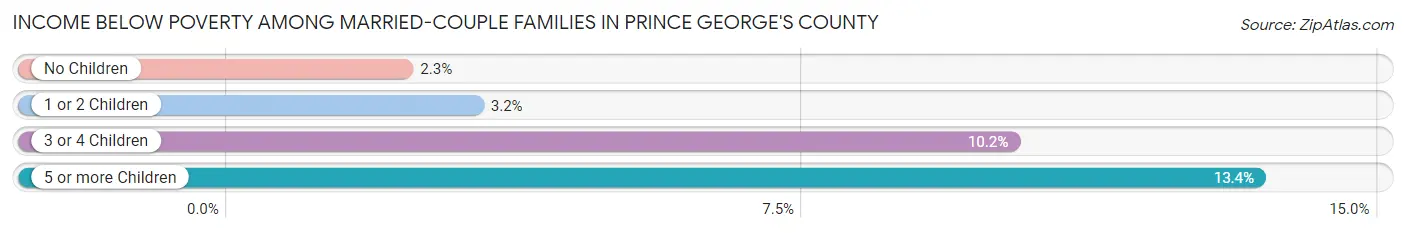
| Children | Above Poverty | Below Poverty |
| No Children | 73,551 (97.7%) | 1,727 (2.3%) |
| 1 or 2 Children | 43,288 (96.8%) | 1,435 (3.2%) |
| 3 or 4 Children | 10,731 (89.8%) | 1,220 (10.2%) |
| 5 or more Children | 1,084 (86.6%) | 168 (13.4%) |
| Total | 128,654 (96.6%) | 4,550 (3.4%) |
Income Below Poverty Among Single-Parent Households in Prince George's County
According to the poverty data in Prince George's County, 7.9% or 1,792 single-father households and 11.3% or 7,120 single-mother households are living below the poverty line. Among single-father households, those with 5 or more children have the highest poverty rate, with 60 households (27.3%) experiencing poverty. Likewise, among single-mother households, those with 5 or more children have the highest poverty rate, with 277 households (44.3%) falling below the poverty line.
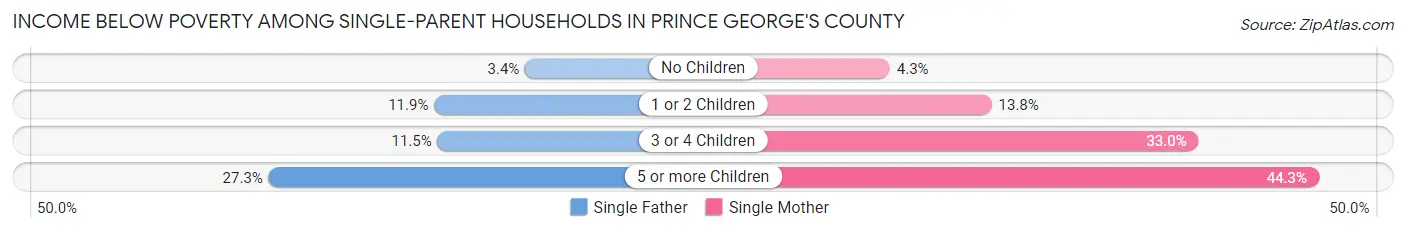
| Children | Single Father | Single Mother |
| No Children | 372 (3.4%) | 1,226 (4.3%) |
| 1 or 2 Children | 1,099 (11.8%) | 3,960 (13.8%) |
| 3 or 4 Children | 261 (11.5%) | 1,657 (33.0%) |
| 5 or more Children | 60 (27.3%) | 277 (44.3%) |
| Total | 1,792 (7.9%) | 7,120 (11.3%) |
Income Below Poverty Among Married-Couple vs Single-Parent Households in Prince George's County
The poverty data for Prince George's County shows that 4,550 of the married-couple family households (3.4%) and 8,912 of the single-parent households (10.4%) are living below the poverty level. Within the married-couple family households, those with 5 or more children have the highest poverty rate, with 168 households (13.4%) falling below the poverty line. Among the single-parent households, those with 5 or more children have the highest poverty rate, with 337 household (39.8%) living below poverty.
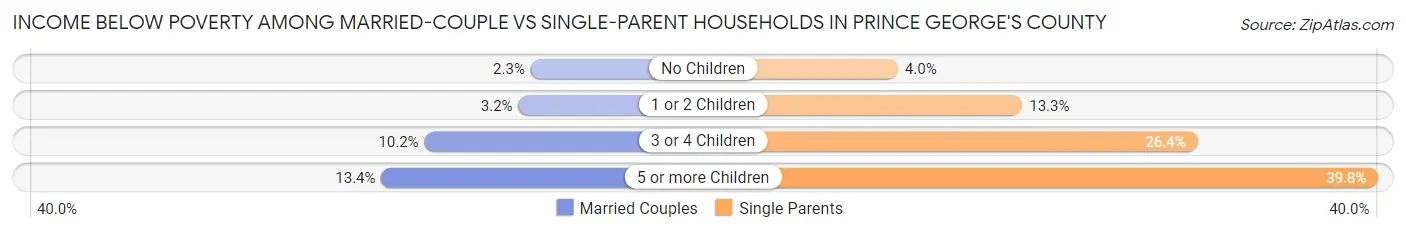
| Children | Married-Couple Families | Single-Parent Households |
| No Children | 1,727 (2.3%) | 1,598 (4.0%) |
| 1 or 2 Children | 1,435 (3.2%) | 5,059 (13.3%) |
| 3 or 4 Children | 1,220 (10.2%) | 1,918 (26.4%) |
| 5 or more Children | 168 (13.4%) | 337 (39.8%) |
| Total | 4,550 (3.4%) | 8,912 (10.4%) |
Employment Characteristics in Prince George's County
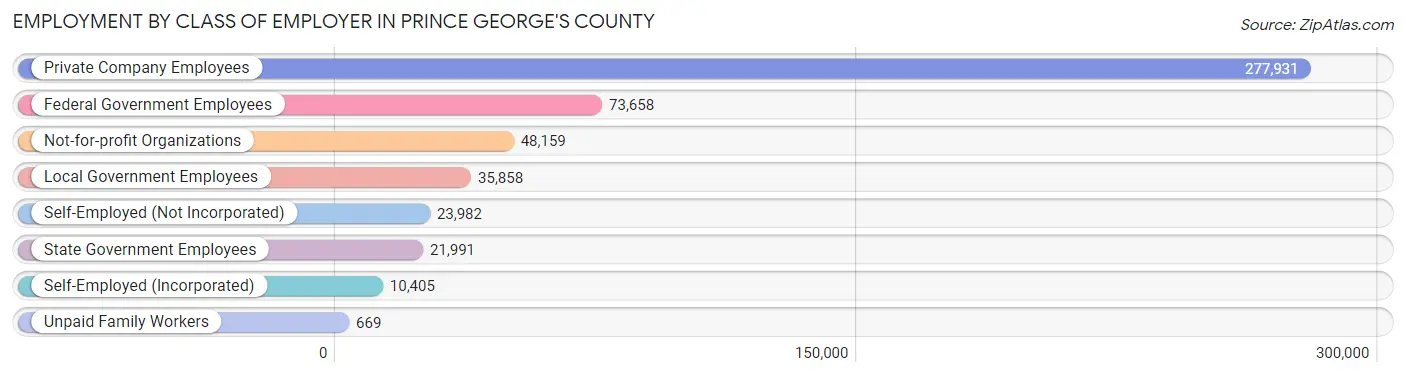
Employment by Class of Employer in Prince George's County
Among the 492,653 employed individuals in Prince George's County, private company employees (277,931 | 56.4%), federal government employees (73,658 | 14.9%), and not-for-profit organizations (48,159 | 9.8%) make up the most common classes of employment.
| Employer Class | # Employees | % Employees |
| Private Company Employees | 277,931 | 56.4% |
| Self-Employed (Incorporated) | 10,405 | 2.1% |
| Self-Employed (Not Incorporated) | 23,982 | 4.9% |
| Not-for-profit Organizations | 48,159 | 9.8% |
| Local Government Employees | 35,858 | 7.3% |
| State Government Employees | 21,991 | 4.5% |
| Federal Government Employees | 73,658 | 14.9% |
| Unpaid Family Workers | 669 | 0.1% |
| Total | 492,653 | 100.0% |
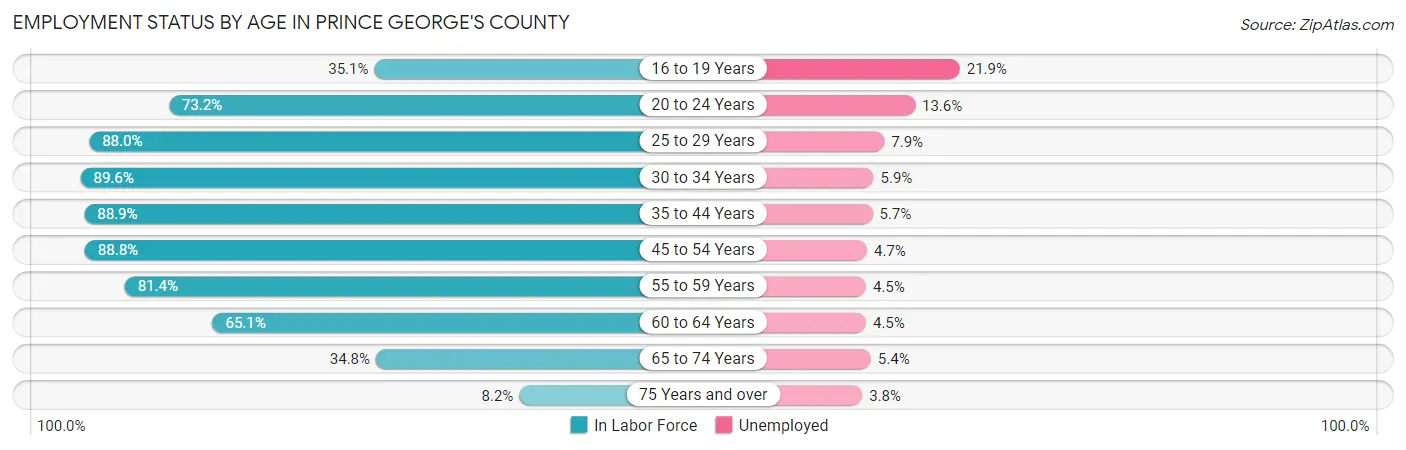
Employment Status by Age in Prince George's County
According to the labor force statistics for Prince George's County, out of the total population over 16 years of age (767,992), 70.3% or 539,898 individuals are in the labor force, with 6.7% or 36,173 of them unemployed. The age group with the highest labor force participation rate is 30 to 34 years, with 89.6% or 61,236 individuals in the labor force. Within the labor force, the 16 to 19 years age range has the highest percentage of unemployed individuals, with 21.9% or 3,797 of them being unemployed.
| Age Bracket | In Labor Force | Unemployed |
| 16 to 19 Years | 17,339 (35.1%) | 3,797 (21.9%) |
| 20 to 24 Years | 45,670 (73.2%) | 6,211 (13.6%) |
| 25 to 29 Years | 59,088 (88.0%) | 4,668 (7.9%) |
| 30 to 34 Years | 61,236 (89.6%) | 3,613 (5.9%) |
| 35 to 44 Years | 115,294 (88.9%) | 6,572 (5.7%) |
| 45 to 54 Years | 114,380 (88.8%) | 5,376 (4.7%) |
| 55 to 59 Years | 53,924 (81.4%) | 2,427 (4.5%) |
| 60 to 64 Years | 39,671 (65.1%) | 1,785 (4.5%) |
| 65 to 74 Years | 29,533 (34.8%) | 1,595 (5.4%) |
| 75 Years and over | 4,114 (8.2%) | 156 (3.8%) |
| Total | 539,898 (70.3%) | 36,173 (6.7%) |
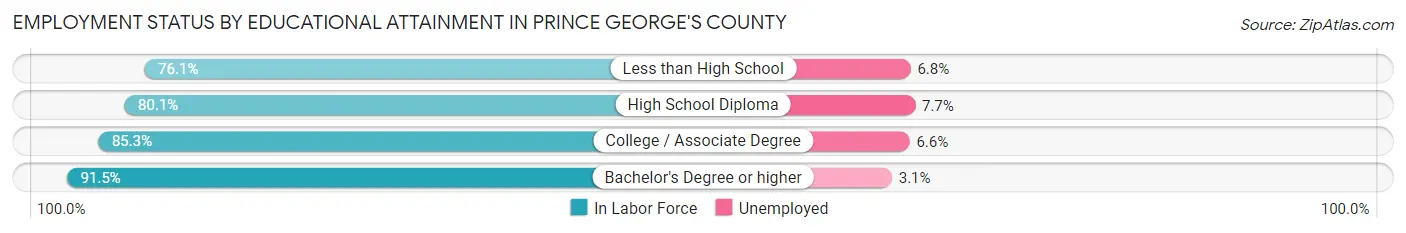
Employment Status by Educational Attainment in Prince George's County
According to labor force statistics for Prince George's County, 85.1% of individuals (443,515) out of the total population between 25 and 64 years of age (521,169) are in the labor force, with 5.5% or 24,393 of them being unemployed. The group with the highest labor force participation rate are those with the educational attainment of bachelor's degree or higher, with 91.5% or 174,163 individuals in the labor force. Within the labor force, individuals with high school diploma education have the highest percentage of unemployment, with 7.7% or 7,828 of them being unemployed.
| Educational Attainment | In Labor Force | Unemployed |
| Less than High School | 50,754 (76.1%) | 4,535 (6.8%) |
| High School Diploma | 101,666 (80.1%) | 9,773 (7.7%) |
| College / Associate Degree | 117,039 (85.3%) | 9,056 (6.6%) |
| Bachelor's Degree or higher | 174,163 (91.5%) | 5,901 (3.1%) |
| Total | 443,515 (85.1%) | 28,664 (5.5%) |
Employment Occupations by Sex in Prince George's County
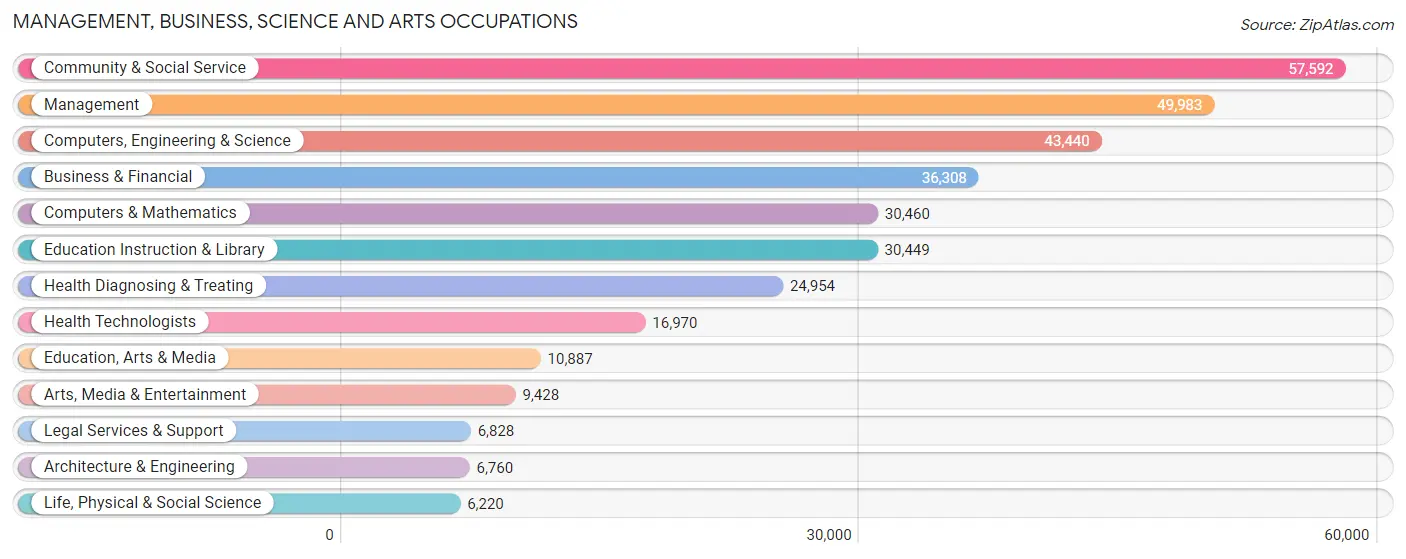
Management, Business, Science and Arts Occupations
The most common Management, Business, Science and Arts occupations in Prince George's County are Community & Social Service (57,592 | 11.5%), Management (49,983 | 10.0%), Computers, Engineering & Science (43,440 | 8.7%), Business & Financial (36,308 | 7.2%), and Computers & Mathematics (30,460 | 6.1%).
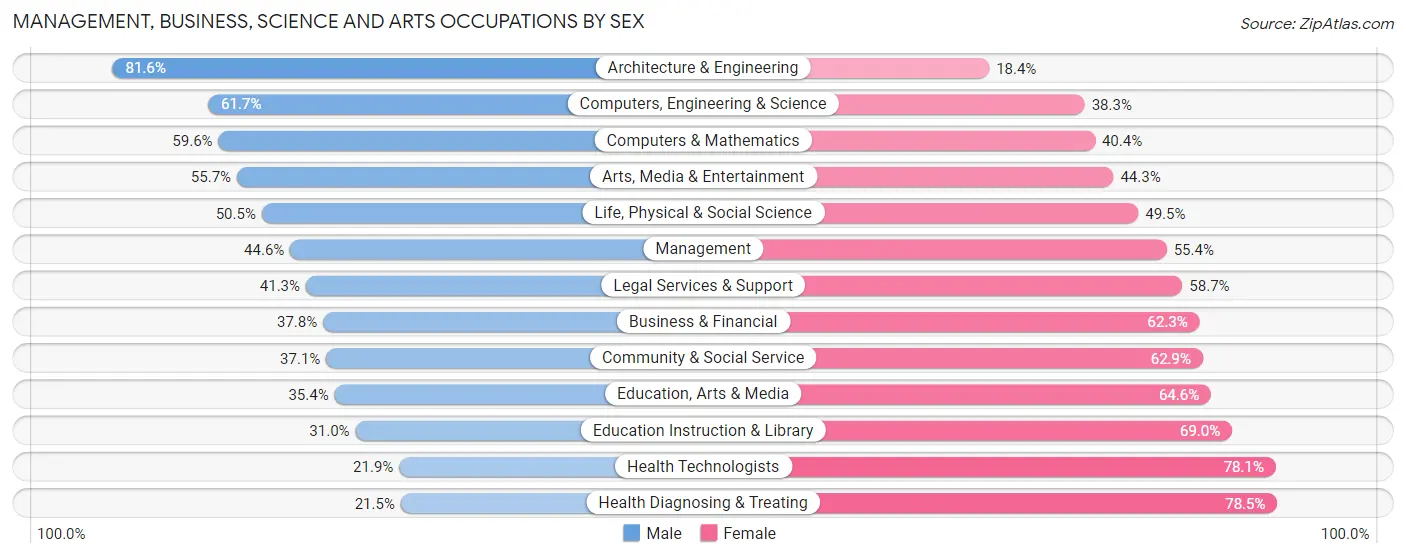
Management, Business, Science and Arts Occupations by Sex
Within the Management, Business, Science and Arts occupations in Prince George's County, the most male-oriented occupations are Architecture & Engineering (81.6%), Computers, Engineering & Science (61.7%), and Computers & Mathematics (59.6%), while the most female-oriented occupations are Health Diagnosing & Treating (78.5%), Health Technologists (78.1%), and Education Instruction & Library (69.0%).
| Occupation | Male | Female |
| Management | 22,292 (44.6%) | 27,691 (55.4%) |
| Business & Financial | 13,706 (37.8%) | 22,602 (62.3%) |
| Computers, Engineering & Science | 26,806 (61.7%) | 16,634 (38.3%) |
| Computers & Mathematics | 18,144 (59.6%) | 12,316 (40.4%) |
| Architecture & Engineering | 5,519 (81.6%) | 1,241 (18.4%) |
| Life, Physical & Social Science | 3,143 (50.5%) | 3,077 (49.5%) |
| Community & Social Service | 21,361 (37.1%) | 36,231 (62.9%) |
| Education, Arts & Media | 3,850 (35.4%) | 7,037 (64.6%) |
| Legal Services & Support | 2,822 (41.3%) | 4,006 (58.7%) |
| Education Instruction & Library | 9,437 (31.0%) | 21,012 (69.0%) |
| Arts, Media & Entertainment | 5,252 (55.7%) | 4,176 (44.3%) |
| Health Diagnosing & Treating | 5,374 (21.5%) | 19,580 (78.5%) |
| Health Technologists | 3,711 (21.9%) | 13,259 (78.1%) |
| Total (Category) | 89,539 (42.2%) | 122,738 (57.8%) |
| Total (Overall) | 251,709 (50.3%) | 248,856 (49.7%) |
Services Occupations
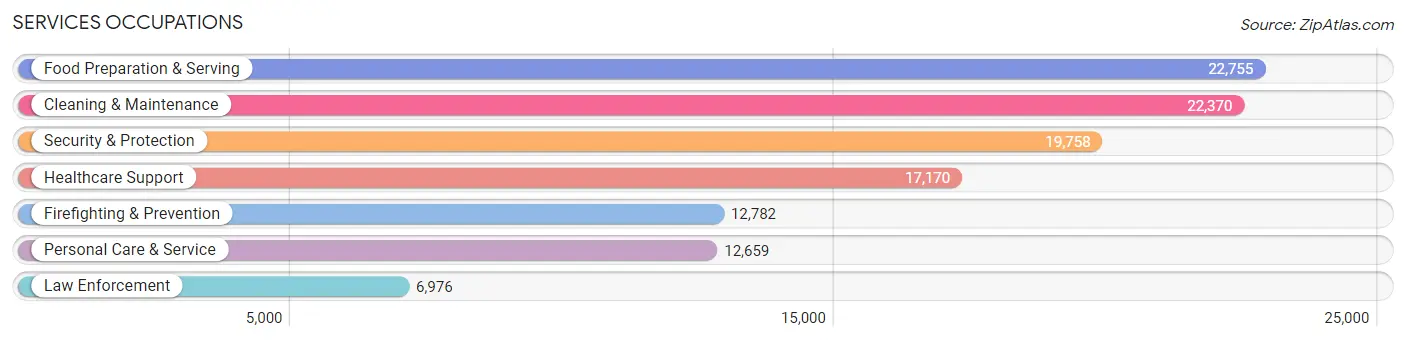
The most common Services occupations in Prince George's County are Food Preparation & Serving (22,755 | 4.5%), Cleaning & Maintenance (22,370 | 4.5%), Security & Protection (19,758 | 4.0%), Healthcare Support (17,170 | 3.4%), and Firefighting & Prevention (12,782 | 2.5%).
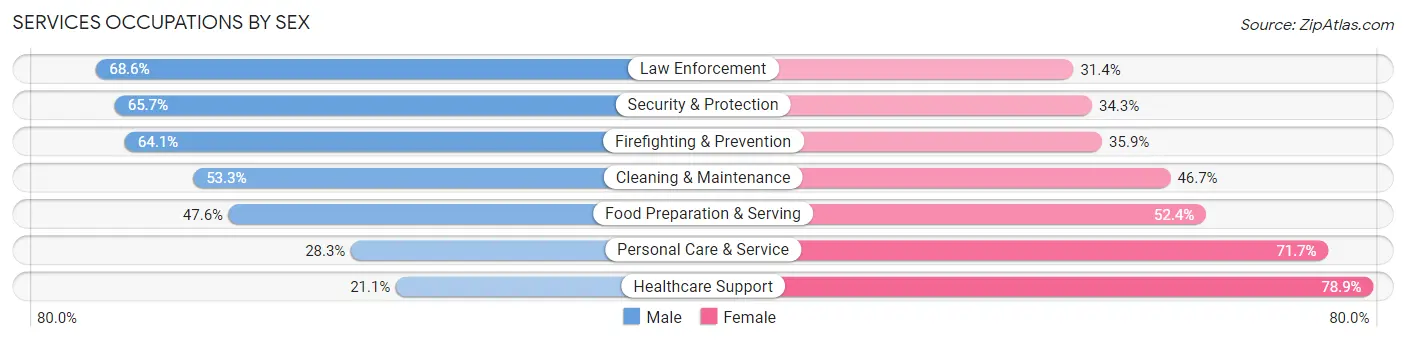
Services Occupations by Sex
Within the Services occupations in Prince George's County, the most male-oriented occupations are Law Enforcement (68.6%), Security & Protection (65.7%), and Firefighting & Prevention (64.1%), while the most female-oriented occupations are Healthcare Support (78.9%), Personal Care & Service (71.7%), and Food Preparation & Serving (52.4%).
| Occupation | Male | Female |
| Healthcare Support | 3,628 (21.1%) | 13,542 (78.9%) |
| Security & Protection | 12,981 (65.7%) | 6,777 (34.3%) |
| Firefighting & Prevention | 8,193 (64.1%) | 4,589 (35.9%) |
| Law Enforcement | 4,788 (68.6%) | 2,188 (31.4%) |
| Food Preparation & Serving | 10,839 (47.6%) | 11,916 (52.4%) |
| Cleaning & Maintenance | 11,918 (53.3%) | 10,452 (46.7%) |
| Personal Care & Service | 3,577 (28.3%) | 9,082 (71.7%) |
| Total (Category) | 42,943 (45.3%) | 51,769 (54.7%) |
| Total (Overall) | 251,709 (50.3%) | 248,856 (49.7%) |
Sales and Office Occupations
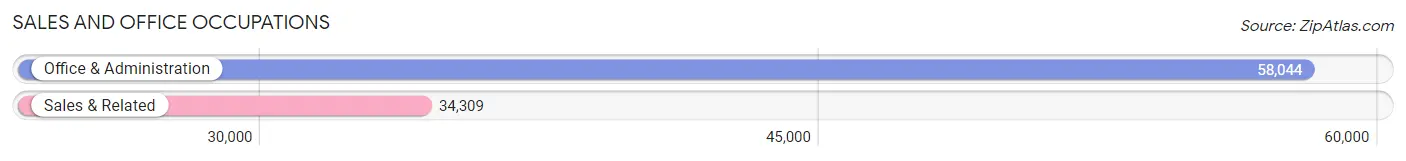
The most common Sales and Office occupations in Prince George's County are Office & Administration (58,044 | 11.6%), and Sales & Related (34,309 | 6.9%).
Sales and Office Occupations by Sex
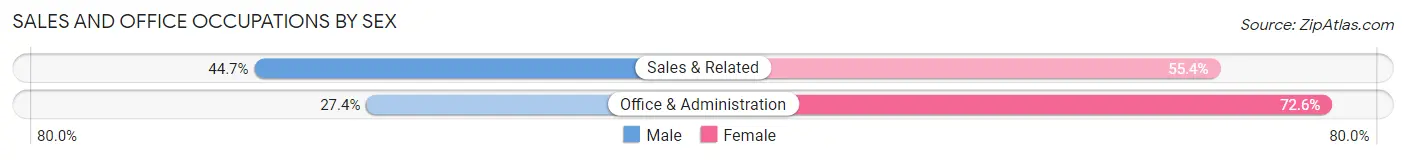
| Occupation | Male | Female |
| Sales & Related | 15,320 (44.7%) | 18,989 (55.3%) |
| Office & Administration | 15,930 (27.4%) | 42,114 (72.6%) |
| Total (Category) | 31,250 (33.8%) | 61,103 (66.2%) |
| Total (Overall) | 251,709 (50.3%) | 248,856 (49.7%) |
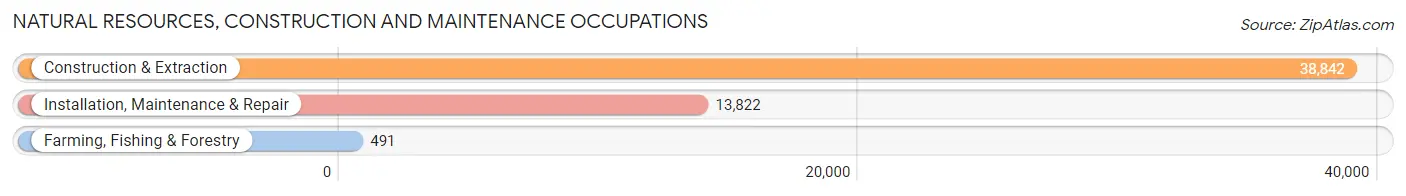
Natural Resources, Construction and Maintenance Occupations
The most common Natural Resources, Construction and Maintenance occupations in Prince George's County are Construction & Extraction (38,842 | 7.8%), Installation, Maintenance & Repair (13,822 | 2.8%), and Farming, Fishing & Forestry (491 | 0.1%).
Natural Resources, Construction and Maintenance Occupations by Sex
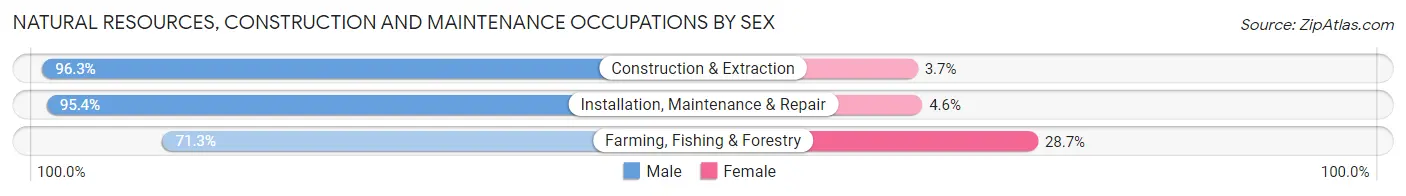
| Occupation | Male | Female |
| Farming, Fishing & Forestry | 350 (71.3%) | 141 (28.7%) |
| Construction & Extraction | 37,401 (96.3%) | 1,441 (3.7%) |
| Installation, Maintenance & Repair | 13,180 (95.4%) | 642 (4.6%) |
| Total (Category) | 50,931 (95.8%) | 2,224 (4.2%) |
| Total (Overall) | 251,709 (50.3%) | 248,856 (49.7%) |
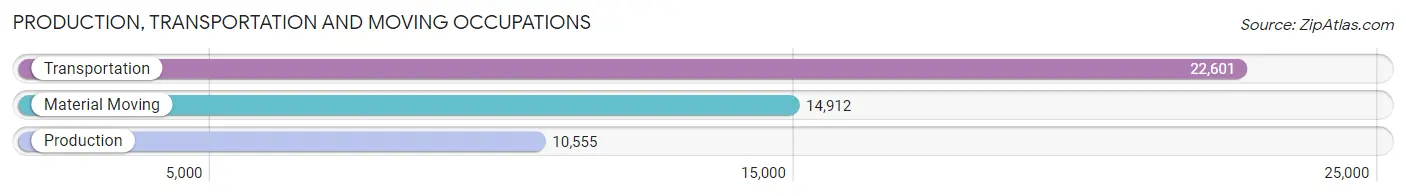
Production, Transportation and Moving Occupations
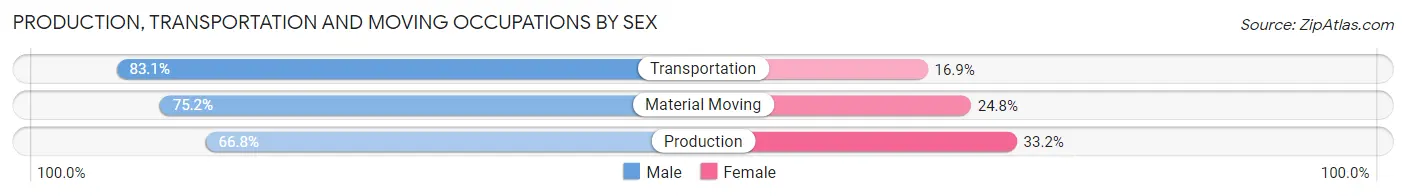
The most common Production, Transportation and Moving occupations in Prince George's County are Transportation (22,601 | 4.5%), Material Moving (14,912 | 3.0%), and Production (10,555 | 2.1%).
Production, Transportation and Moving Occupations by Sex
| Occupation | Male | Female |
| Production | 7,048 (66.8%) | 3,507 (33.2%) |
| Transportation | 18,787 (83.1%) | 3,814 (16.9%) |
| Material Moving | 11,211 (75.2%) | 3,701 (24.8%) |
| Total (Category) | 37,046 (77.1%) | 11,022 (22.9%) |
| Total (Overall) | 251,709 (50.3%) | 248,856 (49.7%) |
Employment Industries by Sex in Prince George's County
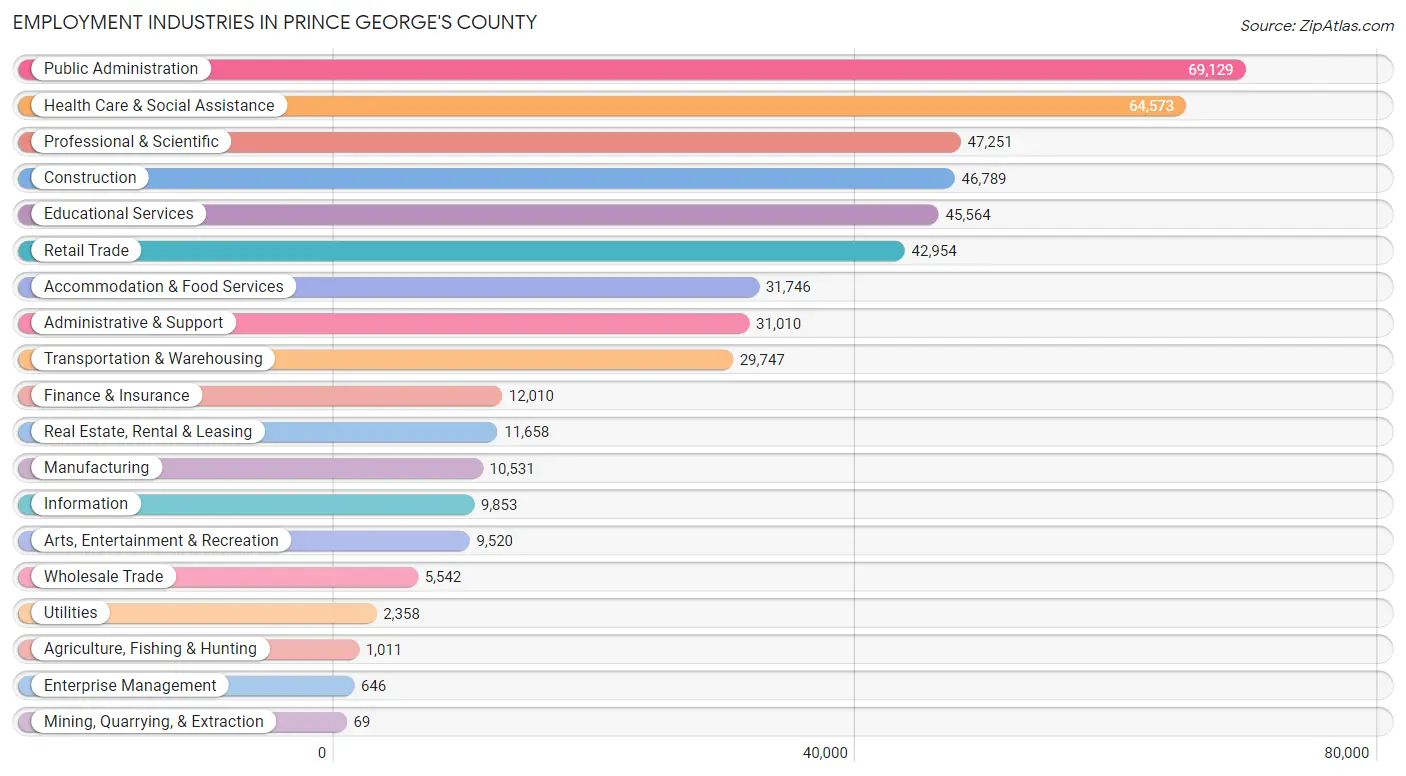
Employment Industries in Prince George's County
The major employment industries in Prince George's County include Public Administration (69,129 | 13.8%), Health Care & Social Assistance (64,573 | 12.9%), Professional & Scientific (47,251 | 9.4%), Construction (46,789 | 9.3%), and Educational Services (45,564 | 9.1%).
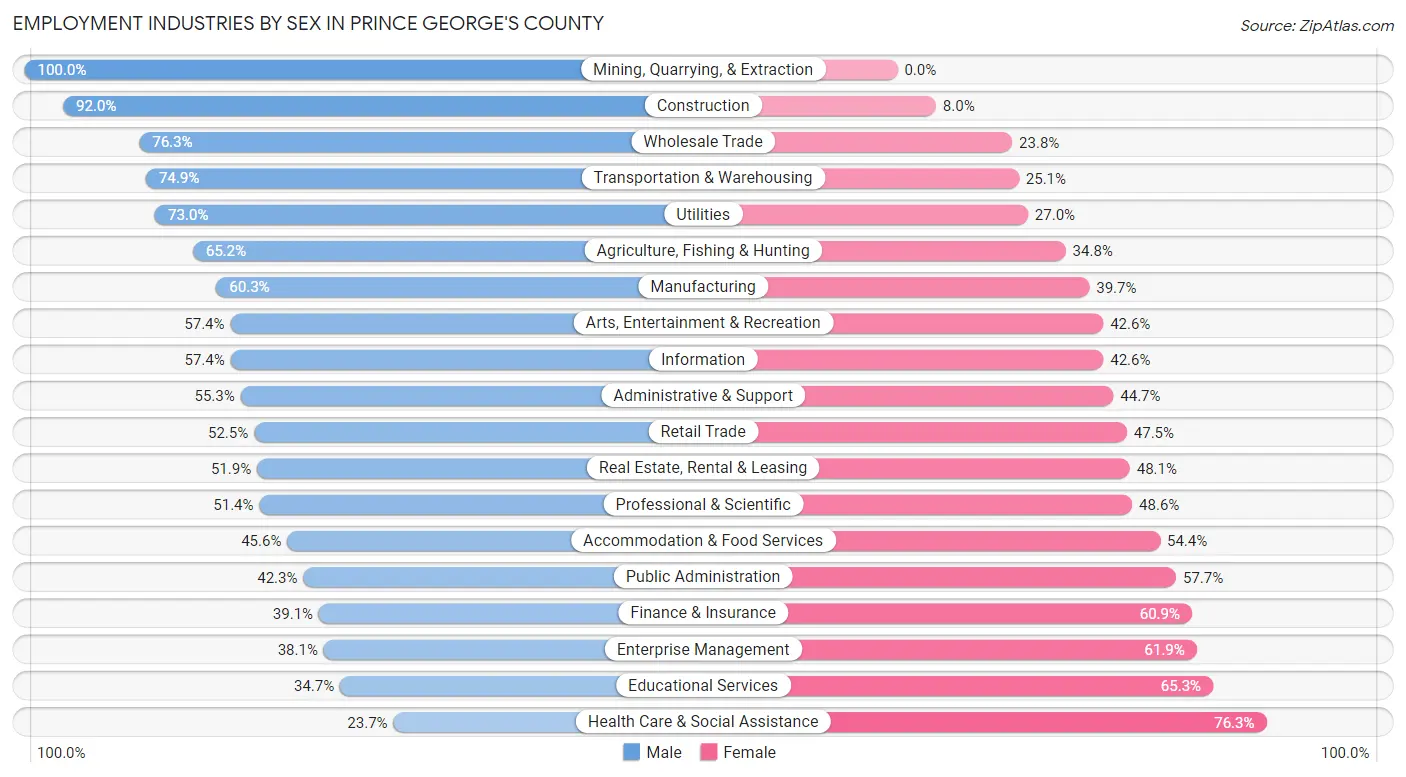
Employment Industries by Sex in Prince George's County
The Prince George's County industries that see more men than women are Mining, Quarrying, & Extraction (100.0%), Construction (92.0%), and Wholesale Trade (76.2%), whereas the industries that tend to have a higher number of women are Health Care & Social Assistance (76.3%), Educational Services (65.3%), and Enterprise Management (61.9%).
| Industry | Male | Female |
| Agriculture, Fishing & Hunting | 659 (65.2%) | 352 (34.8%) |
| Mining, Quarrying, & Extraction | 69 (100.0%) | 0 (0.0%) |
| Construction | 43,062 (92.0%) | 3,727 (8.0%) |
| Manufacturing | 6,349 (60.3%) | 4,182 (39.7%) |
| Wholesale Trade | 4,226 (76.2%) | 1,316 (23.7%) |
| Retail Trade | 22,554 (52.5%) | 20,400 (47.5%) |
| Transportation & Warehousing | 22,272 (74.9%) | 7,475 (25.1%) |
| Utilities | 1,721 (73.0%) | 637 (27.0%) |
| Information | 5,654 (57.4%) | 4,199 (42.6%) |
| Finance & Insurance | 4,693 (39.1%) | 7,317 (60.9%) |
| Real Estate, Rental & Leasing | 6,050 (51.9%) | 5,608 (48.1%) |
| Professional & Scientific | 24,290 (51.4%) | 22,961 (48.6%) |
| Enterprise Management | 246 (38.1%) | 400 (61.9%) |
| Administrative & Support | 17,147 (55.3%) | 13,863 (44.7%) |
| Educational Services | 15,813 (34.7%) | 29,751 (65.3%) |
| Health Care & Social Assistance | 15,275 (23.7%) | 49,298 (76.3%) |
| Arts, Entertainment & Recreation | 5,465 (57.4%) | 4,055 (42.6%) |
| Accommodation & Food Services | 14,488 (45.6%) | 17,258 (54.4%) |
| Public Administration | 29,254 (42.3%) | 39,875 (57.7%) |
| Total | 251,709 (50.3%) | 248,856 (49.7%) |
Education in Prince George's County
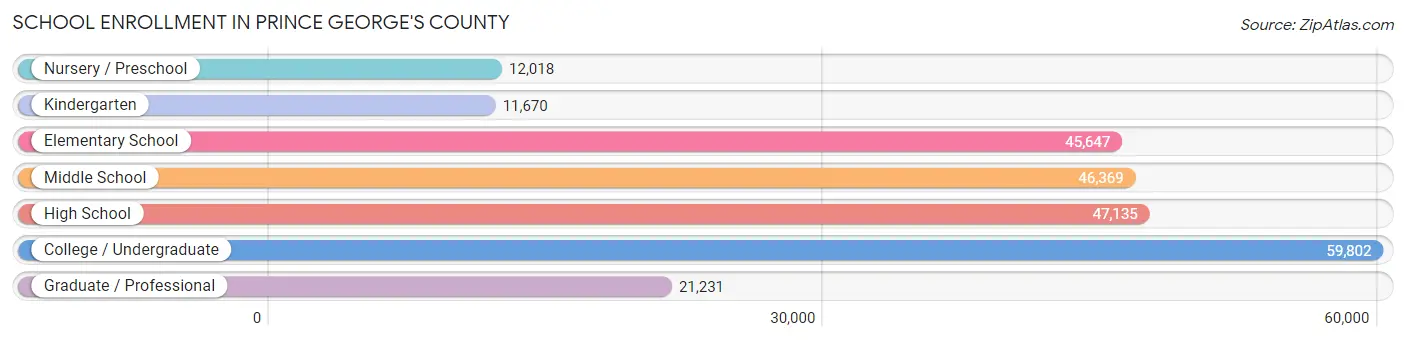
School Enrollment in Prince George's County
The most common levels of schooling among the 243,872 students in Prince George's County are college / undergraduate (59,802 | 24.5%), high school (47,135 | 19.3%), and middle school (46,369 | 19.0%).
| School Level | # Students | % Students |
| Nursery / Preschool | 12,018 | 4.9% |
| Kindergarten | 11,670 | 4.8% |
| Elementary School | 45,647 | 18.7% |
| Middle School | 46,369 | 19.0% |
| High School | 47,135 | 19.3% |
| College / Undergraduate | 59,802 | 24.5% |
| Graduate / Professional | 21,231 | 8.7% |
| Total | 243,872 | 100.0% |
School Enrollment by Age by Funding Source in Prince George's County
Out of a total of 243,872 students who are enrolled in schools in Prince George's County, 41,946 (17.2%) attend a private institution, while the remaining 201,926 (82.8%) are enrolled in public schools. The age group of 3 to 4 year olds has the highest likelihood of being enrolled in private schools, with 3,824 (40.1% in the age bracket) enrolled. Conversely, the age group of 18 to 19 year olds has the lowest likelihood of being enrolled in a private school, with 19,654 (91.3% in the age bracket) attending a public institution.
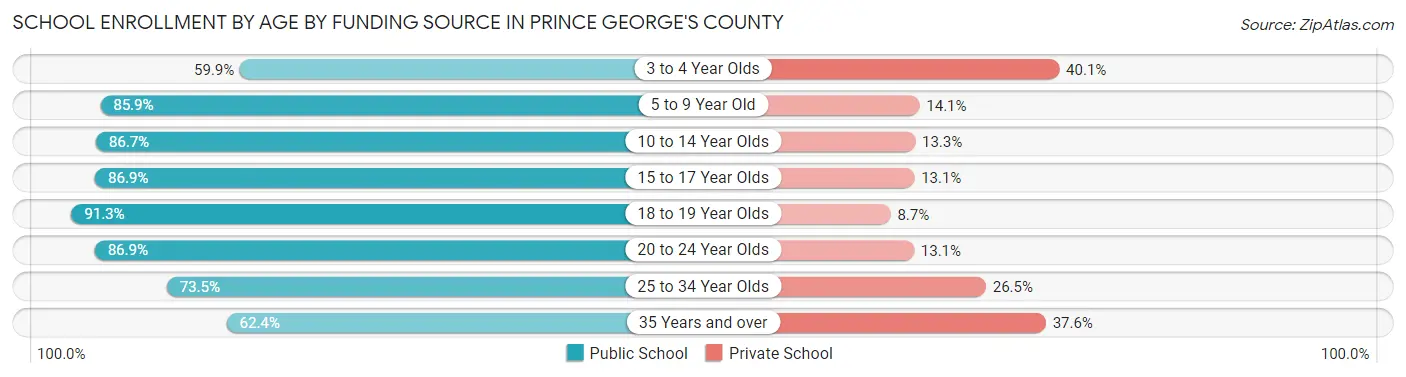
| Age Bracket | Public School | Private School |
| 3 to 4 Year Olds | 5,703 (59.9%) | 3,824 (40.1%) |
| 5 to 9 Year Old | 47,116 (85.9%) | 7,732 (14.1%) |
| 10 to 14 Year Olds | 49,539 (86.7%) | 7,595 (13.3%) |
| 15 to 17 Year Olds | 28,618 (86.9%) | 4,328 (13.1%) |
| 18 to 19 Year Olds | 19,654 (91.3%) | 1,878 (8.7%) |
| 20 to 24 Year Olds | 24,389 (86.9%) | 3,668 (13.1%) |
| 25 to 34 Year Olds | 13,644 (73.5%) | 4,913 (26.5%) |
| 35 Years and over | 13,267 (62.4%) | 8,004 (37.6%) |
| Total | 201,926 (82.8%) | 41,946 (17.2%) |
Educational Attainment by Field of Study in Prince George's County
Business (53,646 | 21.3%), social sciences (26,032 | 10.3%), science & technology (22,982 | 9.1%), computers & mathematics (20,101 | 8.0%), and education (19,798 | 7.9%) are the most common fields of study among 251,480 individuals in Prince George's County who have obtained a bachelor's degree or higher.
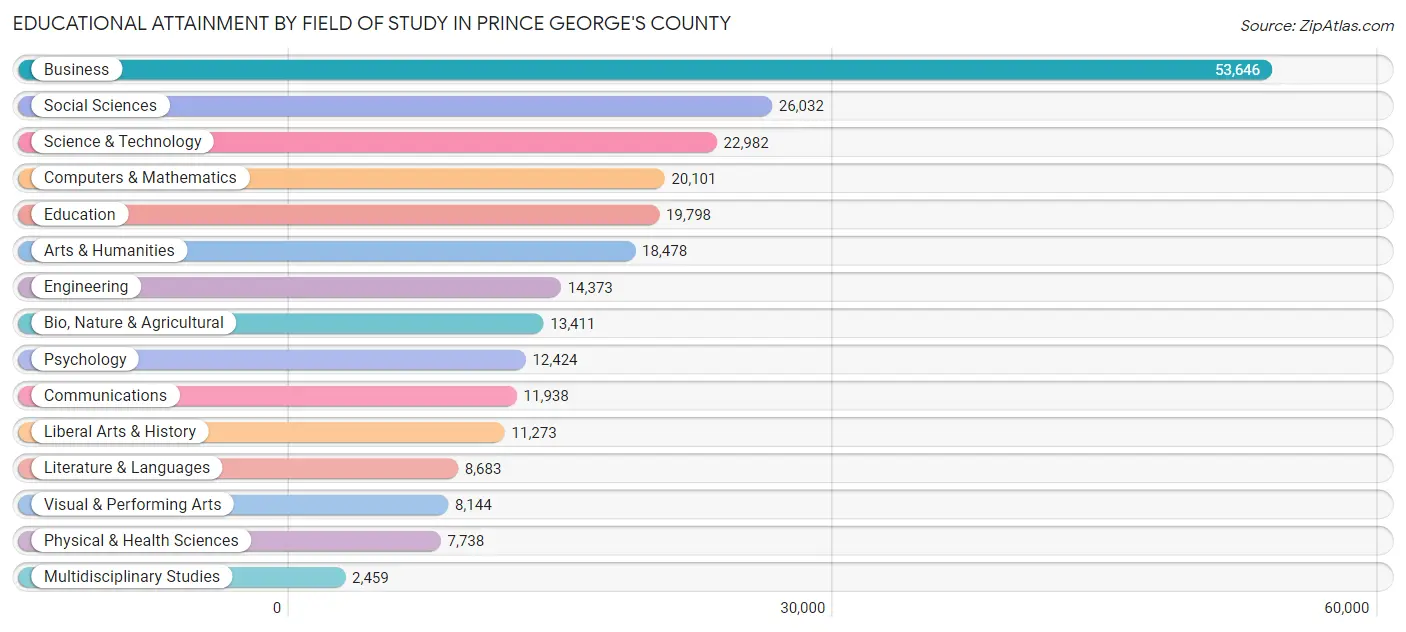
| Field of Study | # Graduates | % Graduates |
| Computers & Mathematics | 20,101 | 8.0% |
| Bio, Nature & Agricultural | 13,411 | 5.3% |
| Physical & Health Sciences | 7,738 | 3.1% |
| Psychology | 12,424 | 4.9% |
| Social Sciences | 26,032 | 10.3% |
| Engineering | 14,373 | 5.7% |
| Multidisciplinary Studies | 2,459 | 1.0% |
| Science & Technology | 22,982 | 9.1% |
| Business | 53,646 | 21.3% |
| Education | 19,798 | 7.9% |
| Literature & Languages | 8,683 | 3.5% |
| Liberal Arts & History | 11,273 | 4.5% |
| Visual & Performing Arts | 8,144 | 3.2% |
| Communications | 11,938 | 4.8% |
| Arts & Humanities | 18,478 | 7.3% |
| Total | 251,480 | 100.0% |
Transportation & Commute in Prince George's County
Vehicle Availability by Sex in Prince George's County
The most prevalent vehicle ownership categories in Prince George's County are males with 2 vehicles (87,214, accounting for 35.1%) and females with 2 vehicles (79,353, making up 36.2%).
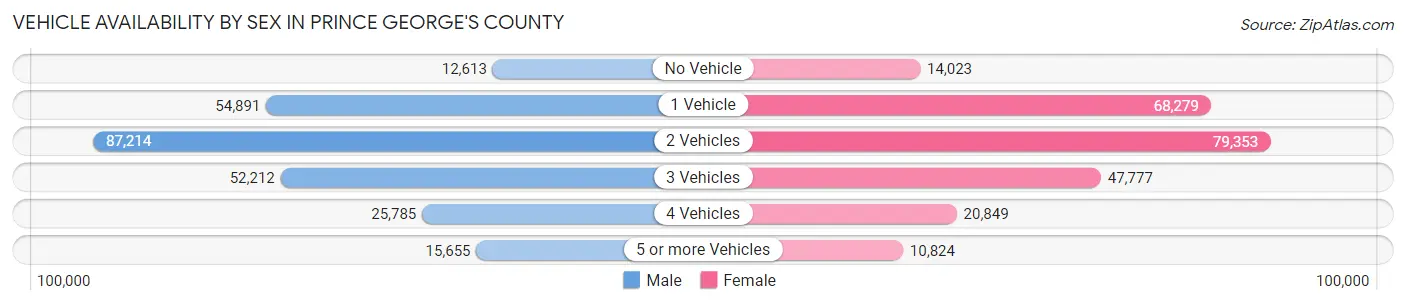
| Vehicles Available | Male | Female |
| No Vehicle | 12,613 (5.1%) | 14,023 (5.8%) |
| 1 Vehicle | 54,891 (22.1%) | 68,279 (28.3%) |
| 2 Vehicles | 87,214 (35.1%) | 79,353 (32.9%) |
| 3 Vehicles | 52,212 (21.0%) | 47,777 (19.8%) |
| 4 Vehicles | 25,785 (10.4%) | 20,849 (8.6%) |
| 5 or more Vehicles | 15,655 (6.3%) | 10,824 (4.5%) |
| Total | 248,370 (100.0%) | 241,105 (100.0%) |
Commute Time in Prince George's County
The most frequently occuring commute durations in Prince George's County are 30 to 34 minutes (79,258 commuters, 18.5%), 45 to 59 minutes (66,397 commuters, 15.5%), and 60 to 89 minutes (56,549 commuters, 13.2%).
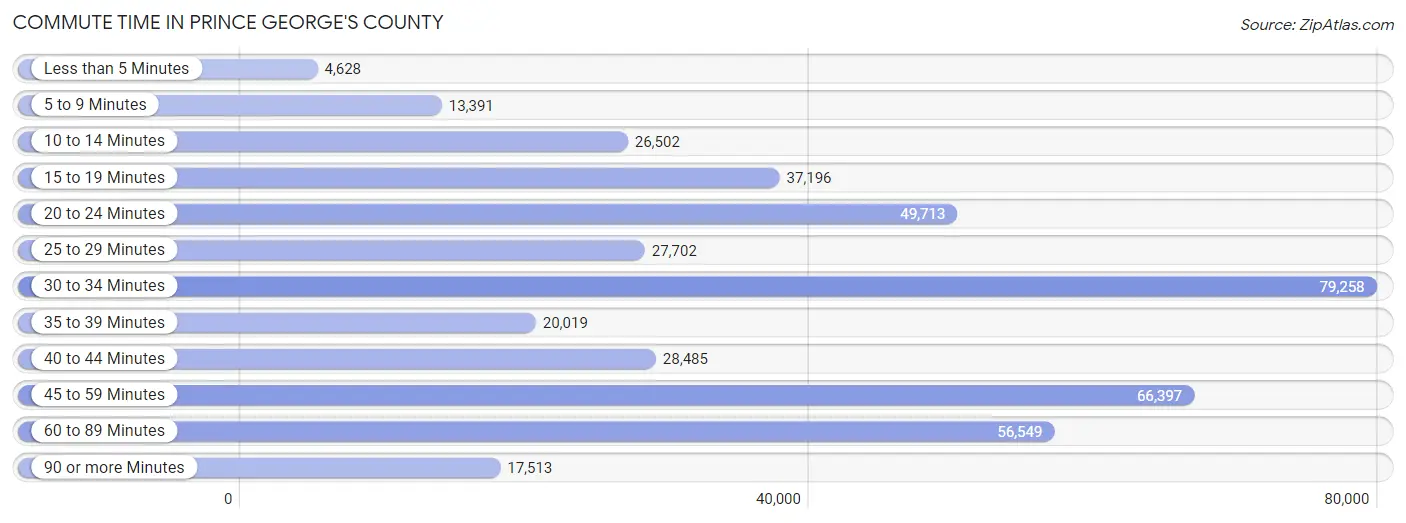
| Commute Time | # Commuters | % Commuters |
| Less than 5 Minutes | 4,628 | 1.1% |
| 5 to 9 Minutes | 13,391 | 3.1% |
| 10 to 14 Minutes | 26,502 | 6.2% |
| 15 to 19 Minutes | 37,196 | 8.7% |
| 20 to 24 Minutes | 49,713 | 11.6% |
| 25 to 29 Minutes | 27,702 | 6.5% |
| 30 to 34 Minutes | 79,258 | 18.5% |
| 35 to 39 Minutes | 20,019 | 4.7% |
| 40 to 44 Minutes | 28,485 | 6.7% |
| 45 to 59 Minutes | 66,397 | 15.5% |
| 60 to 89 Minutes | 56,549 | 13.2% |
| 90 or more Minutes | 17,513 | 4.1% |
Commute Time by Sex in Prince George's County
The most common commute times in Prince George's County are 30 to 34 minutes (44,983 commuters, 20.2%) for males and 30 to 34 minutes (34,275 commuters, 16.8%) for females.
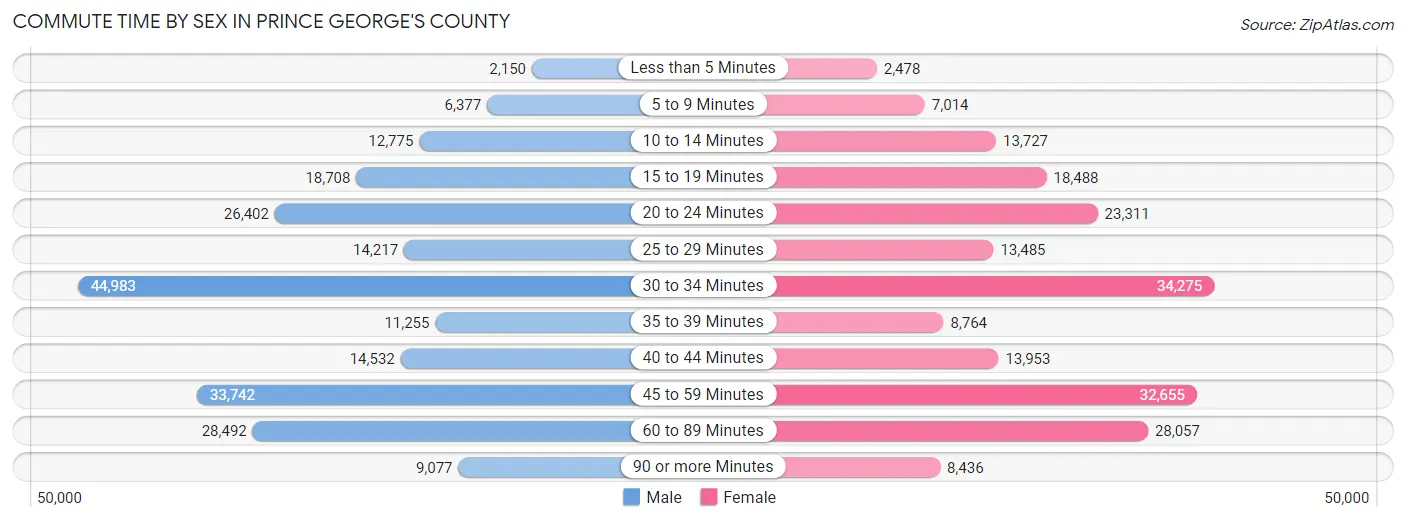
| Commute Time | Male | Female |
| Less than 5 Minutes | 2,150 (1.0%) | 2,478 (1.2%) |
| 5 to 9 Minutes | 6,377 (2.9%) | 7,014 (3.4%) |
| 10 to 14 Minutes | 12,775 (5.7%) | 13,727 (6.7%) |
| 15 to 19 Minutes | 18,708 (8.4%) | 18,488 (9.0%) |
| 20 to 24 Minutes | 26,402 (11.8%) | 23,311 (11.4%) |
| 25 to 29 Minutes | 14,217 (6.4%) | 13,485 (6.6%) |
| 30 to 34 Minutes | 44,983 (20.2%) | 34,275 (16.8%) |
| 35 to 39 Minutes | 11,255 (5.1%) | 8,764 (4.3%) |
| 40 to 44 Minutes | 14,532 (6.5%) | 13,953 (6.8%) |
| 45 to 59 Minutes | 33,742 (15.1%) | 32,655 (16.0%) |
| 60 to 89 Minutes | 28,492 (12.8%) | 28,057 (13.7%) |
| 90 or more Minutes | 9,077 (4.1%) | 8,436 (4.1%) |
Time of Departure to Work by Sex in Prince George's County
The most frequent times of departure to work in Prince George's County are 6:00 AM to 6:29 AM (28,030, 12.6%) for males and 7:00 AM to 7:29 AM (30,754, 15.0%) for females.
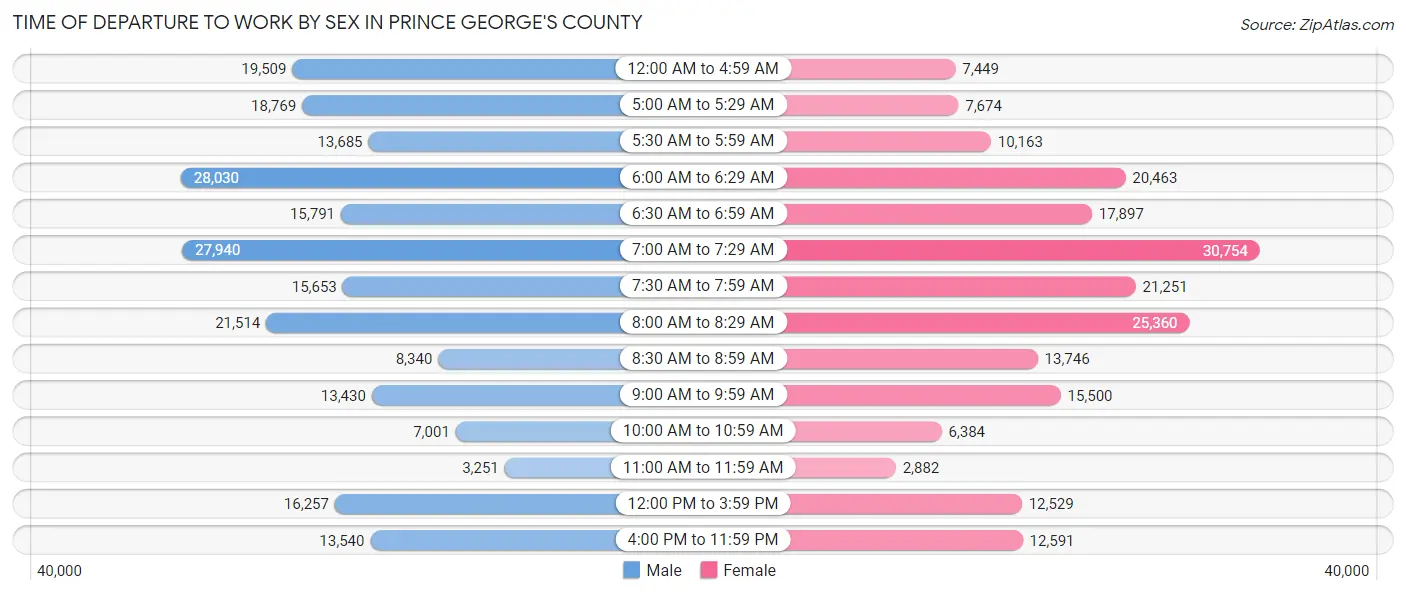
| Time of Departure | Male | Female |
| 12:00 AM to 4:59 AM | 19,509 (8.8%) | 7,449 (3.6%) |
| 5:00 AM to 5:29 AM | 18,769 (8.4%) | 7,674 (3.7%) |
| 5:30 AM to 5:59 AM | 13,685 (6.1%) | 10,163 (5.0%) |
| 6:00 AM to 6:29 AM | 28,030 (12.6%) | 20,463 (10.0%) |
| 6:30 AM to 6:59 AM | 15,791 (7.1%) | 17,897 (8.7%) |
| 7:00 AM to 7:29 AM | 27,940 (12.6%) | 30,754 (15.0%) |
| 7:30 AM to 7:59 AM | 15,653 (7.0%) | 21,251 (10.4%) |
| 8:00 AM to 8:29 AM | 21,514 (9.7%) | 25,360 (12.4%) |
| 8:30 AM to 8:59 AM | 8,340 (3.7%) | 13,746 (6.7%) |
| 9:00 AM to 9:59 AM | 13,430 (6.0%) | 15,500 (7.6%) |
| 10:00 AM to 10:59 AM | 7,001 (3.1%) | 6,384 (3.1%) |
| 11:00 AM to 11:59 AM | 3,251 (1.5%) | 2,882 (1.4%) |
| 12:00 PM to 3:59 PM | 16,257 (7.3%) | 12,529 (6.1%) |
| 4:00 PM to 11:59 PM | 13,540 (6.1%) | 12,591 (6.1%) |
| Total | 222,710 (100.0%) | 204,643 (100.0%) |
Housing Occupancy in Prince George's County
Occupancy by Ownership in Prince George's County
Of the total 341,057 dwellings in Prince George's County, owner-occupied units account for 212,888 (62.4%), while renter-occupied units make up 128,169 (37.6%).
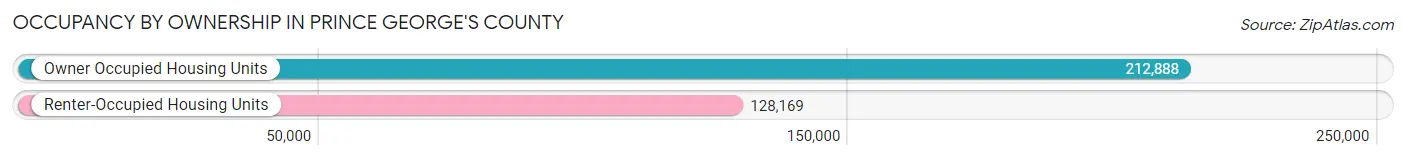
| Occupancy | # Housing Units | % Housing Units |
| Owner Occupied Housing Units | 212,888 | 62.4% |
| Renter-Occupied Housing Units | 128,169 | 37.6% |
| Total Occupied Housing Units | 341,057 | 100.0% |
Occupancy by Household Size in Prince George's County
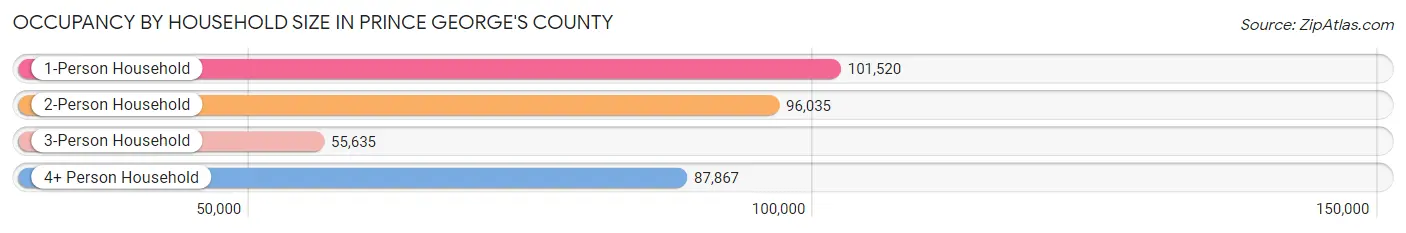
| Household Size | # Housing Units | % Housing Units |
| 1-Person Household | 101,520 | 29.8% |
| 2-Person Household | 96,035 | 28.2% |
| 3-Person Household | 55,635 | 16.3% |
| 4+ Person Household | 87,867 | 25.8% |
| Total Housing Units | 341,057 | 100.0% |
Occupancy by Ownership by Household Size in Prince George's County
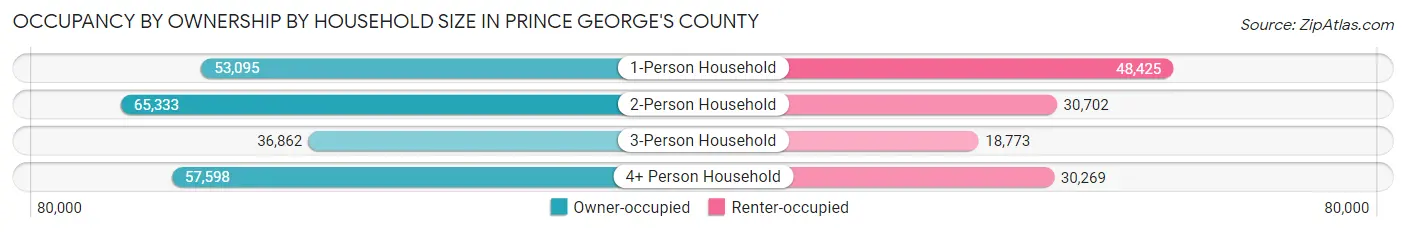
| Household Size | Owner-occupied | Renter-occupied |
| 1-Person Household | 53,095 (52.3%) | 48,425 (47.7%) |
| 2-Person Household | 65,333 (68.0%) | 30,702 (32.0%) |
| 3-Person Household | 36,862 (66.3%) | 18,773 (33.7%) |
| 4+ Person Household | 57,598 (65.5%) | 30,269 (34.4%) |
| Total Housing Units | 212,888 (62.4%) | 128,169 (37.6%) |
Occupancy by Educational Attainment in Prince George's County
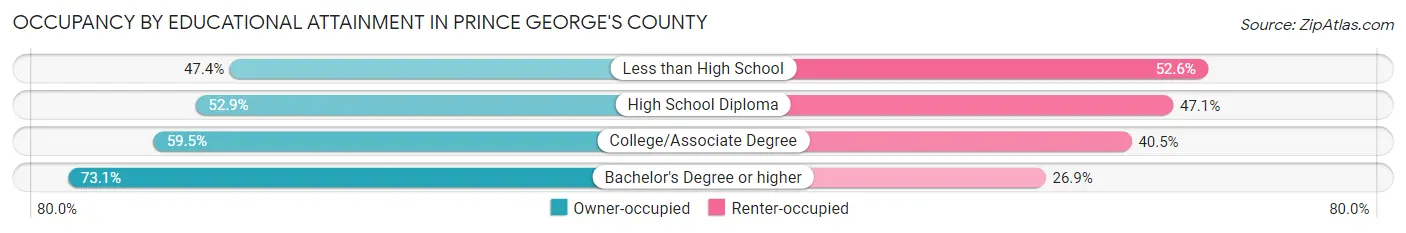
| Household Size | Owner-occupied | Renter-occupied |
| Less than High School | 15,315 (47.4%) | 16,980 (52.6%) |
| High School Diploma | 38,736 (52.9%) | 34,472 (47.1%) |
| College/Associate Degree | 58,663 (59.5%) | 39,906 (40.5%) |
| Bachelor's Degree or higher | 100,174 (73.1%) | 36,811 (26.9%) |
Occupancy by Age of Householder in Prince George's County
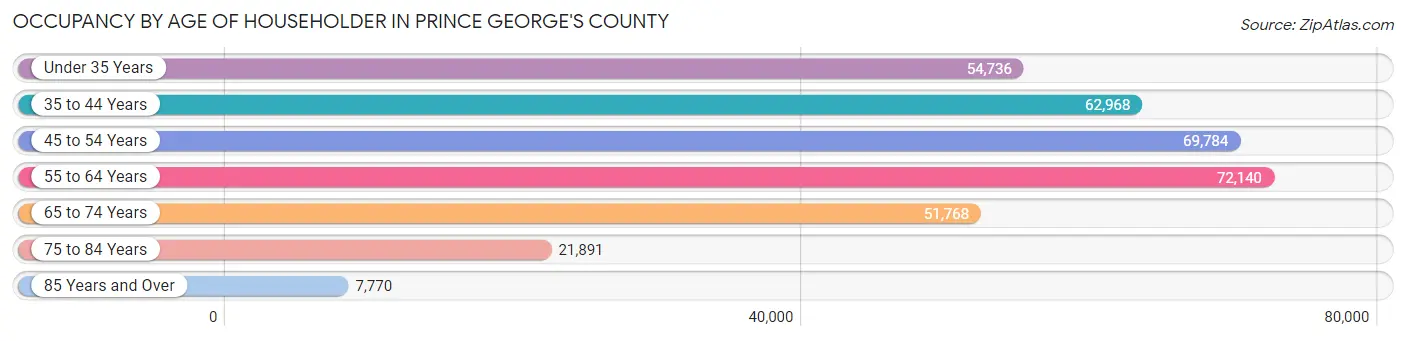
| Age Bracket | # Households | % Households |
| Under 35 Years | 54,736 | 16.1% |
| 35 to 44 Years | 62,968 | 18.5% |
| 45 to 54 Years | 69,784 | 20.5% |
| 55 to 64 Years | 72,140 | 21.1% |
| 65 to 74 Years | 51,768 | 15.2% |
| 75 to 84 Years | 21,891 | 6.4% |
| 85 Years and Over | 7,770 | 2.3% |
| Total | 341,057 | 100.0% |
Housing Finances in Prince George's County
Median Income by Occupancy in Prince George's County
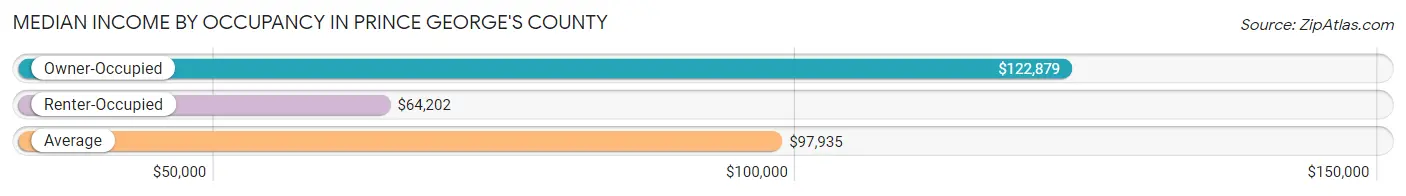
| Occupancy Type | # Households | Median Income |
| Owner-Occupied | 212,888 (62.4%) | $122,879 |
| Renter-Occupied | 128,169 (37.6%) | $64,202 |
| Average | 341,057 (100.0%) | $97,935 |
Occupancy by Householder Income Bracket in Prince George's County
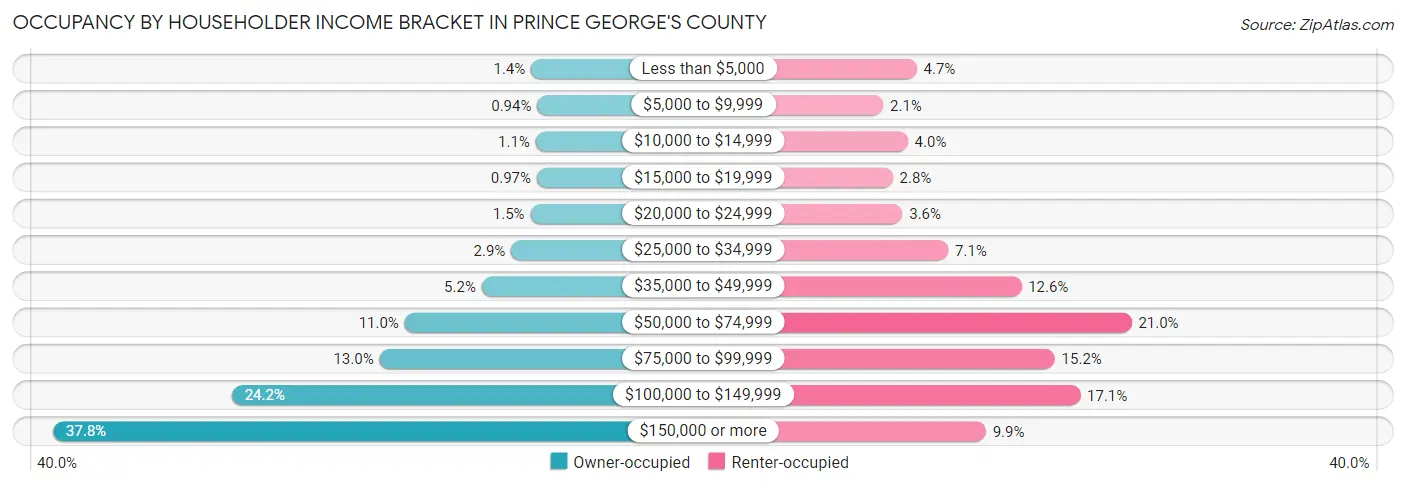
| Income Bracket | Owner-occupied | Renter-occupied |
| Less than $5,000 | 3,011 (1.4%) | 5,957 (4.6%) |
| $5,000 to $9,999 | 2,005 (0.9%) | 2,687 (2.1%) |
| $10,000 to $14,999 | 2,266 (1.1%) | 5,092 (4.0%) |
| $15,000 to $19,999 | 2,066 (1.0%) | 3,620 (2.8%) |
| $20,000 to $24,999 | 3,098 (1.5%) | 4,566 (3.6%) |
| $25,000 to $34,999 | 6,248 (2.9%) | 9,036 (7.0%) |
| $35,000 to $49,999 | 11,009 (5.2%) | 16,177 (12.6%) |
| $50,000 to $74,999 | 23,495 (11.0%) | 26,947 (21.0%) |
| $75,000 to $99,999 | 27,586 (13.0%) | 19,449 (15.2%) |
| $100,000 to $149,999 | 51,552 (24.2%) | 21,928 (17.1%) |
| $150,000 or more | 80,552 (37.8%) | 12,710 (9.9%) |
| Total | 212,888 (100.0%) | 128,169 (100.0%) |
Monthly Housing Cost Tiers in Prince George's County
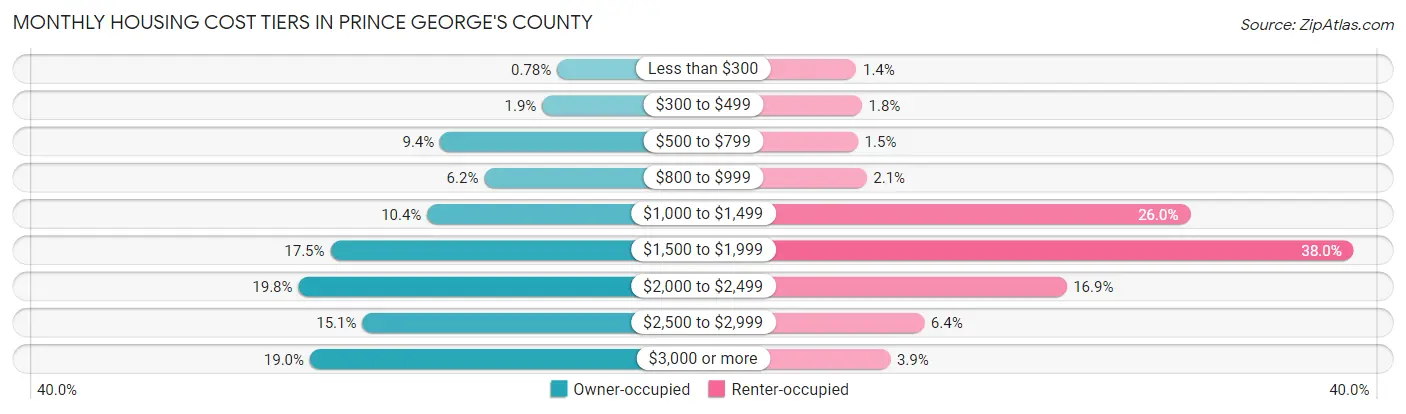
| Monthly Cost | Owner-occupied | Renter-occupied |
| Less than $300 | 1,658 (0.8%) | 1,750 (1.4%) |
| $300 to $499 | 4,007 (1.9%) | 2,280 (1.8%) |
| $500 to $799 | 20,013 (9.4%) | 1,912 (1.5%) |
| $800 to $999 | 13,083 (6.1%) | 2,732 (2.1%) |
| $1,000 to $1,499 | 22,029 (10.3%) | 33,302 (26.0%) |
| $1,500 to $1,999 | 37,220 (17.5%) | 48,720 (38.0%) |
| $2,000 to $2,499 | 42,241 (19.8%) | 21,593 (16.9%) |
| $2,500 to $2,999 | 32,208 (15.1%) | 8,163 (6.4%) |
| $3,000 or more | 40,429 (19.0%) | 4,957 (3.9%) |
| Total | 212,888 (100.0%) | 128,169 (100.0%) |
Physical Housing Characteristics in Prince George's County
Housing Structures in Prince George's County
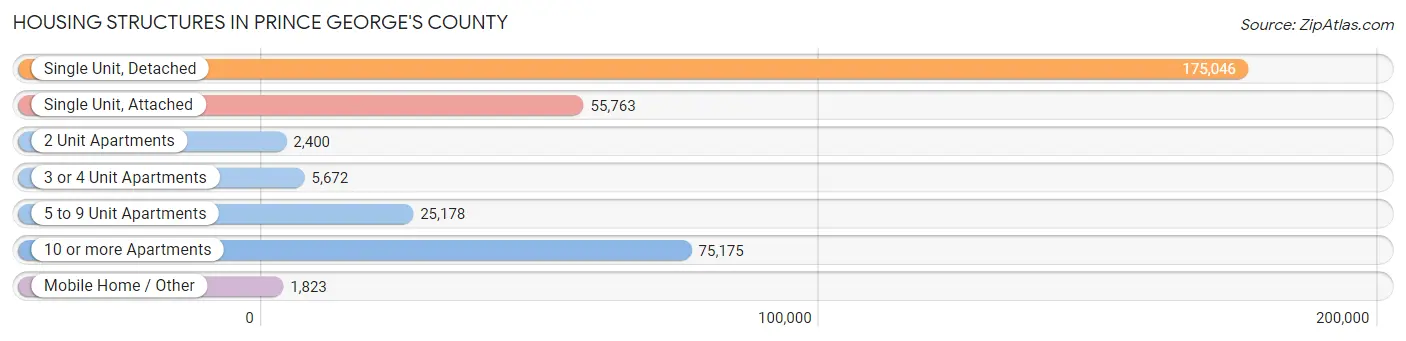
| Structure Type | # Housing Units | % Housing Units |
| Single Unit, Detached | 175,046 | 51.3% |
| Single Unit, Attached | 55,763 | 16.4% |
| 2 Unit Apartments | 2,400 | 0.7% |
| 3 or 4 Unit Apartments | 5,672 | 1.7% |
| 5 to 9 Unit Apartments | 25,178 | 7.4% |
| 10 or more Apartments | 75,175 | 22.0% |
| Mobile Home / Other | 1,823 | 0.5% |
| Total | 341,057 | 100.0% |
Housing Structures by Occupancy in Prince George's County
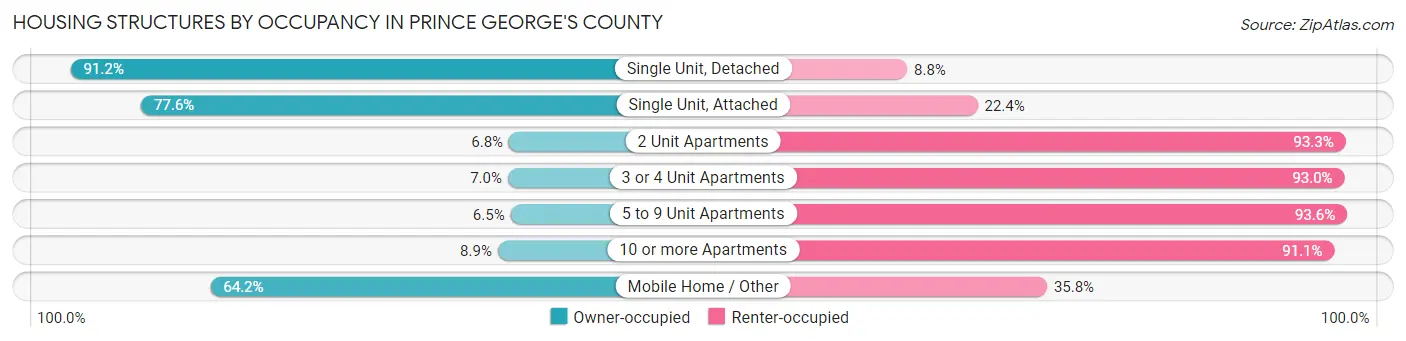
| Structure Type | Owner-occupied | Renter-occupied |
| Single Unit, Detached | 159,577 (91.2%) | 15,469 (8.8%) |
| Single Unit, Attached | 43,268 (77.6%) | 12,495 (22.4%) |
| 2 Unit Apartments | 162 (6.8%) | 2,238 (93.2%) |
| 3 or 4 Unit Apartments | 395 (7.0%) | 5,277 (93.0%) |
| 5 to 9 Unit Apartments | 1,625 (6.5%) | 23,553 (93.5%) |
| 10 or more Apartments | 6,690 (8.9%) | 68,485 (91.1%) |
| Mobile Home / Other | 1,171 (64.2%) | 652 (35.8%) |
| Total | 212,888 (62.4%) | 128,169 (37.6%) |
Housing Structures by Number of Rooms in Prince George's County
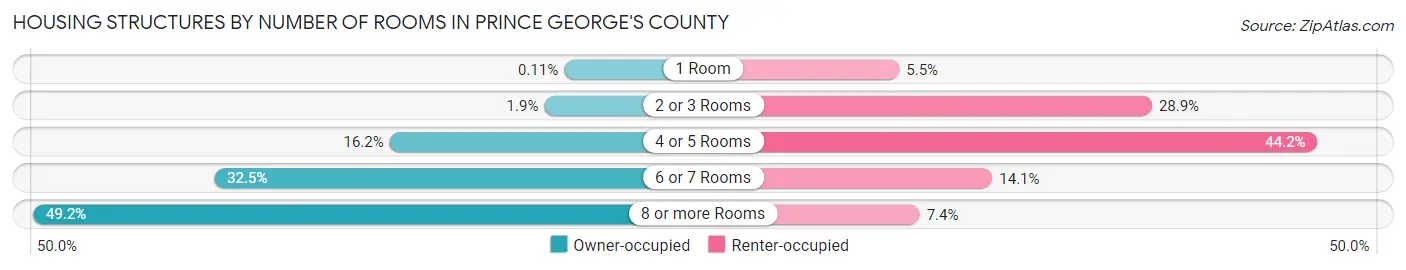
| Number of Rooms | Owner-occupied | Renter-occupied |
| 1 Room | 244 (0.1%) | 7,044 (5.5%) |
| 2 or 3 Rooms | 4,134 (1.9%) | 36,993 (28.9%) |
| 4 or 5 Rooms | 34,580 (16.2%) | 56,602 (44.2%) |
| 6 or 7 Rooms | 69,123 (32.5%) | 18,067 (14.1%) |
| 8 or more Rooms | 104,807 (49.2%) | 9,463 (7.4%) |
| Total | 212,888 (100.0%) | 128,169 (100.0%) |
Housing Structure by Heating Type in Prince George's County
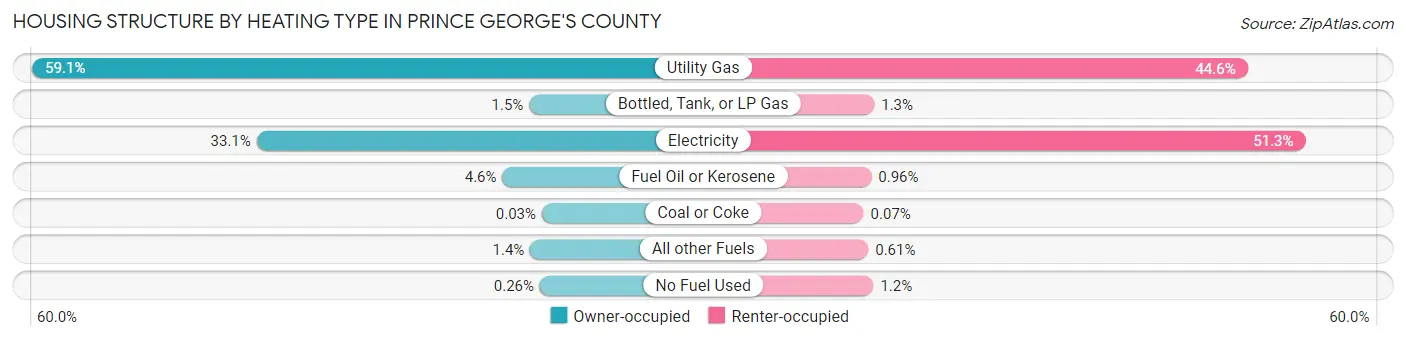
| Heating Type | Owner-occupied | Renter-occupied |
| Utility Gas | 125,875 (59.1%) | 57,121 (44.6%) |
| Bottled, Tank, or LP Gas | 3,191 (1.5%) | 1,672 (1.3%) |
| Electricity | 70,457 (33.1%) | 65,724 (51.3%) |
| Fuel Oil or Kerosene | 9,822 (4.6%) | 1,231 (1.0%) |
| Coal or Coke | 58 (0.0%) | 96 (0.1%) |
| All other Fuels | 2,929 (1.4%) | 780 (0.6%) |
| No Fuel Used | 556 (0.3%) | 1,545 (1.2%) |
| Total | 212,888 (100.0%) | 128,169 (100.0%) |
Household Vehicle Usage in Prince George's County
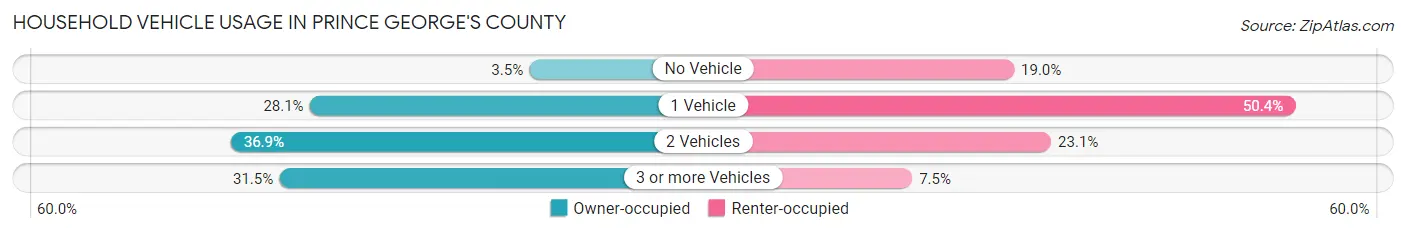
| Vehicles per Household | Owner-occupied | Renter-occupied |
| No Vehicle | 7,460 (3.5%) | 24,286 (19.0%) |
| 1 Vehicle | 59,810 (28.1%) | 64,613 (50.4%) |
| 2 Vehicles | 78,566 (36.9%) | 29,603 (23.1%) |
| 3 or more Vehicles | 67,052 (31.5%) | 9,667 (7.5%) |
| Total | 212,888 (100.0%) | 128,169 (100.0%) |
Real Estate & Mortgages in Prince George's County
Real Estate and Mortgage Overview in Prince George's County
| Characteristic | Without Mortgage | With Mortgage |
| Housing Units | 43,388 | 169,500 |
| Median Property Value | $358,000 | $386,200 |
| Median Household Income | $95,175 | $68,993 |
| Monthly Housing Costs | $776 | $40,205 |
| Real Estate Taxes | $4,343 | $4,391 |
Property Value by Mortgage Status in Prince George's County
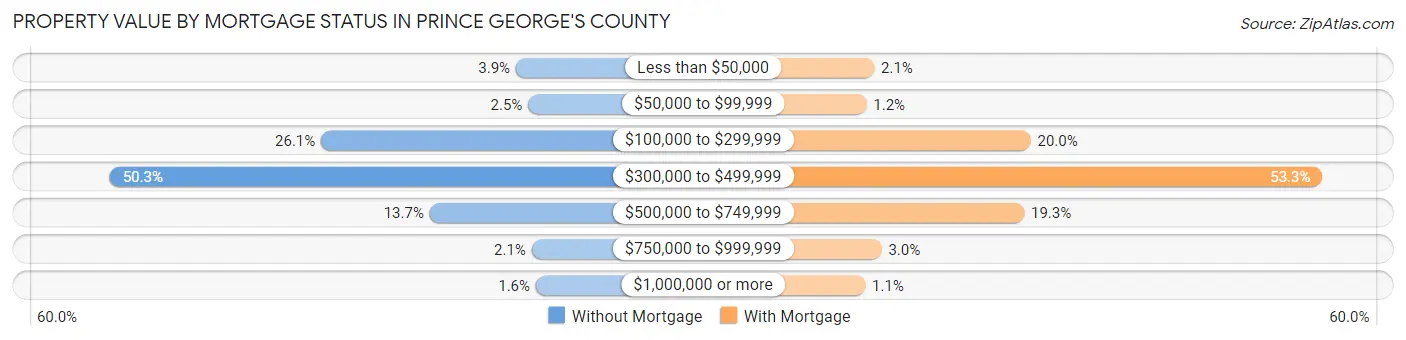
| Property Value | Without Mortgage | With Mortgage |
| Less than $50,000 | 1,669 (3.8%) | 3,592 (2.1%) |
| $50,000 to $99,999 | 1,062 (2.5%) | 2,083 (1.2%) |
| $100,000 to $299,999 | 11,328 (26.1%) | 33,906 (20.0%) |
| $300,000 to $499,999 | 21,812 (50.3%) | 90,408 (53.3%) |
| $500,000 to $749,999 | 5,946 (13.7%) | 32,649 (19.3%) |
| $750,000 to $999,999 | 889 (2.1%) | 5,011 (3.0%) |
| $1,000,000 or more | 682 (1.6%) | 1,851 (1.1%) |
| Total | 43,388 (100.0%) | 169,500 (100.0%) |
Household Income by Mortgage Status in Prince George's County
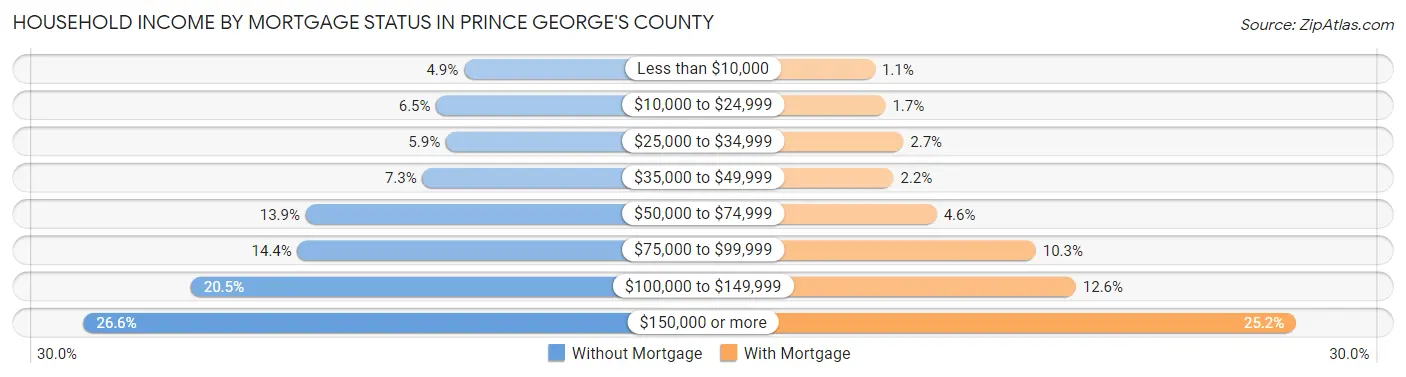
| Household Income | Without Mortgage | With Mortgage |
| Less than $10,000 | 2,120 (4.9%) | 1,878 (1.1%) |
| $10,000 to $24,999 | 2,807 (6.5%) | 2,896 (1.7%) |
| $25,000 to $34,999 | 2,569 (5.9%) | 4,623 (2.7%) |
| $35,000 to $49,999 | 3,149 (7.3%) | 3,679 (2.2%) |
| $50,000 to $74,999 | 6,042 (13.9%) | 7,860 (4.6%) |
| $75,000 to $99,999 | 6,249 (14.4%) | 17,453 (10.3%) |
| $100,000 to $149,999 | 8,893 (20.5%) | 21,337 (12.6%) |
| $150,000 or more | 11,559 (26.6%) | 42,659 (25.2%) |
| Total | 43,388 (100.0%) | 169,500 (100.0%) |
Property Value to Household Income Ratio in Prince George's County
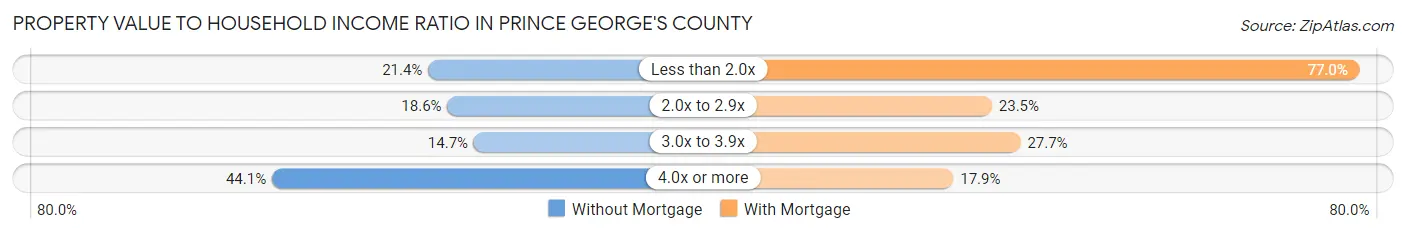
| Value-to-Income Ratio | Without Mortgage | With Mortgage |
| Less than 2.0x | 9,267 (21.4%) | 130,477 (77.0%) |
| 2.0x to 2.9x | 8,059 (18.6%) | 39,889 (23.5%) |
| 3.0x to 3.9x | 6,387 (14.7%) | 46,923 (27.7%) |
| 4.0x or more | 19,118 (44.1%) | 30,377 (17.9%) |
| Total | 43,388 (100.0%) | 169,500 (100.0%) |
Real Estate Taxes by Mortgage Status in Prince George's County
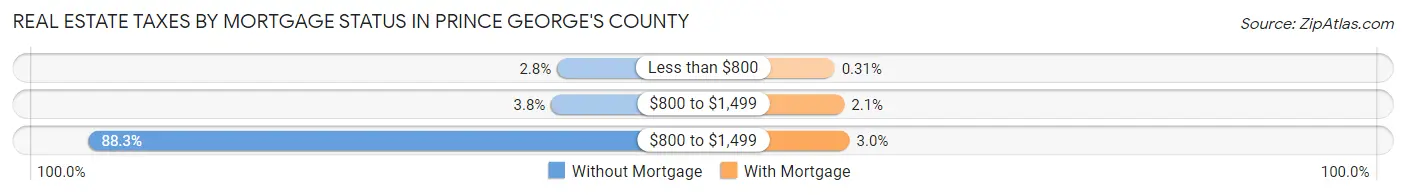
| Property Taxes | Without Mortgage | With Mortgage |
| Less than $800 | 1,194 (2.8%) | 522 (0.3%) |
| $800 to $1,499 | 1,658 (3.8%) | 3,487 (2.1%) |
| $800 to $1,499 | 38,317 (88.3%) | 5,116 (3.0%) |
| Total | 43,388 (100.0%) | 169,500 (100.0%) |
Health & Disability in Prince George's County
Health Insurance Coverage by Age in Prince George's County
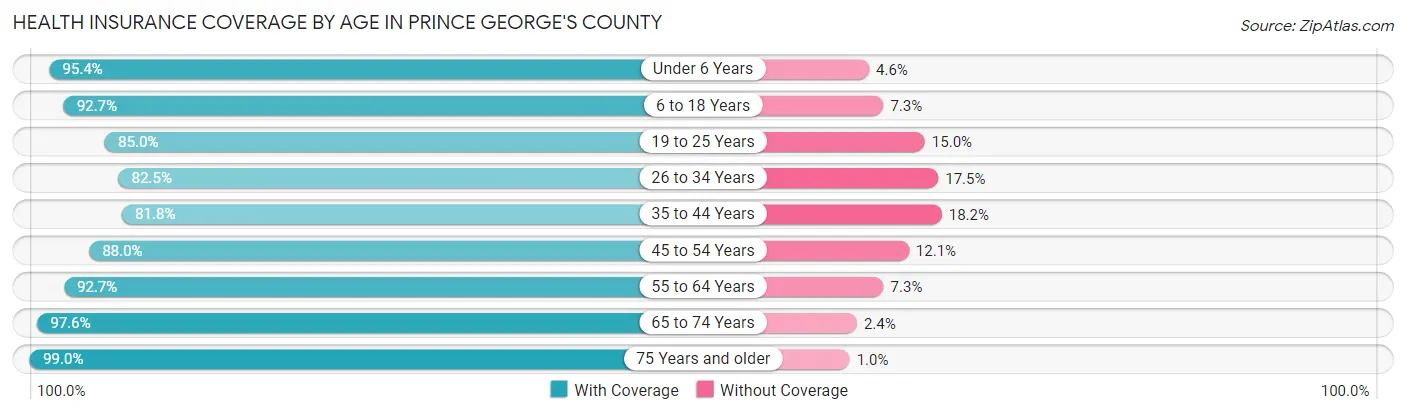
| Age Bracket | With Coverage | Without Coverage |
| Under 6 Years | 68,601 (95.4%) | 3,332 (4.6%) |
| 6 to 18 Years | 141,899 (92.7%) | 11,173 (7.3%) |
| 19 to 25 Years | 75,244 (85.0%) | 13,310 (15.0%) |
| 26 to 34 Years | 98,816 (82.5%) | 21,009 (17.5%) |
| 35 to 44 Years | 105,184 (81.8%) | 23,372 (18.2%) |
| 45 to 54 Years | 112,530 (87.9%) | 15,414 (12.0%) |
| 55 to 64 Years | 117,259 (92.7%) | 9,288 (7.3%) |
| 65 to 74 Years | 81,941 (97.6%) | 1,992 (2.4%) |
| 75 Years and older | 48,099 (99.0%) | 493 (1.0%) |
| Total | 849,573 (89.5%) | 99,383 (10.5%) |
Health Insurance Coverage by Citizenship Status in Prince George's County
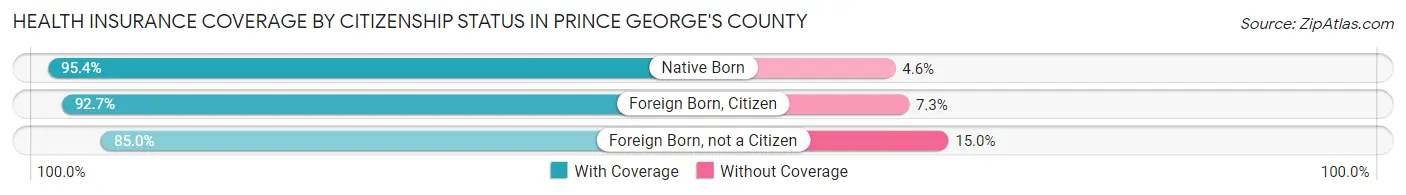
| Citizenship Status | With Coverage | Without Coverage |
| Native Born | 68,601 (95.4%) | 3,332 (4.6%) |
| Foreign Born, Citizen | 141,899 (92.7%) | 11,173 (7.3%) |
| Foreign Born, not a Citizen | 75,244 (85.0%) | 13,310 (15.0%) |
Health Insurance Coverage by Household Income in Prince George's County
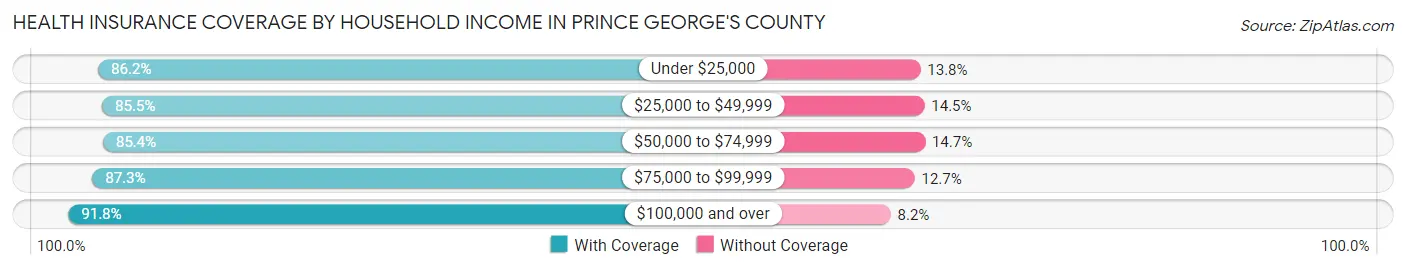
| Household Income | With Coverage | Without Coverage |
| Under $25,000 | 53,174 (86.2%) | 8,501 (13.8%) |
| $25,000 to $49,999 | 81,328 (85.5%) | 13,828 (14.5%) |
| $50,000 to $74,999 | 100,992 (85.4%) | 17,340 (14.6%) |
| $75,000 to $99,999 | 105,778 (87.3%) | 15,377 (12.7%) |
| $100,000 and over | 494,749 (91.8%) | 44,228 (8.2%) |
Public vs Private Health Insurance Coverage by Age in Prince George's County
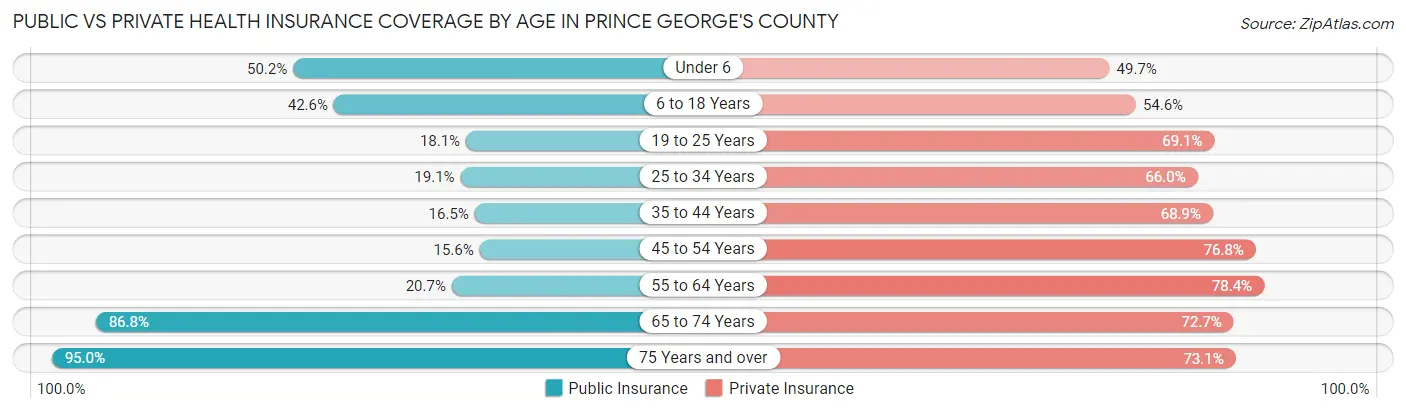
| Age Bracket | Public Insurance | Private Insurance |
| Under 6 | 36,098 (50.2%) | 35,764 (49.7%) |
| 6 to 18 Years | 65,219 (42.6%) | 83,575 (54.6%) |
| 19 to 25 Years | 16,010 (18.1%) | 61,224 (69.1%) |
| 25 to 34 Years | 22,897 (19.1%) | 79,098 (66.0%) |
| 35 to 44 Years | 21,162 (16.5%) | 88,509 (68.9%) |
| 45 to 54 Years | 19,893 (15.5%) | 98,286 (76.8%) |
| 55 to 64 Years | 26,220 (20.7%) | 99,147 (78.3%) |
| 65 to 74 Years | 72,854 (86.8%) | 61,044 (72.7%) |
| 75 Years and over | 46,143 (95.0%) | 35,508 (73.1%) |
| Total | 326,496 (34.4%) | 642,155 (67.7%) |
Disability Status by Sex by Age in Prince George's County
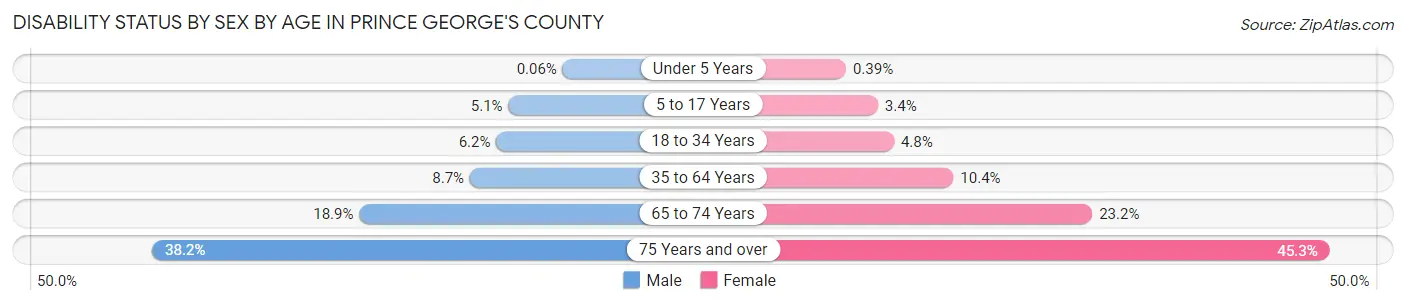
| Age Bracket | Male | Female |
| Under 5 Years | 18 (0.1%) | 115 (0.4%) |
| 5 to 17 Years | 3,918 (5.1%) | 2,476 (3.4%) |
| 18 to 34 Years | 6,905 (6.2%) | 5,382 (4.8%) |
| 35 to 64 Years | 16,023 (8.7%) | 20,548 (10.4%) |
| 65 to 74 Years | 6,884 (18.9%) | 11,062 (23.2%) |
| 75 Years and over | 7,125 (38.2%) | 13,542 (45.3%) |
Disability Class by Sex by Age in Prince George's County
Disability Class: Hearing Difficulty
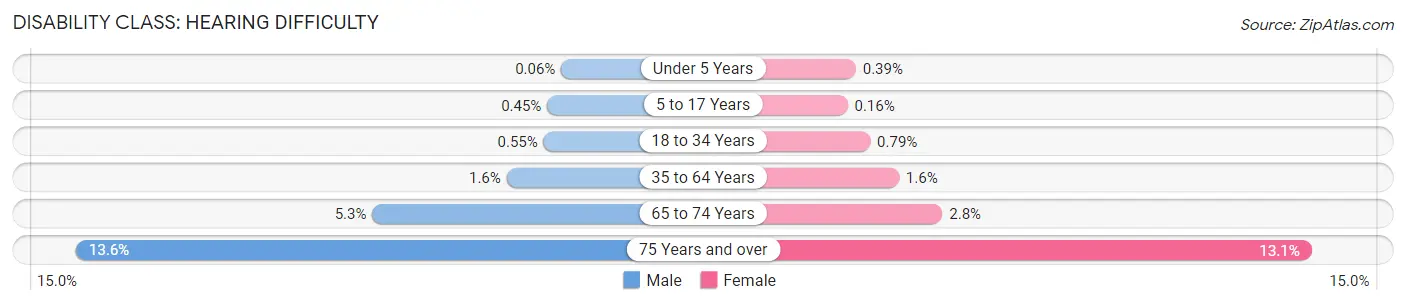
| Age Bracket | Male | Female |
| Under 5 Years | 18 (0.1%) | 115 (0.4%) |
| 5 to 17 Years | 347 (0.4%) | 122 (0.2%) |
| 18 to 34 Years | 609 (0.5%) | 876 (0.8%) |
| 35 to 64 Years | 2,910 (1.6%) | 3,146 (1.6%) |
| 65 to 74 Years | 1,935 (5.3%) | 1,334 (2.8%) |
| 75 Years and over | 2,534 (13.6%) | 3,913 (13.1%) |
Disability Class: Vision Difficulty
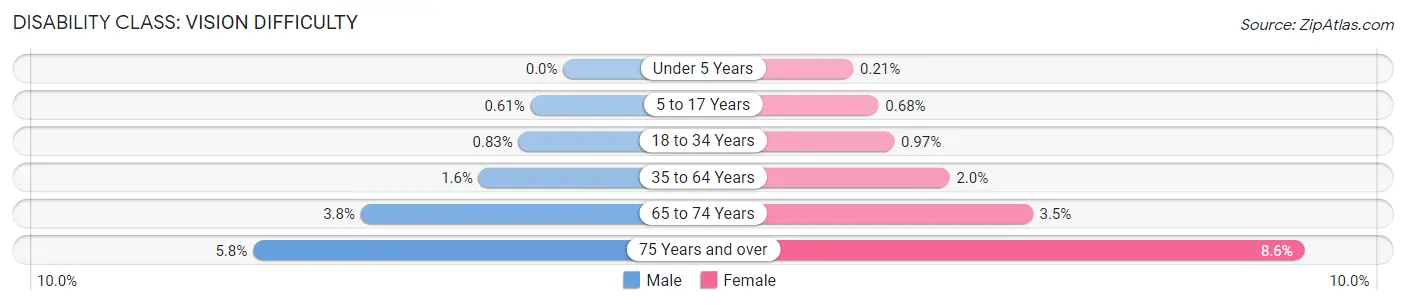
| Age Bracket | Male | Female |
| Under 5 Years | 0 (0.0%) | 61 (0.2%) |
| 5 to 17 Years | 467 (0.6%) | 500 (0.7%) |
| 18 to 34 Years | 925 (0.8%) | 1,080 (1.0%) |
| 35 to 64 Years | 2,900 (1.6%) | 3,964 (2.0%) |
| 65 to 74 Years | 1,368 (3.8%) | 1,687 (3.5%) |
| 75 Years and over | 1,076 (5.8%) | 2,570 (8.6%) |
Disability Class: Cognitive Difficulty
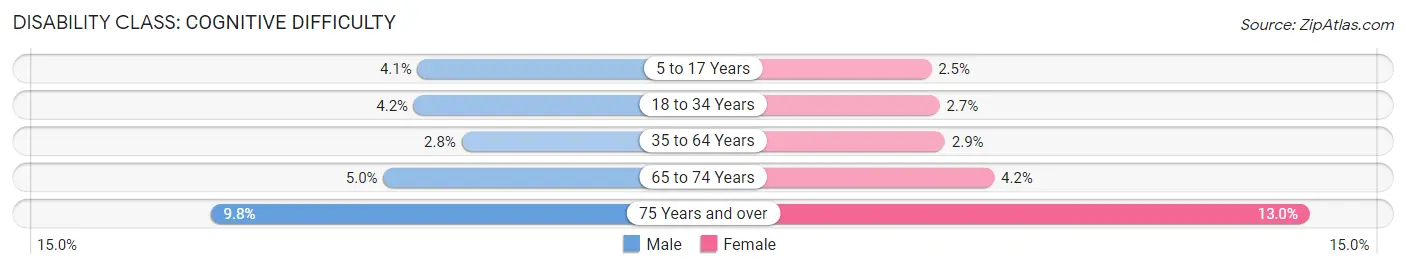
| Age Bracket | Male | Female |
| 5 to 17 Years | 3,120 (4.1%) | 1,843 (2.5%) |
| 18 to 34 Years | 4,618 (4.2%) | 3,029 (2.7%) |
| 35 to 64 Years | 5,228 (2.8%) | 5,691 (2.9%) |
| 65 to 74 Years | 1,821 (5.0%) | 2,019 (4.2%) |
| 75 Years and over | 1,833 (9.8%) | 3,897 (13.0%) |
Disability Class: Ambulatory Difficulty
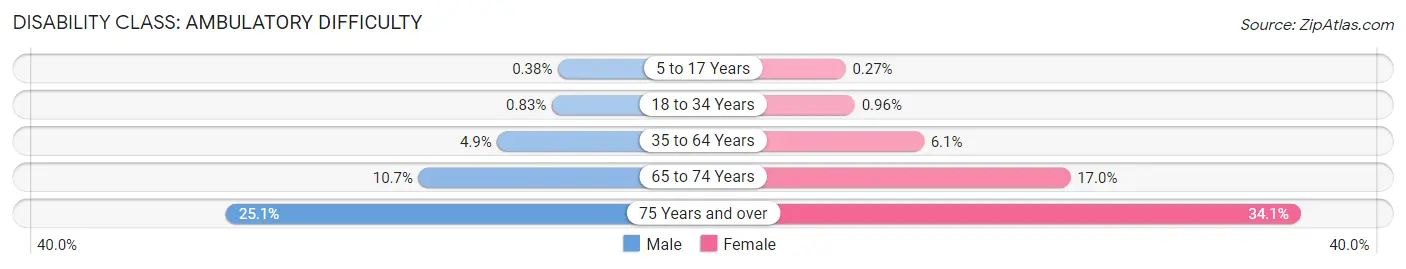
| Age Bracket | Male | Female |
| 5 to 17 Years | 288 (0.4%) | 201 (0.3%) |
| 18 to 34 Years | 925 (0.8%) | 1,073 (1.0%) |
| 35 to 64 Years | 9,008 (4.9%) | 12,050 (6.1%) |
| 65 to 74 Years | 3,901 (10.7%) | 8,073 (17.0%) |
| 75 Years and over | 4,677 (25.1%) | 10,191 (34.1%) |
Disability Class: Self-Care Difficulty
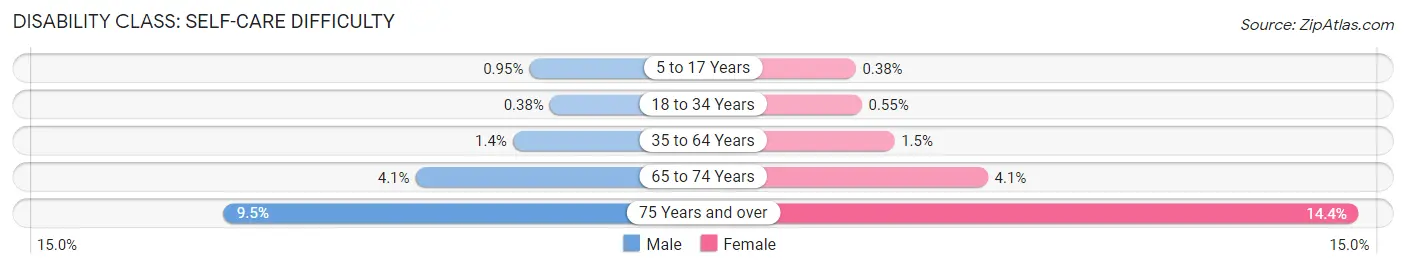
| Age Bracket | Male | Female |
| 5 to 17 Years | 727 (0.9%) | 281 (0.4%) |
| 18 to 34 Years | 418 (0.4%) | 617 (0.5%) |
| 35 to 64 Years | 2,614 (1.4%) | 2,901 (1.5%) |
| 65 to 74 Years | 1,497 (4.1%) | 1,930 (4.1%) |
| 75 Years and over | 1,765 (9.5%) | 4,305 (14.4%) |
Technology Access in Prince George's County
Computing Device Access in Prince George's County
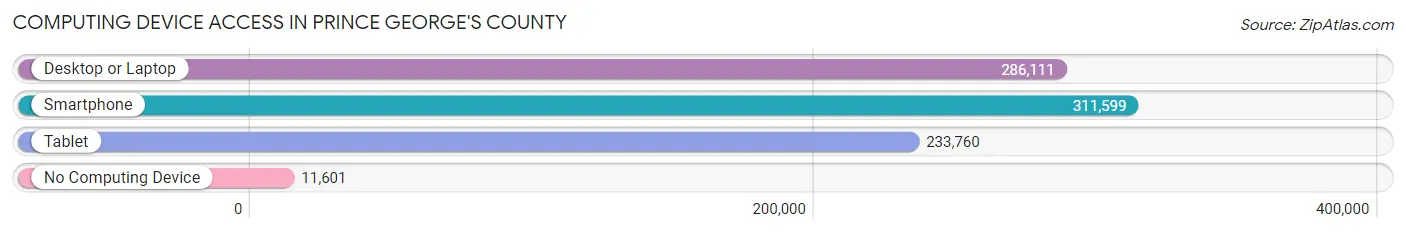
| Device Type | # Households | % Households |
| Desktop or Laptop | 286,111 | 83.9% |
| Smartphone | 311,599 | 91.4% |
| Tablet | 233,760 | 68.5% |
| No Computing Device | 11,601 | 3.4% |
| Total | 341,057 | 100.0% |
Internet Access in Prince George's County
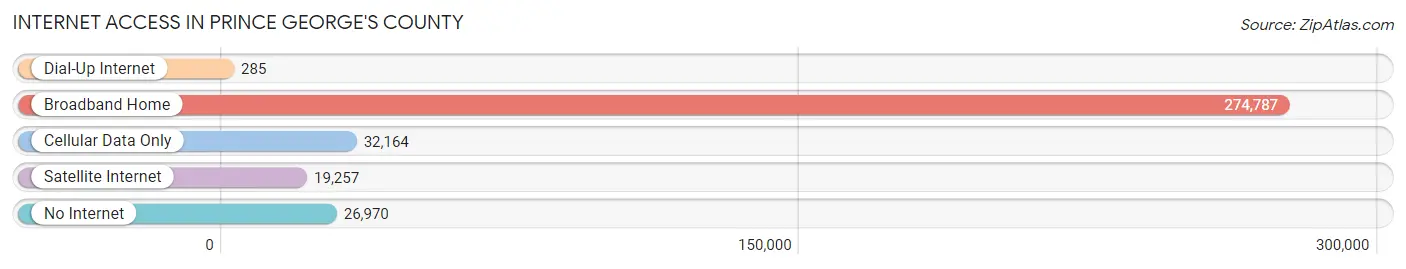
| Internet Type | # Households | % Households |
| Dial-Up Internet | 285 | 0.1% |
| Broadband Home | 274,787 | 80.6% |
| Cellular Data Only | 32,164 | 9.4% |
| Satellite Internet | 19,257 | 5.7% |
| No Internet | 26,970 | 7.9% |
| Total | 341,057 | 100.0% |
Prince George's County Summary
George's County, Maryland is located in the state of Maryland and is the second most populous county in the state. It is located in the Washington-Arlington-Alexandria metropolitan area and is part of the Baltimore-Washington metropolitan area. The county is named after Prince George of Denmark, the husband of Queen Anne of Great Britain.
Geography
Prince George's County is located in the central part of Maryland, just east of Washington, D.C. It is bordered by Montgomery County to the north, Anne Arundel County to the east, Charles County to the south, and the District of Columbia to the west. The county covers an area of 491 square miles and has a population of 863,420 as of the 2020 census.
The county is divided into five regions: the Upper Marlboro region, the Bowie region, the Largo region, the Clinton region, and the Suitland region. The county is home to several major cities and towns, including Bowie, Upper Marlboro, Largo, Clinton, and Suitland.
The county is home to several major rivers, including the Potomac River, the Anacostia River, and the Patuxent River. The county is also home to several major parks, including Patuxent River Park, Greenbelt Park, and Prince George's County Park.
Economy
Prince George's County is home to a diverse economy, with a variety of industries and businesses. The county is home to several major employers, including the University of Maryland, the National Institutes of Health, and the U.S. Department of Defense. The county is also home to several major shopping centers, including the Bowie Town Center, the Largo Town Center, and the Prince George's Plaza.
The county is home to several major industries, including government, healthcare, education, retail, and technology. The county is also home to several major companies, including Lockheed Martin, Northrop Grumman, and Booz Allen Hamilton.
Demographics
As of the 2020 census, Prince George's County had a population of 863,420. The population is racially and ethnically diverse, with a majority of African Americans (63.3%), followed by Whites (25.2%), Hispanics (7.2%), and Asians (3.3%).
The median household income in the county is $80,890, and the median home value is $310,000. The county has a poverty rate of 11.2%, and the unemployment rate is 4.2%.
The county is home to several major universities, including the University of Maryland, Bowie State University, and Prince George's Community College. The county is also home to several major hospitals, including the University of Maryland Medical Center, MedStar Health, and the Prince George's Hospital Center.
Conclusion
Prince George's County, Maryland is a diverse and vibrant county located in the central part of the state. The county is home to a diverse economy, with a variety of industries and businesses. The county is also home to a diverse population, with a majority of African Americans, followed by Whites, Hispanics, and Asians. The county is home to several major employers, universities, and hospitals, and has a median household income of $80,890 and a median home value of $310,000.
Common Questions
What is the Total Population of Prince George's County?
Total Population of Prince George's County is 957,189.
What is the Total Male Population of Prince George's County?
Total Male Population of Prince George's County is 463,483.
What is the Total Female Population of Prince George's County?
Total Female Population of Prince George's County is 493,706.
What is the Ratio of Males per 100 Females in Prince George's County?
There are 93.88 Males per 100 Females in Prince George's County.
What is the Ratio of Females per 100 Males in Prince George's County?
There are 106.52 Females per 100 Males in Prince George's County.
What is the Median Population Age in Prince George's County?
Median Population Age in Prince George's County is 38.2 Years.
What is the Average Family Size in Prince George's County
Average Family Size in Prince George's County is 3.4 People.
What is the Average Household Size in Prince George's County
Average Household Size in Prince George's County is 2.8 People.
What is Per Capita Income in Prince George's County?
Per Capita income in Prince George's County is $43,833.
What is the Median Family Income in Prince George's County?
Median Family Income in Prince George's County is $115,235.
What is the Median Household income in Prince George's County?
Median Household Income in Prince George's County is $97,935.
What is Income or Wage Gap in Prince George's County?
Income or Wage Gap in Prince George's County is 3.4%.
Women in Prince George's County earn 96.6 cents for every dollar earned by a man.
What is Family Income Deficit in Prince George's County?
Family Income Deficit in Prince George's County is $11,184.
Families that are below poverty line in Prince George's County earn $11,184 less on average than the poverty threshold level.
What is Inequality or Gini Index in Prince George's County?
Inequality or Gini Index in Prince George's County is 0.41.
How Large is the Labor Force in Prince George's County?
There are 539,898 People in the Labor Forcein in Prince George's County.
What is the Percentage of People in the Labor Force in Prince George's County?
70.3% of People are in the Labor Force in Prince George's County.
What is the Unemployment Rate in Prince George's County?
Unemployment Rate in Prince George's County is 6.7%.