Montgomery County, MD
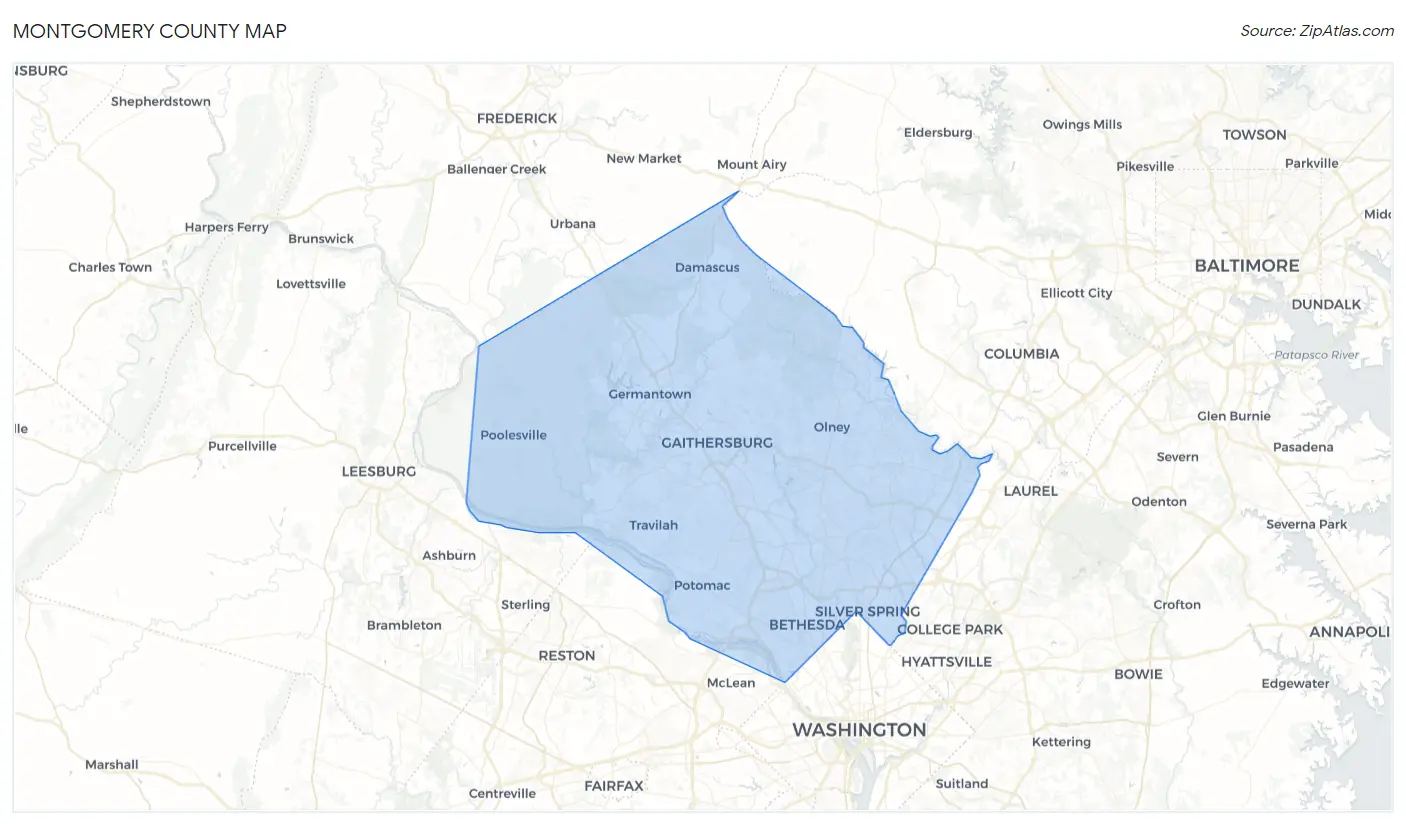
Montgomery County Map
Montgomery County Overview
1,056,910
TOTAL POPULATION
515,682
MALE POPULATION
541,228
FEMALE POPULATION
95.28
MALES / 100 FEMALES
104.95
FEMALES / 100 MALES
39.8
MEDIAN AGE
3.3
AVG FAMILY SIZE
2.7
AVG HOUSEHOLD SIZE
$64,126
PER CAPITA INCOME
$152,137
AVG FAMILY INCOME
$125,583
AVG HOUSEHOLD INCOME
24.0%
WAGE / INCOME GAP [ % ]
76.0¢/ $1
WAGE / INCOME GAP [ $ ]
$11,281
FAMILY INCOME DEFICIT
0.47
INEQUALITY / GINI INDEX
593,035
LABOR FORCE [ PEOPLE ]
70.3%
PERCENT IN LABOR FORCE
4.8%
UNEMPLOYMENT RATE
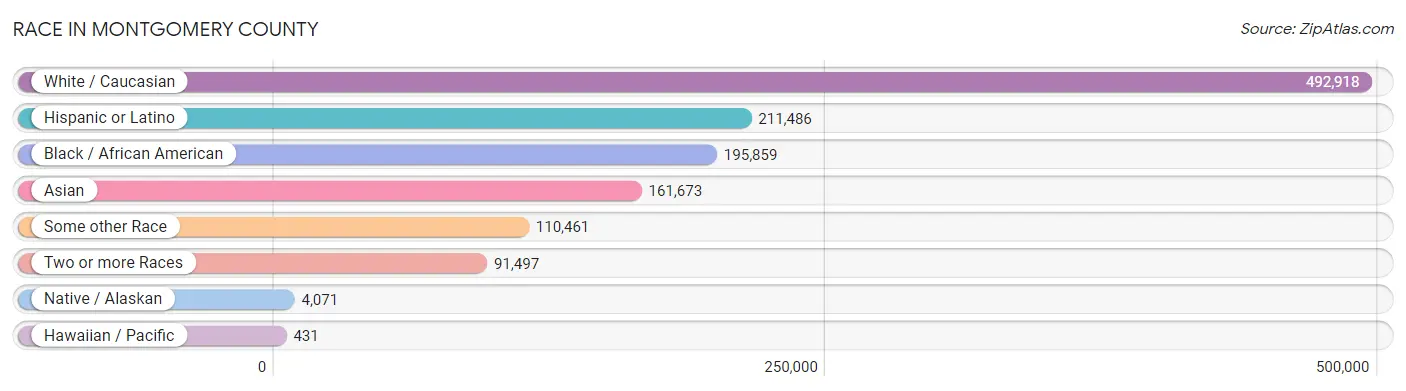
Race in Montgomery County
The most populous races in Montgomery County are White / Caucasian (492,918 | 46.6%), Hispanic or Latino (211,486 | 20.0%), and Black / African American (195,859 | 18.5%).
| Race | # Population | % Population |
| Asian | 161,673 | 15.3% |
| Black / African American | 195,859 | 18.5% |
| Hawaiian / Pacific | 431 | 0.0% |
| Hispanic or Latino | 211,486 | 20.0% |
| Native / Alaskan | 4,071 | 0.4% |
| White / Caucasian | 492,918 | 46.6% |
| Two or more Races | 91,497 | 8.7% |
| Some other Race | 110,461 | 10.4% |
| Total | 1,056,910 | 100.0% |
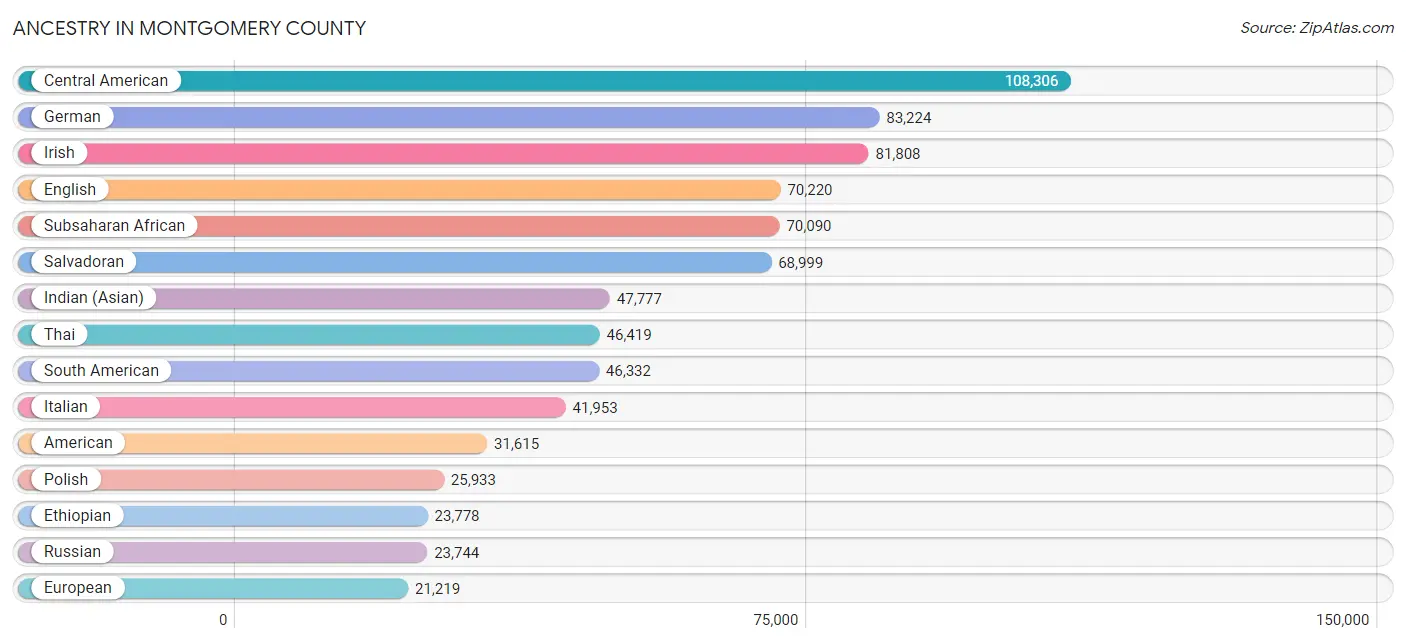
Ancestry in Montgomery County
The most populous ancestries reported in Montgomery County are Central American (108,306 | 10.2%), German (83,224 | 7.9%), Irish (81,808 | 7.7%), English (70,220 | 6.6%), and Subsaharan African (70,090 | 6.6%), together accounting for 39.1% of all Montgomery County residents.
| Ancestry | # Population | % Population |
| Afghan | 1,287 | 0.1% |
| African | 19,726 | 1.9% |
| Alaska Native | 41 | 0.0% |
| Albanian | 842 | 0.1% |
| Alsatian | 72 | 0.0% |
| American | 31,615 | 3.0% |
| Apache | 147 | 0.0% |
| Arab | 12,647 | 1.2% |
| Argentinean | 3,711 | 0.4% |
| Armenian | 1,858 | 0.2% |
| Assyrian / Chaldean / Syriac | 101 | 0.0% |
| Australian | 480 | 0.1% |
| Austrian | 3,668 | 0.4% |
| Bahamian | 85 | 0.0% |
| Bangladeshi | 121 | 0.0% |
| Barbadian | 328 | 0.0% |
| Basque | 95 | 0.0% |
| Belgian | 1,279 | 0.1% |
| Belizean | 184 | 0.0% |
| Bermudan | 78 | 0.0% |
| Bhutanese | 6,509 | 0.6% |
| Blackfeet | 448 | 0.0% |
| Bolivian | 6,958 | 0.7% |
| Brazilian | 6,630 | 0.6% |
| British | 7,658 | 0.7% |
| British West Indian | 653 | 0.1% |
| Bulgarian | 1,182 | 0.1% |
| Burmese | 19,827 | 1.9% |
| Cajun | 173 | 0.0% |
| Cambodian | 482 | 0.1% |
| Canadian | 1,494 | 0.1% |
| Cape Verdean | 117 | 0.0% |
| Carpatho Rusyn | 30 | 0.0% |
| Celtic | 214 | 0.0% |
| Central American | 108,306 | 10.2% |
| Central American Indian | 2,304 | 0.2% |
| Cherokee | 1,551 | 0.2% |
| Chickasaw | 16 | 0.0% |
| Chilean | 2,340 | 0.2% |
| Chinese | 26 | 0.0% |
| Chippewa | 71 | 0.0% |
| Choctaw | 84 | 0.0% |
| Colombian | 9,550 | 0.9% |
| Costa Rican | 1,041 | 0.1% |
| Cree | 41 | 0.0% |
| Creek | 133 | 0.0% |
| Croatian | 1,054 | 0.1% |
| Crow | 11 | 0.0% |
| Cuban | 3,123 | 0.3% |
| Cypriot | 155 | 0.0% |
| Czech | 2,885 | 0.3% |
| Czechoslovakian | 621 | 0.1% |
| Danish | 2,247 | 0.2% |
| Delaware | 53 | 0.0% |
| Dominican | 7,209 | 0.7% |
| Dutch | 6,585 | 0.6% |
| Eastern European | 14,242 | 1.3% |
| Ecuadorian | 4,287 | 0.4% |
| Egyptian | 1,543 | 0.2% |
| English | 70,220 | 6.6% |
| Estonian | 196 | 0.0% |
| Ethiopian | 23,778 | 2.2% |
| European | 21,219 | 2.0% |
| Filipino | 3,389 | 0.3% |
| Finnish | 1,569 | 0.2% |
| French | 15,457 | 1.5% |
| French American Indian | 62 | 0.0% |
| French Canadian | 2,972 | 0.3% |
| German | 83,224 | 7.9% |
| German Russian | 24 | 0.0% |
| Ghanaian | 4,421 | 0.4% |
| Greek | 6,733 | 0.6% |
| Guamanian / Chamorro | 444 | 0.0% |
| Guatemalan | 18,222 | 1.7% |
| Guyanese | 1,708 | 0.2% |
| Haitian | 4,018 | 0.4% |
| Honduran | 13,396 | 1.3% |
| Hopi | 19 | 0.0% |
| Hungarian | 5,174 | 0.5% |
| Icelander | 166 | 0.0% |
| Indian (Asian) | 47,777 | 4.5% |
| Indonesian | 1,565 | 0.2% |
| Inupiat | 13 | 0.0% |
| Iranian | 9,263 | 0.9% |
| Iraqi | 608 | 0.1% |
| Irish | 81,808 | 7.7% |
| Iroquois | 172 | 0.0% |
| Israeli | 1,103 | 0.1% |
| Italian | 41,953 | 4.0% |
| Jamaican | 9,606 | 0.9% |
| Japanese | 1,308 | 0.1% |
| Jordanian | 339 | 0.0% |
| Kenyan | 1,343 | 0.1% |
| Kiowa | 8 | 0.0% |
| Korean | 17,798 | 1.7% |
| Laotian | 2,006 | 0.2% |
| Latvian | 907 | 0.1% |
| Lebanese | 3,178 | 0.3% |
| Liberian | 875 | 0.1% |
| Lithuanian | 3,326 | 0.3% |
| Lumbee | 131 | 0.0% |
| Luxembourger | 131 | 0.0% |
| Macedonian | 125 | 0.0% |
| Malaysian | 294 | 0.0% |
| Maltese | 54 | 0.0% |
| Mexican | 16,538 | 1.6% |
| Mexican American Indian | 901 | 0.1% |
| Mongolian | 321 | 0.0% |
| Moroccan | 1,324 | 0.1% |
| Native Hawaiian | 631 | 0.1% |
| Navajo | 150 | 0.0% |
| Nepalese | 56 | 0.0% |
| New Zealander | 85 | 0.0% |
| Nicaraguan | 5,236 | 0.5% |
| Nigerian | 5,688 | 0.5% |
| Northern European | 2,633 | 0.3% |
| Norwegian | 5,484 | 0.5% |
| Okinawan | 50 | 0.0% |
| Osage | 128 | 0.0% |
| Paiute | 2 | 0.0% |
| Pakistani | 2,825 | 0.3% |
| Palestinian | 961 | 0.1% |
| Panamanian | 1,266 | 0.1% |
| Paraguayan | 683 | 0.1% |
| Pennsylvania German | 89 | 0.0% |
| Peruvian | 14,786 | 1.4% |
| Polish | 25,933 | 2.5% |
| Portuguese | 3,592 | 0.3% |
| Pueblo | 80 | 0.0% |
| Puerto Rican | 11,759 | 1.1% |
| Puget Sound Salish | 7 | 0.0% |
| Romanian | 2,691 | 0.3% |
| Russian | 23,744 | 2.2% |
| Salvadoran | 68,999 | 6.5% |
| Samoan | 146 | 0.0% |
| Scandinavian | 1,942 | 0.2% |
| Scotch-Irish | 6,858 | 0.6% |
| Scottish | 13,639 | 1.3% |
| Seminole | 8 | 0.0% |
| Senegalese | 671 | 0.1% |
| Serbian | 1,232 | 0.1% |
| Sierra Leonean | 1,040 | 0.1% |
| Sioux | 35 | 0.0% |
| Slavic | 427 | 0.0% |
| Slovak | 2,318 | 0.2% |
| Slovene | 766 | 0.1% |
| Somali | 214 | 0.0% |
| South African | 281 | 0.0% |
| South American | 46,332 | 4.4% |
| South American Indian | 1,010 | 0.1% |
| Soviet Union | 67 | 0.0% |
| Spaniard | 3,045 | 0.3% |
| Spanish | 2,001 | 0.2% |
| Spanish American Indian | 40 | 0.0% |
| Sri Lankan | 15,576 | 1.5% |
| Subsaharan African | 70,090 | 6.6% |
| Sudanese | 688 | 0.1% |
| Swedish | 6,921 | 0.6% |
| Swiss | 2,074 | 0.2% |
| Syrian | 860 | 0.1% |
| Taiwanese | 56 | 0.0% |
| Thai | 46,419 | 4.4% |
| Tlingit-Haida | 2 | 0.0% |
| Tongan | 164 | 0.0% |
| Trinidadian and Tobagonian | 2,003 | 0.2% |
| Turkish | 2,015 | 0.2% |
| U.S. Virgin Islander | 63 | 0.0% |
| Ugandan | 386 | 0.0% |
| Ukrainian | 5,999 | 0.6% |
| Uruguayan | 872 | 0.1% |
| Ute | 23 | 0.0% |
| Venezuelan | 2,689 | 0.3% |
| Vietnamese | 2,220 | 0.2% |
| Welsh | 4,600 | 0.4% |
| West Indian | 2,808 | 0.3% |
| Yugoslavian | 353 | 0.0% |
| Yup'ik | 14 | 0.0% |
| Zimbabwean | 323 | 0.0% | View All 178 Rows |
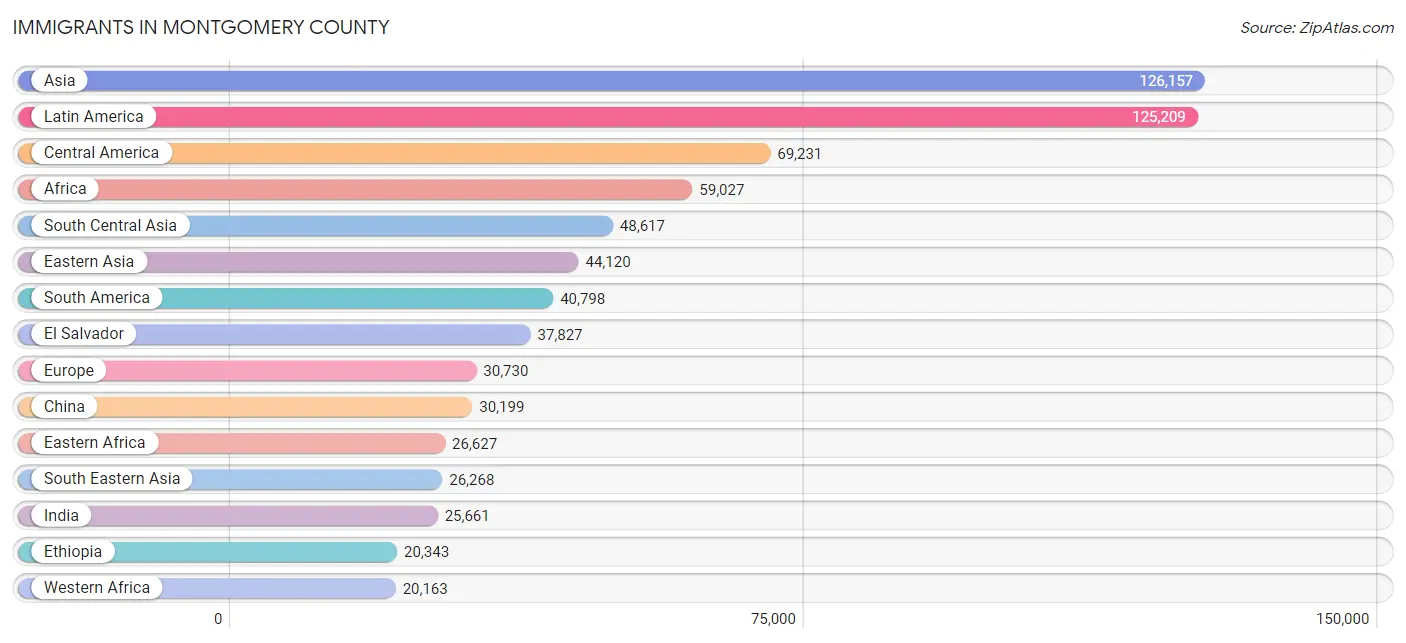
Immigrants in Montgomery County
The most numerous immigrant groups reported in Montgomery County came from Asia (126,157 | 11.9%), Latin America (125,209 | 11.8%), Central America (69,231 | 6.6%), Africa (59,027 | 5.6%), and South Central Asia (48,617 | 4.6%), together accounting for 40.5% of all Montgomery County residents.
| Immigration Origin | # Population | % Population |
| Afghanistan | 916 | 0.1% |
| Africa | 59,027 | 5.6% |
| Albania | 274 | 0.0% |
| Argentina | 1,990 | 0.2% |
| Armenia | 306 | 0.0% |
| Asia | 126,157 | 11.9% |
| Australia | 719 | 0.1% |
| Austria | 135 | 0.0% |
| Bahamas | 160 | 0.0% |
| Bangladesh | 3,261 | 0.3% |
| Barbados | 170 | 0.0% |
| Belarus | 441 | 0.0% |
| Belgium | 426 | 0.0% |
| Belize | 135 | 0.0% |
| Bolivia | 4,754 | 0.4% |
| Bosnia and Herzegovina | 226 | 0.0% |
| Brazil | 7,111 | 0.7% |
| Bulgaria | 764 | 0.1% |
| Cabo Verde | 38 | 0.0% |
| Cambodia | 751 | 0.1% |
| Cameroon | 6,259 | 0.6% |
| Canada | 3,043 | 0.3% |
| Caribbean | 15,180 | 1.4% |
| Central America | 69,231 | 6.6% |
| Chile | 1,495 | 0.1% |
| China | 30,199 | 2.9% |
| Colombia | 6,303 | 0.6% |
| Congo | 176 | 0.0% |
| Costa Rica | 1,230 | 0.1% |
| Croatia | 105 | 0.0% |
| Cuba | 1,015 | 0.1% |
| Czechoslovakia | 577 | 0.1% |
| Denmark | 128 | 0.0% |
| Dominica | 78 | 0.0% |
| Dominican Republic | 3,705 | 0.4% |
| Eastern Africa | 26,627 | 2.5% |
| Eastern Asia | 44,120 | 4.2% |
| Eastern Europe | 14,146 | 1.3% |
| Ecuador | 3,103 | 0.3% |
| Egypt | 1,085 | 0.1% |
| El Salvador | 37,827 | 3.6% |
| England | 1,374 | 0.1% |
| Eritrea | 1,388 | 0.1% |
| Ethiopia | 20,343 | 1.9% |
| Europe | 30,730 | 2.9% |
| Fiji | 110 | 0.0% |
| France | 2,620 | 0.3% |
| Germany | 3,079 | 0.3% |
| Ghana | 5,325 | 0.5% |
| Greece | 826 | 0.1% |
| Grenada | 110 | 0.0% |
| Guatemala | 12,432 | 1.2% |
| Guyana | 1,938 | 0.2% |
| Haiti | 2,501 | 0.2% |
| Honduras | 8,297 | 0.8% |
| Hong Kong | 2,045 | 0.2% |
| Hungary | 381 | 0.0% |
| India | 25,661 | 2.4% |
| Indonesia | 1,608 | 0.2% |
| Iran | 7,379 | 0.7% |
| Iraq | 586 | 0.1% |
| Ireland | 424 | 0.0% |
| Israel | 1,364 | 0.1% |
| Italy | 1,556 | 0.2% |
| Jamaica | 4,970 | 0.5% |
| Japan | 2,711 | 0.3% |
| Jordan | 436 | 0.0% |
| Kazakhstan | 269 | 0.0% |
| Kenya | 1,937 | 0.2% |
| Korea | 10,993 | 1.0% |
| Kuwait | 370 | 0.0% |
| Laos | 316 | 0.0% |
| Latin America | 125,209 | 11.8% |
| Latvia | 305 | 0.0% |
| Lebanon | 882 | 0.1% |
| Liberia | 1,589 | 0.2% |
| Lithuania | 170 | 0.0% |
| Malaysia | 626 | 0.1% |
| Mexico | 5,590 | 0.5% |
| Middle Africa | 7,594 | 0.7% |
| Moldova | 445 | 0.0% |
| Morocco | 686 | 0.1% |
| Nepal | 2,953 | 0.3% |
| Netherlands | 678 | 0.1% |
| Nicaragua | 2,860 | 0.3% |
| Nigeria | 3,105 | 0.3% |
| North Macedonia | 95 | 0.0% |
| Northern Africa | 2,685 | 0.3% |
| Northern Europe | 4,846 | 0.5% |
| Norway | 82 | 0.0% |
| Oceania | 956 | 0.1% |
| Pakistan | 5,173 | 0.5% |
| Panama | 742 | 0.1% |
| Peru | 10,831 | 1.0% |
| Philippines | 9,531 | 0.9% |
| Poland | 774 | 0.1% |
| Portugal | 849 | 0.1% |
| Romania | 919 | 0.1% |
| Russia | 4,421 | 0.4% |
| Saudi Arabia | 157 | 0.0% |
| Scotland | 116 | 0.0% |
| Senegal | 1,089 | 0.1% |
| Serbia | 501 | 0.1% |
| Sierra Leone | 2,282 | 0.2% |
| Singapore | 294 | 0.0% |
| Somalia | 219 | 0.0% |
| South Africa | 872 | 0.1% |
| South America | 40,798 | 3.9% |
| South Central Asia | 48,617 | 4.6% |
| South Eastern Asia | 26,268 | 2.5% |
| Southern Europe | 4,389 | 0.4% |
| Spain | 1,113 | 0.1% |
| Sri Lanka | 2,312 | 0.2% |
| St. Vincent and the Grenadines | 59 | 0.0% |
| Sudan | 477 | 0.1% |
| Sweden | 200 | 0.0% |
| Switzerland | 363 | 0.0% |
| Syria | 516 | 0.1% |
| Taiwan | 5,266 | 0.5% |
| Thailand | 1,761 | 0.2% |
| Trinidad and Tobago | 1,903 | 0.2% |
| Turkey | 924 | 0.1% |
| Uganda | 711 | 0.1% |
| Ukraine | 2,257 | 0.2% |
| Uruguay | 381 | 0.0% |
| Uzbekistan | 413 | 0.0% |
| Venezuela | 2,356 | 0.2% |
| Vietnam | 10,004 | 0.9% |
| West Indies | 252 | 0.0% |
| Western Africa | 20,163 | 1.9% |
| Western Asia | 6,859 | 0.6% |
| Western Europe | 7,303 | 0.7% |
| Yemen | 108 | 0.0% |
| Zaire | 802 | 0.1% |
| Zimbabwe | 502 | 0.1% | View All 135 Rows |
Sex and Age in Montgomery County
Sex and Age in Montgomery County
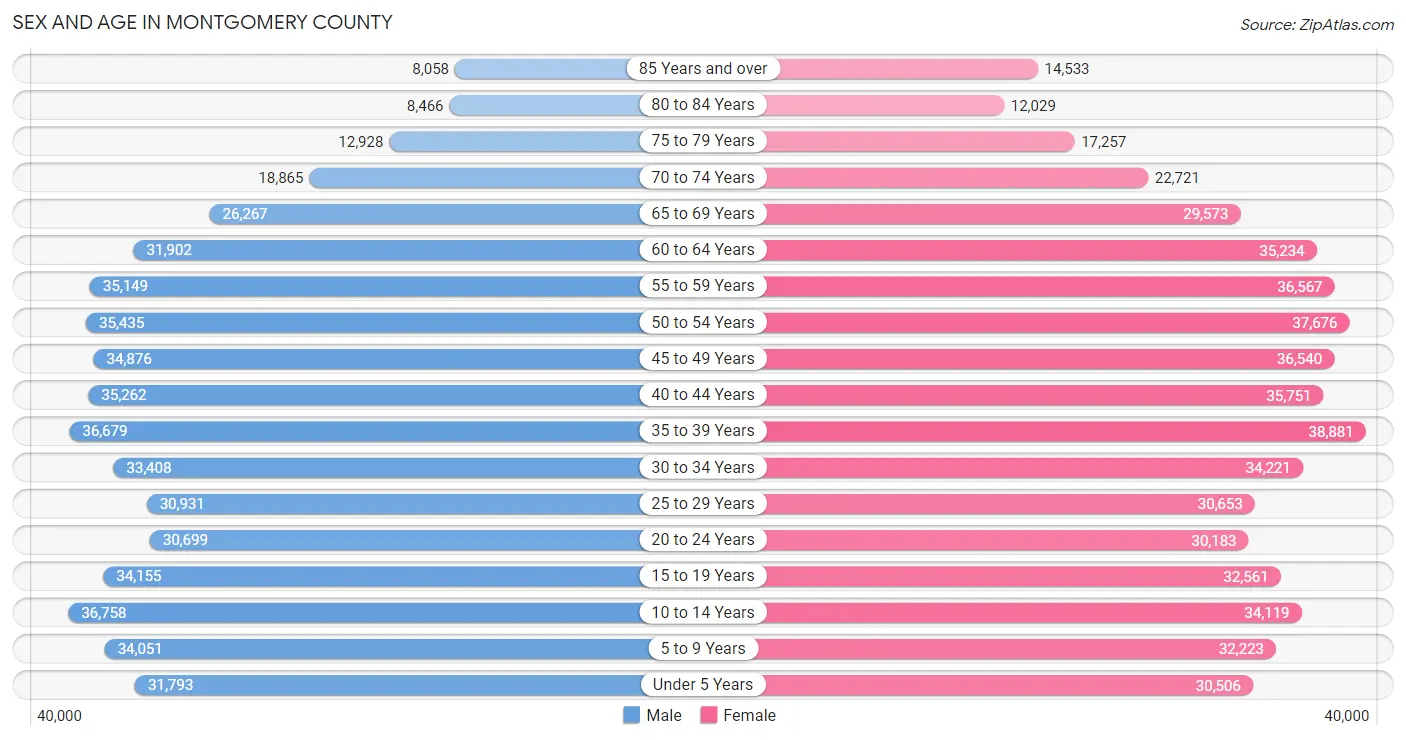
The most populous age groups in Montgomery County are 10 to 14 Years (36,758 | 7.1%) for men and 35 to 39 Years (38,881 | 7.2%) for women.
| Age Bracket | Male | Female |
| Under 5 Years | 31,793 (6.2%) | 30,506 (5.6%) |
| 5 to 9 Years | 34,051 (6.6%) | 32,223 (5.9%) |
| 10 to 14 Years | 36,758 (7.1%) | 34,119 (6.3%) |
| 15 to 19 Years | 34,155 (6.6%) | 32,561 (6.0%) |
| 20 to 24 Years | 30,699 (5.9%) | 30,183 (5.6%) |
| 25 to 29 Years | 30,931 (6.0%) | 30,653 (5.7%) |
| 30 to 34 Years | 33,408 (6.5%) | 34,221 (6.3%) |
| 35 to 39 Years | 36,679 (7.1%) | 38,881 (7.2%) |
| 40 to 44 Years | 35,262 (6.8%) | 35,751 (6.6%) |
| 45 to 49 Years | 34,876 (6.8%) | 36,540 (6.8%) |
| 50 to 54 Years | 35,435 (6.9%) | 37,676 (7.0%) |
| 55 to 59 Years | 35,149 (6.8%) | 36,567 (6.8%) |
| 60 to 64 Years | 31,902 (6.2%) | 35,234 (6.5%) |
| 65 to 69 Years | 26,267 (5.1%) | 29,573 (5.5%) |
| 70 to 74 Years | 18,865 (3.7%) | 22,721 (4.2%) |
| 75 to 79 Years | 12,928 (2.5%) | 17,257 (3.2%) |
| 80 to 84 Years | 8,466 (1.6%) | 12,029 (2.2%) |
| 85 Years and over | 8,058 (1.6%) | 14,533 (2.7%) |
| Total | 515,682 (100.0%) | 541,228 (100.0%) |
Families and Households in Montgomery County
Median Family Size in Montgomery County
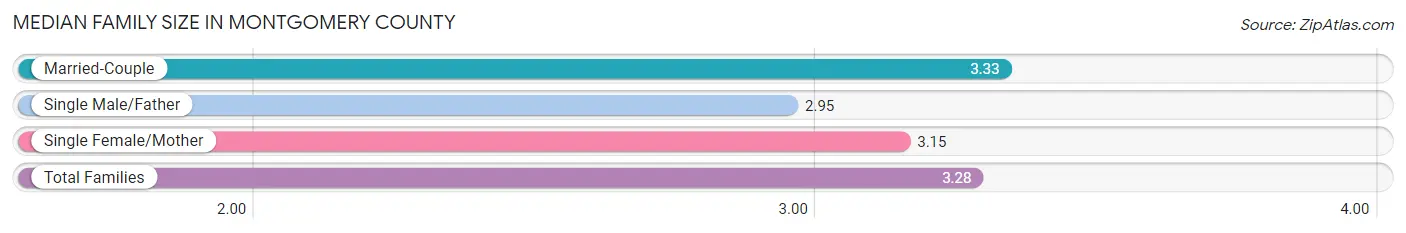
The median family size in Montgomery County is 3.28 persons per family, with married-couple families (207,473 | 77.9%) accounting for the largest median family size of 3.33 persons per family. On the other hand, single male/father families (16,036 | 6.0%) represent the smallest median family size with 2.95 persons per family.
| Family Type | # Families | Family Size |
| Married-Couple | 207,473 (77.9%) | 3.33 |
| Single Male/Father | 16,036 (6.0%) | 2.95 |
| Single Female/Mother | 42,777 (16.1%) | 3.15 |
| Total Families | 266,286 (100.0%) | 3.28 |
Median Household Size in Montgomery County
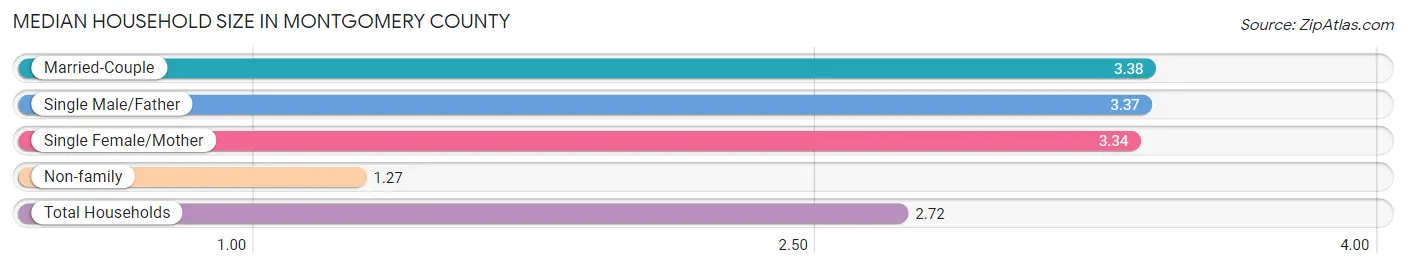
The median household size in Montgomery County is 2.72 persons per household, with married-couple households (207,473 | 53.8%) accounting for the largest median household size of 3.38 persons per household. non-family households (118,998 | 30.9%) represent the smallest median household size with 1.27 persons per household.
| Household Type | # Households | Household Size |
| Married-Couple | 207,473 (53.8%) | 3.38 |
| Single Male/Father | 16,036 (4.2%) | 3.37 |
| Single Female/Mother | 42,777 (11.1%) | 3.34 |
| Non-family | 118,998 (30.9%) | 1.27 |
| Total Households | 385,284 (100.0%) | 2.72 |
Household Size by Marriage Status in Montgomery County
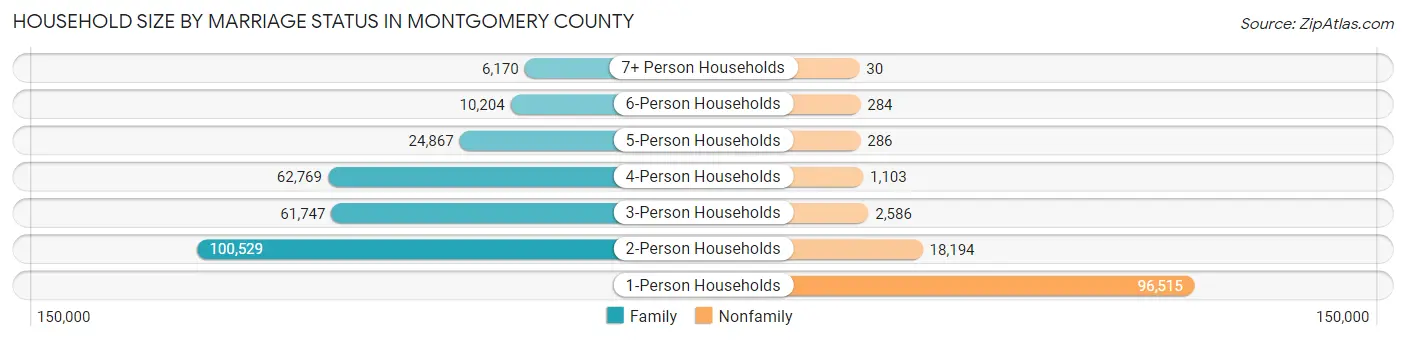
Out of a total of 385,284 households in Montgomery County, 266,286 (69.1%) are family households, while 118,998 (30.9%) are nonfamily households. The most numerous type of family households are 2-person households, comprising 100,529, and the most common type of nonfamily households are 1-person households, comprising 96,515.
| Household Size | Family Households | Nonfamily Households |
| 1-Person Households | - | 96,515 (25.1%) |
| 2-Person Households | 100,529 (26.1%) | 18,194 (4.7%) |
| 3-Person Households | 61,747 (16.0%) | 2,586 (0.7%) |
| 4-Person Households | 62,769 (16.3%) | 1,103 (0.3%) |
| 5-Person Households | 24,867 (6.5%) | 286 (0.1%) |
| 6-Person Households | 10,204 (2.6%) | 284 (0.1%) |
| 7+ Person Households | 6,170 (1.6%) | 30 (0.0%) |
| Total | 266,286 (69.1%) | 118,998 (30.9%) |
Female Fertility in Montgomery County
Fertility by Age in Montgomery County
Average fertility rate in Montgomery County is 52.0 births per 1,000 women. Women in the age bracket of 20 to 34 years have the highest fertility rate with 77.0 births per 1,000 women. Women in the age bracket of 20 to 34 years acount for 56.6% of all women with births.
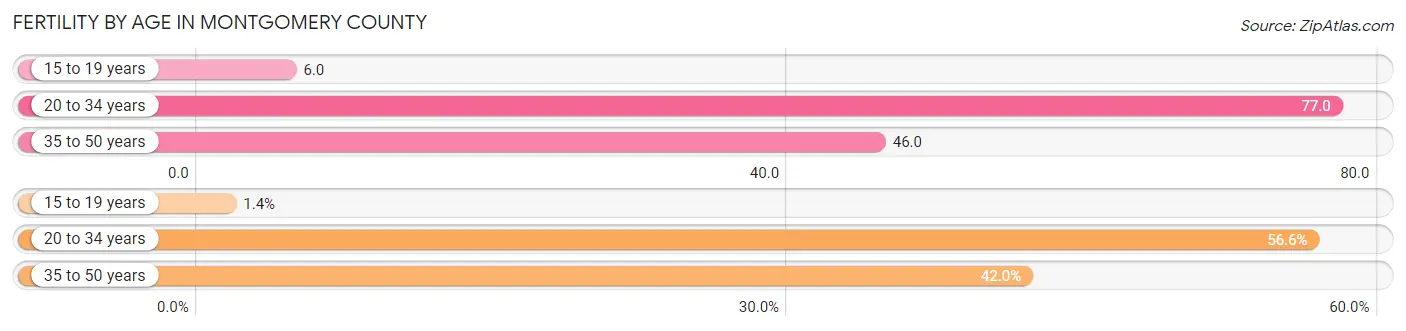
| Age Bracket | Women with Births | Births / 1,000 Women |
| 15 to 19 years | 186 (1.4%) | 6.0 |
| 20 to 34 years | 7,329 (56.6%) | 77.0 |
| 35 to 50 years | 5,440 (42.0%) | 46.0 |
| Total | 12,955 (100.0%) | 52.0 |
Fertility by Age by Marriage Status in Montgomery County
78.4% of women with births (12,955) in Montgomery County are married. The highest percentage of unmarried women with births falls into 15 to 19 years age bracket with 96.8% of them unmarried at the time of birth, while the lowest percentage of unmarried women with births belong to 35 to 50 years age bracket with 15.3% of them unmarried.
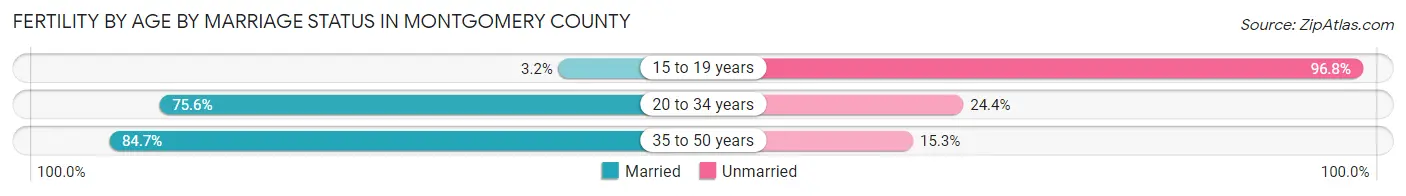
| Age Bracket | Married | Unmarried |
| 15 to 19 years | 6 (3.2%) | 180 (96.8%) |
| 20 to 34 years | 5,541 (75.6%) | 1,788 (24.4%) |
| 35 to 50 years | 4,608 (84.7%) | 832 (15.3%) |
| Total | 10,157 (78.4%) | 2,798 (21.6%) |
Fertility by Education in Montgomery County
Average fertility rate in Montgomery County is 52.0 births per 1,000 women. Women with the education attainment of graduate degree have the highest fertility rate of 71.0 births per 1,000 women, while women with the education attainment of less than high school have the lowest fertility at 38.0 births per 1,000 women. Women with the education attainment of graduate degree represent 35.6% of all women with births.
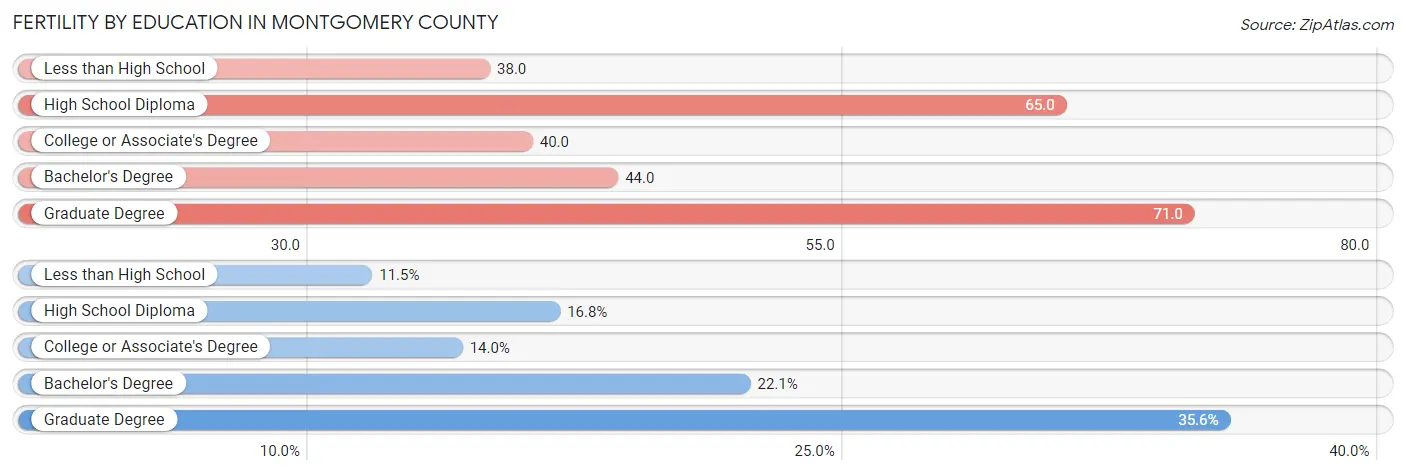
| Educational Attainment | Women with Births | Births / 1,000 Women |
| Less than High School | 1,488 (11.5%) | 38.0 |
| High School Diploma | 2,173 (16.8%) | 65.0 |
| College or Associate's Degree | 1,817 (14.0%) | 40.0 |
| Bachelor's Degree | 2,865 (22.1%) | 44.0 |
| Graduate Degree | 4,612 (35.6%) | 71.0 |
| Total | 12,955 (100.0%) | 52.0 |
Fertility by Education by Marriage Status in Montgomery County
21.6% of women with births in Montgomery County are unmarried. Women with the educational attainment of graduate degree are most likely to be married with 94.8% of them married at childbirth, while women with the educational attainment of less than high school are least likely to be married with 55.0% of them unmarried at childbirth.
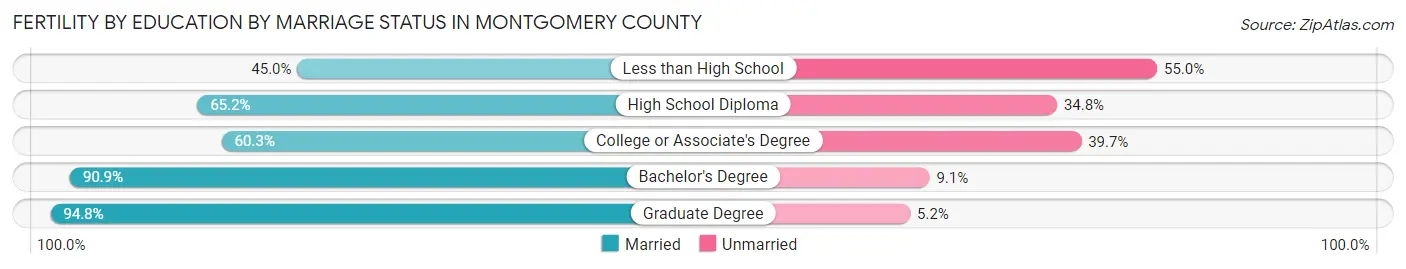
| Educational Attainment | Married | Unmarried |
| Less than High School | 670 (45.0%) | 818 (55.0%) |
| High School Diploma | 1,417 (65.2%) | 756 (34.8%) |
| College or Associate's Degree | 1,096 (60.3%) | 721 (39.7%) |
| Bachelor's Degree | 2,604 (90.9%) | 261 (9.1%) |
| Graduate Degree | 4,372 (94.8%) | 240 (5.2%) |
| Total | 10,157 (78.4%) | 2,798 (21.6%) |
Income in Montgomery County
Income Overview in Montgomery County
Per Capita Income in Montgomery County is $64,126, while median incomes of families and households are $152,137 and $125,583 respectively.
| Characteristic | Number | Measure |
| Per Capita Income | 1,056,910 | $64,126 |
| Median Family Income | 266,286 | $152,137 |
| Mean Family Income | 266,286 | $201,426 |
| Median Household Income | 385,284 | $125,583 |
| Mean Household Income | 385,284 | $172,866 |
| Income Deficit | 266,286 | $11,281 |
| Wage / Income Gap (%) | 1,056,910 | 23.95% |
| Wage / Income Gap ($) | 1,056,910 | 76.05¢ per $1 |
| Gini / Inequality Index | 1,056,910 | 0.47 |
Earnings by Sex in Montgomery County
Average Earnings in Montgomery County are $59,843, $68,633 for men and $52,195 for women, a difference of 23.9%.
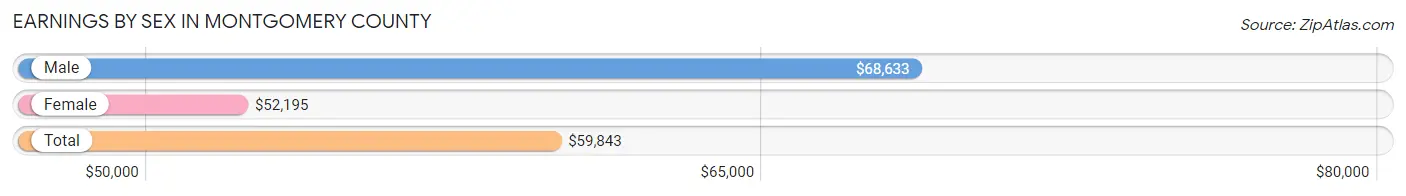
| Sex | Number | Average Earnings |
| Male | 314,468 (51.5%) | $68,633 |
| Female | 295,910 (48.5%) | $52,195 |
| Total | 610,378 (100.0%) | $59,843 |
Earnings by Sex by Income Bracket in Montgomery County
The most common earnings brackets in Montgomery County are $100,000+ for men (116,834 | 37.1%) and $100,000+ for women (77,794 | 26.3%).
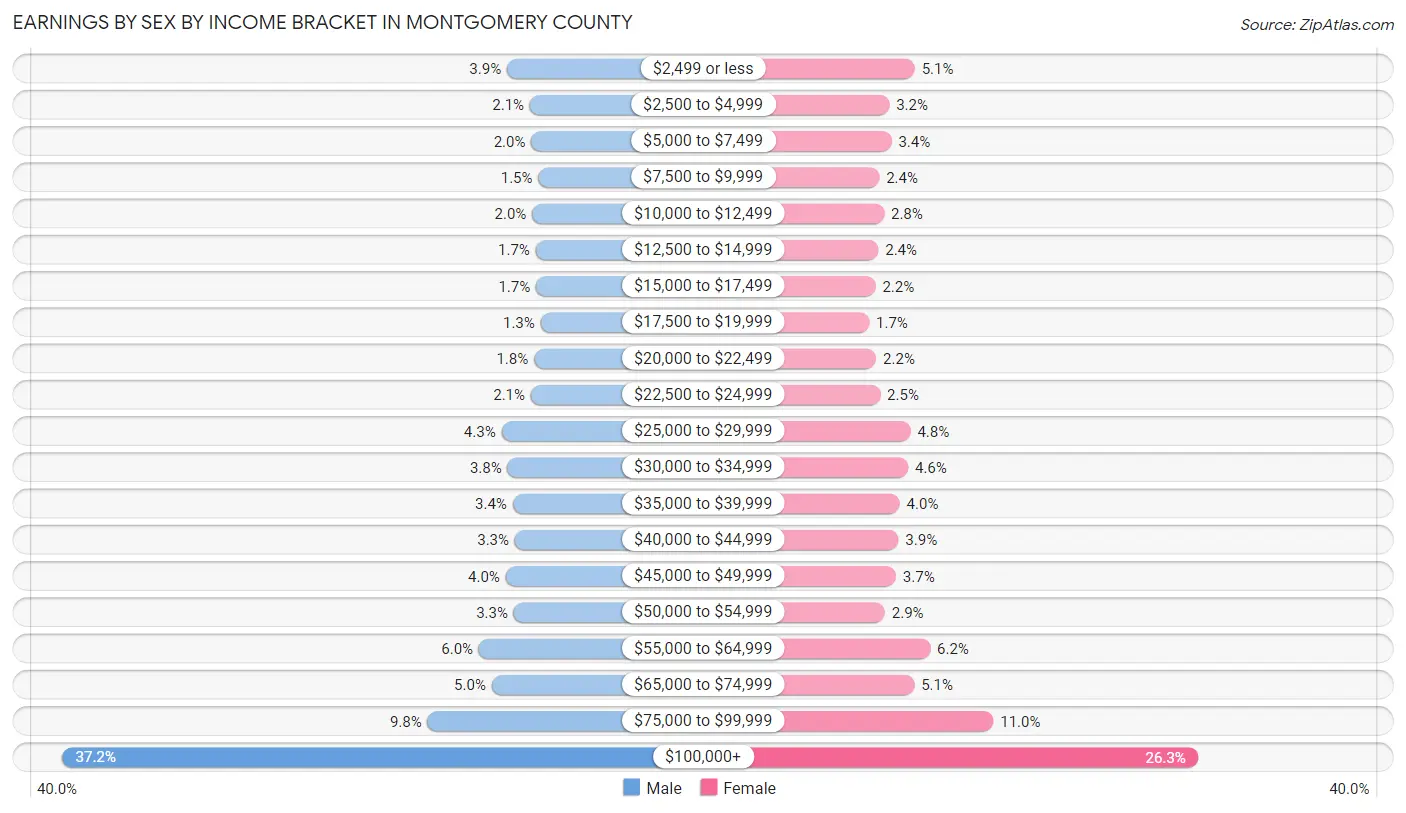
| Income | Male | Female |
| $2,499 or less | 12,099 (3.8%) | 15,070 (5.1%) |
| $2,500 to $4,999 | 6,695 (2.1%) | 9,400 (3.2%) |
| $5,000 to $7,499 | 6,396 (2.0%) | 9,922 (3.4%) |
| $7,500 to $9,999 | 4,731 (1.5%) | 7,179 (2.4%) |
| $10,000 to $12,499 | 6,170 (2.0%) | 8,254 (2.8%) |
| $12,500 to $14,999 | 5,357 (1.7%) | 6,982 (2.4%) |
| $15,000 to $17,499 | 5,258 (1.7%) | 6,353 (2.1%) |
| $17,500 to $19,999 | 4,190 (1.3%) | 4,945 (1.7%) |
| $20,000 to $22,499 | 5,737 (1.8%) | 6,518 (2.2%) |
| $22,500 to $24,999 | 6,480 (2.1%) | 7,395 (2.5%) |
| $25,000 to $29,999 | 13,383 (4.3%) | 14,108 (4.8%) |
| $30,000 to $34,999 | 11,984 (3.8%) | 13,587 (4.6%) |
| $35,000 to $39,999 | 10,752 (3.4%) | 11,725 (4.0%) |
| $40,000 to $44,999 | 10,259 (3.3%) | 11,449 (3.9%) |
| $45,000 to $49,999 | 12,434 (4.0%) | 10,886 (3.7%) |
| $50,000 to $54,999 | 10,493 (3.3%) | 8,428 (2.9%) |
| $55,000 to $64,999 | 18,712 (5.9%) | 18,458 (6.2%) |
| $65,000 to $74,999 | 15,678 (5.0%) | 14,955 (5.1%) |
| $75,000 to $99,999 | 30,826 (9.8%) | 32,502 (11.0%) |
| $100,000+ | 116,834 (37.1%) | 77,794 (26.3%) |
| Total | 314,468 (100.0%) | 295,910 (100.0%) |
Earnings by Sex by Educational Attainment in Montgomery County
Average earnings in Montgomery County are $80,077 for men and $60,687 for women, a difference of 24.2%. Men with an educational attainment of graduate degree enjoy the highest average annual earnings of $137,354, while those with less than high school education earn the least with $38,402. Women with an educational attainment of graduate degree earn the most with the average annual earnings of $101,706, while those with less than high school education have the smallest earnings of $22,730.
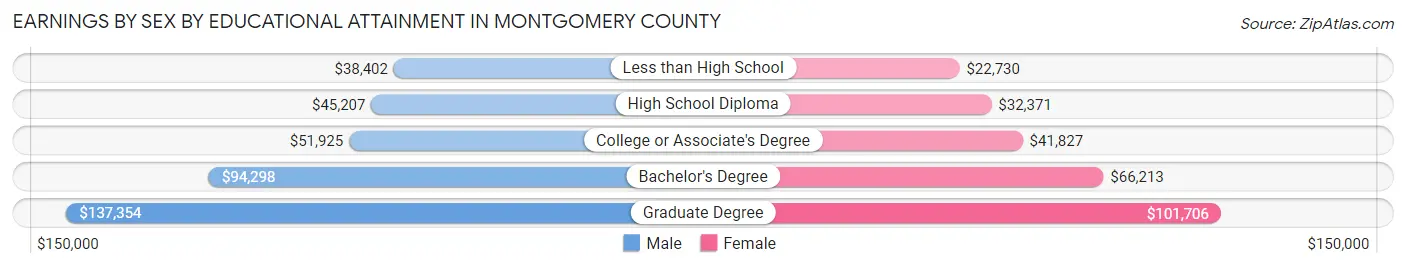
| Educational Attainment | Male Income | Female Income |
| Less than High School | $38,402 | $22,730 |
| High School Diploma | $45,207 | $32,371 |
| College or Associate's Degree | $51,925 | $41,827 |
| Bachelor's Degree | $94,298 | $66,213 |
| Graduate Degree | $137,354 | $101,706 |
| Total | $80,077 | $60,687 |
Family Income in Montgomery County
Family Income Brackets in Montgomery County
According to the Montgomery County family income data, there are 96,662 families falling into the $200,000+ income range, which is the most common income bracket and makes up 36.3% of all families. Conversely, the $10,000 to $14,999 income bracket is the least frequent group with only 1,864 families (0.7%) belonging to this category.
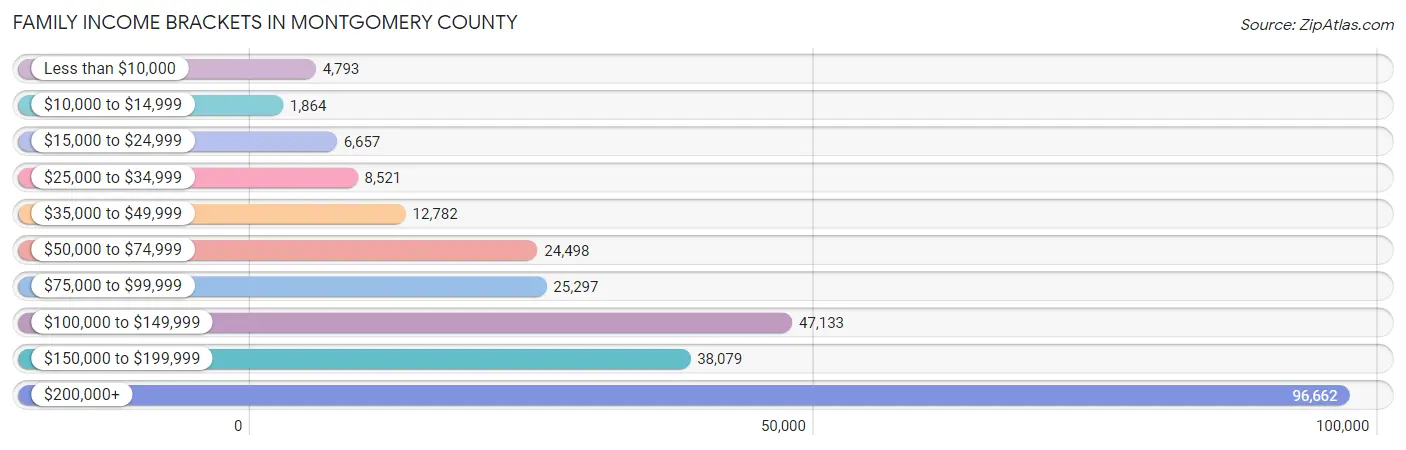
| Income Bracket | # Families | % Families |
| Less than $10,000 | 4,793 | 1.8% |
| $10,000 to $14,999 | 1,864 | 0.7% |
| $15,000 to $24,999 | 6,657 | 2.5% |
| $25,000 to $34,999 | 8,521 | 3.2% |
| $35,000 to $49,999 | 12,782 | 4.8% |
| $50,000 to $74,999 | 24,498 | 9.2% |
| $75,000 to $99,999 | 25,297 | 9.5% |
| $100,000 to $149,999 | 47,133 | 17.7% |
| $150,000 to $199,999 | 38,079 | 14.3% |
| $200,000+ | 96,662 | 36.3% |
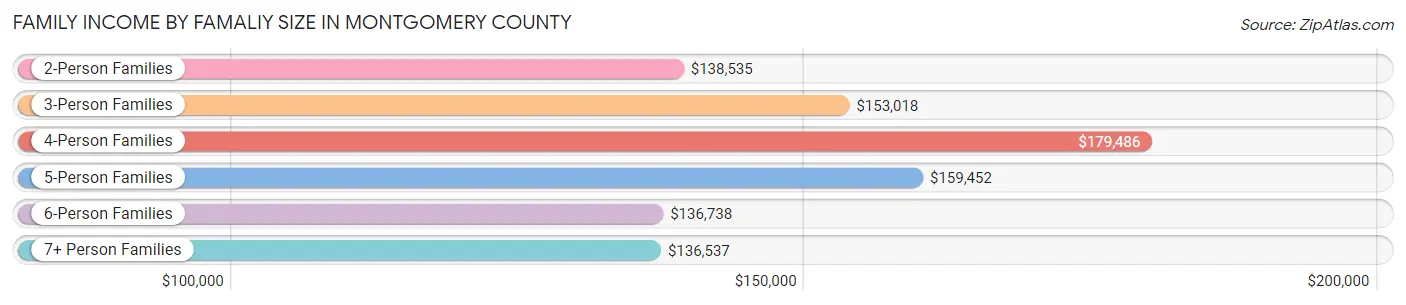
Family Income by Famaliy Size in Montgomery County
4-person families (60,341 | 22.7%) account for the highest median family income in Montgomery County with $179,486 per family, while 2-person families (106,547 | 40.0%) have the highest median income of $69,268 per family member.
| Income Bracket | # Families | Median Income |
| 2-Person Families | 106,547 (40.0%) | $138,535 |
| 3-Person Families | 62,546 (23.5%) | $153,018 |
| 4-Person Families | 60,341 (22.7%) | $179,486 |
| 5-Person Families | 23,248 (8.7%) | $159,452 |
| 6-Person Families | 8,469 (3.2%) | $136,738 |
| 7+ Person Families | 5,135 (1.9%) | $136,537 |
| Total | 266,286 (100.0%) | $152,137 |
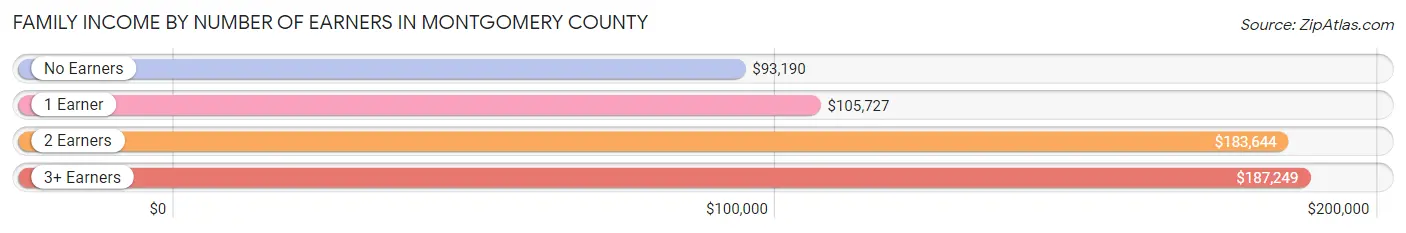
Family Income by Number of Earners in Montgomery County
The median family income in Montgomery County is $152,137, with families comprising 3+ earners (42,241) having the highest median family income of $187,249, while families with no earners (23,970) have the lowest median family income of $93,190, accounting for 15.9% and 9.0% of families, respectively.
| Number of Earners | # Families | Median Income |
| No Earners | 23,970 (9.0%) | $93,190 |
| 1 Earner | 71,488 (26.9%) | $105,727 |
| 2 Earners | 128,587 (48.3%) | $183,644 |
| 3+ Earners | 42,241 (15.9%) | $187,249 |
| Total | 266,286 (100.0%) | $152,137 |
Household Income in Montgomery County
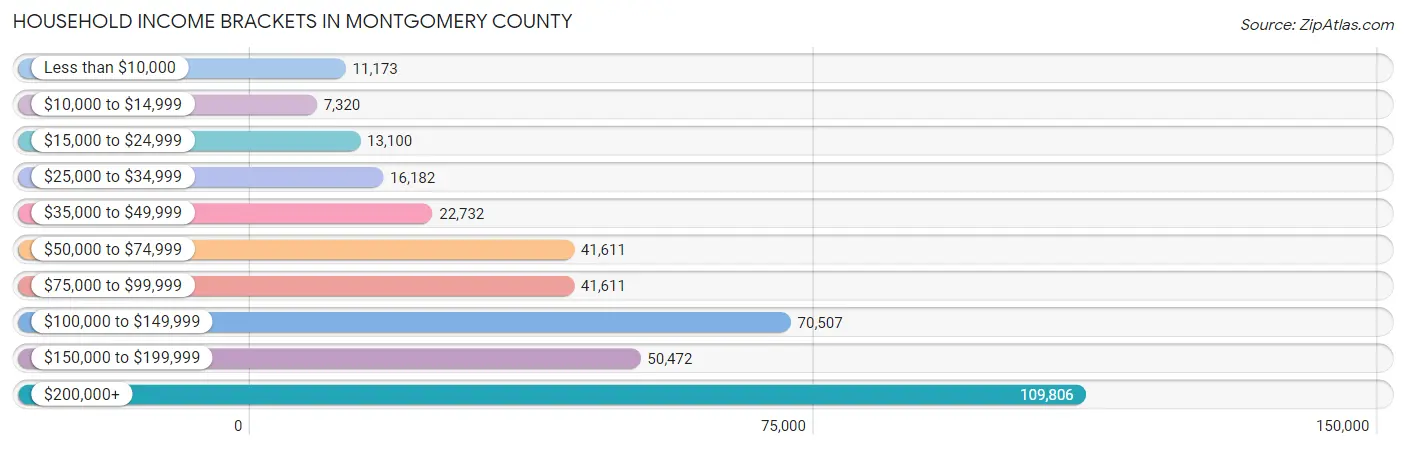
Household Income Brackets in Montgomery County
With 109,806 households falling in the category, the $200,000+ income range is the most frequent in Montgomery County, accounting for 28.5% of all households. In contrast, only 7,320 households (1.9%) fall into the $10,000 to $14,999 income bracket, making it the least populous group.
| Income Bracket | # Households | % Households |
| Less than $10,000 | 11,173 | 2.9% |
| $10,000 to $14,999 | 7,320 | 1.9% |
| $15,000 to $24,999 | 13,100 | 3.4% |
| $25,000 to $34,999 | 16,182 | 4.2% |
| $35,000 to $49,999 | 22,732 | 5.9% |
| $50,000 to $74,999 | 41,611 | 10.8% |
| $75,000 to $99,999 | 41,611 | 10.8% |
| $100,000 to $149,999 | 70,507 | 18.3% |
| $150,000 to $199,999 | 50,472 | 13.1% |
| $200,000+ | 109,806 | 28.5% |
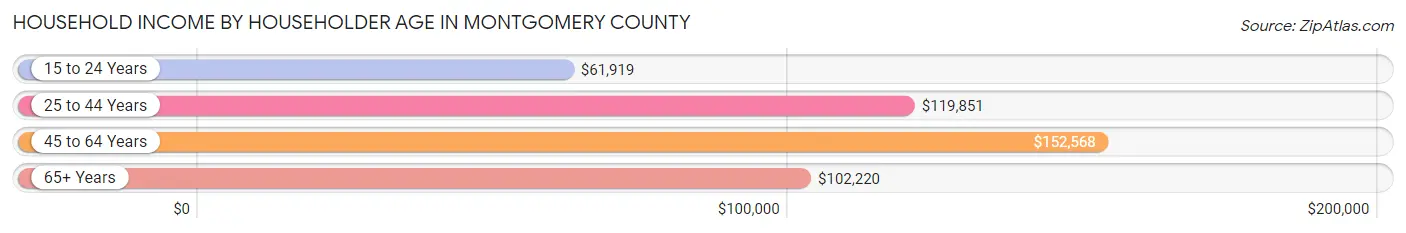
Household Income by Householder Age in Montgomery County
The median household income in Montgomery County is $125,583, with the highest median household income of $152,568 found in the 45 to 64 years age bracket for the primary householder. A total of 156,935 households (40.7%) fall into this category. Meanwhile, the 15 to 24 years age bracket for the primary householder has the lowest median household income of $61,919, with 7,961 households (2.1%) in this group.
| Income Bracket | # Households | Median Income |
| 15 to 24 Years | 7,961 (2.1%) | $61,919 |
| 25 to 44 Years | 122,518 (31.8%) | $119,851 |
| 45 to 64 Years | 156,935 (40.7%) | $152,568 |
| 65+ Years | 97,870 (25.4%) | $102,220 |
| Total | 385,284 (100.0%) | $125,583 |
Poverty in Montgomery County
Income Below Poverty by Sex and Age in Montgomery County
With 6.4% poverty level for males and 7.9% for females among the residents of Montgomery County, under 5 year old males and 18 to 24 year old females are the most vulnerable to poverty, with 2,936 males (9.5%) and 5,035 females (12.1%) in their respective age groups living below the poverty level.
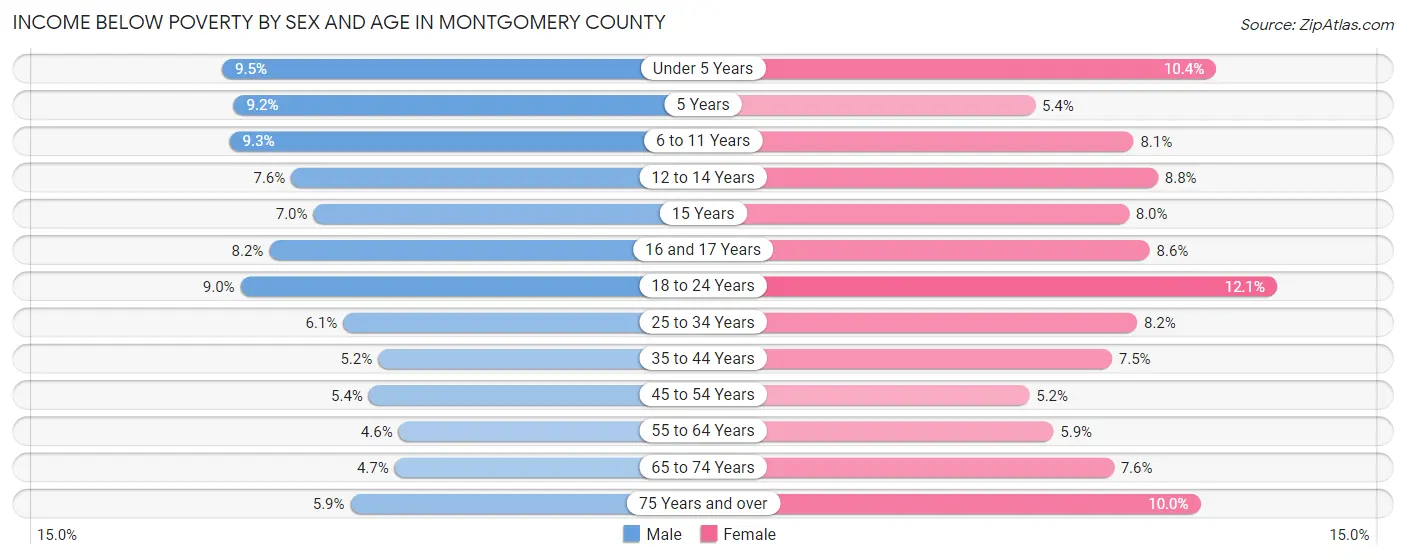
| Age Bracket | Male | Female |
| Under 5 Years | 2,936 (9.5%) | 3,126 (10.4%) |
| 5 Years | 567 (9.2%) | 309 (5.4%) |
| 6 to 11 Years | 3,874 (9.3%) | 3,210 (8.1%) |
| 12 to 14 Years | 1,679 (7.6%) | 1,775 (8.8%) |
| 15 Years | 484 (7.0%) | 551 (8.0%) |
| 16 and 17 Years | 1,212 (8.2%) | 1,206 (8.6%) |
| 18 to 24 Years | 3,831 (9.0%) | 5,035 (12.1%) |
| 25 to 34 Years | 3,924 (6.1%) | 5,332 (8.2%) |
| 35 to 44 Years | 3,703 (5.2%) | 5,613 (7.5%) |
| 45 to 54 Years | 3,804 (5.4%) | 3,861 (5.2%) |
| 55 to 64 Years | 3,059 (4.6%) | 4,211 (5.9%) |
| 65 to 74 Years | 2,095 (4.7%) | 3,903 (7.6%) |
| 75 Years and over | 1,707 (5.9%) | 4,198 (10.0%) |
| Total | 32,875 (6.4%) | 42,330 (7.9%) |
Income Above Poverty by Sex and Age in Montgomery County
According to the poverty statistics in Montgomery County, males aged 55 to 64 years and females aged 45 to 54 years are the age groups that are most secure financially, with 95.4% of males and 94.8% of females in these age groups living above the poverty line.
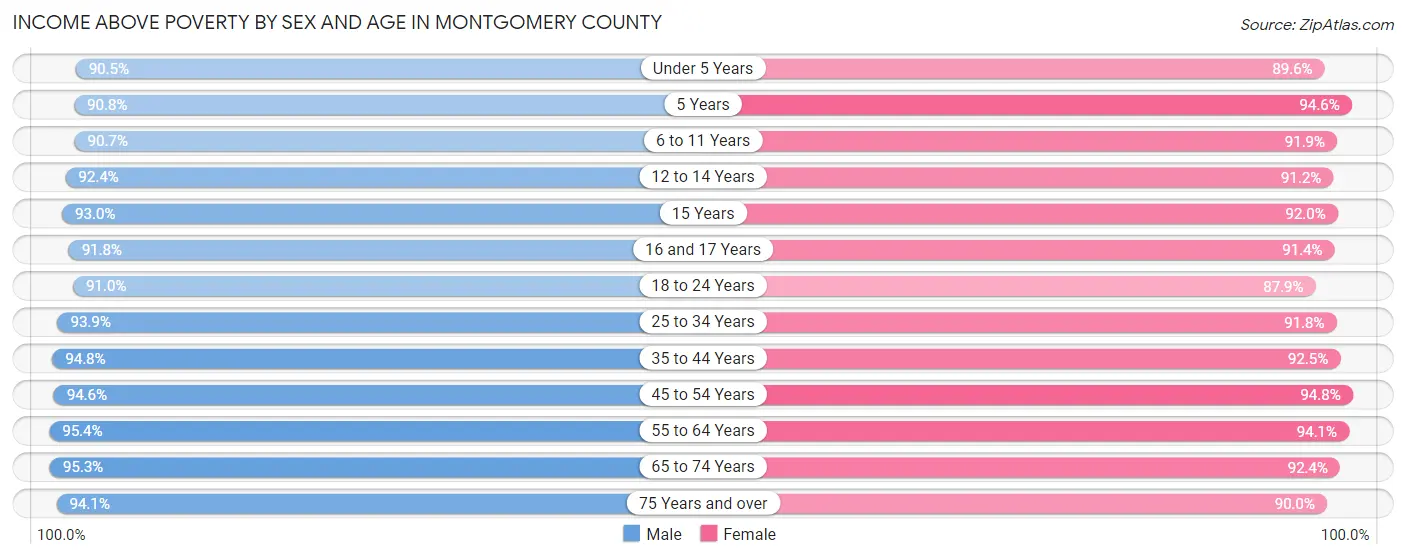
| Age Bracket | Male | Female |
| Under 5 Years | 27,973 (90.5%) | 26,867 (89.6%) |
| 5 Years | 5,608 (90.8%) | 5,432 (94.6%) |
| 6 to 11 Years | 37,825 (90.7%) | 36,330 (91.9%) |
| 12 to 14 Years | 20,485 (92.4%) | 18,402 (91.2%) |
| 15 Years | 6,469 (93.0%) | 6,346 (92.0%) |
| 16 and 17 Years | 13,592 (91.8%) | 12,873 (91.4%) |
| 18 to 24 Years | 38,761 (91.0%) | 36,552 (87.9%) |
| 25 to 34 Years | 60,109 (93.9%) | 59,502 (91.8%) |
| 35 to 44 Years | 68,021 (94.8%) | 68,999 (92.5%) |
| 45 to 54 Years | 66,341 (94.6%) | 70,170 (94.8%) |
| 55 to 64 Years | 63,570 (95.4%) | 67,285 (94.1%) |
| 65 to 74 Years | 42,492 (95.3%) | 47,660 (92.4%) |
| 75 Years and over | 27,094 (94.1%) | 37,851 (90.0%) |
| Total | 478,340 (93.6%) | 494,269 (92.1%) |
Income Below Poverty Among Married-Couple Families in Montgomery County
The poverty statistics for married-couple families in Montgomery County show that 3.1% or 6,444 of the total 207,473 families live below the poverty line. Families with 3 or 4 children have the highest poverty rate of 7.3%, comprising of 1,221 families. On the other hand, families with no children have the lowest poverty rate of 2.3%, which includes 2,460 families.
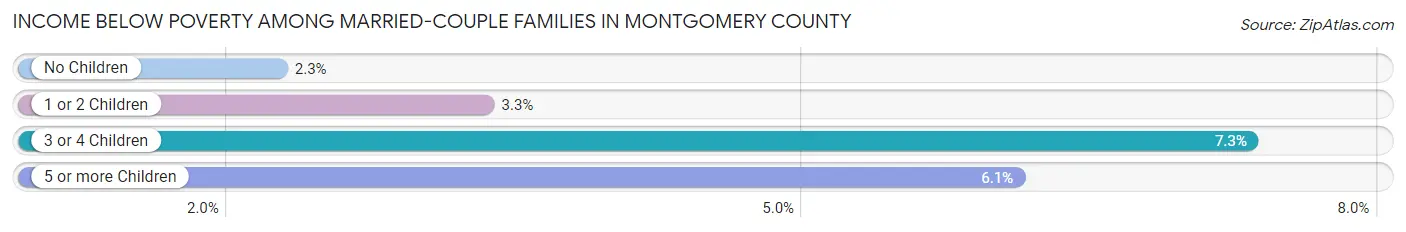
| Children | Above Poverty | Below Poverty |
| No Children | 106,178 (97.7%) | 2,460 (2.3%) |
| 1 or 2 Children | 78,730 (96.7%) | 2,718 (3.3%) |
| 3 or 4 Children | 15,430 (92.7%) | 1,221 (7.3%) |
| 5 or more Children | 691 (93.9%) | 45 (6.1%) |
| Total | 201,029 (96.9%) | 6,444 (3.1%) |
Income Below Poverty Among Single-Parent Households in Montgomery County
According to the poverty data in Montgomery County, 6.9% or 1,101 single-father households and 13.0% or 5,576 single-mother households are living below the poverty line. Among single-father households, those with 3 or 4 children have the highest poverty rate, with 186 households (15.0%) experiencing poverty. Likewise, among single-mother households, those with 5 or more children have the highest poverty rate, with 126 households (47.2%) falling below the poverty line.
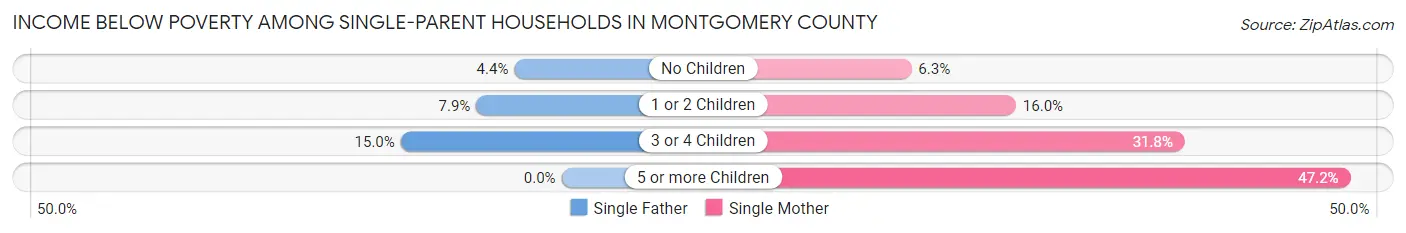
| Children | Single Father | Single Mother |
| No Children | 321 (4.4%) | 1,220 (6.3%) |
| 1 or 2 Children | 594 (7.9%) | 3,197 (16.0%) |
| 3 or 4 Children | 186 (15.0%) | 1,033 (31.8%) |
| 5 or more Children | 0 (0.0%) | 126 (47.2%) |
| Total | 1,101 (6.9%) | 5,576 (13.0%) |
Income Below Poverty Among Married-Couple vs Single-Parent Households in Montgomery County
The poverty data for Montgomery County shows that 6,444 of the married-couple family households (3.1%) and 6,677 of the single-parent households (11.4%) are living below the poverty level. Within the married-couple family households, those with 3 or 4 children have the highest poverty rate, with 1,221 households (7.3%) falling below the poverty line. Among the single-parent households, those with 5 or more children have the highest poverty rate, with 126 household (44.8%) living below poverty.
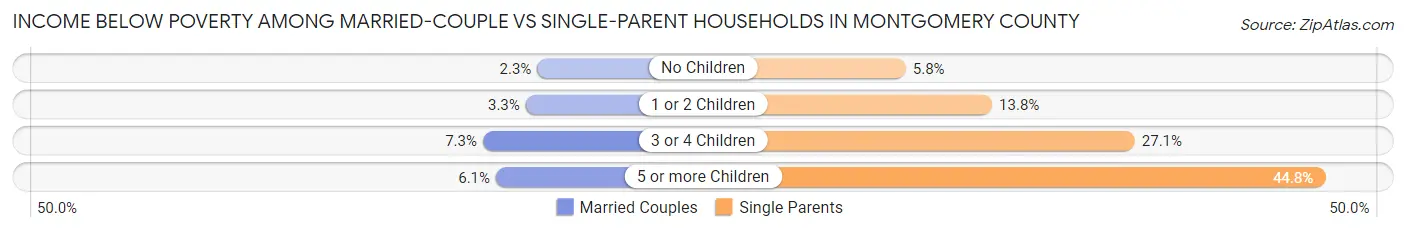
| Children | Married-Couple Families | Single-Parent Households |
| No Children | 2,460 (2.3%) | 1,541 (5.8%) |
| 1 or 2 Children | 2,718 (3.3%) | 3,791 (13.8%) |
| 3 or 4 Children | 1,221 (7.3%) | 1,219 (27.1%) |
| 5 or more Children | 45 (6.1%) | 126 (44.8%) |
| Total | 6,444 (3.1%) | 6,677 (11.4%) |
Employment Characteristics in Montgomery County
Employment by Class of Employer in Montgomery County
Among the 551,214 employed individuals in Montgomery County, private company employees (304,283 | 55.2%), federal government employees (75,755 | 13.7%), and not-for-profit organizations (65,884 | 11.9%) make up the most common classes of employment.
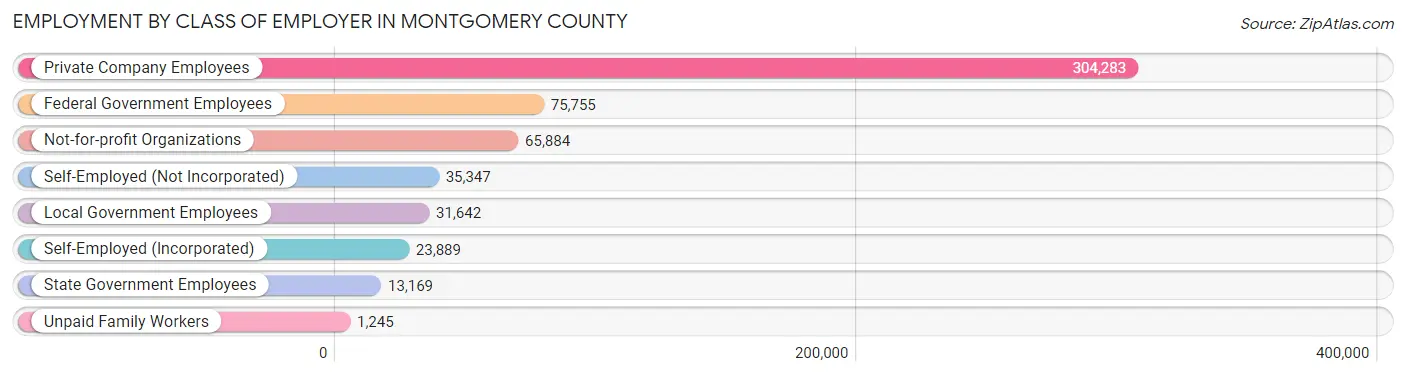
| Employer Class | # Employees | % Employees |
| Private Company Employees | 304,283 | 55.2% |
| Self-Employed (Incorporated) | 23,889 | 4.3% |
| Self-Employed (Not Incorporated) | 35,347 | 6.4% |
| Not-for-profit Organizations | 65,884 | 11.9% |
| Local Government Employees | 31,642 | 5.7% |
| State Government Employees | 13,169 | 2.4% |
| Federal Government Employees | 75,755 | 13.7% |
| Unpaid Family Workers | 1,245 | 0.2% |
| Total | 551,214 | 100.0% |
Employment Status by Age in Montgomery County
According to the labor force statistics for Montgomery County, out of the total population over 16 years of age (843,577), 70.3% or 593,035 individuals are in the labor force, with 4.8% or 28,466 of them unemployed. The age group with the highest labor force participation rate is 35 to 44 years, with 89.0% or 130,450 individuals in the labor force. Within the labor force, the 16 to 19 years age range has the highest percentage of unemployed individuals, with 17.0% or 2,739 of them being unemployed.
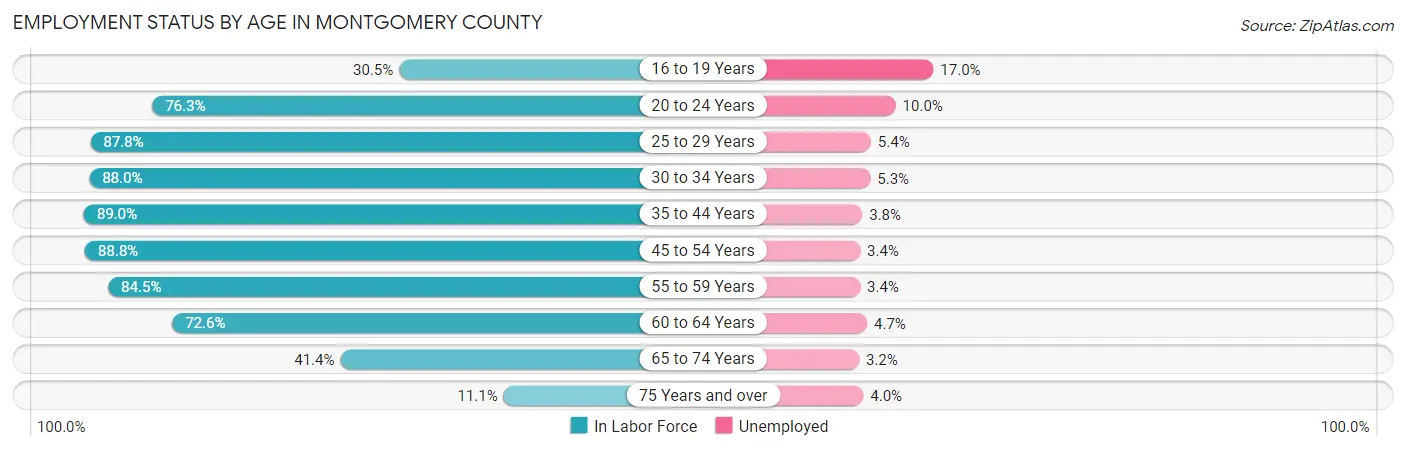
| Age Bracket | In Labor Force | Unemployed |
| 16 to 19 Years | 16,114 (30.5%) | 2,739 (17.0%) |
| 20 to 24 Years | 46,453 (76.3%) | 4,645 (10.0%) |
| 25 to 29 Years | 54,071 (87.8%) | 2,920 (5.4%) |
| 30 to 34 Years | 59,514 (88.0%) | 3,154 (5.3%) |
| 35 to 44 Years | 130,450 (89.0%) | 4,957 (3.8%) |
| 45 to 54 Years | 128,340 (88.8%) | 4,364 (3.4%) |
| 55 to 59 Years | 60,600 (84.5%) | 2,060 (3.4%) |
| 60 to 64 Years | 48,741 (72.6%) | 2,291 (4.7%) |
| 65 to 74 Years | 40,334 (41.4%) | 1,291 (3.2%) |
| 75 Years and over | 8,133 (11.1%) | 325 (4.0%) |
| Total | 593,035 (70.3%) | 28,466 (4.8%) |
Employment Status by Educational Attainment in Montgomery County
According to labor force statistics for Montgomery County, 86.1% of individuals (481,441) out of the total population between 25 and 64 years of age (559,165) are in the labor force, with 4.1% or 19,739 of them being unemployed. The group with the highest labor force participation rate are those with the educational attainment of bachelor's degree or higher, with 89.5% or 302,518 individuals in the labor force. Within the labor force, individuals with less than high school education have the highest percentage of unemployment, with 6.2% or 2,254 of them being unemployed.
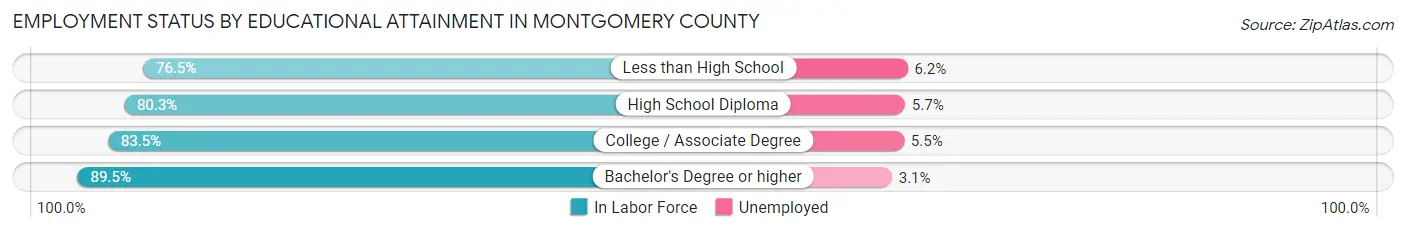
| Educational Attainment | In Labor Force | Unemployed |
| Less than High School | 36,351 (76.5%) | 2,946 (6.2%) |
| High School Diploma | 59,179 (80.3%) | 4,201 (5.7%) |
| College / Associate Degree | 83,452 (83.5%) | 5,497 (5.5%) |
| Bachelor's Degree or higher | 302,518 (89.5%) | 10,478 (3.1%) |
| Total | 481,441 (86.1%) | 22,926 (4.1%) |
Employment Occupations by Sex in Montgomery County
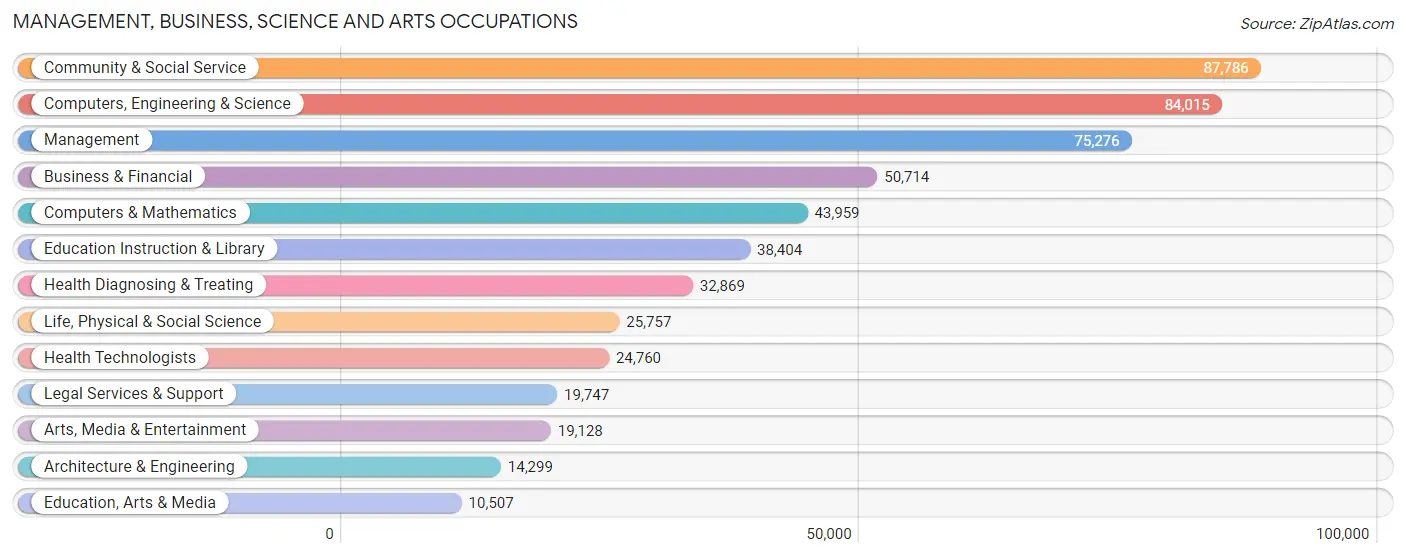
Management, Business, Science and Arts Occupations
The most common Management, Business, Science and Arts occupations in Montgomery County are Community & Social Service (87,786 | 15.7%), Computers, Engineering & Science (84,015 | 15.0%), Management (75,276 | 13.4%), Business & Financial (50,714 | 9.0%), and Computers & Mathematics (43,959 | 7.8%).
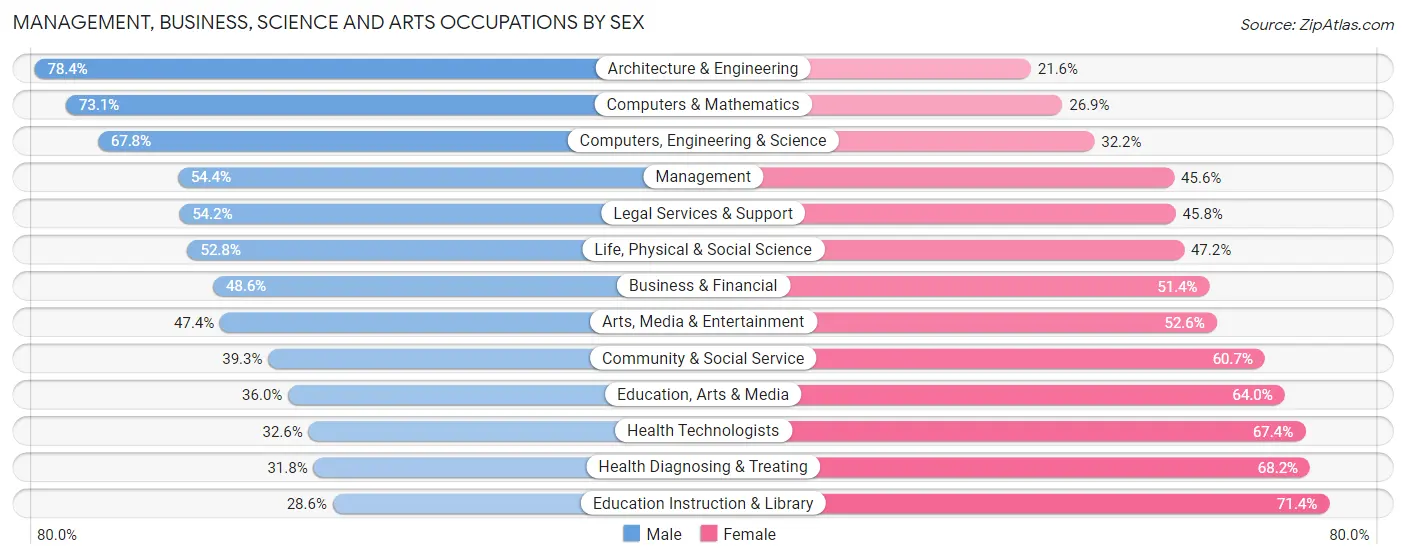
Management, Business, Science and Arts Occupations by Sex
Within the Management, Business, Science and Arts occupations in Montgomery County, the most male-oriented occupations are Architecture & Engineering (78.4%), Computers & Mathematics (73.1%), and Computers, Engineering & Science (67.8%), while the most female-oriented occupations are Education Instruction & Library (71.4%), Health Diagnosing & Treating (68.2%), and Health Technologists (67.4%).
| Occupation | Male | Female |
| Management | 40,983 (54.4%) | 34,293 (45.6%) |
| Business & Financial | 24,626 (48.6%) | 26,088 (51.4%) |
| Computers, Engineering & Science | 56,939 (67.8%) | 27,076 (32.2%) |
| Computers & Mathematics | 32,136 (73.1%) | 11,823 (26.9%) |
| Architecture & Engineering | 11,204 (78.4%) | 3,095 (21.6%) |
| Life, Physical & Social Science | 13,599 (52.8%) | 12,158 (47.2%) |
| Community & Social Service | 34,522 (39.3%) | 53,264 (60.7%) |
| Education, Arts & Media | 3,785 (36.0%) | 6,722 (64.0%) |
| Legal Services & Support | 10,701 (54.2%) | 9,046 (45.8%) |
| Education Instruction & Library | 10,976 (28.6%) | 27,428 (71.4%) |
| Arts, Media & Entertainment | 9,060 (47.4%) | 10,068 (52.6%) |
| Health Diagnosing & Treating | 10,449 (31.8%) | 22,420 (68.2%) |
| Health Technologists | 8,077 (32.6%) | 16,683 (67.4%) |
| Total (Category) | 167,519 (50.7%) | 163,141 (49.3%) |
| Total (Overall) | 290,472 (51.8%) | 270,277 (48.2%) |
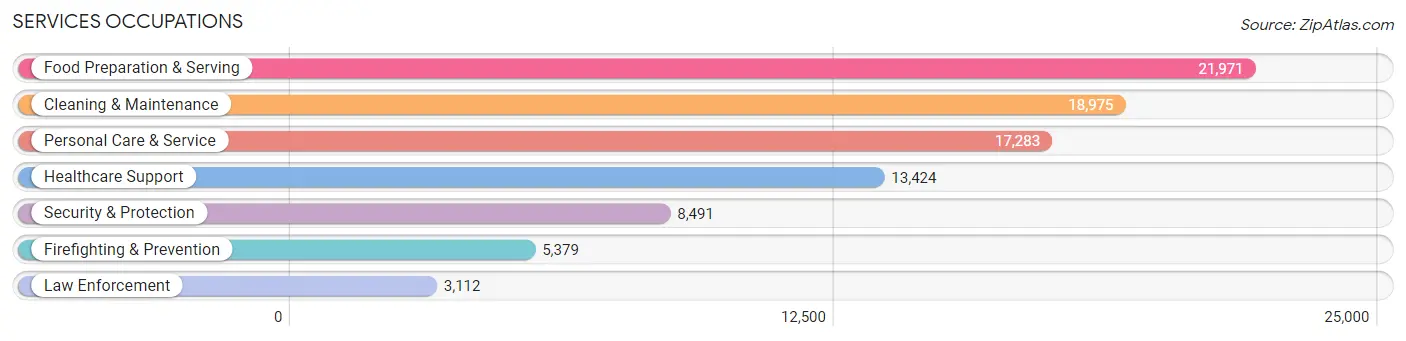
Services Occupations
The most common Services occupations in Montgomery County are Food Preparation & Serving (21,971 | 3.9%), Cleaning & Maintenance (18,975 | 3.4%), Personal Care & Service (17,283 | 3.1%), Healthcare Support (13,424 | 2.4%), and Security & Protection (8,491 | 1.5%).
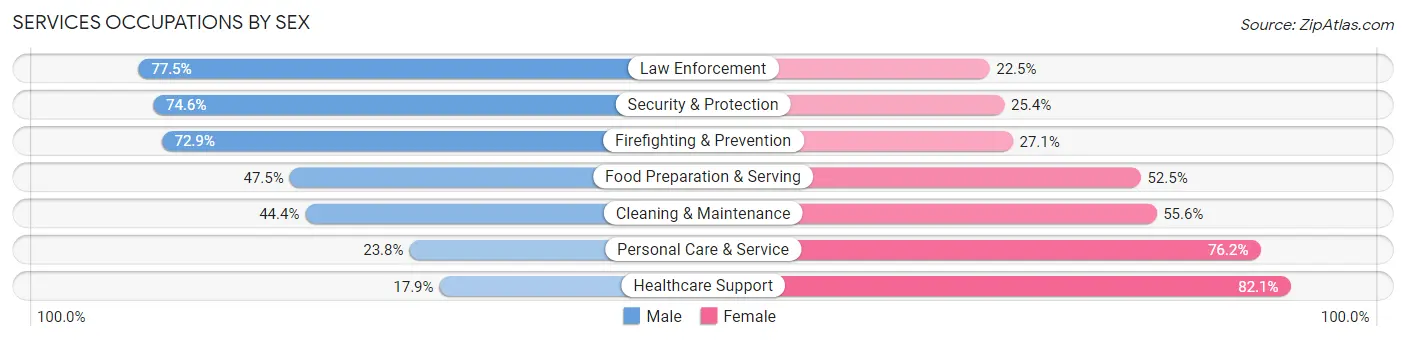
Services Occupations by Sex
Within the Services occupations in Montgomery County, the most male-oriented occupations are Law Enforcement (77.5%), Security & Protection (74.6%), and Firefighting & Prevention (72.9%), while the most female-oriented occupations are Healthcare Support (82.1%), Personal Care & Service (76.2%), and Cleaning & Maintenance (55.6%).
| Occupation | Male | Female |
| Healthcare Support | 2,399 (17.9%) | 11,025 (82.1%) |
| Security & Protection | 6,331 (74.6%) | 2,160 (25.4%) |
| Firefighting & Prevention | 3,920 (72.9%) | 1,459 (27.1%) |
| Law Enforcement | 2,411 (77.5%) | 701 (22.5%) |
| Food Preparation & Serving | 10,444 (47.5%) | 11,527 (52.5%) |
| Cleaning & Maintenance | 8,430 (44.4%) | 10,545 (55.6%) |
| Personal Care & Service | 4,119 (23.8%) | 13,164 (76.2%) |
| Total (Category) | 31,723 (39.6%) | 48,421 (60.4%) |
| Total (Overall) | 290,472 (51.8%) | 270,277 (48.2%) |
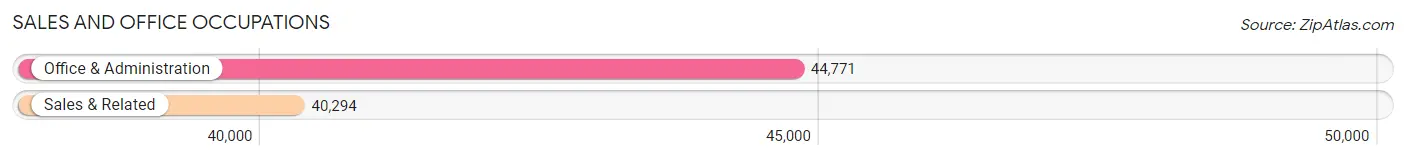
Sales and Office Occupations
The most common Sales and Office occupations in Montgomery County are Office & Administration (44,771 | 8.0%), and Sales & Related (40,294 | 7.2%).
Sales and Office Occupations by Sex
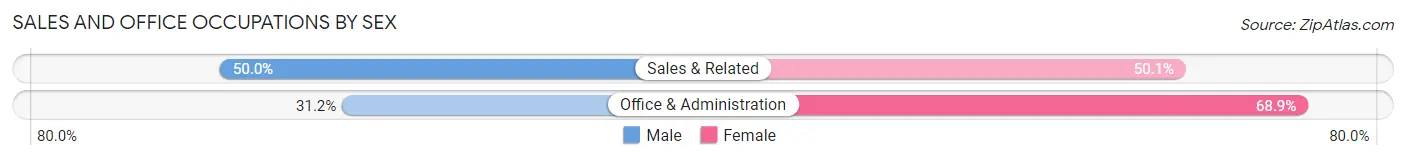
| Occupation | Male | Female |
| Sales & Related | 20,126 (49.9%) | 20,168 (50.0%) |
| Office & Administration | 13,946 (31.1%) | 30,825 (68.9%) |
| Total (Category) | 34,072 (40.1%) | 50,993 (60.0%) |
| Total (Overall) | 290,472 (51.8%) | 270,277 (48.2%) |
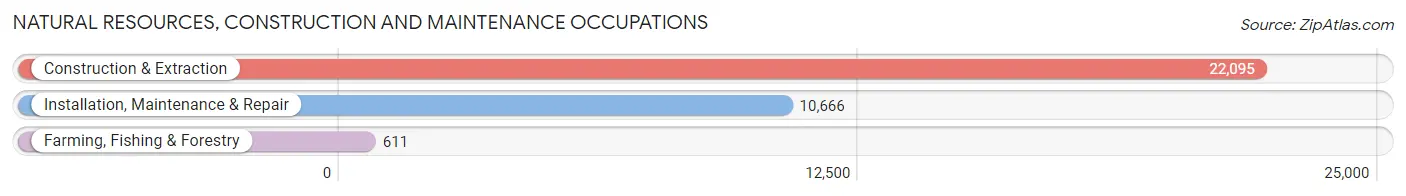
Natural Resources, Construction and Maintenance Occupations
The most common Natural Resources, Construction and Maintenance occupations in Montgomery County are Construction & Extraction (22,095 | 3.9%), Installation, Maintenance & Repair (10,666 | 1.9%), and Farming, Fishing & Forestry (611 | 0.1%).
Natural Resources, Construction and Maintenance Occupations by Sex
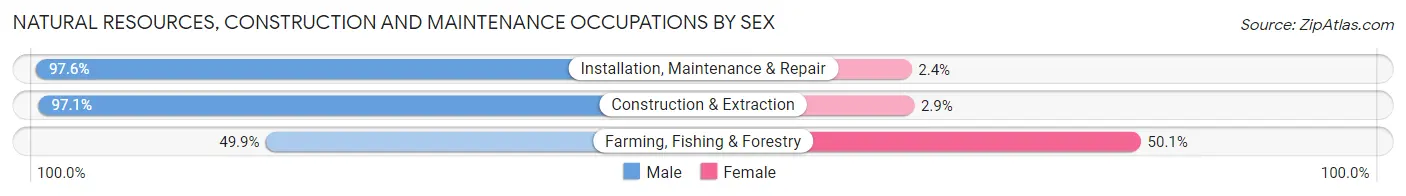
| Occupation | Male | Female |
| Farming, Fishing & Forestry | 305 (49.9%) | 306 (50.1%) |
| Construction & Extraction | 21,450 (97.1%) | 645 (2.9%) |
| Installation, Maintenance & Repair | 10,412 (97.6%) | 254 (2.4%) |
| Total (Category) | 32,167 (96.4%) | 1,205 (3.6%) |
| Total (Overall) | 290,472 (51.8%) | 270,277 (48.2%) |
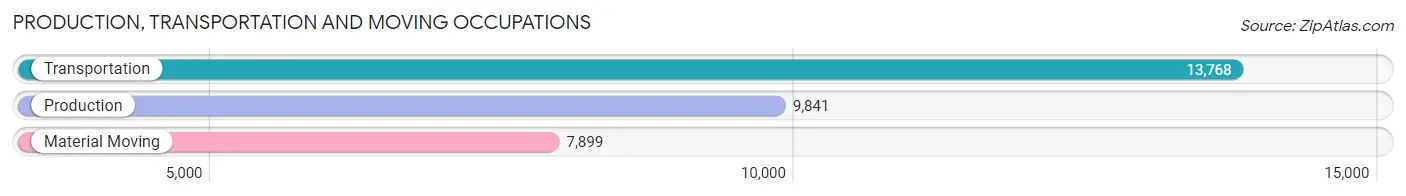
Production, Transportation and Moving Occupations
The most common Production, Transportation and Moving occupations in Montgomery County are Transportation (13,768 | 2.5%), Production (9,841 | 1.8%), and Material Moving (7,899 | 1.4%).
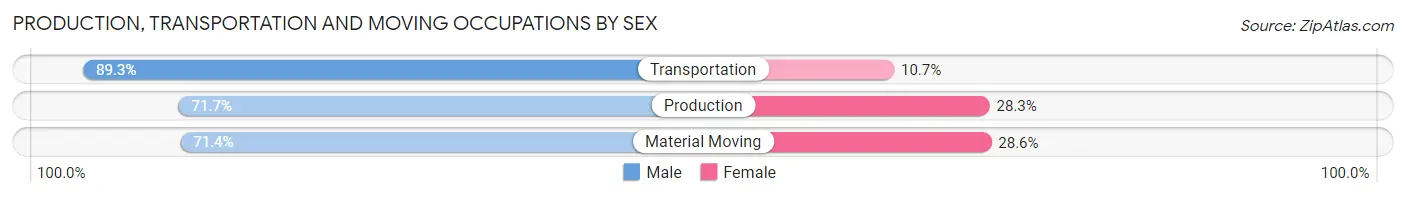
Production, Transportation and Moving Occupations by Sex
| Occupation | Male | Female |
| Production | 7,059 (71.7%) | 2,782 (28.3%) |
| Transportation | 12,291 (89.3%) | 1,477 (10.7%) |
| Material Moving | 5,641 (71.4%) | 2,258 (28.6%) |
| Total (Category) | 24,991 (79.3%) | 6,517 (20.7%) |
| Total (Overall) | 290,472 (51.8%) | 270,277 (48.2%) |
Employment Industries by Sex in Montgomery County
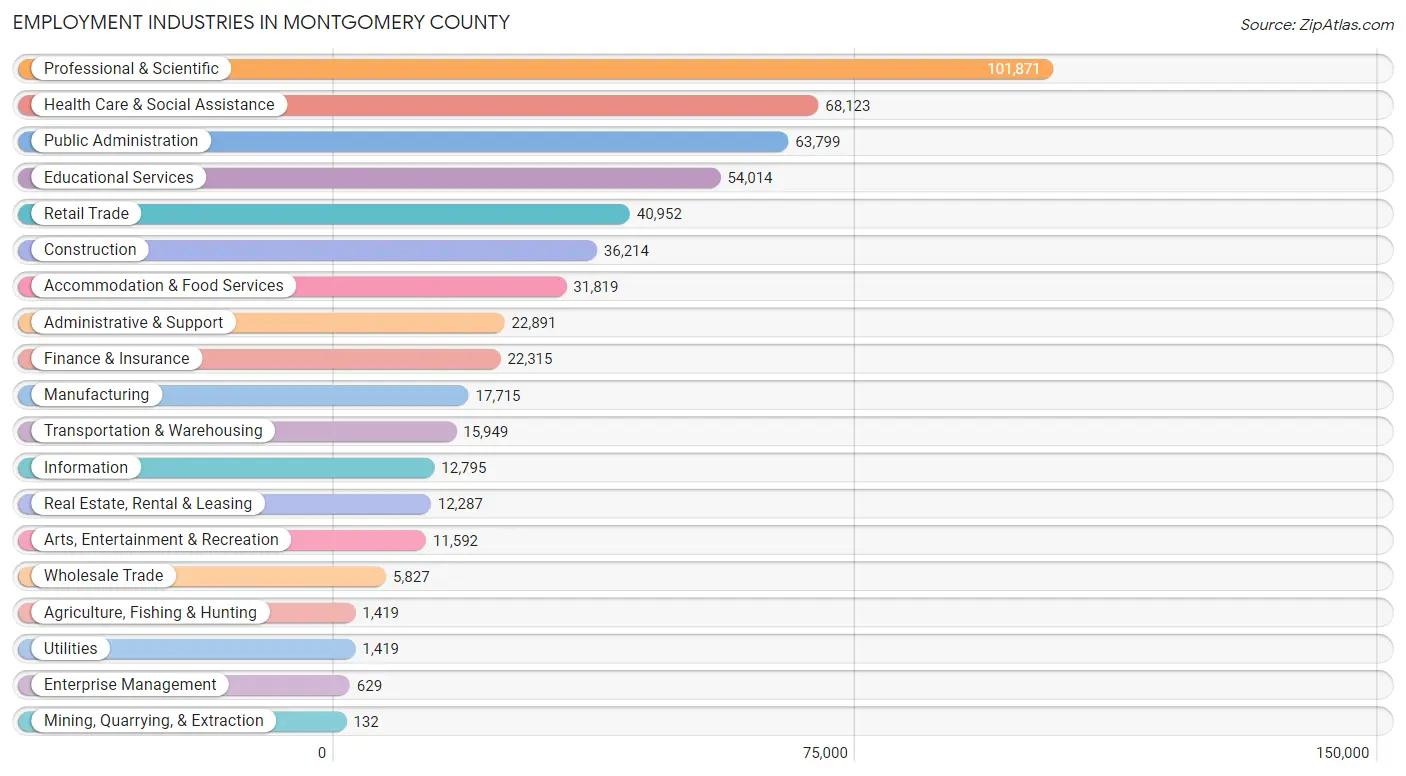
Employment Industries in Montgomery County
The major employment industries in Montgomery County include Professional & Scientific (101,871 | 18.2%), Health Care & Social Assistance (68,123 | 12.1%), Public Administration (63,799 | 11.4%), Educational Services (54,014 | 9.6%), and Retail Trade (40,952 | 7.3%).
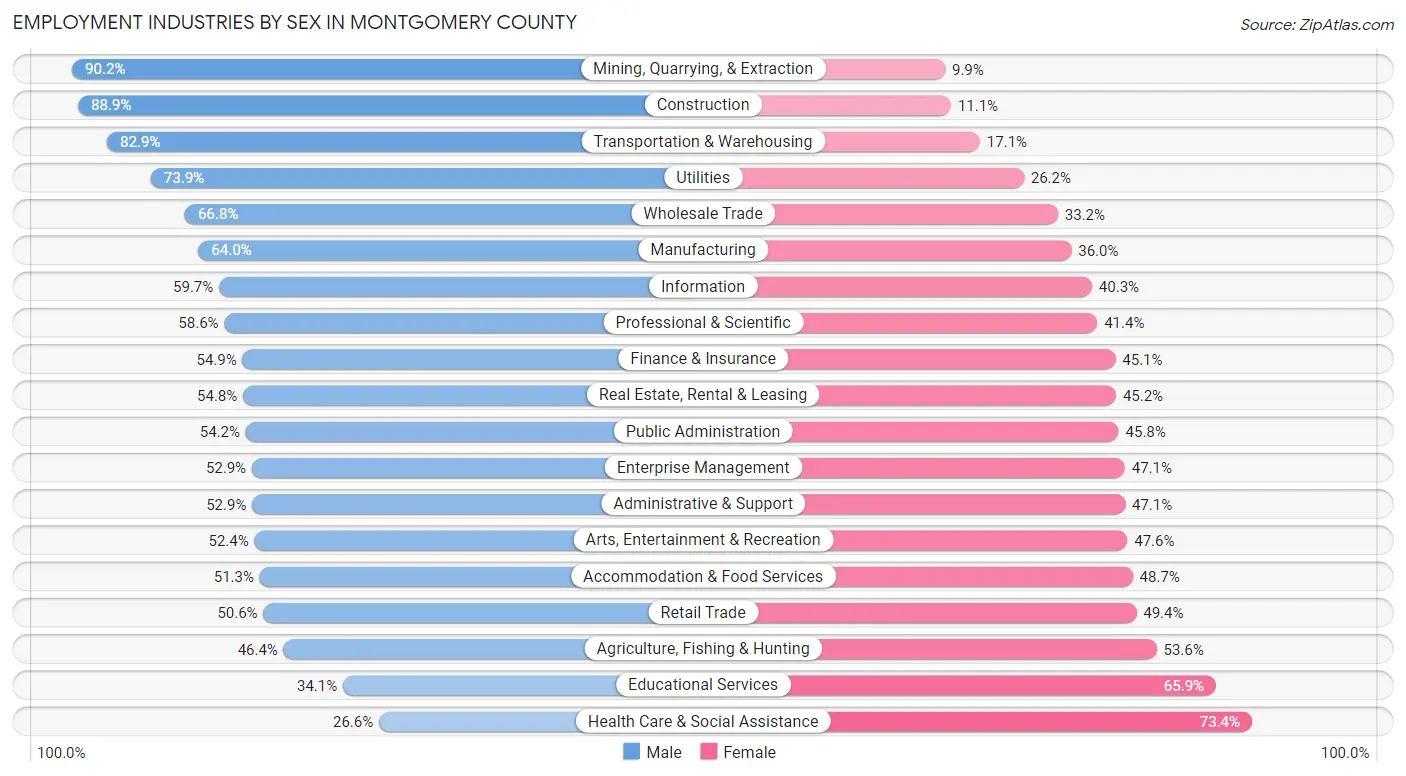
Employment Industries by Sex in Montgomery County
The Montgomery County industries that see more men than women are Mining, Quarrying, & Extraction (90.1%), Construction (88.9%), and Transportation & Warehousing (82.9%), whereas the industries that tend to have a higher number of women are Health Care & Social Assistance (73.4%), Educational Services (65.9%), and Agriculture, Fishing & Hunting (53.6%).
| Industry | Male | Female |
| Agriculture, Fishing & Hunting | 658 (46.4%) | 761 (53.6%) |
| Mining, Quarrying, & Extraction | 119 (90.1%) | 13 (9.9%) |
| Construction | 32,203 (88.9%) | 4,011 (11.1%) |
| Manufacturing | 11,341 (64.0%) | 6,374 (36.0%) |
| Wholesale Trade | 3,892 (66.8%) | 1,935 (33.2%) |
| Retail Trade | 20,705 (50.6%) | 20,247 (49.4%) |
| Transportation & Warehousing | 13,226 (82.9%) | 2,723 (17.1%) |
| Utilities | 1,048 (73.9%) | 371 (26.2%) |
| Information | 7,644 (59.7%) | 5,151 (40.3%) |
| Finance & Insurance | 12,249 (54.9%) | 10,066 (45.1%) |
| Real Estate, Rental & Leasing | 6,729 (54.8%) | 5,558 (45.2%) |
| Professional & Scientific | 59,740 (58.6%) | 42,131 (41.4%) |
| Enterprise Management | 333 (52.9%) | 296 (47.1%) |
| Administrative & Support | 12,105 (52.9%) | 10,786 (47.1%) |
| Educational Services | 18,407 (34.1%) | 35,607 (65.9%) |
| Health Care & Social Assistance | 18,151 (26.6%) | 49,972 (73.4%) |
| Arts, Entertainment & Recreation | 6,075 (52.4%) | 5,517 (47.6%) |
| Accommodation & Food Services | 16,327 (51.3%) | 15,492 (48.7%) |
| Public Administration | 34,591 (54.2%) | 29,208 (45.8%) |
| Total | 290,472 (51.8%) | 270,277 (48.2%) |
Education in Montgomery County
School Enrollment in Montgomery County
The most common levels of schooling among the 268,437 students in Montgomery County are high school (59,672 | 22.2%), middle school (56,093 | 20.9%), and elementary school (53,082 | 19.8%).
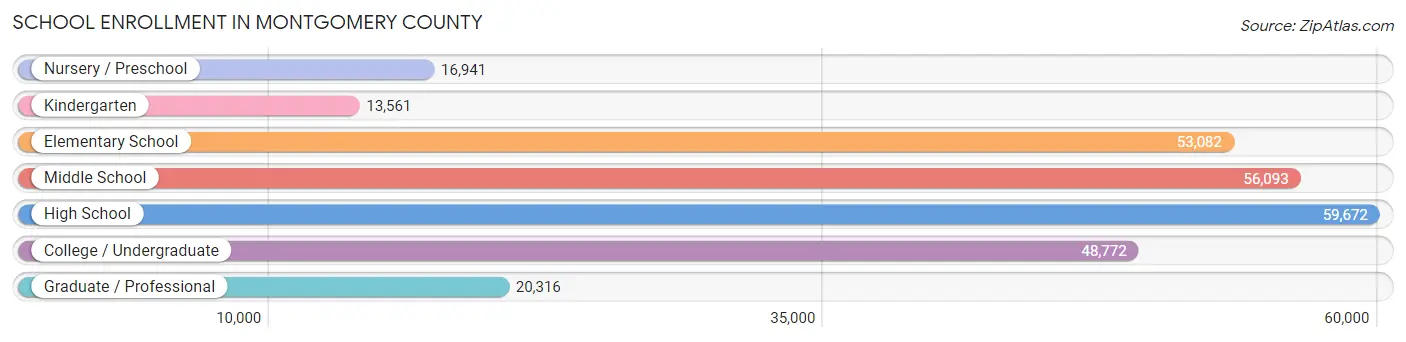
| School Level | # Students | % Students |
| Nursery / Preschool | 16,941 | 6.3% |
| Kindergarten | 13,561 | 5.1% |
| Elementary School | 53,082 | 19.8% |
| Middle School | 56,093 | 20.9% |
| High School | 59,672 | 22.2% |
| College / Undergraduate | 48,772 | 18.2% |
| Graduate / Professional | 20,316 | 7.6% |
| Total | 268,437 | 100.0% |
School Enrollment by Age by Funding Source in Montgomery County
Out of a total of 268,437 students who are enrolled in schools in Montgomery County, 60,130 (22.4%) attend a private institution, while the remaining 208,307 (77.6%) are enrolled in public schools. The age group of 3 to 4 year olds has the highest likelihood of being enrolled in private schools, with 8,507 (66.4% in the age bracket) enrolled. Conversely, the age group of 10 to 14 year olds has the lowest likelihood of being enrolled in a private school, with 58,366 (84.4% in the age bracket) attending a public institution.
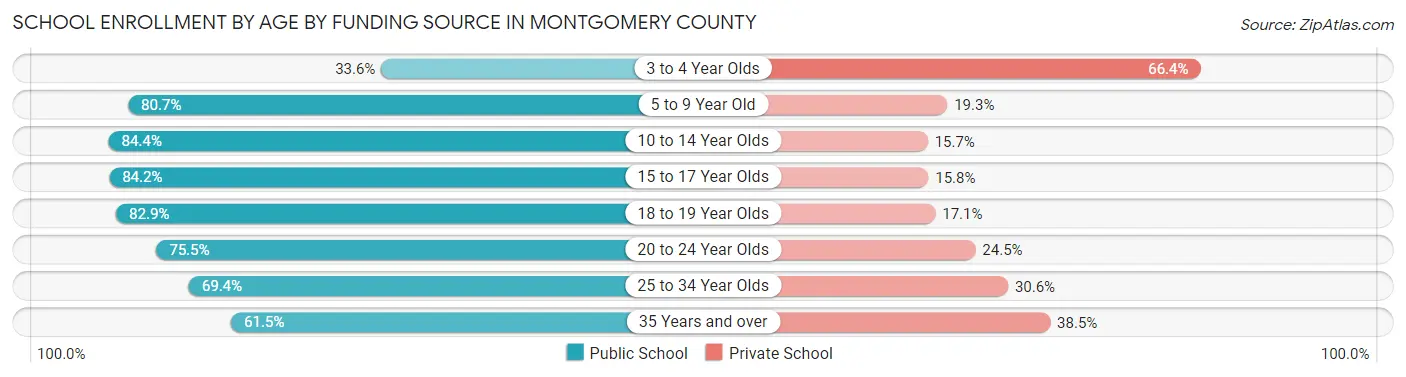
| Age Bracket | Public School | Private School |
| 3 to 4 Year Olds | 4,301 (33.6%) | 8,507 (66.4%) |
| 5 to 9 Year Old | 51,258 (80.7%) | 12,249 (19.3%) |
| 10 to 14 Year Olds | 58,366 (84.4%) | 10,829 (15.7%) |
| 15 to 17 Year Olds | 35,468 (84.2%) | 6,636 (15.8%) |
| 18 to 19 Year Olds | 16,491 (82.9%) | 3,393 (17.1%) |
| 20 to 24 Year Olds | 19,928 (75.5%) | 6,479 (24.5%) |
| 25 to 34 Year Olds | 11,762 (69.4%) | 5,186 (30.6%) |
| 35 Years and over | 10,822 (61.5%) | 6,762 (38.5%) |
| Total | 208,307 (77.6%) | 60,130 (22.4%) |
Educational Attainment by Field of Study in Montgomery County
Business (70,620 | 14.7%), social sciences (67,992 | 14.2%), engineering (42,033 | 8.8%), bio, nature & agricultural (40,687 | 8.5%), and science & technology (35,645 | 7.4%) are the most common fields of study among 478,966 individuals in Montgomery County who have obtained a bachelor's degree or higher.
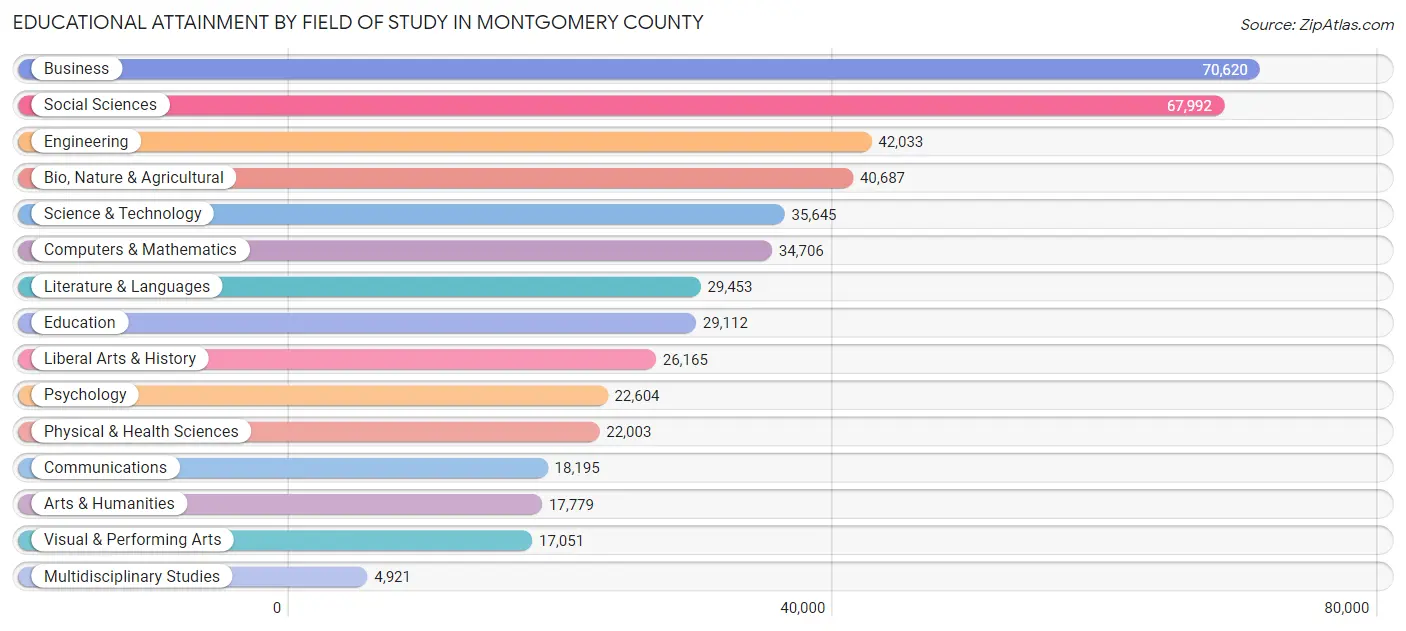
| Field of Study | # Graduates | % Graduates |
| Computers & Mathematics | 34,706 | 7.2% |
| Bio, Nature & Agricultural | 40,687 | 8.5% |
| Physical & Health Sciences | 22,003 | 4.6% |
| Psychology | 22,604 | 4.7% |
| Social Sciences | 67,992 | 14.2% |
| Engineering | 42,033 | 8.8% |
| Multidisciplinary Studies | 4,921 | 1.0% |
| Science & Technology | 35,645 | 7.4% |
| Business | 70,620 | 14.7% |
| Education | 29,112 | 6.1% |
| Literature & Languages | 29,453 | 6.1% |
| Liberal Arts & History | 26,165 | 5.5% |
| Visual & Performing Arts | 17,051 | 3.6% |
| Communications | 18,195 | 3.8% |
| Arts & Humanities | 17,779 | 3.7% |
| Total | 478,966 | 100.0% |
Transportation & Commute in Montgomery County
Vehicle Availability by Sex in Montgomery County
The most prevalent vehicle ownership categories in Montgomery County are males with 2 vehicles (124,986, accounting for 43.6%) and females with 2 vehicles (109,612, making up 47.3%).
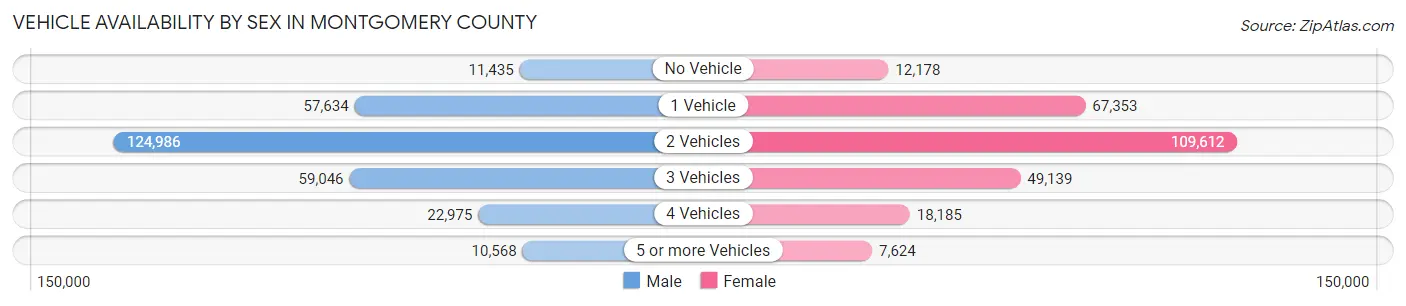
| Vehicles Available | Male | Female |
| No Vehicle | 11,435 (4.0%) | 12,178 (4.6%) |
| 1 Vehicle | 57,634 (20.1%) | 67,353 (25.5%) |
| 2 Vehicles | 124,986 (43.6%) | 109,612 (41.5%) |
| 3 Vehicles | 59,046 (20.6%) | 49,139 (18.6%) |
| 4 Vehicles | 22,975 (8.0%) | 18,185 (6.9%) |
| 5 or more Vehicles | 10,568 (3.7%) | 7,624 (2.9%) |
| Total | 286,644 (100.0%) | 264,091 (100.0%) |
Commute Time in Montgomery County
The most frequently occuring commute durations in Montgomery County are 30 to 34 minutes (70,821 commuters, 16.5%), 45 to 59 minutes (57,098 commuters, 13.3%), and 20 to 24 minutes (52,023 commuters, 12.1%).
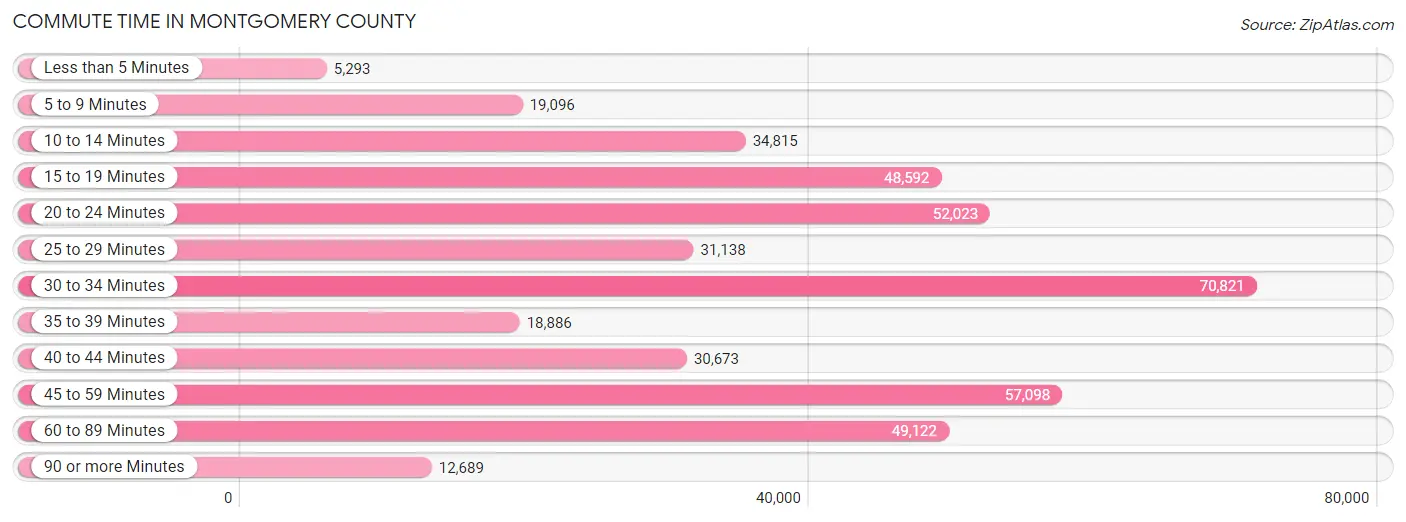
| Commute Time | # Commuters | % Commuters |
| Less than 5 Minutes | 5,293 | 1.2% |
| 5 to 9 Minutes | 19,096 | 4.4% |
| 10 to 14 Minutes | 34,815 | 8.1% |
| 15 to 19 Minutes | 48,592 | 11.3% |
| 20 to 24 Minutes | 52,023 | 12.1% |
| 25 to 29 Minutes | 31,138 | 7.2% |
| 30 to 34 Minutes | 70,821 | 16.5% |
| 35 to 39 Minutes | 18,886 | 4.4% |
| 40 to 44 Minutes | 30,673 | 7.1% |
| 45 to 59 Minutes | 57,098 | 13.3% |
| 60 to 89 Minutes | 49,122 | 11.4% |
| 90 or more Minutes | 12,689 | 2.9% |
Commute Time by Sex in Montgomery County
The most common commute times in Montgomery County are 30 to 34 minutes (38,183 commuters, 16.8%) for males and 30 to 34 minutes (32,638 commuters, 16.1%) for females.
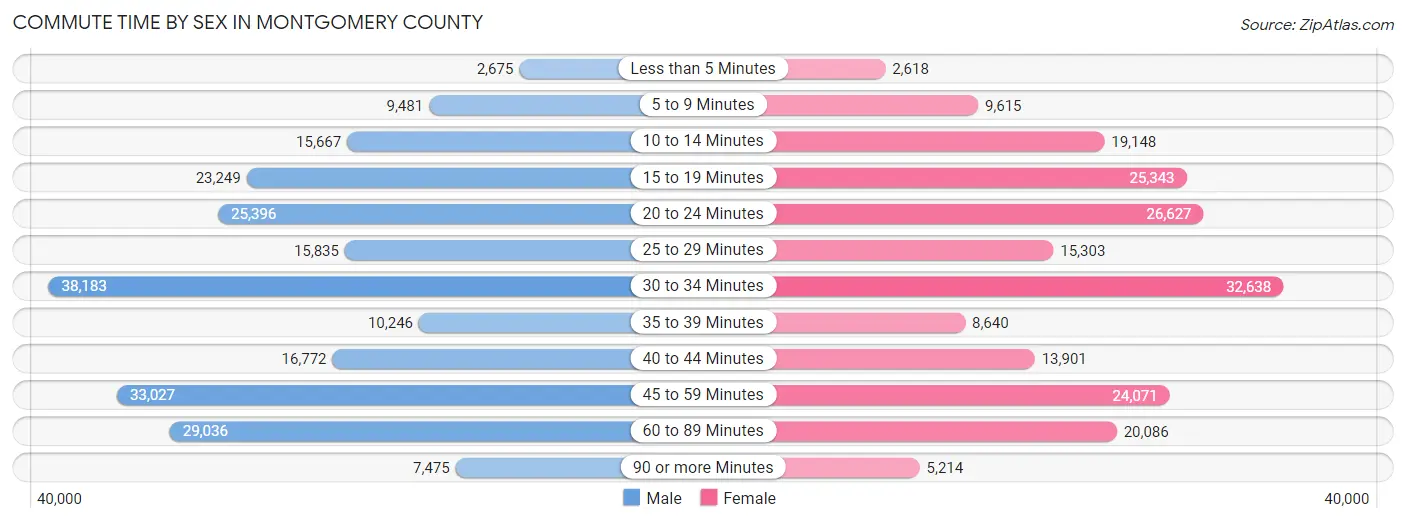
| Commute Time | Male | Female |
| Less than 5 Minutes | 2,675 (1.2%) | 2,618 (1.3%) |
| 5 to 9 Minutes | 9,481 (4.2%) | 9,615 (4.7%) |
| 10 to 14 Minutes | 15,667 (6.9%) | 19,148 (9.4%) |
| 15 to 19 Minutes | 23,249 (10.2%) | 25,343 (12.5%) |
| 20 to 24 Minutes | 25,396 (11.2%) | 26,627 (13.1%) |
| 25 to 29 Minutes | 15,835 (7.0%) | 15,303 (7.5%) |
| 30 to 34 Minutes | 38,183 (16.8%) | 32,638 (16.1%) |
| 35 to 39 Minutes | 10,246 (4.5%) | 8,640 (4.3%) |
| 40 to 44 Minutes | 16,772 (7.4%) | 13,901 (6.8%) |
| 45 to 59 Minutes | 33,027 (14.5%) | 24,071 (11.8%) |
| 60 to 89 Minutes | 29,036 (12.8%) | 20,086 (9.9%) |
| 90 or more Minutes | 7,475 (3.3%) | 5,214 (2.6%) |
Time of Departure to Work by Sex in Montgomery County
The most frequent times of departure to work in Montgomery County are 8:00 AM to 8:29 AM (32,258, 14.2%) for males and 8:00 AM to 8:29 AM (31,850, 15.7%) for females.
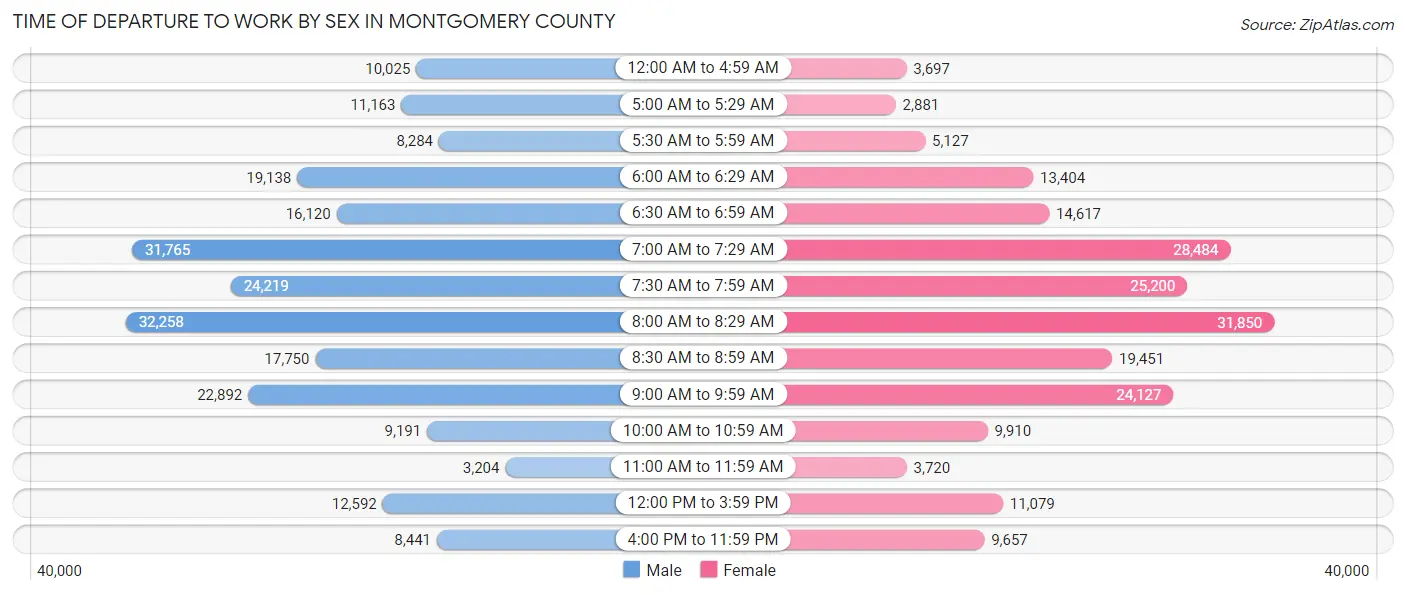
| Time of Departure | Male | Female |
| 12:00 AM to 4:59 AM | 10,025 (4.4%) | 3,697 (1.8%) |
| 5:00 AM to 5:29 AM | 11,163 (4.9%) | 2,881 (1.4%) |
| 5:30 AM to 5:59 AM | 8,284 (3.6%) | 5,127 (2.5%) |
| 6:00 AM to 6:29 AM | 19,138 (8.4%) | 13,404 (6.6%) |
| 6:30 AM to 6:59 AM | 16,120 (7.1%) | 14,617 (7.2%) |
| 7:00 AM to 7:29 AM | 31,765 (14.0%) | 28,484 (14.0%) |
| 7:30 AM to 7:59 AM | 24,219 (10.7%) | 25,200 (12.4%) |
| 8:00 AM to 8:29 AM | 32,258 (14.2%) | 31,850 (15.7%) |
| 8:30 AM to 8:59 AM | 17,750 (7.8%) | 19,451 (9.6%) |
| 9:00 AM to 9:59 AM | 22,892 (10.1%) | 24,127 (11.9%) |
| 10:00 AM to 10:59 AM | 9,191 (4.1%) | 9,910 (4.9%) |
| 11:00 AM to 11:59 AM | 3,204 (1.4%) | 3,720 (1.8%) |
| 12:00 PM to 3:59 PM | 12,592 (5.6%) | 11,079 (5.4%) |
| 4:00 PM to 11:59 PM | 8,441 (3.7%) | 9,657 (4.8%) |
| Total | 227,042 (100.0%) | 203,204 (100.0%) |
Housing Occupancy in Montgomery County
Occupancy by Ownership in Montgomery County
Of the total 385,284 dwellings in Montgomery County, owner-occupied units account for 252,457 (65.5%), while renter-occupied units make up 132,827 (34.5%).
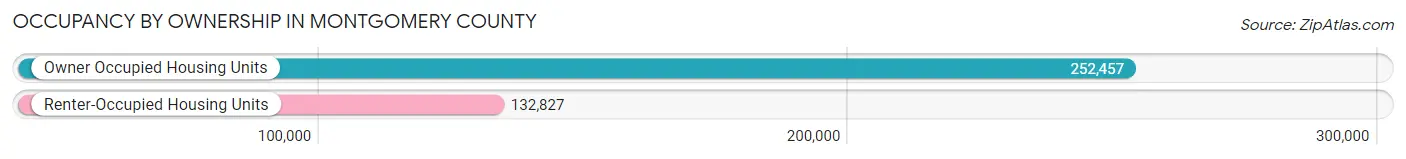
| Occupancy | # Housing Units | % Housing Units |
| Owner Occupied Housing Units | 252,457 | 65.5% |
| Renter-Occupied Housing Units | 132,827 | 34.5% |
| Total Occupied Housing Units | 385,284 | 100.0% |
Occupancy by Household Size in Montgomery County
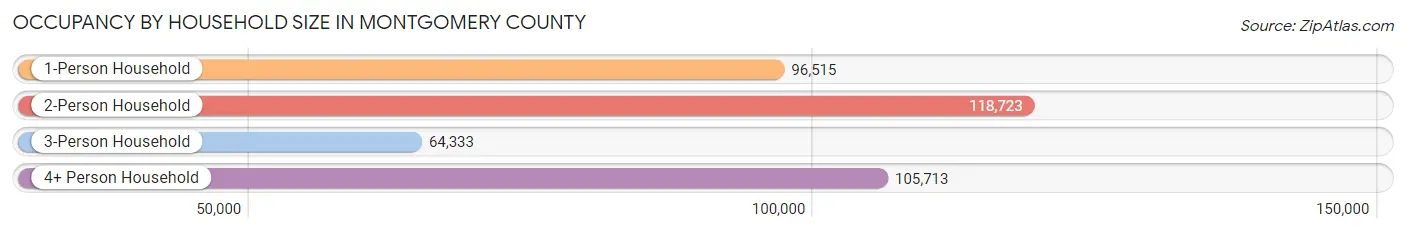
| Household Size | # Housing Units | % Housing Units |
| 1-Person Household | 96,515 | 25.1% |
| 2-Person Household | 118,723 | 30.8% |
| 3-Person Household | 64,333 | 16.7% |
| 4+ Person Household | 105,713 | 27.4% |
| Total Housing Units | 385,284 | 100.0% |
Occupancy by Ownership by Household Size in Montgomery County
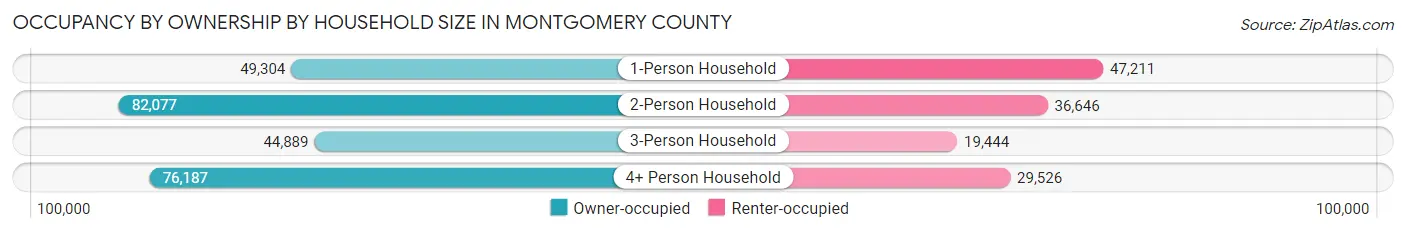
| Household Size | Owner-occupied | Renter-occupied |
| 1-Person Household | 49,304 (51.1%) | 47,211 (48.9%) |
| 2-Person Household | 82,077 (69.1%) | 36,646 (30.9%) |
| 3-Person Household | 44,889 (69.8%) | 19,444 (30.2%) |
| 4+ Person Household | 76,187 (72.1%) | 29,526 (27.9%) |
| Total Housing Units | 252,457 (65.5%) | 132,827 (34.5%) |
Occupancy by Educational Attainment in Montgomery County
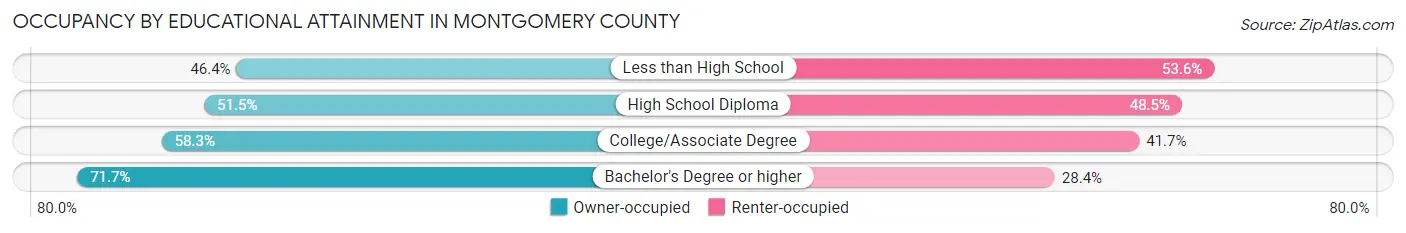
| Household Size | Owner-occupied | Renter-occupied |
| Less than High School | 11,631 (46.4%) | 13,436 (53.6%) |
| High School Diploma | 21,580 (51.5%) | 20,302 (48.5%) |
| College/Associate Degree | 38,521 (58.3%) | 27,583 (41.7%) |
| Bachelor's Degree or higher | 180,725 (71.7%) | 71,506 (28.3%) |
Occupancy by Age of Householder in Montgomery County
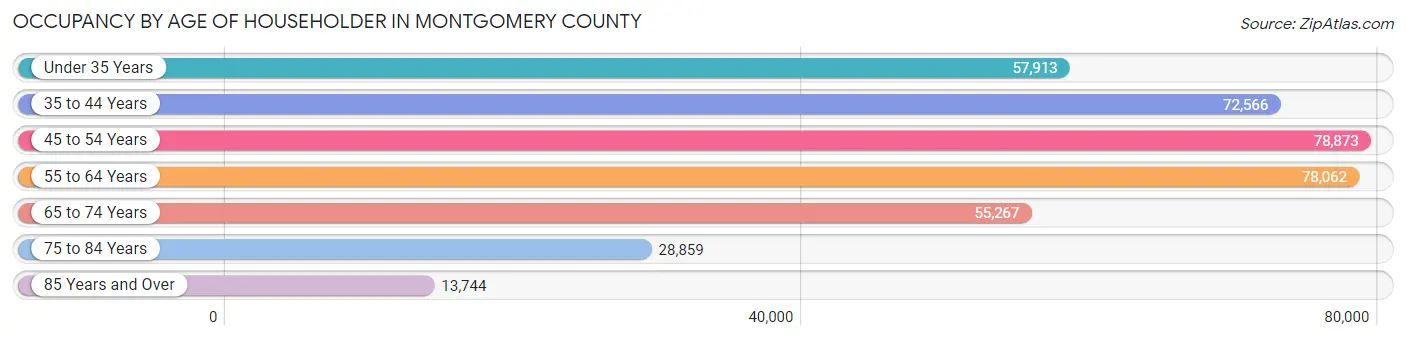
| Age Bracket | # Households | % Households |
| Under 35 Years | 57,913 | 15.0% |
| 35 to 44 Years | 72,566 | 18.8% |
| 45 to 54 Years | 78,873 | 20.5% |
| 55 to 64 Years | 78,062 | 20.3% |
| 65 to 74 Years | 55,267 | 14.3% |
| 75 to 84 Years | 28,859 | 7.5% |
| 85 Years and Over | 13,744 | 3.6% |
| Total | 385,284 | 100.0% |
Housing Finances in Montgomery County
Median Income by Occupancy in Montgomery County
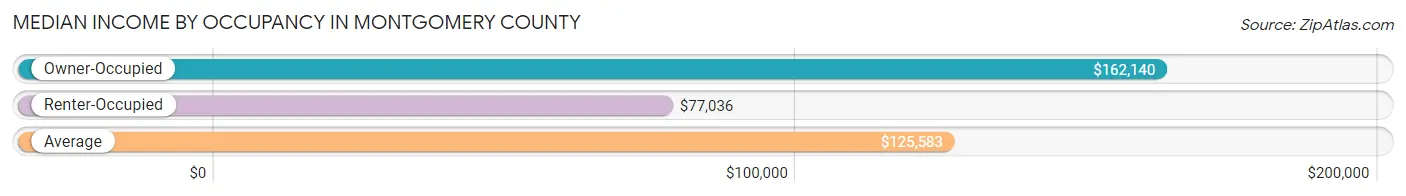
| Occupancy Type | # Households | Median Income |
| Owner-Occupied | 252,457 (65.5%) | $162,140 |
| Renter-Occupied | 132,827 (34.5%) | $77,036 |
| Average | 385,284 (100.0%) | $125,583 |
Occupancy by Householder Income Bracket in Montgomery County
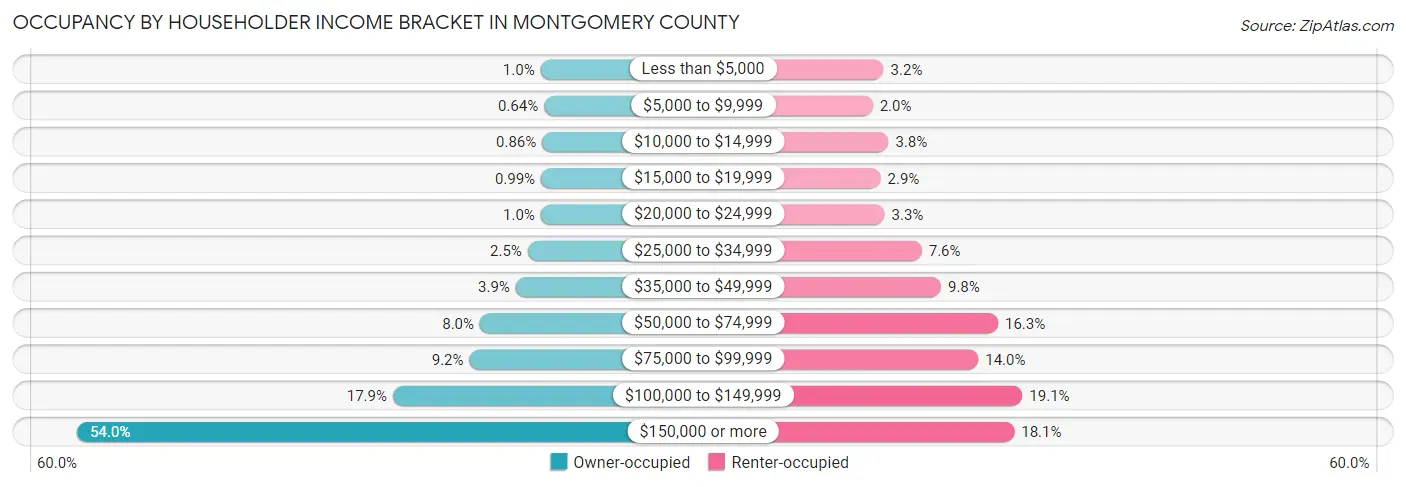
| Income Bracket | Owner-occupied | Renter-occupied |
| Less than $5,000 | 2,626 (1.0%) | 4,268 (3.2%) |
| $5,000 to $9,999 | 1,615 (0.6%) | 2,610 (2.0%) |
| $10,000 to $14,999 | 2,164 (0.9%) | 4,996 (3.8%) |
| $15,000 to $19,999 | 2,492 (1.0%) | 3,805 (2.9%) |
| $20,000 to $24,999 | 2,574 (1.0%) | 4,412 (3.3%) |
| $25,000 to $34,999 | 6,316 (2.5%) | 10,054 (7.6%) |
| $35,000 to $49,999 | 9,801 (3.9%) | 12,979 (9.8%) |
| $50,000 to $74,999 | 20,119 (8.0%) | 21,636 (16.3%) |
| $75,000 to $99,999 | 23,159 (9.2%) | 18,639 (14.0%) |
| $100,000 to $149,999 | 45,244 (17.9%) | 25,333 (19.1%) |
| $150,000 or more | 136,347 (54.0%) | 24,095 (18.1%) |
| Total | 252,457 (100.0%) | 132,827 (100.0%) |
Monthly Housing Cost Tiers in Montgomery County
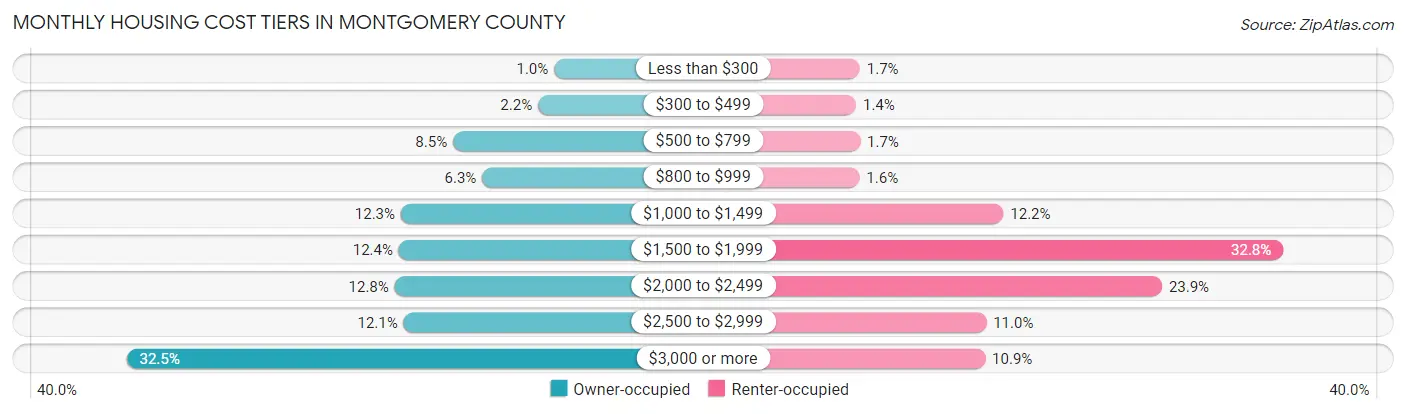
| Monthly Cost | Owner-occupied | Renter-occupied |
| Less than $300 | 2,524 (1.0%) | 2,191 (1.7%) |
| $300 to $499 | 5,517 (2.2%) | 1,815 (1.4%) |
| $500 to $799 | 21,328 (8.5%) | 2,216 (1.7%) |
| $800 to $999 | 15,906 (6.3%) | 2,149 (1.6%) |
| $1,000 to $1,499 | 31,033 (12.3%) | 16,234 (12.2%) |
| $1,500 to $1,999 | 31,418 (12.4%) | 43,600 (32.8%) |
| $2,000 to $2,499 | 32,188 (12.8%) | 31,749 (23.9%) |
| $2,500 to $2,999 | 30,532 (12.1%) | 14,553 (11.0%) |
| $3,000 or more | 82,011 (32.5%) | 14,458 (10.9%) |
| Total | 252,457 (100.0%) | 132,827 (100.0%) |
Physical Housing Characteristics in Montgomery County
Housing Structures in Montgomery County
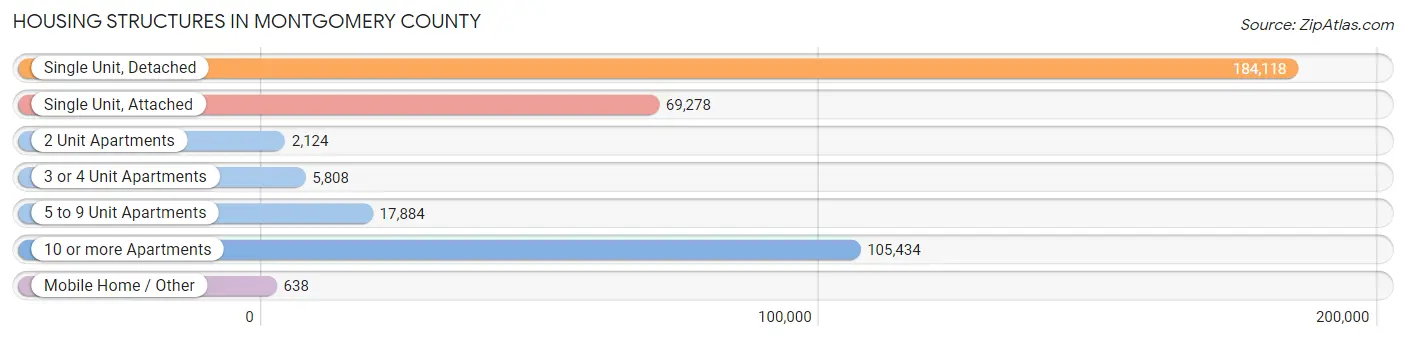
| Structure Type | # Housing Units | % Housing Units |
| Single Unit, Detached | 184,118 | 47.8% |
| Single Unit, Attached | 69,278 | 18.0% |
| 2 Unit Apartments | 2,124 | 0.5% |
| 3 or 4 Unit Apartments | 5,808 | 1.5% |
| 5 to 9 Unit Apartments | 17,884 | 4.6% |
| 10 or more Apartments | 105,434 | 27.4% |
| Mobile Home / Other | 638 | 0.2% |
| Total | 385,284 | 100.0% |
Housing Structures by Occupancy in Montgomery County
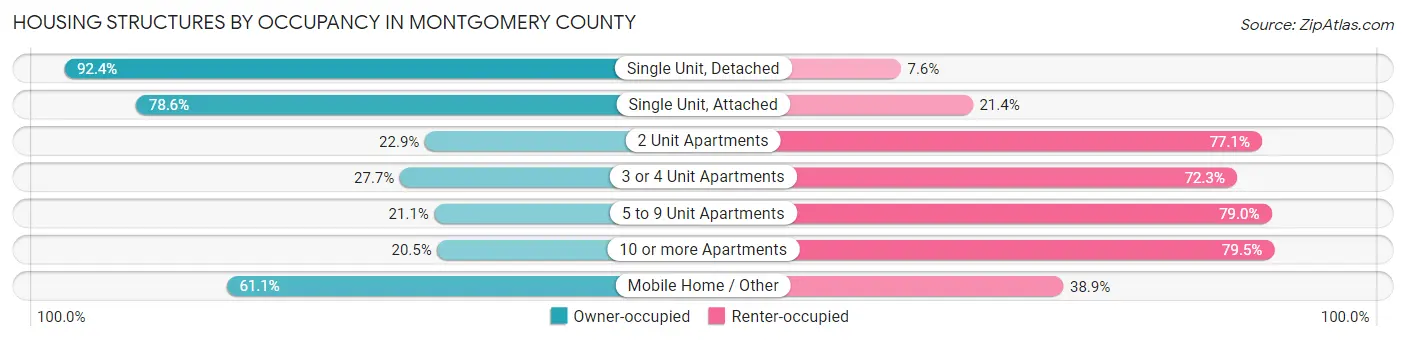
| Structure Type | Owner-occupied | Renter-occupied |
| Single Unit, Detached | 170,168 (92.4%) | 13,950 (7.6%) |
| Single Unit, Attached | 54,432 (78.6%) | 14,846 (21.4%) |
| 2 Unit Apartments | 486 (22.9%) | 1,638 (77.1%) |
| 3 or 4 Unit Apartments | 1,609 (27.7%) | 4,199 (72.3%) |
| 5 to 9 Unit Apartments | 3,765 (21.0%) | 14,119 (78.9%) |
| 10 or more Apartments | 21,607 (20.5%) | 83,827 (79.5%) |
| Mobile Home / Other | 390 (61.1%) | 248 (38.9%) |
| Total | 252,457 (65.5%) | 132,827 (34.5%) |
Housing Structures by Number of Rooms in Montgomery County
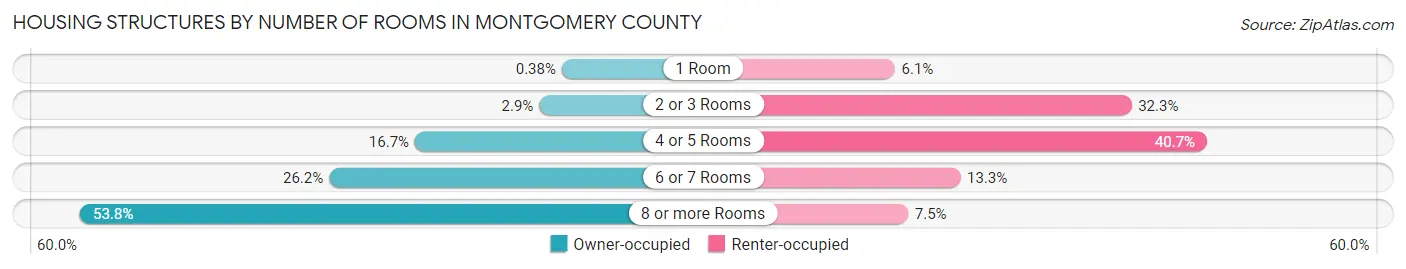
| Number of Rooms | Owner-occupied | Renter-occupied |
| 1 Room | 948 (0.4%) | 8,066 (6.1%) |
| 2 or 3 Rooms | 7,289 (2.9%) | 42,943 (32.3%) |
| 4 or 5 Rooms | 42,119 (16.7%) | 54,102 (40.7%) |
| 6 or 7 Rooms | 66,179 (26.2%) | 17,706 (13.3%) |
| 8 or more Rooms | 135,922 (53.8%) | 10,010 (7.5%) |
| Total | 252,457 (100.0%) | 132,827 (100.0%) |
Housing Structure by Heating Type in Montgomery County
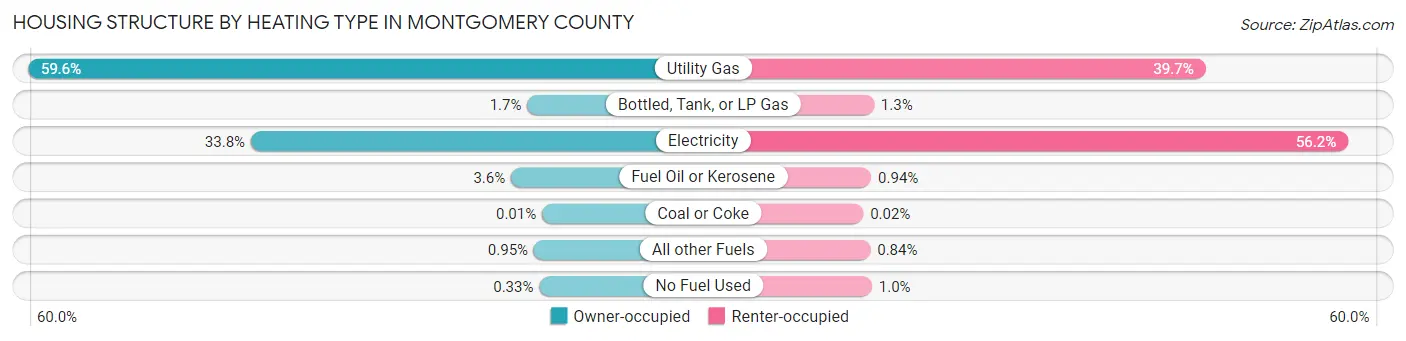
| Heating Type | Owner-occupied | Renter-occupied |
| Utility Gas | 150,543 (59.6%) | 52,733 (39.7%) |
| Bottled, Tank, or LP Gas | 4,352 (1.7%) | 1,673 (1.3%) |
| Electricity | 85,218 (33.8%) | 74,673 (56.2%) |
| Fuel Oil or Kerosene | 9,084 (3.6%) | 1,254 (0.9%) |
| Coal or Coke | 26 (0.0%) | 22 (0.0%) |
| All other Fuels | 2,406 (0.9%) | 1,113 (0.8%) |
| No Fuel Used | 828 (0.3%) | 1,359 (1.0%) |
| Total | 252,457 (100.0%) | 132,827 (100.0%) |
Household Vehicle Usage in Montgomery County
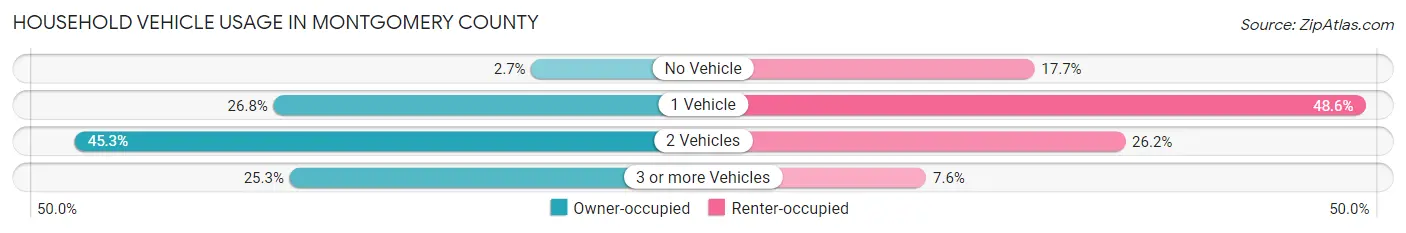
| Vehicles per Household | Owner-occupied | Renter-occupied |
| No Vehicle | 6,795 (2.7%) | 23,497 (17.7%) |
| 1 Vehicle | 67,531 (26.8%) | 64,519 (48.6%) |
| 2 Vehicles | 114,397 (45.3%) | 34,742 (26.2%) |
| 3 or more Vehicles | 63,734 (25.3%) | 10,069 (7.6%) |
| Total | 252,457 (100.0%) | 132,827 (100.0%) |
Real Estate & Mortgages in Montgomery County
Real Estate and Mortgage Overview in Montgomery County
| Characteristic | Without Mortgage | With Mortgage |
| Housing Units | 72,611 | 179,846 |
| Median Property Value | $586,300 | $589,900 |
| Median Household Income | $130,888 | $104,589 |
| Monthly Housing Costs | $924 | $80,642 |
| Real Estate Taxes | $5,305 | $2,957 |
Property Value by Mortgage Status in Montgomery County
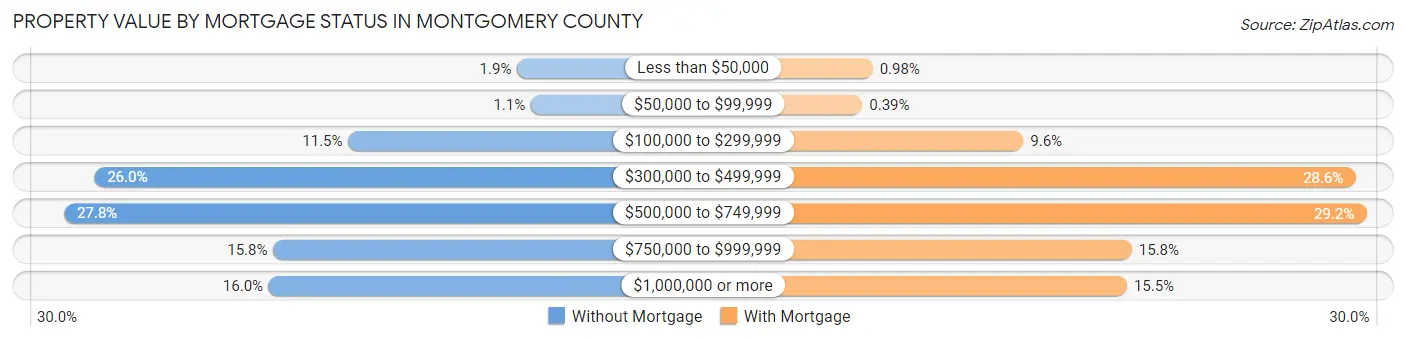
| Property Value | Without Mortgage | With Mortgage |
| Less than $50,000 | 1,341 (1.8%) | 1,765 (1.0%) |
| $50,000 to $99,999 | 767 (1.1%) | 710 (0.4%) |
| $100,000 to $299,999 | 8,353 (11.5%) | 17,245 (9.6%) |
| $300,000 to $499,999 | 18,893 (26.0%) | 51,339 (28.5%) |
| $500,000 to $749,999 | 20,147 (27.8%) | 52,485 (29.2%) |
| $750,000 to $999,999 | 11,465 (15.8%) | 28,400 (15.8%) |
| $1,000,000 or more | 11,645 (16.0%) | 27,902 (15.5%) |
| Total | 72,611 (100.0%) | 179,846 (100.0%) |
Household Income by Mortgage Status in Montgomery County
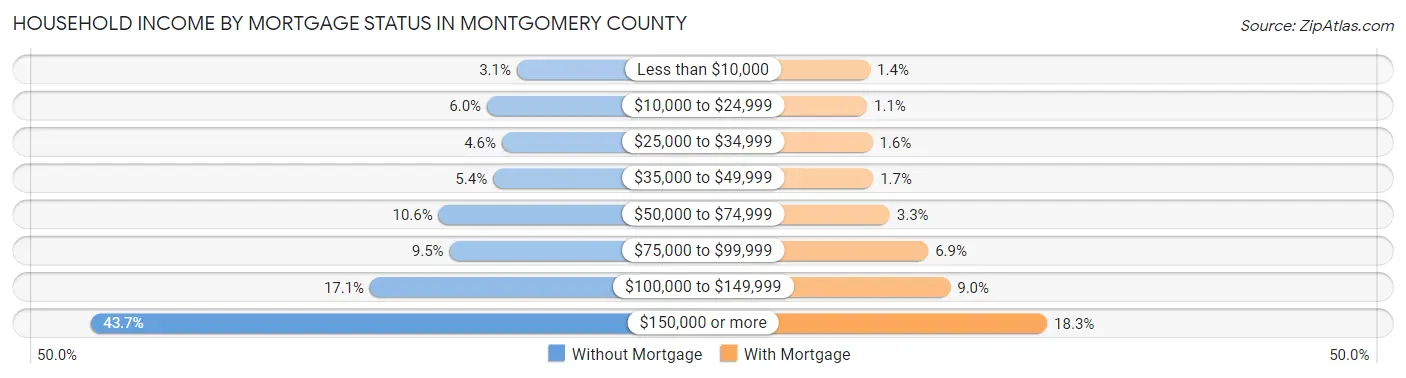
| Household Income | Without Mortgage | With Mortgage |
| Less than $10,000 | 2,262 (3.1%) | 2,494 (1.4%) |
| $10,000 to $24,999 | 4,338 (6.0%) | 1,979 (1.1%) |
| $25,000 to $34,999 | 3,302 (4.5%) | 2,892 (1.6%) |
| $35,000 to $49,999 | 3,916 (5.4%) | 3,014 (1.7%) |
| $50,000 to $74,999 | 7,681 (10.6%) | 5,885 (3.3%) |
| $75,000 to $99,999 | 6,928 (9.5%) | 12,438 (6.9%) |
| $100,000 to $149,999 | 12,426 (17.1%) | 16,231 (9.0%) |
| $150,000 or more | 31,758 (43.7%) | 32,818 (18.2%) |
| Total | 72,611 (100.0%) | 179,846 (100.0%) |
Property Value to Household Income Ratio in Montgomery County
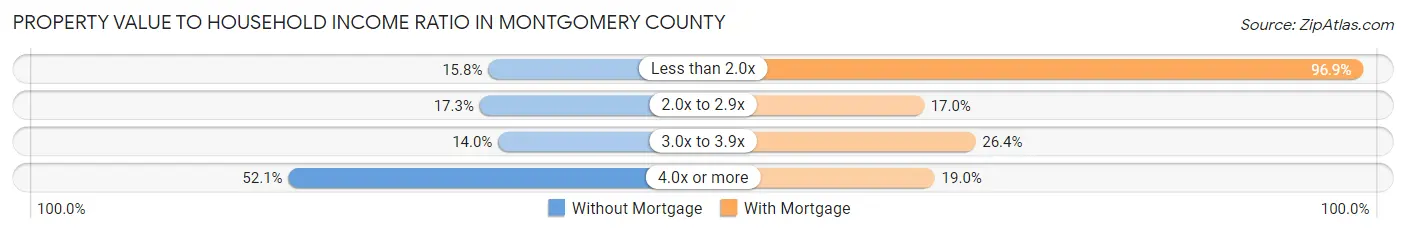
| Value-to-Income Ratio | Without Mortgage | With Mortgage |
| Less than 2.0x | 11,471 (15.8%) | 174,205 (96.9%) |
| 2.0x to 2.9x | 12,594 (17.3%) | 30,621 (17.0%) |
| 3.0x to 3.9x | 10,155 (14.0%) | 47,485 (26.4%) |
| 4.0x or more | 37,821 (52.1%) | 34,212 (19.0%) |
| Total | 72,611 (100.0%) | 179,846 (100.0%) |
Real Estate Taxes by Mortgage Status in Montgomery County
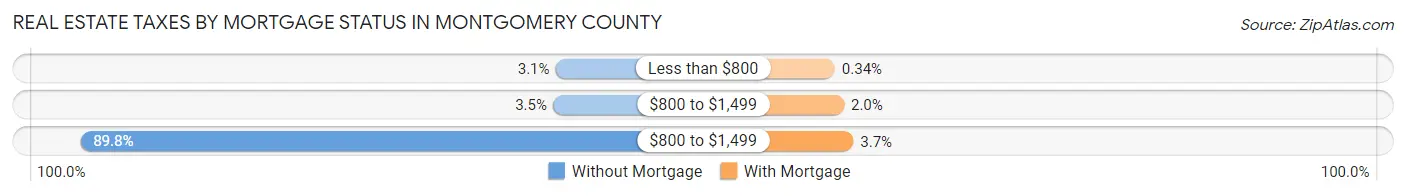
| Property Taxes | Without Mortgage | With Mortgage |
| Less than $800 | 2,219 (3.1%) | 620 (0.3%) |
| $800 to $1,499 | 2,560 (3.5%) | 3,608 (2.0%) |
| $800 to $1,499 | 65,224 (89.8%) | 6,679 (3.7%) |
| Total | 72,611 (100.0%) | 179,846 (100.0%) |
Health & Disability in Montgomery County
Health Insurance Coverage by Age in Montgomery County
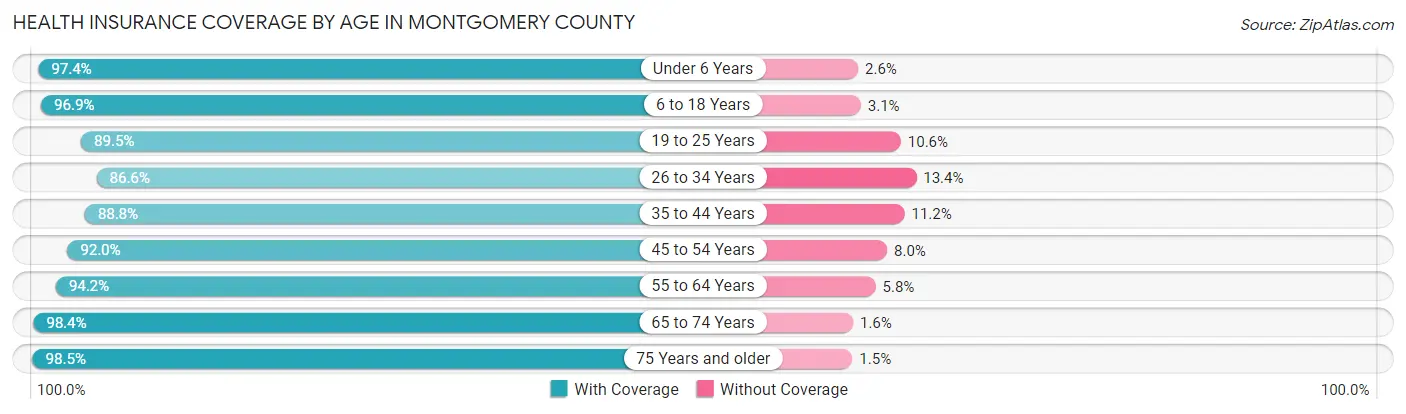
| Age Bracket | With Coverage | Without Coverage |
| Under 6 Years | 72,520 (97.4%) | 1,917 (2.6%) |
| 6 to 18 Years | 175,424 (96.9%) | 5,601 (3.1%) |
| 19 to 25 Years | 73,312 (89.4%) | 8,649 (10.5%) |
| 26 to 34 Years | 100,574 (86.6%) | 15,608 (13.4%) |
| 35 to 44 Years | 129,020 (88.8%) | 16,344 (11.2%) |
| 45 to 54 Years | 132,237 (92.0%) | 11,470 (8.0%) |
| 55 to 64 Years | 129,973 (94.2%) | 8,067 (5.8%) |
| 65 to 74 Years | 94,586 (98.4%) | 1,564 (1.6%) |
| 75 Years and older | 69,780 (98.5%) | 1,070 (1.5%) |
| Total | 977,426 (93.3%) | 70,290 (6.7%) |
Health Insurance Coverage by Citizenship Status in Montgomery County
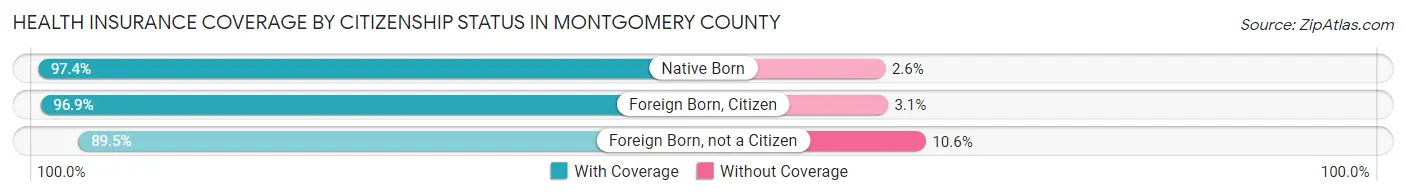
| Citizenship Status | With Coverage | Without Coverage |
| Native Born | 72,520 (97.4%) | 1,917 (2.6%) |
| Foreign Born, Citizen | 175,424 (96.9%) | 5,601 (3.1%) |
| Foreign Born, not a Citizen | 73,312 (89.4%) | 8,649 (10.5%) |
Health Insurance Coverage by Household Income in Montgomery County
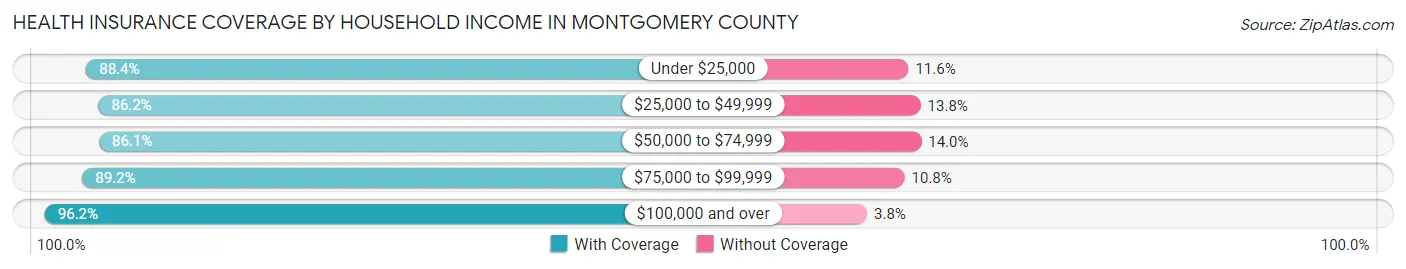
| Household Income | With Coverage | Without Coverage |
| Under $25,000 | 50,620 (88.4%) | 6,619 (11.6%) |
| $25,000 to $49,999 | 75,660 (86.2%) | 12,157 (13.8%) |
| $50,000 to $74,999 | 84,574 (86.1%) | 13,714 (14.0%) |
| $75,000 to $99,999 | 91,951 (89.2%) | 11,172 (10.8%) |
| $100,000 and over | 671,985 (96.2%) | 26,530 (3.8%) |
Public vs Private Health Insurance Coverage by Age in Montgomery County
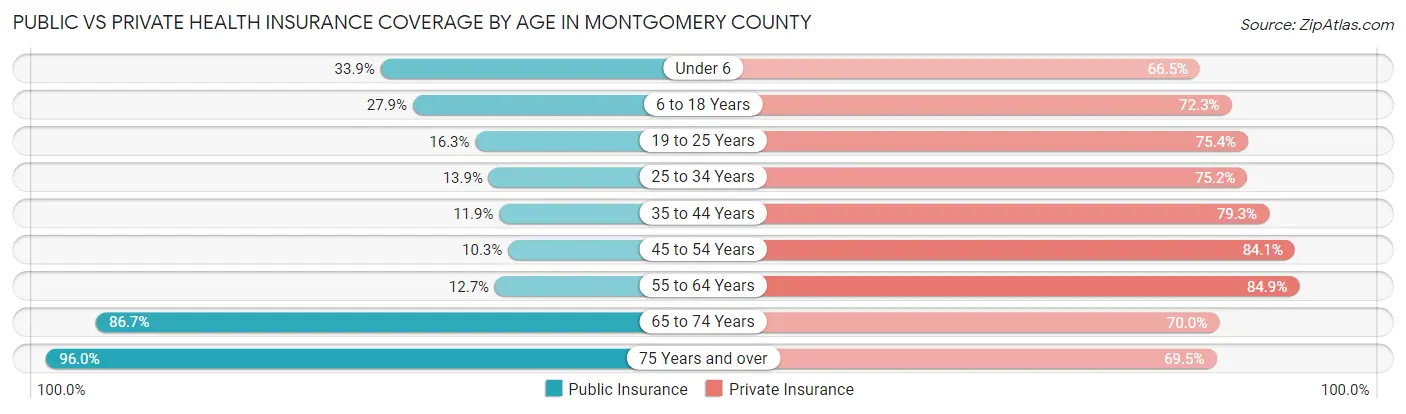
| Age Bracket | Public Insurance | Private Insurance |
| Under 6 | 25,249 (33.9%) | 49,469 (66.5%) |
| 6 to 18 Years | 50,557 (27.9%) | 130,901 (72.3%) |
| 19 to 25 Years | 13,387 (16.3%) | 61,776 (75.4%) |
| 25 to 34 Years | 16,097 (13.9%) | 87,420 (75.2%) |
| 35 to 44 Years | 17,285 (11.9%) | 115,240 (79.3%) |
| 45 to 54 Years | 14,723 (10.2%) | 120,818 (84.1%) |
| 55 to 64 Years | 17,532 (12.7%) | 117,156 (84.9%) |
| 65 to 74 Years | 83,384 (86.7%) | 67,328 (70.0%) |
| 75 Years and over | 67,998 (96.0%) | 49,235 (69.5%) |
| Total | 306,212 (29.2%) | 799,343 (76.3%) |
Disability Status by Sex by Age in Montgomery County
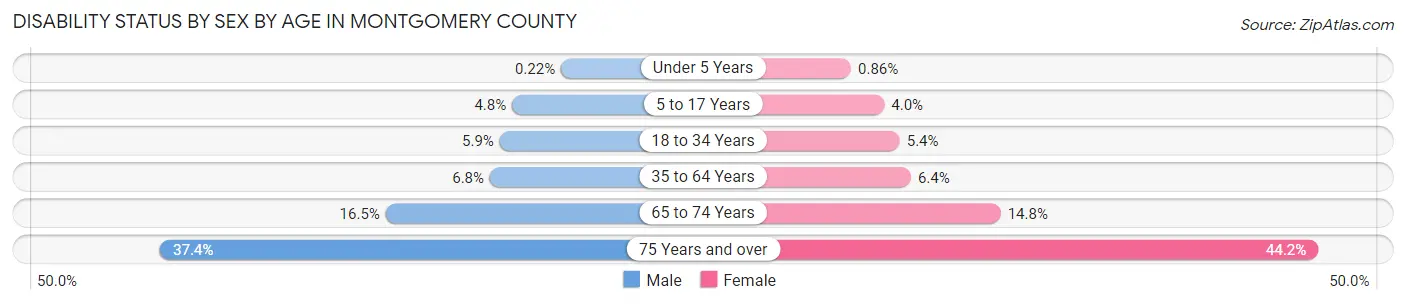
| Age Bracket | Male | Female |
| Under 5 Years | 69 (0.2%) | 261 (0.9%) |
| 5 to 17 Years | 4,401 (4.8%) | 3,449 (4.0%) |
| 18 to 34 Years | 6,256 (5.9%) | 5,686 (5.4%) |
| 35 to 64 Years | 14,151 (6.8%) | 14,096 (6.4%) |
| 65 to 74 Years | 7,352 (16.5%) | 7,605 (14.7%) |
| 75 Years and over | 10,776 (37.4%) | 18,584 (44.2%) |
Disability Class by Sex by Age in Montgomery County
Disability Class: Hearing Difficulty
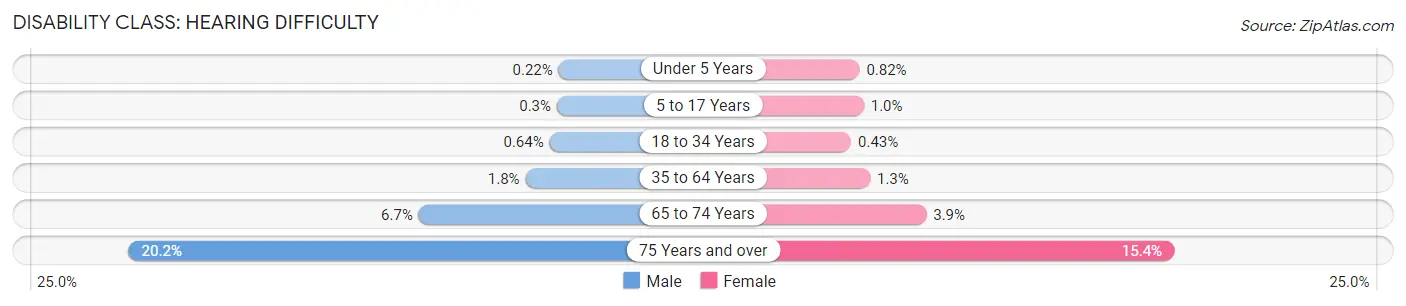
| Age Bracket | Male | Female |
| Under 5 Years | 69 (0.2%) | 251 (0.8%) |
| 5 to 17 Years | 274 (0.3%) | 891 (1.0%) |
| 18 to 34 Years | 675 (0.6%) | 459 (0.4%) |
| 35 to 64 Years | 3,654 (1.8%) | 2,889 (1.3%) |
| 65 to 74 Years | 2,993 (6.7%) | 2,023 (3.9%) |
| 75 Years and over | 5,810 (20.2%) | 6,481 (15.4%) |
Disability Class: Vision Difficulty
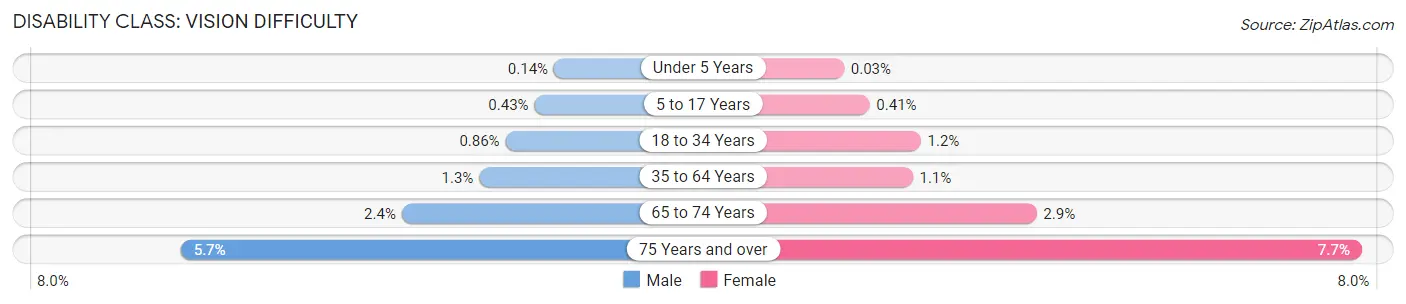
| Age Bracket | Male | Female |
| Under 5 Years | 43 (0.1%) | 10 (0.0%) |
| 5 to 17 Years | 395 (0.4%) | 361 (0.4%) |
| 18 to 34 Years | 909 (0.9%) | 1,234 (1.2%) |
| 35 to 64 Years | 2,603 (1.3%) | 2,316 (1.1%) |
| 65 to 74 Years | 1,072 (2.4%) | 1,490 (2.9%) |
| 75 Years and over | 1,636 (5.7%) | 3,248 (7.7%) |
Disability Class: Cognitive Difficulty
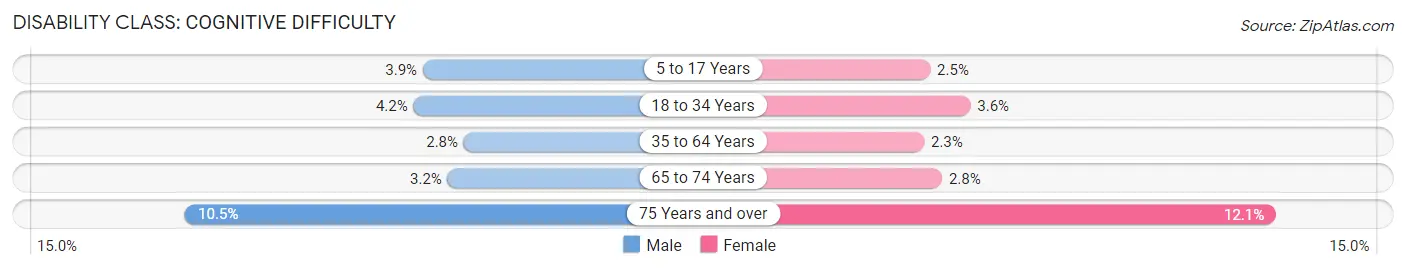
| Age Bracket | Male | Female |
| 5 to 17 Years | 3,622 (3.9%) | 2,152 (2.5%) |
| 18 to 34 Years | 4,417 (4.2%) | 3,780 (3.6%) |
| 35 to 64 Years | 5,751 (2.8%) | 5,024 (2.3%) |
| 65 to 74 Years | 1,435 (3.2%) | 1,437 (2.8%) |
| 75 Years and over | 3,033 (10.5%) | 5,083 (12.1%) |
Disability Class: Ambulatory Difficulty
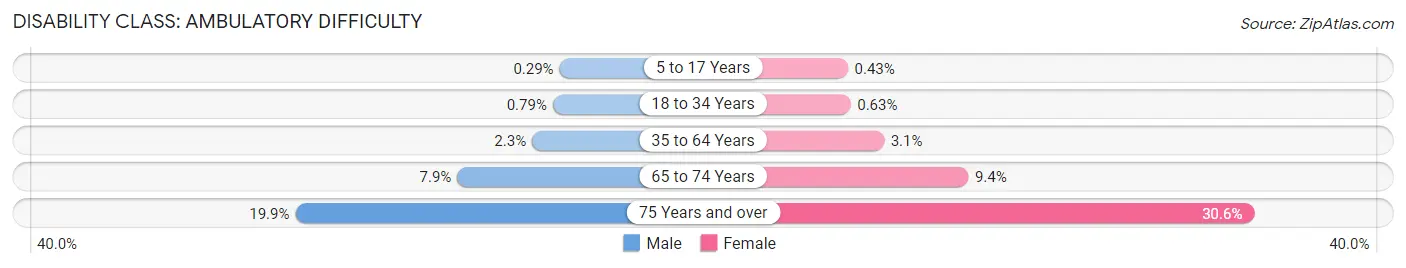
| Age Bracket | Male | Female |
| 5 to 17 Years | 265 (0.3%) | 375 (0.4%) |
| 18 to 34 Years | 840 (0.8%) | 664 (0.6%) |
| 35 to 64 Years | 4,825 (2.3%) | 6,837 (3.1%) |
| 65 to 74 Years | 3,512 (7.9%) | 4,829 (9.4%) |
| 75 Years and over | 5,731 (19.9%) | 12,877 (30.6%) |
Disability Class: Self-Care Difficulty
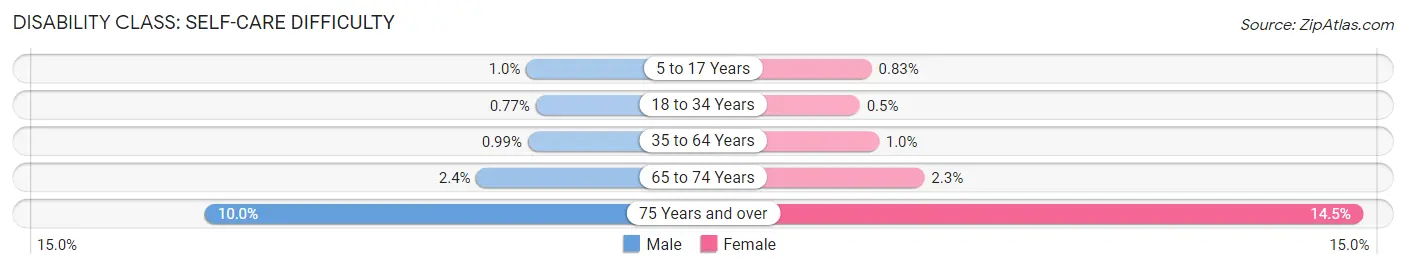
| Age Bracket | Male | Female |
| 5 to 17 Years | 951 (1.0%) | 726 (0.8%) |
| 18 to 34 Years | 814 (0.8%) | 532 (0.5%) |
| 35 to 64 Years | 2,046 (1.0%) | 2,255 (1.0%) |
| 65 to 74 Years | 1,081 (2.4%) | 1,187 (2.3%) |
| 75 Years and over | 2,874 (10.0%) | 6,099 (14.5%) |
Technology Access in Montgomery County
Computing Device Access in Montgomery County
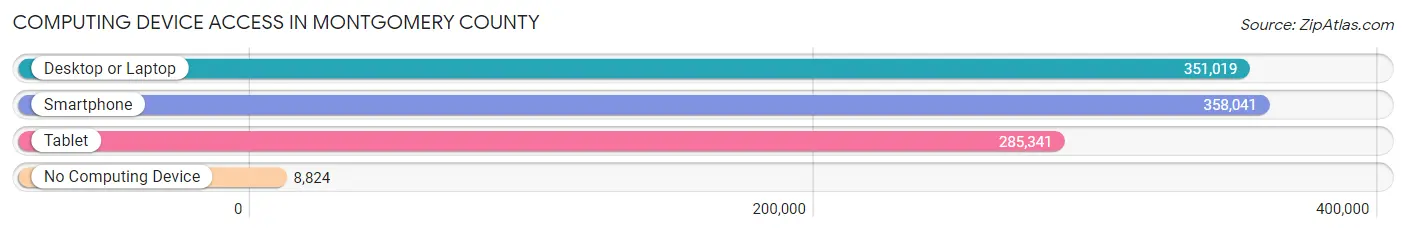
| Device Type | # Households | % Households |
| Desktop or Laptop | 351,019 | 91.1% |
| Smartphone | 358,041 | 92.9% |
| Tablet | 285,341 | 74.1% |
| No Computing Device | 8,824 | 2.3% |
| Total | 385,284 | 100.0% |
Internet Access in Montgomery County
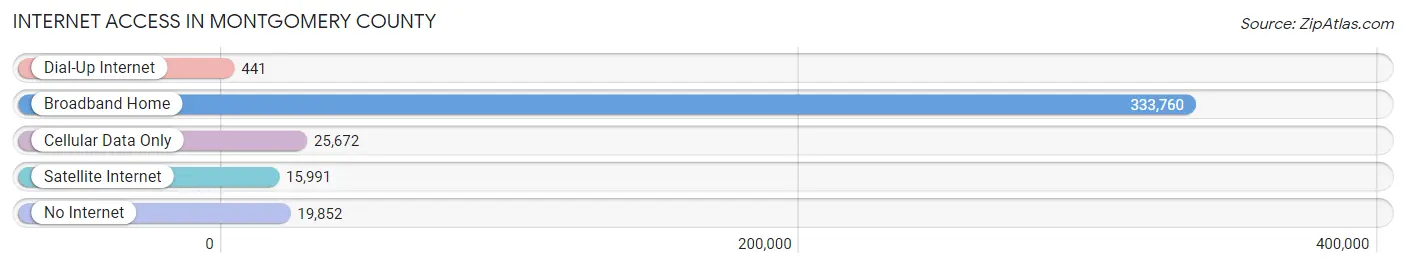
| Internet Type | # Households | % Households |
| Dial-Up Internet | 441 | 0.1% |
| Broadband Home | 333,760 | 86.6% |
| Cellular Data Only | 25,672 | 6.7% |
| Satellite Internet | 15,991 | 4.2% |
| No Internet | 19,852 | 5.1% |
| Total | 385,284 | 100.0% |
Montgomery County Summary
Montgomery County, Maryland is located in the central part of the state, just north of Washington, D.C. It is the most populous county in Maryland, with a population of 1,050,688 as of the 2019 U.S. Census. Montgomery County is home to many of the nation’s most affluent communities, and is considered one of the most affluent counties in the United States.
Geography
Montgomery County is located in the Piedmont region of Maryland, and is bordered by Frederick County to the north, Howard County to the east, Prince George’s County to the south, and Washington, D.C. to the west. The county is divided into five distinct regions: the Potomac River Valley, the Central Plateau, the Eastern Plateau, the Western Plateau, and the Southern Plateau. The county is home to several major rivers, including the Potomac River, the Anacostia River, and the Patuxent River. The county is also home to several major parks, including Rock Creek Park, Great Falls Park, and Seneca Creek State Park.
Economy
Montgomery County is home to a diverse and vibrant economy. The county is home to several major employers, including the National Institutes of Health, the U.S. Department of Health and Human Services, and the U.S. Department of Defense. The county is also home to several major corporations, including Marriott International, Lockheed Martin, and Discovery Communications. The county is also home to several major universities, including the University of Maryland, Johns Hopkins University, and George Washington University.
Demographics
As of the 2019 U.S. Census, Montgomery County had a population of 1,050,688. The population is racially and ethnically diverse, with the largest racial/ethnic groups being White (54.2%), Black or African American (20.3%), Asian (14.2%), and Hispanic or Latino (10.2%). The median household income in the county is $109,844, and the median home value is $451,400.
Montgomery County is home to a variety of religious faiths, with the largest being Christianity (48.2%), followed by Judaism (14.2%), Islam (4.2%), and Hinduism (2.2%). The county is also home to a variety of cultural attractions, including the Strathmore Music Center, the National Museum of Health and Medicine, and the Montgomery County Agricultural Fair.
Montgomery County is a vibrant and diverse county, with a strong economy and a variety of cultural attractions. The county is home to many of the nation’s most affluent communities, and is considered one of the most affluent counties in the United States. The county is home to a variety of religious faiths, and is a great place to live, work, and play.
Common Questions
What is the Total Population of Montgomery County?
Total Population of Montgomery County is 1,056,910.
What is the Total Male Population of Montgomery County?
Total Male Population of Montgomery County is 515,682.
What is the Total Female Population of Montgomery County?
Total Female Population of Montgomery County is 541,228.
What is the Ratio of Males per 100 Females in Montgomery County?
There are 95.28 Males per 100 Females in Montgomery County.
What is the Ratio of Females per 100 Males in Montgomery County?
There are 104.95 Females per 100 Males in Montgomery County.
What is the Median Population Age in Montgomery County?
Median Population Age in Montgomery County is 39.8 Years.
What is the Average Family Size in Montgomery County
Average Family Size in Montgomery County is 3.3 People.
What is the Average Household Size in Montgomery County
Average Household Size in Montgomery County is 2.7 People.
What is Per Capita Income in Montgomery County?
Per Capita income in Montgomery County is $64,126.
What is the Median Family Income in Montgomery County?
Median Family Income in Montgomery County is $152,137.
What is the Median Household income in Montgomery County?
Median Household Income in Montgomery County is $125,583.
What is Income or Wage Gap in Montgomery County?
Income or Wage Gap in Montgomery County is 24.0%.
Women in Montgomery County earn 76.0 cents for every dollar earned by a man.
What is Family Income Deficit in Montgomery County?
Family Income Deficit in Montgomery County is $11,281.
Families that are below poverty line in Montgomery County earn $11,281 less on average than the poverty threshold level.
What is Inequality or Gini Index in Montgomery County?
Inequality or Gini Index in Montgomery County is 0.47.
How Large is the Labor Force in Montgomery County?
There are 593,035 People in the Labor Forcein in Montgomery County.
What is the Percentage of People in the Labor Force in Montgomery County?
70.3% of People are in the Labor Force in Montgomery County.
What is the Unemployment Rate in Montgomery County?
Unemployment Rate in Montgomery County is 4.8%.