Kent County, MD
Kent County Map
Kent County Overview
19,289
TOTAL POPULATION
9,215
MALE POPULATION
10,074
FEMALE POPULATION
91.47
MALES / 100 FEMALES
109.32
FEMALES / 100 MALES
48.5
MEDIAN AGE
2.6
AVG FAMILY SIZE
2.1
AVG HOUSEHOLD SIZE
$44,283
PER CAPITA INCOME
$103,341
AVG FAMILY INCOME
$71,635
AVG HOUSEHOLD INCOME
43.9%
WAGE / INCOME GAP [ % ]
56.1¢/ $1
WAGE / INCOME GAP [ $ ]
0.45
INEQUALITY / GINI INDEX
9,685
LABOR FORCE [ PEOPLE ]
58.1%
PERCENT IN LABOR FORCE
3.3%
UNEMPLOYMENT RATE
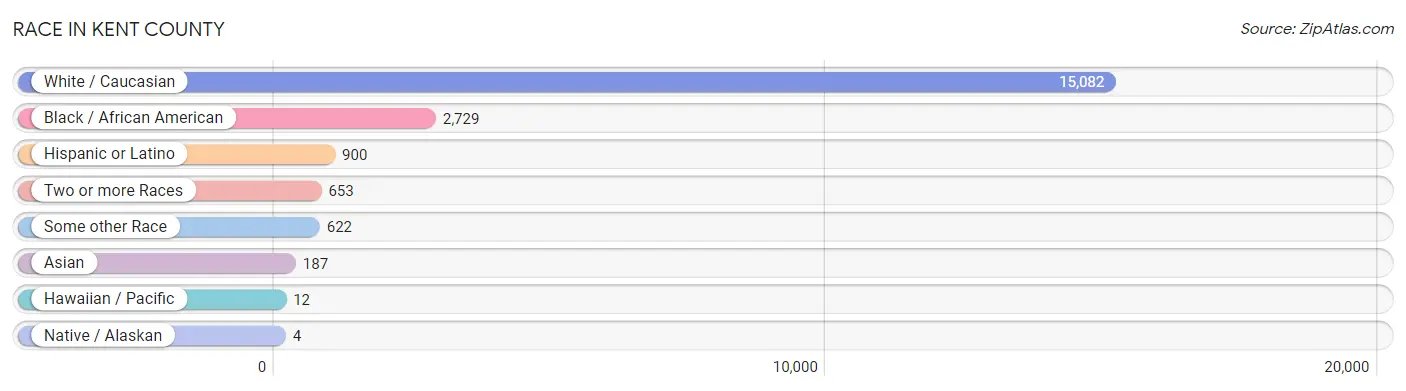
Race in Kent County
The most populous races in Kent County are White / Caucasian (15,082 | 78.2%), Black / African American (2,729 | 14.1%), and Hispanic or Latino (900 | 4.7%).
| Race | # Population | % Population |
| Asian | 187 | 1.0% |
| Black / African American | 2,729 | 14.1% |
| Hawaiian / Pacific | 12 | 0.1% |
| Hispanic or Latino | 900 | 4.7% |
| Native / Alaskan | 4 | 0.0% |
| White / Caucasian | 15,082 | 78.2% |
| Two or more Races | 653 | 3.4% |
| Some other Race | 622 | 3.2% |
| Total | 19,289 | 100.0% |
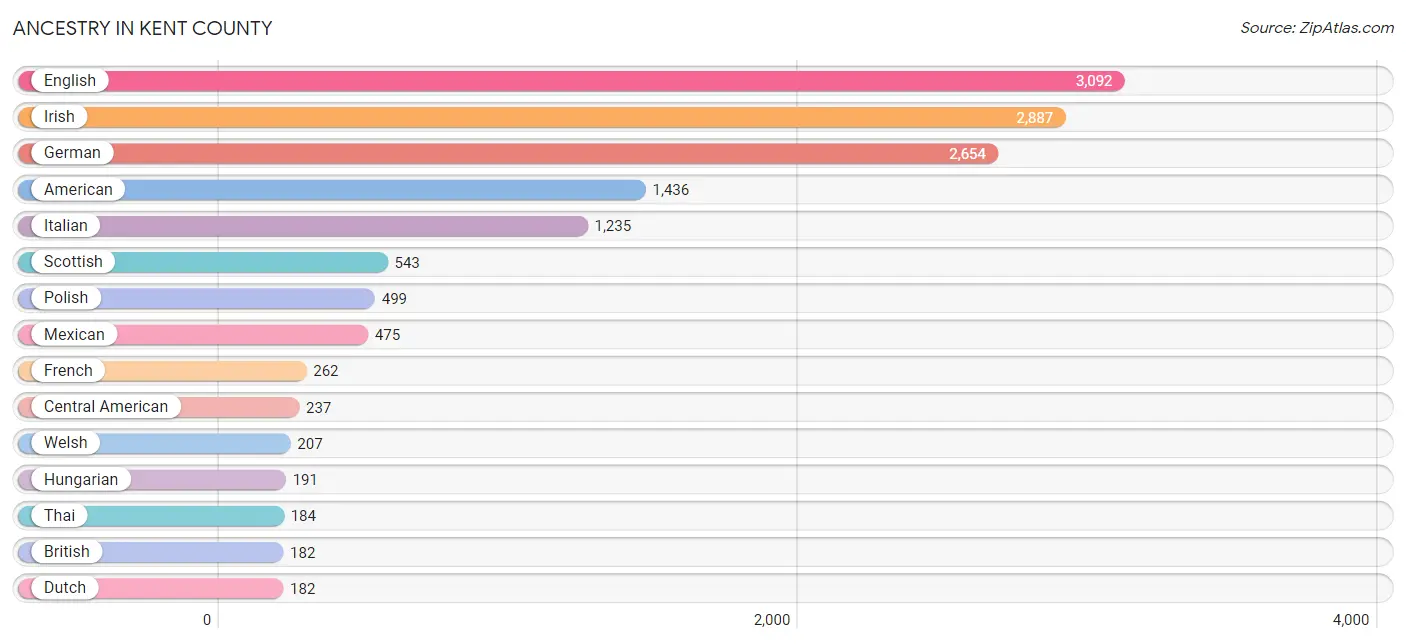
Ancestry in Kent County
The most populous ancestries reported in Kent County are English (3,092 | 16.0%), Irish (2,887 | 15.0%), German (2,654 | 13.8%), American (1,436 | 7.4%), and Italian (1,235 | 6.4%), together accounting for 58.6% of all Kent County residents.
| Ancestry | # Population | % Population |
| African | 12 | 0.1% |
| American | 1,436 | 7.4% |
| Arab | 4 | 0.0% |
| Australian | 59 | 0.3% |
| Austrian | 86 | 0.4% |
| Bhutanese | 33 | 0.2% |
| Bolivian | 2 | 0.0% |
| British | 182 | 0.9% |
| Central American | 237 | 1.2% |
| Cherokee | 23 | 0.1% |
| Costa Rican | 12 | 0.1% |
| Cuban | 35 | 0.2% |
| Czech | 76 | 0.4% |
| Czechoslovakian | 8 | 0.0% |
| Dominican | 10 | 0.1% |
| Dutch | 182 | 0.9% |
| Eastern European | 73 | 0.4% |
| English | 3,092 | 16.0% |
| Estonian | 48 | 0.3% |
| Ethiopian | 10 | 0.1% |
| European | 156 | 0.8% |
| French | 262 | 1.4% |
| French Canadian | 110 | 0.6% |
| German | 2,654 | 13.8% |
| Ghanaian | 5 | 0.0% |
| Greek | 61 | 0.3% |
| Guatemalan | 146 | 0.8% |
| Haitian | 5 | 0.0% |
| Honduran | 77 | 0.4% |
| Hungarian | 191 | 1.0% |
| Indian (Asian) | 73 | 0.4% |
| Indonesian | 28 | 0.2% |
| Iraqi | 4 | 0.0% |
| Irish | 2,887 | 15.0% |
| Iroquois | 10 | 0.1% |
| Italian | 1,235 | 6.4% |
| Jamaican | 11 | 0.1% |
| Korean | 17 | 0.1% |
| Lithuanian | 38 | 0.2% |
| Mexican | 475 | 2.5% |
| Native Hawaiian | 22 | 0.1% |
| Nicaraguan | 2 | 0.0% |
| Northern European | 110 | 0.6% |
| Norwegian | 121 | 0.6% |
| Pakistani | 46 | 0.2% |
| Pennsylvania German | 94 | 0.5% |
| Peruvian | 11 | 0.1% |
| Polish | 499 | 2.6% |
| Puerto Rican | 80 | 0.4% |
| Russian | 105 | 0.5% |
| Scandinavian | 49 | 0.3% |
| Scotch-Irish | 145 | 0.7% |
| Scottish | 543 | 2.8% |
| Slovak | 22 | 0.1% |
| South American | 13 | 0.1% |
| Spaniard | 21 | 0.1% |
| Spanish | 27 | 0.1% |
| Subsaharan African | 27 | 0.1% |
| Swedish | 174 | 0.9% |
| Swiss | 59 | 0.3% |
| Thai | 184 | 0.9% |
| Trinidadian and Tobagonian | 10 | 0.1% |
| Ugandan | 2 | 0.0% |
| Ukrainian | 42 | 0.2% |
| Welsh | 207 | 1.1% |
| West Indian | 10 | 0.1% | View All 66 Rows |
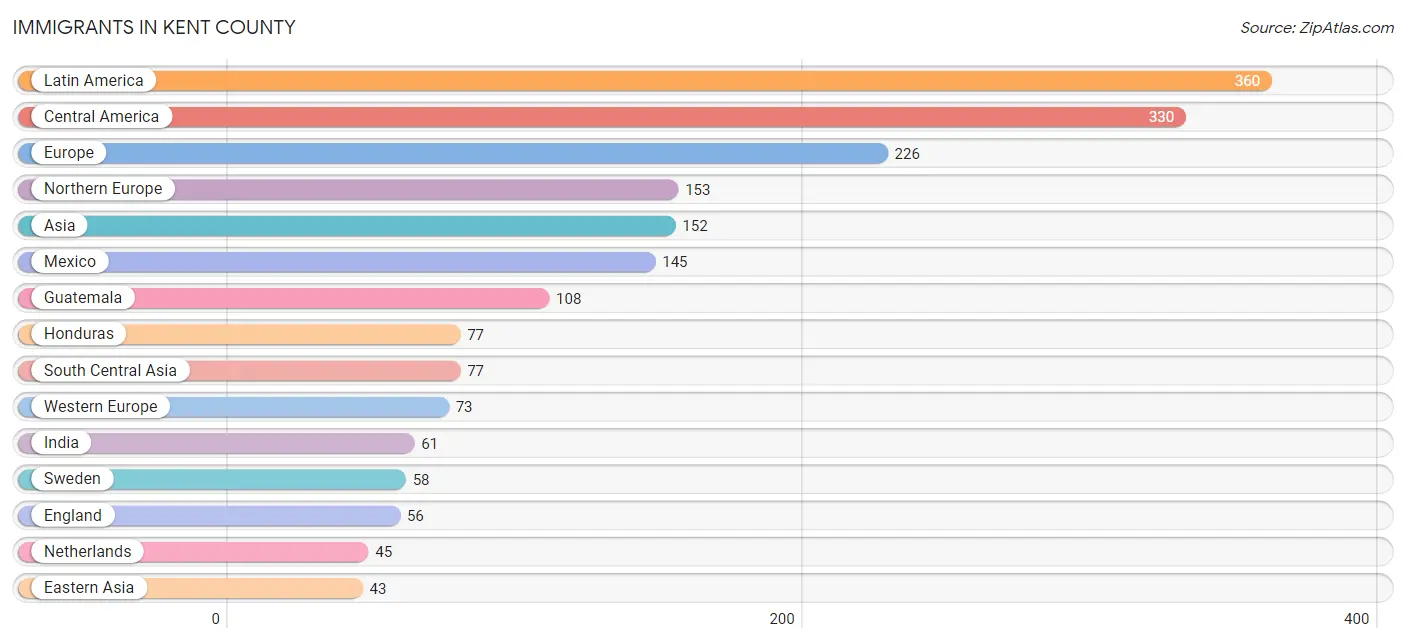
Immigrants in Kent County
The most numerous immigrant groups reported in Kent County came from Latin America (360 | 1.9%), Central America (330 | 1.7%), Europe (226 | 1.2%), Northern Europe (153 | 0.8%), and Asia (152 | 0.8%), together accounting for 6.3% of all Kent County residents.
| Immigration Origin | # Population | % Population |
| Africa | 28 | 0.2% |
| Asia | 152 | 0.8% |
| Bangladesh | 16 | 0.1% |
| Bolivia | 2 | 0.0% |
| Canada | 3 | 0.0% |
| Caribbean | 28 | 0.2% |
| Central America | 330 | 1.7% |
| China | 42 | 0.2% |
| Cuba | 28 | 0.2% |
| Eastern Africa | 23 | 0.1% |
| Eastern Asia | 43 | 0.2% |
| England | 56 | 0.3% |
| Ethiopia | 10 | 0.1% |
| Europe | 226 | 1.2% |
| France | 4 | 0.0% |
| Germany | 24 | 0.1% |
| Ghana | 5 | 0.0% |
| Guatemala | 108 | 0.6% |
| Honduras | 77 | 0.4% |
| Hong Kong | 28 | 0.2% |
| India | 61 | 0.3% |
| Iraq | 4 | 0.0% |
| Korea | 1 | 0.0% |
| Latin America | 360 | 1.9% |
| Mexico | 145 | 0.7% |
| Netherlands | 45 | 0.2% |
| Northern Europe | 153 | 0.8% |
| Scotland | 15 | 0.1% |
| South America | 2 | 0.0% |
| South Central Asia | 77 | 0.4% |
| South Eastern Asia | 28 | 0.2% |
| Sweden | 58 | 0.3% |
| Uganda | 2 | 0.0% |
| Western Africa | 5 | 0.0% |
| Western Asia | 4 | 0.0% |
| Western Europe | 73 | 0.4% | View All 36 Rows |
Sex and Age in Kent County
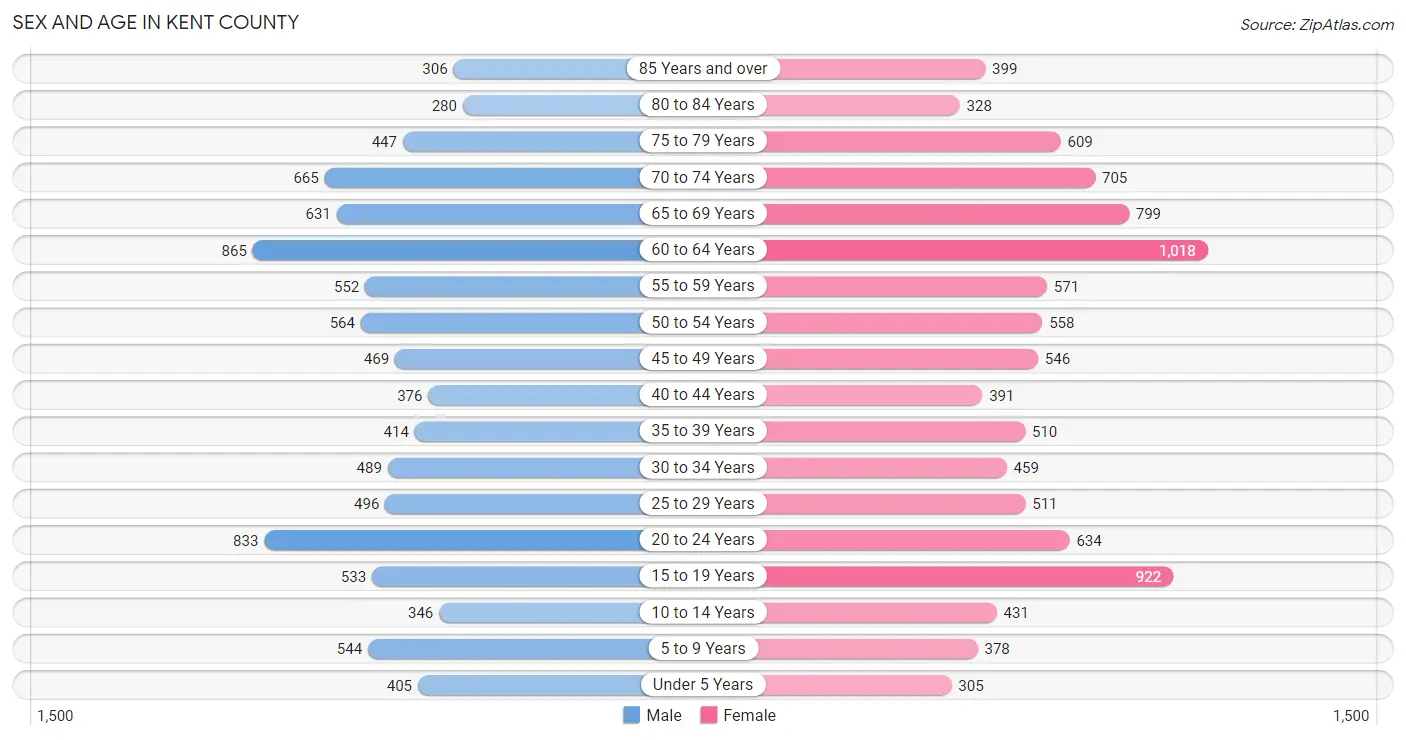
Sex and Age in Kent County
The most populous age groups in Kent County are 60 to 64 Years (865 | 9.4%) for men and 60 to 64 Years (1,018 | 10.1%) for women.
| Age Bracket | Male | Female |
| Under 5 Years | 405 (4.4%) | 305 (3.0%) |
| 5 to 9 Years | 544 (5.9%) | 378 (3.7%) |
| 10 to 14 Years | 346 (3.7%) | 431 (4.3%) |
| 15 to 19 Years | 533 (5.8%) | 922 (9.1%) |
| 20 to 24 Years | 833 (9.0%) | 634 (6.3%) |
| 25 to 29 Years | 496 (5.4%) | 511 (5.1%) |
| 30 to 34 Years | 489 (5.3%) | 459 (4.6%) |
| 35 to 39 Years | 414 (4.5%) | 510 (5.1%) |
| 40 to 44 Years | 376 (4.1%) | 391 (3.9%) |
| 45 to 49 Years | 469 (5.1%) | 546 (5.4%) |
| 50 to 54 Years | 564 (6.1%) | 558 (5.5%) |
| 55 to 59 Years | 552 (6.0%) | 571 (5.7%) |
| 60 to 64 Years | 865 (9.4%) | 1,018 (10.1%) |
| 65 to 69 Years | 631 (6.9%) | 799 (7.9%) |
| 70 to 74 Years | 665 (7.2%) | 705 (7.0%) |
| 75 to 79 Years | 447 (4.9%) | 609 (6.0%) |
| 80 to 84 Years | 280 (3.0%) | 328 (3.3%) |
| 85 Years and over | 306 (3.3%) | 399 (4.0%) |
| Total | 9,215 (100.0%) | 10,074 (100.0%) |
Families and Households in Kent County
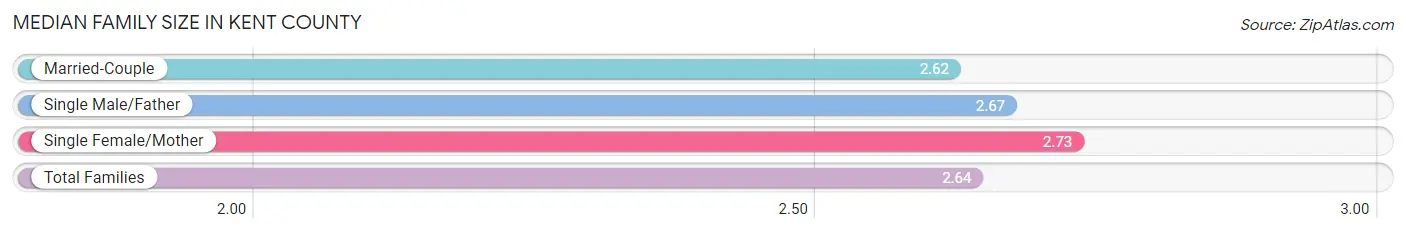
Median Family Size in Kent County
The median family size in Kent County is 2.64 persons per family, with single female/mother families (963 | 19.3%) accounting for the largest median family size of 2.73 persons per family. On the other hand, married-couple families (3,630 | 72.8%) represent the smallest median family size with 2.62 persons per family.
| Family Type | # Families | Family Size |
| Married-Couple | 3,630 (72.8%) | 2.62 |
| Single Male/Father | 396 (7.9%) | 2.67 |
| Single Female/Mother | 963 (19.3%) | 2.73 |
| Total Families | 4,989 (100.0%) | 2.64 |
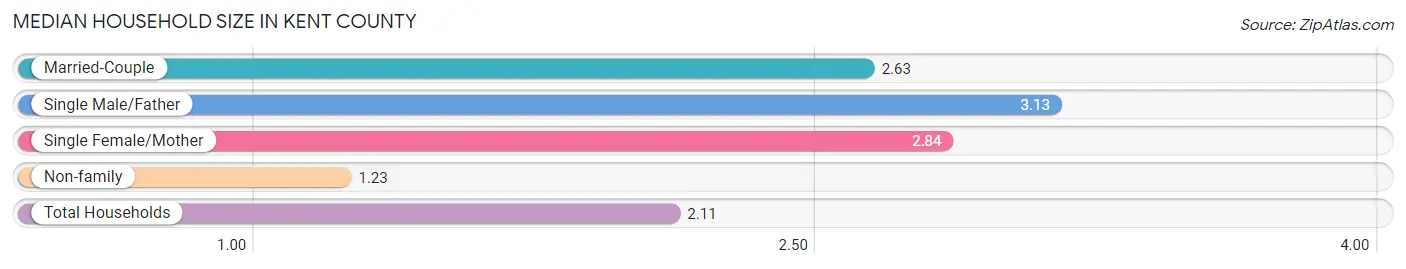
Median Household Size in Kent County
The median household size in Kent County is 2.11 persons per household, with single male/father households (396 | 4.7%) accounting for the largest median household size of 3.13 persons per household. non-family households (3,386 | 40.4%) represent the smallest median household size with 1.23 persons per household.
| Household Type | # Households | Household Size |
| Married-Couple | 3,630 (43.3%) | 2.63 |
| Single Male/Father | 396 (4.7%) | 3.13 |
| Single Female/Mother | 963 (11.5%) | 2.84 |
| Non-family | 3,386 (40.4%) | 1.23 |
| Total Households | 8,375 (100.0%) | 2.11 |
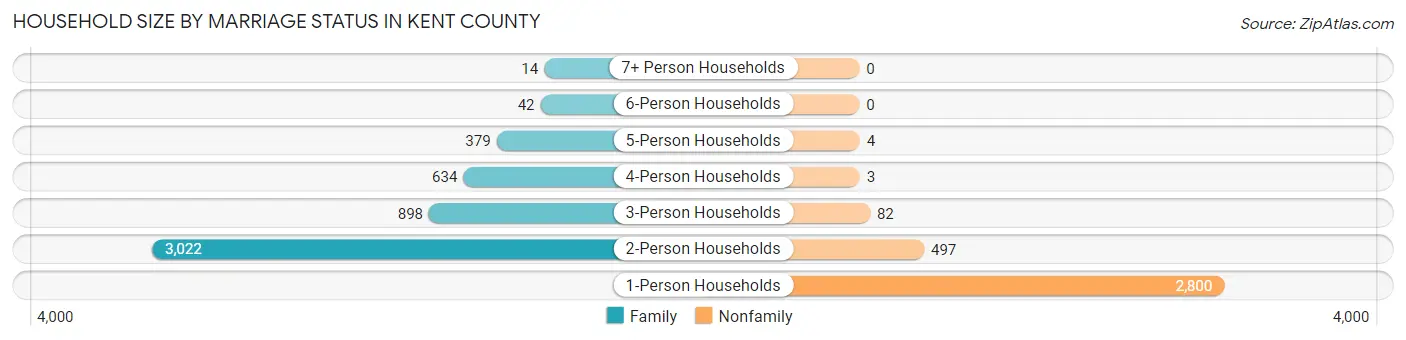
Household Size by Marriage Status in Kent County
Out of a total of 8,375 households in Kent County, 4,989 (59.6%) are family households, while 3,386 (40.4%) are nonfamily households. The most numerous type of family households are 2-person households, comprising 3,022, and the most common type of nonfamily households are 1-person households, comprising 2,800.
| Household Size | Family Households | Nonfamily Households |
| 1-Person Households | - | 2,800 (33.4%) |
| 2-Person Households | 3,022 (36.1%) | 497 (5.9%) |
| 3-Person Households | 898 (10.7%) | 82 (1.0%) |
| 4-Person Households | 634 (7.6%) | 3 (0.0%) |
| 5-Person Households | 379 (4.5%) | 4 (0.1%) |
| 6-Person Households | 42 (0.5%) | 0 (0.0%) |
| 7+ Person Households | 14 (0.2%) | 0 (0.0%) |
| Total | 4,989 (59.6%) | 3,386 (40.4%) |
Female Fertility in Kent County
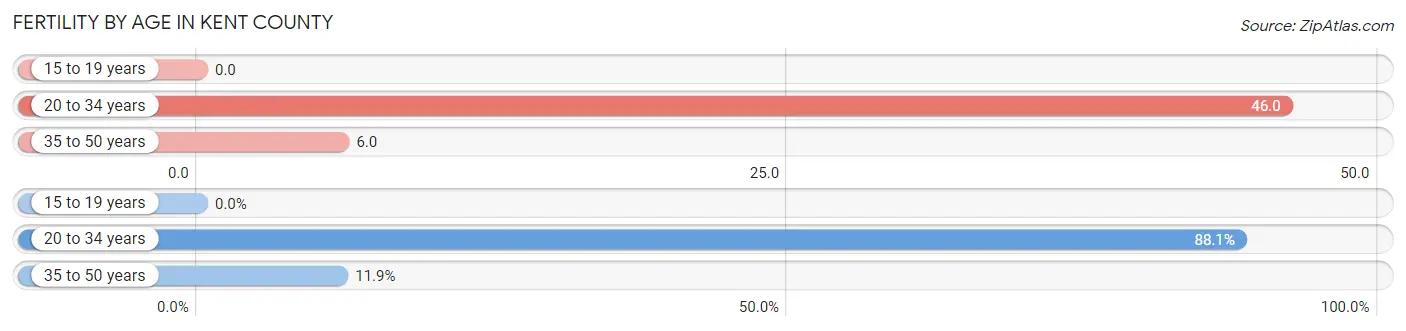
Fertility by Age in Kent County
Average fertility rate in Kent County is 20.0 births per 1,000 women. Women in the age bracket of 20 to 34 years have the highest fertility rate with 46.0 births per 1,000 women. Women in the age bracket of 20 to 34 years acount for 88.1% of all women with births.
| Age Bracket | Women with Births | Births / 1,000 Women |
| 15 to 19 years | 0 (0.0%) | 0.0 |
| 20 to 34 years | 74 (88.1%) | 46.0 |
| 35 to 50 years | 10 (11.9%) | 6.0 |
| Total | 84 (100.0%) | 20.0 |
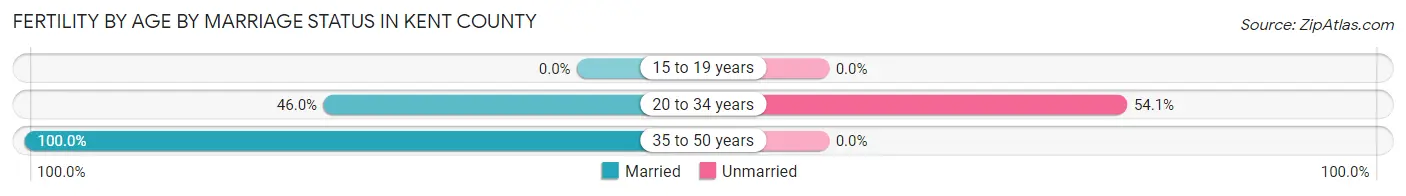
Fertility by Age by Marriage Status in Kent County
52.4% of women with births (84) in Kent County are married. The highest percentage of unmarried women with births falls into 20 to 34 years age bracket with 54.0% of them unmarried at the time of birth, while the lowest percentage of unmarried women with births belong to 35 to 50 years age bracket with 0.0% of them unmarried.
| Age Bracket | Married | Unmarried |
| 15 to 19 years | 0 (0.0%) | 0 (0.0%) |
| 20 to 34 years | 34 (46.0%) | 40 (54.0%) |
| 35 to 50 years | 10 (100.0%) | 0 (0.0%) |
| Total | 44 (52.4%) | 40 (47.6%) |
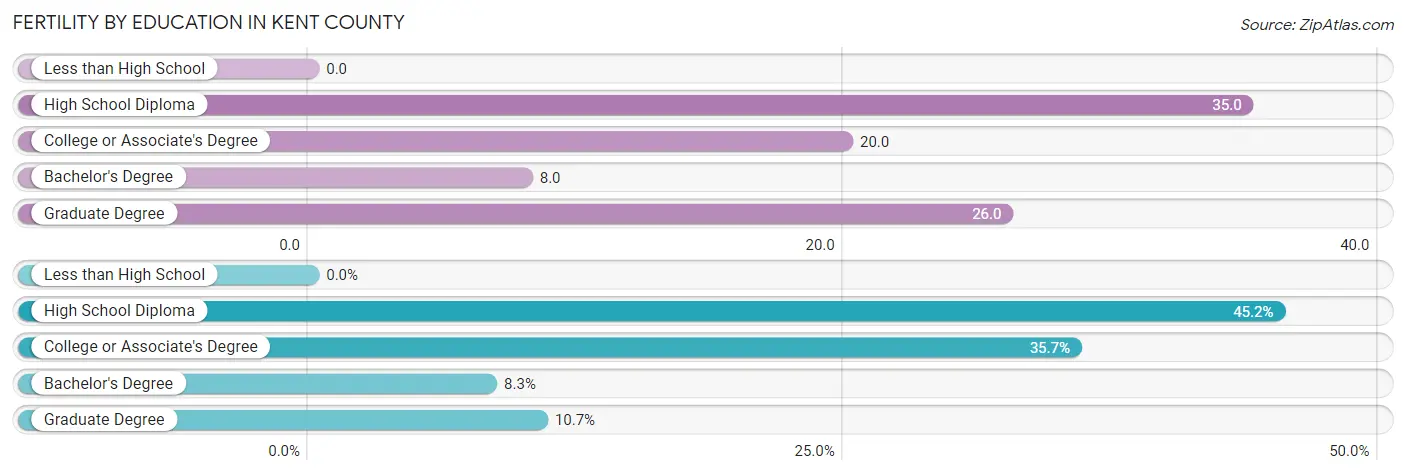
Fertility by Education in Kent County
| Educational Attainment | Women with Births | Births / 1,000 Women |
| Less than High School | 0 (0.0%) | 0.0 |
| High School Diploma | 38 (45.2%) | 35.0 |
| College or Associate's Degree | 30 (35.7%) | 20.0 |
| Bachelor's Degree | 7 (8.3%) | 8.0 |
| Graduate Degree | 9 (10.7%) | 26.0 |
| Total | 84 (100.0%) | 20.0 |
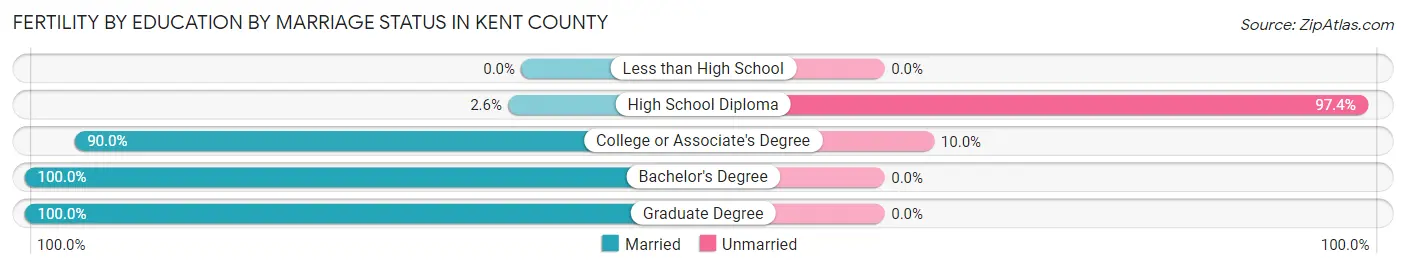
Fertility by Education by Marriage Status in Kent County
47.6% of women with births in Kent County are unmarried. Women with the educational attainment of bachelor's degree are most likely to be married with 100.0% of them married at childbirth, while women with the educational attainment of high school diploma are least likely to be married with 97.4% of them unmarried at childbirth.
| Educational Attainment | Married | Unmarried |
| Less than High School | 0 (0.0%) | 0 (0.0%) |
| High School Diploma | 1 (2.6%) | 37 (97.4%) |
| College or Associate's Degree | 27 (90.0%) | 3 (10.0%) |
| Bachelor's Degree | 7 (100.0%) | 0 (0.0%) |
| Graduate Degree | 9 (100.0%) | 0 (0.0%) |
| Total | 44 (52.4%) | 40 (47.6%) |
Income in Kent County
Income Overview in Kent County
Per Capita Income in Kent County is $44,283, while median incomes of families and households are $103,341 and $71,635 respectively.
| Characteristic | Number | Measure |
| Per Capita Income | 19,289 | $44,283 |
| Median Family Income | 4,989 | $103,341 |
| Mean Family Income | 4,989 | $123,180 |
| Median Household Income | 8,375 | $71,635 |
| Mean Household Income | 8,375 | $98,025 |
| Income Deficit | 4,989 | $0 |
| Wage / Income Gap (%) | 19,289 | 43.89% |
| Wage / Income Gap ($) | 19,289 | 56.11¢ per $1 |
| Gini / Inequality Index | 19,289 | 0.45 |
Earnings by Sex in Kent County
Average Earnings in Kent County are $41,737, $54,264 for men and $30,450 for women, a difference of 43.9%.
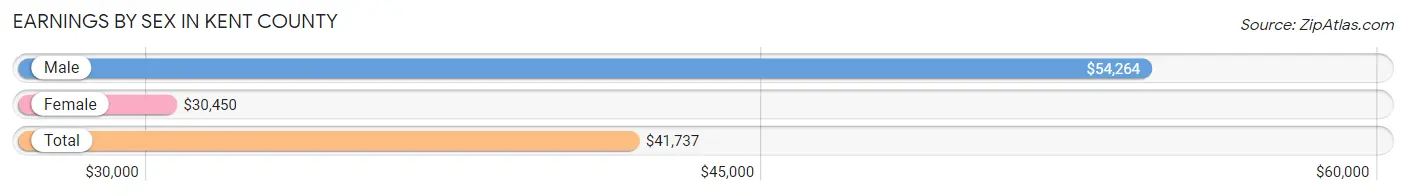
| Sex | Number | Average Earnings |
| Male | 5,234 (50.1%) | $54,264 |
| Female | 5,207 (49.9%) | $30,450 |
| Total | 10,441 (100.0%) | $41,737 |
Earnings by Sex by Income Bracket in Kent County
The most common earnings brackets in Kent County are $100,000+ for men (1,107 | 21.1%) and $2,499 or less for women (658 | 12.6%).
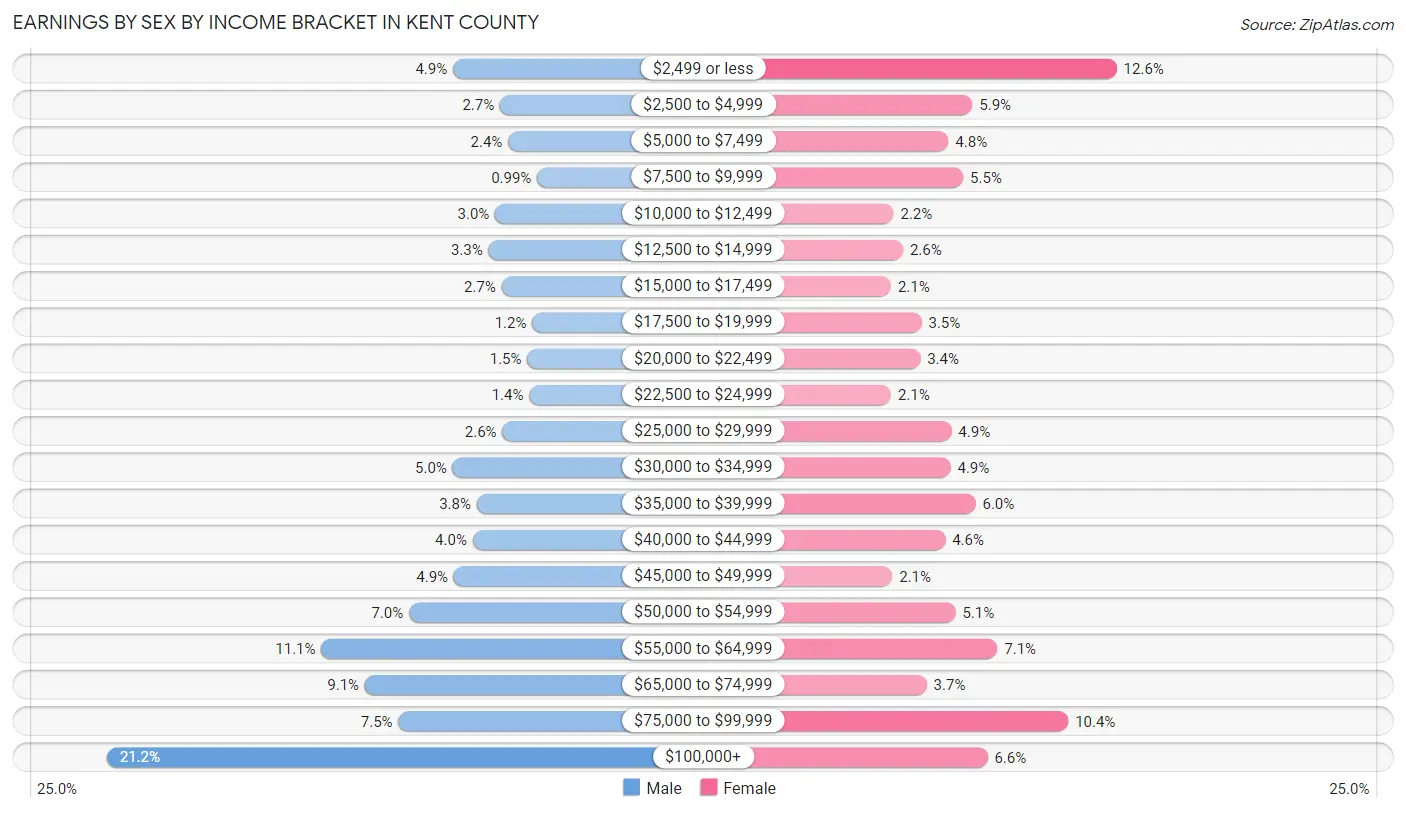
| Income | Male | Female |
| $2,499 or less | 258 (4.9%) | 658 (12.6%) |
| $2,500 to $4,999 | 143 (2.7%) | 306 (5.9%) |
| $5,000 to $7,499 | 123 (2.4%) | 248 (4.8%) |
| $7,500 to $9,999 | 52 (1.0%) | 284 (5.4%) |
| $10,000 to $12,499 | 155 (3.0%) | 114 (2.2%) |
| $12,500 to $14,999 | 171 (3.3%) | 137 (2.6%) |
| $15,000 to $17,499 | 139 (2.7%) | 108 (2.1%) |
| $17,500 to $19,999 | 64 (1.2%) | 182 (3.5%) |
| $20,000 to $22,499 | 76 (1.5%) | 179 (3.4%) |
| $22,500 to $24,999 | 71 (1.4%) | 108 (2.1%) |
| $25,000 to $29,999 | 137 (2.6%) | 255 (4.9%) |
| $30,000 to $34,999 | 259 (5.0%) | 253 (4.9%) |
| $35,000 to $39,999 | 200 (3.8%) | 314 (6.0%) |
| $40,000 to $44,999 | 210 (4.0%) | 240 (4.6%) |
| $45,000 to $49,999 | 256 (4.9%) | 111 (2.1%) |
| $50,000 to $54,999 | 366 (7.0%) | 265 (5.1%) |
| $55,000 to $64,999 | 581 (11.1%) | 367 (7.0%) |
| $65,000 to $74,999 | 474 (9.1%) | 195 (3.7%) |
| $75,000 to $99,999 | 392 (7.5%) | 540 (10.4%) |
| $100,000+ | 1,107 (21.1%) | 343 (6.6%) |
| Total | 5,234 (100.0%) | 5,207 (100.0%) |
Earnings by Sex by Educational Attainment in Kent County
Average earnings in Kent County are $59,989 for men and $39,393 for women, a difference of 34.3%. Men with an educational attainment of bachelor's degree enjoy the highest average annual earnings of $84,583, while those with less than high school education earn the least with $45,809. Women with an educational attainment of graduate degree earn the most with the average annual earnings of $67,353, while those with less than high school education have the smallest earnings of $17,946.
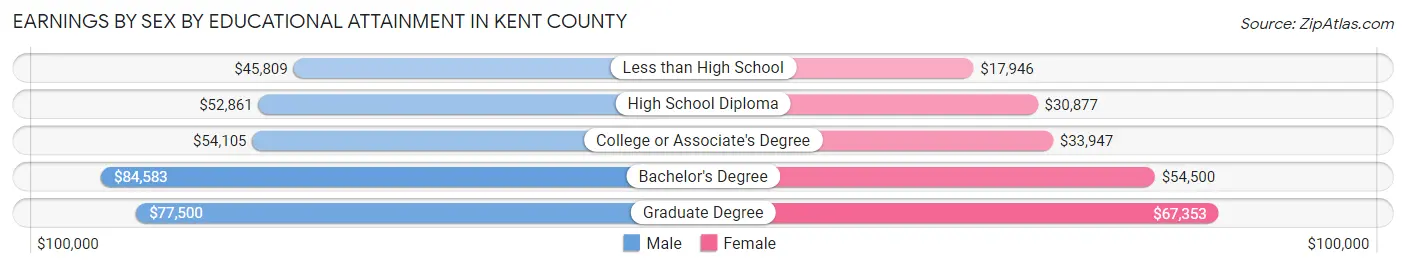
| Educational Attainment | Male Income | Female Income |
| Less than High School | $45,809 | $17,946 |
| High School Diploma | $52,861 | $30,877 |
| College or Associate's Degree | $54,105 | $33,947 |
| Bachelor's Degree | $84,583 | $54,500 |
| Graduate Degree | $77,500 | $67,353 |
| Total | $59,989 | $39,393 |
Family Income in Kent County
Family Income Brackets in Kent County
According to the Kent County family income data, there are 1,108 families falling into the $100,000 to $149,999 income range, which is the most common income bracket and makes up 22.2% of all families. Conversely, the less than $10,000 income bracket is the least frequent group with only 55 families (1.1%) belonging to this category.
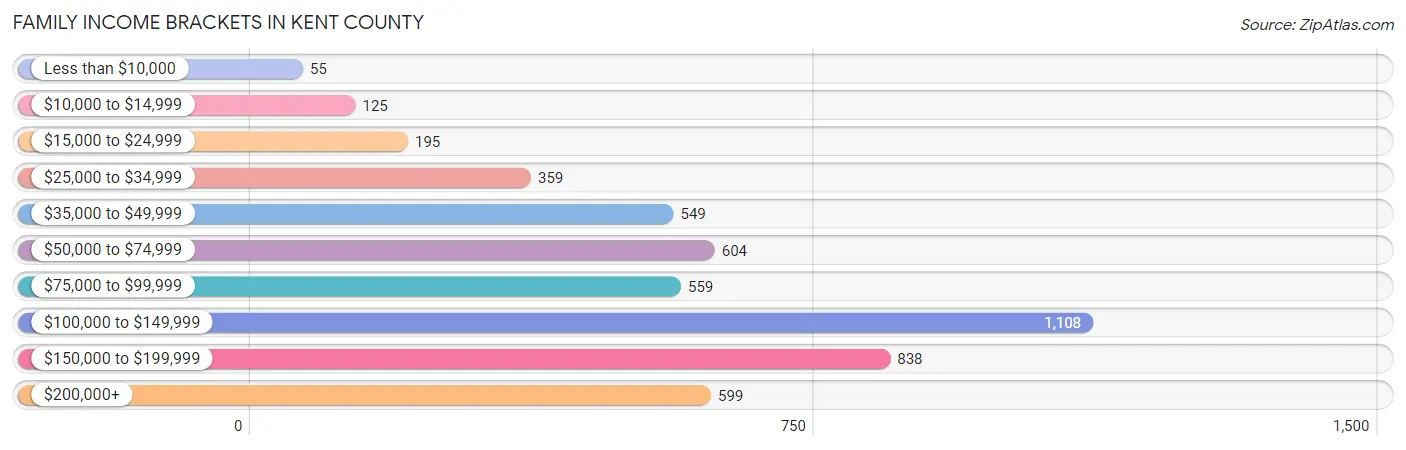
| Income Bracket | # Families | % Families |
| Less than $10,000 | 55 | 1.1% |
| $10,000 to $14,999 | 125 | 2.5% |
| $15,000 to $24,999 | 195 | 3.9% |
| $25,000 to $34,999 | 359 | 7.2% |
| $35,000 to $49,999 | 549 | 11.0% |
| $50,000 to $74,999 | 604 | 12.1% |
| $75,000 to $99,999 | 559 | 11.2% |
| $100,000 to $149,999 | 1,108 | 22.2% |
| $150,000 to $199,999 | 838 | 16.8% |
| $200,000+ | 599 | 12.0% |
Family Income by Famaliy Size in Kent County
4-person families (582 | 11.7%) account for the highest median family income in Kent County with $135,735 per family, while 2-person families (3,118 | 62.5%) have the highest median income of $50,900 per family member.
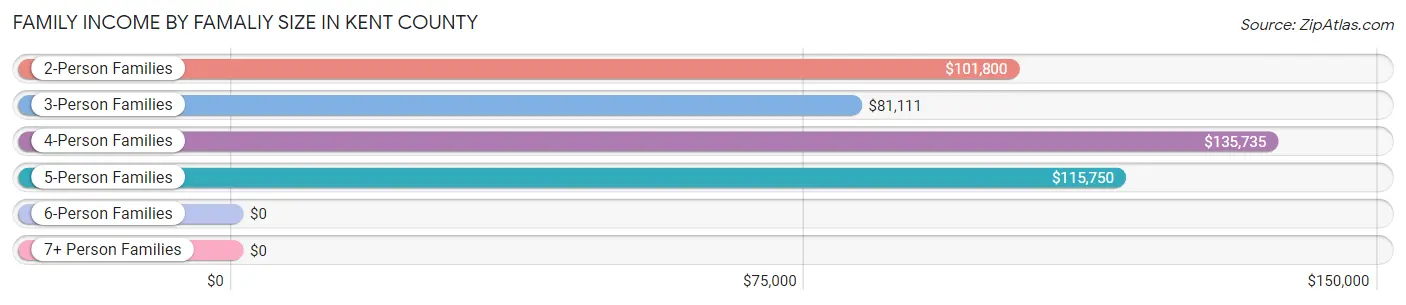
| Income Bracket | # Families | Median Income |
| 2-Person Families | 3,118 (62.5%) | $101,800 |
| 3-Person Families | 924 (18.5%) | $81,111 |
| 4-Person Families | 582 (11.7%) | $135,735 |
| 5-Person Families | 321 (6.4%) | $115,750 |
| 6-Person Families | 31 (0.6%) | $0 |
| 7+ Person Families | 13 (0.3%) | $0 |
| Total | 4,989 (100.0%) | $103,341 |
Family Income by Number of Earners in Kent County
The median family income in Kent County is $103,341, with families comprising 3+ earners (456) having the highest median family income of $166,000, while families with 1 earner (1,638) have the lowest median family income of $60,833, accounting for 9.1% and 32.8% of families, respectively.
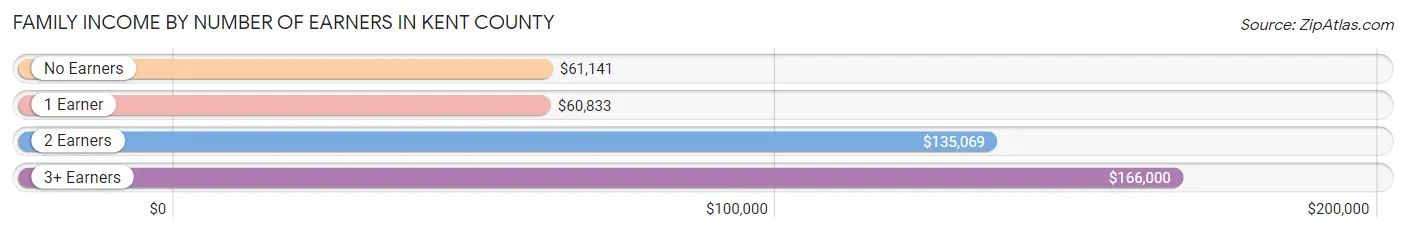
| Number of Earners | # Families | Median Income |
| No Earners | 921 (18.5%) | $61,141 |
| 1 Earner | 1,638 (32.8%) | $60,833 |
| 2 Earners | 1,974 (39.6%) | $135,069 |
| 3+ Earners | 456 (9.1%) | $166,000 |
| Total | 4,989 (100.0%) | $103,341 |
Household Income in Kent County
Household Income Brackets in Kent County
With 1,524 households falling in the category, the $100,000 to $149,999 income range is the most frequent in Kent County, accounting for 18.2% of all households. In contrast, only 302 households (3.6%) fall into the $10,000 to $14,999 income bracket, making it the least populous group.
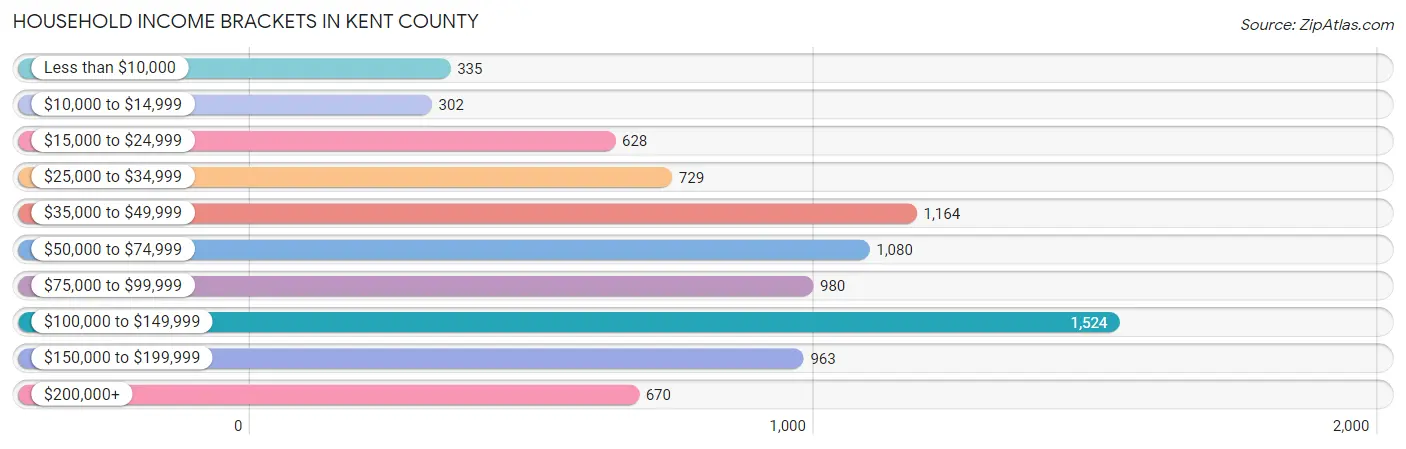
| Income Bracket | # Households | % Households |
| Less than $10,000 | 335 | 4.0% |
| $10,000 to $14,999 | 302 | 3.6% |
| $15,000 to $24,999 | 628 | 7.5% |
| $25,000 to $34,999 | 729 | 8.7% |
| $35,000 to $49,999 | 1,164 | 13.9% |
| $50,000 to $74,999 | 1,080 | 12.9% |
| $75,000 to $99,999 | 980 | 11.7% |
| $100,000 to $149,999 | 1,524 | 18.2% |
| $150,000 to $199,999 | 963 | 11.5% |
| $200,000+ | 670 | 8.0% |
Household Income by Householder Age in Kent County
The median household income in Kent County is $71,635, with the highest median household income of $86,337 found in the 45 to 64 years age bracket for the primary householder. A total of 3,032 households (36.2%) fall into this category. Meanwhile, the 15 to 24 years age bracket for the primary householder has the lowest median household income of $51,304, with 252 households (3.0%) in this group.
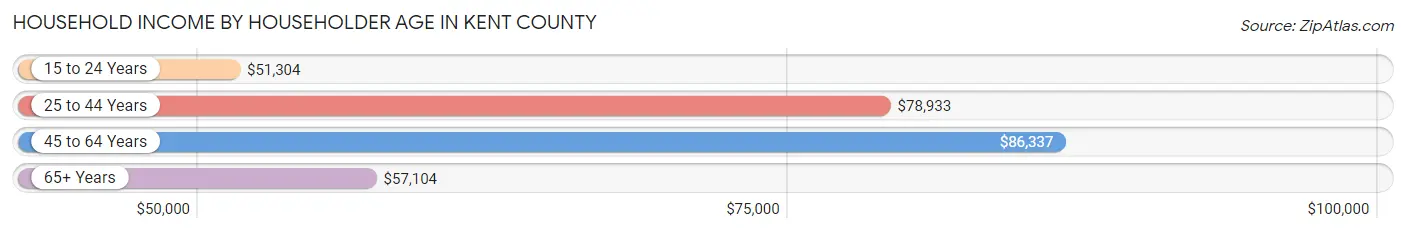
| Income Bracket | # Households | Median Income |
| 15 to 24 Years | 252 (3.0%) | $51,304 |
| 25 to 44 Years | 1,852 (22.1%) | $78,933 |
| 45 to 64 Years | 3,032 (36.2%) | $86,337 |
| 65+ Years | 3,239 (38.7%) | $57,104 |
| Total | 8,375 (100.0%) | $71,635 |
Poverty in Kent County
Income Below Poverty by Sex and Age in Kent County
With 9.6% poverty level for males and 9.5% for females among the residents of Kent County, 16 and 17 year old males and 16 and 17 year old females are the most vulnerable to poverty, with 122 males (51.9%) and 29 females (20.0%) in their respective age groups living below the poverty level.
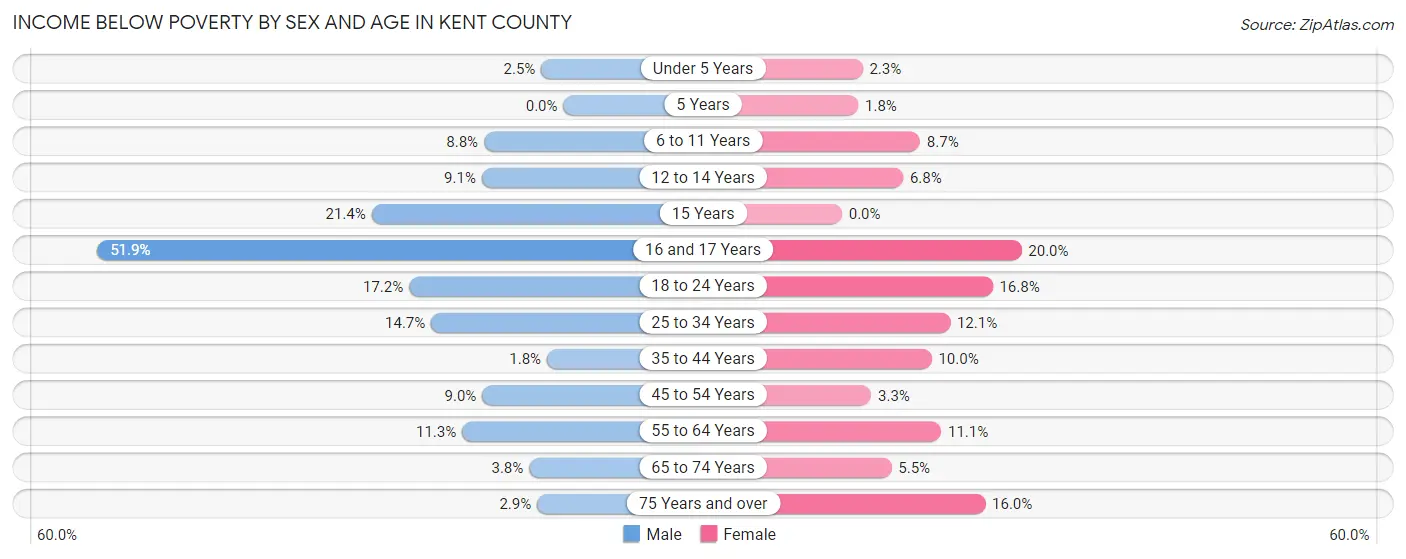
| Age Bracket | Male | Female |
| Under 5 Years | 10 (2.5%) | 7 (2.3%) |
| 5 Years | 0 (0.0%) | 3 (1.8%) |
| 6 to 11 Years | 66 (8.8%) | 28 (8.7%) |
| 12 to 14 Years | 8 (9.1%) | 19 (6.8%) |
| 15 Years | 22 (21.4%) | 0 (0.0%) |
| 16 and 17 Years | 122 (51.9%) | 29 (20.0%) |
| 18 to 24 Years | 129 (17.2%) | 74 (16.8%) |
| 25 to 34 Years | 141 (14.7%) | 116 (12.0%) |
| 35 to 44 Years | 14 (1.8%) | 90 (10.0%) |
| 45 to 54 Years | 93 (9.0%) | 36 (3.3%) |
| 55 to 64 Years | 159 (11.3%) | 175 (11.1%) |
| 65 to 74 Years | 49 (3.8%) | 79 (5.5%) |
| 75 Years and over | 29 (2.9%) | 195 (16.0%) |
| Total | 842 (9.6%) | 851 (9.5%) |
Income Above Poverty by Sex and Age in Kent County
According to the poverty statistics in Kent County, males aged 5 years and females aged 15 years are the age groups that are most secure financially, with 100.0% of males and 100.0% of females in these age groups living above the poverty line.
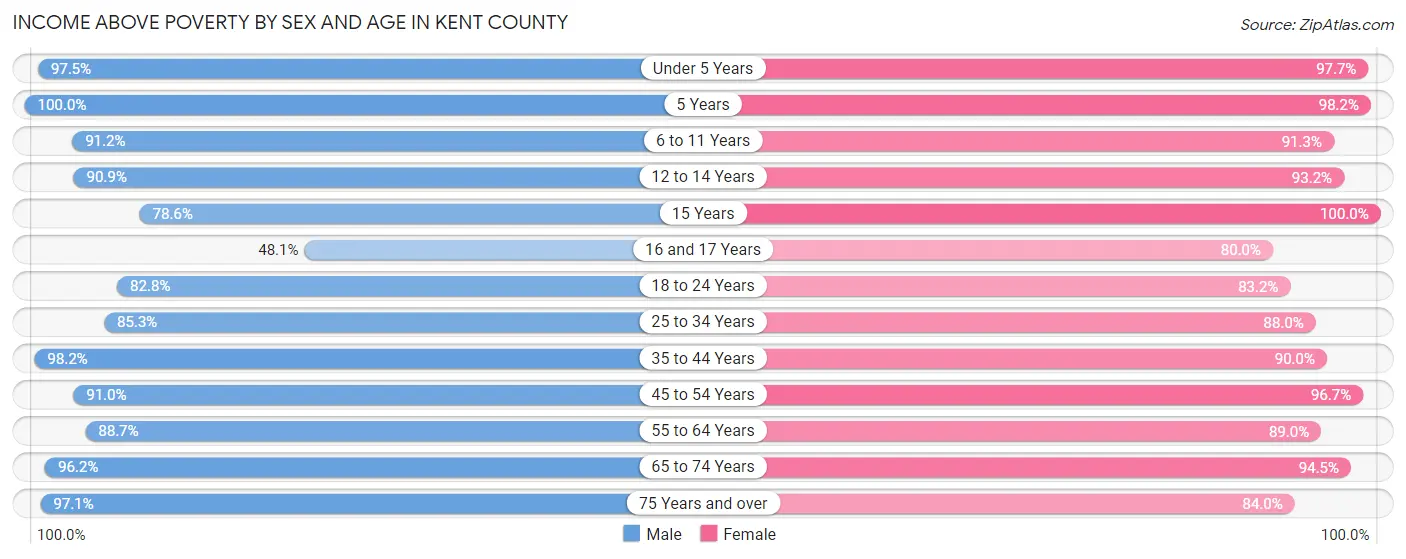
| Age Bracket | Male | Female |
| Under 5 Years | 395 (97.5%) | 298 (97.7%) |
| 5 Years | 32 (100.0%) | 162 (98.2%) |
| 6 to 11 Years | 681 (91.2%) | 294 (91.3%) |
| 12 to 14 Years | 80 (90.9%) | 260 (93.2%) |
| 15 Years | 81 (78.6%) | 104 (100.0%) |
| 16 and 17 Years | 113 (48.1%) | 116 (80.0%) |
| 18 to 24 Years | 622 (82.8%) | 367 (83.2%) |
| 25 to 34 Years | 816 (85.3%) | 847 (87.9%) |
| 35 to 44 Years | 752 (98.2%) | 811 (90.0%) |
| 45 to 54 Years | 936 (91.0%) | 1,067 (96.7%) |
| 55 to 64 Years | 1,250 (88.7%) | 1,409 (88.9%) |
| 65 to 74 Years | 1,236 (96.2%) | 1,352 (94.5%) |
| 75 Years and over | 960 (97.1%) | 1,027 (84.0%) |
| Total | 7,954 (90.4%) | 8,114 (90.5%) |
Income Below Poverty Among Married-Couple Families in Kent County
The poverty statistics for married-couple families in Kent County show that 1.7% or 62 of the total 3,630 families live below the poverty line. Families with 3 or 4 children have the highest poverty rate of 8.2%, comprising of 13 families. On the other hand, families with 1 or 2 children have the lowest poverty rate of 0.9%, which includes 6 families.
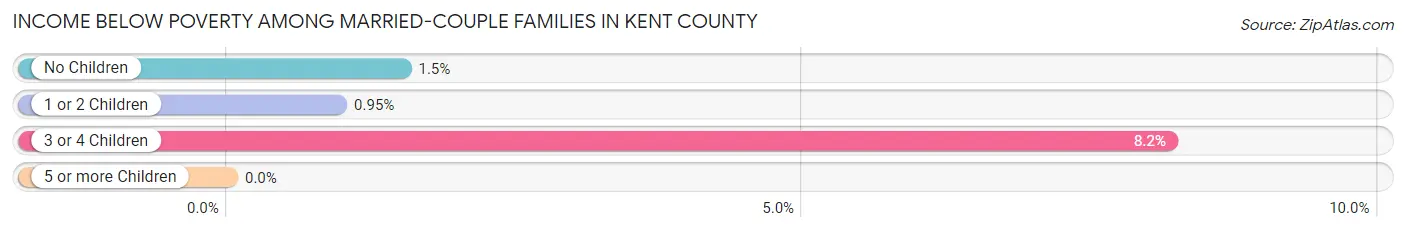
| Children | Above Poverty | Below Poverty |
| No Children | 2,798 (98.5%) | 43 (1.5%) |
| 1 or 2 Children | 624 (99.1%) | 6 (0.9%) |
| 3 or 4 Children | 146 (91.8%) | 13 (8.2%) |
| 5 or more Children | 0 (0.0%) | 0 (0.0%) |
| Total | 3,568 (98.3%) | 62 (1.7%) |
Income Below Poverty Among Single-Parent Households in Kent County
According to the poverty data in Kent County, 0.8% or 3 single-father households and 19.7% or 190 single-mother households are living below the poverty line. Among single-father households, those with 3 or 4 children have the highest poverty rate, with 2 households (7.7%) experiencing poverty. Likewise, among single-mother households, those with 1 or 2 children have the highest poverty rate, with 168 households (29.1%) falling below the poverty line.
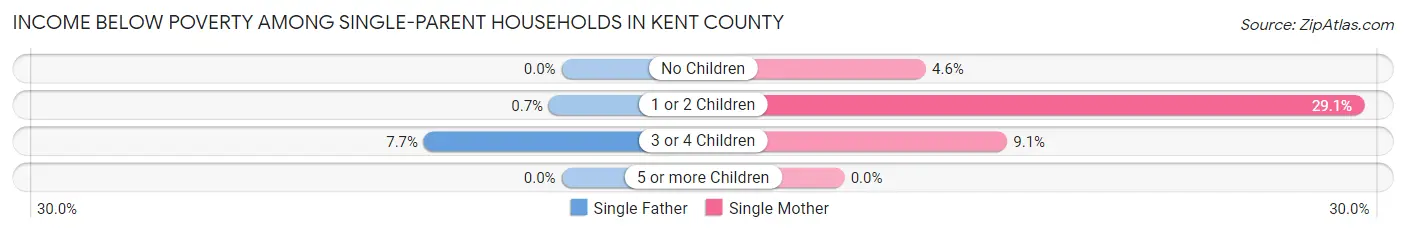
| Children | Single Father | Single Mother |
| No Children | 0 (0.0%) | 13 (4.5%) |
| 1 or 2 Children | 1 (0.7%) | 168 (29.1%) |
| 3 or 4 Children | 2 (7.7%) | 9 (9.1%) |
| 5 or more Children | 0 (0.0%) | 0 (0.0%) |
| Total | 3 (0.8%) | 190 (19.7%) |
Income Below Poverty Among Married-Couple vs Single-Parent Households in Kent County
The poverty data for Kent County shows that 62 of the married-couple family households (1.7%) and 193 of the single-parent households (14.2%) are living below the poverty level. Within the married-couple family households, those with 3 or 4 children have the highest poverty rate, with 13 households (8.2%) falling below the poverty line. Among the single-parent households, those with 1 or 2 children have the highest poverty rate, with 169 household (23.4%) living below poverty.
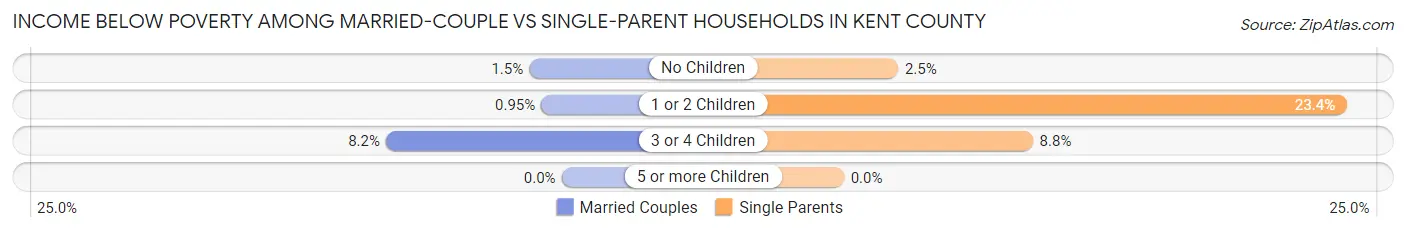
| Children | Married-Couple Families | Single-Parent Households |
| No Children | 43 (1.5%) | 13 (2.5%) |
| 1 or 2 Children | 6 (0.9%) | 169 (23.4%) |
| 3 or 4 Children | 13 (8.2%) | 11 (8.8%) |
| 5 or more Children | 0 (0.0%) | 0 (0.0%) |
| Total | 62 (1.7%) | 193 (14.2%) |
Employment Characteristics in Kent County
Employment by Class of Employer in Kent County
Among the 9,119 employed individuals in Kent County, private company employees (5,056 | 55.4%), self-employed (not incorporated) (1,003 | 11.0%), and not-for-profit organizations (885 | 9.7%) make up the most common classes of employment.
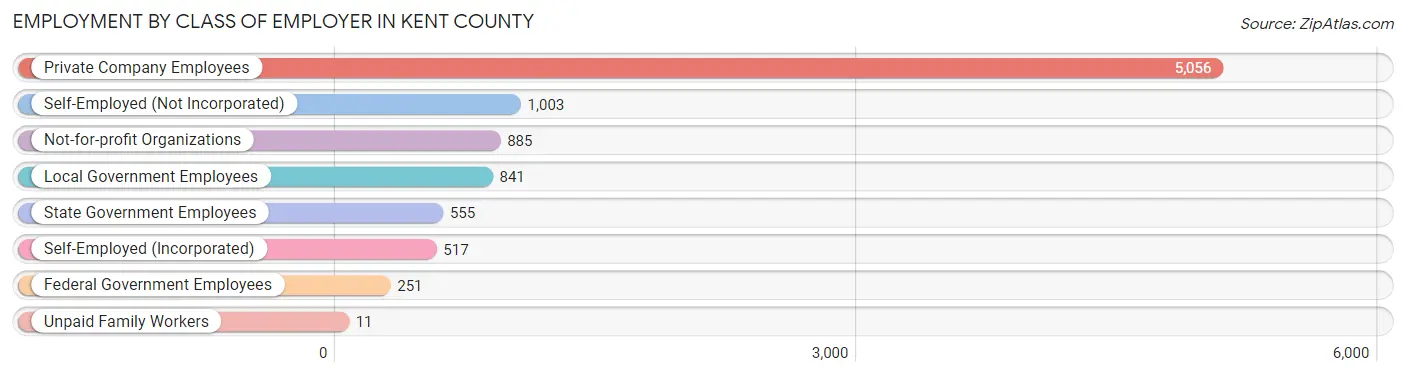
| Employer Class | # Employees | % Employees |
| Private Company Employees | 5,056 | 55.4% |
| Self-Employed (Incorporated) | 517 | 5.7% |
| Self-Employed (Not Incorporated) | 1,003 | 11.0% |
| Not-for-profit Organizations | 885 | 9.7% |
| Local Government Employees | 841 | 9.2% |
| State Government Employees | 555 | 6.1% |
| Federal Government Employees | 251 | 2.8% |
| Unpaid Family Workers | 11 | 0.1% |
| Total | 9,119 | 100.0% |
Employment Status by Age in Kent County
According to the labor force statistics for Kent County, out of the total population over 16 years of age (16,670), 58.1% or 9,685 individuals are in the labor force, with 3.3% or 320 of them unemployed. The age group with the highest labor force participation rate is 30 to 34 years, with 90.0% or 853 individuals in the labor force. Within the labor force, the 45 to 54 years age range has the highest percentage of unemployed individuals, with 5.8% or 110 of them being unemployed.
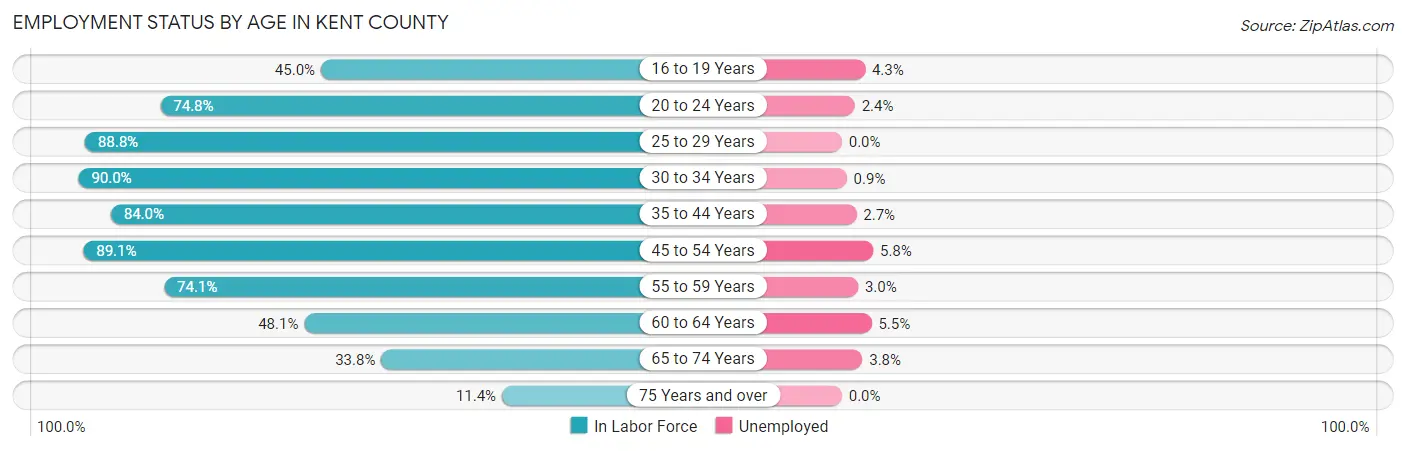
| Age Bracket | In Labor Force | Unemployed |
| 16 to 19 Years | 560 (45.0%) | 24 (4.3%) |
| 20 to 24 Years | 1,097 (74.8%) | 26 (2.4%) |
| 25 to 29 Years | 894 (88.8%) | 0 (0.0%) |
| 30 to 34 Years | 853 (90.0%) | 8 (0.9%) |
| 35 to 44 Years | 1,420 (84.0%) | 38 (2.7%) |
| 45 to 54 Years | 1,904 (89.1%) | 110 (5.8%) |
| 55 to 59 Years | 832 (74.1%) | 25 (3.0%) |
| 60 to 64 Years | 906 (48.1%) | 50 (5.5%) |
| 65 to 74 Years | 946 (33.8%) | 36 (3.8%) |
| 75 Years and over | 270 (11.4%) | 0 (0.0%) |
| Total | 9,685 (58.1%) | 320 (3.3%) |
Employment Status by Educational Attainment in Kent County
According to labor force statistics for Kent County, 77.4% of individuals (6,803) out of the total population between 25 and 64 years of age (8,789) are in the labor force, with 3.4% or 231 of them being unemployed. The group with the highest labor force participation rate are those with the educational attainment of bachelor's degree or higher, with 86.2% or 2,703 individuals in the labor force. Within the labor force, individuals with college / associate degree education have the highest percentage of unemployment, with 5.1% or 81 of them being unemployed.
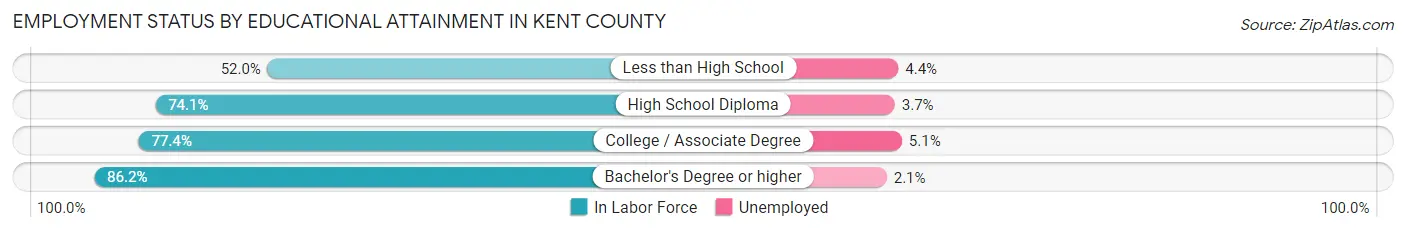
| Educational Attainment | In Labor Force | Unemployed |
| Less than High School | 363 (52.0%) | 31 (4.4%) |
| High School Diploma | 2,149 (74.1%) | 107 (3.7%) |
| College / Associate Degree | 1,591 (77.4%) | 105 (5.1%) |
| Bachelor's Degree or higher | 2,703 (86.2%) | 66 (2.1%) |
| Total | 6,803 (77.4%) | 299 (3.4%) |
Employment Occupations by Sex in Kent County
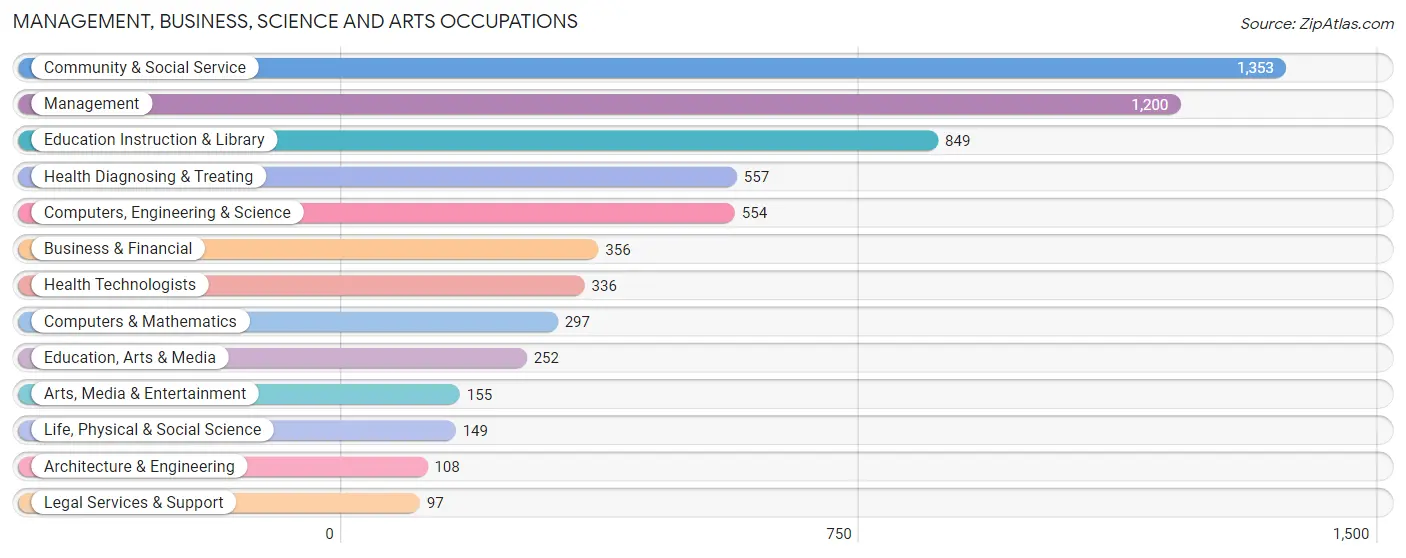
Management, Business, Science and Arts Occupations
The most common Management, Business, Science and Arts occupations in Kent County are Community & Social Service (1,353 | 14.6%), Management (1,200 | 12.9%), Education Instruction & Library (849 | 9.1%), Health Diagnosing & Treating (557 | 6.0%), and Computers, Engineering & Science (554 | 6.0%).
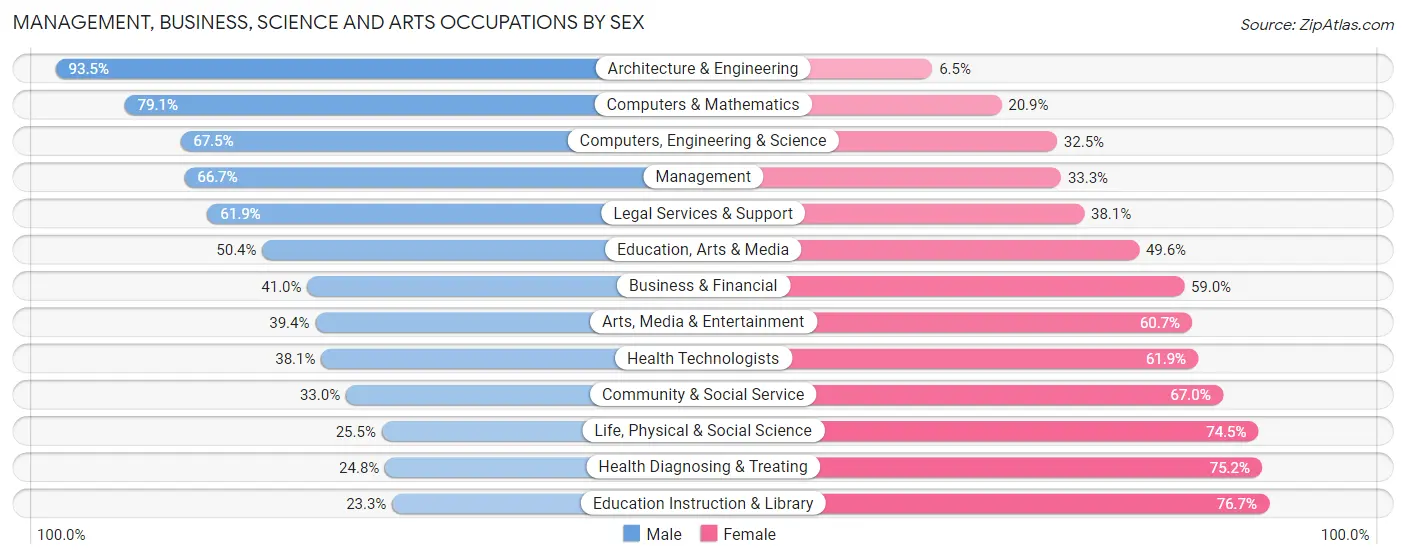
Management, Business, Science and Arts Occupations by Sex
Within the Management, Business, Science and Arts occupations in Kent County, the most male-oriented occupations are Architecture & Engineering (93.5%), Computers & Mathematics (79.1%), and Computers, Engineering & Science (67.5%), while the most female-oriented occupations are Education Instruction & Library (76.7%), Health Diagnosing & Treating (75.2%), and Life, Physical & Social Science (74.5%).
| Occupation | Male | Female |
| Management | 800 (66.7%) | 400 (33.3%) |
| Business & Financial | 146 (41.0%) | 210 (59.0%) |
| Computers, Engineering & Science | 374 (67.5%) | 180 (32.5%) |
| Computers & Mathematics | 235 (79.1%) | 62 (20.9%) |
| Architecture & Engineering | 101 (93.5%) | 7 (6.5%) |
| Life, Physical & Social Science | 38 (25.5%) | 111 (74.5%) |
| Community & Social Service | 446 (33.0%) | 907 (67.0%) |
| Education, Arts & Media | 127 (50.4%) | 125 (49.6%) |
| Legal Services & Support | 60 (61.9%) | 37 (38.1%) |
| Education Instruction & Library | 198 (23.3%) | 651 (76.7%) |
| Arts, Media & Entertainment | 61 (39.4%) | 94 (60.7%) |
| Health Diagnosing & Treating | 138 (24.8%) | 419 (75.2%) |
| Health Technologists | 128 (38.1%) | 208 (61.9%) |
| Total (Category) | 1,904 (47.4%) | 2,116 (52.6%) |
| Total (Overall) | 4,697 (50.6%) | 4,582 (49.4%) |
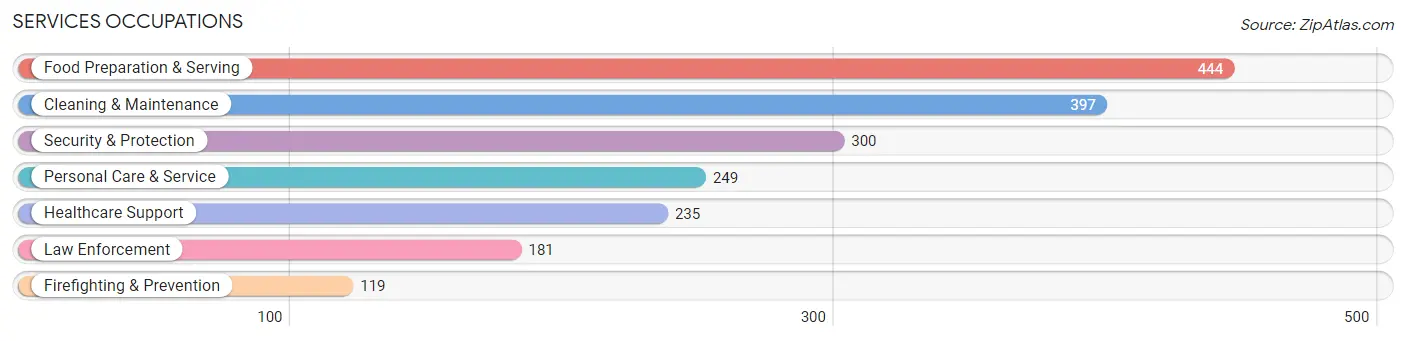
Services Occupations
The most common Services occupations in Kent County are Food Preparation & Serving (444 | 4.8%), Cleaning & Maintenance (397 | 4.3%), Security & Protection (300 | 3.2%), Personal Care & Service (249 | 2.7%), and Healthcare Support (235 | 2.5%).
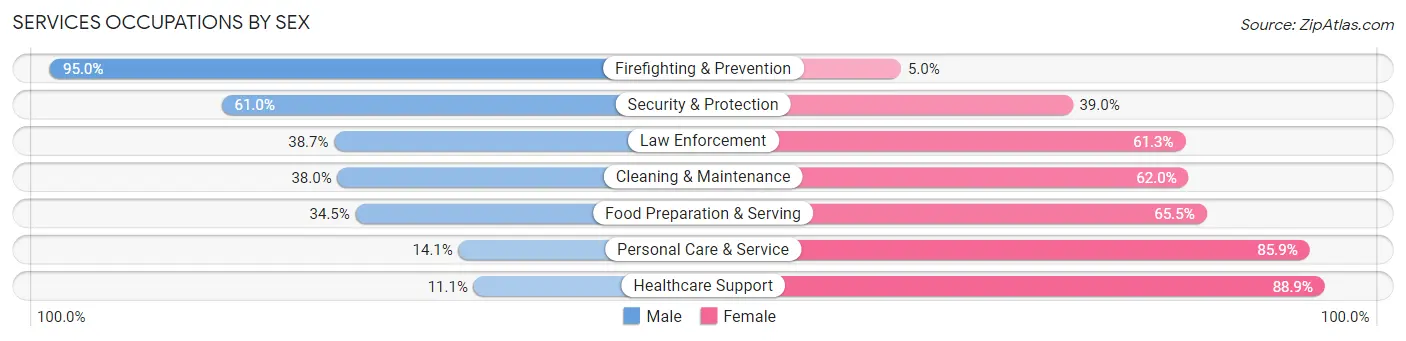
Services Occupations by Sex
Within the Services occupations in Kent County, the most male-oriented occupations are Firefighting & Prevention (95.0%), Security & Protection (61.0%), and Law Enforcement (38.7%), while the most female-oriented occupations are Healthcare Support (88.9%), Personal Care & Service (85.9%), and Food Preparation & Serving (65.5%).
| Occupation | Male | Female |
| Healthcare Support | 26 (11.1%) | 209 (88.9%) |
| Security & Protection | 183 (61.0%) | 117 (39.0%) |
| Firefighting & Prevention | 113 (95.0%) | 6 (5.0%) |
| Law Enforcement | 70 (38.7%) | 111 (61.3%) |
| Food Preparation & Serving | 153 (34.5%) | 291 (65.5%) |
| Cleaning & Maintenance | 151 (38.0%) | 246 (62.0%) |
| Personal Care & Service | 35 (14.1%) | 214 (85.9%) |
| Total (Category) | 548 (33.7%) | 1,077 (66.3%) |
| Total (Overall) | 4,697 (50.6%) | 4,582 (49.4%) |
Sales and Office Occupations
The most common Sales and Office occupations in Kent County are Sales & Related (858 | 9.2%), and Office & Administration (828 | 8.9%).

Sales and Office Occupations by Sex

| Occupation | Male | Female |
| Sales & Related | 459 (53.5%) | 399 (46.5%) |
| Office & Administration | 96 (11.6%) | 732 (88.4%) |
| Total (Category) | 555 (32.9%) | 1,131 (67.1%) |
| Total (Overall) | 4,697 (50.6%) | 4,582 (49.4%) |
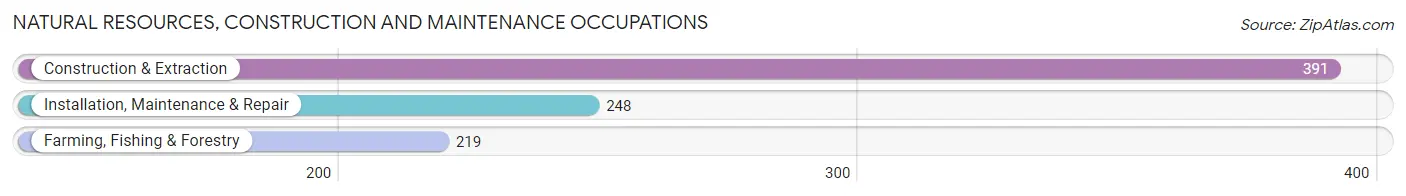
Natural Resources, Construction and Maintenance Occupations
The most common Natural Resources, Construction and Maintenance occupations in Kent County are Construction & Extraction (391 | 4.2%), Installation, Maintenance & Repair (248 | 2.7%), and Farming, Fishing & Forestry (219 | 2.4%).
Natural Resources, Construction and Maintenance Occupations by Sex
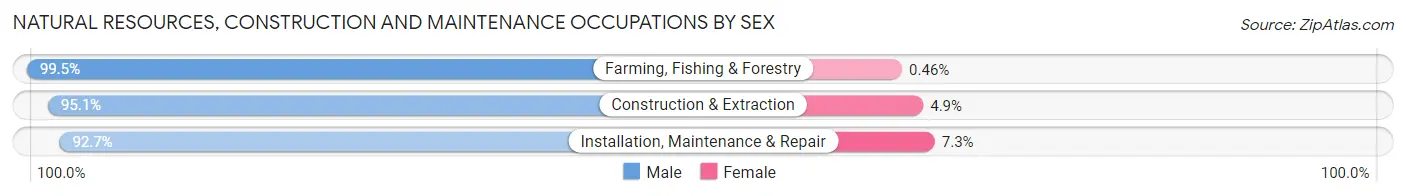
| Occupation | Male | Female |
| Farming, Fishing & Forestry | 218 (99.5%) | 1 (0.5%) |
| Construction & Extraction | 372 (95.1%) | 19 (4.9%) |
| Installation, Maintenance & Repair | 230 (92.7%) | 18 (7.3%) |
| Total (Category) | 820 (95.6%) | 38 (4.4%) |
| Total (Overall) | 4,697 (50.6%) | 4,582 (49.4%) |
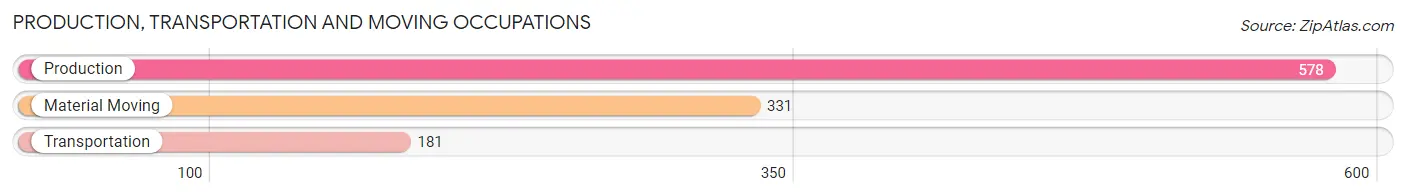
Production, Transportation and Moving Occupations
The most common Production, Transportation and Moving occupations in Kent County are Production (578 | 6.2%), Material Moving (331 | 3.6%), and Transportation (181 | 1.9%).
Production, Transportation and Moving Occupations by Sex
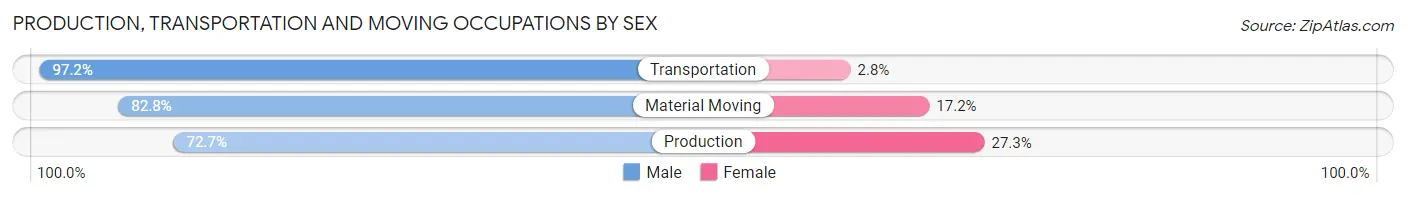
| Occupation | Male | Female |
| Production | 420 (72.7%) | 158 (27.3%) |
| Transportation | 176 (97.2%) | 5 (2.8%) |
| Material Moving | 274 (82.8%) | 57 (17.2%) |
| Total (Category) | 870 (79.8%) | 220 (20.2%) |
| Total (Overall) | 4,697 (50.6%) | 4,582 (49.4%) |
Employment Industries by Sex in Kent County
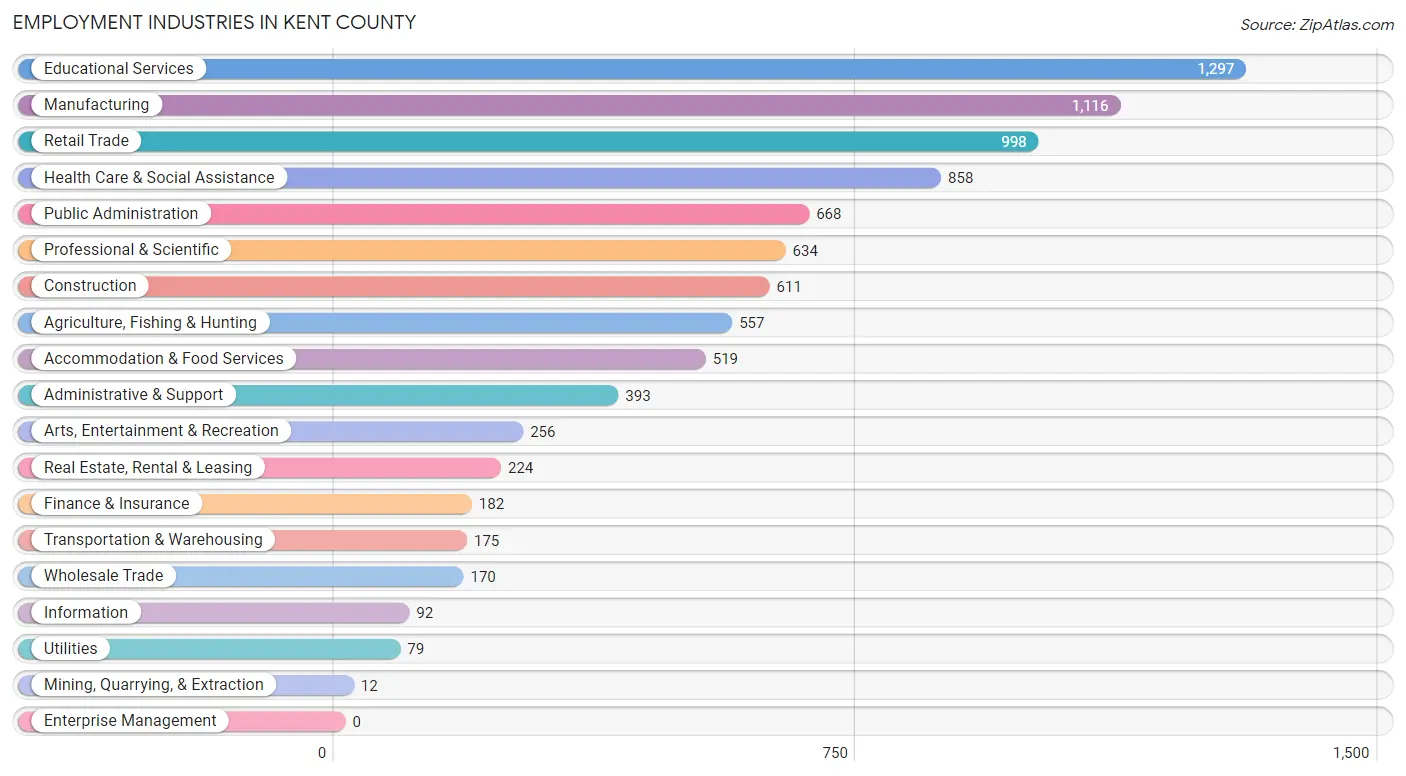
Employment Industries in Kent County
The major employment industries in Kent County include Educational Services (1,297 | 14.0%), Manufacturing (1,116 | 12.0%), Retail Trade (998 | 10.8%), Health Care & Social Assistance (858 | 9.2%), and Public Administration (668 | 7.2%).
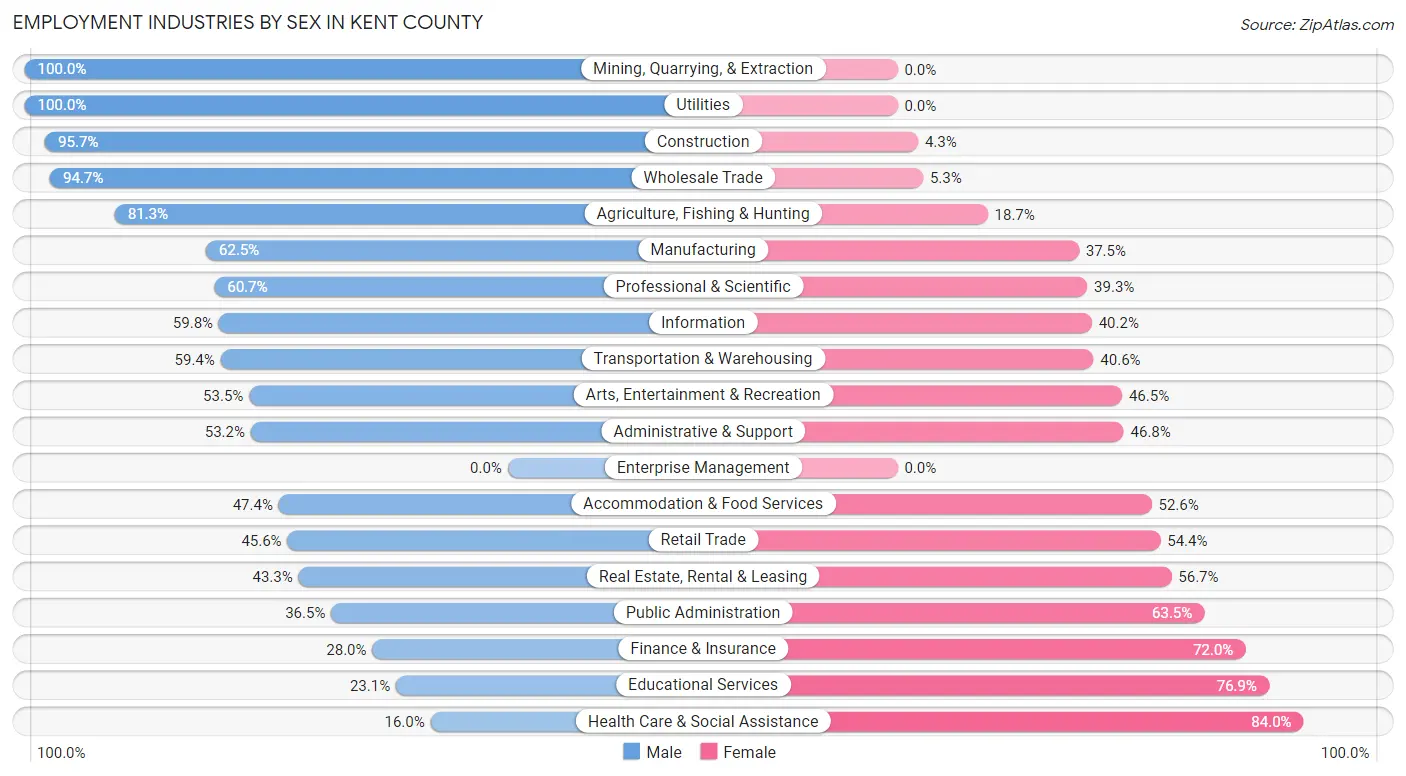
Employment Industries by Sex in Kent County
The Kent County industries that see more men than women are Mining, Quarrying, & Extraction (100.0%), Utilities (100.0%), and Construction (95.7%), whereas the industries that tend to have a higher number of women are Health Care & Social Assistance (84.0%), Educational Services (76.9%), and Finance & Insurance (72.0%).
| Industry | Male | Female |
| Agriculture, Fishing & Hunting | 453 (81.3%) | 104 (18.7%) |
| Mining, Quarrying, & Extraction | 12 (100.0%) | 0 (0.0%) |
| Construction | 585 (95.7%) | 26 (4.3%) |
| Manufacturing | 697 (62.5%) | 419 (37.5%) |
| Wholesale Trade | 161 (94.7%) | 9 (5.3%) |
| Retail Trade | 455 (45.6%) | 543 (54.4%) |
| Transportation & Warehousing | 104 (59.4%) | 71 (40.6%) |
| Utilities | 79 (100.0%) | 0 (0.0%) |
| Information | 55 (59.8%) | 37 (40.2%) |
| Finance & Insurance | 51 (28.0%) | 131 (72.0%) |
| Real Estate, Rental & Leasing | 97 (43.3%) | 127 (56.7%) |
| Professional & Scientific | 385 (60.7%) | 249 (39.3%) |
| Enterprise Management | 0 (0.0%) | 0 (0.0%) |
| Administrative & Support | 209 (53.2%) | 184 (46.8%) |
| Educational Services | 300 (23.1%) | 997 (76.9%) |
| Health Care & Social Assistance | 137 (16.0%) | 721 (84.0%) |
| Arts, Entertainment & Recreation | 137 (53.5%) | 119 (46.5%) |
| Accommodation & Food Services | 246 (47.4%) | 273 (52.6%) |
| Public Administration | 244 (36.5%) | 424 (63.5%) |
| Total | 4,697 (50.6%) | 4,582 (49.4%) |
Education in Kent County
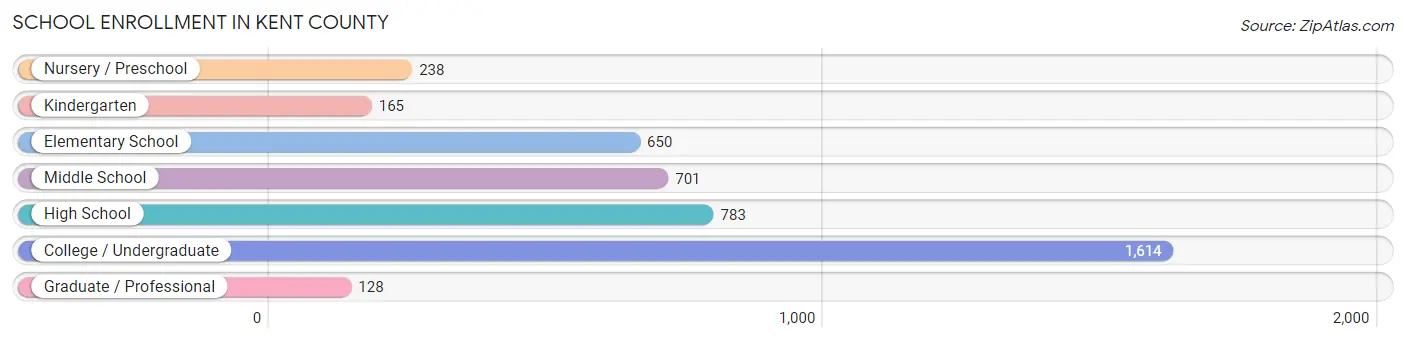
School Enrollment in Kent County
The most common levels of schooling among the 4,279 students in Kent County are college / undergraduate (1,614 | 37.7%), high school (783 | 18.3%), and middle school (701 | 16.4%).
| School Level | # Students | % Students |
| Nursery / Preschool | 238 | 5.6% |
| Kindergarten | 165 | 3.9% |
| Elementary School | 650 | 15.2% |
| Middle School | 701 | 16.4% |
| High School | 783 | 18.3% |
| College / Undergraduate | 1,614 | 37.7% |
| Graduate / Professional | 128 | 3.0% |
| Total | 4,279 | 100.0% |
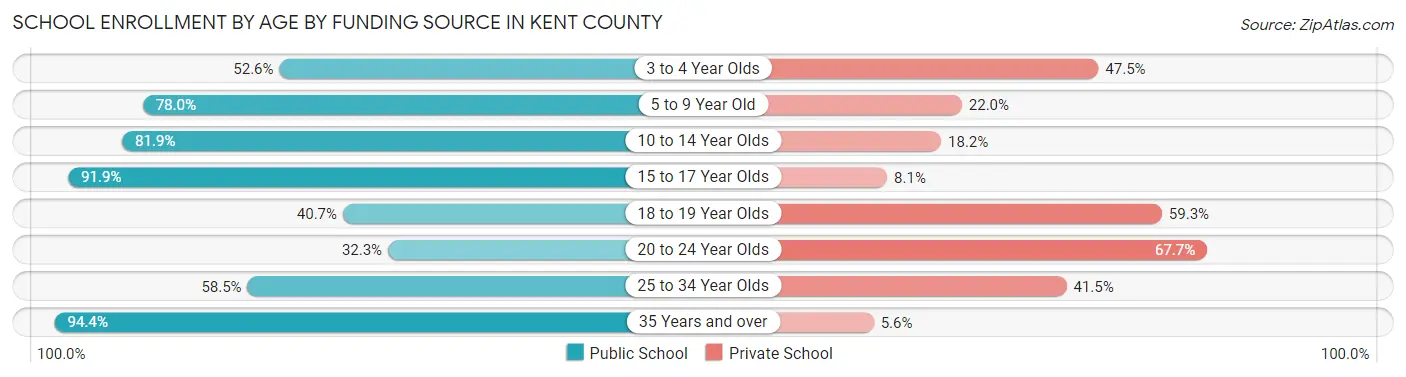
School Enrollment by Age by Funding Source in Kent County
Out of a total of 4,279 students who are enrolled in schools in Kent County, 1,528 (35.7%) attend a private institution, while the remaining 2,751 (64.3%) are enrolled in public schools. The age group of 20 to 24 year olds has the highest likelihood of being enrolled in private schools, with 532 (67.7% in the age bracket) enrolled. Conversely, the age group of 35 years and over has the lowest likelihood of being enrolled in a private school, with 169 (94.4% in the age bracket) attending a public institution.
| Age Bracket | Public School | Private School |
| 3 to 4 Year Olds | 103 (52.5%) | 93 (47.4%) |
| 5 to 9 Year Old | 645 (78.0%) | 182 (22.0%) |
| 10 to 14 Year Olds | 636 (81.9%) | 141 (18.1%) |
| 15 to 17 Year Olds | 556 (91.9%) | 49 (8.1%) |
| 18 to 19 Year Olds | 327 (40.7%) | 476 (59.3%) |
| 20 to 24 Year Olds | 254 (32.3%) | 532 (67.7%) |
| 25 to 34 Year Olds | 62 (58.5%) | 44 (41.5%) |
| 35 Years and over | 169 (94.4%) | 10 (5.6%) |
| Total | 2,751 (64.3%) | 1,528 (35.7%) |
Educational Attainment by Field of Study in Kent County
Social sciences (775 | 14.0%), education (725 | 13.1%), business (707 | 12.8%), bio, nature & agricultural (415 | 7.5%), and science & technology (403 | 7.3%) are the most common fields of study among 5,537 individuals in Kent County who have obtained a bachelor's degree or higher.
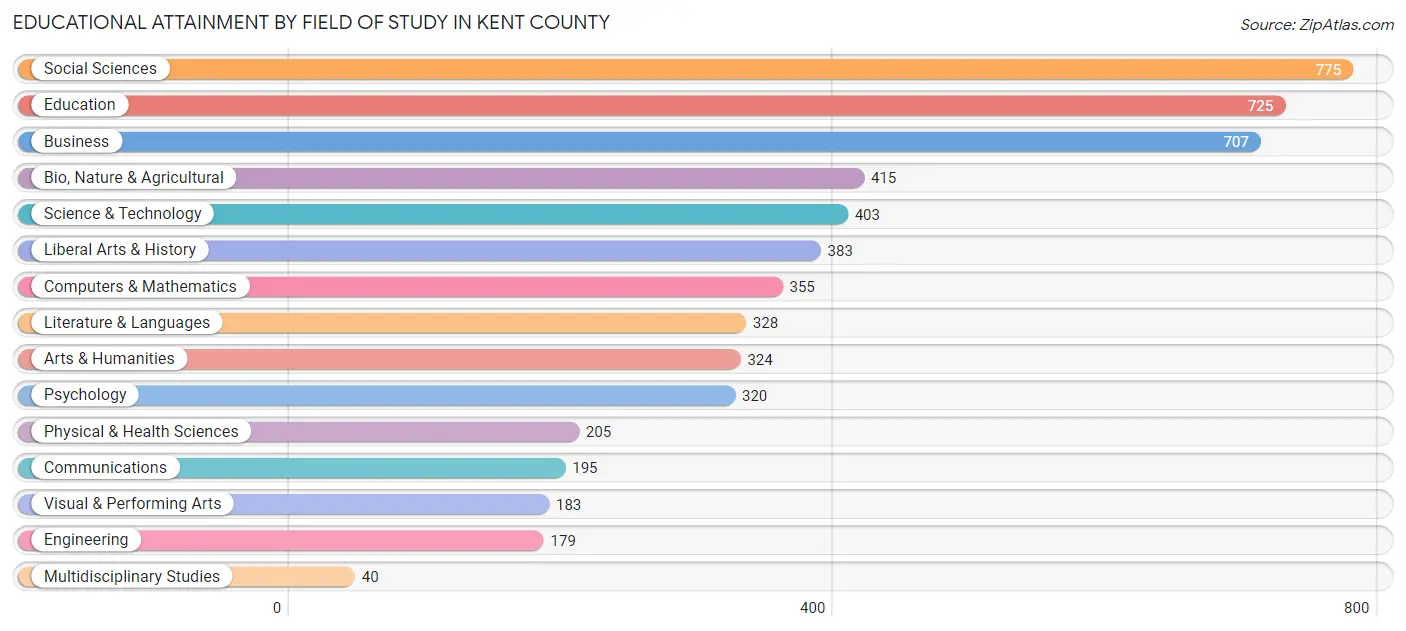
| Field of Study | # Graduates | % Graduates |
| Computers & Mathematics | 355 | 6.4% |
| Bio, Nature & Agricultural | 415 | 7.5% |
| Physical & Health Sciences | 205 | 3.7% |
| Psychology | 320 | 5.8% |
| Social Sciences | 775 | 14.0% |
| Engineering | 179 | 3.2% |
| Multidisciplinary Studies | 40 | 0.7% |
| Science & Technology | 403 | 7.3% |
| Business | 707 | 12.8% |
| Education | 725 | 13.1% |
| Literature & Languages | 328 | 5.9% |
| Liberal Arts & History | 383 | 6.9% |
| Visual & Performing Arts | 183 | 3.3% |
| Communications | 195 | 3.5% |
| Arts & Humanities | 324 | 5.9% |
| Total | 5,537 | 100.0% |
Transportation & Commute in Kent County
Vehicle Availability by Sex in Kent County
The most prevalent vehicle ownership categories in Kent County are males with 2 vehicles (2,004, accounting for 44.1%) and females with 2 vehicles (1,552, making up 49.7%).
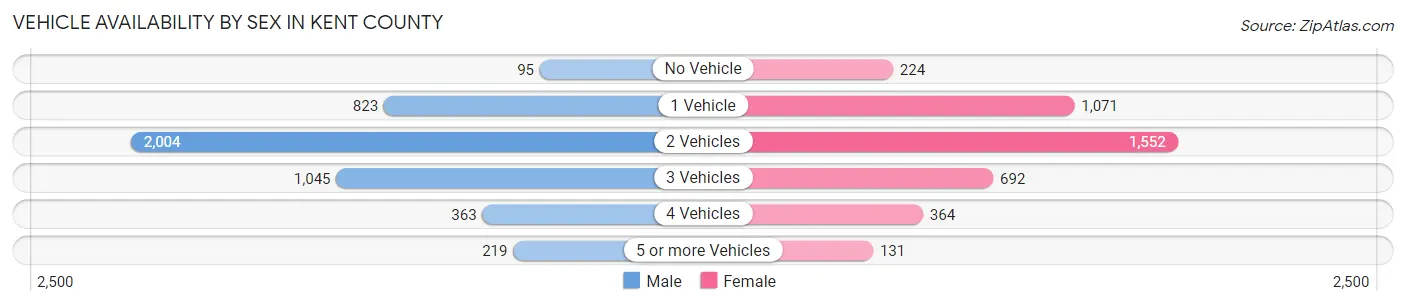
| Vehicles Available | Male | Female |
| No Vehicle | 95 (2.1%) | 224 (5.6%) |
| 1 Vehicle | 823 (18.1%) | 1,071 (26.6%) |
| 2 Vehicles | 2,004 (44.1%) | 1,552 (38.5%) |
| 3 Vehicles | 1,045 (23.0%) | 692 (17.2%) |
| 4 Vehicles | 363 (8.0%) | 364 (9.0%) |
| 5 or more Vehicles | 219 (4.8%) | 131 (3.3%) |
| Total | 4,549 (100.0%) | 4,034 (100.0%) |
Commute Time in Kent County
The most frequently occuring commute durations in Kent County are 5 to 9 minutes (1,560 commuters, 18.8%), 15 to 19 minutes (1,213 commuters, 14.6%), and 20 to 24 minutes (1,130 commuters, 13.6%).
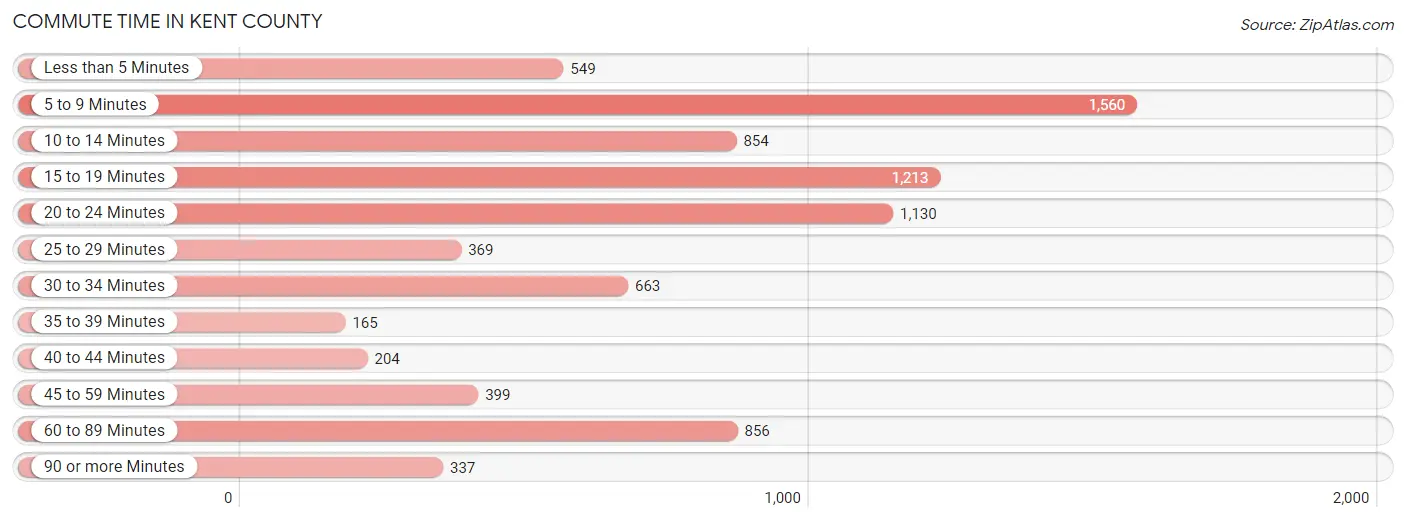
| Commute Time | # Commuters | % Commuters |
| Less than 5 Minutes | 549 | 6.6% |
| 5 to 9 Minutes | 1,560 | 18.8% |
| 10 to 14 Minutes | 854 | 10.3% |
| 15 to 19 Minutes | 1,213 | 14.6% |
| 20 to 24 Minutes | 1,130 | 13.6% |
| 25 to 29 Minutes | 369 | 4.4% |
| 30 to 34 Minutes | 663 | 8.0% |
| 35 to 39 Minutes | 165 | 2.0% |
| 40 to 44 Minutes | 204 | 2.5% |
| 45 to 59 Minutes | 399 | 4.8% |
| 60 to 89 Minutes | 856 | 10.3% |
| 90 or more Minutes | 337 | 4.1% |
Commute Time by Sex in Kent County
The most common commute times in Kent County are 20 to 24 minutes (640 commuters, 15.0%) for males and 5 to 9 minutes (964 commuters, 24.0%) for females.
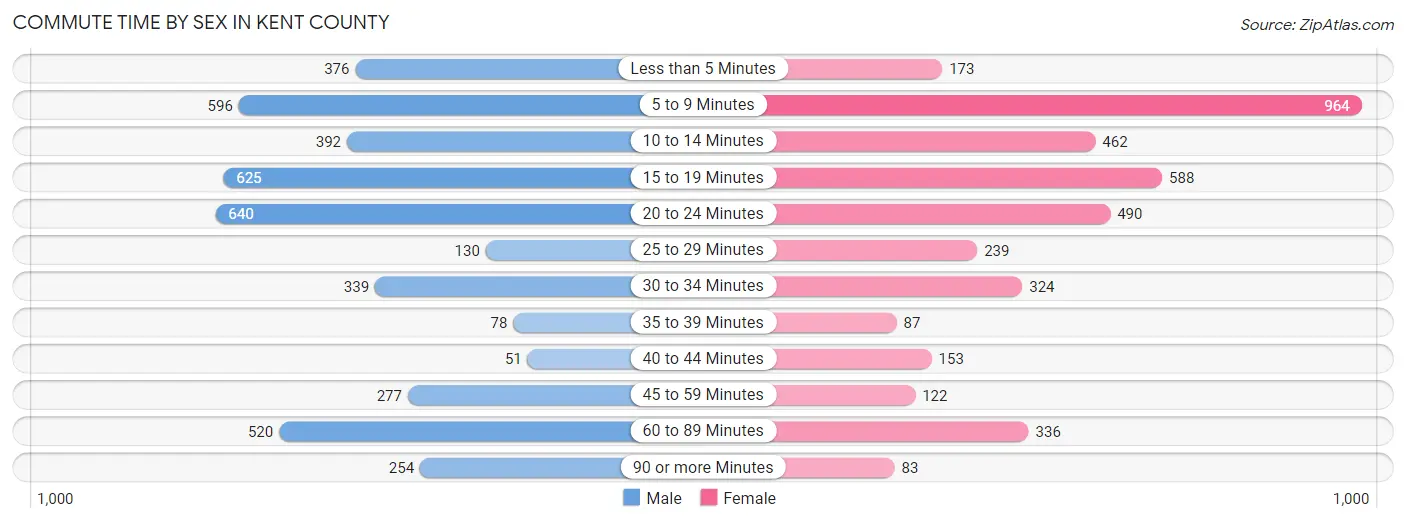
| Commute Time | Male | Female |
| Less than 5 Minutes | 376 (8.8%) | 173 (4.3%) |
| 5 to 9 Minutes | 596 (13.9%) | 964 (24.0%) |
| 10 to 14 Minutes | 392 (9.2%) | 462 (11.5%) |
| 15 to 19 Minutes | 625 (14.6%) | 588 (14.6%) |
| 20 to 24 Minutes | 640 (15.0%) | 490 (12.2%) |
| 25 to 29 Minutes | 130 (3.0%) | 239 (5.9%) |
| 30 to 34 Minutes | 339 (7.9%) | 324 (8.1%) |
| 35 to 39 Minutes | 78 (1.8%) | 87 (2.2%) |
| 40 to 44 Minutes | 51 (1.2%) | 153 (3.8%) |
| 45 to 59 Minutes | 277 (6.5%) | 122 (3.0%) |
| 60 to 89 Minutes | 520 (12.2%) | 336 (8.4%) |
| 90 or more Minutes | 254 (5.9%) | 83 (2.1%) |
Time of Departure to Work by Sex in Kent County
The most frequent times of departure to work in Kent County are 6:30 AM to 6:59 AM (629, 14.7%) for males and 7:00 AM to 7:29 AM (632, 15.7%) for females.

| Time of Departure | Male | Female |
| 12:00 AM to 4:59 AM | 243 (5.7%) | 205 (5.1%) |
| 5:00 AM to 5:29 AM | 166 (3.9%) | 145 (3.6%) |
| 5:30 AM to 5:59 AM | 305 (7.1%) | 202 (5.0%) |
| 6:00 AM to 6:29 AM | 619 (14.5%) | 177 (4.4%) |
| 6:30 AM to 6:59 AM | 629 (14.7%) | 108 (2.7%) |
| 7:00 AM to 7:29 AM | 535 (12.5%) | 632 (15.7%) |
| 7:30 AM to 7:59 AM | 310 (7.2%) | 528 (13.1%) |
| 8:00 AM to 8:29 AM | 526 (12.3%) | 457 (11.4%) |
| 8:30 AM to 8:59 AM | 115 (2.7%) | 384 (9.6%) |
| 9:00 AM to 9:59 AM | 209 (4.9%) | 129 (3.2%) |
| 10:00 AM to 10:59 AM | 97 (2.3%) | 133 (3.3%) |
| 11:00 AM to 11:59 AM | 7 (0.2%) | 128 (3.2%) |
| 12:00 PM to 3:59 PM | 366 (8.6%) | 413 (10.3%) |
| 4:00 PM to 11:59 PM | 151 (3.5%) | 380 (9.5%) |
| Total | 4,278 (100.0%) | 4,021 (100.0%) |
Housing Occupancy in Kent County
Occupancy by Ownership in Kent County
Of the total 8,375 dwellings in Kent County, owner-occupied units account for 5,847 (69.8%), while renter-occupied units make up 2,528 (30.2%).
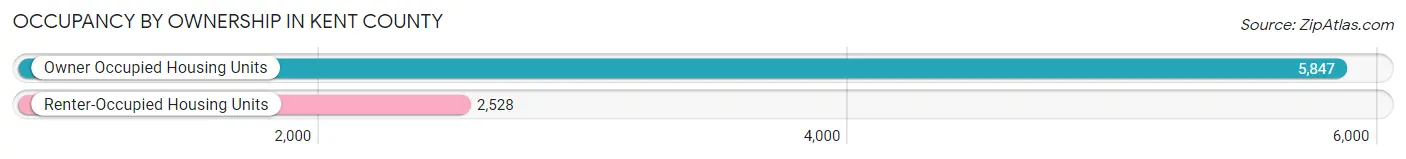
| Occupancy | # Housing Units | % Housing Units |
| Owner Occupied Housing Units | 5,847 | 69.8% |
| Renter-Occupied Housing Units | 2,528 | 30.2% |
| Total Occupied Housing Units | 8,375 | 100.0% |
Occupancy by Household Size in Kent County
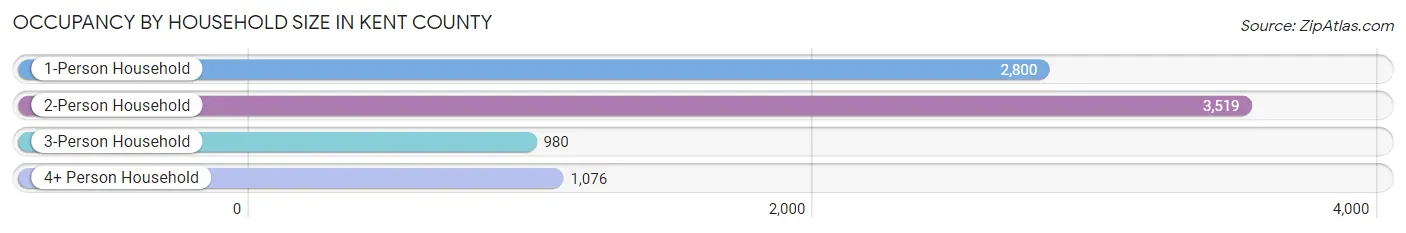
| Household Size | # Housing Units | % Housing Units |
| 1-Person Household | 2,800 | 33.4% |
| 2-Person Household | 3,519 | 42.0% |
| 3-Person Household | 980 | 11.7% |
| 4+ Person Household | 1,076 | 12.9% |
| Total Housing Units | 8,375 | 100.0% |
Occupancy by Ownership by Household Size in Kent County
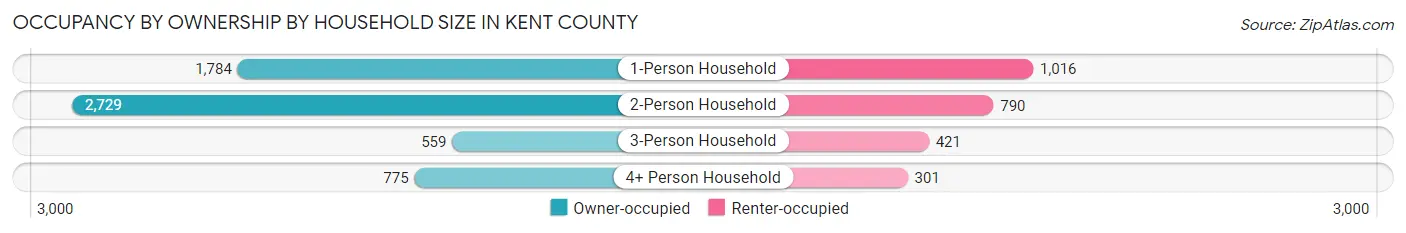
| Household Size | Owner-occupied | Renter-occupied |
| 1-Person Household | 1,784 (63.7%) | 1,016 (36.3%) |
| 2-Person Household | 2,729 (77.5%) | 790 (22.5%) |
| 3-Person Household | 559 (57.0%) | 421 (43.0%) |
| 4+ Person Household | 775 (72.0%) | 301 (28.0%) |
| Total Housing Units | 5,847 (69.8%) | 2,528 (30.2%) |
Occupancy by Educational Attainment in Kent County
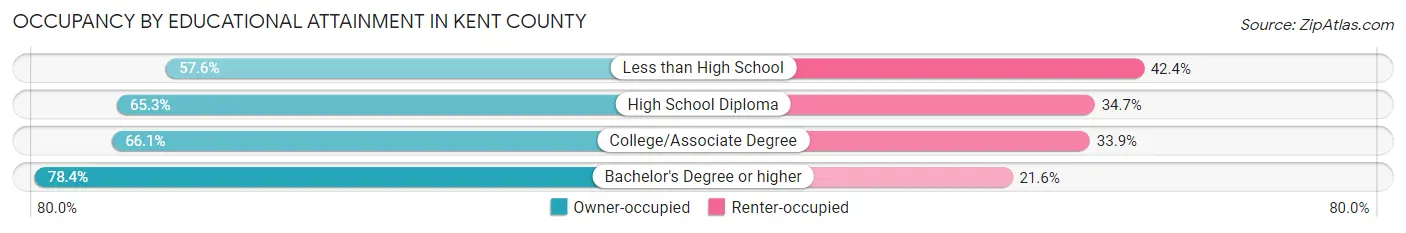
| Household Size | Owner-occupied | Renter-occupied |
| Less than High School | 430 (57.6%) | 317 (42.4%) |
| High School Diploma | 1,691 (65.3%) | 897 (34.7%) |
| College/Associate Degree | 1,207 (66.1%) | 619 (33.9%) |
| Bachelor's Degree or higher | 2,519 (78.4%) | 695 (21.6%) |
Occupancy by Age of Householder in Kent County
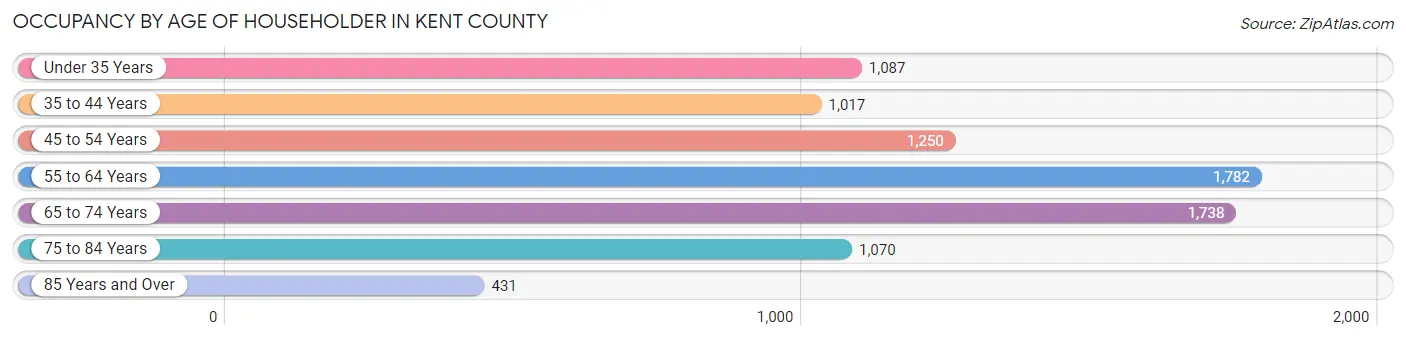
| Age Bracket | # Households | % Households |
| Under 35 Years | 1,087 | 13.0% |
| 35 to 44 Years | 1,017 | 12.1% |
| 45 to 54 Years | 1,250 | 14.9% |
| 55 to 64 Years | 1,782 | 21.3% |
| 65 to 74 Years | 1,738 | 20.7% |
| 75 to 84 Years | 1,070 | 12.8% |
| 85 Years and Over | 431 | 5.1% |
| Total | 8,375 | 100.0% |
Housing Finances in Kent County
Median Income by Occupancy in Kent County
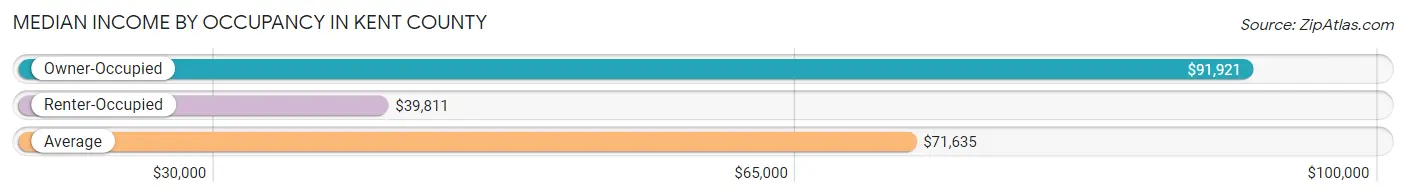
| Occupancy Type | # Households | Median Income |
| Owner-Occupied | 5,847 (69.8%) | $91,921 |
| Renter-Occupied | 2,528 (30.2%) | $39,811 |
| Average | 8,375 (100.0%) | $71,635 |
Occupancy by Householder Income Bracket in Kent County
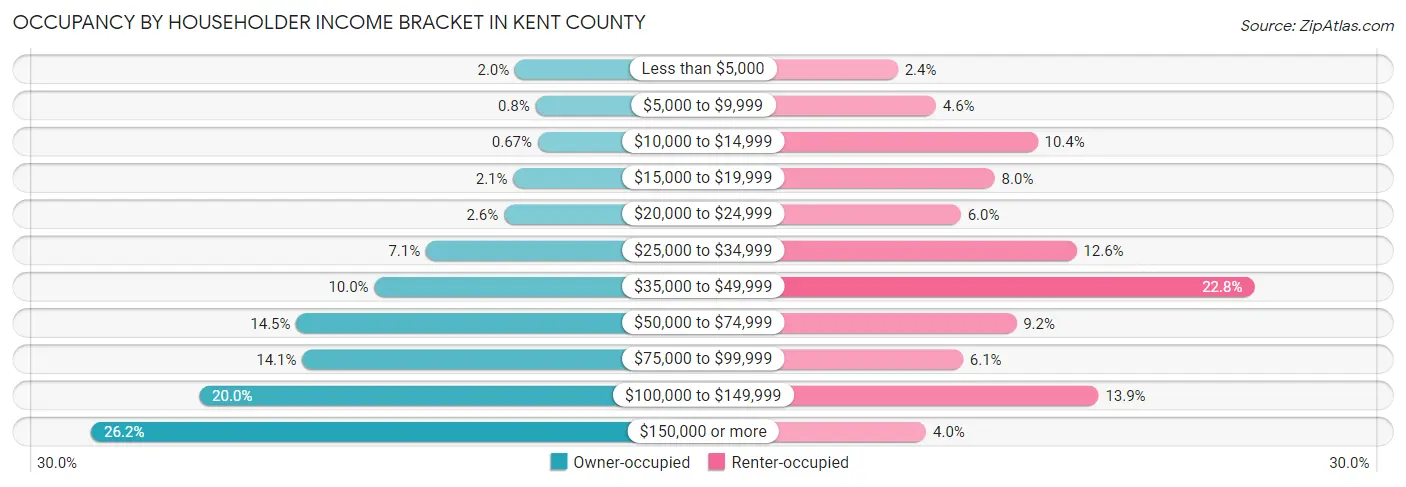
| Income Bracket | Owner-occupied | Renter-occupied |
| Less than $5,000 | 115 (2.0%) | 61 (2.4%) |
| $5,000 to $9,999 | 47 (0.8%) | 116 (4.6%) |
| $10,000 to $14,999 | 39 (0.7%) | 263 (10.4%) |
| $15,000 to $19,999 | 121 (2.1%) | 201 (8.0%) |
| $20,000 to $24,999 | 152 (2.6%) | 152 (6.0%) |
| $25,000 to $34,999 | 413 (7.1%) | 319 (12.6%) |
| $35,000 to $49,999 | 585 (10.0%) | 576 (22.8%) |
| $50,000 to $74,999 | 846 (14.5%) | 232 (9.2%) |
| $75,000 to $99,999 | 826 (14.1%) | 155 (6.1%) |
| $100,000 to $149,999 | 1,171 (20.0%) | 351 (13.9%) |
| $150,000 or more | 1,532 (26.2%) | 102 (4.0%) |
| Total | 5,847 (100.0%) | 2,528 (100.0%) |
Monthly Housing Cost Tiers in Kent County
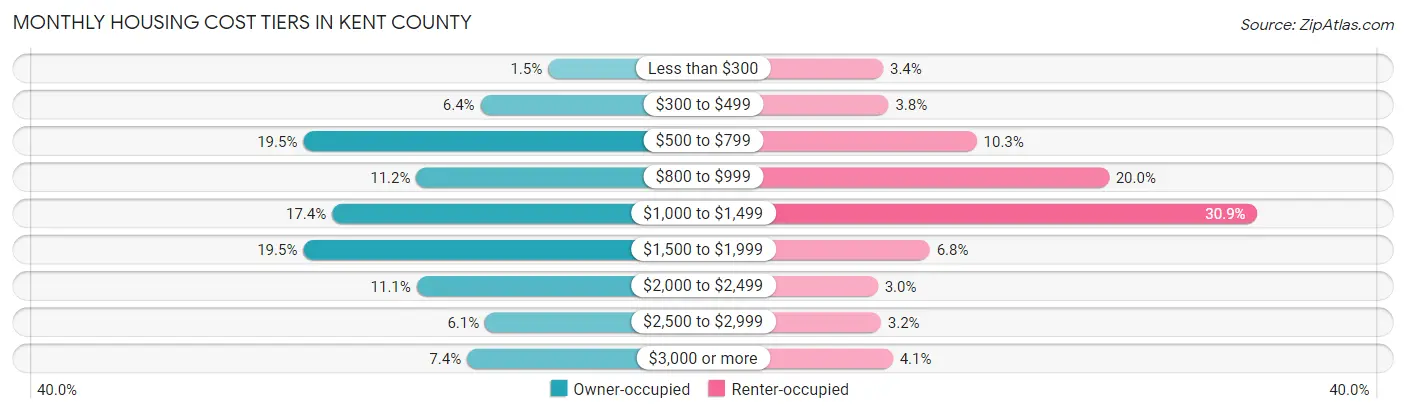
| Monthly Cost | Owner-occupied | Renter-occupied |
| Less than $300 | 85 (1.5%) | 85 (3.4%) |
| $300 to $499 | 376 (6.4%) | 95 (3.8%) |
| $500 to $799 | 1,139 (19.5%) | 259 (10.2%) |
| $800 to $999 | 652 (11.2%) | 505 (20.0%) |
| $1,000 to $1,499 | 1,015 (17.4%) | 782 (30.9%) |
| $1,500 to $1,999 | 1,139 (19.5%) | 172 (6.8%) |
| $2,000 to $2,499 | 651 (11.1%) | 75 (3.0%) |
| $2,500 to $2,999 | 356 (6.1%) | 81 (3.2%) |
| $3,000 or more | 434 (7.4%) | 103 (4.1%) |
| Total | 5,847 (100.0%) | 2,528 (100.0%) |
Physical Housing Characteristics in Kent County
Housing Structures in Kent County
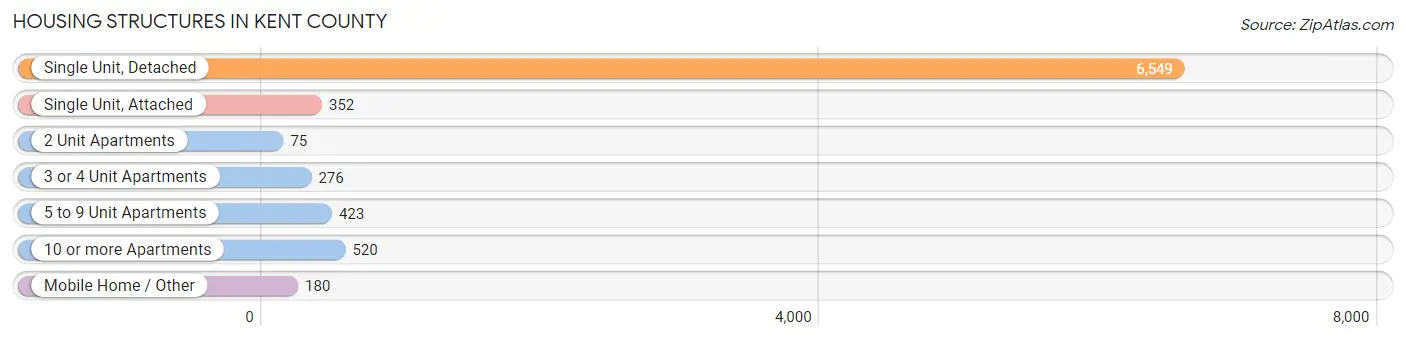
| Structure Type | # Housing Units | % Housing Units |
| Single Unit, Detached | 6,549 | 78.2% |
| Single Unit, Attached | 352 | 4.2% |
| 2 Unit Apartments | 75 | 0.9% |
| 3 or 4 Unit Apartments | 276 | 3.3% |
| 5 to 9 Unit Apartments | 423 | 5.1% |
| 10 or more Apartments | 520 | 6.2% |
| Mobile Home / Other | 180 | 2.1% |
| Total | 8,375 | 100.0% |
Housing Structures by Occupancy in Kent County
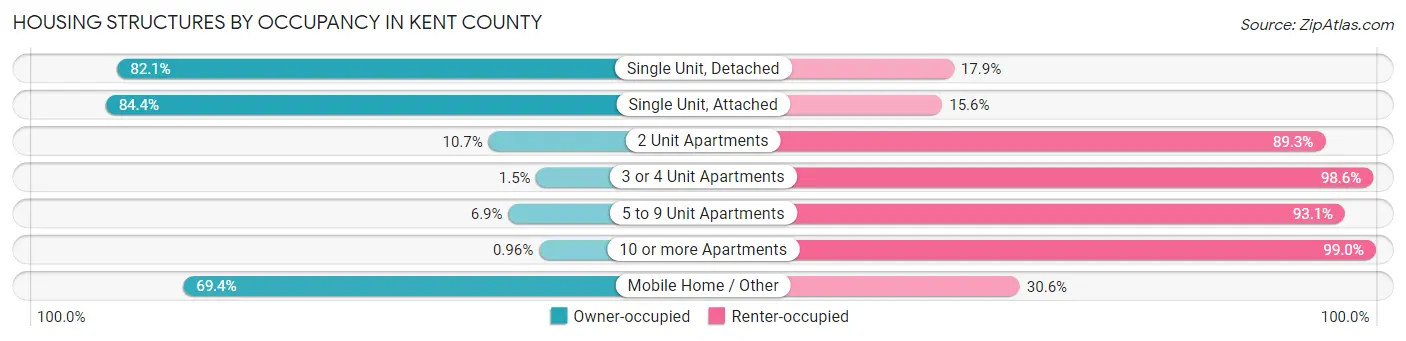
| Structure Type | Owner-occupied | Renter-occupied |
| Single Unit, Detached | 5,379 (82.1%) | 1,170 (17.9%) |
| Single Unit, Attached | 297 (84.4%) | 55 (15.6%) |
| 2 Unit Apartments | 8 (10.7%) | 67 (89.3%) |
| 3 or 4 Unit Apartments | 4 (1.5%) | 272 (98.6%) |
| 5 to 9 Unit Apartments | 29 (6.9%) | 394 (93.1%) |
| 10 or more Apartments | 5 (1.0%) | 515 (99.0%) |
| Mobile Home / Other | 125 (69.4%) | 55 (30.6%) |
| Total | 5,847 (69.8%) | 2,528 (30.2%) |
Housing Structures by Number of Rooms in Kent County
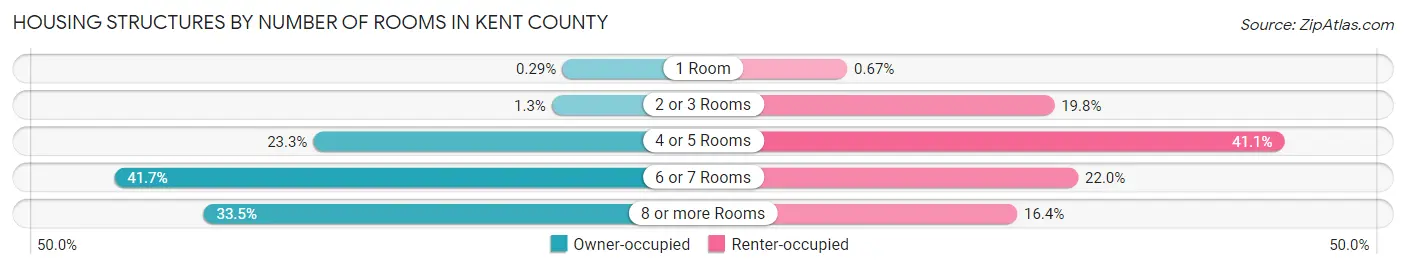
| Number of Rooms | Owner-occupied | Renter-occupied |
| 1 Room | 17 (0.3%) | 17 (0.7%) |
| 2 or 3 Rooms | 73 (1.3%) | 501 (19.8%) |
| 4 or 5 Rooms | 1,363 (23.3%) | 1,039 (41.1%) |
| 6 or 7 Rooms | 2,438 (41.7%) | 557 (22.0%) |
| 8 or more Rooms | 1,956 (33.5%) | 414 (16.4%) |
| Total | 5,847 (100.0%) | 2,528 (100.0%) |
Housing Structure by Heating Type in Kent County
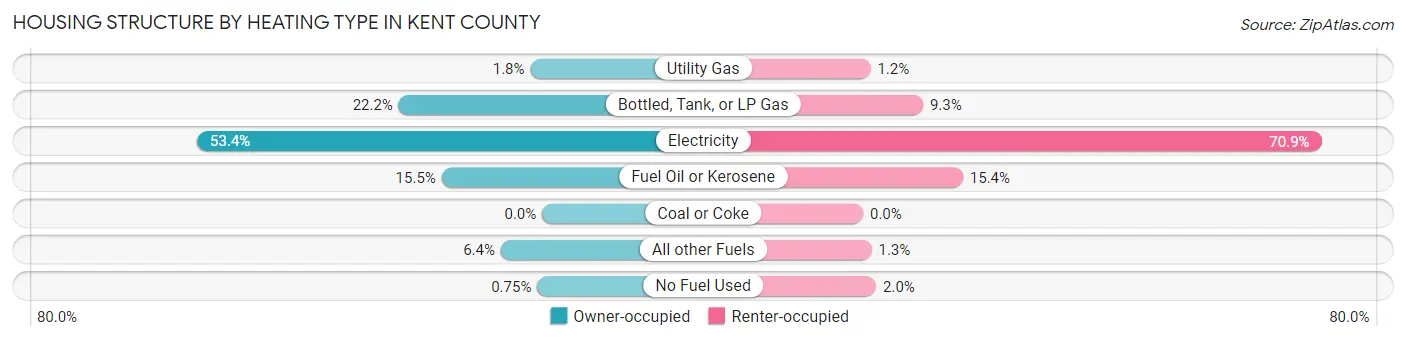
| Heating Type | Owner-occupied | Renter-occupied |
| Utility Gas | 106 (1.8%) | 29 (1.1%) |
| Bottled, Tank, or LP Gas | 1,296 (22.2%) | 234 (9.3%) |
| Electricity | 3,120 (53.4%) | 1,791 (70.9%) |
| Fuel Oil or Kerosene | 908 (15.5%) | 390 (15.4%) |
| Coal or Coke | 0 (0.0%) | 0 (0.0%) |
| All other Fuels | 373 (6.4%) | 33 (1.3%) |
| No Fuel Used | 44 (0.7%) | 51 (2.0%) |
| Total | 5,847 (100.0%) | 2,528 (100.0%) |
Household Vehicle Usage in Kent County
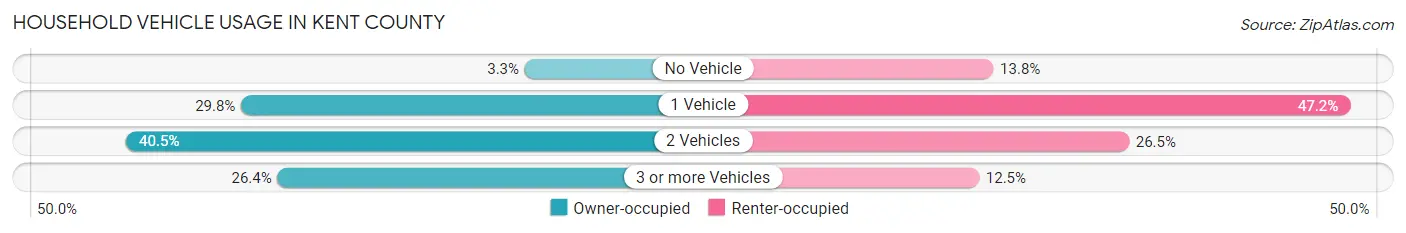
| Vehicles per Household | Owner-occupied | Renter-occupied |
| No Vehicle | 193 (3.3%) | 350 (13.8%) |
| 1 Vehicle | 1,741 (29.8%) | 1,192 (47.1%) |
| 2 Vehicles | 2,370 (40.5%) | 670 (26.5%) |
| 3 or more Vehicles | 1,543 (26.4%) | 316 (12.5%) |
| Total | 5,847 (100.0%) | 2,528 (100.0%) |
Real Estate & Mortgages in Kent County
Real Estate and Mortgage Overview in Kent County
| Characteristic | Without Mortgage | With Mortgage |
| Housing Units | 2,275 | 3,572 |
| Median Property Value | $284,800 | $296,500 |
| Median Household Income | $78,277 | $1,169 |
| Monthly Housing Costs | $698 | $430 |
| Real Estate Taxes | $3,095 | $66 |
Property Value by Mortgage Status in Kent County
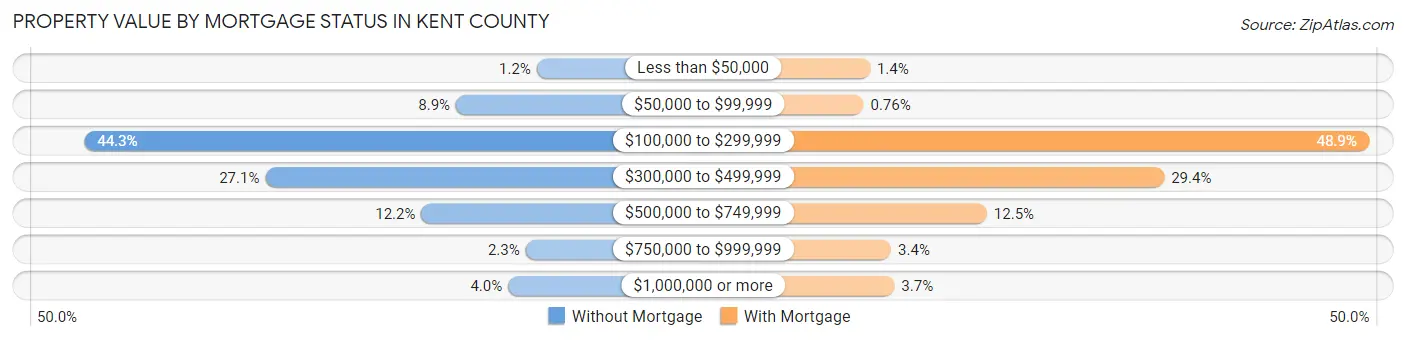
| Property Value | Without Mortgage | With Mortgage |
| Less than $50,000 | 28 (1.2%) | 49 (1.4%) |
| $50,000 to $99,999 | 203 (8.9%) | 27 (0.8%) |
| $100,000 to $299,999 | 1,008 (44.3%) | 1,746 (48.9%) |
| $300,000 to $499,999 | 616 (27.1%) | 1,050 (29.4%) |
| $500,000 to $749,999 | 278 (12.2%) | 447 (12.5%) |
| $750,000 to $999,999 | 52 (2.3%) | 121 (3.4%) |
| $1,000,000 or more | 90 (4.0%) | 132 (3.7%) |
| Total | 2,275 (100.0%) | 3,572 (100.0%) |
Household Income by Mortgage Status in Kent County
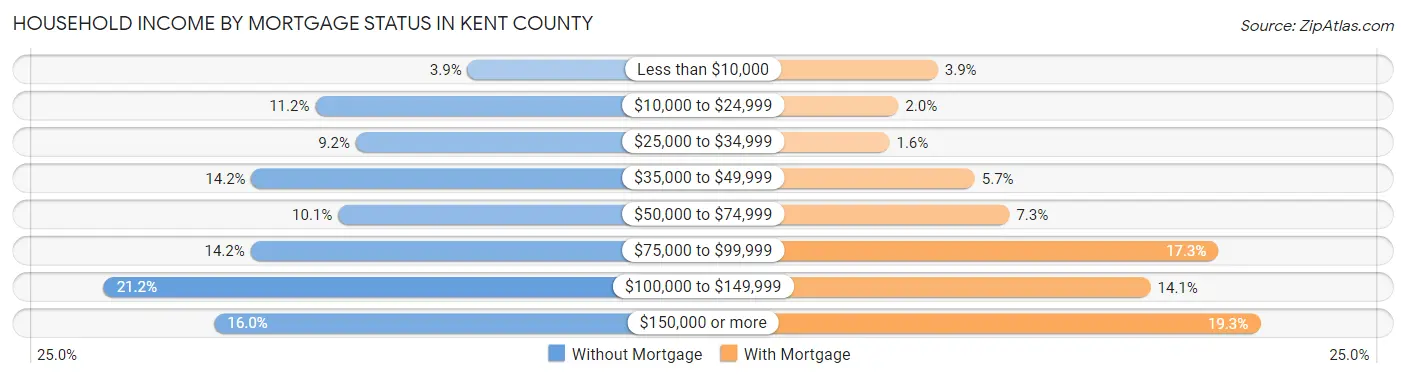
| Household Income | Without Mortgage | With Mortgage |
| Less than $10,000 | 89 (3.9%) | 140 (3.9%) |
| $10,000 to $24,999 | 254 (11.2%) | 73 (2.0%) |
| $25,000 to $34,999 | 210 (9.2%) | 58 (1.6%) |
| $35,000 to $49,999 | 323 (14.2%) | 203 (5.7%) |
| $50,000 to $74,999 | 229 (10.1%) | 262 (7.3%) |
| $75,000 to $99,999 | 324 (14.2%) | 617 (17.3%) |
| $100,000 to $149,999 | 483 (21.2%) | 502 (14.1%) |
| $150,000 or more | 363 (16.0%) | 688 (19.3%) |
| Total | 2,275 (100.0%) | 3,572 (100.0%) |
Property Value to Household Income Ratio in Kent County
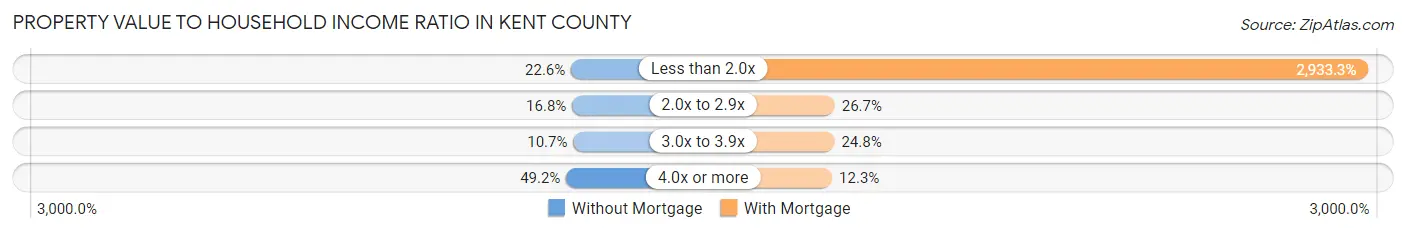
| Value-to-Income Ratio | Without Mortgage | With Mortgage |
| Less than 2.0x | 513 (22.6%) | 104,779 (2,933.3%) |
| 2.0x to 2.9x | 381 (16.8%) | 952 (26.7%) |
| 3.0x to 3.9x | 243 (10.7%) | 887 (24.8%) |
| 4.0x or more | 1,119 (49.2%) | 440 (12.3%) |
| Total | 2,275 (100.0%) | 3,572 (100.0%) |
Real Estate Taxes by Mortgage Status in Kent County
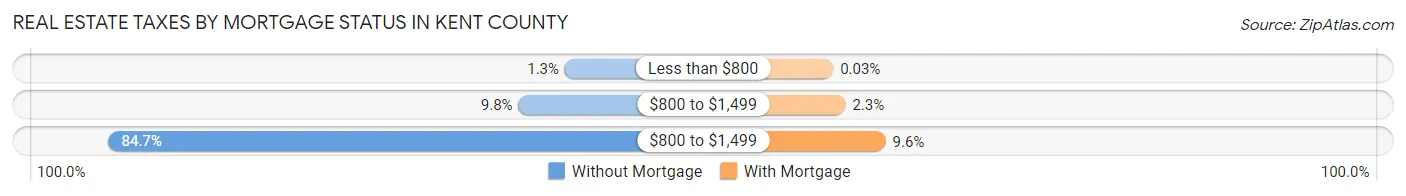
| Property Taxes | Without Mortgage | With Mortgage |
| Less than $800 | 30 (1.3%) | 1 (0.0%) |
| $800 to $1,499 | 223 (9.8%) | 81 (2.3%) |
| $800 to $1,499 | 1,926 (84.7%) | 343 (9.6%) |
| Total | 2,275 (100.0%) | 3,572 (100.0%) |
Health & Disability in Kent County
Health Insurance Coverage by Age in Kent County
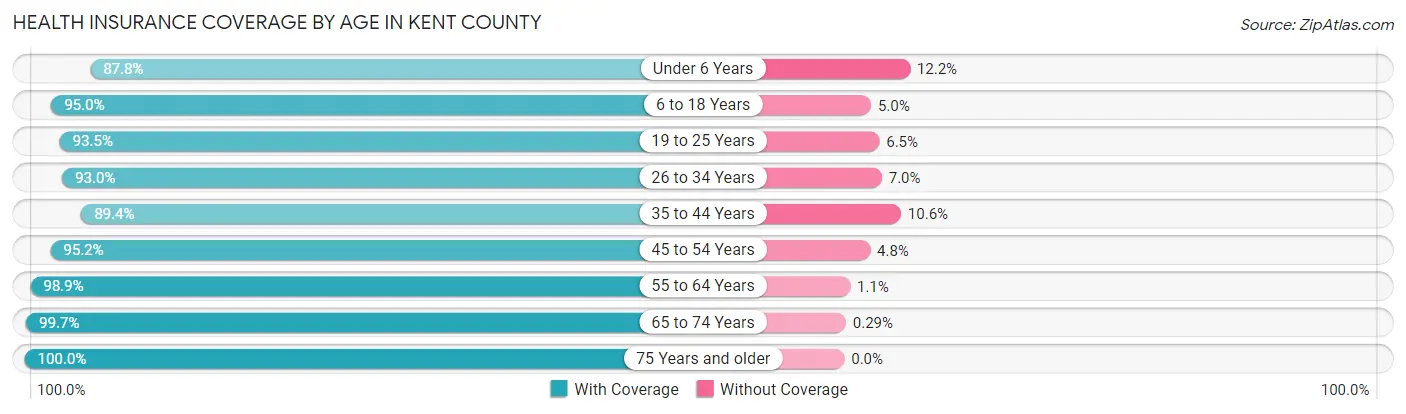
| Age Bracket | With Coverage | Without Coverage |
| Under 6 Years | 796 (87.8%) | 111 (12.2%) |
| 6 to 18 Years | 2,388 (95.0%) | 125 (5.0%) |
| 19 to 25 Years | 1,931 (93.5%) | 135 (6.5%) |
| 26 to 34 Years | 1,624 (93.0%) | 122 (7.0%) |
| 35 to 44 Years | 1,491 (89.4%) | 176 (10.6%) |
| 45 to 54 Years | 1,960 (95.2%) | 99 (4.8%) |
| 55 to 64 Years | 2,961 (98.9%) | 32 (1.1%) |
| 65 to 74 Years | 2,708 (99.7%) | 8 (0.3%) |
| 75 Years and older | 2,211 (100.0%) | 0 (0.0%) |
| Total | 18,070 (95.7%) | 808 (4.3%) |
Health Insurance Coverage by Citizenship Status in Kent County
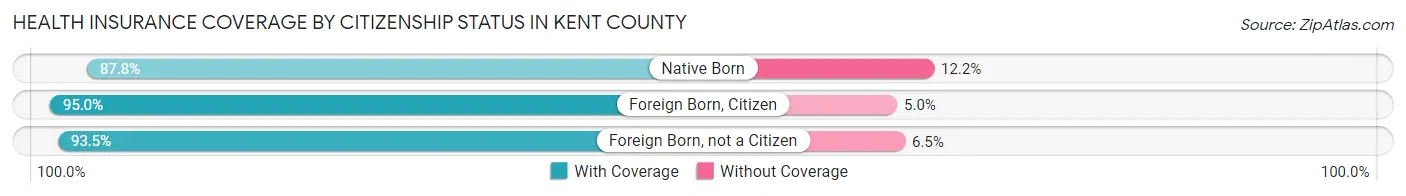
| Citizenship Status | With Coverage | Without Coverage |
| Native Born | 796 (87.8%) | 111 (12.2%) |
| Foreign Born, Citizen | 2,388 (95.0%) | 125 (5.0%) |
| Foreign Born, not a Citizen | 1,931 (93.5%) | 135 (6.5%) |
Health Insurance Coverage by Household Income in Kent County
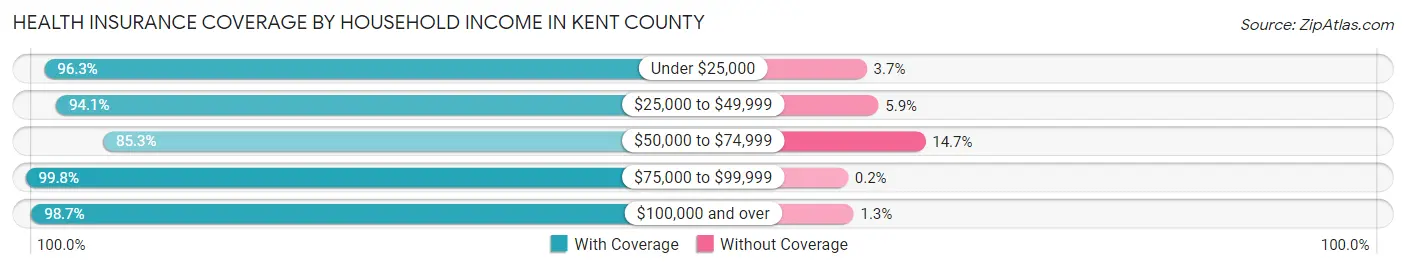
| Household Income | With Coverage | Without Coverage |
| Under $25,000 | 1,864 (96.3%) | 72 (3.7%) |
| $25,000 to $49,999 | 3,153 (94.1%) | 198 (5.9%) |
| $50,000 to $74,999 | 1,925 (85.3%) | 332 (14.7%) |
| $75,000 to $99,999 | 2,008 (99.8%) | 4 (0.2%) |
| $100,000 and over | 7,940 (98.7%) | 101 (1.3%) |
Public vs Private Health Insurance Coverage by Age in Kent County
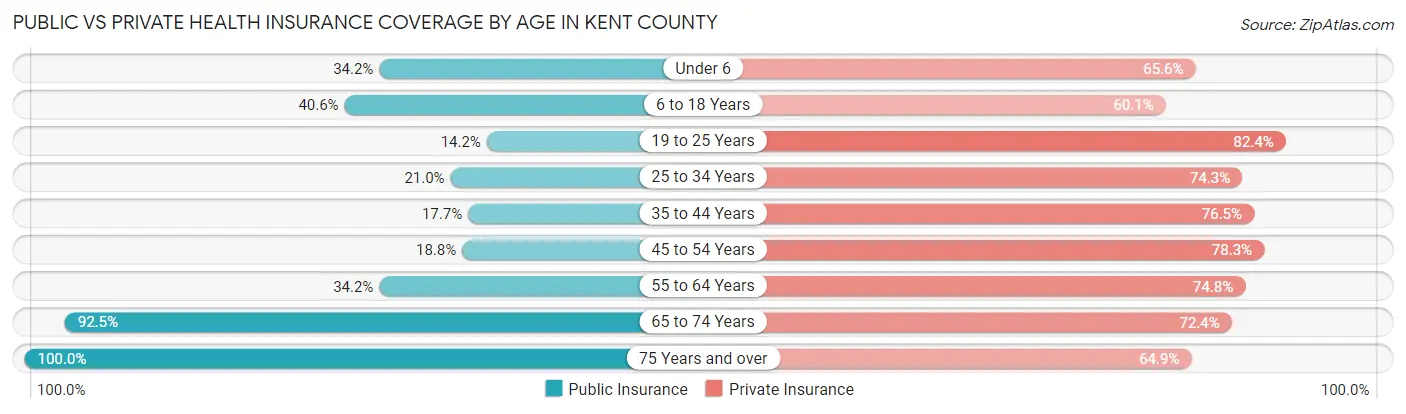
| Age Bracket | Public Insurance | Private Insurance |
| Under 6 | 310 (34.2%) | 595 (65.6%) |
| 6 to 18 Years | 1,021 (40.6%) | 1,510 (60.1%) |
| 19 to 25 Years | 294 (14.2%) | 1,702 (82.4%) |
| 25 to 34 Years | 366 (21.0%) | 1,297 (74.3%) |
| 35 to 44 Years | 295 (17.7%) | 1,275 (76.5%) |
| 45 to 54 Years | 387 (18.8%) | 1,613 (78.3%) |
| 55 to 64 Years | 1,023 (34.2%) | 2,240 (74.8%) |
| 65 to 74 Years | 2,513 (92.5%) | 1,965 (72.4%) |
| 75 Years and over | 2,211 (100.0%) | 1,434 (64.9%) |
| Total | 8,420 (44.6%) | 13,631 (72.2%) |
Disability Status by Sex by Age in Kent County
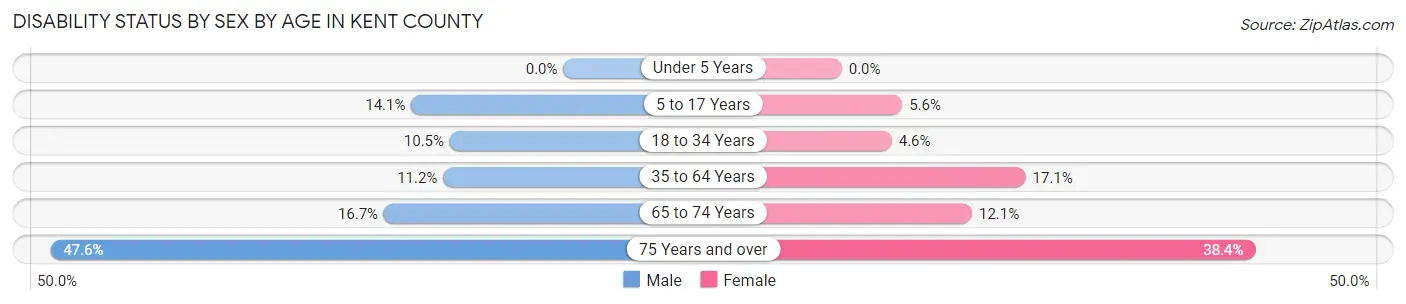
| Age Bracket | Male | Female |
| Under 5 Years | 0 (0.0%) | 0 (0.0%) |
| 5 to 17 Years | 173 (14.1%) | 60 (5.6%) |
| 18 to 34 Years | 207 (10.5%) | 105 (4.6%) |
| 35 to 64 Years | 349 (11.2%) | 612 (17.1%) |
| 65 to 74 Years | 214 (16.7%) | 173 (12.1%) |
| 75 Years and over | 471 (47.6%) | 469 (38.4%) |
Disability Class by Sex by Age in Kent County
Disability Class: Hearing Difficulty
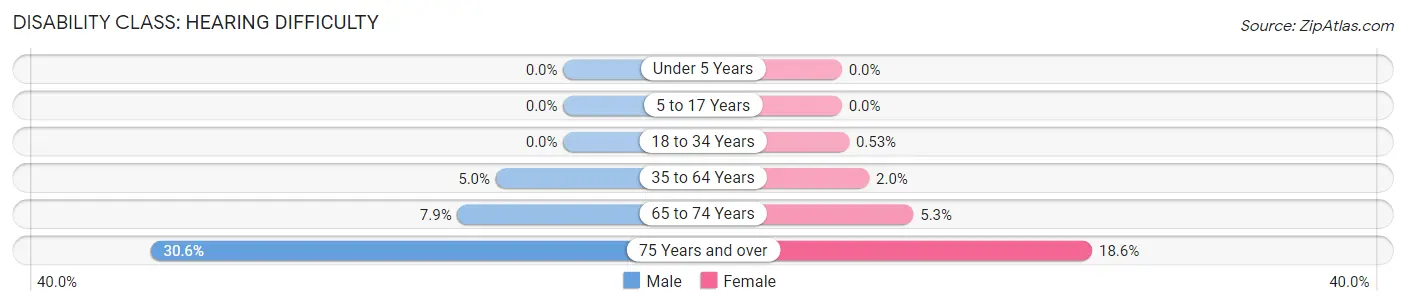
| Age Bracket | Male | Female |
| Under 5 Years | 0 (0.0%) | 0 (0.0%) |
| 5 to 17 Years | 0 (0.0%) | 0 (0.0%) |
| 18 to 34 Years | 0 (0.0%) | 12 (0.5%) |
| 35 to 64 Years | 157 (5.0%) | 73 (2.0%) |
| 65 to 74 Years | 101 (7.9%) | 76 (5.3%) |
| 75 Years and over | 303 (30.6%) | 227 (18.6%) |
Disability Class: Vision Difficulty
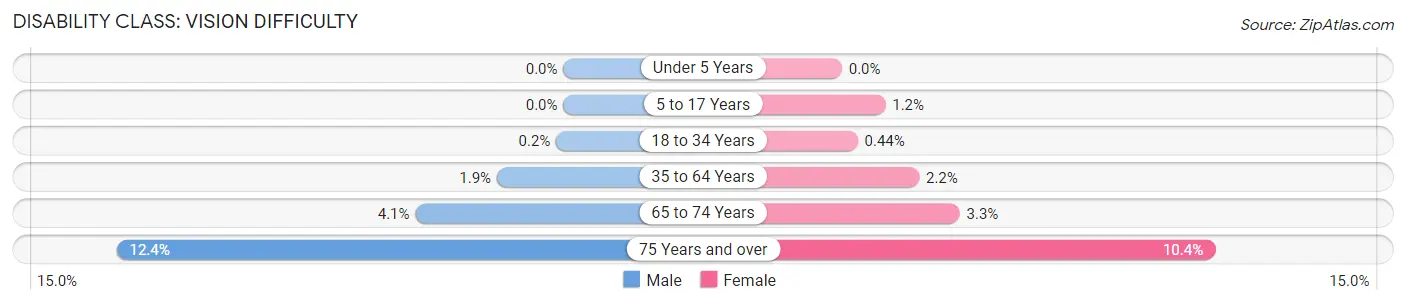
| Age Bracket | Male | Female |
| Under 5 Years | 0 (0.0%) | 0 (0.0%) |
| 5 to 17 Years | 0 (0.0%) | 13 (1.2%) |
| 18 to 34 Years | 4 (0.2%) | 10 (0.4%) |
| 35 to 64 Years | 58 (1.8%) | 77 (2.1%) |
| 65 to 74 Years | 53 (4.1%) | 47 (3.3%) |
| 75 Years and over | 123 (12.4%) | 127 (10.4%) |
Disability Class: Cognitive Difficulty
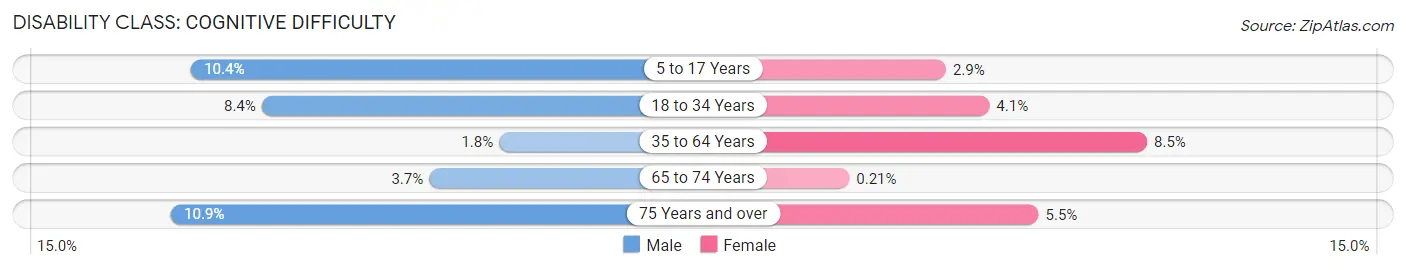
| Age Bracket | Male | Female |
| 5 to 17 Years | 127 (10.4%) | 31 (2.9%) |
| 18 to 34 Years | 165 (8.4%) | 93 (4.1%) |
| 35 to 64 Years | 56 (1.8%) | 305 (8.5%) |
| 65 to 74 Years | 48 (3.7%) | 3 (0.2%) |
| 75 Years and over | 108 (10.9%) | 67 (5.5%) |
Disability Class: Ambulatory Difficulty
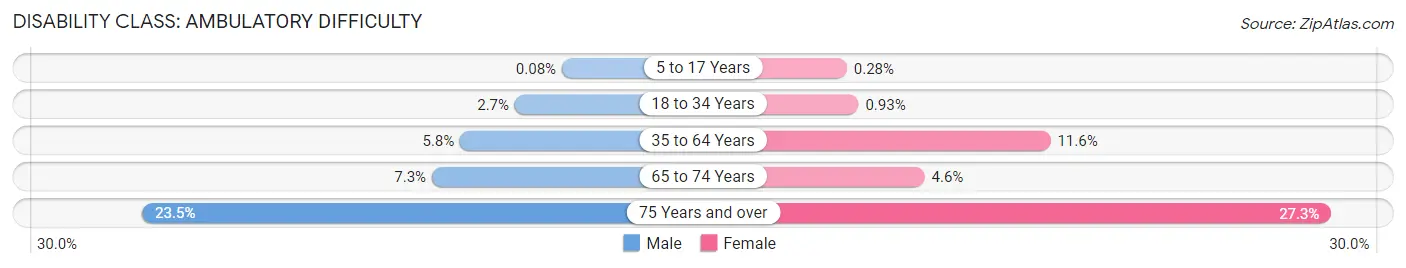
| Age Bracket | Male | Female |
| 5 to 17 Years | 1 (0.1%) | 3 (0.3%) |
| 18 to 34 Years | 53 (2.7%) | 21 (0.9%) |
| 35 to 64 Years | 180 (5.8%) | 417 (11.6%) |
| 65 to 74 Years | 94 (7.3%) | 66 (4.6%) |
| 75 Years and over | 232 (23.5%) | 333 (27.3%) |
Disability Class: Self-Care Difficulty
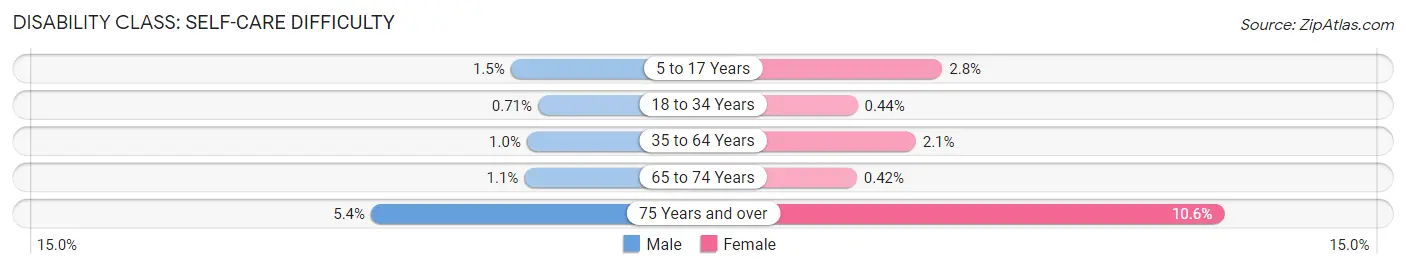
| Age Bracket | Male | Female |
| 5 to 17 Years | 18 (1.5%) | 30 (2.8%) |
| 18 to 34 Years | 14 (0.7%) | 10 (0.4%) |
| 35 to 64 Years | 32 (1.0%) | 74 (2.1%) |
| 65 to 74 Years | 14 (1.1%) | 6 (0.4%) |
| 75 Years and over | 53 (5.4%) | 130 (10.6%) |
Technology Access in Kent County
Computing Device Access in Kent County
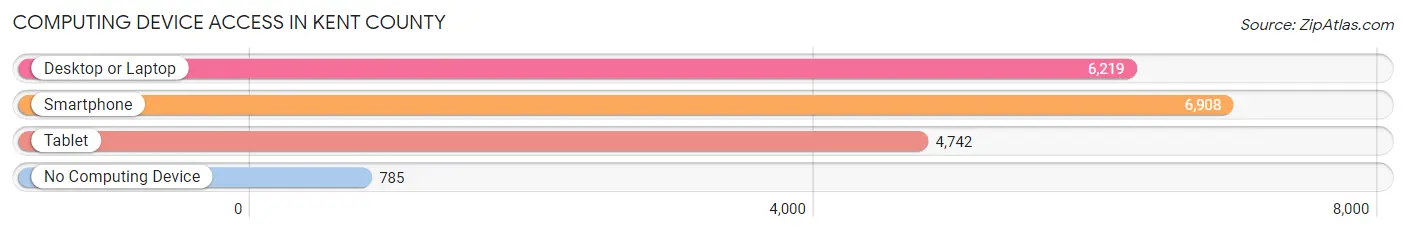
| Device Type | # Households | % Households |
| Desktop or Laptop | 6,219 | 74.3% |
| Smartphone | 6,908 | 82.5% |
| Tablet | 4,742 | 56.6% |
| No Computing Device | 785 | 9.4% |
| Total | 8,375 | 100.0% |
Internet Access in Kent County
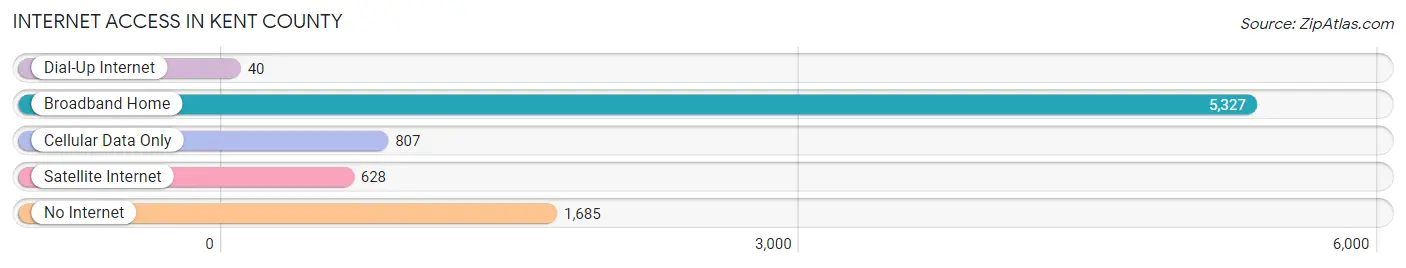
| Internet Type | # Households | % Households |
| Dial-Up Internet | 40 | 0.5% |
| Broadband Home | 5,327 | 63.6% |
| Cellular Data Only | 807 | 9.6% |
| Satellite Internet | 628 | 7.5% |
| No Internet | 1,685 | 20.1% |
| Total | 8,375 | 100.0% |
Kent County Summary
Kent County, Maryland is located in the Eastern Shore region of the state and is bordered by Queen Anne’s County to the north, Caroline County to the south, and Talbot County to the east. The county seat is Chestertown, and the county is home to a population of 20,197 as of the 2010 census.
History
The area that is now Kent County was first settled in the early 1600s by English colonists. The county was officially established in 1642 and was named for the county of Kent in England. The county was initially divided into four districts, each of which was governed by a court of three justices.
In the late 1700s, the county was a major center of the slave trade. Slaves were brought to the county from the West Indies and sold to local farmers. The county was also home to a large number of free African Americans, many of whom were descended from freed slaves.
During the Civil War, Kent County was a major center of Union activity. The county was home to several Union camps, and the county seat of Chestertown was the site of a major Union supply depot.
Geography
Kent County is located in the Eastern Shore region of Maryland and is bordered by Queen Anne’s County to the north, Caroline County to the south, and Talbot County to the east. The county is located on the western shore of the Chesapeake Bay and is home to a number of rivers, including the Chester, Sassafras, and Wye.
The county is mostly rural, with the majority of the land being used for farming and forestry. The county is home to several state parks, including Fairlee Creek State Park, Pickering Creek State Park, and Sassafras River State Park.
Economy
The economy of Kent County is largely based on agriculture and tourism. The county is home to a number of farms, which produce a variety of crops, including corn, soybeans, wheat, and hay. The county is also home to a number of seafood processing plants, which process and package seafood for sale in the region.
Tourism is also an important part of the county’s economy. The county is home to a number of historic sites, including the Chestertown Historic District, the Kent County Courthouse, and the Kent County Museum. The county is also home to a number of outdoor recreation areas, including Fairlee Creek State Park, Pickering Creek State Park, and Sassafras River State Park.
Demographics
As of the 2010 census, Kent County had a population of 20,197. The racial makeup of the county was 87.3% White, 8.7% African American, 0.5% Native American, 0.7% Asian, 0.1% Pacific Islander, 1.2% from other races, and 1.5% from two or more races. Hispanic or Latino of any race were 3.2% of the population.
The median income for a household in the county was $50,945, and the median income for a family was $60,945. The per capita income for the county was $25,945. About 8.7% of families and 11.2% of the population were below the poverty line, including 15.2% of those under age 18 and 8.2% of those age 65 or over.
Common Questions
What is the Total Population of Kent County?
Total Population of Kent County is 19,289.
What is the Total Male Population of Kent County?
Total Male Population of Kent County is 9,215.
What is the Total Female Population of Kent County?
Total Female Population of Kent County is 10,074.
What is the Ratio of Males per 100 Females in Kent County?
There are 91.47 Males per 100 Females in Kent County.
What is the Ratio of Females per 100 Males in Kent County?
There are 109.32 Females per 100 Males in Kent County.
What is the Median Population Age in Kent County?
Median Population Age in Kent County is 48.5 Years.
What is the Average Family Size in Kent County
Average Family Size in Kent County is 2.6 People.
What is the Average Household Size in Kent County
Average Household Size in Kent County is 2.1 People.
What is Per Capita Income in Kent County?
Per Capita income in Kent County is $44,283.
What is the Median Family Income in Kent County?
Median Family Income in Kent County is $103,341.
What is the Median Household income in Kent County?
Median Household Income in Kent County is $71,635.
What is Income or Wage Gap in Kent County?
Income or Wage Gap in Kent County is 43.9%.
Women in Kent County earn 56.1 cents for every dollar earned by a man.
What is Inequality or Gini Index in Kent County?
Inequality or Gini Index in Kent County is 0.45.
How Large is the Labor Force in Kent County?
There are 9,685 People in the Labor Forcein in Kent County.
What is the Percentage of People in the Labor Force in Kent County?
58.1% of People are in the Labor Force in Kent County.
What is the Unemployment Rate in Kent County?
Unemployment Rate in Kent County is 3.3%.