Howard County, MD
Howard County Map
Howard County Overview
332,011
TOTAL POPULATION
164,011
MALE POPULATION
168,000
FEMALE POPULATION
97.63
MALES / 100 FEMALES
102.43
FEMALES / 100 MALES
39.2
MEDIAN AGE
3.2
AVG FAMILY SIZE
2.8
AVG HOUSEHOLD SIZE
$63,441
PER CAPITA INCOME
$169,085
AVG FAMILY INCOME
$140,971
AVG HOUSEHOLD INCOME
33.4%
WAGE / INCOME GAP [ % ]
66.6¢/ $1
WAGE / INCOME GAP [ $ ]
$11,910
FAMILY INCOME DEFICIT
0.41
INEQUALITY / GINI INDEX
183,590
LABOR FORCE [ PEOPLE ]
70.1%
PERCENT IN LABOR FORCE
3.8%
UNEMPLOYMENT RATE
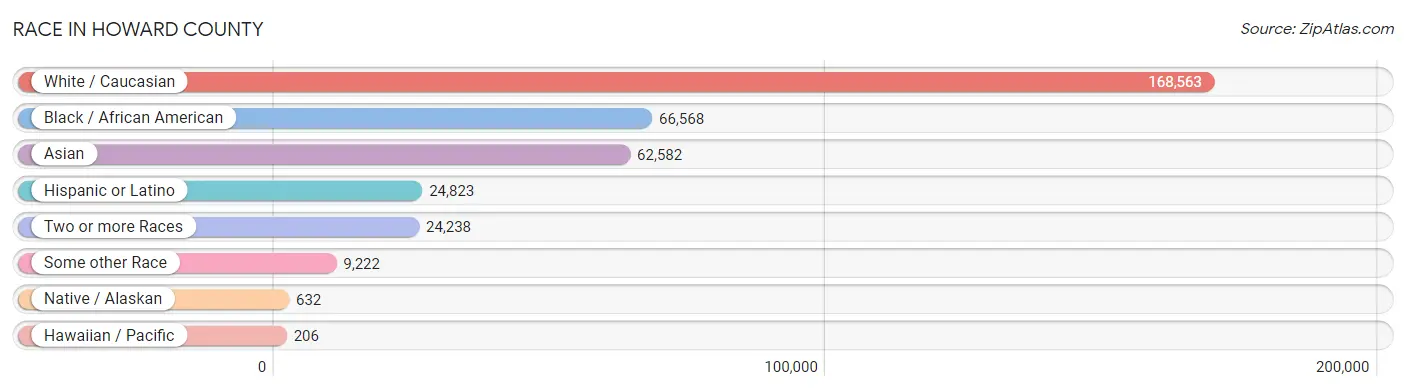
Race in Howard County
The most populous races in Howard County are White / Caucasian (168,563 | 50.8%), Black / African American (66,568 | 20.1%), and Asian (62,582 | 18.9%).
| Race | # Population | % Population |
| Asian | 62,582 | 18.9% |
| Black / African American | 66,568 | 20.1% |
| Hawaiian / Pacific | 206 | 0.1% |
| Hispanic or Latino | 24,823 | 7.5% |
| Native / Alaskan | 632 | 0.2% |
| White / Caucasian | 168,563 | 50.8% |
| Two or more Races | 24,238 | 7.3% |
| Some other Race | 9,222 | 2.8% |
| Total | 332,011 | 100.0% |
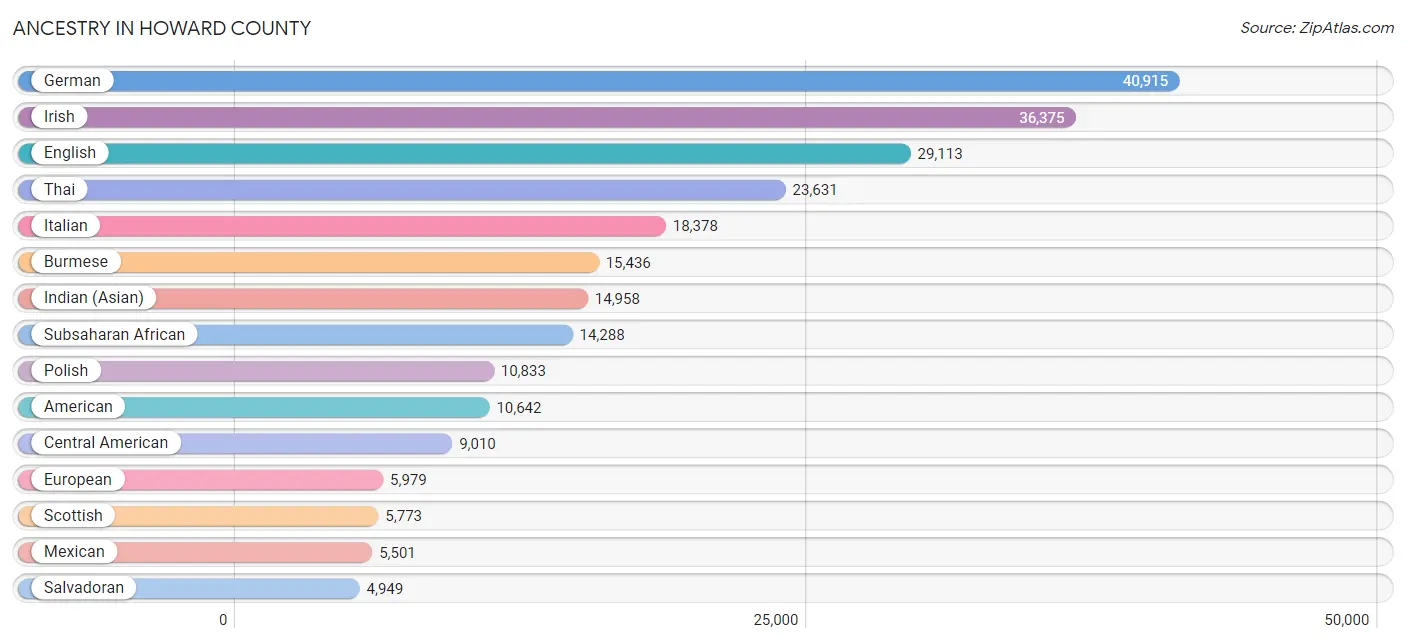
Ancestry in Howard County
The most populous ancestries reported in Howard County are German (40,915 | 12.3%), Irish (36,375 | 11.0%), English (29,113 | 8.8%), Thai (23,631 | 7.1%), and Italian (18,378 | 5.5%), together accounting for 44.7% of all Howard County residents.
| Ancestry | # Population | % Population |
| Afghan | 232 | 0.1% |
| African | 4,217 | 1.3% |
| Albanian | 93 | 0.0% |
| American | 10,642 | 3.2% |
| Apache | 35 | 0.0% |
| Arab | 4,640 | 1.4% |
| Argentinean | 294 | 0.1% |
| Armenian | 139 | 0.0% |
| Assyrian / Chaldean / Syriac | 42 | 0.0% |
| Australian | 163 | 0.1% |
| Austrian | 893 | 0.3% |
| Bahamian | 163 | 0.1% |
| Bangladeshi | 20 | 0.0% |
| Barbadian | 191 | 0.1% |
| Basque | 13 | 0.0% |
| Belgian | 229 | 0.1% |
| Belizean | 3 | 0.0% |
| Bhutanese | 1,670 | 0.5% |
| Blackfeet | 106 | 0.0% |
| Bolivian | 51 | 0.0% |
| Brazilian | 729 | 0.2% |
| British | 2,783 | 0.8% |
| British West Indian | 413 | 0.1% |
| Bulgarian | 18 | 0.0% |
| Burmese | 15,436 | 4.6% |
| Cajun | 20 | 0.0% |
| Cambodian | 168 | 0.1% |
| Canadian | 423 | 0.1% |
| Cape Verdean | 285 | 0.1% |
| Carpatho Rusyn | 38 | 0.0% |
| Celtic | 16 | 0.0% |
| Central American | 9,010 | 2.7% |
| Central American Indian | 347 | 0.1% |
| Cherokee | 769 | 0.2% |
| Chickasaw | 12 | 0.0% |
| Chilean | 82 | 0.0% |
| Choctaw | 61 | 0.0% |
| Colombian | 1,175 | 0.4% |
| Costa Rican | 149 | 0.0% |
| Creek | 48 | 0.0% |
| Croatian | 313 | 0.1% |
| Cuban | 1,021 | 0.3% |
| Czech | 1,461 | 0.4% |
| Czechoslovakian | 323 | 0.1% |
| Danish | 760 | 0.2% |
| Dominican | 704 | 0.2% |
| Dutch | 1,428 | 0.4% |
| Eastern European | 2,774 | 0.8% |
| Ecuadorian | 159 | 0.1% |
| Egyptian | 509 | 0.2% |
| English | 29,113 | 8.8% |
| Estonian | 88 | 0.0% |
| Ethiopian | 1,968 | 0.6% |
| European | 5,979 | 1.8% |
| Filipino | 505 | 0.2% |
| Finnish | 394 | 0.1% |
| French | 4,213 | 1.3% |
| French Canadian | 1,336 | 0.4% |
| German | 40,915 | 12.3% |
| German Russian | 164 | 0.1% |
| Ghanaian | 994 | 0.3% |
| Greek | 3,092 | 0.9% |
| Guamanian / Chamorro | 11 | 0.0% |
| Guatemalan | 1,253 | 0.4% |
| Guyanese | 568 | 0.2% |
| Haitian | 741 | 0.2% |
| Honduran | 2,278 | 0.7% |
| Hungarian | 1,201 | 0.4% |
| Icelander | 27 | 0.0% |
| Indian (Asian) | 14,958 | 4.5% |
| Indonesian | 532 | 0.2% |
| Iranian | 1,694 | 0.5% |
| Iraqi | 93 | 0.0% |
| Irish | 36,375 | 11.0% |
| Iroquois | 21 | 0.0% |
| Israeli | 504 | 0.2% |
| Italian | 18,378 | 5.5% |
| Jamaican | 2,532 | 0.8% |
| Japanese | 72 | 0.0% |
| Jordanian | 274 | 0.1% |
| Kenyan | 239 | 0.1% |
| Korean | 4,816 | 1.5% |
| Laotian | 303 | 0.1% |
| Latvian | 330 | 0.1% |
| Lebanese | 610 | 0.2% |
| Liberian | 192 | 0.1% |
| Lithuanian | 1,189 | 0.4% |
| Lumbee | 3 | 0.0% |
| Luxembourger | 34 | 0.0% |
| Macedonian | 41 | 0.0% |
| Malaysian | 5 | 0.0% |
| Maltese | 18 | 0.0% |
| Mexican | 5,501 | 1.7% |
| Mexican American Indian | 93 | 0.0% |
| Mongolian | 88 | 0.0% |
| Moroccan | 137 | 0.0% |
| Native Hawaiian | 404 | 0.1% |
| Navajo | 25 | 0.0% |
| Nicaraguan | 110 | 0.0% |
| Nigerian | 4,555 | 1.4% |
| Northern European | 383 | 0.1% |
| Norwegian | 2,571 | 0.8% |
| Okinawan | 14 | 0.0% |
| Osage | 19 | 0.0% |
| Pakistani | 421 | 0.1% |
| Palestinian | 715 | 0.2% |
| Panamanian | 271 | 0.1% |
| Paraguayan | 75 | 0.0% |
| Pennsylvania German | 143 | 0.0% |
| Peruvian | 930 | 0.3% |
| Polish | 10,833 | 3.3% |
| Portuguese | 778 | 0.2% |
| Potawatomi | 11 | 0.0% |
| Puerto Rican | 3,825 | 1.1% |
| Puget Sound Salish | 36 | 0.0% |
| Romanian | 639 | 0.2% |
| Russian | 4,923 | 1.5% |
| Salvadoran | 4,949 | 1.5% |
| Samoan | 17 | 0.0% |
| Scandinavian | 810 | 0.2% |
| Scotch-Irish | 2,829 | 0.9% |
| Scottish | 5,773 | 1.7% |
| Seminole | 14 | 0.0% |
| Senegalese | 9 | 0.0% |
| Serbian | 368 | 0.1% |
| Shoshone | 6 | 0.0% |
| Sierra Leonean | 617 | 0.2% |
| Sioux | 100 | 0.0% |
| Slavic | 221 | 0.1% |
| Slovak | 1,039 | 0.3% |
| Slovene | 67 | 0.0% |
| Somali | 86 | 0.0% |
| South African | 84 | 0.0% |
| South American | 3,226 | 1.0% |
| South American Indian | 127 | 0.0% |
| Spaniard | 606 | 0.2% |
| Spanish | 346 | 0.1% |
| Spanish American | 19 | 0.0% |
| Sri Lankan | 3,068 | 0.9% |
| Subsaharan African | 14,288 | 4.3% |
| Sudanese | 28 | 0.0% |
| Swedish | 1,915 | 0.6% |
| Swiss | 751 | 0.2% |
| Syrian | 375 | 0.1% |
| Thai | 23,631 | 7.1% |
| Tongan | 6 | 0.0% |
| Trinidadian and Tobagonian | 204 | 0.1% |
| Turkish | 588 | 0.2% |
| Ugandan | 41 | 0.0% |
| Ukrainian | 1,372 | 0.4% |
| Uruguayan | 118 | 0.0% |
| Venezuelan | 338 | 0.1% |
| Vietnamese | 828 | 0.3% |
| Welsh | 1,578 | 0.5% |
| West Indian | 394 | 0.1% |
| Yugoslavian | 58 | 0.0% | View All 156 Rows |
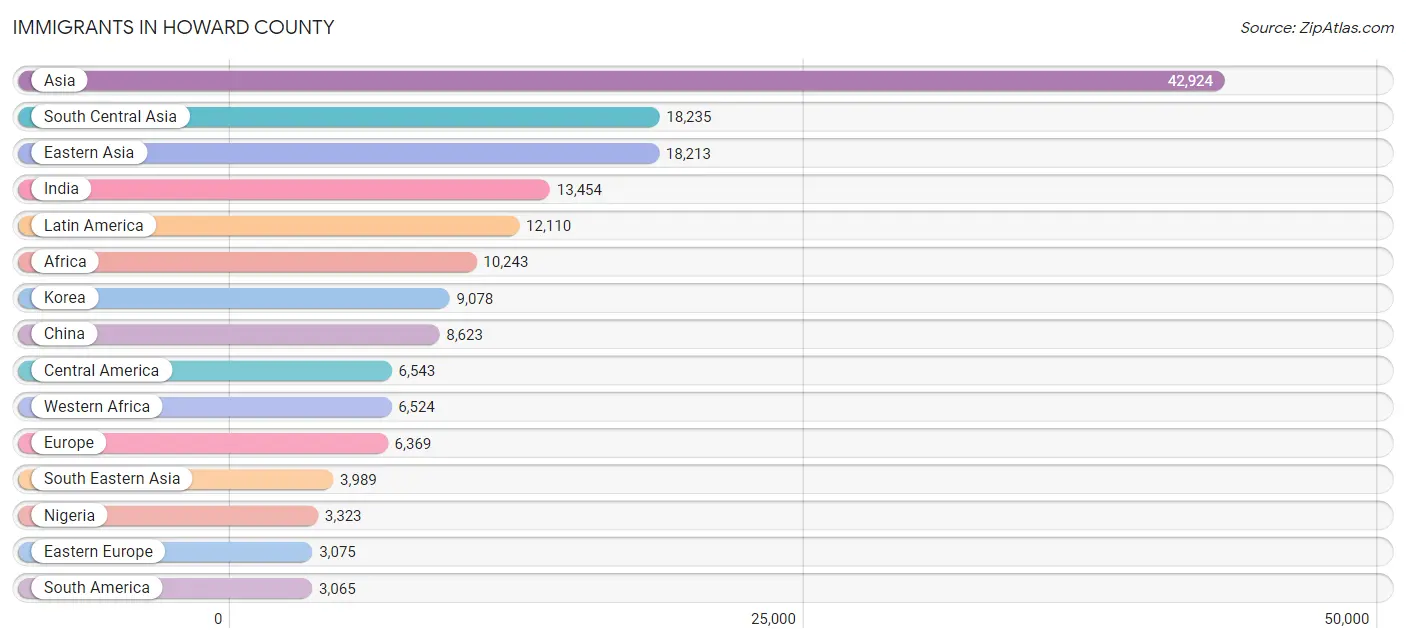
Immigrants in Howard County
The most numerous immigrant groups reported in Howard County came from Asia (42,924 | 12.9%), South Central Asia (18,235 | 5.5%), Eastern Asia (18,213 | 5.5%), India (13,454 | 4.1%), and Latin America (12,110 | 3.6%), together accounting for 31.6% of all Howard County residents.
| Immigration Origin | # Population | % Population |
| Afghanistan | 143 | 0.0% |
| Africa | 10,243 | 3.1% |
| Argentina | 148 | 0.0% |
| Armenia | 11 | 0.0% |
| Asia | 42,924 | 12.9% |
| Australia | 82 | 0.0% |
| Austria | 62 | 0.0% |
| Bahamas | 76 | 0.0% |
| Bangladesh | 759 | 0.2% |
| Belarus | 152 | 0.1% |
| Belgium | 183 | 0.1% |
| Belize | 3 | 0.0% |
| Bolivia | 36 | 0.0% |
| Bosnia and Herzegovina | 10 | 0.0% |
| Brazil | 1,016 | 0.3% |
| Bulgaria | 27 | 0.0% |
| Cambodia | 45 | 0.0% |
| Cameroon | 548 | 0.2% |
| Canada | 687 | 0.2% |
| Caribbean | 2,502 | 0.7% |
| Central America | 6,543 | 2.0% |
| Chile | 40 | 0.0% |
| China | 8,623 | 2.6% |
| Colombia | 815 | 0.3% |
| Costa Rica | 81 | 0.0% |
| Croatia | 7 | 0.0% |
| Cuba | 148 | 0.0% |
| Czechoslovakia | 80 | 0.0% |
| Denmark | 25 | 0.0% |
| Dominica | 32 | 0.0% |
| Dominican Republic | 202 | 0.1% |
| Eastern Africa | 1,943 | 0.6% |
| Eastern Asia | 18,213 | 5.5% |
| Eastern Europe | 3,075 | 0.9% |
| Ecuador | 133 | 0.0% |
| Egypt | 399 | 0.1% |
| El Salvador | 2,608 | 0.8% |
| England | 451 | 0.1% |
| Eritrea | 74 | 0.0% |
| Ethiopia | 1,389 | 0.4% |
| Europe | 6,369 | 1.9% |
| Fiji | 19 | 0.0% |
| France | 167 | 0.1% |
| Germany | 919 | 0.3% |
| Ghana | 1,201 | 0.4% |
| Greece | 142 | 0.0% |
| Grenada | 36 | 0.0% |
| Guatemala | 826 | 0.3% |
| Guyana | 185 | 0.1% |
| Haiti | 367 | 0.1% |
| Honduras | 1,550 | 0.5% |
| Hong Kong | 962 | 0.3% |
| Hungary | 112 | 0.0% |
| India | 13,454 | 4.1% |
| Indonesia | 157 | 0.1% |
| Iran | 1,046 | 0.3% |
| Iraq | 162 | 0.1% |
| Ireland | 85 | 0.0% |
| Israel | 653 | 0.2% |
| Italy | 179 | 0.1% |
| Jamaica | 1,284 | 0.4% |
| Japan | 378 | 0.1% |
| Jordan | 353 | 0.1% |
| Kazakhstan | 46 | 0.0% |
| Kenya | 359 | 0.1% |
| Korea | 9,078 | 2.7% |
| Kuwait | 145 | 0.0% |
| Laos | 28 | 0.0% |
| Latin America | 12,110 | 3.6% |
| Latvia | 83 | 0.0% |
| Lebanon | 100 | 0.0% |
| Liberia | 495 | 0.2% |
| Lithuania | 28 | 0.0% |
| Malaysia | 118 | 0.0% |
| Mexico | 1,397 | 0.4% |
| Middle Africa | 733 | 0.2% |
| Moldova | 104 | 0.0% |
| Morocco | 130 | 0.0% |
| Nepal | 834 | 0.3% |
| Netherlands | 30 | 0.0% |
| Nicaragua | 47 | 0.0% |
| Nigeria | 3,323 | 1.0% |
| North Macedonia | 41 | 0.0% |
| Northern Africa | 803 | 0.2% |
| Northern Europe | 1,381 | 0.4% |
| Norway | 38 | 0.0% |
| Oceania | 127 | 0.0% |
| Pakistan | 1,781 | 0.5% |
| Panama | 31 | 0.0% |
| Peru | 357 | 0.1% |
| Philippines | 1,688 | 0.5% |
| Poland | 435 | 0.1% |
| Portugal | 61 | 0.0% |
| Romania | 164 | 0.1% |
| Russia | 963 | 0.3% |
| Saudi Arabia | 44 | 0.0% |
| Scotland | 15 | 0.0% |
| Senegal | 74 | 0.0% |
| Serbia | 52 | 0.0% |
| Sierra Leone | 877 | 0.3% |
| Singapore | 22 | 0.0% |
| Somalia | 20 | 0.0% |
| South Africa | 178 | 0.1% |
| South America | 3,065 | 0.9% |
| South Central Asia | 18,235 | 5.5% |
| South Eastern Asia | 3,989 | 1.2% |
| Southern Europe | 506 | 0.2% |
| Spain | 124 | 0.0% |
| Sri Lanka | 104 | 0.0% |
| Sudan | 174 | 0.1% |
| Sweden | 79 | 0.0% |
| Switzerland | 40 | 0.0% |
| Syria | 275 | 0.1% |
| Taiwan | 916 | 0.3% |
| Thailand | 255 | 0.1% |
| Trinidad and Tobago | 233 | 0.1% |
| Turkey | 485 | 0.2% |
| Uganda | 55 | 0.0% |
| Ukraine | 580 | 0.2% |
| Uruguay | 29 | 0.0% |
| Uzbekistan | 52 | 0.0% |
| Venezuela | 219 | 0.1% |
| Vietnam | 1,209 | 0.4% |
| West Indies | 18 | 0.0% |
| Western Africa | 6,524 | 2.0% |
| Western Asia | 2,438 | 0.7% |
| Western Europe | 1,401 | 0.4% |
| Yemen | 9 | 0.0% |
| Zaire | 179 | 0.1% | View All 129 Rows |
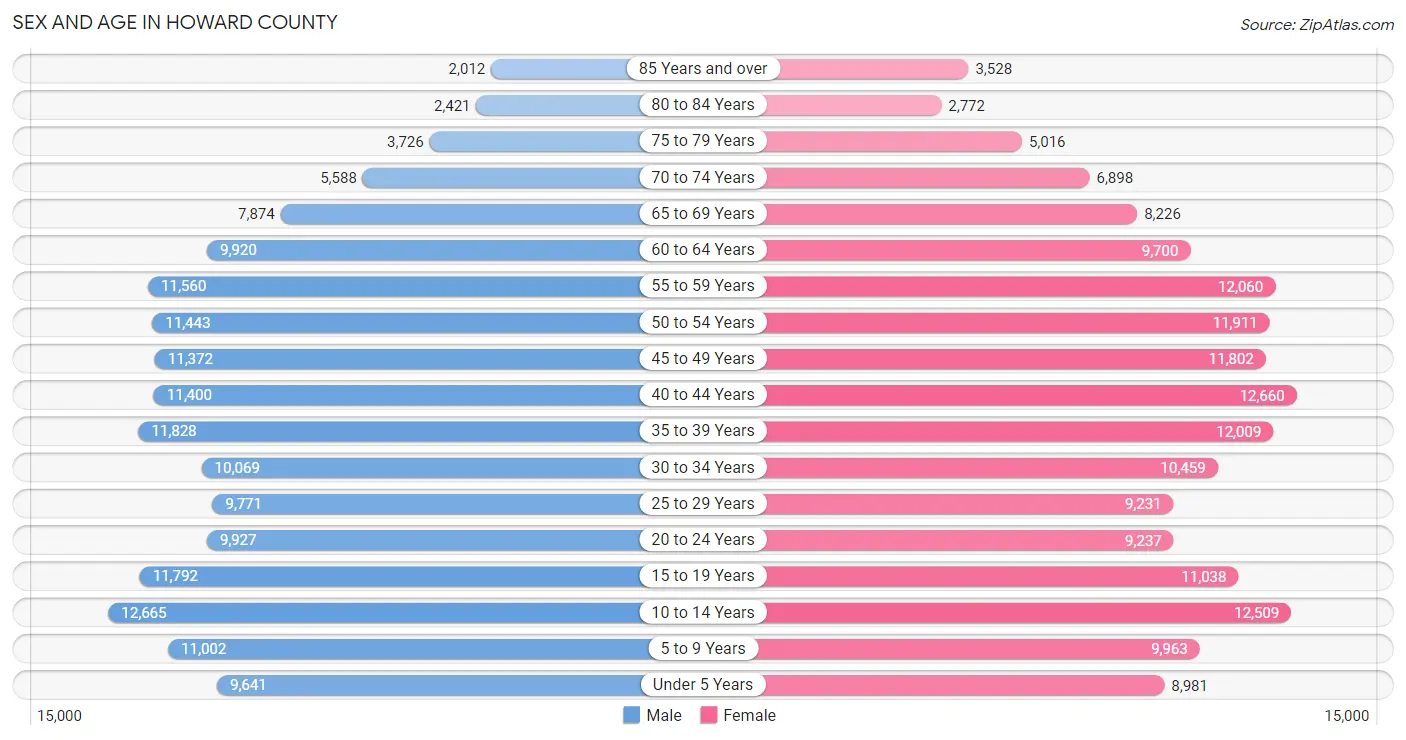
Sex and Age in Howard County
Sex and Age in Howard County
The most populous age groups in Howard County are 10 to 14 Years (12,665 | 7.7%) for men and 40 to 44 Years (12,660 | 7.5%) for women.
| Age Bracket | Male | Female |
| Under 5 Years | 9,641 (5.9%) | 8,981 (5.3%) |
| 5 to 9 Years | 11,002 (6.7%) | 9,963 (5.9%) |
| 10 to 14 Years | 12,665 (7.7%) | 12,509 (7.4%) |
| 15 to 19 Years | 11,792 (7.2%) | 11,038 (6.6%) |
| 20 to 24 Years | 9,927 (6.0%) | 9,237 (5.5%) |
| 25 to 29 Years | 9,771 (6.0%) | 9,231 (5.5%) |
| 30 to 34 Years | 10,069 (6.1%) | 10,459 (6.2%) |
| 35 to 39 Years | 11,828 (7.2%) | 12,009 (7.1%) |
| 40 to 44 Years | 11,400 (7.0%) | 12,660 (7.5%) |
| 45 to 49 Years | 11,372 (6.9%) | 11,802 (7.0%) |
| 50 to 54 Years | 11,443 (7.0%) | 11,911 (7.1%) |
| 55 to 59 Years | 11,560 (7.0%) | 12,060 (7.2%) |
| 60 to 64 Years | 9,920 (6.0%) | 9,700 (5.8%) |
| 65 to 69 Years | 7,874 (4.8%) | 8,226 (4.9%) |
| 70 to 74 Years | 5,588 (3.4%) | 6,898 (4.1%) |
| 75 to 79 Years | 3,726 (2.3%) | 5,016 (3.0%) |
| 80 to 84 Years | 2,421 (1.5%) | 2,772 (1.7%) |
| 85 Years and over | 2,012 (1.2%) | 3,528 (2.1%) |
| Total | 164,011 (100.0%) | 168,000 (100.0%) |
Families and Households in Howard County
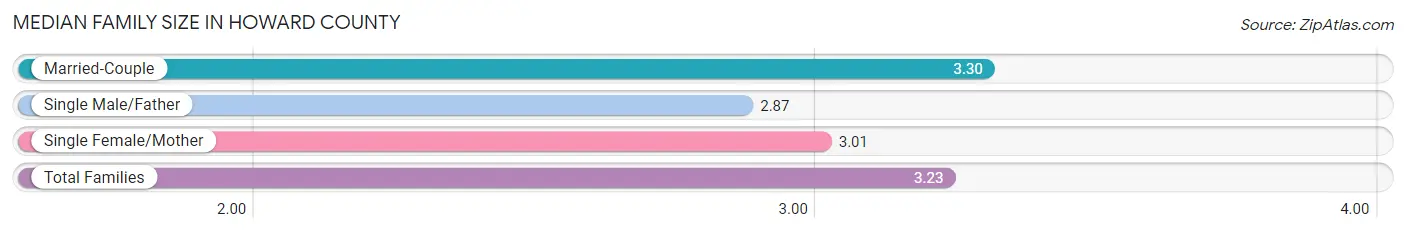
Median Family Size in Howard County
The median family size in Howard County is 3.23 persons per family, with married-couple families (70,027 | 79.8%) accounting for the largest median family size of 3.3 persons per family. On the other hand, single male/father families (4,522 | 5.2%) represent the smallest median family size with 2.87 persons per family.
| Family Type | # Families | Family Size |
| Married-Couple | 70,027 (79.8%) | 3.30 |
| Single Male/Father | 4,522 (5.2%) | 2.87 |
| Single Female/Mother | 13,165 (15.0%) | 3.01 |
| Total Families | 87,714 (100.0%) | 3.23 |
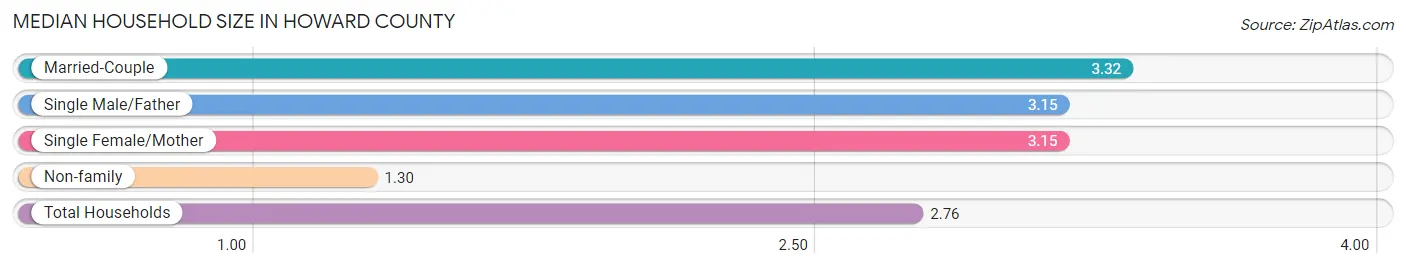
Median Household Size in Howard County
The median household size in Howard County is 2.76 persons per household, with married-couple households (70,027 | 58.7%) accounting for the largest median household size of 3.32 persons per household. non-family households (31,516 | 26.4%) represent the smallest median household size with 1.30 persons per household.
| Household Type | # Households | Household Size |
| Married-Couple | 70,027 (58.7%) | 3.32 |
| Single Male/Father | 4,522 (3.8%) | 3.15 |
| Single Female/Mother | 13,165 (11.0%) | 3.15 |
| Non-family | 31,516 (26.4%) | 1.30 |
| Total Households | 119,230 (100.0%) | 2.76 |
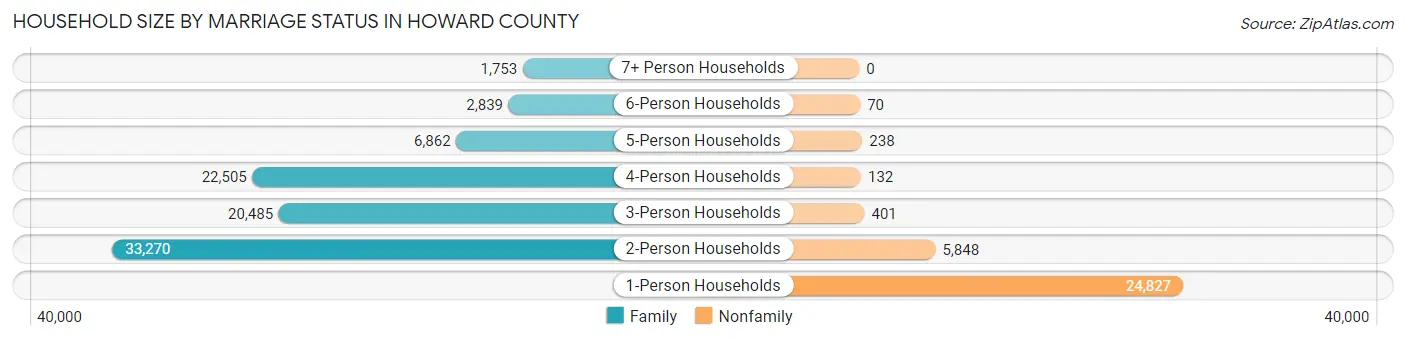
Household Size by Marriage Status in Howard County
Out of a total of 119,230 households in Howard County, 87,714 (73.6%) are family households, while 31,516 (26.4%) are nonfamily households. The most numerous type of family households are 2-person households, comprising 33,270, and the most common type of nonfamily households are 1-person households, comprising 24,827.
| Household Size | Family Households | Nonfamily Households |
| 1-Person Households | - | 24,827 (20.8%) |
| 2-Person Households | 33,270 (27.9%) | 5,848 (4.9%) |
| 3-Person Households | 20,485 (17.2%) | 401 (0.3%) |
| 4-Person Households | 22,505 (18.9%) | 132 (0.1%) |
| 5-Person Households | 6,862 (5.8%) | 238 (0.2%) |
| 6-Person Households | 2,839 (2.4%) | 70 (0.1%) |
| 7+ Person Households | 1,753 (1.5%) | 0 (0.0%) |
| Total | 87,714 (73.6%) | 31,516 (26.4%) |
Female Fertility in Howard County
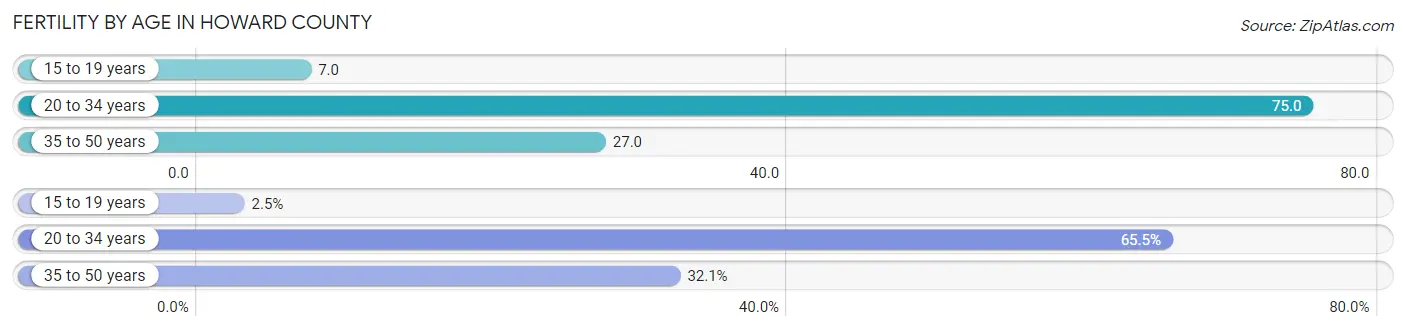
Fertility by Age in Howard County
Average fertility rate in Howard County is 42.0 births per 1,000 women. Women in the age bracket of 20 to 34 years have the highest fertility rate with 75.0 births per 1,000 women. Women in the age bracket of 20 to 34 years acount for 65.5% of all women with births.
| Age Bracket | Women with Births | Births / 1,000 Women |
| 15 to 19 years | 82 (2.5%) | 7.0 |
| 20 to 34 years | 2,169 (65.5%) | 75.0 |
| 35 to 50 years | 1,062 (32.1%) | 27.0 |
| Total | 3,313 (100.0%) | 42.0 |
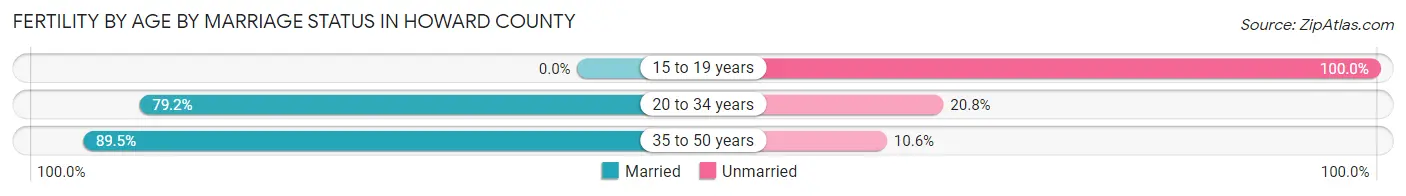
Fertility by Age by Marriage Status in Howard County
80.6% of women with births (3,313) in Howard County are married. The highest percentage of unmarried women with births falls into 15 to 19 years age bracket with 100.0% of them unmarried at the time of birth, while the lowest percentage of unmarried women with births belong to 35 to 50 years age bracket with 10.6% of them unmarried.
| Age Bracket | Married | Unmarried |
| 15 to 19 years | 0 (0.0%) | 82 (100.0%) |
| 20 to 34 years | 1,718 (79.2%) | 451 (20.8%) |
| 35 to 50 years | 950 (89.4%) | 112 (10.5%) |
| Total | 2,670 (80.6%) | 643 (19.4%) |
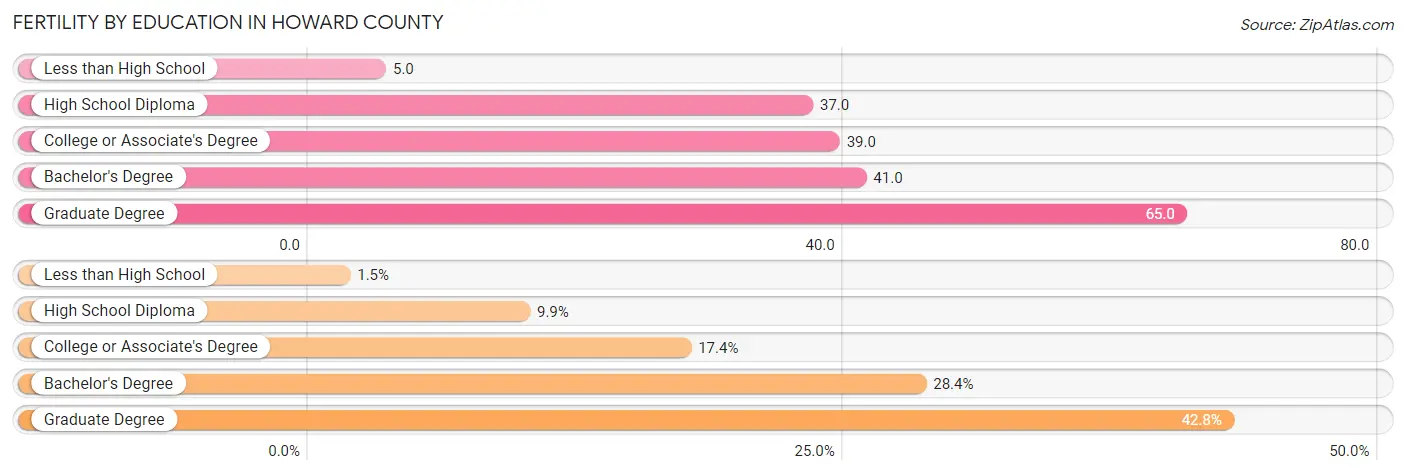
Fertility by Education in Howard County
Average fertility rate in Howard County is 42.0 births per 1,000 women. Women with the education attainment of graduate degree have the highest fertility rate of 65.0 births per 1,000 women, while women with the education attainment of less than high school have the lowest fertility at 5.0 births per 1,000 women. Women with the education attainment of graduate degree represent 42.8% of all women with births.
| Educational Attainment | Women with Births | Births / 1,000 Women |
| Less than High School | 48 (1.5%) | 5.0 |
| High School Diploma | 327 (9.9%) | 37.0 |
| College or Associate's Degree | 577 (17.4%) | 39.0 |
| Bachelor's Degree | 942 (28.4%) | 41.0 |
| Graduate Degree | 1,419 (42.8%) | 65.0 |
| Total | 3,313 (100.0%) | 42.0 |
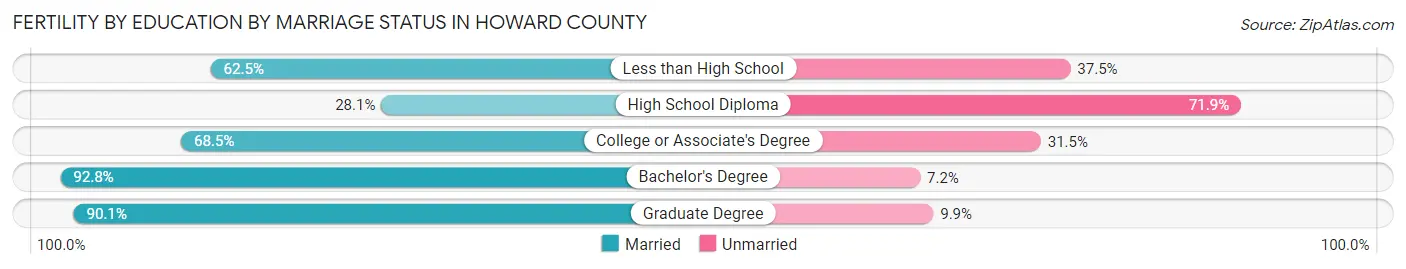
Fertility by Education by Marriage Status in Howard County
19.4% of women with births in Howard County are unmarried. Women with the educational attainment of bachelor's degree are most likely to be married with 92.8% of them married at childbirth, while women with the educational attainment of high school diploma are least likely to be married with 71.9% of them unmarried at childbirth.
| Educational Attainment | Married | Unmarried |
| Less than High School | 30 (62.5%) | 18 (37.5%) |
| High School Diploma | 92 (28.1%) | 235 (71.9%) |
| College or Associate's Degree | 395 (68.5%) | 182 (31.5%) |
| Bachelor's Degree | 874 (92.8%) | 68 (7.2%) |
| Graduate Degree | 1,279 (90.1%) | 140 (9.9%) |
| Total | 2,670 (80.6%) | 643 (19.4%) |
Income in Howard County
Income Overview in Howard County
Per Capita Income in Howard County is $63,441, while median incomes of families and households are $169,085 and $140,971 respectively.
| Characteristic | Number | Measure |
| Per Capita Income | 332,011 | $63,441 |
| Median Family Income | 87,714 | $169,085 |
| Mean Family Income | 87,714 | $199,015 |
| Median Household Income | 119,230 | $140,971 |
| Mean Household Income | 119,230 | $173,854 |
| Income Deficit | 87,714 | $11,910 |
| Wage / Income Gap (%) | 332,011 | 33.38% |
| Wage / Income Gap ($) | 332,011 | 66.62¢ per $1 |
| Gini / Inequality Index | 332,011 | 0.41 |
Earnings by Sex in Howard County
Average Earnings in Howard County are $71,759, $87,772 for men and $58,478 for women, a difference of 33.4%.
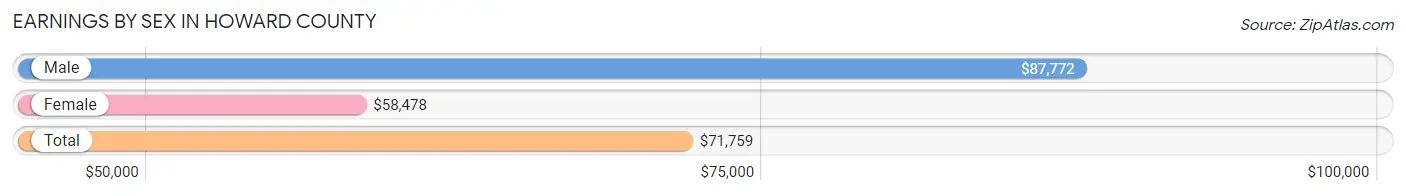
| Sex | Number | Average Earnings |
| Male | 99,433 (52.1%) | $87,772 |
| Female | 91,569 (47.9%) | $58,478 |
| Total | 191,002 (100.0%) | $71,759 |
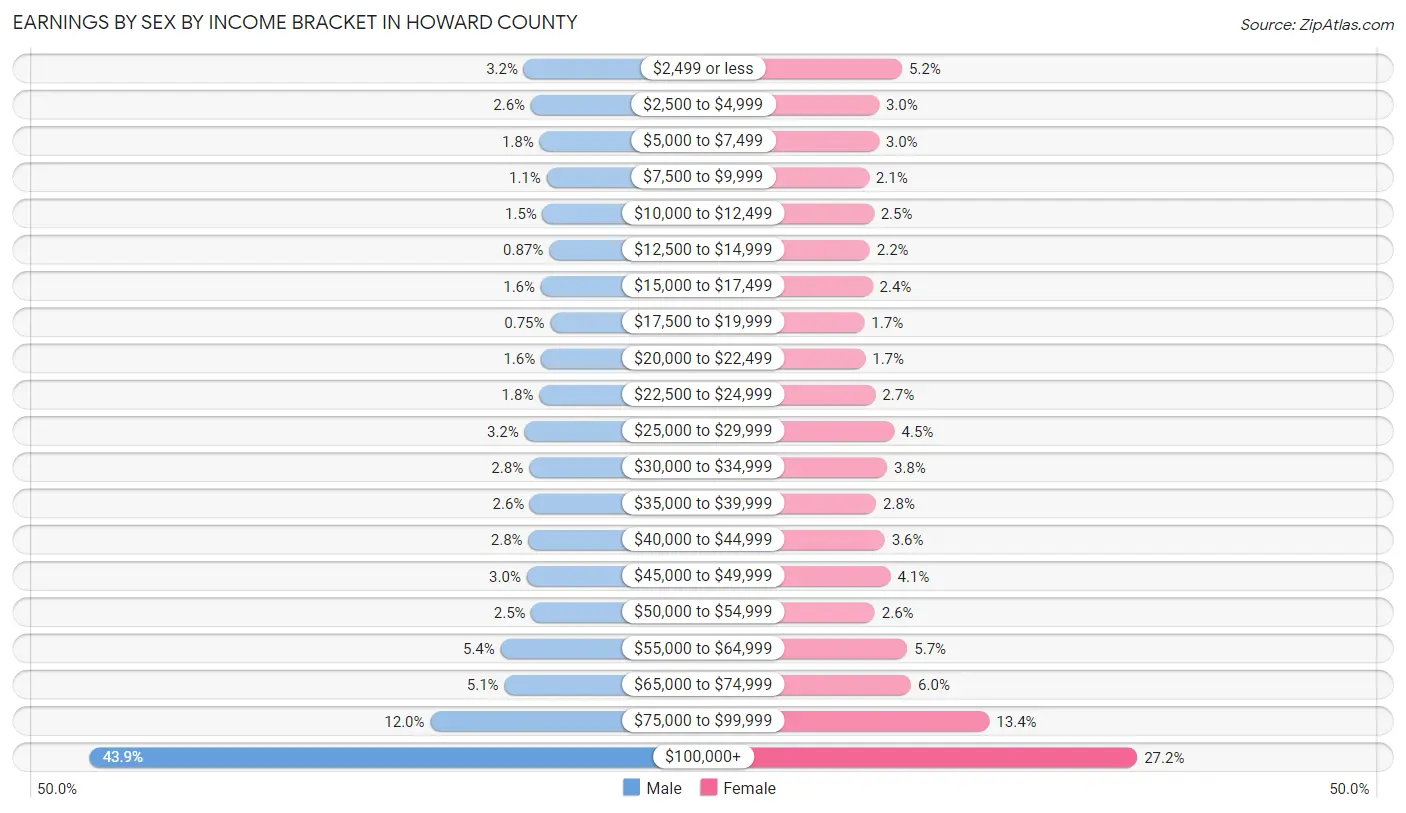
Earnings by Sex by Income Bracket in Howard County
The most common earnings brackets in Howard County are $100,000+ for men (43,653 | 43.9%) and $100,000+ for women (24,914 | 27.2%).
| Income | Male | Female |
| $2,499 or less | 3,220 (3.2%) | 4,743 (5.2%) |
| $2,500 to $4,999 | 2,557 (2.6%) | 2,757 (3.0%) |
| $5,000 to $7,499 | 1,751 (1.8%) | 2,747 (3.0%) |
| $7,500 to $9,999 | 1,093 (1.1%) | 1,895 (2.1%) |
| $10,000 to $12,499 | 1,457 (1.5%) | 2,312 (2.5%) |
| $12,500 to $14,999 | 864 (0.9%) | 1,976 (2.2%) |
| $15,000 to $17,499 | 1,633 (1.6%) | 2,220 (2.4%) |
| $17,500 to $19,999 | 749 (0.7%) | 1,507 (1.7%) |
| $20,000 to $22,499 | 1,613 (1.6%) | 1,585 (1.7%) |
| $22,500 to $24,999 | 1,779 (1.8%) | 2,457 (2.7%) |
| $25,000 to $29,999 | 3,147 (3.2%) | 4,105 (4.5%) |
| $30,000 to $34,999 | 2,734 (2.8%) | 3,453 (3.8%) |
| $35,000 to $39,999 | 2,629 (2.6%) | 2,518 (2.8%) |
| $40,000 to $44,999 | 2,783 (2.8%) | 3,263 (3.6%) |
| $45,000 to $49,999 | 2,942 (3.0%) | 3,754 (4.1%) |
| $50,000 to $54,999 | 2,506 (2.5%) | 2,412 (2.6%) |
| $55,000 to $64,999 | 5,381 (5.4%) | 5,195 (5.7%) |
| $65,000 to $74,999 | 5,024 (5.1%) | 5,524 (6.0%) |
| $75,000 to $99,999 | 11,918 (12.0%) | 12,232 (13.4%) |
| $100,000+ | 43,653 (43.9%) | 24,914 (27.2%) |
| Total | 99,433 (100.0%) | 91,569 (100.0%) |
Earnings by Sex by Educational Attainment in Howard County
Average earnings in Howard County are $99,720 for men and $68,696 for women, a difference of 31.1%. Men with an educational attainment of graduate degree enjoy the highest average annual earnings of $134,610, while those with less than high school education earn the least with $43,051. Women with an educational attainment of graduate degree earn the most with the average annual earnings of $98,168, while those with less than high school education have the smallest earnings of $26,528.
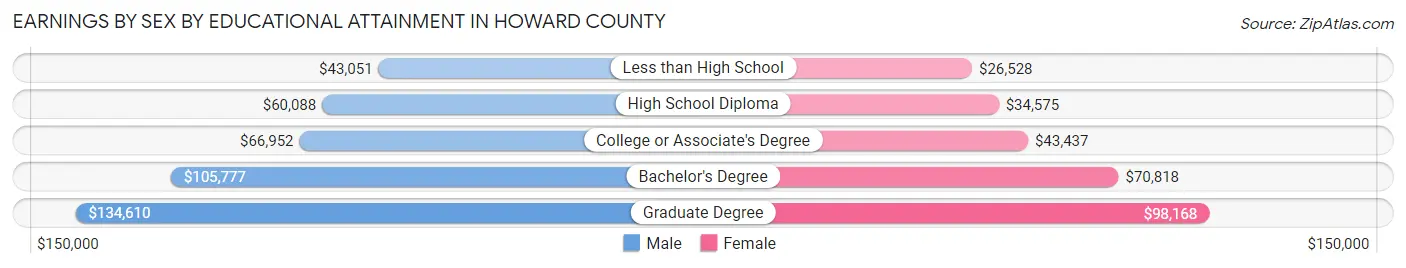
| Educational Attainment | Male Income | Female Income |
| Less than High School | $43,051 | $26,528 |
| High School Diploma | $60,088 | $34,575 |
| College or Associate's Degree | $66,952 | $43,437 |
| Bachelor's Degree | $105,777 | $70,818 |
| Graduate Degree | $134,610 | $98,168 |
| Total | $99,720 | $68,696 |
Family Income in Howard County
Family Income Brackets in Howard County
According to the Howard County family income data, there are 34,559 families falling into the $200,000+ income range, which is the most common income bracket and makes up 39.4% of all families. Conversely, the $10,000 to $14,999 income bracket is the least frequent group with only 614 families (0.7%) belonging to this category.
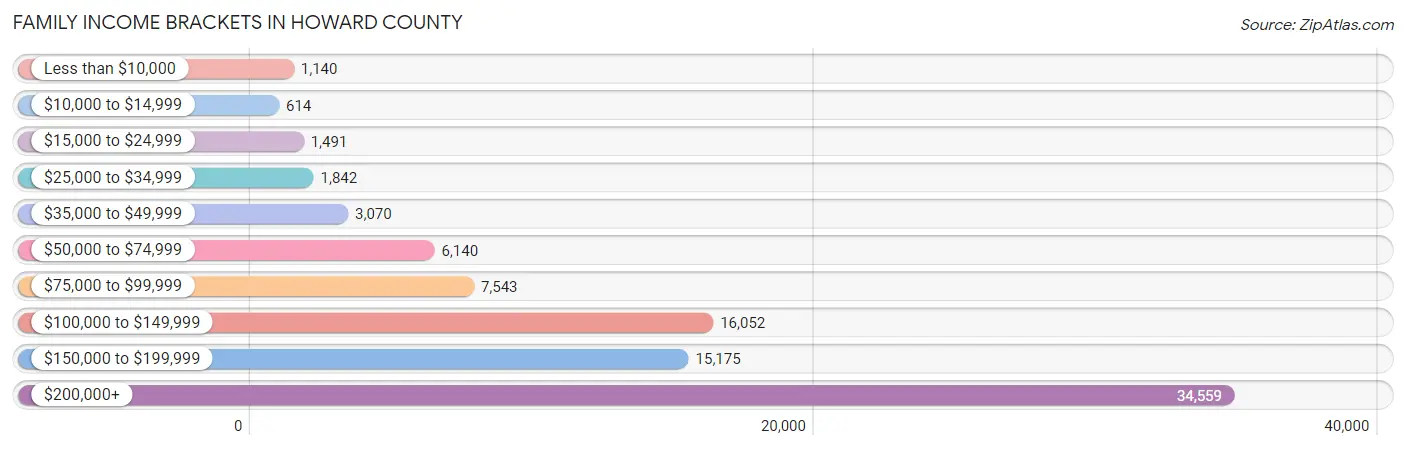
| Income Bracket | # Families | % Families |
| Less than $10,000 | 1,140 | 1.3% |
| $10,000 to $14,999 | 614 | 0.7% |
| $15,000 to $24,999 | 1,491 | 1.7% |
| $25,000 to $34,999 | 1,842 | 2.1% |
| $35,000 to $49,999 | 3,070 | 3.5% |
| $50,000 to $74,999 | 6,140 | 7.0% |
| $75,000 to $99,999 | 7,543 | 8.6% |
| $100,000 to $149,999 | 16,052 | 18.3% |
| $150,000 to $199,999 | 15,175 | 17.3% |
| $200,000+ | 34,559 | 39.4% |
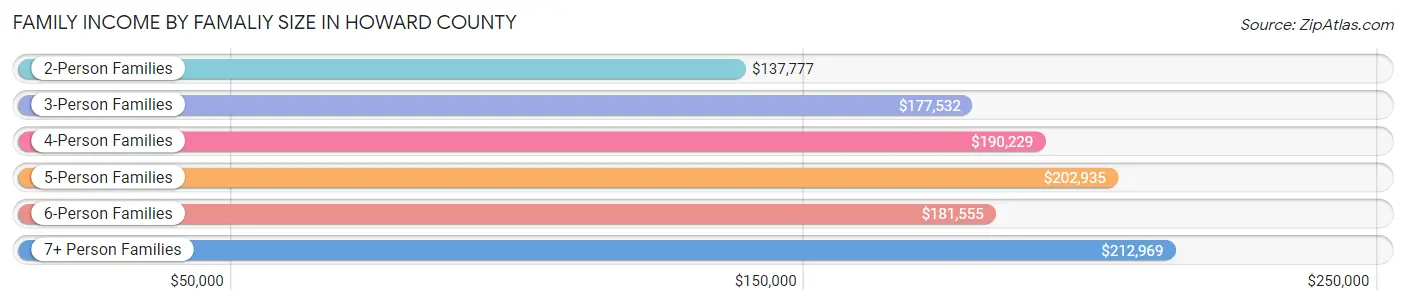
Family Income by Famaliy Size in Howard County
7+ person families (1,353 | 1.5%) account for the highest median family income in Howard County with $212,969 per family, while 2-person families (34,944 | 39.8%) have the highest median income of $68,888 per family member.
| Income Bracket | # Families | Median Income |
| 2-Person Families | 34,944 (39.8%) | $137,777 |
| 3-Person Families | 20,029 (22.8%) | $177,532 |
| 4-Person Families | 21,742 (24.8%) | $190,229 |
| 5-Person Families | 6,979 (8.0%) | $202,935 |
| 6-Person Families | 2,667 (3.0%) | $181,555 |
| 7+ Person Families | 1,353 (1.5%) | $212,969 |
| Total | 87,714 (100.0%) | $169,085 |
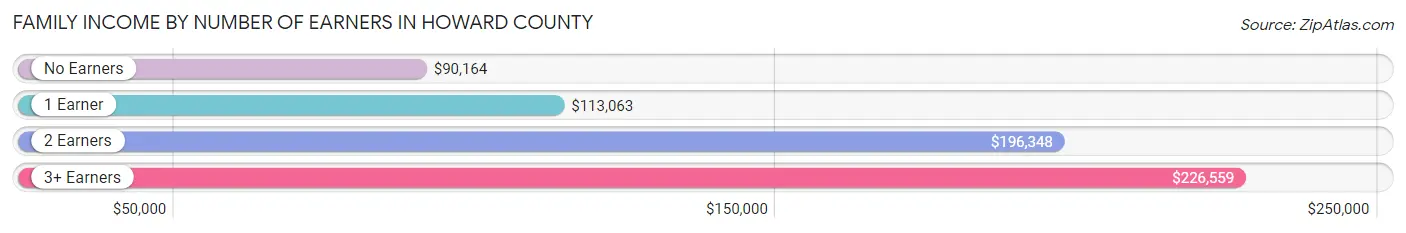
Family Income by Number of Earners in Howard County
The median family income in Howard County is $169,085, with families comprising 3+ earners (13,141) having the highest median family income of $226,559, while families with no earners (8,056) have the lowest median family income of $90,164, accounting for 15.0% and 9.2% of families, respectively.
| Number of Earners | # Families | Median Income |
| No Earners | 8,056 (9.2%) | $90,164 |
| 1 Earner | 23,738 (27.1%) | $113,063 |
| 2 Earners | 42,779 (48.8%) | $196,348 |
| 3+ Earners | 13,141 (15.0%) | $226,559 |
| Total | 87,714 (100.0%) | $169,085 |
Household Income in Howard County
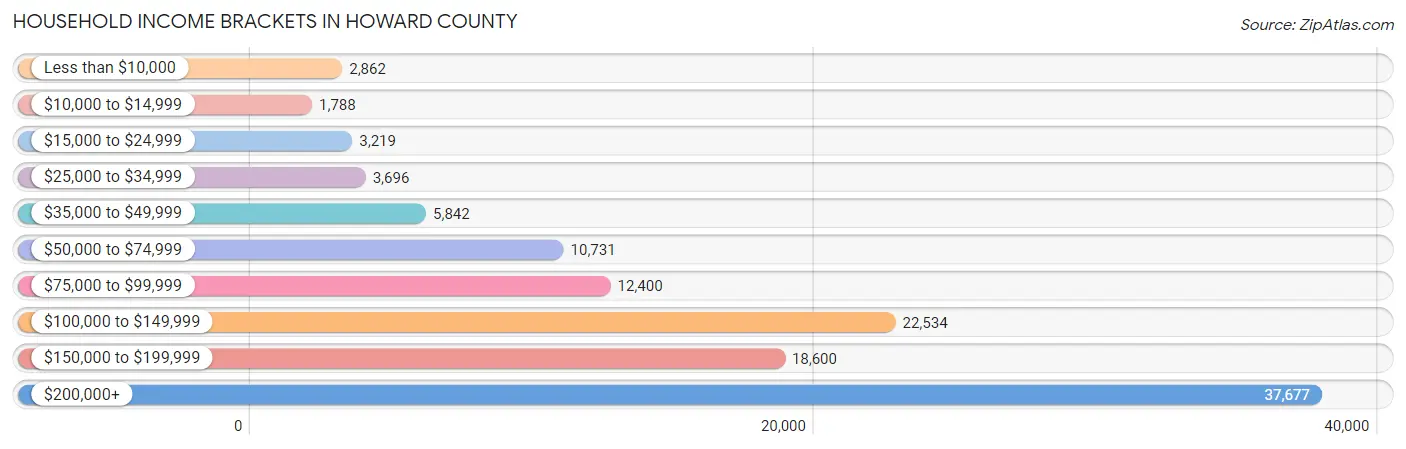
Household Income Brackets in Howard County
With 37,677 households falling in the category, the $200,000+ income range is the most frequent in Howard County, accounting for 31.6% of all households. In contrast, only 1,788 households (1.5%) fall into the $10,000 to $14,999 income bracket, making it the least populous group.
| Income Bracket | # Households | % Households |
| Less than $10,000 | 2,862 | 2.4% |
| $10,000 to $14,999 | 1,788 | 1.5% |
| $15,000 to $24,999 | 3,219 | 2.7% |
| $25,000 to $34,999 | 3,696 | 3.1% |
| $35,000 to $49,999 | 5,842 | 4.9% |
| $50,000 to $74,999 | 10,731 | 9.0% |
| $75,000 to $99,999 | 12,400 | 10.4% |
| $100,000 to $149,999 | 22,534 | 18.9% |
| $150,000 to $199,999 | 18,600 | 15.6% |
| $200,000+ | 37,677 | 31.6% |
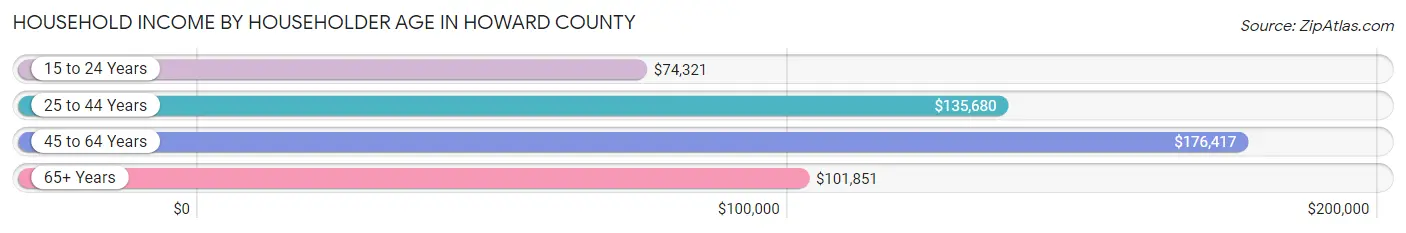
Household Income by Householder Age in Howard County
The median household income in Howard County is $140,971, with the highest median household income of $176,417 found in the 45 to 64 years age bracket for the primary householder. A total of 49,363 households (41.4%) fall into this category. Meanwhile, the 15 to 24 years age bracket for the primary householder has the lowest median household income of $74,321, with 2,576 households (2.2%) in this group.
| Income Bracket | # Households | Median Income |
| 15 to 24 Years | 2,576 (2.2%) | $74,321 |
| 25 to 44 Years | 39,633 (33.2%) | $135,680 |
| 45 to 64 Years | 49,363 (41.4%) | $176,417 |
| 65+ Years | 27,658 (23.2%) | $101,851 |
| Total | 119,230 (100.0%) | $140,971 |
Poverty in Howard County
Income Below Poverty by Sex and Age in Howard County
With 4.6% poverty level for males and 6.1% for females among the residents of Howard County, 5 year old males and 18 to 24 year old females are the most vulnerable to poverty, with 214 males (11.2%) and 1,509 females (11.6%) in their respective age groups living below the poverty level.
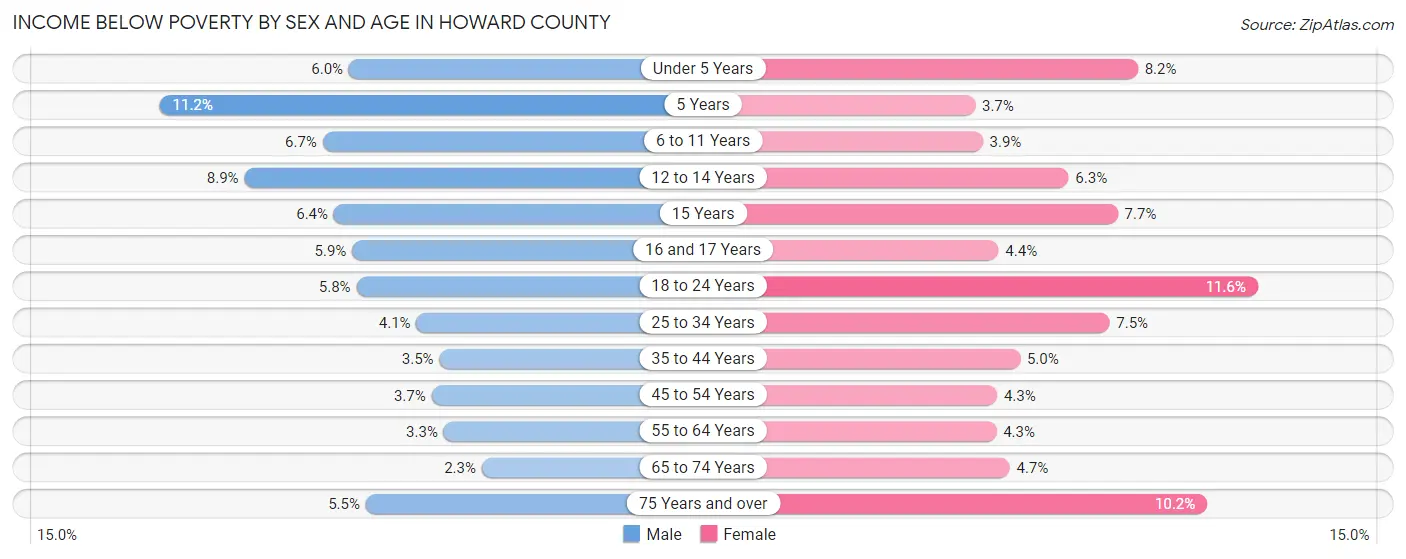
| Age Bracket | Male | Female |
| Under 5 Years | 572 (6.0%) | 706 (8.2%) |
| 5 Years | 214 (11.2%) | 70 (3.7%) |
| 6 to 11 Years | 924 (6.7%) | 476 (3.9%) |
| 12 to 14 Years | 691 (8.9%) | 497 (6.3%) |
| 15 Years | 168 (6.4%) | 209 (7.7%) |
| 16 and 17 Years | 290 (5.9%) | 197 (4.4%) |
| 18 to 24 Years | 811 (5.8%) | 1,509 (11.6%) |
| 25 to 34 Years | 805 (4.1%) | 1,462 (7.4%) |
| 35 to 44 Years | 792 (3.5%) | 1,222 (5.0%) |
| 45 to 54 Years | 830 (3.7%) | 1,025 (4.3%) |
| 55 to 64 Years | 713 (3.3%) | 934 (4.3%) |
| 65 to 74 Years | 303 (2.3%) | 704 (4.7%) |
| 75 Years and over | 443 (5.5%) | 1,104 (10.2%) |
| Total | 7,556 (4.6%) | 10,115 (6.1%) |
Income Above Poverty by Sex and Age in Howard County
According to the poverty statistics in Howard County, males aged 65 to 74 years and females aged 5 years are the age groups that are most secure financially, with 97.7% of males and 96.3% of females in these age groups living above the poverty line.
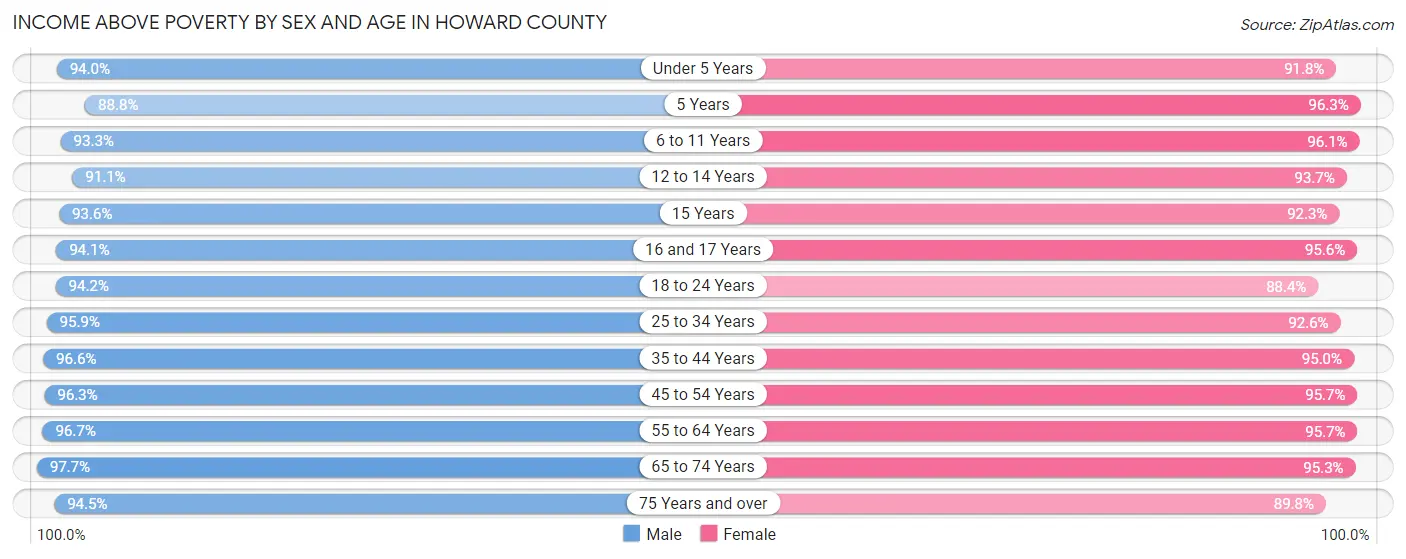
| Age Bracket | Male | Female |
| Under 5 Years | 9,014 (94.0%) | 7,867 (91.8%) |
| 5 Years | 1,690 (88.8%) | 1,816 (96.3%) |
| 6 to 11 Years | 12,868 (93.3%) | 11,681 (96.1%) |
| 12 to 14 Years | 7,090 (91.1%) | 7,376 (93.7%) |
| 15 Years | 2,461 (93.6%) | 2,514 (92.3%) |
| 16 and 17 Years | 4,641 (94.1%) | 4,319 (95.6%) |
| 18 to 24 Years | 13,257 (94.2%) | 11,517 (88.4%) |
| 25 to 34 Years | 18,871 (95.9%) | 18,166 (92.5%) |
| 35 to 44 Years | 22,188 (96.6%) | 23,398 (95.0%) |
| 45 to 54 Years | 21,814 (96.3%) | 22,685 (95.7%) |
| 55 to 64 Years | 20,670 (96.7%) | 20,771 (95.7%) |
| 65 to 74 Years | 13,058 (97.7%) | 14,363 (95.3%) |
| 75 Years and over | 7,607 (94.5%) | 9,750 (89.8%) |
| Total | 155,229 (95.4%) | 156,223 (93.9%) |
Income Below Poverty Among Married-Couple Families in Howard County
The poverty statistics for married-couple families in Howard County show that 1.9% or 1,355 of the total 70,027 families live below the poverty line. Families with 3 or 4 children have the highest poverty rate of 3.4%, comprising of 168 families. On the other hand, families with 5 or more children have the lowest poverty rate of 0.5%, which includes 2 families.
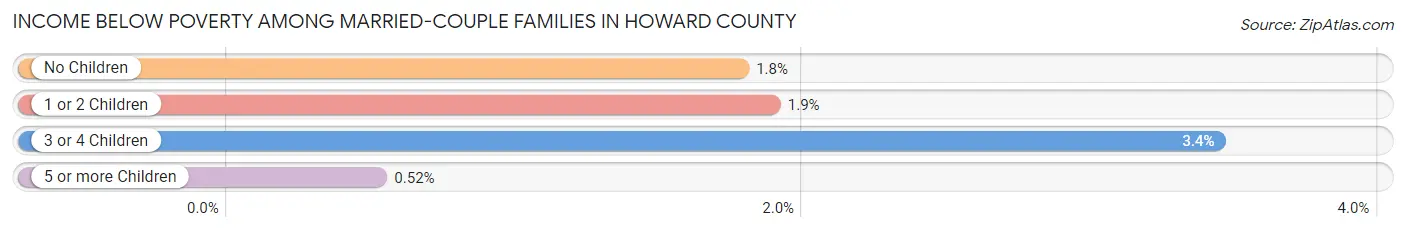
| Children | Above Poverty | Below Poverty |
| No Children | 35,433 (98.2%) | 642 (1.8%) |
| 1 or 2 Children | 28,138 (98.1%) | 543 (1.9%) |
| 3 or 4 Children | 4,716 (96.6%) | 168 (3.4%) |
| 5 or more Children | 385 (99.5%) | 2 (0.5%) |
| Total | 68,672 (98.1%) | 1,355 (1.9%) |
Income Below Poverty Among Single-Parent Households in Howard County
According to the poverty data in Howard County, 4.8% or 219 single-father households and 12.4% or 1,631 single-mother households are living below the poverty line. Among single-father households, those with 3 or 4 children have the highest poverty rate, with 61 households (20.5%) experiencing poverty. Likewise, among single-mother households, those with 3 or 4 children have the highest poverty rate, with 527 households (37.4%) falling below the poverty line.
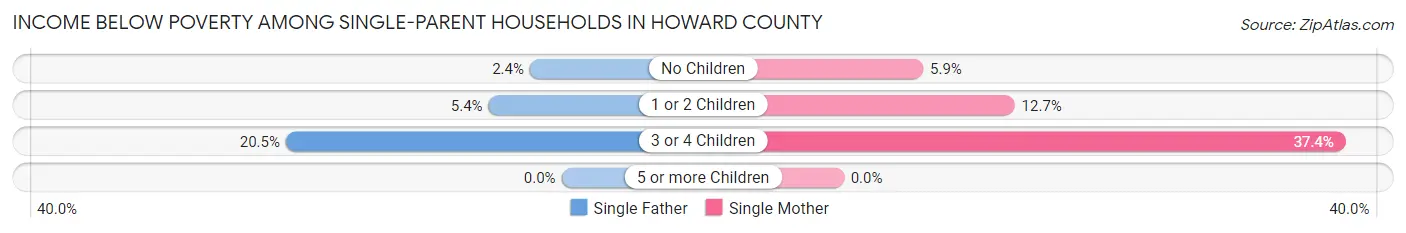
| Children | Single Father | Single Mother |
| No Children | 53 (2.4%) | 338 (5.9%) |
| 1 or 2 Children | 105 (5.4%) | 766 (12.7%) |
| 3 or 4 Children | 61 (20.5%) | 527 (37.4%) |
| 5 or more Children | 0 (0.0%) | 0 (0.0%) |
| Total | 219 (4.8%) | 1,631 (12.4%) |
Income Below Poverty Among Married-Couple vs Single-Parent Households in Howard County
The poverty data for Howard County shows that 1,355 of the married-couple family households (1.9%) and 1,850 of the single-parent households (10.5%) are living below the poverty level. Within the married-couple family households, those with 3 or 4 children have the highest poverty rate, with 168 households (3.4%) falling below the poverty line. Among the single-parent households, those with 3 or 4 children have the highest poverty rate, with 588 household (34.5%) living below poverty.
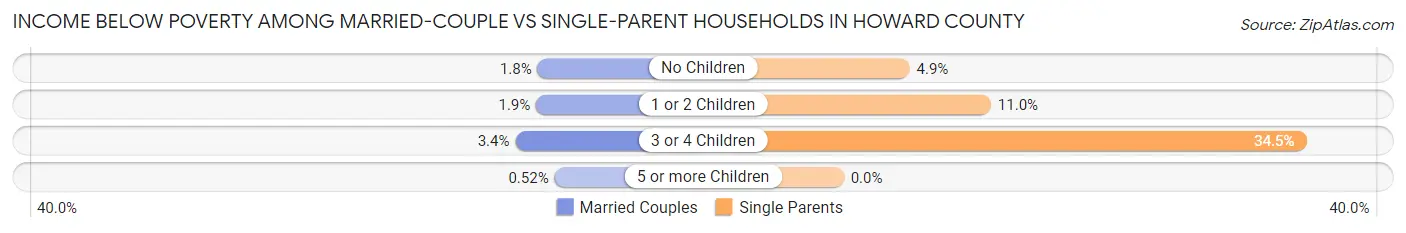
| Children | Married-Couple Families | Single-Parent Households |
| No Children | 642 (1.8%) | 391 (4.9%) |
| 1 or 2 Children | 543 (1.9%) | 871 (11.0%) |
| 3 or 4 Children | 168 (3.4%) | 588 (34.5%) |
| 5 or more Children | 2 (0.5%) | 0 (0.0%) |
| Total | 1,355 (1.9%) | 1,850 (10.5%) |
Employment Characteristics in Howard County
Employment by Class of Employer in Howard County
Among the 173,546 employed individuals in Howard County, private company employees (95,546 | 55.1%), federal government employees (22,787 | 13.1%), and not-for-profit organizations (19,759 | 11.4%) make up the most common classes of employment.
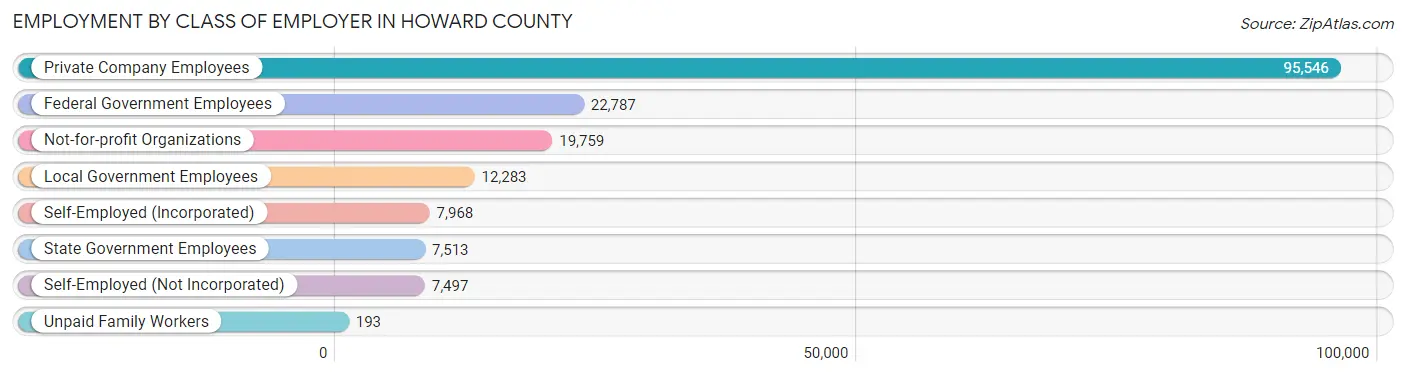
| Employer Class | # Employees | % Employees |
| Private Company Employees | 95,546 | 55.1% |
| Self-Employed (Incorporated) | 7,968 | 4.6% |
| Self-Employed (Not Incorporated) | 7,497 | 4.3% |
| Not-for-profit Organizations | 19,759 | 11.4% |
| Local Government Employees | 12,283 | 7.1% |
| State Government Employees | 7,513 | 4.3% |
| Federal Government Employees | 22,787 | 13.1% |
| Unpaid Family Workers | 193 | 0.1% |
| Total | 173,546 | 100.0% |
Employment Status by Age in Howard County
According to the labor force statistics for Howard County, out of the total population over 16 years of age (261,898), 70.1% or 183,590 individuals are in the labor force, with 3.8% or 6,976 of them unemployed. The age group with the highest labor force participation rate is 45 to 54 years, with 88.8% or 41,317 individuals in the labor force. Within the labor force, the 16 to 19 years age range has the highest percentage of unemployed individuals, with 12.0% or 730 of them being unemployed.
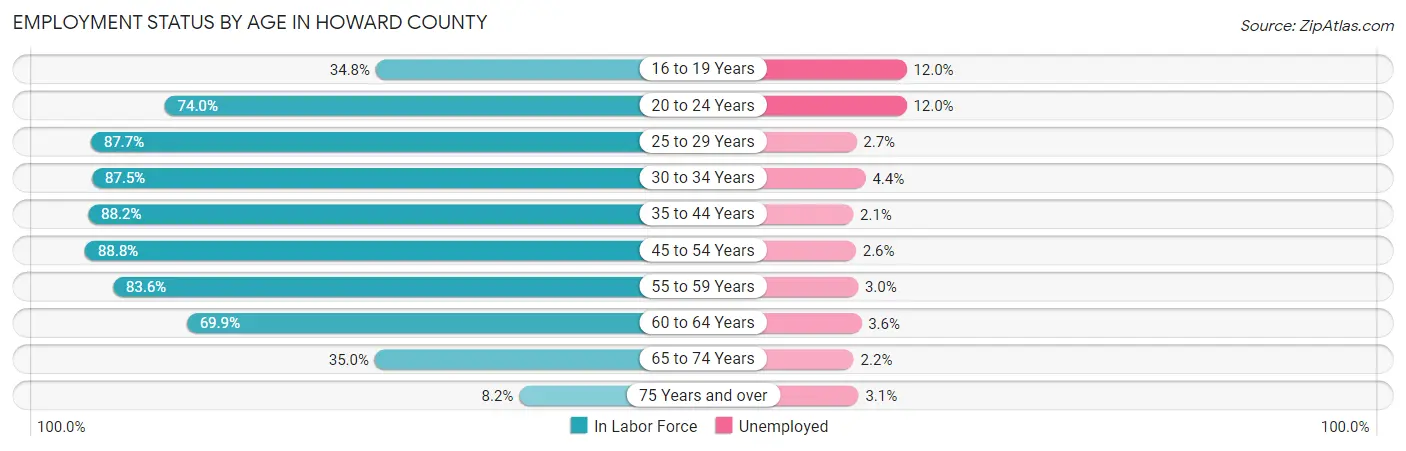
| Age Bracket | In Labor Force | Unemployed |
| 16 to 19 Years | 6,082 (34.8%) | 730 (12.0%) |
| 20 to 24 Years | 14,181 (74.0%) | 1,702 (12.0%) |
| 25 to 29 Years | 16,665 (87.7%) | 450 (2.7%) |
| 30 to 34 Years | 17,962 (87.5%) | 790 (4.4%) |
| 35 to 44 Years | 42,245 (88.2%) | 887 (2.1%) |
| 45 to 54 Years | 41,317 (88.8%) | 1,074 (2.6%) |
| 55 to 59 Years | 19,746 (83.6%) | 592 (3.0%) |
| 60 to 64 Years | 13,714 (69.9%) | 494 (3.6%) |
| 65 to 74 Years | 10,005 (35.0%) | 220 (2.2%) |
| 75 Years and over | 1,597 (8.2%) | 50 (3.1%) |
| Total | 183,590 (70.1%) | 6,976 (3.8%) |
Employment Status by Educational Attainment in Howard County
According to labor force statistics for Howard County, 85.6% of individuals (151,679) out of the total population between 25 and 64 years of age (177,195) are in the labor force, with 2.8% or 4,247 of them being unemployed. The group with the highest labor force participation rate are those with the educational attainment of bachelor's degree or higher, with 89.5% or 105,012 individuals in the labor force. Within the labor force, individuals with high school diploma education have the highest percentage of unemployment, with 8.5% or 1,295 of them being unemployed.
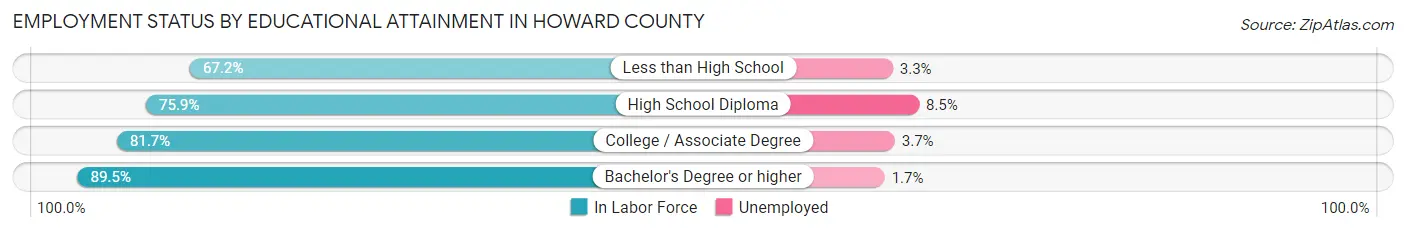
| Educational Attainment | In Labor Force | Unemployed |
| Less than High School | 4,948 (67.2%) | 243 (3.3%) |
| High School Diploma | 15,237 (75.9%) | 1,706 (8.5%) |
| College / Associate Degree | 26,491 (81.7%) | 1,200 (3.7%) |
| Bachelor's Degree or higher | 105,012 (89.5%) | 1,995 (1.7%) |
| Total | 151,679 (85.6%) | 4,961 (2.8%) |
Employment Occupations by Sex in Howard County
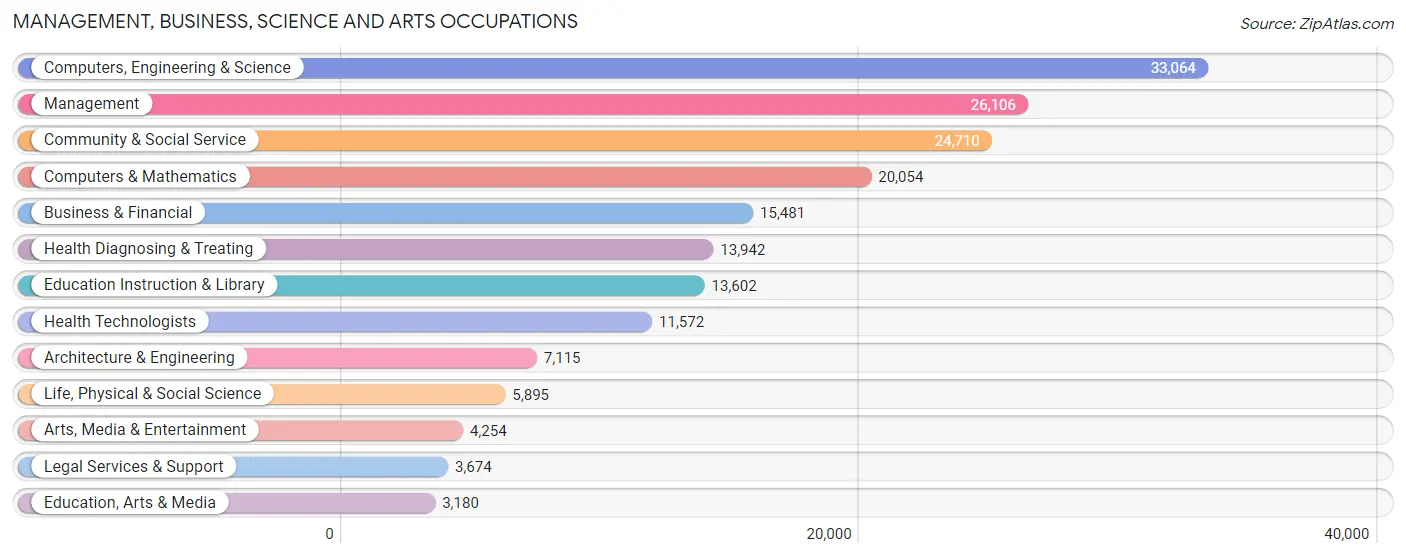
Management, Business, Science and Arts Occupations
The most common Management, Business, Science and Arts occupations in Howard County are Computers, Engineering & Science (33,064 | 19.0%), Management (26,106 | 15.0%), Community & Social Service (24,710 | 14.2%), Computers & Mathematics (20,054 | 11.5%), and Business & Financial (15,481 | 8.9%).
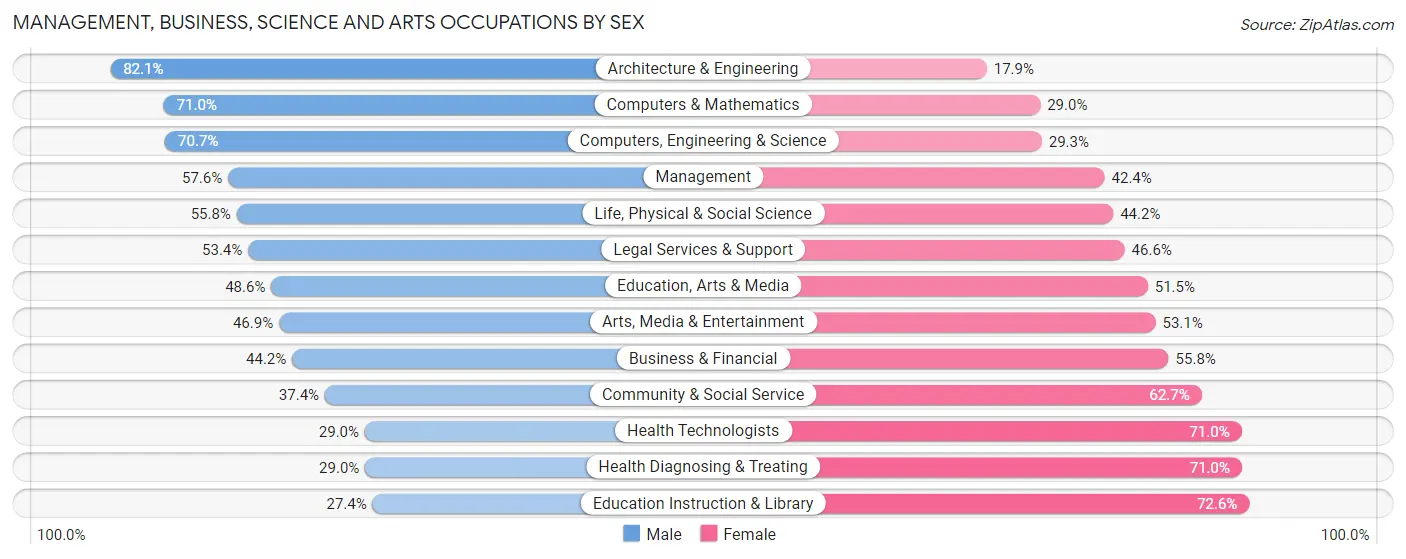
Management, Business, Science and Arts Occupations by Sex
Within the Management, Business, Science and Arts occupations in Howard County, the most male-oriented occupations are Architecture & Engineering (82.1%), Computers & Mathematics (71.0%), and Computers, Engineering & Science (70.7%), while the most female-oriented occupations are Education Instruction & Library (72.6%), Health Diagnosing & Treating (71.0%), and Health Technologists (71.0%).
| Occupation | Male | Female |
| Management | 15,027 (57.6%) | 11,079 (42.4%) |
| Business & Financial | 6,843 (44.2%) | 8,638 (55.8%) |
| Computers, Engineering & Science | 23,367 (70.7%) | 9,697 (29.3%) |
| Computers & Mathematics | 14,236 (71.0%) | 5,818 (29.0%) |
| Architecture & Engineering | 5,844 (82.1%) | 1,271 (17.9%) |
| Life, Physical & Social Science | 3,287 (55.8%) | 2,608 (44.2%) |
| Community & Social Service | 9,230 (37.3%) | 15,480 (62.6%) |
| Education, Arts & Media | 1,544 (48.5%) | 1,636 (51.4%) |
| Legal Services & Support | 1,961 (53.4%) | 1,713 (46.6%) |
| Education Instruction & Library | 3,728 (27.4%) | 9,874 (72.6%) |
| Arts, Media & Entertainment | 1,997 (46.9%) | 2,257 (53.1%) |
| Health Diagnosing & Treating | 4,037 (29.0%) | 9,905 (71.0%) |
| Health Technologists | 3,358 (29.0%) | 8,214 (71.0%) |
| Total (Category) | 58,504 (51.6%) | 54,799 (48.4%) |
| Total (Overall) | 90,900 (52.1%) | 83,405 (47.8%) |
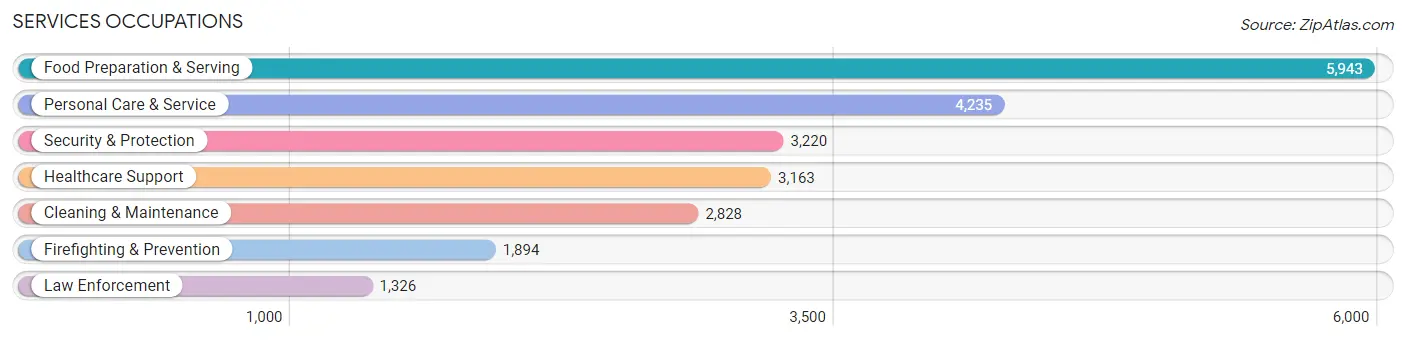
Services Occupations
The most common Services occupations in Howard County are Food Preparation & Serving (5,943 | 3.4%), Personal Care & Service (4,235 | 2.4%), Security & Protection (3,220 | 1.8%), Healthcare Support (3,163 | 1.8%), and Cleaning & Maintenance (2,828 | 1.6%).
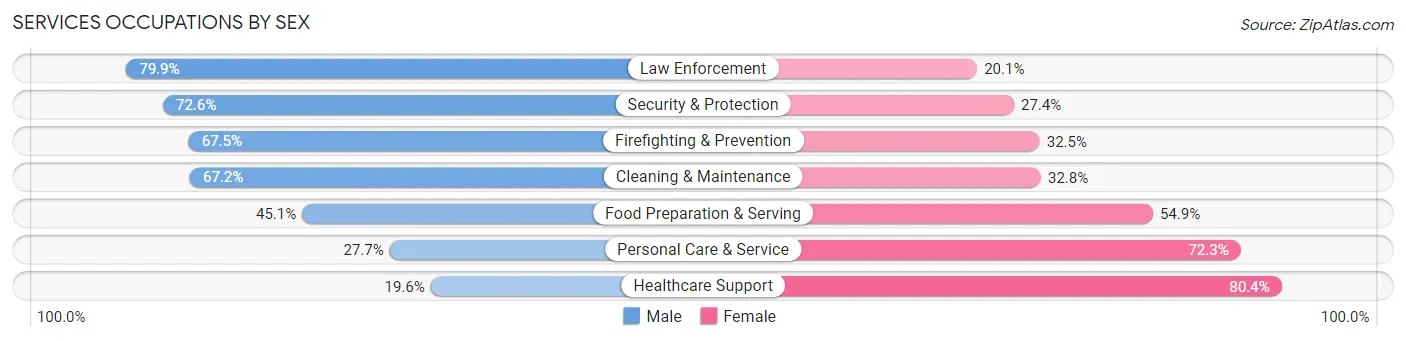
Services Occupations by Sex
Within the Services occupations in Howard County, the most male-oriented occupations are Law Enforcement (79.9%), Security & Protection (72.6%), and Firefighting & Prevention (67.5%), while the most female-oriented occupations are Healthcare Support (80.4%), Personal Care & Service (72.3%), and Food Preparation & Serving (54.9%).
| Occupation | Male | Female |
| Healthcare Support | 620 (19.6%) | 2,543 (80.4%) |
| Security & Protection | 2,337 (72.6%) | 883 (27.4%) |
| Firefighting & Prevention | 1,278 (67.5%) | 616 (32.5%) |
| Law Enforcement | 1,059 (79.9%) | 267 (20.1%) |
| Food Preparation & Serving | 2,678 (45.1%) | 3,265 (54.9%) |
| Cleaning & Maintenance | 1,901 (67.2%) | 927 (32.8%) |
| Personal Care & Service | 1,175 (27.7%) | 3,060 (72.3%) |
| Total (Category) | 8,711 (44.9%) | 10,678 (55.1%) |
| Total (Overall) | 90,900 (52.1%) | 83,405 (47.8%) |
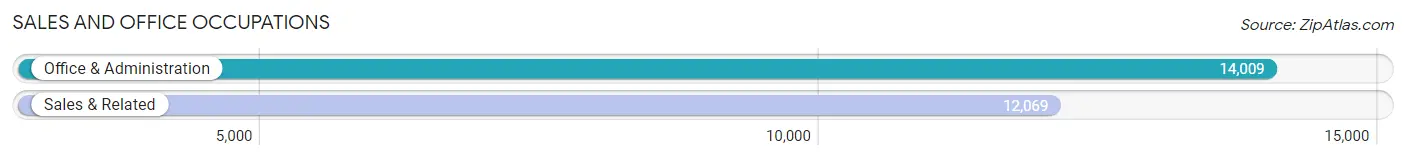
Sales and Office Occupations
The most common Sales and Office occupations in Howard County are Office & Administration (14,009 | 8.0%), and Sales & Related (12,069 | 6.9%).
Sales and Office Occupations by Sex
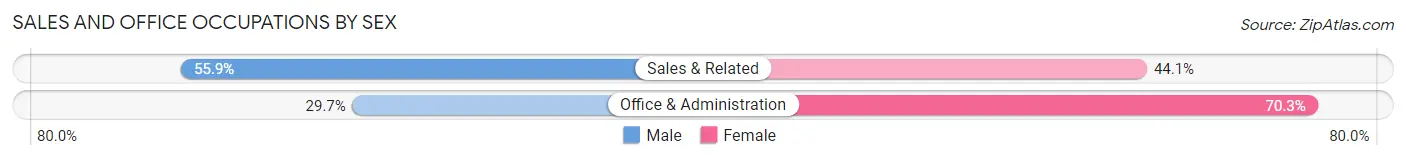
| Occupation | Male | Female |
| Sales & Related | 6,752 (55.9%) | 5,317 (44.1%) |
| Office & Administration | 4,159 (29.7%) | 9,850 (70.3%) |
| Total (Category) | 10,911 (41.8%) | 15,167 (58.2%) |
| Total (Overall) | 90,900 (52.1%) | 83,405 (47.8%) |
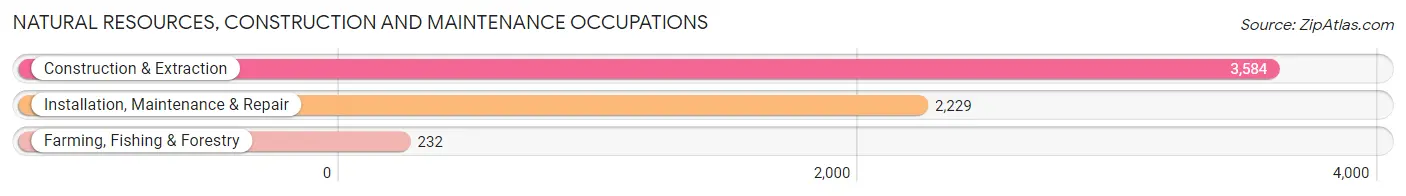
Natural Resources, Construction and Maintenance Occupations
The most common Natural Resources, Construction and Maintenance occupations in Howard County are Construction & Extraction (3,584 | 2.1%), Installation, Maintenance & Repair (2,229 | 1.3%), and Farming, Fishing & Forestry (232 | 0.1%).
Natural Resources, Construction and Maintenance Occupations by Sex
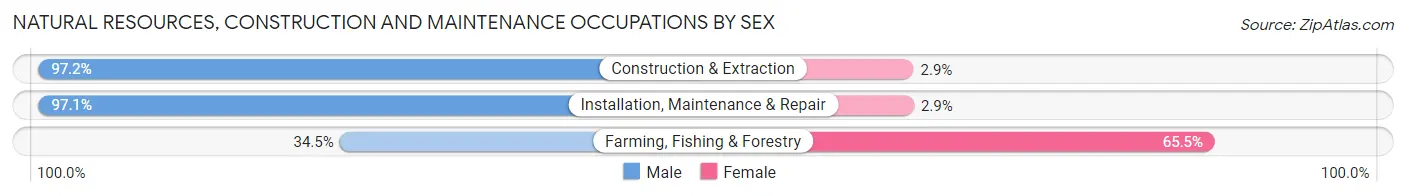
| Occupation | Male | Female |
| Farming, Fishing & Forestry | 80 (34.5%) | 152 (65.5%) |
| Construction & Extraction | 3,482 (97.2%) | 102 (2.9%) |
| Installation, Maintenance & Repair | 2,164 (97.1%) | 65 (2.9%) |
| Total (Category) | 5,726 (94.7%) | 319 (5.3%) |
| Total (Overall) | 90,900 (52.1%) | 83,405 (47.8%) |
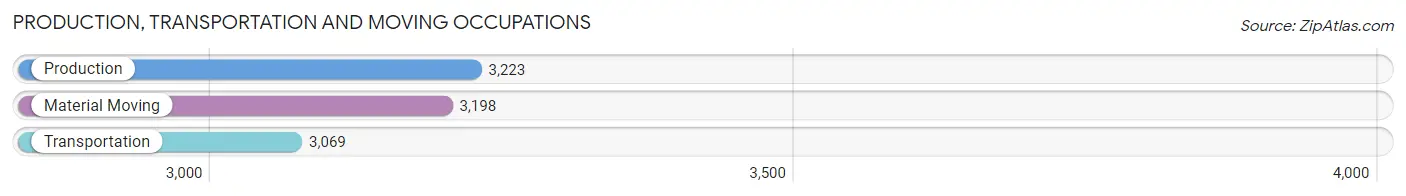
Production, Transportation and Moving Occupations
The most common Production, Transportation and Moving occupations in Howard County are Production (3,223 | 1.8%), Material Moving (3,198 | 1.8%), and Transportation (3,069 | 1.8%).
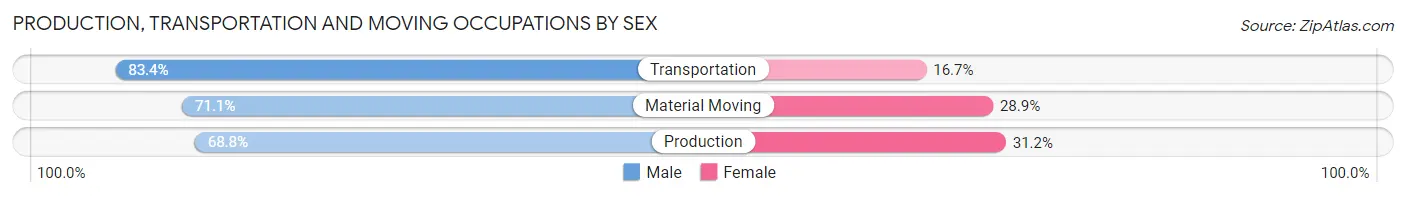
Production, Transportation and Moving Occupations by Sex
| Occupation | Male | Female |
| Production | 2,216 (68.8%) | 1,007 (31.2%) |
| Transportation | 2,558 (83.4%) | 511 (16.7%) |
| Material Moving | 2,274 (71.1%) | 924 (28.9%) |
| Total (Category) | 7,048 (74.3%) | 2,442 (25.7%) |
| Total (Overall) | 90,900 (52.1%) | 83,405 (47.8%) |
Employment Industries by Sex in Howard County
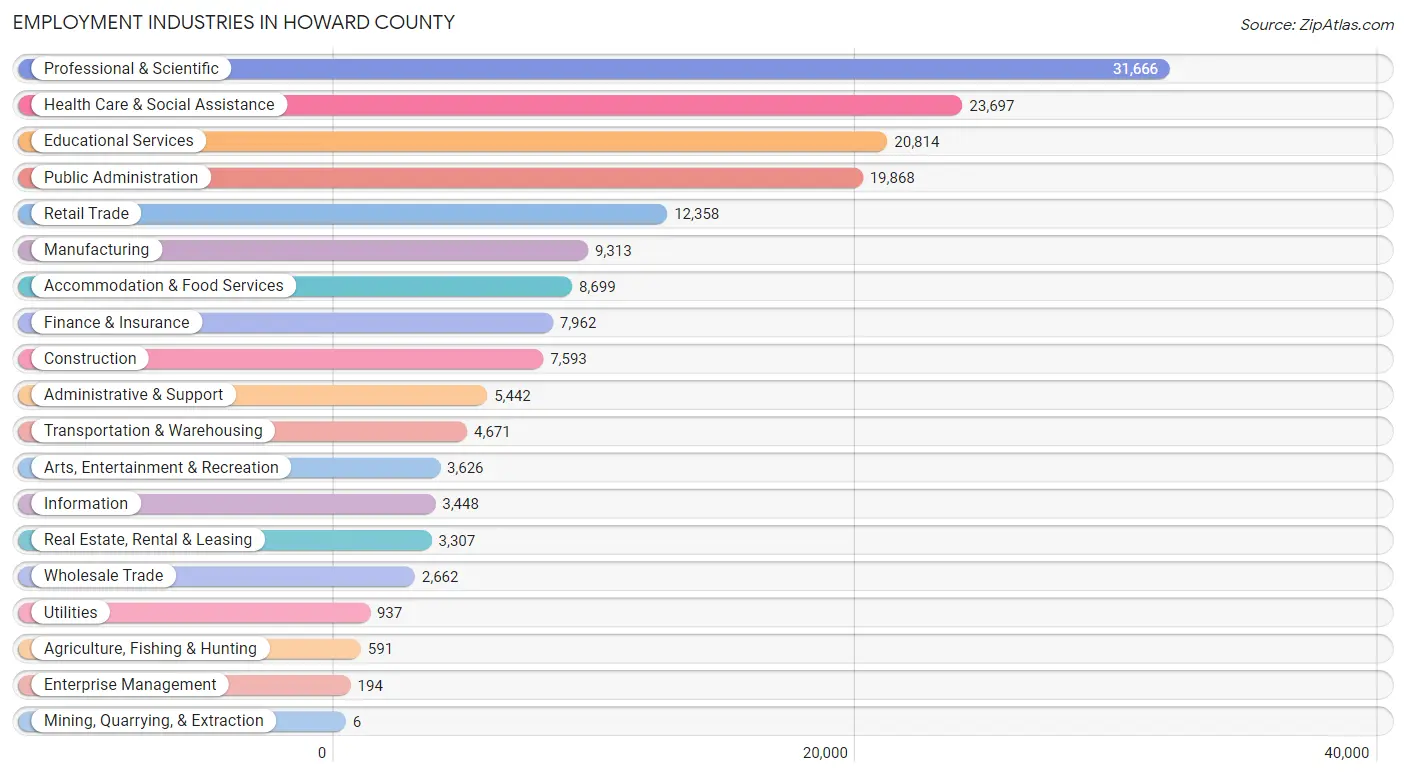
Employment Industries in Howard County
The major employment industries in Howard County include Professional & Scientific (31,666 | 18.2%), Health Care & Social Assistance (23,697 | 13.6%), Educational Services (20,814 | 11.9%), Public Administration (19,868 | 11.4%), and Retail Trade (12,358 | 7.1%).
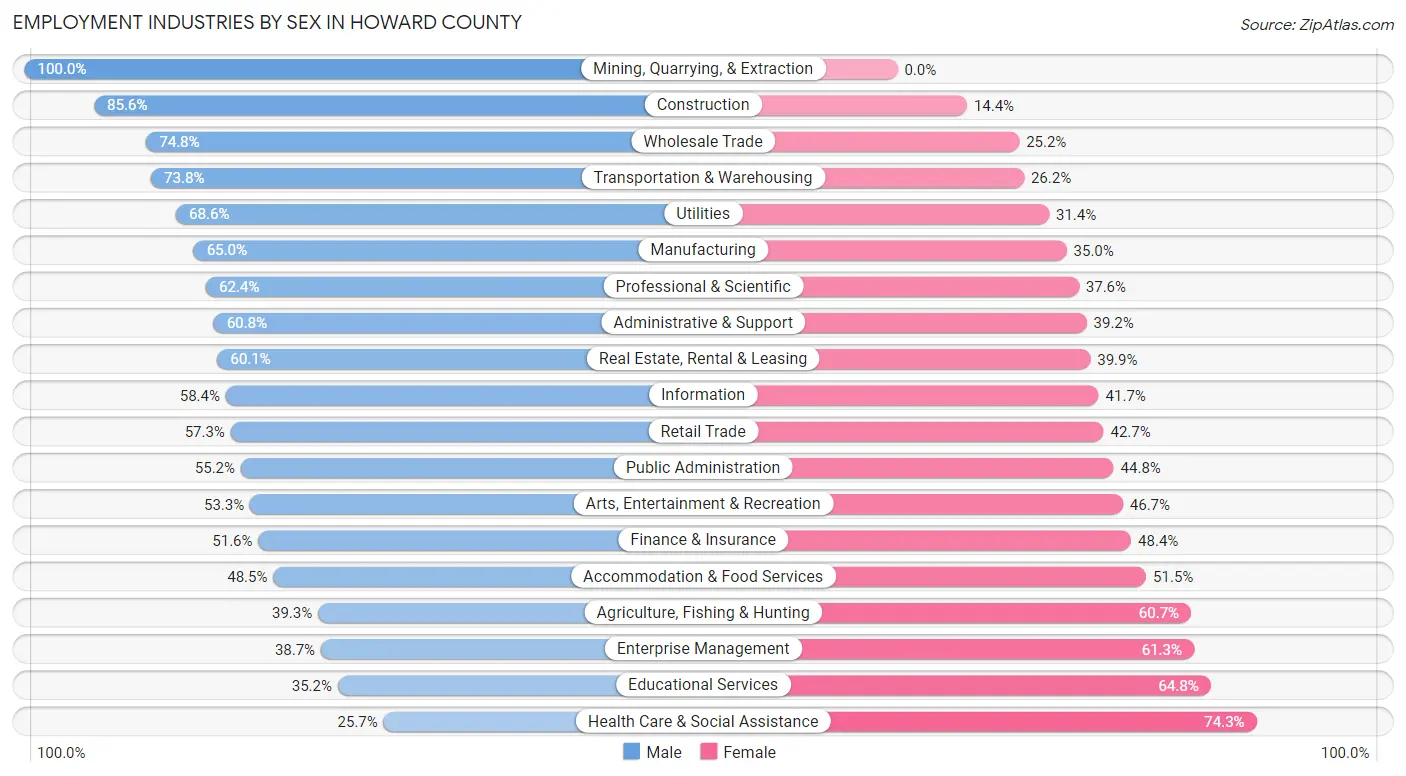
Employment Industries by Sex in Howard County
The Howard County industries that see more men than women are Mining, Quarrying, & Extraction (100.0%), Construction (85.6%), and Wholesale Trade (74.8%), whereas the industries that tend to have a higher number of women are Health Care & Social Assistance (74.3%), Educational Services (64.8%), and Enterprise Management (61.3%).
| Industry | Male | Female |
| Agriculture, Fishing & Hunting | 232 (39.3%) | 359 (60.7%) |
| Mining, Quarrying, & Extraction | 6 (100.0%) | 0 (0.0%) |
| Construction | 6,500 (85.6%) | 1,093 (14.4%) |
| Manufacturing | 6,052 (65.0%) | 3,261 (35.0%) |
| Wholesale Trade | 1,991 (74.8%) | 671 (25.2%) |
| Retail Trade | 7,086 (57.3%) | 5,272 (42.7%) |
| Transportation & Warehousing | 3,447 (73.8%) | 1,224 (26.2%) |
| Utilities | 643 (68.6%) | 294 (31.4%) |
| Information | 2,012 (58.4%) | 1,436 (41.6%) |
| Finance & Insurance | 4,110 (51.6%) | 3,852 (48.4%) |
| Real Estate, Rental & Leasing | 1,987 (60.1%) | 1,320 (39.9%) |
| Professional & Scientific | 19,772 (62.4%) | 11,894 (37.6%) |
| Enterprise Management | 75 (38.7%) | 119 (61.3%) |
| Administrative & Support | 3,311 (60.8%) | 2,131 (39.2%) |
| Educational Services | 7,321 (35.2%) | 13,493 (64.8%) |
| Health Care & Social Assistance | 6,089 (25.7%) | 17,608 (74.3%) |
| Arts, Entertainment & Recreation | 1,934 (53.3%) | 1,692 (46.7%) |
| Accommodation & Food Services | 4,221 (48.5%) | 4,478 (51.5%) |
| Public Administration | 10,976 (55.2%) | 8,892 (44.8%) |
| Total | 90,900 (52.1%) | 83,405 (47.8%) |
Education in Howard County
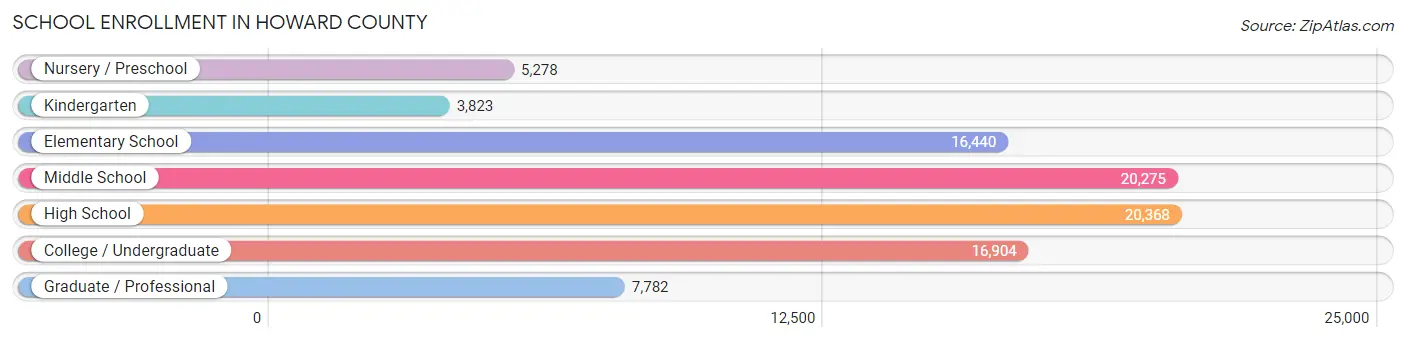
School Enrollment in Howard County
The most common levels of schooling among the 90,870 students in Howard County are high school (20,368 | 22.4%), middle school (20,275 | 22.3%), and college / undergraduate (16,904 | 18.6%).
| School Level | # Students | % Students |
| Nursery / Preschool | 5,278 | 5.8% |
| Kindergarten | 3,823 | 4.2% |
| Elementary School | 16,440 | 18.1% |
| Middle School | 20,275 | 22.3% |
| High School | 20,368 | 22.4% |
| College / Undergraduate | 16,904 | 18.6% |
| Graduate / Professional | 7,782 | 8.6% |
| Total | 90,870 | 100.0% |
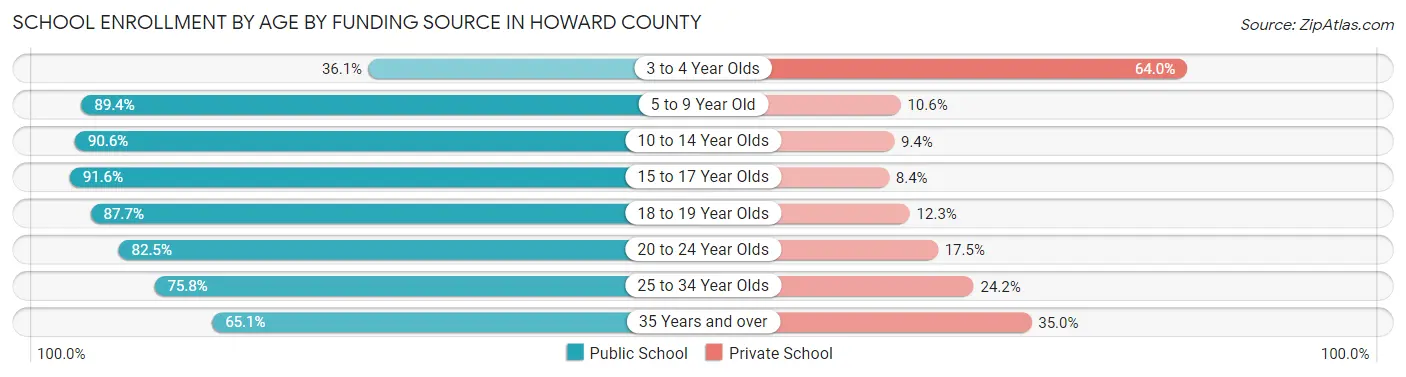
School Enrollment by Age by Funding Source in Howard County
Out of a total of 90,870 students who are enrolled in schools in Howard County, 14,176 (15.6%) attend a private institution, while the remaining 76,694 (84.4%) are enrolled in public schools. The age group of 3 to 4 year olds has the highest likelihood of being enrolled in private schools, with 2,601 (63.9% in the age bracket) enrolled. Conversely, the age group of 15 to 17 year olds has the lowest likelihood of being enrolled in a private school, with 13,406 (91.6% in the age bracket) attending a public institution.
| Age Bracket | Public School | Private School |
| 3 to 4 Year Olds | 1,466 (36.0%) | 2,601 (63.9%) |
| 5 to 9 Year Old | 17,753 (89.4%) | 2,100 (10.6%) |
| 10 to 14 Year Olds | 22,370 (90.6%) | 2,315 (9.4%) |
| 15 to 17 Year Olds | 13,406 (91.6%) | 1,232 (8.4%) |
| 18 to 19 Year Olds | 5,845 (87.7%) | 819 (12.3%) |
| 20 to 24 Year Olds | 7,137 (82.5%) | 1,516 (17.5%) |
| 25 to 34 Year Olds | 4,702 (75.8%) | 1,500 (24.2%) |
| 35 Years and over | 3,973 (65.0%) | 2,135 (34.9%) |
| Total | 76,694 (84.4%) | 14,176 (15.6%) |
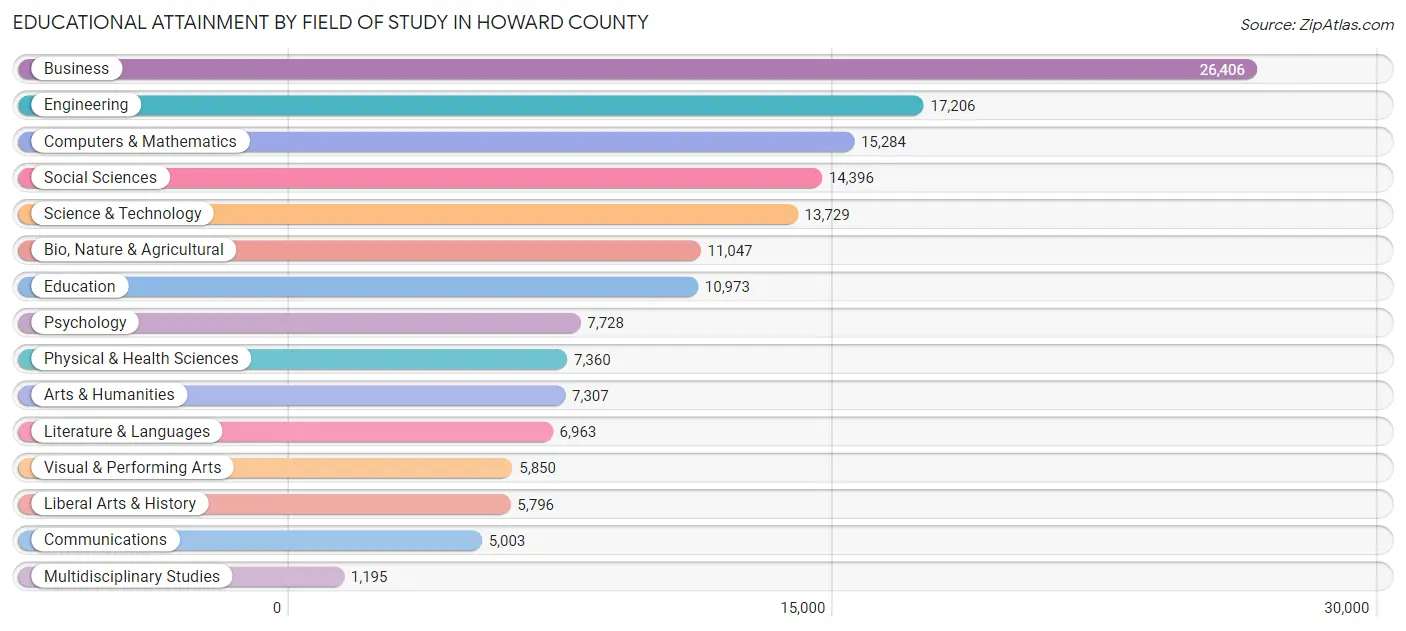
Educational Attainment by Field of Study in Howard County
Business (26,406 | 16.9%), engineering (17,206 | 11.0%), computers & mathematics (15,284 | 9.8%), social sciences (14,396 | 9.2%), and science & technology (13,729 | 8.8%) are the most common fields of study among 156,243 individuals in Howard County who have obtained a bachelor's degree or higher.
| Field of Study | # Graduates | % Graduates |
| Computers & Mathematics | 15,284 | 9.8% |
| Bio, Nature & Agricultural | 11,047 | 7.1% |
| Physical & Health Sciences | 7,360 | 4.7% |
| Psychology | 7,728 | 5.0% |
| Social Sciences | 14,396 | 9.2% |
| Engineering | 17,206 | 11.0% |
| Multidisciplinary Studies | 1,195 | 0.8% |
| Science & Technology | 13,729 | 8.8% |
| Business | 26,406 | 16.9% |
| Education | 10,973 | 7.0% |
| Literature & Languages | 6,963 | 4.5% |
| Liberal Arts & History | 5,796 | 3.7% |
| Visual & Performing Arts | 5,850 | 3.7% |
| Communications | 5,003 | 3.2% |
| Arts & Humanities | 7,307 | 4.7% |
| Total | 156,243 | 100.0% |
Transportation & Commute in Howard County
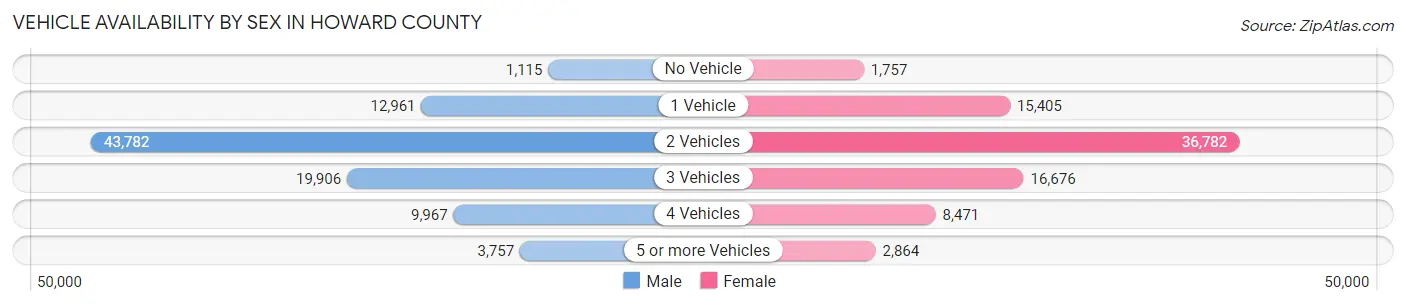
Vehicle Availability by Sex in Howard County
The most prevalent vehicle ownership categories in Howard County are males with 2 vehicles (43,782, accounting for 47.9%) and females with 2 vehicles (36,782, making up 53.4%).
| Vehicles Available | Male | Female |
| No Vehicle | 1,115 (1.2%) | 1,757 (2.1%) |
| 1 Vehicle | 12,961 (14.2%) | 15,405 (18.8%) |
| 2 Vehicles | 43,782 (47.9%) | 36,782 (44.9%) |
| 3 Vehicles | 19,906 (21.8%) | 16,676 (20.3%) |
| 4 Vehicles | 9,967 (10.9%) | 8,471 (10.3%) |
| 5 or more Vehicles | 3,757 (4.1%) | 2,864 (3.5%) |
| Total | 91,488 (100.0%) | 81,955 (100.0%) |
Commute Time in Howard County
The most frequently occuring commute durations in Howard County are 30 to 34 minutes (21,149 commuters, 15.1%), 15 to 19 minutes (20,171 commuters, 14.4%), and 20 to 24 minutes (19,688 commuters, 14.1%).
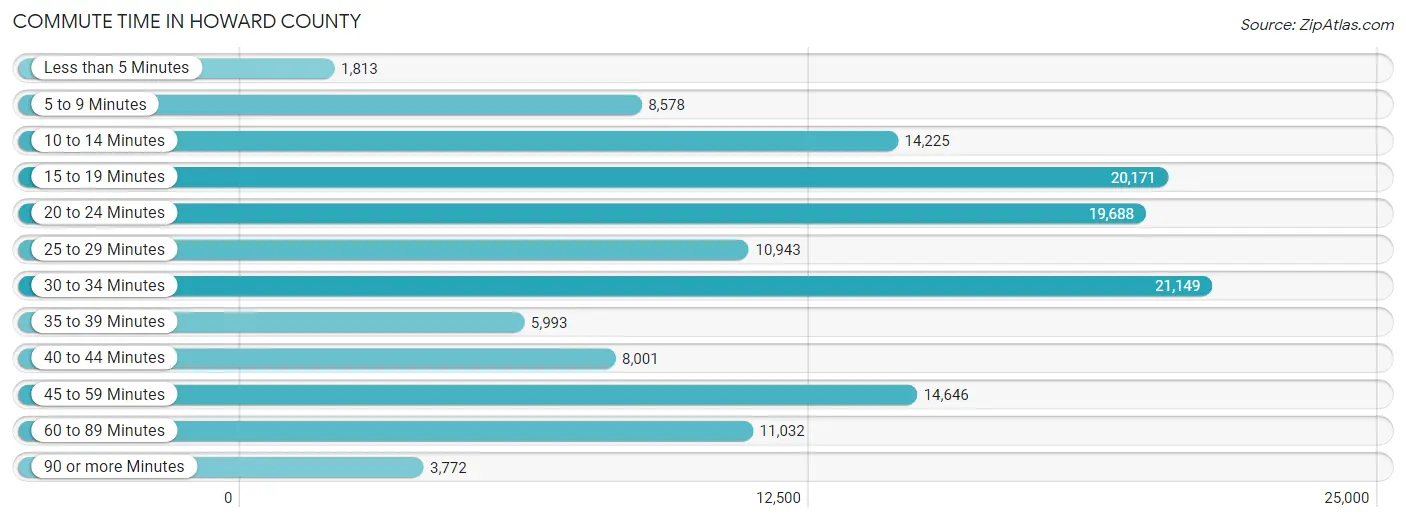
| Commute Time | # Commuters | % Commuters |
| Less than 5 Minutes | 1,813 | 1.3% |
| 5 to 9 Minutes | 8,578 | 6.1% |
| 10 to 14 Minutes | 14,225 | 10.2% |
| 15 to 19 Minutes | 20,171 | 14.4% |
| 20 to 24 Minutes | 19,688 | 14.1% |
| 25 to 29 Minutes | 10,943 | 7.8% |
| 30 to 34 Minutes | 21,149 | 15.1% |
| 35 to 39 Minutes | 5,993 | 4.3% |
| 40 to 44 Minutes | 8,001 | 5.7% |
| 45 to 59 Minutes | 14,646 | 10.5% |
| 60 to 89 Minutes | 11,032 | 7.9% |
| 90 or more Minutes | 3,772 | 2.7% |
Commute Time by Sex in Howard County
The most common commute times in Howard County are 20 to 24 minutes (11,143 commuters, 14.8%) for males and 30 to 34 minutes (10,181 commuters, 15.8%) for females.
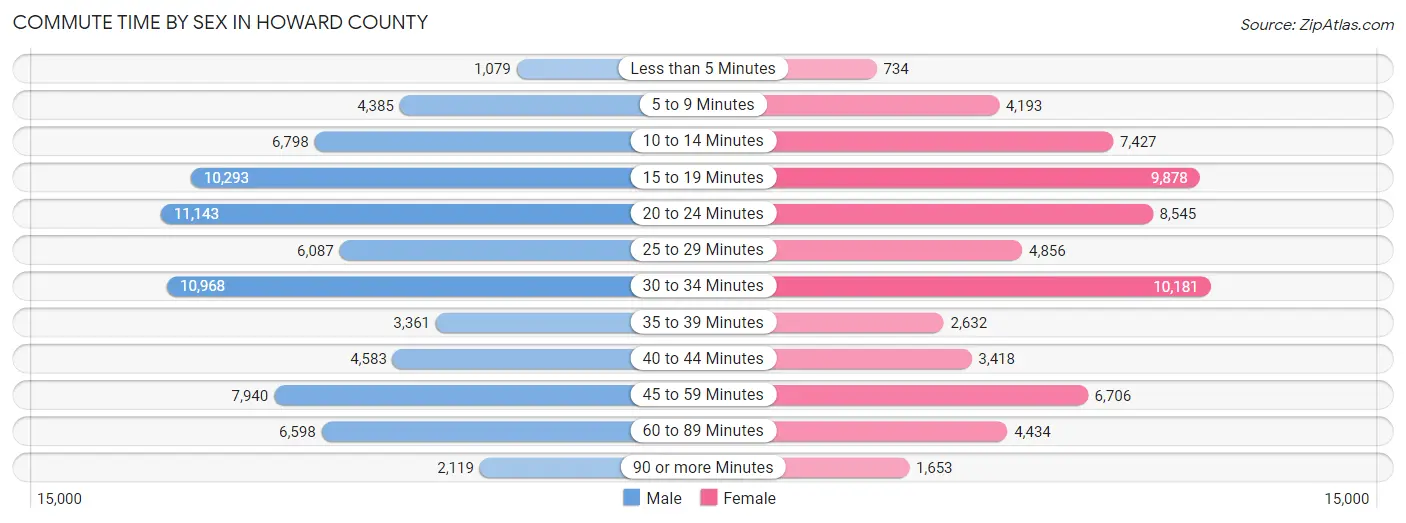
| Commute Time | Male | Female |
| Less than 5 Minutes | 1,079 (1.4%) | 734 (1.1%) |
| 5 to 9 Minutes | 4,385 (5.8%) | 4,193 (6.5%) |
| 10 to 14 Minutes | 6,798 (9.0%) | 7,427 (11.5%) |
| 15 to 19 Minutes | 10,293 (13.7%) | 9,878 (15.3%) |
| 20 to 24 Minutes | 11,143 (14.8%) | 8,545 (13.2%) |
| 25 to 29 Minutes | 6,087 (8.1%) | 4,856 (7.5%) |
| 30 to 34 Minutes | 10,968 (14.6%) | 10,181 (15.8%) |
| 35 to 39 Minutes | 3,361 (4.5%) | 2,632 (4.1%) |
| 40 to 44 Minutes | 4,583 (6.1%) | 3,418 (5.3%) |
| 45 to 59 Minutes | 7,940 (10.5%) | 6,706 (10.4%) |
| 60 to 89 Minutes | 6,598 (8.8%) | 4,434 (6.9%) |
| 90 or more Minutes | 2,119 (2.8%) | 1,653 (2.6%) |
Time of Departure to Work by Sex in Howard County
The most frequent times of departure to work in Howard County are 7:00 AM to 7:29 AM (10,693, 14.2%) for males and 7:00 AM to 7:29 AM (10,589, 16.4%) for females.
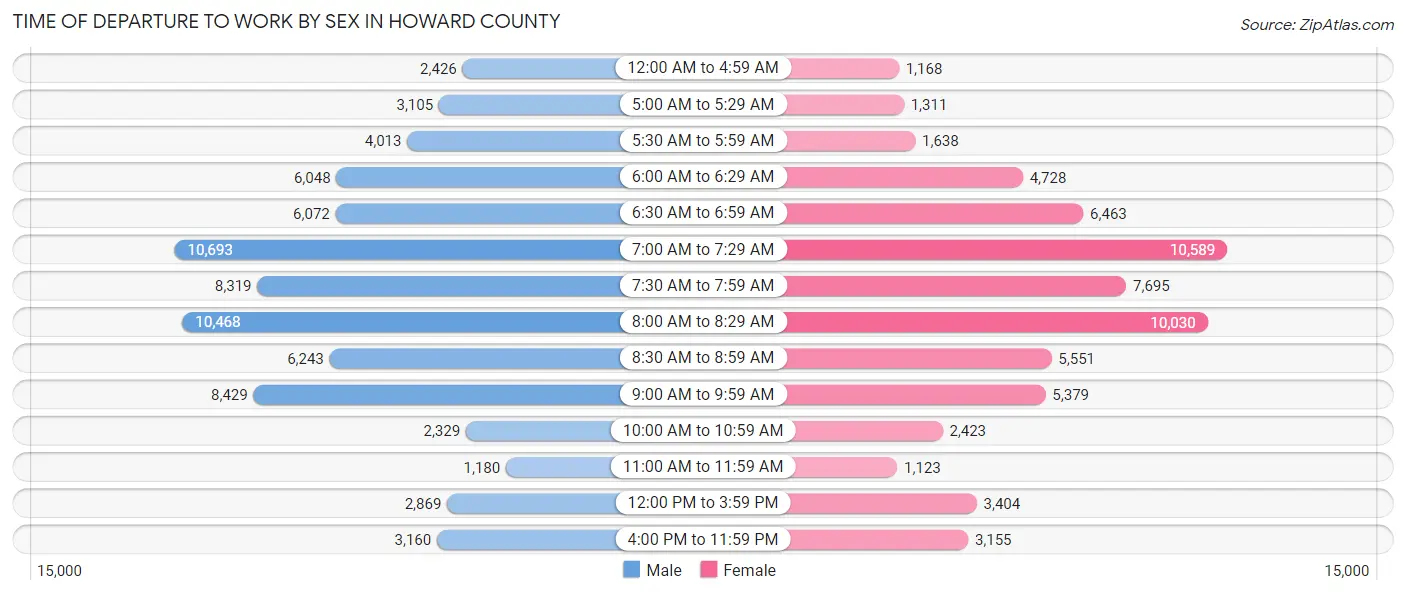
| Time of Departure | Male | Female |
| 12:00 AM to 4:59 AM | 2,426 (3.2%) | 1,168 (1.8%) |
| 5:00 AM to 5:29 AM | 3,105 (4.1%) | 1,311 (2.0%) |
| 5:30 AM to 5:59 AM | 4,013 (5.3%) | 1,638 (2.5%) |
| 6:00 AM to 6:29 AM | 6,048 (8.0%) | 4,728 (7.3%) |
| 6:30 AM to 6:59 AM | 6,072 (8.1%) | 6,463 (10.0%) |
| 7:00 AM to 7:29 AM | 10,693 (14.2%) | 10,589 (16.4%) |
| 7:30 AM to 7:59 AM | 8,319 (11.0%) | 7,695 (11.9%) |
| 8:00 AM to 8:29 AM | 10,468 (13.9%) | 10,030 (15.5%) |
| 8:30 AM to 8:59 AM | 6,243 (8.3%) | 5,551 (8.6%) |
| 9:00 AM to 9:59 AM | 8,429 (11.2%) | 5,379 (8.3%) |
| 10:00 AM to 10:59 AM | 2,329 (3.1%) | 2,423 (3.7%) |
| 11:00 AM to 11:59 AM | 1,180 (1.6%) | 1,123 (1.7%) |
| 12:00 PM to 3:59 PM | 2,869 (3.8%) | 3,404 (5.3%) |
| 4:00 PM to 11:59 PM | 3,160 (4.2%) | 3,155 (4.9%) |
| Total | 75,354 (100.0%) | 64,657 (100.0%) |
Housing Occupancy in Howard County
Occupancy by Ownership in Howard County
Of the total 119,230 dwellings in Howard County, owner-occupied units account for 85,941 (72.1%), while renter-occupied units make up 33,289 (27.9%).
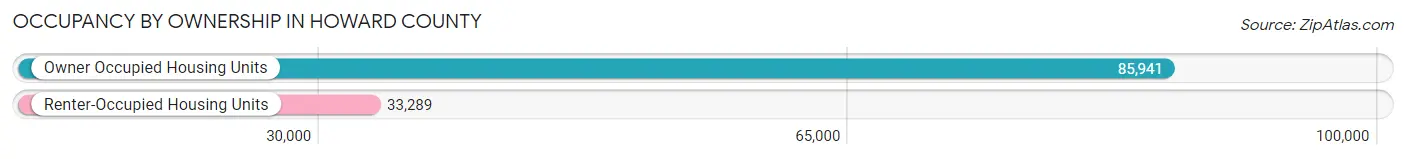
| Occupancy | # Housing Units | % Housing Units |
| Owner Occupied Housing Units | 85,941 | 72.1% |
| Renter-Occupied Housing Units | 33,289 | 27.9% |
| Total Occupied Housing Units | 119,230 | 100.0% |
Occupancy by Household Size in Howard County
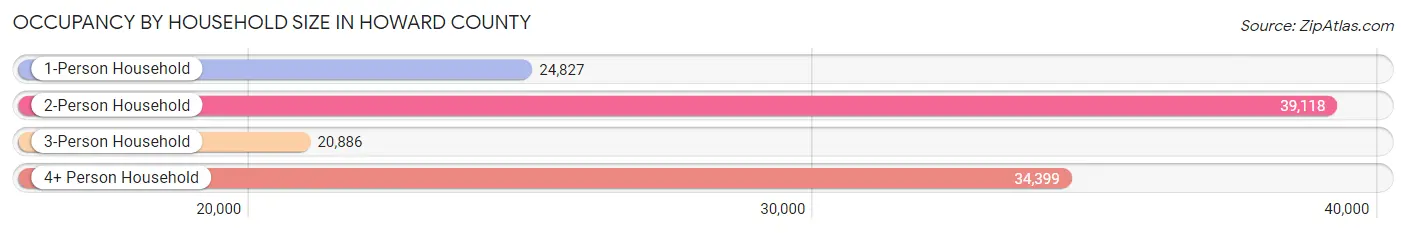
| Household Size | # Housing Units | % Housing Units |
| 1-Person Household | 24,827 | 20.8% |
| 2-Person Household | 39,118 | 32.8% |
| 3-Person Household | 20,886 | 17.5% |
| 4+ Person Household | 34,399 | 28.8% |
| Total Housing Units | 119,230 | 100.0% |
Occupancy by Ownership by Household Size in Howard County
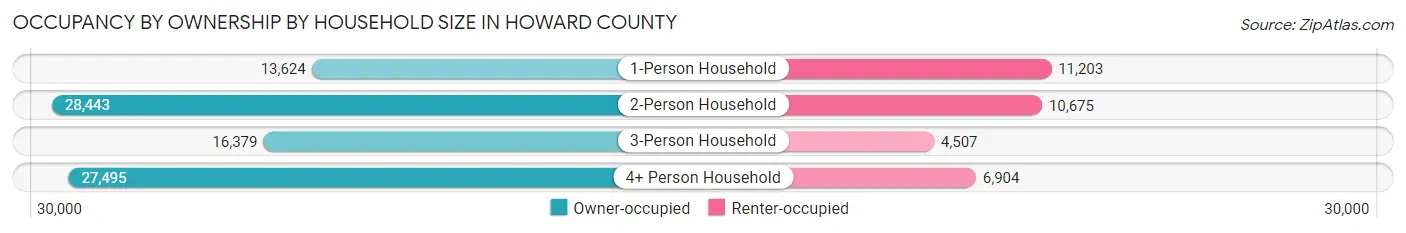
| Household Size | Owner-occupied | Renter-occupied |
| 1-Person Household | 13,624 (54.9%) | 11,203 (45.1%) |
| 2-Person Household | 28,443 (72.7%) | 10,675 (27.3%) |
| 3-Person Household | 16,379 (78.4%) | 4,507 (21.6%) |
| 4+ Person Household | 27,495 (79.9%) | 6,904 (20.1%) |
| Total Housing Units | 85,941 (72.1%) | 33,289 (27.9%) |
Occupancy by Educational Attainment in Howard County
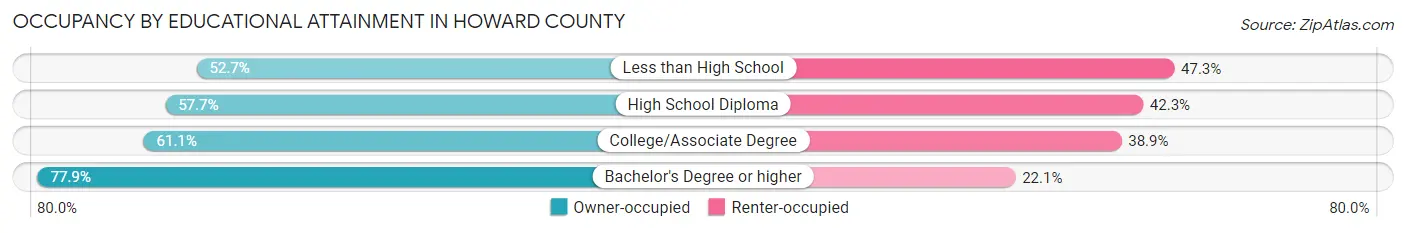
| Household Size | Owner-occupied | Renter-occupied |
| Less than High School | 1,905 (52.7%) | 1,707 (47.3%) |
| High School Diploma | 6,851 (57.7%) | 5,024 (42.3%) |
| College/Associate Degree | 13,344 (61.1%) | 8,489 (38.9%) |
| Bachelor's Degree or higher | 63,841 (77.9%) | 18,069 (22.1%) |
Occupancy by Age of Householder in Howard County
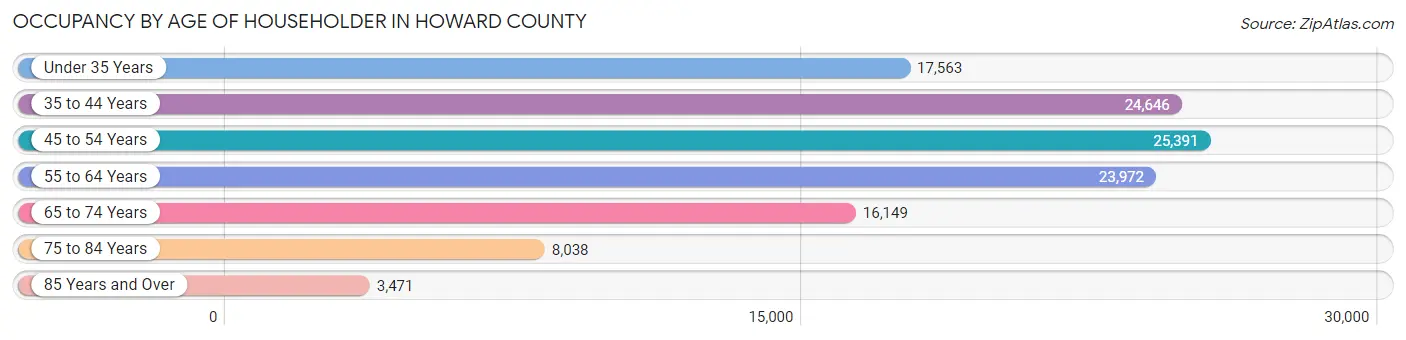
| Age Bracket | # Households | % Households |
| Under 35 Years | 17,563 | 14.7% |
| 35 to 44 Years | 24,646 | 20.7% |
| 45 to 54 Years | 25,391 | 21.3% |
| 55 to 64 Years | 23,972 | 20.1% |
| 65 to 74 Years | 16,149 | 13.5% |
| 75 to 84 Years | 8,038 | 6.7% |
| 85 Years and Over | 3,471 | 2.9% |
| Total | 119,230 | 100.0% |
Housing Finances in Howard County
Median Income by Occupancy in Howard County
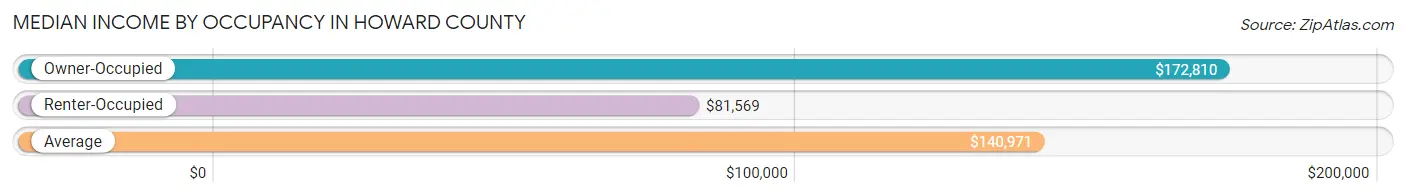
| Occupancy Type | # Households | Median Income |
| Owner-Occupied | 85,941 (72.1%) | $172,810 |
| Renter-Occupied | 33,289 (27.9%) | $81,569 |
| Average | 119,230 (100.0%) | $140,971 |
Occupancy by Householder Income Bracket in Howard County
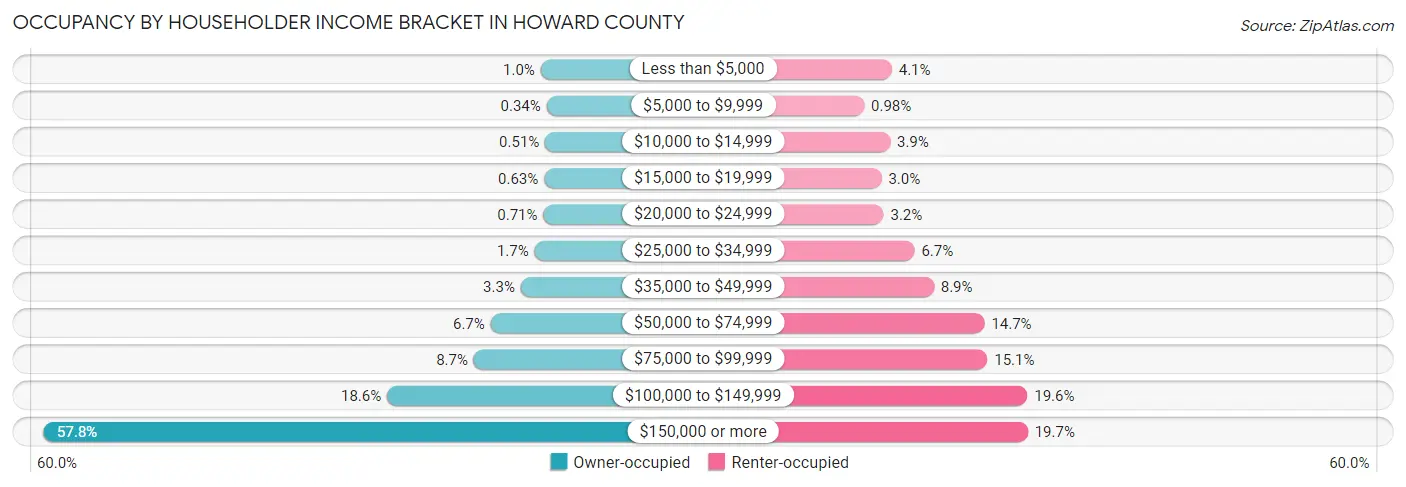
| Income Bracket | Owner-occupied | Renter-occupied |
| Less than $5,000 | 877 (1.0%) | 1,379 (4.1%) |
| $5,000 to $9,999 | 295 (0.3%) | 326 (1.0%) |
| $10,000 to $14,999 | 436 (0.5%) | 1,313 (3.9%) |
| $15,000 to $19,999 | 540 (0.6%) | 985 (3.0%) |
| $20,000 to $24,999 | 613 (0.7%) | 1,066 (3.2%) |
| $25,000 to $34,999 | 1,479 (1.7%) | 2,242 (6.7%) |
| $35,000 to $49,999 | 2,833 (3.3%) | 2,976 (8.9%) |
| $50,000 to $74,999 | 5,792 (6.7%) | 4,903 (14.7%) |
| $75,000 to $99,999 | 7,444 (8.7%) | 5,014 (15.1%) |
| $100,000 to $149,999 | 15,968 (18.6%) | 6,533 (19.6%) |
| $150,000 or more | 49,664 (57.8%) | 6,552 (19.7%) |
| Total | 85,941 (100.0%) | 33,289 (100.0%) |
Monthly Housing Cost Tiers in Howard County
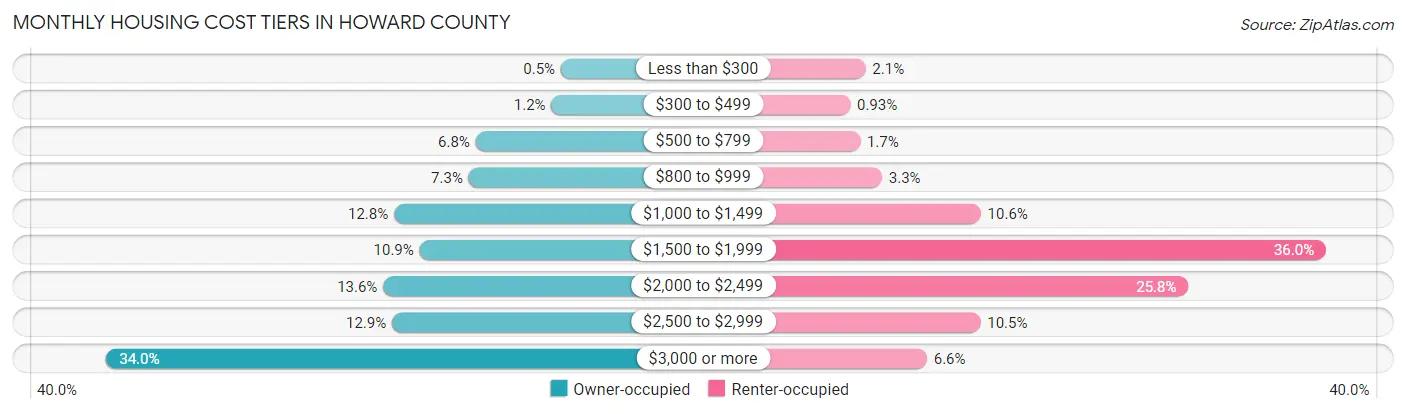
| Monthly Cost | Owner-occupied | Renter-occupied |
| Less than $300 | 433 (0.5%) | 686 (2.1%) |
| $300 to $499 | 1,034 (1.2%) | 310 (0.9%) |
| $500 to $799 | 5,827 (6.8%) | 551 (1.7%) |
| $800 to $999 | 6,267 (7.3%) | 1,088 (3.3%) |
| $1,000 to $1,499 | 10,994 (12.8%) | 3,512 (10.5%) |
| $1,500 to $1,999 | 9,379 (10.9%) | 11,978 (36.0%) |
| $2,000 to $2,499 | 11,683 (13.6%) | 8,601 (25.8%) |
| $2,500 to $2,999 | 11,118 (12.9%) | 3,502 (10.5%) |
| $3,000 or more | 29,206 (34.0%) | 2,190 (6.6%) |
| Total | 85,941 (100.0%) | 33,289 (100.0%) |
Physical Housing Characteristics in Howard County
Housing Structures in Howard County
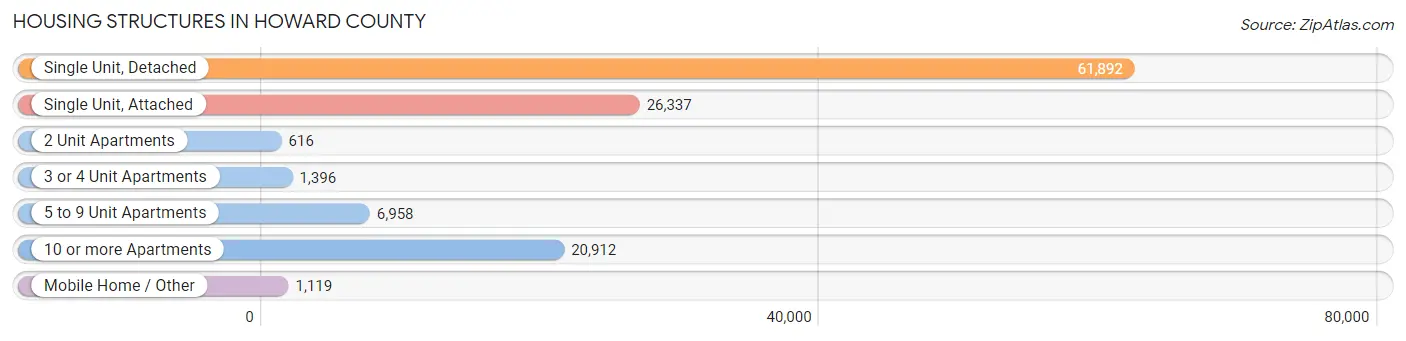
| Structure Type | # Housing Units | % Housing Units |
| Single Unit, Detached | 61,892 | 51.9% |
| Single Unit, Attached | 26,337 | 22.1% |
| 2 Unit Apartments | 616 | 0.5% |
| 3 or 4 Unit Apartments | 1,396 | 1.2% |
| 5 to 9 Unit Apartments | 6,958 | 5.8% |
| 10 or more Apartments | 20,912 | 17.5% |
| Mobile Home / Other | 1,119 | 0.9% |
| Total | 119,230 | 100.0% |
Housing Structures by Occupancy in Howard County
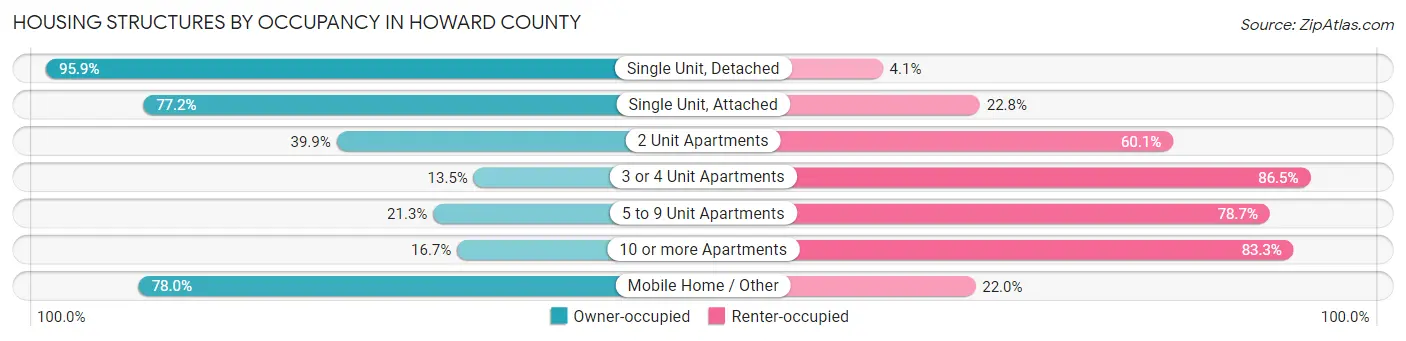
| Structure Type | Owner-occupied | Renter-occupied |
| Single Unit, Detached | 59,328 (95.9%) | 2,564 (4.1%) |
| Single Unit, Attached | 20,321 (77.2%) | 6,016 (22.8%) |
| 2 Unit Apartments | 246 (39.9%) | 370 (60.1%) |
| 3 or 4 Unit Apartments | 189 (13.5%) | 1,207 (86.5%) |
| 5 to 9 Unit Apartments | 1,485 (21.3%) | 5,473 (78.7%) |
| 10 or more Apartments | 3,499 (16.7%) | 17,413 (83.3%) |
| Mobile Home / Other | 873 (78.0%) | 246 (22.0%) |
| Total | 85,941 (72.1%) | 33,289 (27.9%) |
Housing Structures by Number of Rooms in Howard County
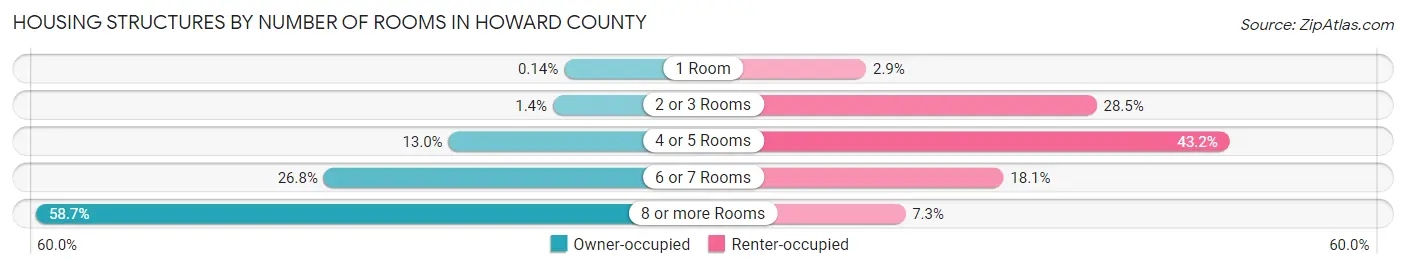
| Number of Rooms | Owner-occupied | Renter-occupied |
| 1 Room | 119 (0.1%) | 964 (2.9%) |
| 2 or 3 Rooms | 1,181 (1.4%) | 9,481 (28.5%) |
| 4 or 5 Rooms | 11,142 (13.0%) | 14,394 (43.2%) |
| 6 or 7 Rooms | 23,030 (26.8%) | 6,037 (18.1%) |
| 8 or more Rooms | 50,469 (58.7%) | 2,413 (7.2%) |
| Total | 85,941 (100.0%) | 33,289 (100.0%) |
Housing Structure by Heating Type in Howard County
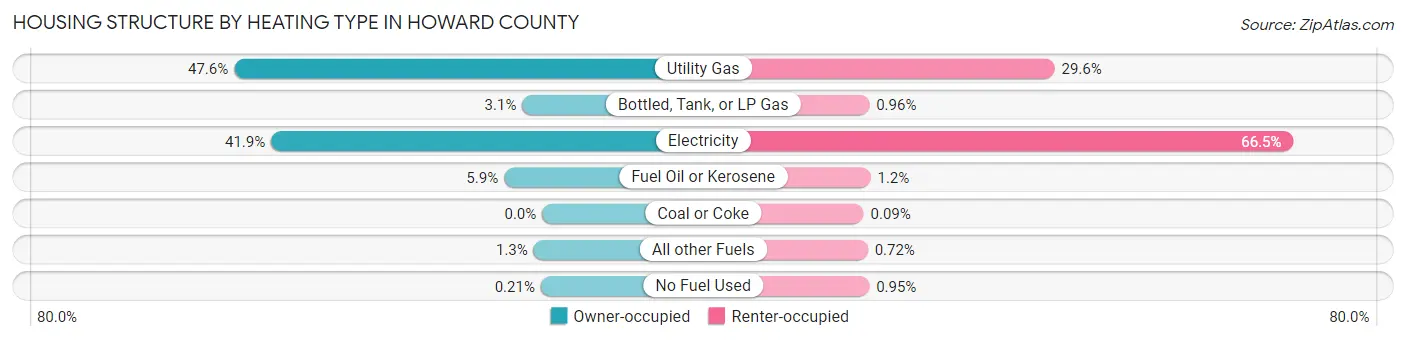
| Heating Type | Owner-occupied | Renter-occupied |
| Utility Gas | 40,928 (47.6%) | 9,857 (29.6%) |
| Bottled, Tank, or LP Gas | 2,635 (3.1%) | 318 (1.0%) |
| Electricity | 36,008 (41.9%) | 22,143 (66.5%) |
| Fuel Oil or Kerosene | 5,065 (5.9%) | 385 (1.2%) |
| Coal or Coke | 0 (0.0%) | 29 (0.1%) |
| All other Fuels | 1,124 (1.3%) | 241 (0.7%) |
| No Fuel Used | 181 (0.2%) | 316 (0.9%) |
| Total | 85,941 (100.0%) | 33,289 (100.0%) |
Household Vehicle Usage in Howard County
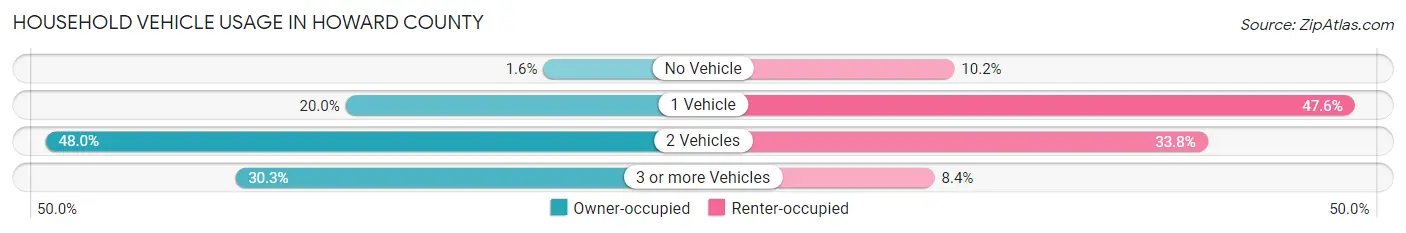
| Vehicles per Household | Owner-occupied | Renter-occupied |
| No Vehicle | 1,359 (1.6%) | 3,401 (10.2%) |
| 1 Vehicle | 17,225 (20.0%) | 15,836 (47.6%) |
| 2 Vehicles | 41,280 (48.0%) | 11,266 (33.8%) |
| 3 or more Vehicles | 26,077 (30.3%) | 2,786 (8.4%) |
| Total | 85,941 (100.0%) | 33,289 (100.0%) |
Real Estate & Mortgages in Howard County
Real Estate and Mortgage Overview in Howard County
| Characteristic | Without Mortgage | With Mortgage |
| Housing Units | 22,637 | 63,304 |
| Median Property Value | $539,500 | $555,600 |
| Median Household Income | $133,824 | $39,803 |
| Monthly Housing Costs | $959 | $29,066 |
| Real Estate Taxes | $6,586 | $810 |
Property Value by Mortgage Status in Howard County
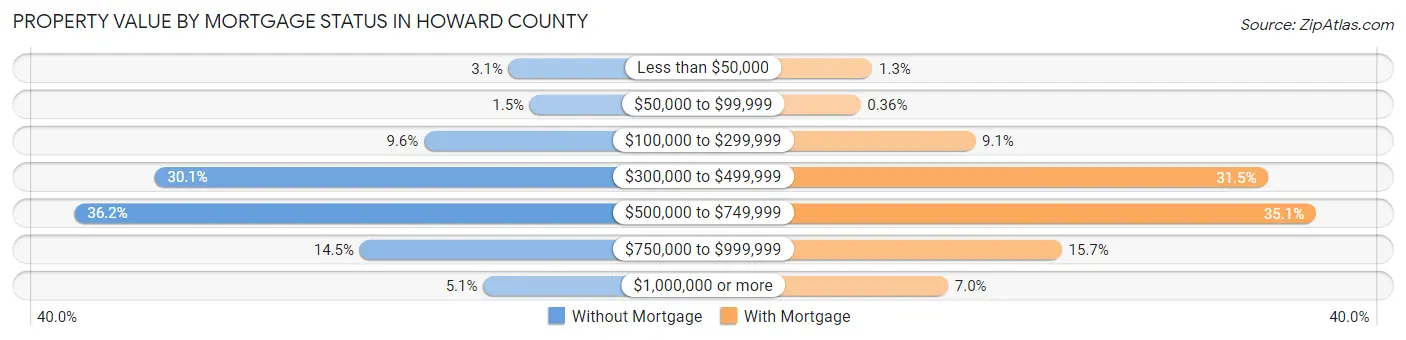
| Property Value | Without Mortgage | With Mortgage |
| Less than $50,000 | 704 (3.1%) | 800 (1.3%) |
| $50,000 to $99,999 | 340 (1.5%) | 231 (0.4%) |
| $100,000 to $299,999 | 2,164 (9.6%) | 5,764 (9.1%) |
| $300,000 to $499,999 | 6,816 (30.1%) | 19,915 (31.5%) |
| $500,000 to $749,999 | 8,197 (36.2%) | 22,204 (35.1%) |
| $750,000 to $999,999 | 3,273 (14.5%) | 9,940 (15.7%) |
| $1,000,000 or more | 1,143 (5.1%) | 4,450 (7.0%) |
| Total | 22,637 (100.0%) | 63,304 (100.0%) |
Household Income by Mortgage Status in Howard County
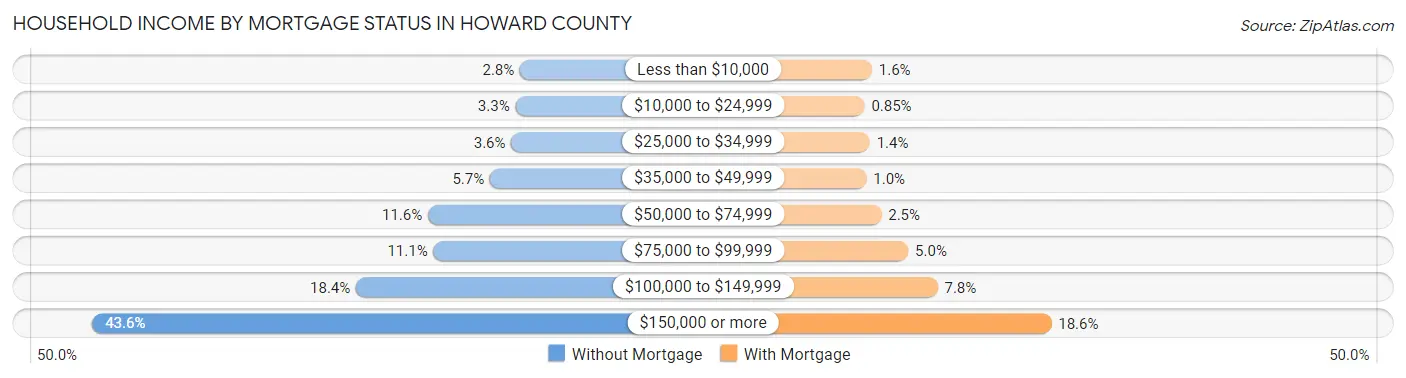
| Household Income | Without Mortgage | With Mortgage |
| Less than $10,000 | 637 (2.8%) | 979 (1.5%) |
| $10,000 to $24,999 | 736 (3.3%) | 535 (0.9%) |
| $25,000 to $34,999 | 824 (3.6%) | 853 (1.3%) |
| $35,000 to $49,999 | 1,284 (5.7%) | 655 (1.0%) |
| $50,000 to $74,999 | 2,621 (11.6%) | 1,549 (2.5%) |
| $75,000 to $99,999 | 2,503 (11.1%) | 3,171 (5.0%) |
| $100,000 to $149,999 | 4,171 (18.4%) | 4,941 (7.8%) |
| $150,000 or more | 9,861 (43.6%) | 11,797 (18.6%) |
| Total | 22,637 (100.0%) | 63,304 (100.0%) |
Property Value to Household Income Ratio in Howard County
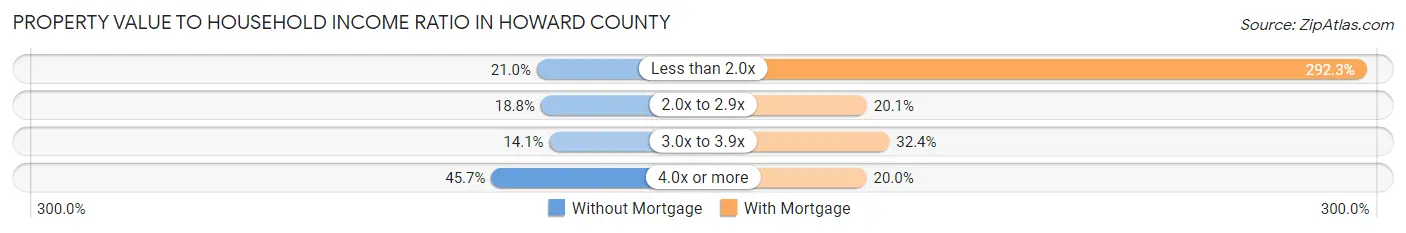
| Value-to-Income Ratio | Without Mortgage | With Mortgage |
| Less than 2.0x | 4,745 (21.0%) | 185,053 (292.3%) |
| 2.0x to 2.9x | 4,252 (18.8%) | 12,734 (20.1%) |
| 3.0x to 3.9x | 3,181 (14.1%) | 20,503 (32.4%) |
| 4.0x or more | 10,351 (45.7%) | 12,635 (20.0%) |
| Total | 22,637 (100.0%) | 63,304 (100.0%) |
Real Estate Taxes by Mortgage Status in Howard County
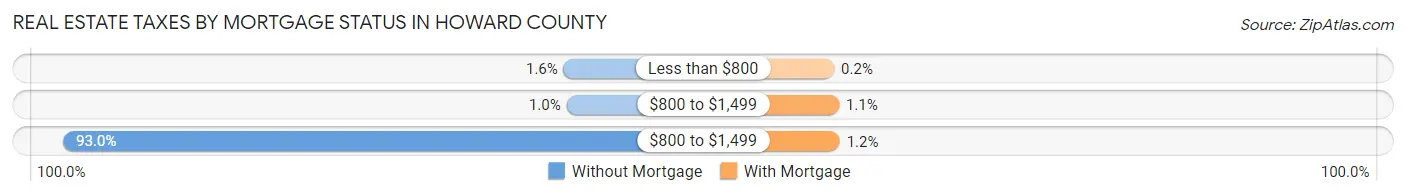
| Property Taxes | Without Mortgage | With Mortgage |
| Less than $800 | 350 (1.5%) | 124 (0.2%) |
| $800 to $1,499 | 229 (1.0%) | 682 (1.1%) |
| $800 to $1,499 | 21,045 (93.0%) | 770 (1.2%) |
| Total | 22,637 (100.0%) | 63,304 (100.0%) |
Health & Disability in Howard County
Health Insurance Coverage by Age in Howard County
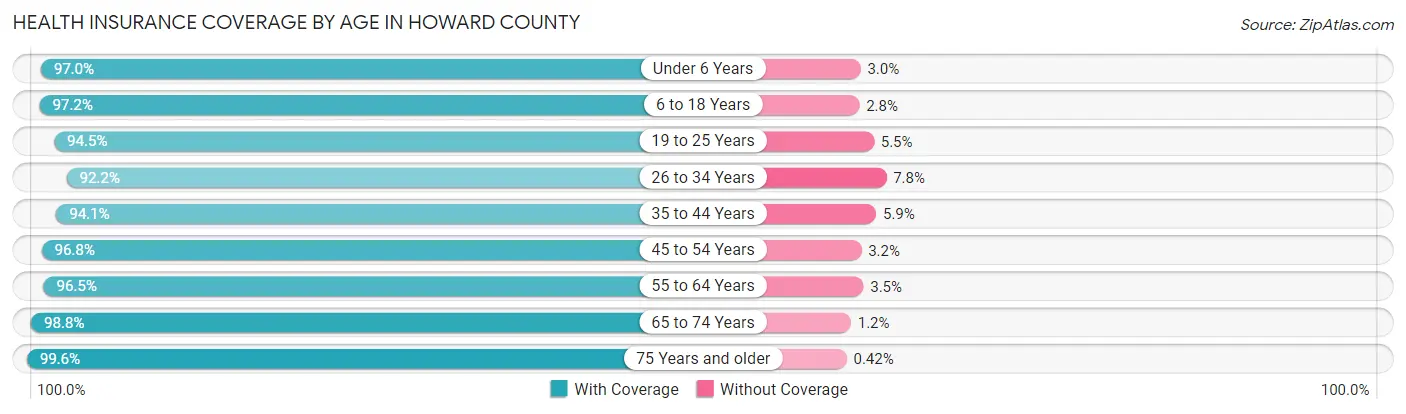
| Age Bracket | With Coverage | Without Coverage |
| Under 6 Years | 21,864 (97.0%) | 681 (3.0%) |
| 6 to 18 Years | 59,935 (97.2%) | 1,711 (2.8%) |
| 19 to 25 Years | 23,572 (94.5%) | 1,371 (5.5%) |
| 26 to 34 Years | 32,375 (92.2%) | 2,747 (7.8%) |
| 35 to 44 Years | 44,410 (94.1%) | 2,795 (5.9%) |
| 45 to 54 Years | 44,630 (96.8%) | 1,457 (3.2%) |
| 55 to 64 Years | 41,537 (96.5%) | 1,523 (3.5%) |
| 65 to 74 Years | 28,085 (98.8%) | 343 (1.2%) |
| 75 Years and older | 18,824 (99.6%) | 80 (0.4%) |
| Total | 315,232 (96.1%) | 12,708 (3.9%) |
Health Insurance Coverage by Citizenship Status in Howard County
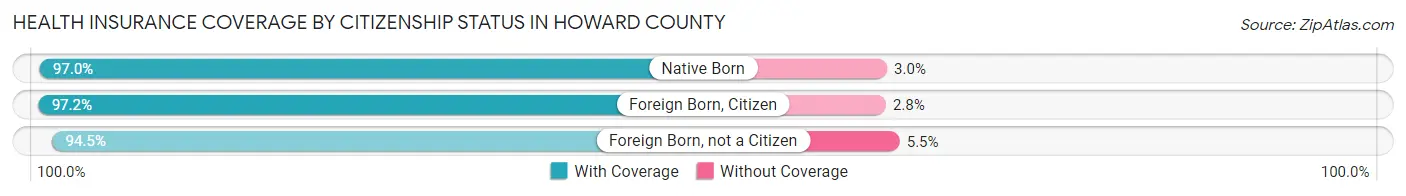
| Citizenship Status | With Coverage | Without Coverage |
| Native Born | 21,864 (97.0%) | 681 (3.0%) |
| Foreign Born, Citizen | 59,935 (97.2%) | 1,711 (2.8%) |
| Foreign Born, not a Citizen | 23,572 (94.5%) | 1,371 (5.5%) |
Health Insurance Coverage by Household Income in Howard County
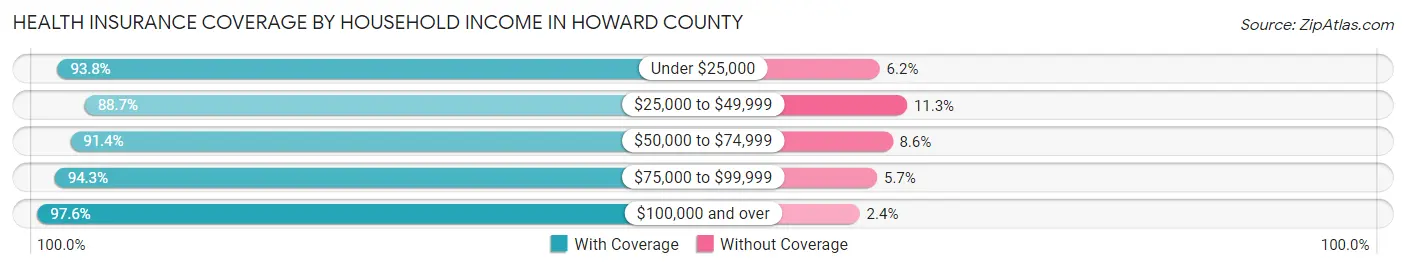
| Household Income | With Coverage | Without Coverage |
| Under $25,000 | 13,457 (93.8%) | 883 (6.2%) |
| $25,000 to $49,999 | 18,533 (88.7%) | 2,353 (11.3%) |
| $50,000 to $74,999 | 20,146 (91.4%) | 1,886 (8.6%) |
| $75,000 to $99,999 | 25,583 (94.3%) | 1,539 (5.7%) |
| $100,000 and over | 236,743 (97.6%) | 5,843 (2.4%) |
Public vs Private Health Insurance Coverage by Age in Howard County
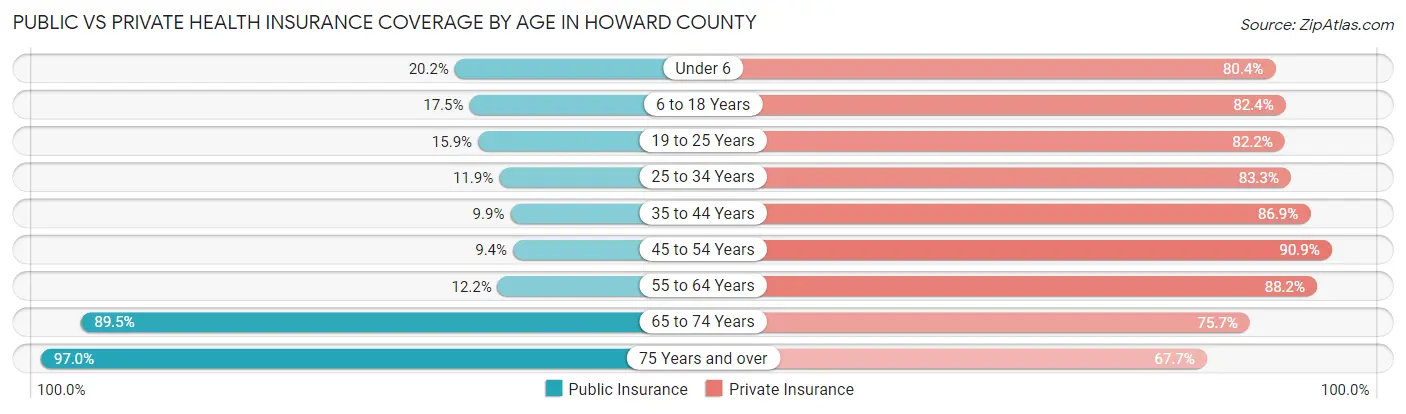
| Age Bracket | Public Insurance | Private Insurance |
| Under 6 | 4,548 (20.2%) | 18,134 (80.4%) |
| 6 to 18 Years | 10,766 (17.5%) | 50,767 (82.4%) |
| 19 to 25 Years | 3,955 (15.9%) | 20,501 (82.2%) |
| 25 to 34 Years | 4,192 (11.9%) | 29,266 (83.3%) |
| 35 to 44 Years | 4,653 (9.9%) | 41,030 (86.9%) |
| 45 to 54 Years | 4,318 (9.4%) | 41,889 (90.9%) |
| 55 to 64 Years | 5,261 (12.2%) | 37,963 (88.2%) |
| 65 to 74 Years | 25,435 (89.5%) | 21,519 (75.7%) |
| 75 Years and over | 18,332 (97.0%) | 12,800 (67.7%) |
| Total | 81,460 (24.8%) | 273,869 (83.5%) |
Disability Status by Sex by Age in Howard County
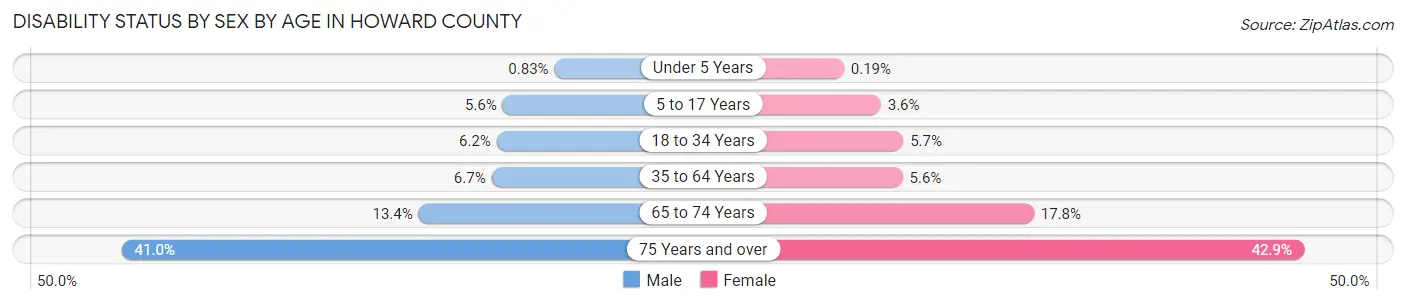
| Age Bracket | Male | Female |
| Under 5 Years | 80 (0.8%) | 17 (0.2%) |
| 5 to 17 Years | 1,760 (5.6%) | 1,076 (3.6%) |
| 18 to 34 Years | 2,015 (6.2%) | 1,834 (5.7%) |
| 35 to 64 Years | 4,432 (6.7%) | 3,945 (5.6%) |
| 65 to 74 Years | 1,796 (13.4%) | 2,685 (17.8%) |
| 75 Years and over | 3,300 (41.0%) | 4,653 (42.9%) |
Disability Class by Sex by Age in Howard County
Disability Class: Hearing Difficulty
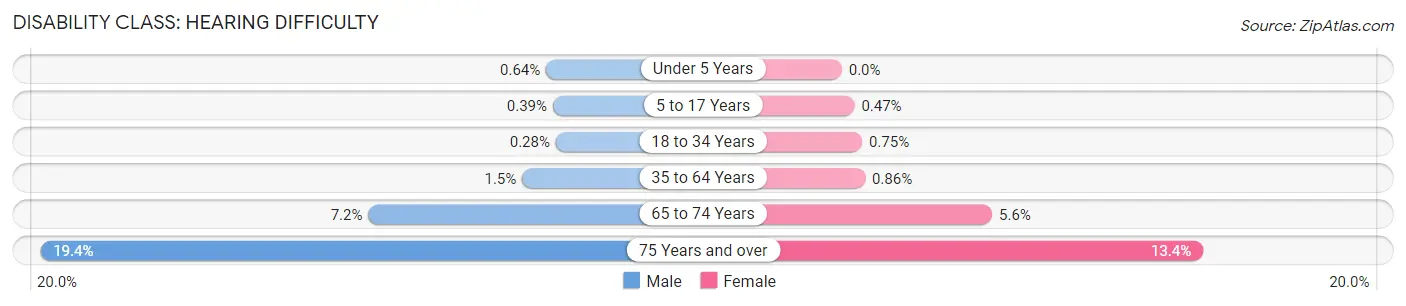
| Age Bracket | Male | Female |
| Under 5 Years | 62 (0.6%) | 0 (0.0%) |
| 5 to 17 Years | 122 (0.4%) | 141 (0.5%) |
| 18 to 34 Years | 90 (0.3%) | 242 (0.7%) |
| 35 to 64 Years | 1,016 (1.5%) | 602 (0.9%) |
| 65 to 74 Years | 968 (7.2%) | 841 (5.6%) |
| 75 Years and over | 1,563 (19.4%) | 1,456 (13.4%) |
Disability Class: Vision Difficulty
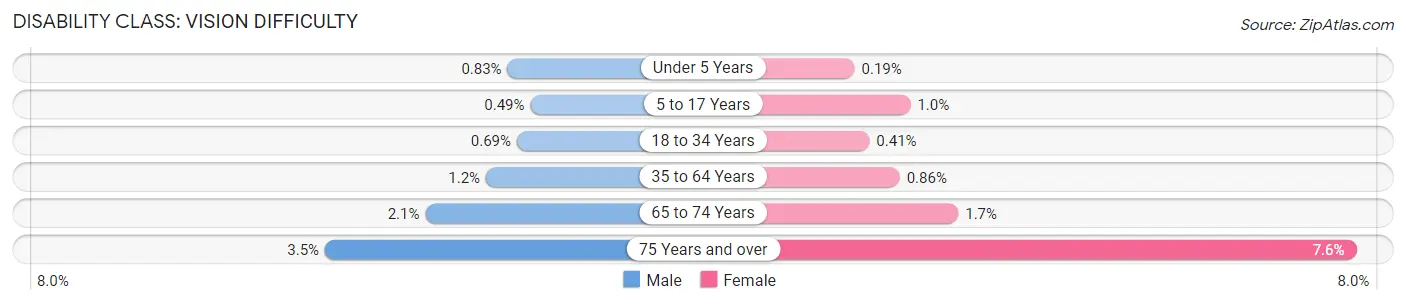
| Age Bracket | Male | Female |
| Under 5 Years | 80 (0.8%) | 17 (0.2%) |
| 5 to 17 Years | 154 (0.5%) | 304 (1.0%) |
| 18 to 34 Years | 226 (0.7%) | 131 (0.4%) |
| 35 to 64 Years | 762 (1.1%) | 598 (0.9%) |
| 65 to 74 Years | 274 (2.1%) | 260 (1.7%) |
| 75 Years and over | 285 (3.5%) | 829 (7.6%) |
Disability Class: Cognitive Difficulty
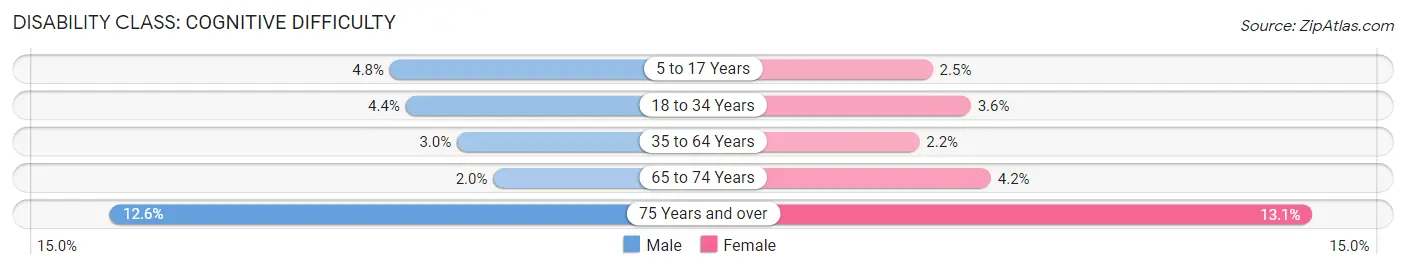
| Age Bracket | Male | Female |
| 5 to 17 Years | 1,509 (4.8%) | 751 (2.5%) |
| 18 to 34 Years | 1,430 (4.4%) | 1,153 (3.6%) |
| 35 to 64 Years | 1,963 (3.0%) | 1,513 (2.2%) |
| 65 to 74 Years | 261 (1.9%) | 625 (4.2%) |
| 75 Years and over | 1,016 (12.6%) | 1,422 (13.1%) |
Disability Class: Ambulatory Difficulty
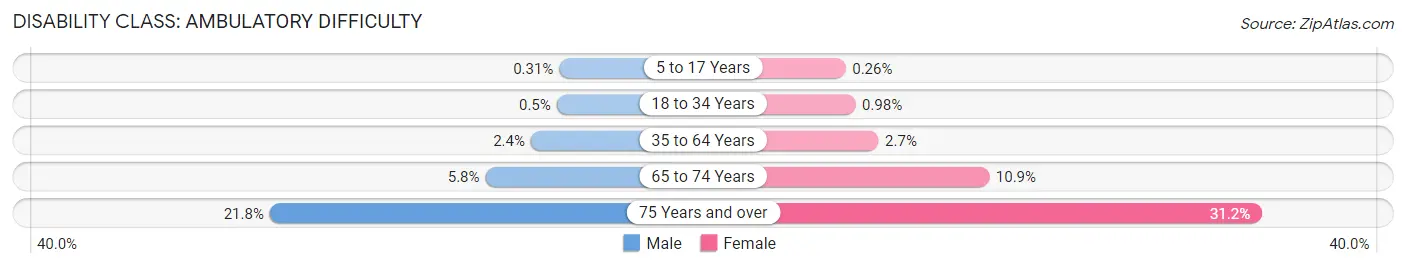
| Age Bracket | Male | Female |
| 5 to 17 Years | 98 (0.3%) | 76 (0.3%) |
| 18 to 34 Years | 162 (0.5%) | 316 (1.0%) |
| 35 to 64 Years | 1,609 (2.4%) | 1,888 (2.7%) |
| 65 to 74 Years | 773 (5.8%) | 1,646 (10.9%) |
| 75 Years and over | 1,755 (21.8%) | 3,386 (31.2%) |
Disability Class: Self-Care Difficulty
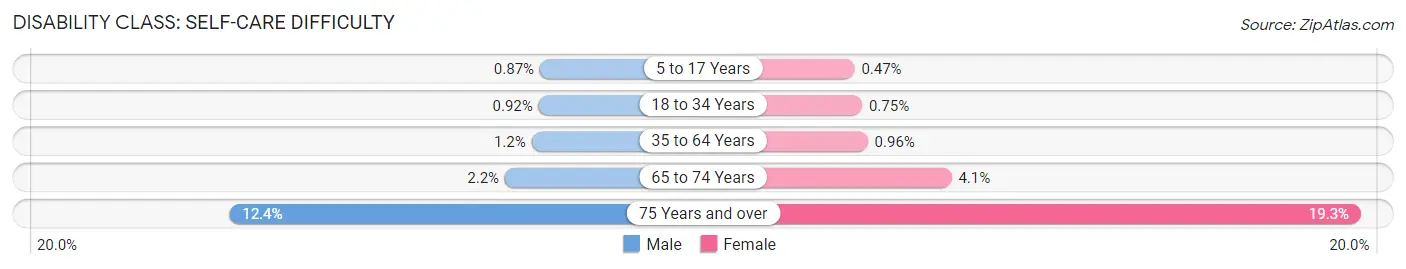
| Age Bracket | Male | Female |
| 5 to 17 Years | 273 (0.9%) | 139 (0.5%) |
| 18 to 34 Years | 299 (0.9%) | 242 (0.7%) |
| 35 to 64 Years | 786 (1.2%) | 670 (1.0%) |
| 65 to 74 Years | 290 (2.2%) | 613 (4.1%) |
| 75 Years and over | 998 (12.4%) | 2,092 (19.3%) |
Technology Access in Howard County
Computing Device Access in Howard County
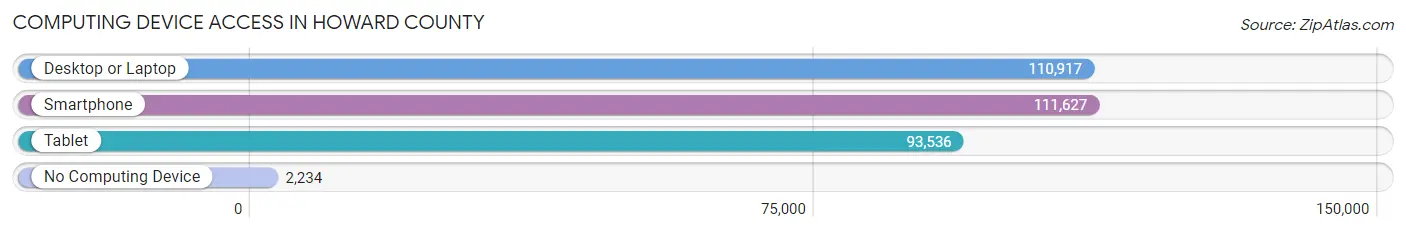
| Device Type | # Households | % Households |
| Desktop or Laptop | 110,917 | 93.0% |
| Smartphone | 111,627 | 93.6% |
| Tablet | 93,536 | 78.4% |
| No Computing Device | 2,234 | 1.9% |
| Total | 119,230 | 100.0% |
Internet Access in Howard County
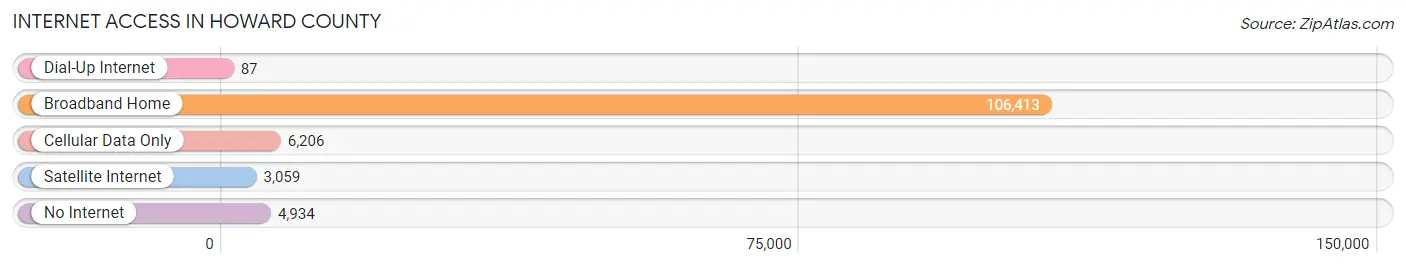
| Internet Type | # Households | % Households |
| Dial-Up Internet | 87 | 0.1% |
| Broadband Home | 106,413 | 89.2% |
| Cellular Data Only | 6,206 | 5.2% |
| Satellite Internet | 3,059 | 2.6% |
| No Internet | 4,934 | 4.1% |
| Total | 119,230 | 100.0% |
Howard County Summary
Howard County, Maryland is located in the central part of the state, just west of Baltimore and north of Washington, D.C. It is part of the Baltimore-Washington metropolitan area and is bordered by Montgomery, Carroll, and Frederick counties. Howard County is known for its high quality of life, excellent schools, and vibrant economy.
History
Howard County was established in 1838 from parts of Anne Arundel and Baltimore counties. It was named after John Eager Howard, a Revolutionary War hero and the fifth governor of Maryland. The county was largely rural until the 1950s, when the population began to grow rapidly due to the expansion of the federal government and the growth of the Baltimore-Washington metropolitan area.
Geography
Howard County is located in the Piedmont region of Maryland, with rolling hills and valleys. The county is bisected by the Patapsco River, which flows south to the Chesapeake Bay. The county is home to several state parks, including Patapsco Valley State Park, which offers hiking, biking, and camping.
The county is divided into nine townships: Ellicott City, Columbia, Elkridge, Savage, North Laurel, Jessup, West Friendship, Clarksville, and Dayton. The county seat is Ellicott City, which is located in the center of the county.
Economy
Howard County has a strong and diverse economy. The county is home to several major employers, including the Johns Hopkins University Applied Physics Laboratory, the National Security Agency, and the Social Security Administration. The county is also home to several large corporations, including Verizon, Northrop Grumman, and Lockheed Martin.
The county is also home to a thriving technology sector, with several major tech companies, such as Tenable, Sourcefire, and Mindgrub, located in the county. The county is also home to several major retail centers, including The Mall in Columbia and The Avenue at White Marsh.
Demographics
As of the 2010 census, Howard County had a population of 287,085. The population is racially and ethnically diverse, with the largest racial group being White (63.2%), followed by African American (17.2%), Asian (13.2%), and Hispanic or Latino (5.2%).
The median household income in Howard County is $107,844, which is significantly higher than the national median of $60,336. The median home value is $420,000, which is also significantly higher than the national median of $184,700.
Howard County is a highly educated county, with over half of the population having a bachelor’s degree or higher. The county is also home to several prestigious universities, including Johns Hopkins University, the University of Maryland, and Towson University.
Conclusion
Howard County, Maryland is a vibrant and diverse county located in the central part of the state. The county is known for its high quality of life, excellent schools, and strong economy. The county is home to several major employers, a thriving technology sector, and several prestigious universities. The population is racially and ethnically diverse, with a median household income and home value significantly higher than the national median.
Common Questions
What is the Total Population of Howard County?
Total Population of Howard County is 332,011.
What is the Total Male Population of Howard County?
Total Male Population of Howard County is 164,011.
What is the Total Female Population of Howard County?
Total Female Population of Howard County is 168,000.
What is the Ratio of Males per 100 Females in Howard County?
There are 97.63 Males per 100 Females in Howard County.
What is the Ratio of Females per 100 Males in Howard County?
There are 102.43 Females per 100 Males in Howard County.
What is the Median Population Age in Howard County?
Median Population Age in Howard County is 39.2 Years.
What is the Average Family Size in Howard County
Average Family Size in Howard County is 3.2 People.
What is the Average Household Size in Howard County
Average Household Size in Howard County is 2.8 People.
What is Per Capita Income in Howard County?
Per Capita income in Howard County is $63,441.
What is the Median Family Income in Howard County?
Median Family Income in Howard County is $169,085.
What is the Median Household income in Howard County?
Median Household Income in Howard County is $140,971.
What is Income or Wage Gap in Howard County?
Income or Wage Gap in Howard County is 33.4%.
Women in Howard County earn 66.6 cents for every dollar earned by a man.
What is Family Income Deficit in Howard County?
Family Income Deficit in Howard County is $11,910.
Families that are below poverty line in Howard County earn $11,910 less on average than the poverty threshold level.
What is Inequality or Gini Index in Howard County?
Inequality or Gini Index in Howard County is 0.41.
How Large is the Labor Force in Howard County?
There are 183,590 People in the Labor Forcein in Howard County.
What is the Percentage of People in the Labor Force in Howard County?
70.1% of People are in the Labor Force in Howard County.
What is the Unemployment Rate in Howard County?
Unemployment Rate in Howard County is 3.8%.