Harford County, MD
Harford County Map
Harford County Overview
261,059
TOTAL POPULATION
128,609
MALE POPULATION
132,450
FEMALE POPULATION
97.10
MALES / 100 FEMALES
102.99
FEMALES / 100 MALES
40.4
MEDIAN AGE
3.1
AVG FAMILY SIZE
2.6
AVG HOUSEHOLD SIZE
$48,615
PER CAPITA INCOME
$125,929
AVG FAMILY INCOME
$106,417
AVG HOUSEHOLD INCOME
33.1%
WAGE / INCOME GAP [ % ]
66.9¢/ $1
WAGE / INCOME GAP [ $ ]
$10,989
FAMILY INCOME DEFICIT
0.41
INEQUALITY / GINI INDEX
142,215
LABOR FORCE [ PEOPLE ]
67.7%
PERCENT IN LABOR FORCE
3.7%
UNEMPLOYMENT RATE
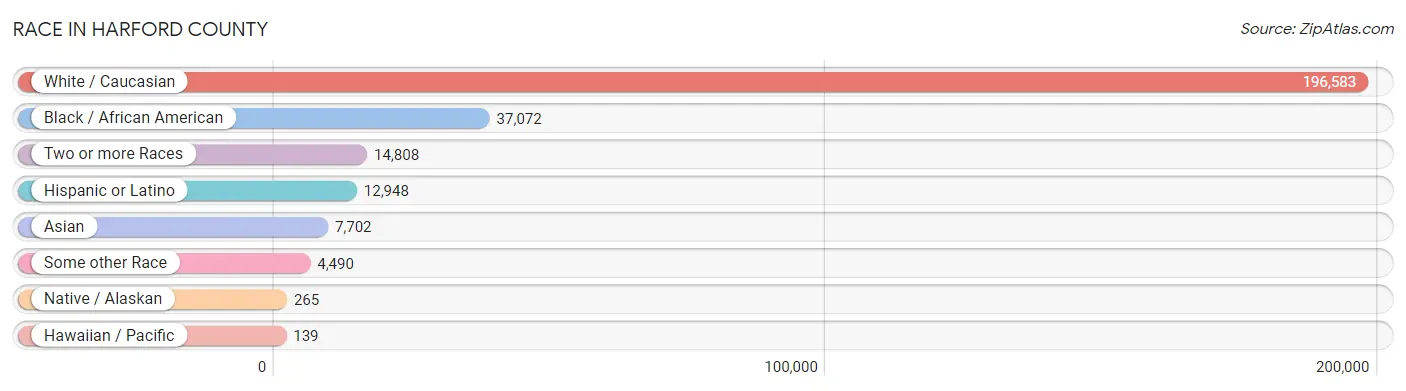
Race in Harford County
The most populous races in Harford County are White / Caucasian (196,583 | 75.3%), Black / African American (37,072 | 14.2%), and Two or more Races (14,808 | 5.7%).
| Race | # Population | % Population |
| Asian | 7,702 | 2.9% |
| Black / African American | 37,072 | 14.2% |
| Hawaiian / Pacific | 139 | 0.1% |
| Hispanic or Latino | 12,948 | 5.0% |
| Native / Alaskan | 265 | 0.1% |
| White / Caucasian | 196,583 | 75.3% |
| Two or more Races | 14,808 | 5.7% |
| Some other Race | 4,490 | 1.7% |
| Total | 261,059 | 100.0% |
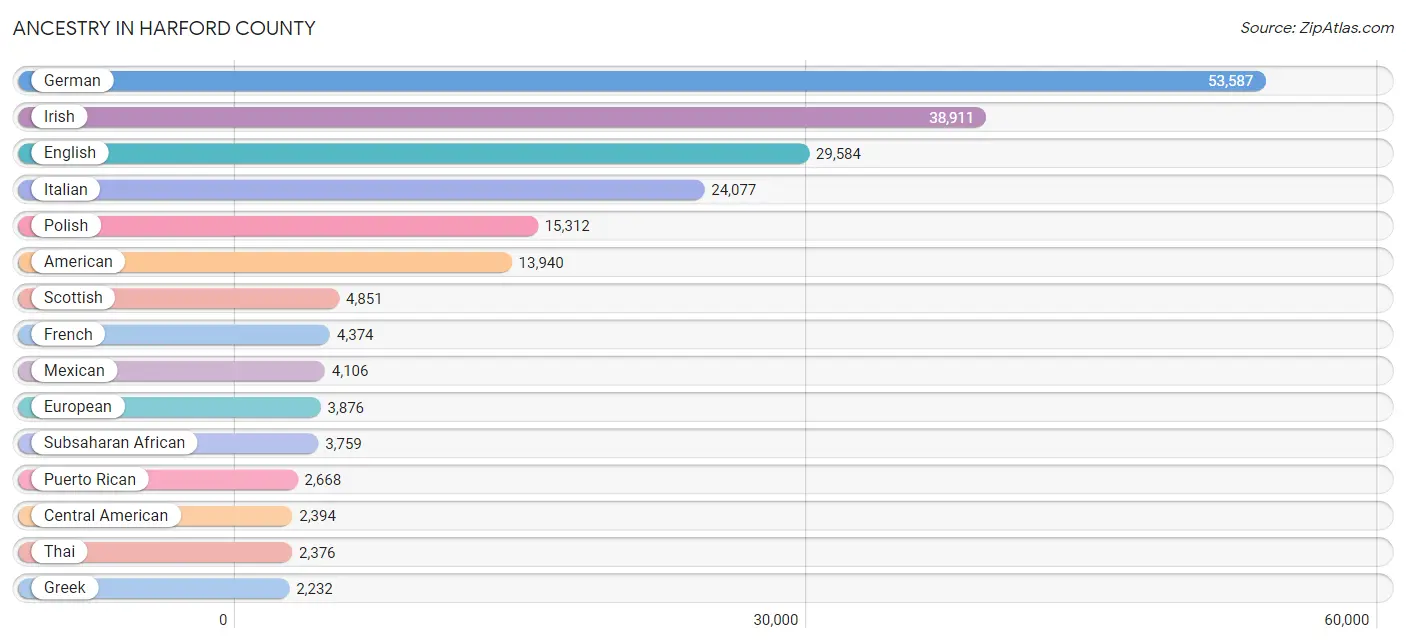
Ancestry in Harford County
The most populous ancestries reported in Harford County are German (53,587 | 20.5%), Irish (38,911 | 14.9%), English (29,584 | 11.3%), Italian (24,077 | 9.2%), and Polish (15,312 | 5.9%), together accounting for 61.9% of all Harford County residents.
| Ancestry | # Population | % Population |
| Afghan | 16 | 0.0% |
| African | 1,996 | 0.8% |
| Albanian | 70 | 0.0% |
| American | 13,940 | 5.3% |
| Apache | 6 | 0.0% |
| Arab | 651 | 0.3% |
| Argentinean | 174 | 0.1% |
| Armenian | 60 | 0.0% |
| Australian | 144 | 0.1% |
| Austrian | 509 | 0.2% |
| Bahamian | 10 | 0.0% |
| Barbadian | 19 | 0.0% |
| Belgian | 120 | 0.1% |
| Bhutanese | 794 | 0.3% |
| Blackfeet | 187 | 0.1% |
| Bolivian | 13 | 0.0% |
| Brazilian | 70 | 0.0% |
| British | 1,894 | 0.7% |
| British West Indian | 124 | 0.1% |
| Bulgarian | 106 | 0.0% |
| Burmese | 1,392 | 0.5% |
| Cajun | 7 | 0.0% |
| Cambodian | 176 | 0.1% |
| Canadian | 389 | 0.2% |
| Cape Verdean | 59 | 0.0% |
| Celtic | 61 | 0.0% |
| Central American | 2,394 | 0.9% |
| Central American Indian | 272 | 0.1% |
| Cherokee | 677 | 0.3% |
| Chilean | 150 | 0.1% |
| Chinese | 28 | 0.0% |
| Chippewa | 12 | 0.0% |
| Choctaw | 84 | 0.0% |
| Colombian | 472 | 0.2% |
| Comanche | 8 | 0.0% |
| Costa Rican | 7 | 0.0% |
| Cree | 34 | 0.0% |
| Creek | 30 | 0.0% |
| Croatian | 334 | 0.1% |
| Cuban | 539 | 0.2% |
| Czech | 1,512 | 0.6% |
| Czechoslovakian | 360 | 0.1% |
| Danish | 369 | 0.1% |
| Dominican | 782 | 0.3% |
| Dutch | 2,011 | 0.8% |
| Eastern European | 894 | 0.3% |
| Ecuadorian | 441 | 0.2% |
| Egyptian | 170 | 0.1% |
| English | 29,584 | 11.3% |
| Estonian | 25 | 0.0% |
| Ethiopian | 61 | 0.0% |
| European | 3,876 | 1.5% |
| Filipino | 25 | 0.0% |
| Finnish | 454 | 0.2% |
| French | 4,374 | 1.7% |
| French Canadian | 1,042 | 0.4% |
| German | 53,587 | 20.5% |
| German Russian | 218 | 0.1% |
| Ghanaian | 247 | 0.1% |
| Greek | 2,232 | 0.9% |
| Guamanian / Chamorro | 41 | 0.0% |
| Guatemalan | 609 | 0.2% |
| Guyanese | 22 | 0.0% |
| Haitian | 262 | 0.1% |
| Honduran | 186 | 0.1% |
| Hungarian | 861 | 0.3% |
| Icelander | 29 | 0.0% |
| Indian (Asian) | 2,076 | 0.8% |
| Indonesian | 26 | 0.0% |
| Iranian | 186 | 0.1% |
| Irish | 38,911 | 14.9% |
| Iroquois | 56 | 0.0% |
| Israeli | 8 | 0.0% |
| Italian | 24,077 | 9.2% |
| Jamaican | 898 | 0.3% |
| Japanese | 120 | 0.1% |
| Jordanian | 35 | 0.0% |
| Kenyan | 342 | 0.1% |
| Kiowa | 11 | 0.0% |
| Korean | 2,163 | 0.8% |
| Laotian | 881 | 0.3% |
| Latvian | 52 | 0.0% |
| Lebanese | 193 | 0.1% |
| Liberian | 57 | 0.0% |
| Lithuanian | 814 | 0.3% |
| Lumbee | 81 | 0.0% |
| Malaysian | 112 | 0.0% |
| Maltese | 8 | 0.0% |
| Mexican | 4,106 | 1.6% |
| Mexican American Indian | 16 | 0.0% |
| Moroccan | 23 | 0.0% |
| Native Hawaiian | 268 | 0.1% |
| Navajo | 37 | 0.0% |
| Nicaraguan | 212 | 0.1% |
| Nigerian | 765 | 0.3% |
| Northern European | 296 | 0.1% |
| Norwegian | 1,028 | 0.4% |
| Ottawa | 46 | 0.0% |
| Pakistani | 986 | 0.4% |
| Palestinian | 10 | 0.0% |
| Panamanian | 252 | 0.1% |
| Paraguayan | 8 | 0.0% |
| Pennsylvania German | 151 | 0.1% |
| Peruvian | 177 | 0.1% |
| Pima | 10 | 0.0% |
| Polish | 15,312 | 5.9% |
| Portuguese | 271 | 0.1% |
| Puerto Rican | 2,668 | 1.0% |
| Romanian | 159 | 0.1% |
| Russian | 1,839 | 0.7% |
| Salvadoran | 1,128 | 0.4% |
| Samoan | 157 | 0.1% |
| Scandinavian | 542 | 0.2% |
| Scotch-Irish | 1,723 | 0.7% |
| Scottish | 4,851 | 1.9% |
| Seminole | 17 | 0.0% |
| Serbian | 79 | 0.0% |
| Sioux | 7 | 0.0% |
| Slavic | 136 | 0.1% |
| Slovak | 633 | 0.2% |
| Slovene | 38 | 0.0% |
| South African | 33 | 0.0% |
| South American | 1,440 | 0.5% |
| Spaniard | 360 | 0.1% |
| Spanish | 299 | 0.1% |
| Sri Lankan | 1,271 | 0.5% |
| Subsaharan African | 3,759 | 1.4% |
| Swedish | 1,356 | 0.5% |
| Swiss | 469 | 0.2% |
| Syrian | 76 | 0.0% |
| Thai | 2,376 | 0.9% |
| Trinidadian and Tobagonian | 423 | 0.2% |
| Turkish | 67 | 0.0% |
| Ukrainian | 882 | 0.3% |
| Venezuelan | 5 | 0.0% |
| Welsh | 2,010 | 0.8% |
| West Indian | 266 | 0.1% |
| Yaqui | 9 | 0.0% |
| Yugoslavian | 61 | 0.0% |
| Zimbabwean | 45 | 0.0% | View All 140 Rows |
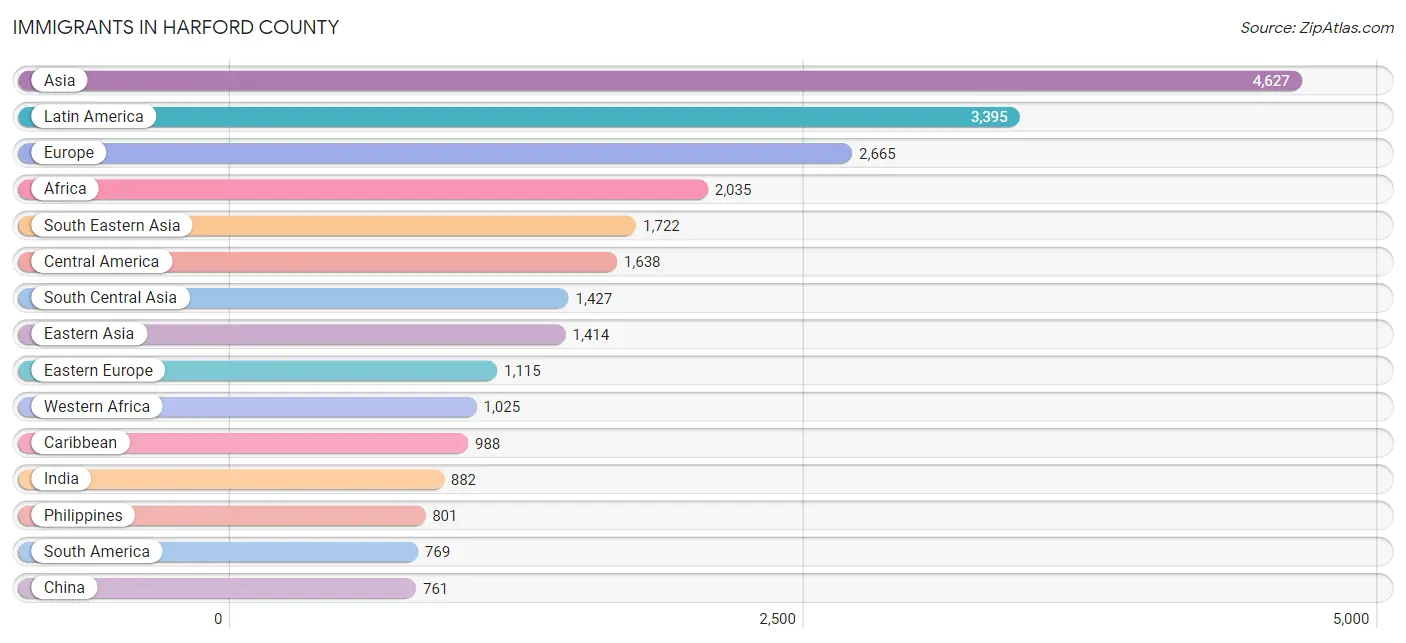
Immigrants in Harford County
The most numerous immigrant groups reported in Harford County came from Asia (4,627 | 1.8%), Latin America (3,395 | 1.3%), Europe (2,665 | 1.0%), Africa (2,035 | 0.8%), and South Eastern Asia (1,722 | 0.7%), together accounting for 5.5% of all Harford County residents.
| Immigration Origin | # Population | % Population |
| Afghanistan | 60 | 0.0% |
| Africa | 2,035 | 0.8% |
| Albania | 43 | 0.0% |
| Argentina | 67 | 0.0% |
| Asia | 4,627 | 1.8% |
| Australia | 49 | 0.0% |
| Austria | 18 | 0.0% |
| Bahamas | 86 | 0.0% |
| Bangladesh | 61 | 0.0% |
| Barbados | 19 | 0.0% |
| Belgium | 21 | 0.0% |
| Belize | 2 | 0.0% |
| Bosnia and Herzegovina | 12 | 0.0% |
| Brazil | 30 | 0.0% |
| Bulgaria | 56 | 0.0% |
| Cameroon | 121 | 0.1% |
| Canada | 213 | 0.1% |
| Caribbean | 988 | 0.4% |
| Central America | 1,638 | 0.6% |
| Chile | 87 | 0.0% |
| China | 761 | 0.3% |
| Colombia | 242 | 0.1% |
| Croatia | 14 | 0.0% |
| Cuba | 78 | 0.0% |
| Czechoslovakia | 94 | 0.0% |
| Denmark | 46 | 0.0% |
| Dominican Republic | 140 | 0.1% |
| Eastern Africa | 569 | 0.2% |
| Eastern Asia | 1,414 | 0.5% |
| Eastern Europe | 1,115 | 0.4% |
| Ecuador | 72 | 0.0% |
| Egypt | 217 | 0.1% |
| El Salvador | 594 | 0.2% |
| England | 149 | 0.1% |
| Ethiopia | 170 | 0.1% |
| Europe | 2,665 | 1.0% |
| France | 27 | 0.0% |
| Germany | 616 | 0.2% |
| Ghana | 576 | 0.2% |
| Greece | 132 | 0.1% |
| Guatemala | 218 | 0.1% |
| Guyana | 149 | 0.1% |
| Haiti | 55 | 0.0% |
| Honduras | 123 | 0.1% |
| Hong Kong | 102 | 0.0% |
| Hungary | 88 | 0.0% |
| India | 882 | 0.3% |
| Indonesia | 116 | 0.0% |
| Iran | 97 | 0.0% |
| Iraq | 10 | 0.0% |
| Ireland | 53 | 0.0% |
| Israel | 8 | 0.0% |
| Italy | 196 | 0.1% |
| Jamaica | 218 | 0.1% |
| Japan | 63 | 0.0% |
| Kenya | 361 | 0.1% |
| Korea | 585 | 0.2% |
| Laos | 18 | 0.0% |
| Latin America | 3,395 | 1.3% |
| Lebanon | 25 | 0.0% |
| Liberia | 78 | 0.0% |
| Lithuania | 8 | 0.0% |
| Malaysia | 15 | 0.0% |
| Mexico | 468 | 0.2% |
| Middle Africa | 121 | 0.1% |
| Morocco | 18 | 0.0% |
| Nepal | 233 | 0.1% |
| Netherlands | 22 | 0.0% |
| Nicaragua | 119 | 0.1% |
| Nigeria | 356 | 0.1% |
| Northern Africa | 271 | 0.1% |
| Northern Europe | 474 | 0.2% |
| Oceania | 58 | 0.0% |
| Pakistan | 94 | 0.0% |
| Panama | 114 | 0.0% |
| Peru | 114 | 0.0% |
| Philippines | 801 | 0.3% |
| Poland | 484 | 0.2% |
| Portugal | 14 | 0.0% |
| Romania | 8 | 0.0% |
| Russia | 165 | 0.1% |
| Saudi Arabia | 21 | 0.0% |
| Scotland | 75 | 0.0% |
| South Africa | 34 | 0.0% |
| South America | 769 | 0.3% |
| South Central Asia | 1,427 | 0.5% |
| South Eastern Asia | 1,722 | 0.7% |
| Southern Europe | 364 | 0.1% |
| Spain | 22 | 0.0% |
| St. Vincent and the Grenadines | 10 | 0.0% |
| Sweden | 8 | 0.0% |
| Switzerland | 8 | 0.0% |
| Taiwan | 119 | 0.1% |
| Thailand | 113 | 0.0% |
| Trinidad and Tobago | 279 | 0.1% |
| Ukraine | 143 | 0.1% |
| Vietnam | 649 | 0.3% |
| Western Africa | 1,025 | 0.4% |
| Western Asia | 64 | 0.0% |
| Western Europe | 712 | 0.3% |
| Zimbabwe | 38 | 0.0% | View All 101 Rows |
Sex and Age in Harford County
Sex and Age in Harford County
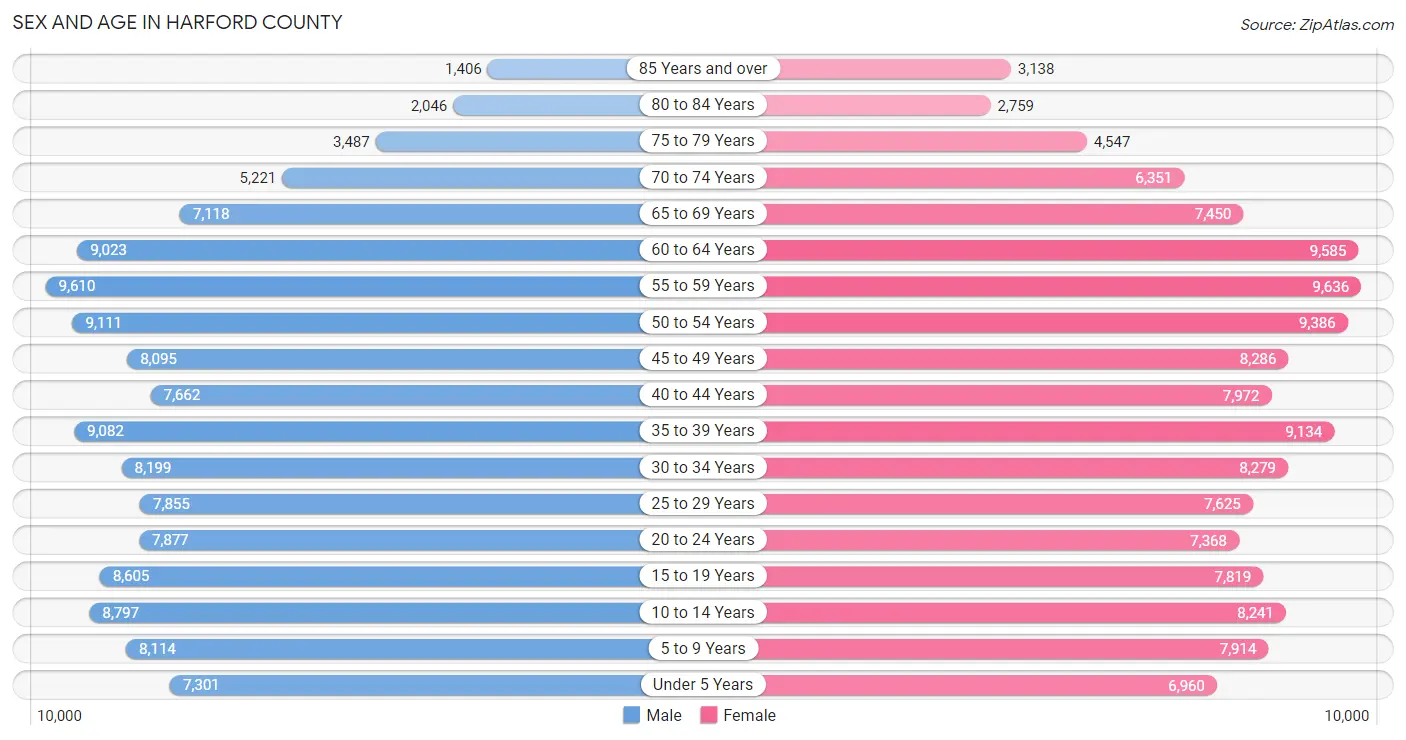
The most populous age groups in Harford County are 55 to 59 Years (9,610 | 7.5%) for men and 55 to 59 Years (9,636 | 7.3%) for women.
| Age Bracket | Male | Female |
| Under 5 Years | 7,301 (5.7%) | 6,960 (5.2%) |
| 5 to 9 Years | 8,114 (6.3%) | 7,914 (6.0%) |
| 10 to 14 Years | 8,797 (6.8%) | 8,241 (6.2%) |
| 15 to 19 Years | 8,605 (6.7%) | 7,819 (5.9%) |
| 20 to 24 Years | 7,877 (6.1%) | 7,368 (5.6%) |
| 25 to 29 Years | 7,855 (6.1%) | 7,625 (5.8%) |
| 30 to 34 Years | 8,199 (6.4%) | 8,279 (6.2%) |
| 35 to 39 Years | 9,082 (7.1%) | 9,134 (6.9%) |
| 40 to 44 Years | 7,662 (6.0%) | 7,972 (6.0%) |
| 45 to 49 Years | 8,095 (6.3%) | 8,286 (6.3%) |
| 50 to 54 Years | 9,111 (7.1%) | 9,386 (7.1%) |
| 55 to 59 Years | 9,610 (7.5%) | 9,636 (7.3%) |
| 60 to 64 Years | 9,023 (7.0%) | 9,585 (7.2%) |
| 65 to 69 Years | 7,118 (5.5%) | 7,450 (5.6%) |
| 70 to 74 Years | 5,221 (4.1%) | 6,351 (4.8%) |
| 75 to 79 Years | 3,487 (2.7%) | 4,547 (3.4%) |
| 80 to 84 Years | 2,046 (1.6%) | 2,759 (2.1%) |
| 85 Years and over | 1,406 (1.1%) | 3,138 (2.4%) |
| Total | 128,609 (100.0%) | 132,450 (100.0%) |
Families and Households in Harford County
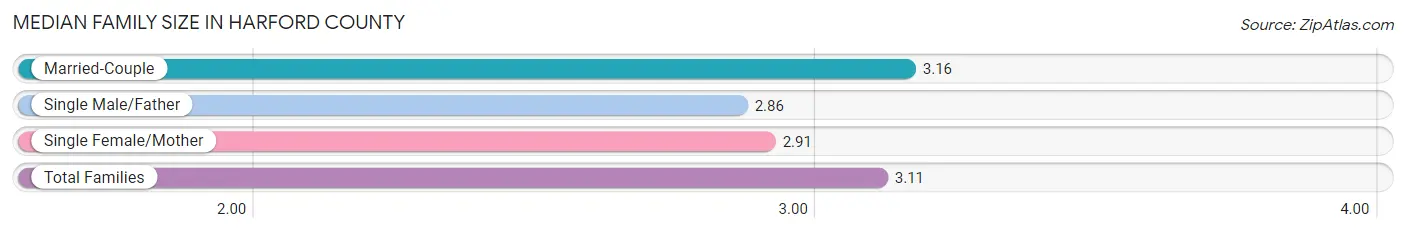
Median Family Size in Harford County
The median family size in Harford County is 3.11 persons per family, with married-couple families (56,129 | 79.2%) accounting for the largest median family size of 3.16 persons per family. On the other hand, single male/father families (4,695 | 6.6%) represent the smallest median family size with 2.86 persons per family.
| Family Type | # Families | Family Size |
| Married-Couple | 56,129 (79.2%) | 3.16 |
| Single Male/Father | 4,695 (6.6%) | 2.86 |
| Single Female/Mother | 10,066 (14.2%) | 2.91 |
| Total Families | 70,890 (100.0%) | 3.11 |
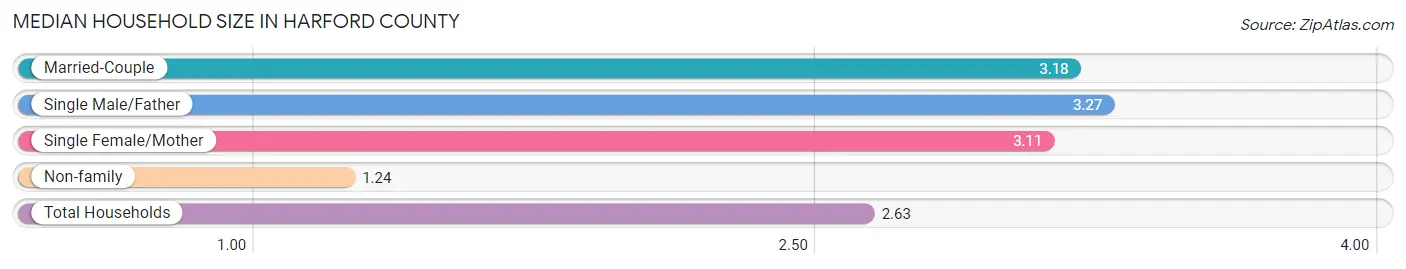
Median Household Size in Harford County
The median household size in Harford County is 2.63 persons per household, with single male/father households (4,695 | 4.8%) accounting for the largest median household size of 3.27 persons per household. non-family households (27,932 | 28.3%) represent the smallest median household size with 1.24 persons per household.
| Household Type | # Households | Household Size |
| Married-Couple | 56,129 (56.8%) | 3.18 |
| Single Male/Father | 4,695 (4.8%) | 3.27 |
| Single Female/Mother | 10,066 (10.2%) | 3.11 |
| Non-family | 27,932 (28.3%) | 1.24 |
| Total Households | 98,822 (100.0%) | 2.63 |
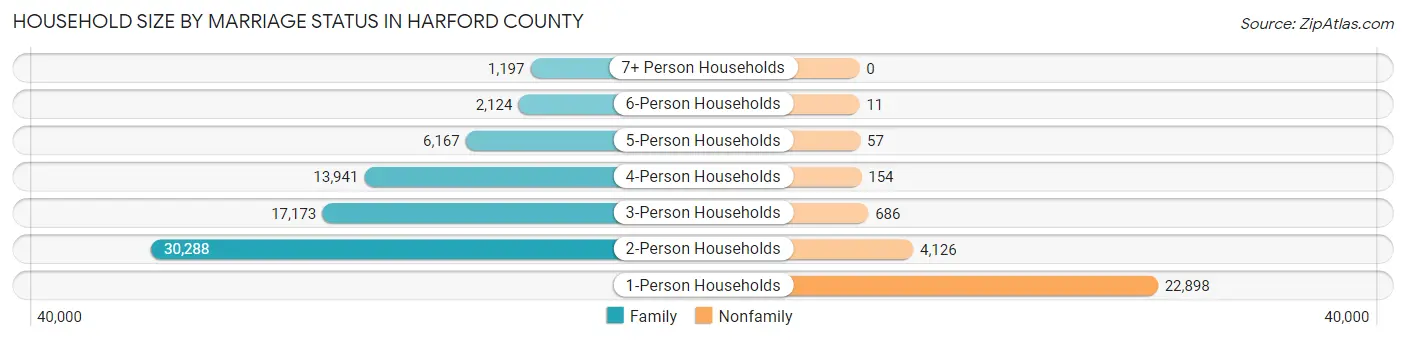
Household Size by Marriage Status in Harford County
Out of a total of 98,822 households in Harford County, 70,890 (71.7%) are family households, while 27,932 (28.3%) are nonfamily households. The most numerous type of family households are 2-person households, comprising 30,288, and the most common type of nonfamily households are 1-person households, comprising 22,898.
| Household Size | Family Households | Nonfamily Households |
| 1-Person Households | - | 22,898 (23.2%) |
| 2-Person Households | 30,288 (30.6%) | 4,126 (4.2%) |
| 3-Person Households | 17,173 (17.4%) | 686 (0.7%) |
| 4-Person Households | 13,941 (14.1%) | 154 (0.2%) |
| 5-Person Households | 6,167 (6.2%) | 57 (0.1%) |
| 6-Person Households | 2,124 (2.1%) | 11 (0.0%) |
| 7+ Person Households | 1,197 (1.2%) | 0 (0.0%) |
| Total | 70,890 (71.7%) | 27,932 (28.3%) |
Female Fertility in Harford County
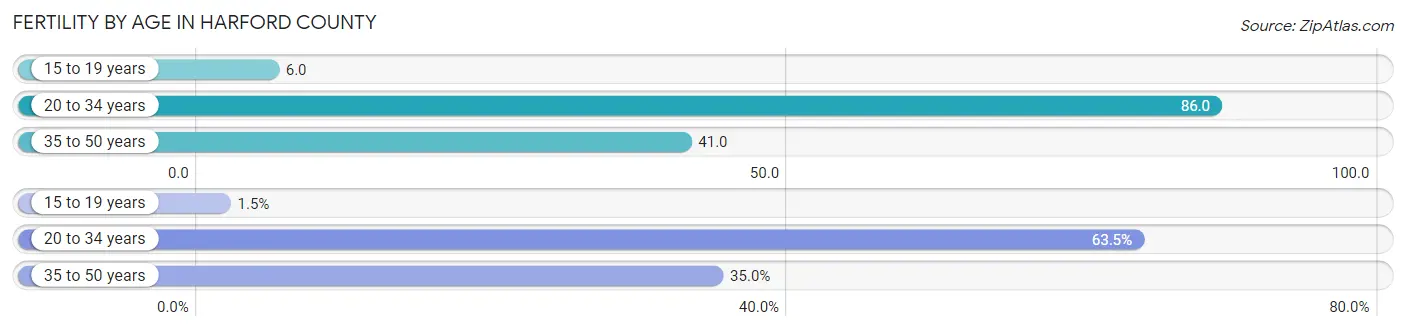
Fertility by Age in Harford County
Average fertility rate in Harford County is 54.0 births per 1,000 women. Women in the age bracket of 20 to 34 years have the highest fertility rate with 86.0 births per 1,000 women. Women in the age bracket of 20 to 34 years acount for 63.5% of all women with births.
| Age Bracket | Women with Births | Births / 1,000 Women |
| 15 to 19 years | 48 (1.5%) | 6.0 |
| 20 to 34 years | 1,995 (63.5%) | 86.0 |
| 35 to 50 years | 1,098 (35.0%) | 41.0 |
| Total | 3,141 (100.0%) | 54.0 |
Fertility by Age by Marriage Status in Harford County
71.5% of women with births (3,141) in Harford County are married. The highest percentage of unmarried women with births falls into 20 to 34 years age bracket with 36.0% of them unmarried at the time of birth, while the lowest percentage of unmarried women with births belong to 35 to 50 years age bracket with 14.7% of them unmarried.

| Age Bracket | Married | Unmarried |
| 15 to 19 years | 33 (68.8%) | 15 (31.2%) |
| 20 to 34 years | 1,277 (64.0%) | 718 (36.0%) |
| 35 to 50 years | 937 (85.3%) | 161 (14.7%) |
| Total | 2,246 (71.5%) | 895 (28.5%) |
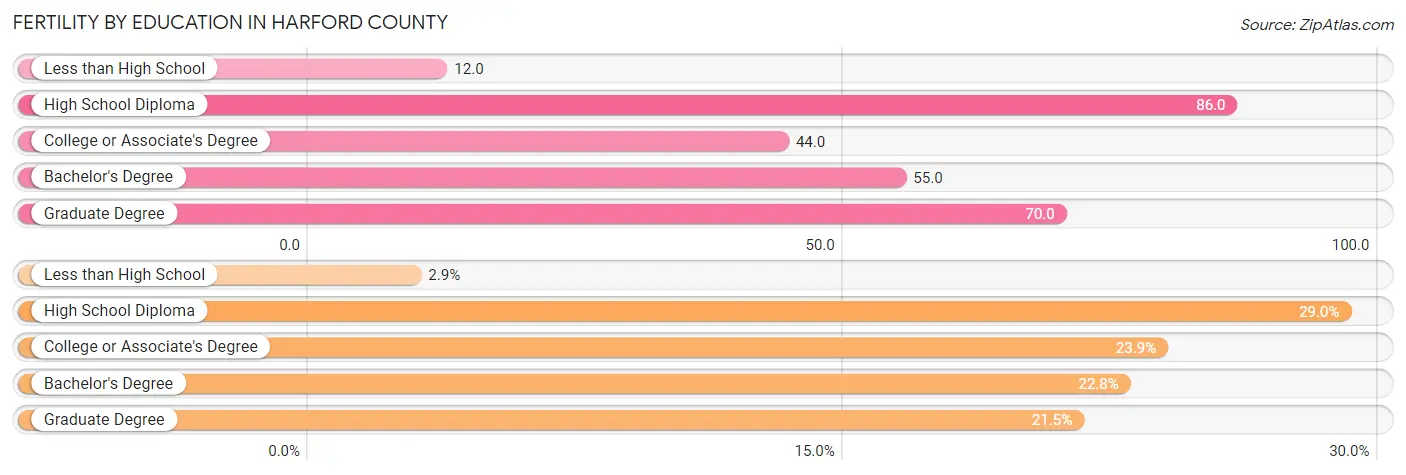
Fertility by Education in Harford County
Average fertility rate in Harford County is 54.0 births per 1,000 women. Women with the education attainment of high school diploma have the highest fertility rate of 86.0 births per 1,000 women, while women with the education attainment of less than high school have the lowest fertility at 12.0 births per 1,000 women. Women with the education attainment of high school diploma represent 29.0% of all women with births.
| Educational Attainment | Women with Births | Births / 1,000 Women |
| Less than High School | 90 (2.9%) | 12.0 |
| High School Diploma | 911 (29.0%) | 86.0 |
| College or Associate's Degree | 749 (23.8%) | 44.0 |
| Bachelor's Degree | 716 (22.8%) | 55.0 |
| Graduate Degree | 675 (21.5%) | 70.0 |
| Total | 3,141 (100.0%) | 54.0 |
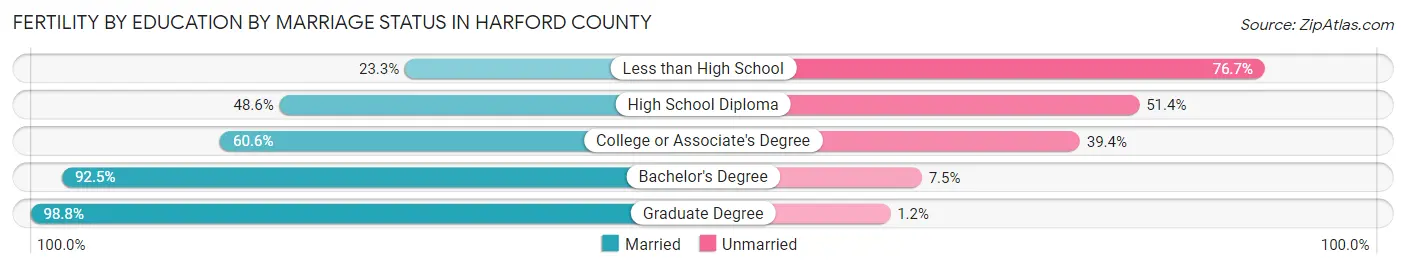
Fertility by Education by Marriage Status in Harford County
28.5% of women with births in Harford County are unmarried. Women with the educational attainment of graduate degree are most likely to be married with 98.8% of them married at childbirth, while women with the educational attainment of less than high school are least likely to be married with 76.7% of them unmarried at childbirth.
| Educational Attainment | Married | Unmarried |
| Less than High School | 21 (23.3%) | 69 (76.7%) |
| High School Diploma | 443 (48.6%) | 468 (51.4%) |
| College or Associate's Degree | 454 (60.6%) | 295 (39.4%) |
| Bachelor's Degree | 662 (92.5%) | 54 (7.5%) |
| Graduate Degree | 667 (98.8%) | 8 (1.2%) |
| Total | 2,246 (71.5%) | 895 (28.5%) |
Income in Harford County
Income Overview in Harford County
Per Capita Income in Harford County is $48,615, while median incomes of families and households are $125,929 and $106,417 respectively.
| Characteristic | Number | Measure |
| Per Capita Income | 261,059 | $48,615 |
| Median Family Income | 70,890 | $125,929 |
| Mean Family Income | 70,890 | $144,942 |
| Median Household Income | 98,822 | $106,417 |
| Mean Household Income | 98,822 | $126,684 |
| Income Deficit | 70,890 | $10,989 |
| Wage / Income Gap (%) | 261,059 | 33.11% |
| Wage / Income Gap ($) | 261,059 | 66.89¢ per $1 |
| Gini / Inequality Index | 261,059 | 0.41 |
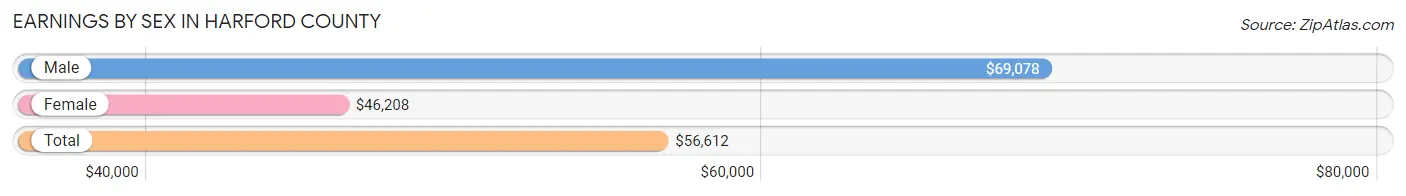
Earnings by Sex in Harford County
Average Earnings in Harford County are $56,612, $69,078 for men and $46,208 for women, a difference of 33.1%.
| Sex | Number | Average Earnings |
| Male | 77,651 (52.8%) | $69,078 |
| Female | 69,319 (47.2%) | $46,208 |
| Total | 146,970 (100.0%) | $56,612 |
Earnings by Sex by Income Bracket in Harford County
The most common earnings brackets in Harford County are $100,000+ for men (23,001 | 29.6%) and $100,000+ for women (10,595 | 15.3%).
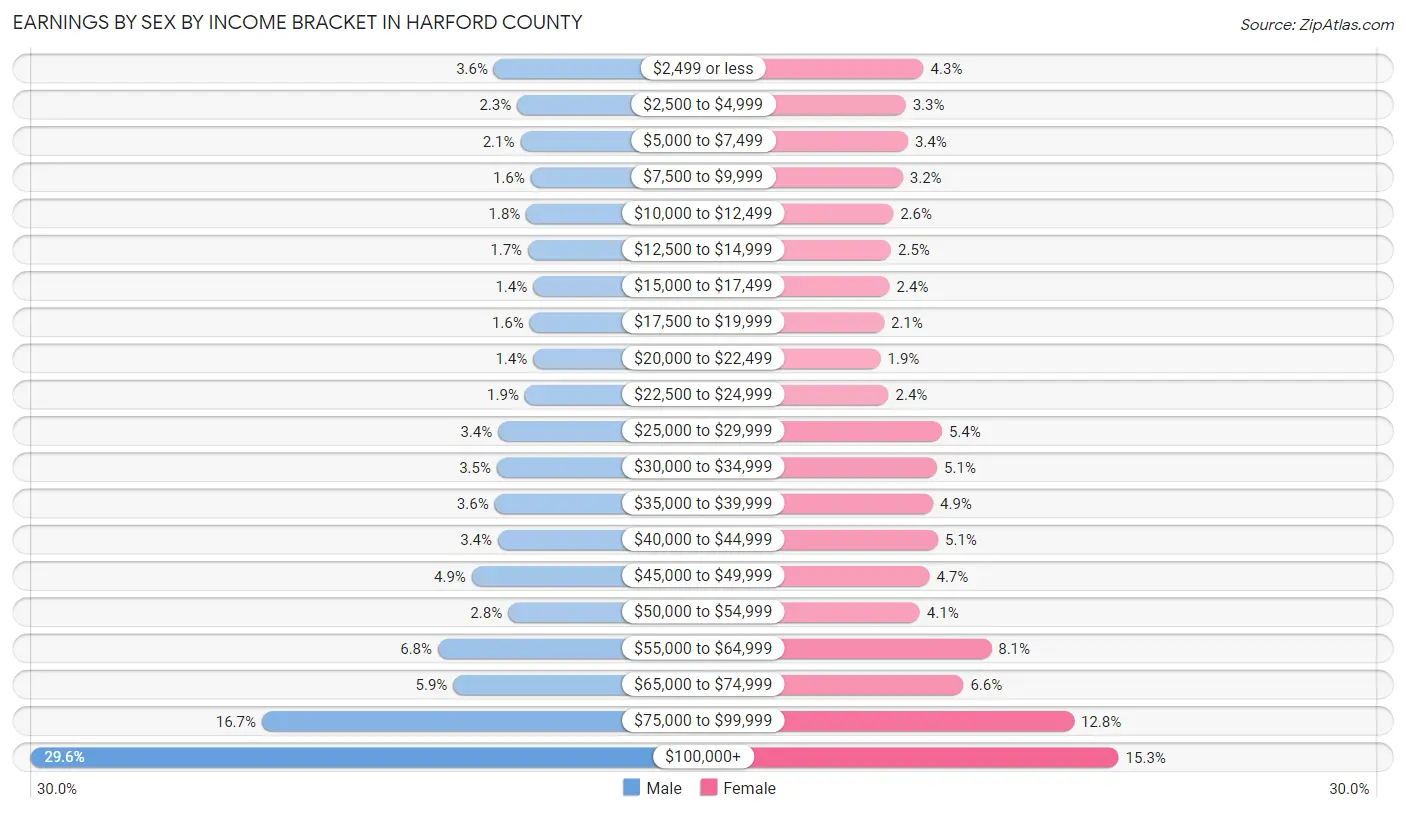
| Income | Male | Female |
| $2,499 or less | 2,820 (3.6%) | 2,995 (4.3%) |
| $2,500 to $4,999 | 1,799 (2.3%) | 2,294 (3.3%) |
| $5,000 to $7,499 | 1,659 (2.1%) | 2,388 (3.4%) |
| $7,500 to $9,999 | 1,213 (1.6%) | 2,186 (3.2%) |
| $10,000 to $12,499 | 1,407 (1.8%) | 1,810 (2.6%) |
| $12,500 to $14,999 | 1,324 (1.7%) | 1,726 (2.5%) |
| $15,000 to $17,499 | 1,105 (1.4%) | 1,673 (2.4%) |
| $17,500 to $19,999 | 1,258 (1.6%) | 1,451 (2.1%) |
| $20,000 to $22,499 | 1,101 (1.4%) | 1,319 (1.9%) |
| $22,500 to $24,999 | 1,464 (1.9%) | 1,631 (2.4%) |
| $25,000 to $29,999 | 2,629 (3.4%) | 3,709 (5.3%) |
| $30,000 to $34,999 | 2,687 (3.5%) | 3,518 (5.1%) |
| $35,000 to $39,999 | 2,784 (3.6%) | 3,365 (4.9%) |
| $40,000 to $44,999 | 2,639 (3.4%) | 3,554 (5.1%) |
| $45,000 to $49,999 | 3,781 (4.9%) | 3,222 (4.6%) |
| $50,000 to $54,999 | 2,198 (2.8%) | 2,852 (4.1%) |
| $55,000 to $64,999 | 5,254 (6.8%) | 5,631 (8.1%) |
| $65,000 to $74,999 | 4,587 (5.9%) | 4,549 (6.6%) |
| $75,000 to $99,999 | 12,941 (16.7%) | 8,851 (12.8%) |
| $100,000+ | 23,001 (29.6%) | 10,595 (15.3%) |
| Total | 77,651 (100.0%) | 69,319 (100.0%) |
Earnings by Sex by Educational Attainment in Harford County
Average earnings in Harford County are $78,482 for men and $52,680 for women, a difference of 32.9%. Men with an educational attainment of graduate degree enjoy the highest average annual earnings of $116,856, while those with less than high school education earn the least with $41,411. Women with an educational attainment of graduate degree earn the most with the average annual earnings of $82,524, while those with less than high school education have the smallest earnings of $29,203.
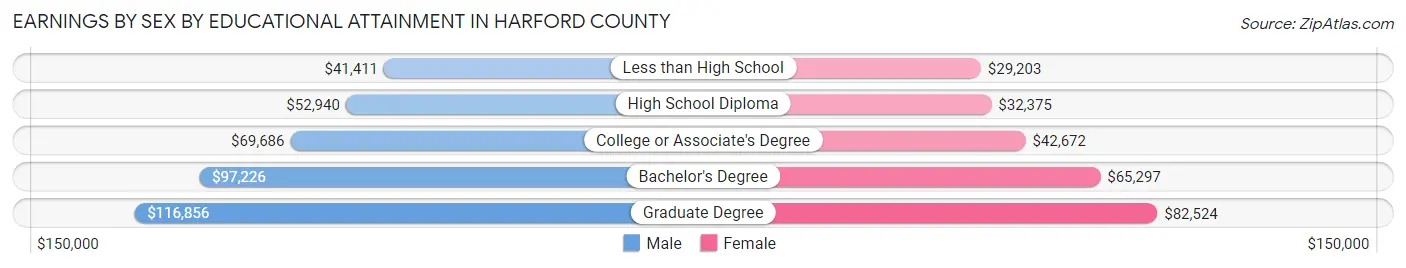
| Educational Attainment | Male Income | Female Income |
| Less than High School | $41,411 | $29,203 |
| High School Diploma | $52,940 | $32,375 |
| College or Associate's Degree | $69,686 | $42,672 |
| Bachelor's Degree | $97,226 | $65,297 |
| Graduate Degree | $116,856 | $82,524 |
| Total | $78,482 | $52,680 |
Family Income in Harford County
Family Income Brackets in Harford County
According to the Harford County family income data, there are 17,226 families falling into the $100,000 to $149,999 income range, which is the most common income bracket and makes up 24.3% of all families. Conversely, the $10,000 to $14,999 income bracket is the least frequent group with only 780 families (1.1%) belonging to this category.
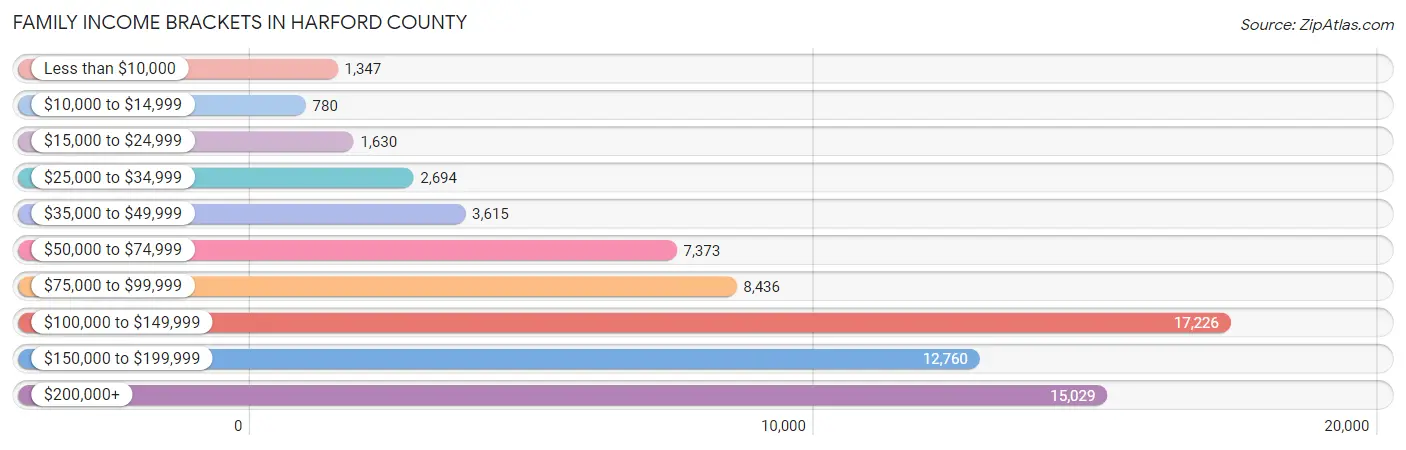
| Income Bracket | # Families | % Families |
| Less than $10,000 | 1,347 | 1.9% |
| $10,000 to $14,999 | 780 | 1.1% |
| $15,000 to $24,999 | 1,630 | 2.3% |
| $25,000 to $34,999 | 2,694 | 3.8% |
| $35,000 to $49,999 | 3,615 | 5.1% |
| $50,000 to $74,999 | 7,373 | 10.4% |
| $75,000 to $99,999 | 8,436 | 11.9% |
| $100,000 to $149,999 | 17,226 | 24.3% |
| $150,000 to $199,999 | 12,760 | 18.0% |
| $200,000+ | 15,029 | 21.2% |
Family Income by Famaliy Size in Harford County
5-person families (5,814 | 8.2%) account for the highest median family income in Harford County with $160,652 per family, while 2-person families (32,163 | 45.4%) have the highest median income of $51,926 per family member.
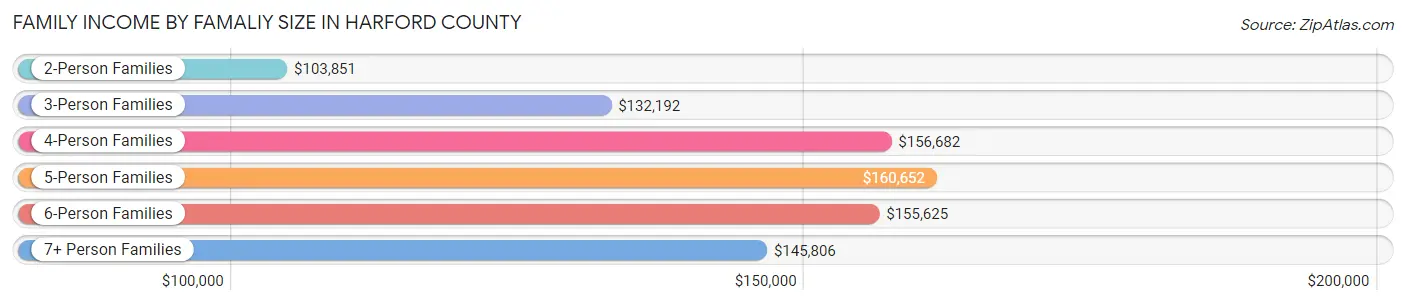
| Income Bracket | # Families | Median Income |
| 2-Person Families | 32,163 (45.4%) | $103,851 |
| 3-Person Families | 16,811 (23.7%) | $132,192 |
| 4-Person Families | 13,050 (18.4%) | $156,682 |
| 5-Person Families | 5,814 (8.2%) | $160,652 |
| 6-Person Families | 1,997 (2.8%) | $155,625 |
| 7+ Person Families | 1,055 (1.5%) | $145,806 |
| Total | 70,890 (100.0%) | $125,929 |
Family Income by Number of Earners in Harford County
The median family income in Harford County is $125,929, with families comprising 3+ earners (10,283) having the highest median family income of $186,072, while families with no earners (8,656) have the lowest median family income of $62,216, accounting for 14.5% and 12.2% of families, respectively.
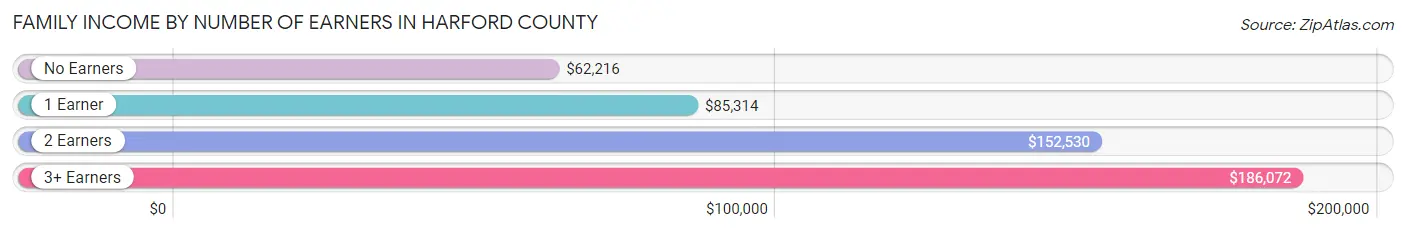
| Number of Earners | # Families | Median Income |
| No Earners | 8,656 (12.2%) | $62,216 |
| 1 Earner | 20,067 (28.3%) | $85,314 |
| 2 Earners | 31,884 (45.0%) | $152,530 |
| 3+ Earners | 10,283 (14.5%) | $186,072 |
| Total | 70,890 (100.0%) | $125,929 |
Household Income in Harford County
Household Income Brackets in Harford County
With 21,642 households falling in the category, the $100,000 to $149,999 income range is the most frequent in Harford County, accounting for 21.9% of all households. In contrast, only 1,878 households (1.9%) fall into the $10,000 to $14,999 income bracket, making it the least populous group.
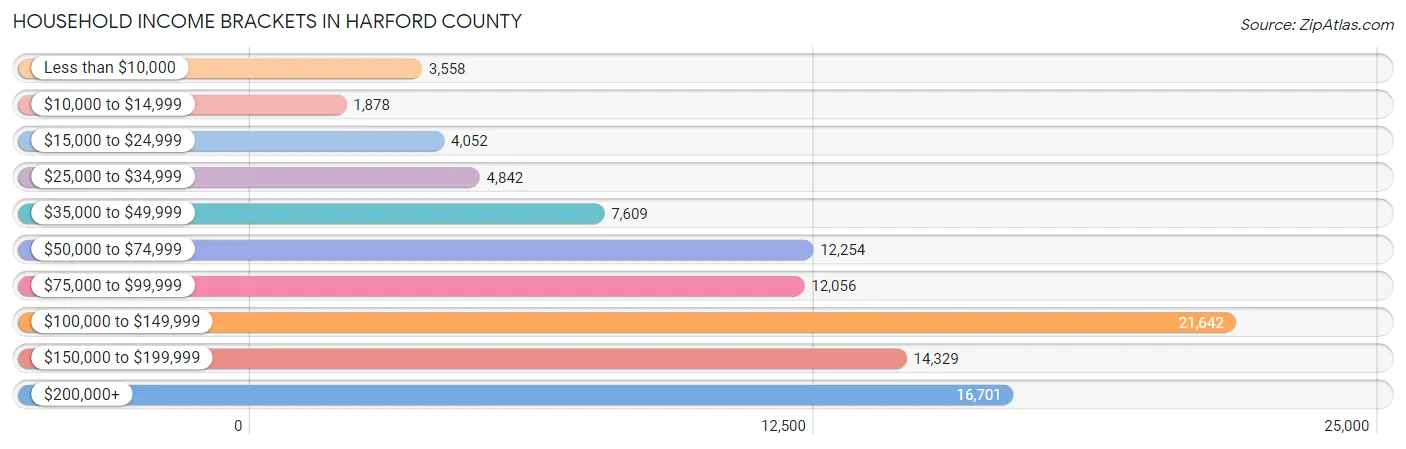
| Income Bracket | # Households | % Households |
| Less than $10,000 | 3,558 | 3.6% |
| $10,000 to $14,999 | 1,878 | 1.9% |
| $15,000 to $24,999 | 4,052 | 4.1% |
| $25,000 to $34,999 | 4,842 | 4.9% |
| $35,000 to $49,999 | 7,609 | 7.7% |
| $50,000 to $74,999 | 12,254 | 12.4% |
| $75,000 to $99,999 | 12,056 | 12.2% |
| $100,000 to $149,999 | 21,642 | 21.9% |
| $150,000 to $199,999 | 14,329 | 14.5% |
| $200,000+ | 16,701 | 16.9% |
Household Income by Householder Age in Harford County
The median household income in Harford County is $106,417, with the highest median household income of $133,942 found in the 45 to 64 years age bracket for the primary householder. A total of 39,834 households (40.3%) fall into this category. Meanwhile, the 15 to 24 years age bracket for the primary householder has the lowest median household income of $62,642, with 2,391 households (2.4%) in this group.
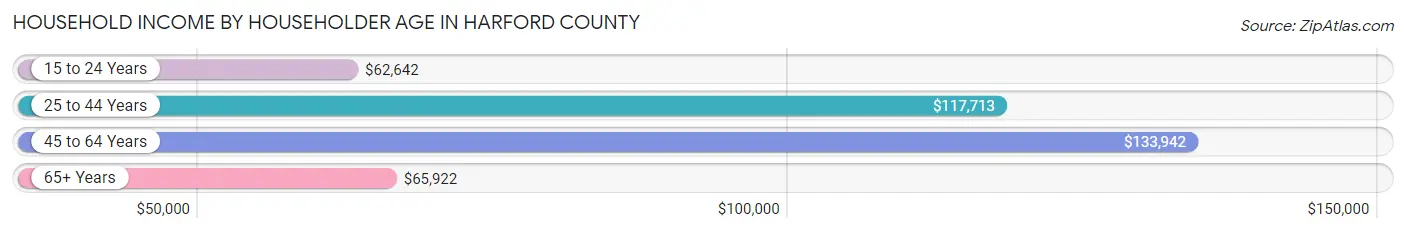
| Income Bracket | # Households | Median Income |
| 15 to 24 Years | 2,391 (2.4%) | $62,642 |
| 25 to 44 Years | 30,215 (30.6%) | $117,713 |
| 45 to 64 Years | 39,834 (40.3%) | $133,942 |
| 65+ Years | 26,382 (26.7%) | $65,922 |
| Total | 98,822 (100.0%) | $106,417 |
Poverty in Harford County
Income Below Poverty by Sex and Age in Harford County
With 6.1% poverty level for males and 8.2% for females among the residents of Harford County, 16 and 17 year old males and 5 year old females are the most vulnerable to poverty, with 559 males (14.9%) and 234 females (13.3%) in their respective age groups living below the poverty level.
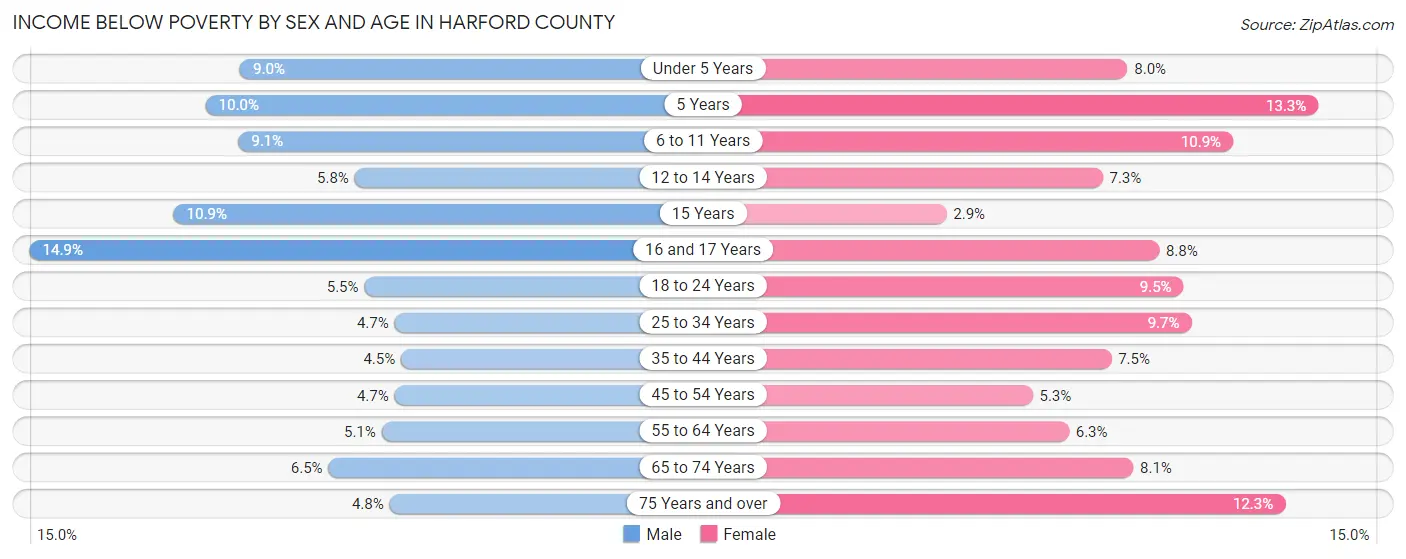
| Age Bracket | Male | Female |
| Under 5 Years | 649 (9.0%) | 551 (8.0%) |
| 5 Years | 145 (10.0%) | 234 (13.3%) |
| 6 to 11 Years | 940 (9.0%) | 964 (10.9%) |
| 12 to 14 Years | 286 (5.8%) | 396 (7.3%) |
| 15 Years | 193 (10.8%) | 55 (2.9%) |
| 16 and 17 Years | 559 (14.9%) | 284 (8.8%) |
| 18 to 24 Years | 603 (5.5%) | 957 (9.5%) |
| 25 to 34 Years | 747 (4.7%) | 1,544 (9.7%) |
| 35 to 44 Years | 755 (4.5%) | 1,282 (7.5%) |
| 45 to 54 Years | 807 (4.7%) | 936 (5.3%) |
| 55 to 64 Years | 943 (5.1%) | 1,214 (6.3%) |
| 65 to 74 Years | 806 (6.5%) | 1,108 (8.1%) |
| 75 Years and over | 331 (4.8%) | 1,235 (12.3%) |
| Total | 7,764 (6.1%) | 10,760 (8.2%) |
Income Above Poverty by Sex and Age in Harford County
According to the poverty statistics in Harford County, males aged 35 to 44 years and females aged 15 years are the age groups that are most secure financially, with 95.5% of males and 97.1% of females in these age groups living above the poverty line.
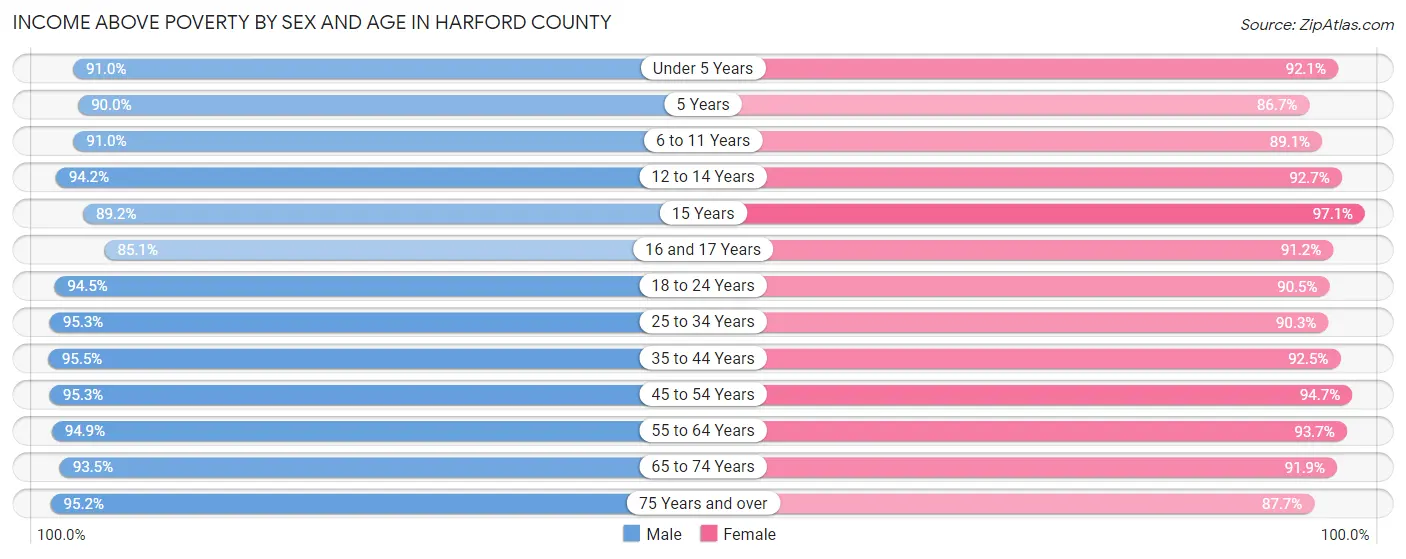
| Age Bracket | Male | Female |
| Under 5 Years | 6,566 (91.0%) | 6,379 (92.0%) |
| 5 Years | 1,311 (90.0%) | 1,531 (86.7%) |
| 6 to 11 Years | 9,449 (90.9%) | 7,892 (89.1%) |
| 12 to 14 Years | 4,640 (94.2%) | 5,056 (92.7%) |
| 15 Years | 1,585 (89.1%) | 1,832 (97.1%) |
| 16 and 17 Years | 3,204 (85.1%) | 2,933 (91.2%) |
| 18 to 24 Years | 10,272 (94.5%) | 9,110 (90.5%) |
| 25 to 34 Years | 15,141 (95.3%) | 14,317 (90.3%) |
| 35 to 44 Years | 15,943 (95.5%) | 15,815 (92.5%) |
| 45 to 54 Years | 16,360 (95.3%) | 16,704 (94.7%) |
| 55 to 64 Years | 17,675 (94.9%) | 17,996 (93.7%) |
| 65 to 74 Years | 11,510 (93.5%) | 12,551 (91.9%) |
| 75 Years and over | 6,507 (95.2%) | 8,774 (87.7%) |
| Total | 120,163 (93.9%) | 120,890 (91.8%) |
Income Below Poverty Among Married-Couple Families in Harford County
The poverty statistics for married-couple families in Harford County show that 2.6% or 1,441 of the total 56,129 families live below the poverty line. Families with 3 or 4 children have the highest poverty rate of 4.6%, comprising of 196 families. On the other hand, families with 1 or 2 children have the lowest poverty rate of 1.7%, which includes 302 families.
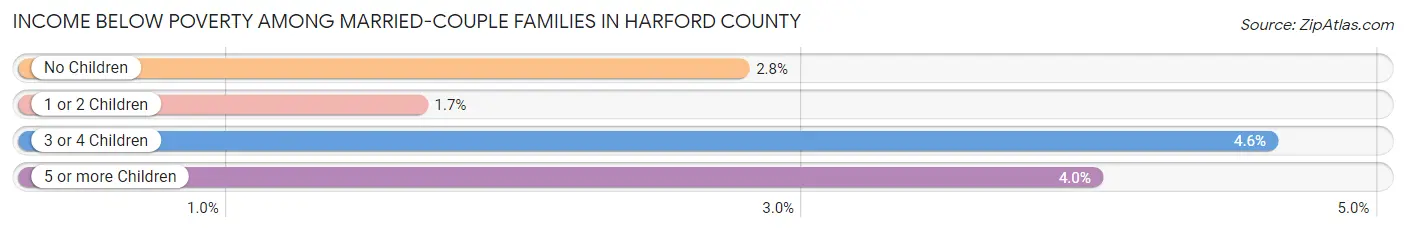
| Children | Above Poverty | Below Poverty |
| No Children | 32,380 (97.2%) | 927 (2.8%) |
| 1 or 2 Children | 17,880 (98.3%) | 302 (1.7%) |
| 3 or 4 Children | 4,045 (95.4%) | 196 (4.6%) |
| 5 or more Children | 383 (96.0%) | 16 (4.0%) |
| Total | 54,688 (97.4%) | 1,441 (2.6%) |
Income Below Poverty Among Single-Parent Households in Harford County
According to the poverty data in Harford County, 5.7% or 269 single-father households and 16.1% or 1,625 single-mother households are living below the poverty line. Among single-father households, those with 5 or more children have the highest poverty rate, with 14 households (100.0%) experiencing poverty. Likewise, among single-mother households, those with 5 or more children have the highest poverty rate, with 96 households (62.7%) falling below the poverty line.
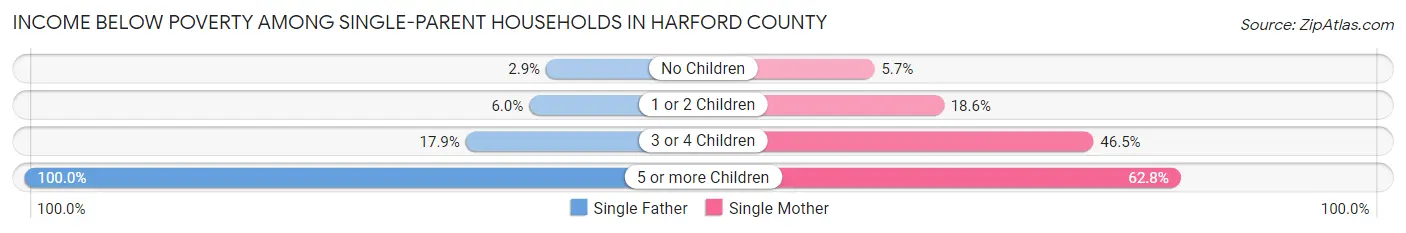
| Children | Single Father | Single Mother |
| No Children | 68 (2.9%) | 232 (5.7%) |
| 1 or 2 Children | 117 (6.0%) | 956 (18.6%) |
| 3 or 4 Children | 70 (17.9%) | 341 (46.5%) |
| 5 or more Children | 14 (100.0%) | 96 (62.7%) |
| Total | 269 (5.7%) | 1,625 (16.1%) |
Income Below Poverty Among Married-Couple vs Single-Parent Households in Harford County
The poverty data for Harford County shows that 1,441 of the married-couple family households (2.6%) and 1,894 of the single-parent households (12.8%) are living below the poverty level. Within the married-couple family households, those with 3 or 4 children have the highest poverty rate, with 196 households (4.6%) falling below the poverty line. Among the single-parent households, those with 5 or more children have the highest poverty rate, with 110 household (65.9%) living below poverty.
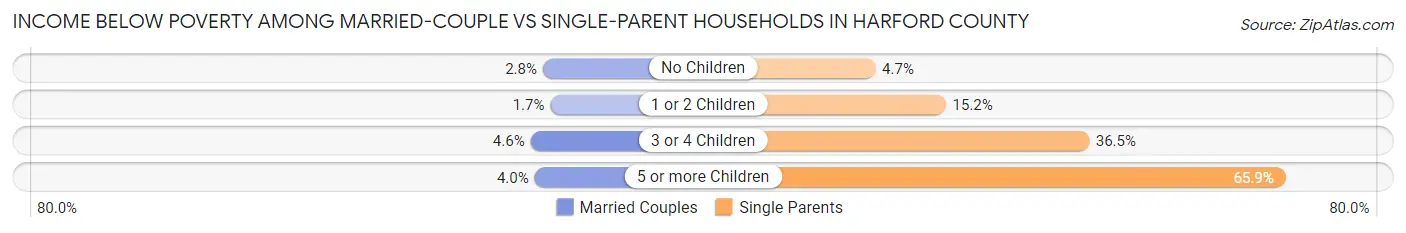
| Children | Married-Couple Families | Single-Parent Households |
| No Children | 927 (2.8%) | 300 (4.7%) |
| 1 or 2 Children | 302 (1.7%) | 1,073 (15.2%) |
| 3 or 4 Children | 196 (4.6%) | 411 (36.5%) |
| 5 or more Children | 16 (4.0%) | 110 (65.9%) |
| Total | 1,441 (2.6%) | 1,894 (12.8%) |
Employment Characteristics in Harford County
Employment by Class of Employer in Harford County
Among the 134,818 employed individuals in Harford County, private company employees (83,634 | 62.0%), federal government employees (14,507 | 10.8%), and not-for-profit organizations (11,188 | 8.3%) make up the most common classes of employment.
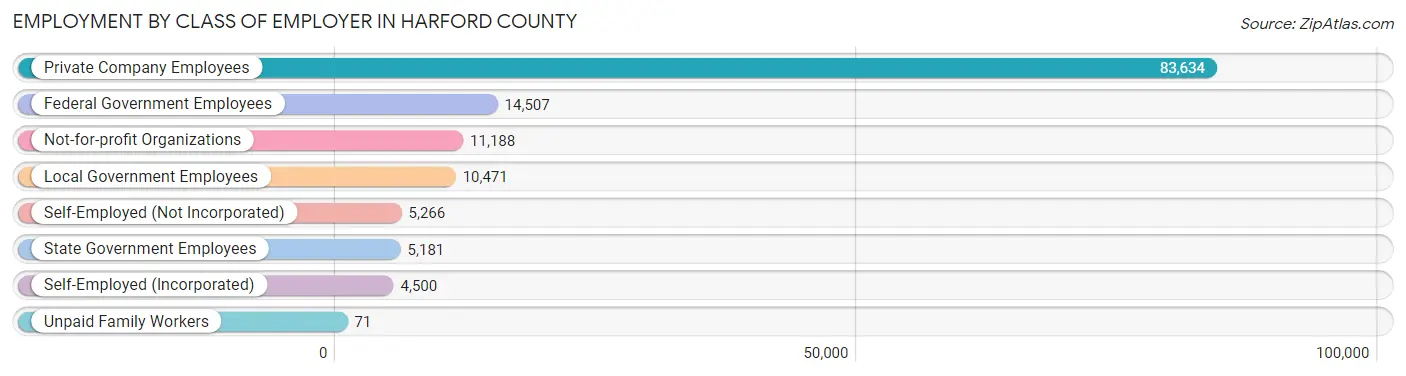
| Employer Class | # Employees | % Employees |
| Private Company Employees | 83,634 | 62.0% |
| Self-Employed (Incorporated) | 4,500 | 3.3% |
| Self-Employed (Not Incorporated) | 5,266 | 3.9% |
| Not-for-profit Organizations | 11,188 | 8.3% |
| Local Government Employees | 10,471 | 7.8% |
| State Government Employees | 5,181 | 3.8% |
| Federal Government Employees | 14,507 | 10.8% |
| Unpaid Family Workers | 71 | 0.1% |
| Total | 134,818 | 100.0% |
Employment Status by Age in Harford County
According to the labor force statistics for Harford County, out of the total population over 16 years of age (210,066), 67.7% or 142,215 individuals are in the labor force, with 3.7% or 5,262 of them unemployed. The age group with the highest labor force participation rate is 35 to 44 years, with 88.9% or 30,093 individuals in the labor force. Within the labor force, the 16 to 19 years age range has the highest percentage of unemployed individuals, with 14.7% or 765 of them being unemployed.
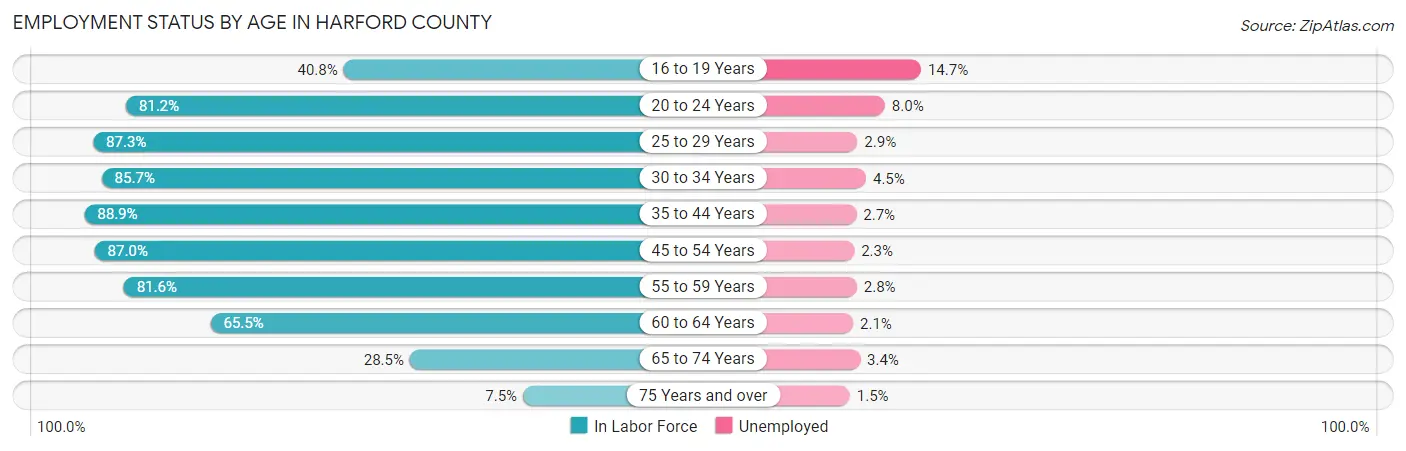
| Age Bracket | In Labor Force | Unemployed |
| 16 to 19 Years | 5,205 (40.8%) | 765 (14.7%) |
| 20 to 24 Years | 12,379 (81.2%) | 990 (8.0%) |
| 25 to 29 Years | 13,514 (87.3%) | 392 (2.9%) |
| 30 to 34 Years | 14,122 (85.7%) | 635 (4.5%) |
| 35 to 44 Years | 30,093 (88.9%) | 813 (2.7%) |
| 45 to 54 Years | 30,344 (87.0%) | 698 (2.3%) |
| 55 to 59 Years | 15,705 (81.6%) | 440 (2.8%) |
| 60 to 64 Years | 12,188 (65.5%) | 256 (2.1%) |
| 65 to 74 Years | 7,450 (28.5%) | 253 (3.4%) |
| 75 Years and over | 1,304 (7.5%) | 20 (1.5%) |
| Total | 142,215 (67.7%) | 5,262 (3.7%) |
Employment Status by Educational Attainment in Harford County
According to labor force statistics for Harford County, 83.7% of individuals (115,958) out of the total population between 25 and 64 years of age (138,540) are in the labor force, with 2.8% or 3,247 of them being unemployed. The group with the highest labor force participation rate are those with the educational attainment of bachelor's degree or higher, with 90.3% or 51,492 individuals in the labor force. Within the labor force, individuals with less than high school education have the highest percentage of unemployment, with 8.9% or 336 of them being unemployed.
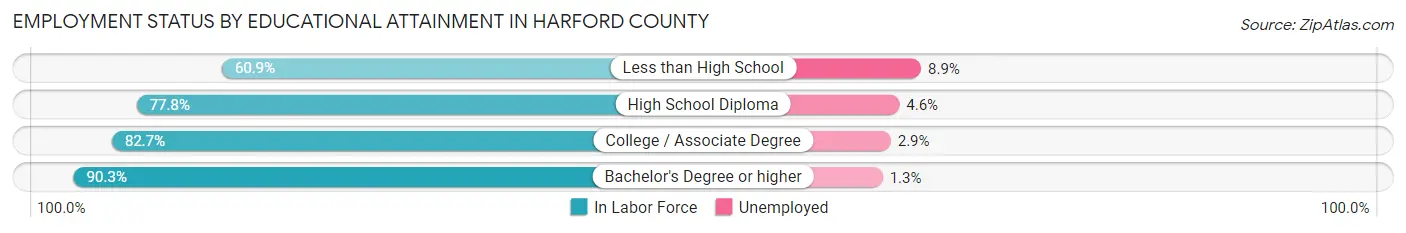
| Educational Attainment | In Labor Force | Unemployed |
| Less than High School | 3,773 (60.9%) | 551 (8.9%) |
| High School Diploma | 26,134 (77.8%) | 1,545 (4.6%) |
| College / Associate Degree | 34,512 (82.7%) | 1,210 (2.9%) |
| Bachelor's Degree or higher | 51,492 (90.3%) | 741 (1.3%) |
| Total | 115,958 (83.7%) | 3,879 (2.8%) |
Employment Occupations by Sex in Harford County
Management, Business, Science and Arts Occupations
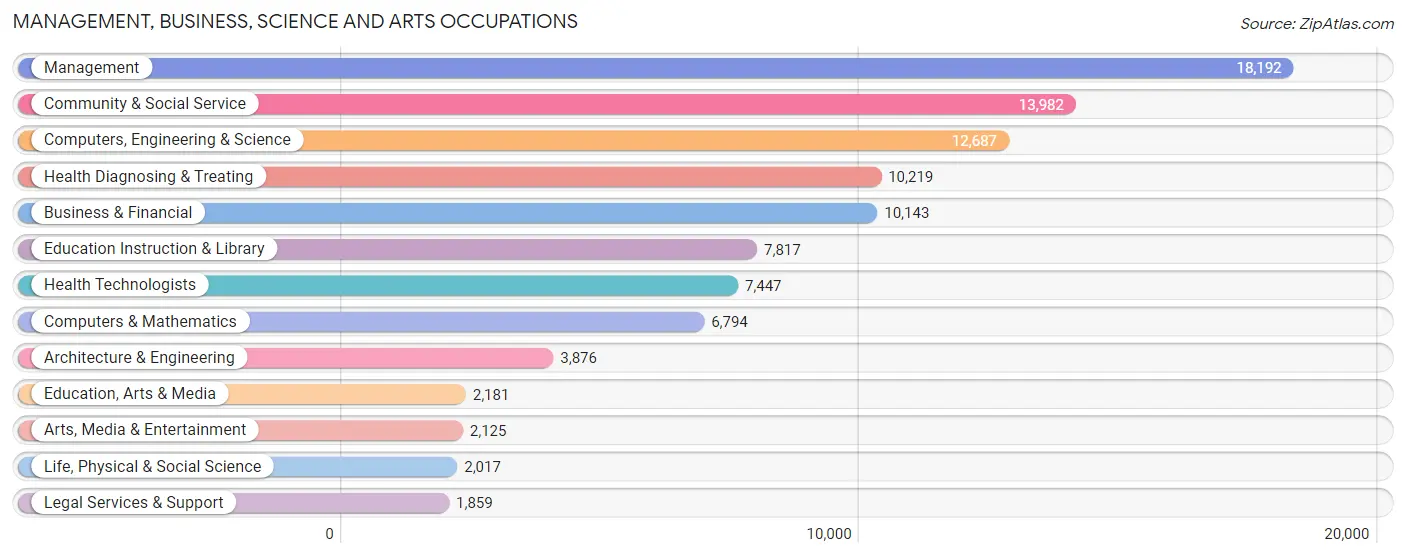
The most common Management, Business, Science and Arts occupations in Harford County are Management (18,192 | 13.4%), Community & Social Service (13,982 | 10.3%), Computers, Engineering & Science (12,687 | 9.3%), Health Diagnosing & Treating (10,219 | 7.5%), and Business & Financial (10,143 | 7.5%).
Management, Business, Science and Arts Occupations by Sex
Within the Management, Business, Science and Arts occupations in Harford County, the most male-oriented occupations are Architecture & Engineering (83.7%), Computers & Mathematics (78.4%), and Computers, Engineering & Science (75.4%), while the most female-oriented occupations are Health Technologists (81.6%), Health Diagnosing & Treating (80.9%), and Education Instruction & Library (79.5%).
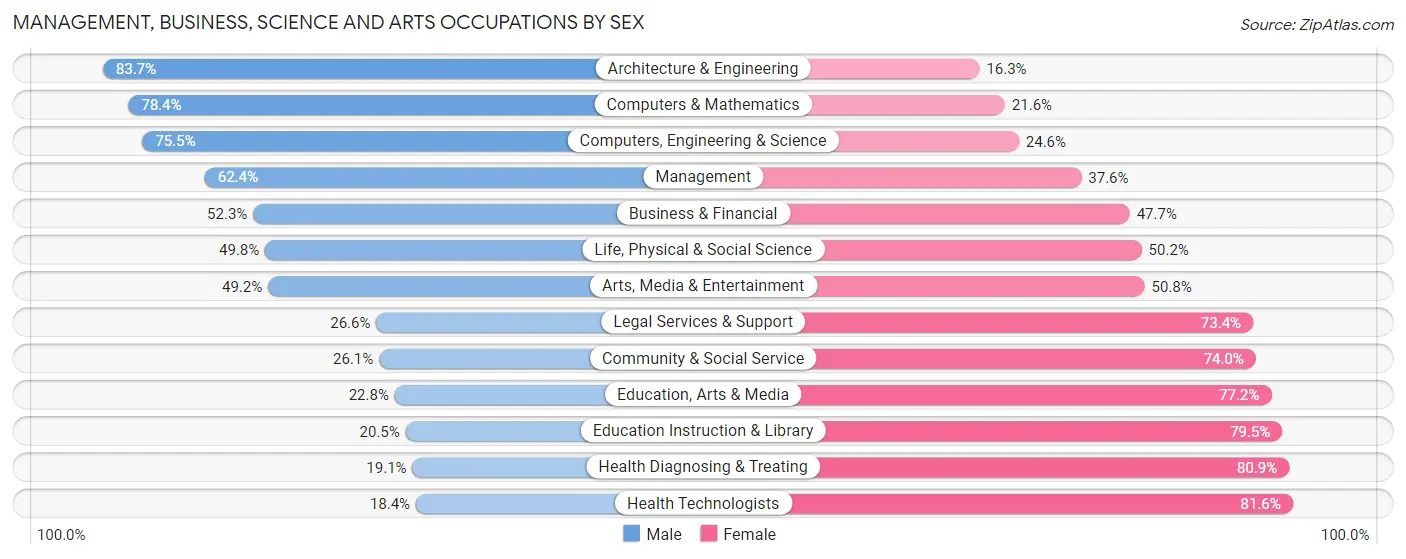
| Occupation | Male | Female |
| Management | 11,354 (62.4%) | 6,838 (37.6%) |
| Business & Financial | 5,307 (52.3%) | 4,836 (47.7%) |
| Computers, Engineering & Science | 9,572 (75.4%) | 3,115 (24.5%) |
| Computers & Mathematics | 5,324 (78.4%) | 1,470 (21.6%) |
| Architecture & Engineering | 3,243 (83.7%) | 633 (16.3%) |
| Life, Physical & Social Science | 1,005 (49.8%) | 1,012 (50.2%) |
| Community & Social Service | 3,642 (26.1%) | 10,340 (74.0%) |
| Education, Arts & Media | 497 (22.8%) | 1,684 (77.2%) |
| Legal Services & Support | 495 (26.6%) | 1,364 (73.4%) |
| Education Instruction & Library | 1,604 (20.5%) | 6,213 (79.5%) |
| Arts, Media & Entertainment | 1,046 (49.2%) | 1,079 (50.8%) |
| Health Diagnosing & Treating | 1,952 (19.1%) | 8,267 (80.9%) |
| Health Technologists | 1,367 (18.4%) | 6,080 (81.6%) |
| Total (Category) | 31,827 (48.8%) | 33,396 (51.2%) |
| Total (Overall) | 71,527 (52.6%) | 64,473 (47.4%) |
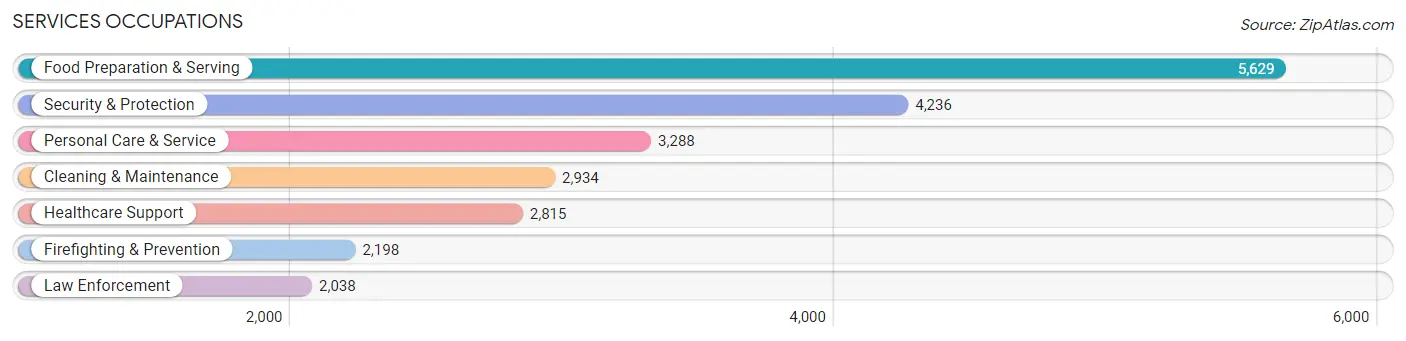
Services Occupations
The most common Services occupations in Harford County are Food Preparation & Serving (5,629 | 4.1%), Security & Protection (4,236 | 3.1%), Personal Care & Service (3,288 | 2.4%), Cleaning & Maintenance (2,934 | 2.2%), and Healthcare Support (2,815 | 2.1%).
Services Occupations by Sex
Within the Services occupations in Harford County, the most male-oriented occupations are Law Enforcement (79.7%), Security & Protection (78.2%), and Firefighting & Prevention (76.7%), while the most female-oriented occupations are Healthcare Support (90.7%), Personal Care & Service (78.7%), and Food Preparation & Serving (51.4%).
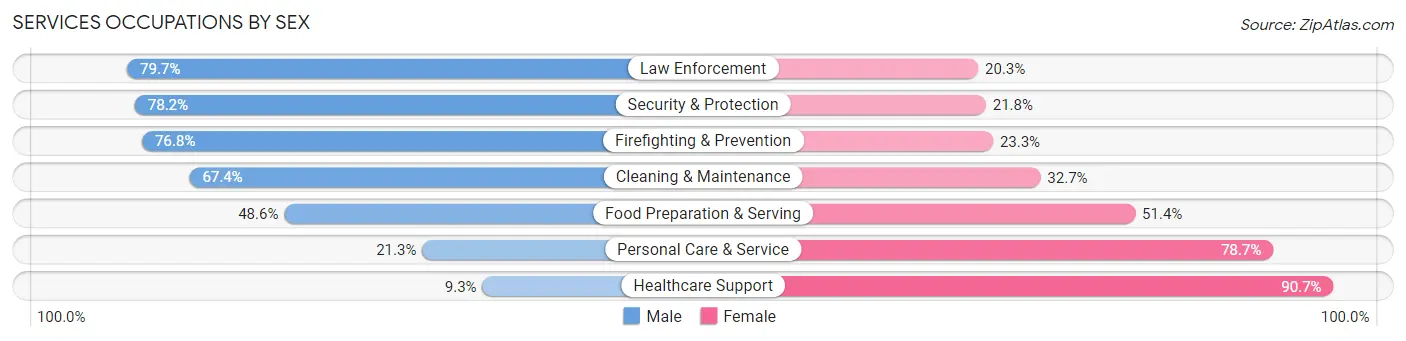
| Occupation | Male | Female |
| Healthcare Support | 263 (9.3%) | 2,552 (90.7%) |
| Security & Protection | 3,311 (78.2%) | 925 (21.8%) |
| Firefighting & Prevention | 1,687 (76.7%) | 511 (23.3%) |
| Law Enforcement | 1,624 (79.7%) | 414 (20.3%) |
| Food Preparation & Serving | 2,735 (48.6%) | 2,894 (51.4%) |
| Cleaning & Maintenance | 1,976 (67.3%) | 958 (32.7%) |
| Personal Care & Service | 699 (21.3%) | 2,589 (78.7%) |
| Total (Category) | 8,984 (47.5%) | 9,918 (52.5%) |
| Total (Overall) | 71,527 (52.6%) | 64,473 (47.4%) |
Sales and Office Occupations
The most common Sales and Office occupations in Harford County are Office & Administration (15,424 | 11.3%), and Sales & Related (12,747 | 9.4%).

Sales and Office Occupations by Sex
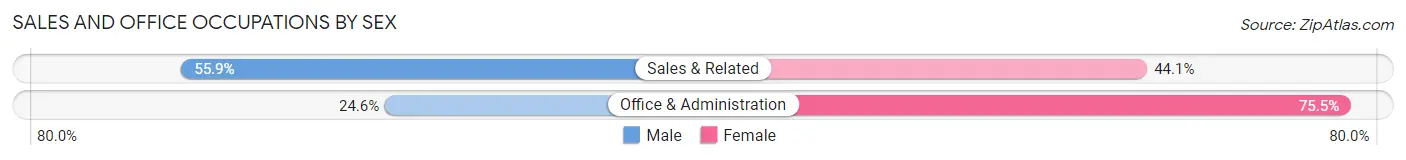
| Occupation | Male | Female |
| Sales & Related | 7,124 (55.9%) | 5,623 (44.1%) |
| Office & Administration | 3,787 (24.5%) | 11,637 (75.4%) |
| Total (Category) | 10,911 (38.7%) | 17,260 (61.3%) |
| Total (Overall) | 71,527 (52.6%) | 64,473 (47.4%) |
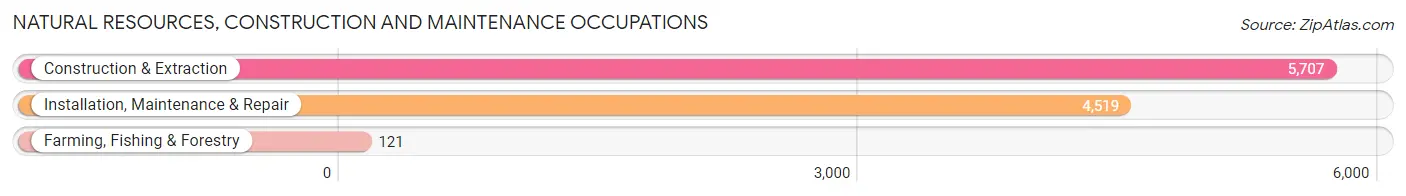
Natural Resources, Construction and Maintenance Occupations
The most common Natural Resources, Construction and Maintenance occupations in Harford County are Construction & Extraction (5,707 | 4.2%), Installation, Maintenance & Repair (4,519 | 3.3%), and Farming, Fishing & Forestry (121 | 0.1%).
Natural Resources, Construction and Maintenance Occupations by Sex
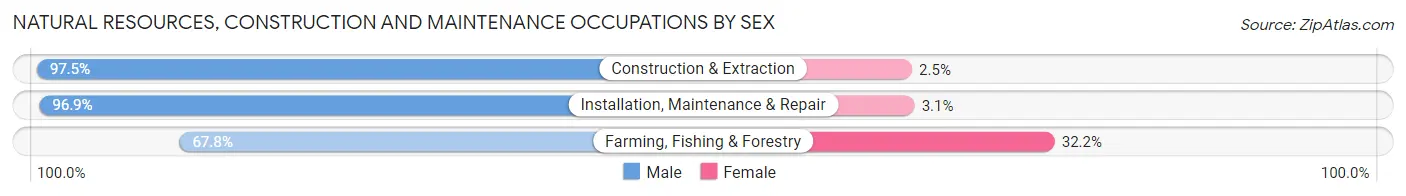
| Occupation | Male | Female |
| Farming, Fishing & Forestry | 82 (67.8%) | 39 (32.2%) |
| Construction & Extraction | 5,562 (97.5%) | 145 (2.5%) |
| Installation, Maintenance & Repair | 4,380 (96.9%) | 139 (3.1%) |
| Total (Category) | 10,024 (96.9%) | 323 (3.1%) |
| Total (Overall) | 71,527 (52.6%) | 64,473 (47.4%) |
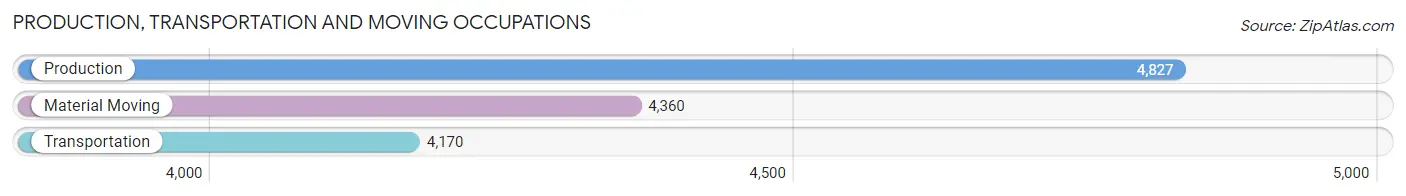
Production, Transportation and Moving Occupations
The most common Production, Transportation and Moving occupations in Harford County are Production (4,827 | 3.5%), Material Moving (4,360 | 3.2%), and Transportation (4,170 | 3.1%).
Production, Transportation and Moving Occupations by Sex
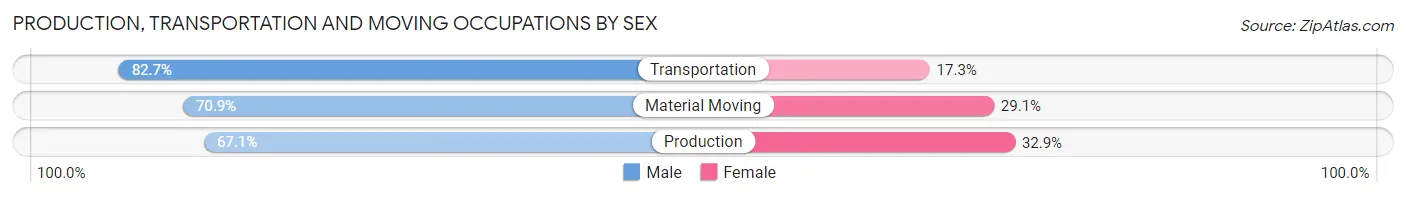
| Occupation | Male | Female |
| Production | 3,238 (67.1%) | 1,589 (32.9%) |
| Transportation | 3,450 (82.7%) | 720 (17.3%) |
| Material Moving | 3,093 (70.9%) | 1,267 (29.1%) |
| Total (Category) | 9,781 (73.2%) | 3,576 (26.8%) |
| Total (Overall) | 71,527 (52.6%) | 64,473 (47.4%) |
Employment Industries by Sex in Harford County
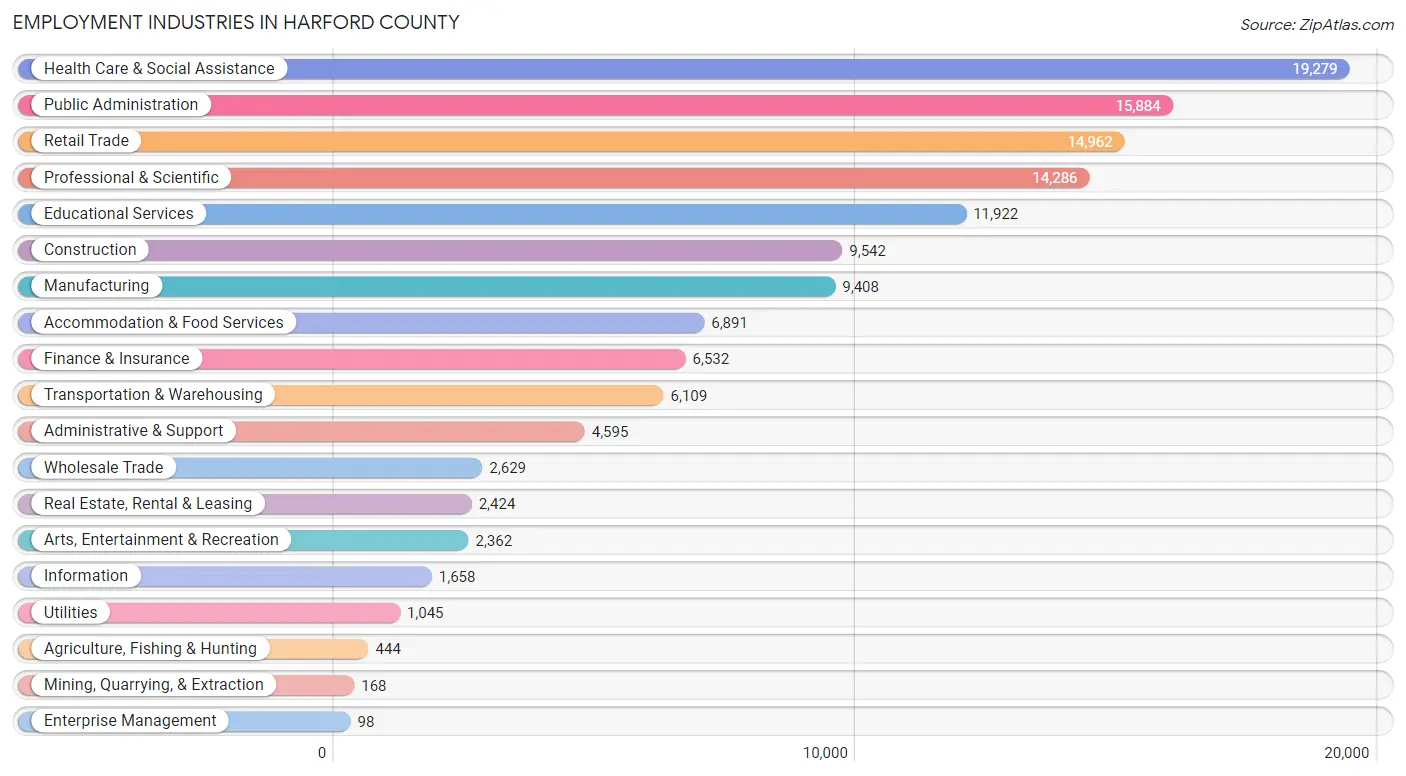
Employment Industries in Harford County
The major employment industries in Harford County include Health Care & Social Assistance (19,279 | 14.2%), Public Administration (15,884 | 11.7%), Retail Trade (14,962 | 11.0%), Professional & Scientific (14,286 | 10.5%), and Educational Services (11,922 | 8.8%).
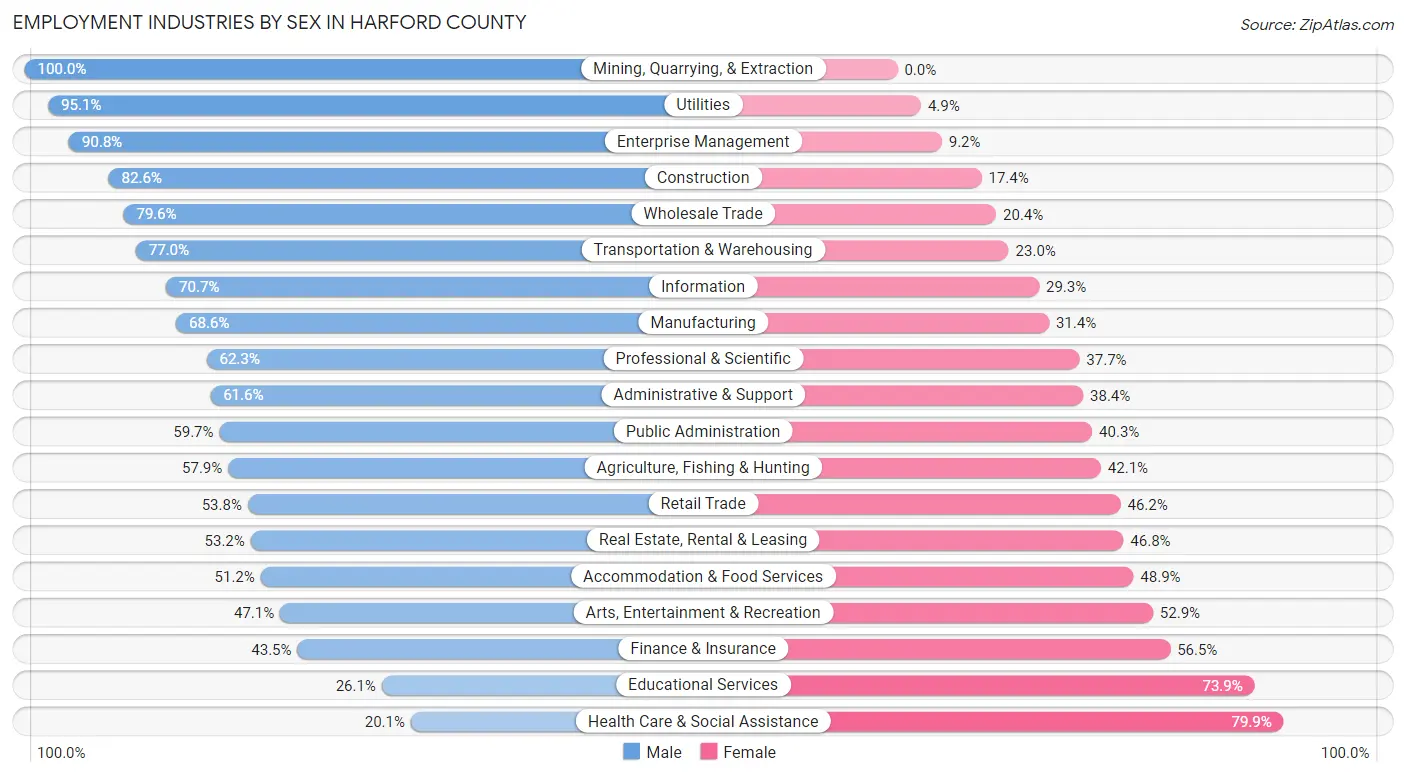
Employment Industries by Sex in Harford County
The Harford County industries that see more men than women are Mining, Quarrying, & Extraction (100.0%), Utilities (95.1%), and Enterprise Management (90.8%), whereas the industries that tend to have a higher number of women are Health Care & Social Assistance (79.9%), Educational Services (73.9%), and Finance & Insurance (56.5%).
| Industry | Male | Female |
| Agriculture, Fishing & Hunting | 257 (57.9%) | 187 (42.1%) |
| Mining, Quarrying, & Extraction | 168 (100.0%) | 0 (0.0%) |
| Construction | 7,881 (82.6%) | 1,661 (17.4%) |
| Manufacturing | 6,457 (68.6%) | 2,951 (31.4%) |
| Wholesale Trade | 2,092 (79.6%) | 537 (20.4%) |
| Retail Trade | 8,052 (53.8%) | 6,910 (46.2%) |
| Transportation & Warehousing | 4,703 (77.0%) | 1,406 (23.0%) |
| Utilities | 994 (95.1%) | 51 (4.9%) |
| Information | 1,172 (70.7%) | 486 (29.3%) |
| Finance & Insurance | 2,844 (43.5%) | 3,688 (56.5%) |
| Real Estate, Rental & Leasing | 1,290 (53.2%) | 1,134 (46.8%) |
| Professional & Scientific | 8,904 (62.3%) | 5,382 (37.7%) |
| Enterprise Management | 89 (90.8%) | 9 (9.2%) |
| Administrative & Support | 2,829 (61.6%) | 1,766 (38.4%) |
| Educational Services | 3,111 (26.1%) | 8,811 (73.9%) |
| Health Care & Social Assistance | 3,869 (20.1%) | 15,410 (79.9%) |
| Arts, Entertainment & Recreation | 1,113 (47.1%) | 1,249 (52.9%) |
| Accommodation & Food Services | 3,525 (51.1%) | 3,366 (48.8%) |
| Public Administration | 9,481 (59.7%) | 6,403 (40.3%) |
| Total | 71,527 (52.6%) | 64,473 (47.4%) |
Education in Harford County
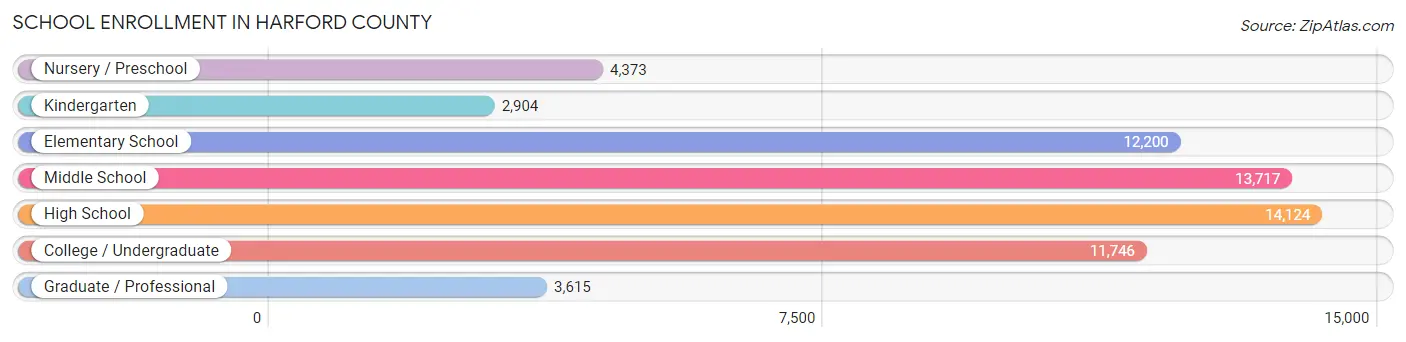
School Enrollment in Harford County
The most common levels of schooling among the 62,679 students in Harford County are high school (14,124 | 22.5%), middle school (13,717 | 21.9%), and elementary school (12,200 | 19.5%).
| School Level | # Students | % Students |
| Nursery / Preschool | 4,373 | 7.0% |
| Kindergarten | 2,904 | 4.6% |
| Elementary School | 12,200 | 19.5% |
| Middle School | 13,717 | 21.9% |
| High School | 14,124 | 22.5% |
| College / Undergraduate | 11,746 | 18.7% |
| Graduate / Professional | 3,615 | 5.8% |
| Total | 62,679 | 100.0% |
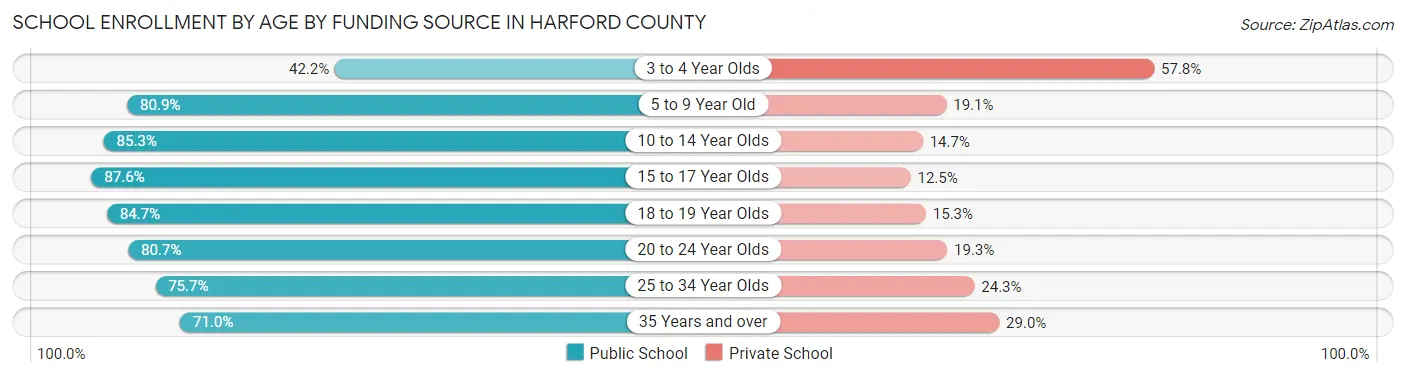
School Enrollment by Age by Funding Source in Harford County
Out of a total of 62,679 students who are enrolled in schools in Harford County, 12,160 (19.4%) attend a private institution, while the remaining 50,519 (80.6%) are enrolled in public schools. The age group of 3 to 4 year olds has the highest likelihood of being enrolled in private schools, with 1,745 (57.8% in the age bracket) enrolled. Conversely, the age group of 15 to 17 year olds has the lowest likelihood of being enrolled in a private school, with 8,958 (87.5% in the age bracket) attending a public institution.
| Age Bracket | Public School | Private School |
| 3 to 4 Year Olds | 1,273 (42.2%) | 1,745 (57.8%) |
| 5 to 9 Year Old | 12,178 (80.9%) | 2,877 (19.1%) |
| 10 to 14 Year Olds | 14,171 (85.3%) | 2,446 (14.7%) |
| 15 to 17 Year Olds | 8,958 (87.5%) | 1,274 (12.4%) |
| 18 to 19 Year Olds | 3,662 (84.7%) | 662 (15.3%) |
| 20 to 24 Year Olds | 4,563 (80.7%) | 1,089 (19.3%) |
| 25 to 34 Year Olds | 2,872 (75.7%) | 924 (24.3%) |
| 35 Years and over | 2,831 (71.0%) | 1,154 (29.0%) |
| Total | 50,519 (80.6%) | 12,160 (19.4%) |
Educational Attainment by Field of Study in Harford County
Business (15,755 | 20.7%), science & technology (8,762 | 11.5%), education (8,167 | 10.8%), engineering (6,403 | 8.4%), and social sciences (5,773 | 7.6%) are the most common fields of study among 75,922 individuals in Harford County who have obtained a bachelor's degree or higher.
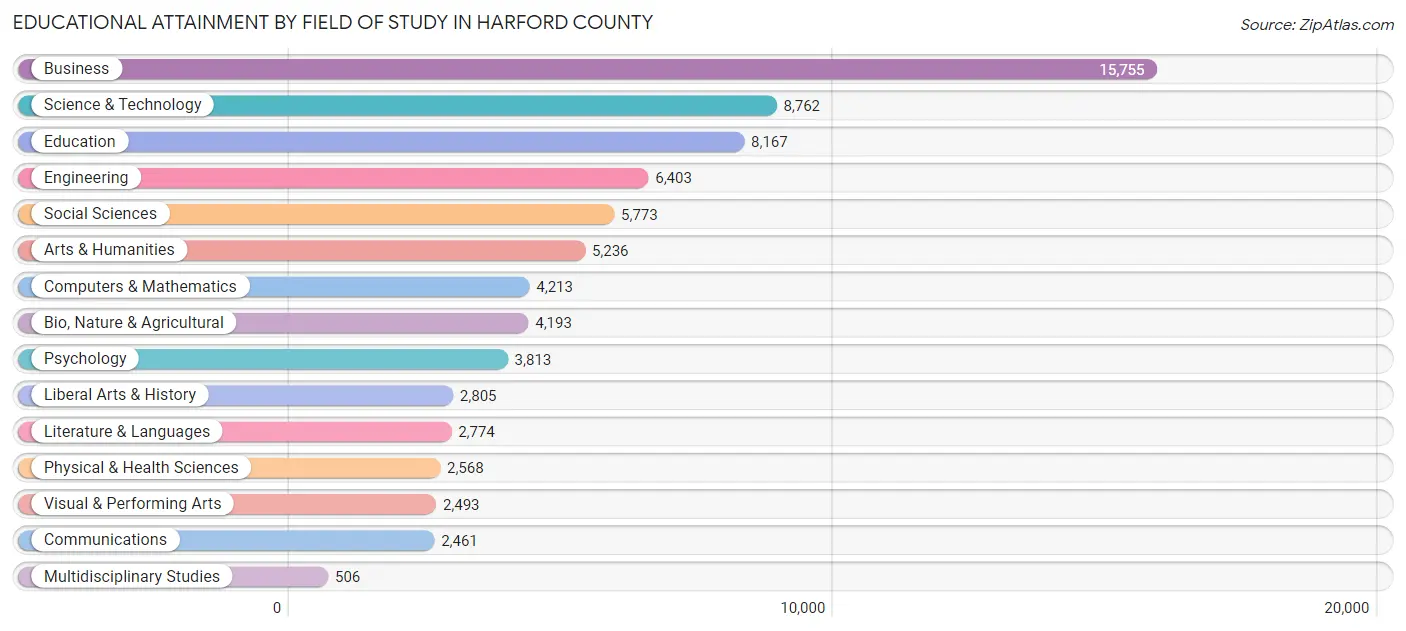
| Field of Study | # Graduates | % Graduates |
| Computers & Mathematics | 4,213 | 5.6% |
| Bio, Nature & Agricultural | 4,193 | 5.5% |
| Physical & Health Sciences | 2,568 | 3.4% |
| Psychology | 3,813 | 5.0% |
| Social Sciences | 5,773 | 7.6% |
| Engineering | 6,403 | 8.4% |
| Multidisciplinary Studies | 506 | 0.7% |
| Science & Technology | 8,762 | 11.5% |
| Business | 15,755 | 20.7% |
| Education | 8,167 | 10.8% |
| Literature & Languages | 2,774 | 3.6% |
| Liberal Arts & History | 2,805 | 3.7% |
| Visual & Performing Arts | 2,493 | 3.3% |
| Communications | 2,461 | 3.2% |
| Arts & Humanities | 5,236 | 6.9% |
| Total | 75,922 | 100.0% |
Transportation & Commute in Harford County
Vehicle Availability by Sex in Harford County
The most prevalent vehicle ownership categories in Harford County are males with 2 vehicles (29,984, accounting for 42.2%) and females with 2 vehicles (26,075, making up 47.2%).
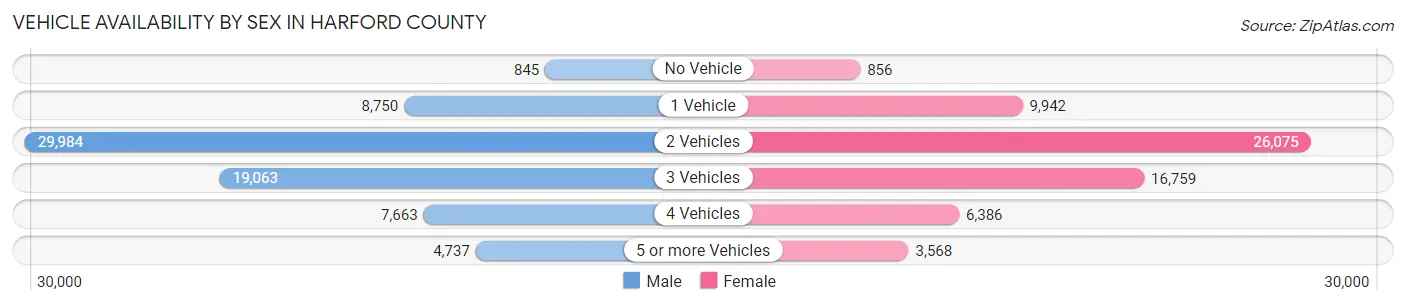
| Vehicles Available | Male | Female |
| No Vehicle | 845 (1.2%) | 856 (1.3%) |
| 1 Vehicle | 8,750 (12.3%) | 9,942 (15.6%) |
| 2 Vehicles | 29,984 (42.2%) | 26,075 (41.0%) |
| 3 Vehicles | 19,063 (26.8%) | 16,759 (26.4%) |
| 4 Vehicles | 7,663 (10.8%) | 6,386 (10.0%) |
| 5 or more Vehicles | 4,737 (6.7%) | 3,568 (5.6%) |
| Total | 71,042 (100.0%) | 63,586 (100.0%) |
Commute Time in Harford County
The most frequently occuring commute durations in Harford County are 45 to 59 minutes (18,187 commuters, 15.3%), 30 to 34 minutes (16,063 commuters, 13.5%), and 15 to 19 minutes (13,985 commuters, 11.7%).
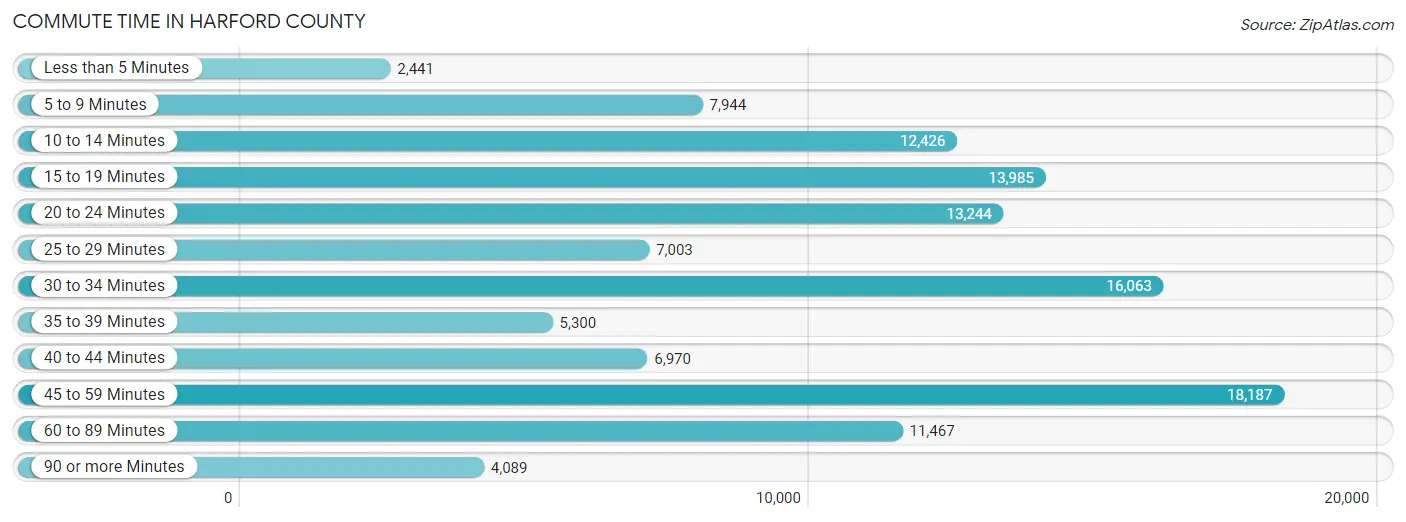
| Commute Time | # Commuters | % Commuters |
| Less than 5 Minutes | 2,441 | 2.1% |
| 5 to 9 Minutes | 7,944 | 6.7% |
| 10 to 14 Minutes | 12,426 | 10.4% |
| 15 to 19 Minutes | 13,985 | 11.7% |
| 20 to 24 Minutes | 13,244 | 11.1% |
| 25 to 29 Minutes | 7,003 | 5.9% |
| 30 to 34 Minutes | 16,063 | 13.5% |
| 35 to 39 Minutes | 5,300 | 4.4% |
| 40 to 44 Minutes | 6,970 | 5.9% |
| 45 to 59 Minutes | 18,187 | 15.3% |
| 60 to 89 Minutes | 11,467 | 9.6% |
| 90 or more Minutes | 4,089 | 3.4% |
Commute Time by Sex in Harford County
The most common commute times in Harford County are 45 to 59 minutes (10,366 commuters, 16.3%) for males and 45 to 59 minutes (7,821 commuters, 14.1%) for females.
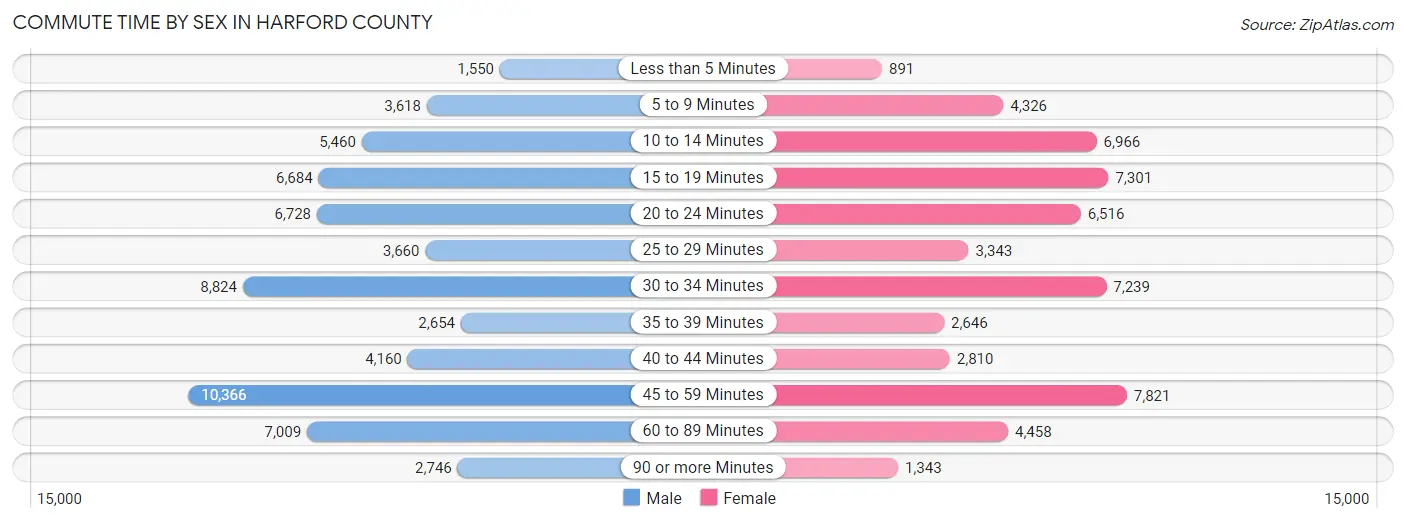
| Commute Time | Male | Female |
| Less than 5 Minutes | 1,550 (2.4%) | 891 (1.6%) |
| 5 to 9 Minutes | 3,618 (5.7%) | 4,326 (7.8%) |
| 10 to 14 Minutes | 5,460 (8.6%) | 6,966 (12.5%) |
| 15 to 19 Minutes | 6,684 (10.5%) | 7,301 (13.1%) |
| 20 to 24 Minutes | 6,728 (10.6%) | 6,516 (11.7%) |
| 25 to 29 Minutes | 3,660 (5.8%) | 3,343 (6.0%) |
| 30 to 34 Minutes | 8,824 (13.9%) | 7,239 (13.0%) |
| 35 to 39 Minutes | 2,654 (4.2%) | 2,646 (4.8%) |
| 40 to 44 Minutes | 4,160 (6.6%) | 2,810 (5.1%) |
| 45 to 59 Minutes | 10,366 (16.3%) | 7,821 (14.1%) |
| 60 to 89 Minutes | 7,009 (11.0%) | 4,458 (8.0%) |
| 90 or more Minutes | 2,746 (4.3%) | 1,343 (2.4%) |
Time of Departure to Work by Sex in Harford County
The most frequent times of departure to work in Harford County are 7:00 AM to 7:29 AM (9,316, 14.7%) for males and 7:00 AM to 7:29 AM (9,023, 16.2%) for females.
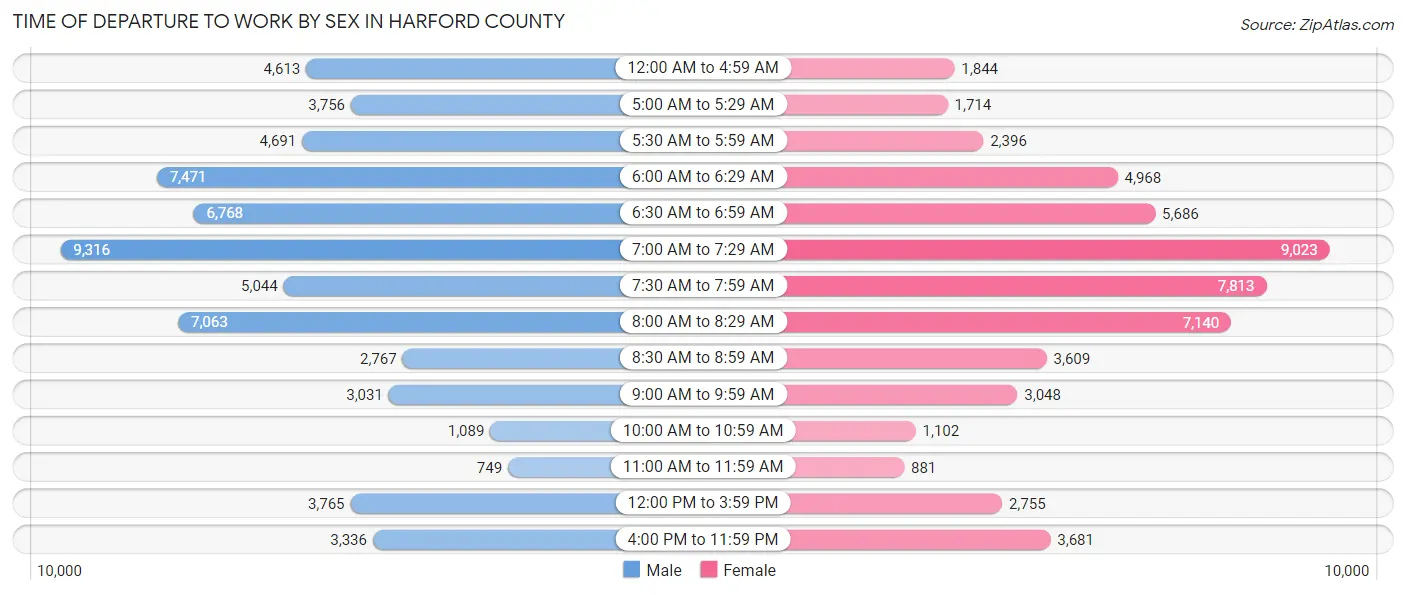
| Time of Departure | Male | Female |
| 12:00 AM to 4:59 AM | 4,613 (7.3%) | 1,844 (3.3%) |
| 5:00 AM to 5:29 AM | 3,756 (5.9%) | 1,714 (3.1%) |
| 5:30 AM to 5:59 AM | 4,691 (7.4%) | 2,396 (4.3%) |
| 6:00 AM to 6:29 AM | 7,471 (11.8%) | 4,968 (8.9%) |
| 6:30 AM to 6:59 AM | 6,768 (10.7%) | 5,686 (10.2%) |
| 7:00 AM to 7:29 AM | 9,316 (14.7%) | 9,023 (16.2%) |
| 7:30 AM to 7:59 AM | 5,044 (8.0%) | 7,813 (14.0%) |
| 8:00 AM to 8:29 AM | 7,063 (11.1%) | 7,140 (12.8%) |
| 8:30 AM to 8:59 AM | 2,767 (4.4%) | 3,609 (6.5%) |
| 9:00 AM to 9:59 AM | 3,031 (4.8%) | 3,048 (5.5%) |
| 10:00 AM to 10:59 AM | 1,089 (1.7%) | 1,102 (2.0%) |
| 11:00 AM to 11:59 AM | 749 (1.2%) | 881 (1.6%) |
| 12:00 PM to 3:59 PM | 3,765 (5.9%) | 2,755 (5.0%) |
| 4:00 PM to 11:59 PM | 3,336 (5.3%) | 3,681 (6.6%) |
| Total | 63,459 (100.0%) | 55,660 (100.0%) |
Housing Occupancy in Harford County
Occupancy by Ownership in Harford County
Of the total 98,822 dwellings in Harford County, owner-occupied units account for 79,011 (79.9%), while renter-occupied units make up 19,811 (20.1%).
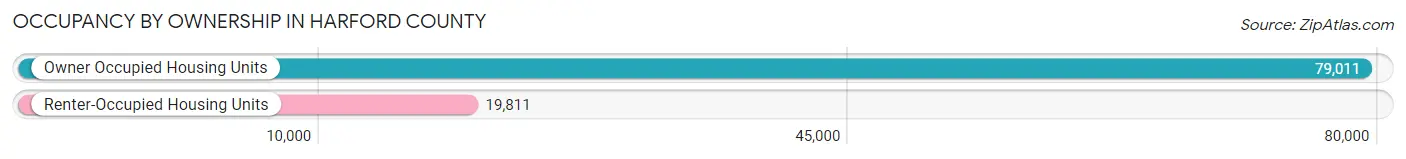
| Occupancy | # Housing Units | % Housing Units |
| Owner Occupied Housing Units | 79,011 | 79.9% |
| Renter-Occupied Housing Units | 19,811 | 20.1% |
| Total Occupied Housing Units | 98,822 | 100.0% |
Occupancy by Household Size in Harford County
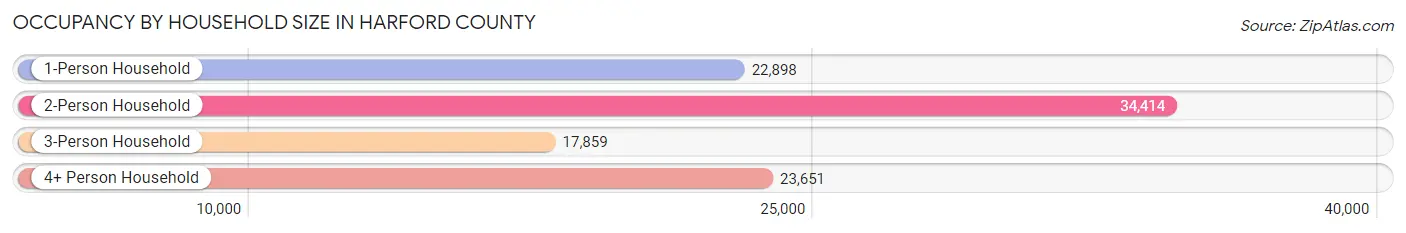
| Household Size | # Housing Units | % Housing Units |
| 1-Person Household | 22,898 | 23.2% |
| 2-Person Household | 34,414 | 34.8% |
| 3-Person Household | 17,859 | 18.1% |
| 4+ Person Household | 23,651 | 23.9% |
| Total Housing Units | 98,822 | 100.0% |
Occupancy by Ownership by Household Size in Harford County
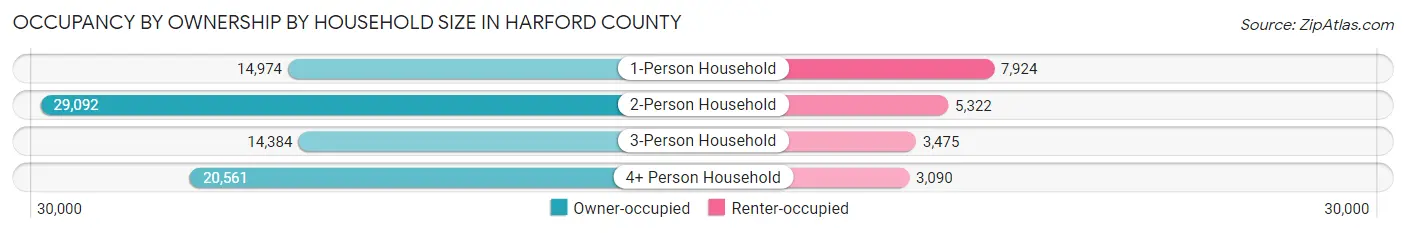
| Household Size | Owner-occupied | Renter-occupied |
| 1-Person Household | 14,974 (65.4%) | 7,924 (34.6%) |
| 2-Person Household | 29,092 (84.5%) | 5,322 (15.5%) |
| 3-Person Household | 14,384 (80.5%) | 3,475 (19.5%) |
| 4+ Person Household | 20,561 (86.9%) | 3,090 (13.1%) |
| Total Housing Units | 79,011 (79.9%) | 19,811 (20.1%) |
Occupancy by Educational Attainment in Harford County
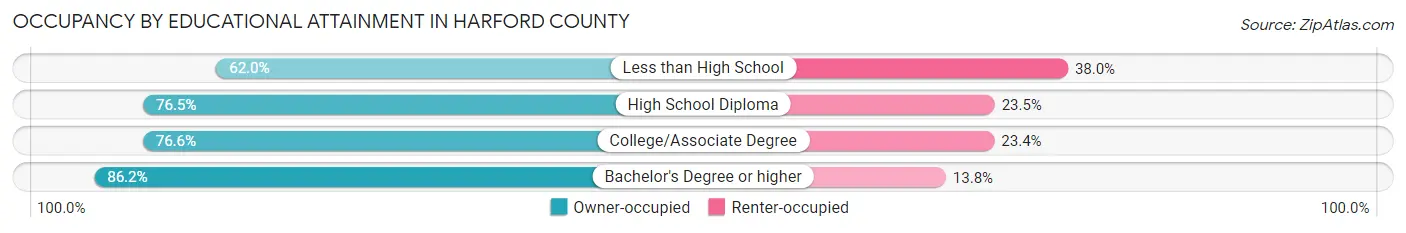
| Household Size | Owner-occupied | Renter-occupied |
| Less than High School | 3,009 (62.0%) | 1,846 (38.0%) |
| High School Diploma | 16,142 (76.5%) | 4,959 (23.5%) |
| College/Associate Degree | 23,353 (76.6%) | 7,148 (23.4%) |
| Bachelor's Degree or higher | 36,507 (86.2%) | 5,858 (13.8%) |
Occupancy by Age of Householder in Harford County
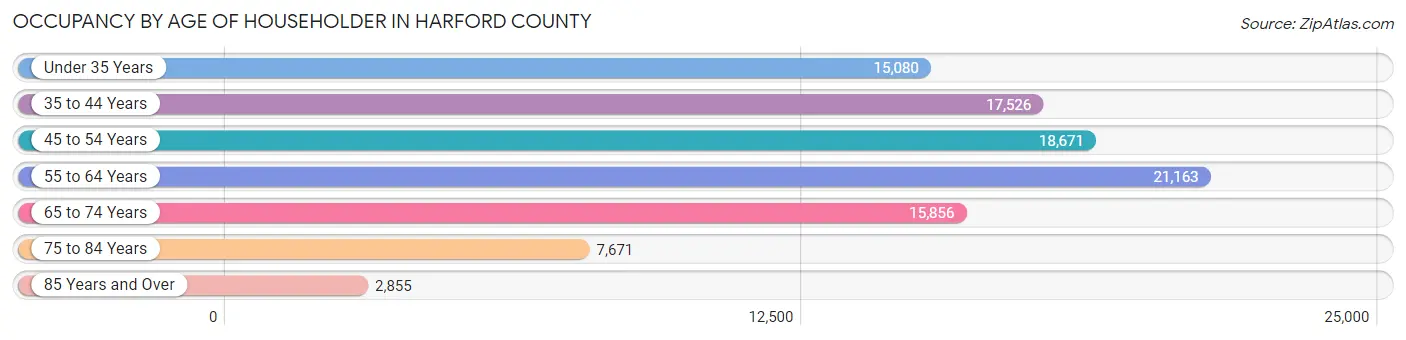
| Age Bracket | # Households | % Households |
| Under 35 Years | 15,080 | 15.3% |
| 35 to 44 Years | 17,526 | 17.7% |
| 45 to 54 Years | 18,671 | 18.9% |
| 55 to 64 Years | 21,163 | 21.4% |
| 65 to 74 Years | 15,856 | 16.1% |
| 75 to 84 Years | 7,671 | 7.8% |
| 85 Years and Over | 2,855 | 2.9% |
| Total | 98,822 | 100.0% |
Housing Finances in Harford County
Median Income by Occupancy in Harford County
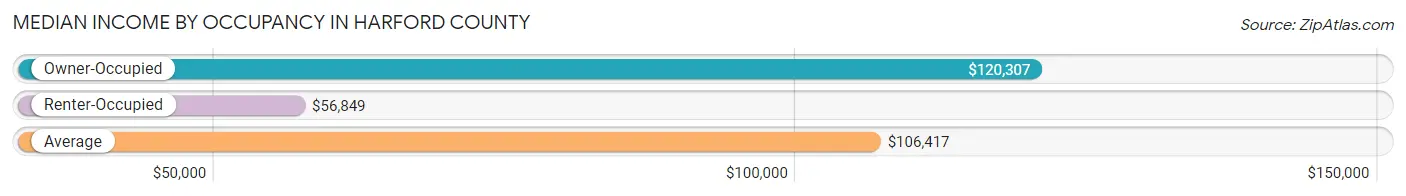
| Occupancy Type | # Households | Median Income |
| Owner-Occupied | 79,011 (79.9%) | $120,307 |
| Renter-Occupied | 19,811 (20.1%) | $56,849 |
| Average | 98,822 (100.0%) | $106,417 |
Occupancy by Householder Income Bracket in Harford County
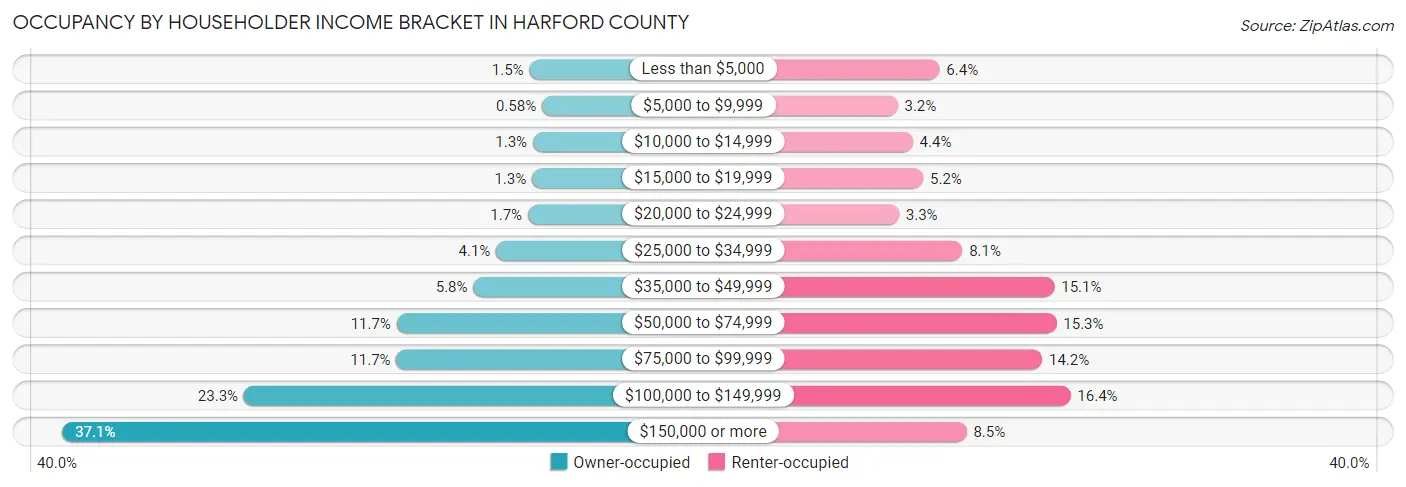
| Income Bracket | Owner-occupied | Renter-occupied |
| Less than $5,000 | 1,215 (1.5%) | 1,266 (6.4%) |
| $5,000 to $9,999 | 459 (0.6%) | 633 (3.2%) |
| $10,000 to $14,999 | 1,005 (1.3%) | 862 (4.3%) |
| $15,000 to $19,999 | 1,056 (1.3%) | 1,021 (5.1%) |
| $20,000 to $24,999 | 1,302 (1.7%) | 654 (3.3%) |
| $25,000 to $34,999 | 3,214 (4.1%) | 1,610 (8.1%) |
| $35,000 to $49,999 | 4,588 (5.8%) | 3,000 (15.1%) |
| $50,000 to $74,999 | 9,202 (11.7%) | 3,032 (15.3%) |
| $75,000 to $99,999 | 9,222 (11.7%) | 2,815 (14.2%) |
| $100,000 to $149,999 | 18,402 (23.3%) | 3,243 (16.4%) |
| $150,000 or more | 29,346 (37.1%) | 1,675 (8.5%) |
| Total | 79,011 (100.0%) | 19,811 (100.0%) |
Monthly Housing Cost Tiers in Harford County
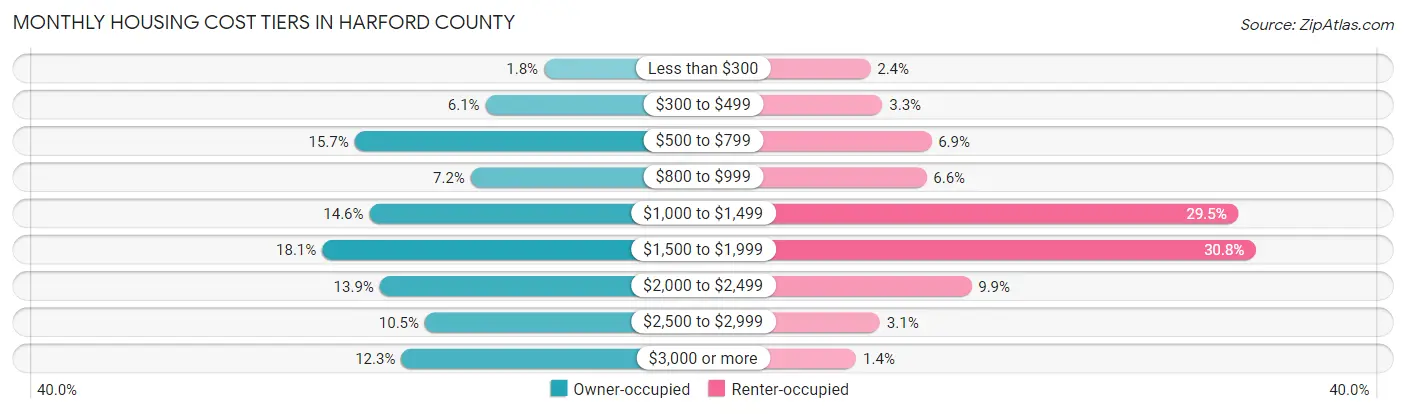
| Monthly Cost | Owner-occupied | Renter-occupied |
| Less than $300 | 1,383 (1.8%) | 480 (2.4%) |
| $300 to $499 | 4,792 (6.1%) | 655 (3.3%) |
| $500 to $799 | 12,406 (15.7%) | 1,369 (6.9%) |
| $800 to $999 | 5,646 (7.1%) | 1,298 (6.6%) |
| $1,000 to $1,499 | 11,546 (14.6%) | 5,852 (29.5%) |
| $1,500 to $1,999 | 14,297 (18.1%) | 6,109 (30.8%) |
| $2,000 to $2,499 | 10,946 (13.9%) | 1,954 (9.9%) |
| $2,500 to $2,999 | 8,312 (10.5%) | 621 (3.1%) |
| $3,000 or more | 9,683 (12.3%) | 273 (1.4%) |
| Total | 79,011 (100.0%) | 19,811 (100.0%) |
Physical Housing Characteristics in Harford County
Housing Structures in Harford County
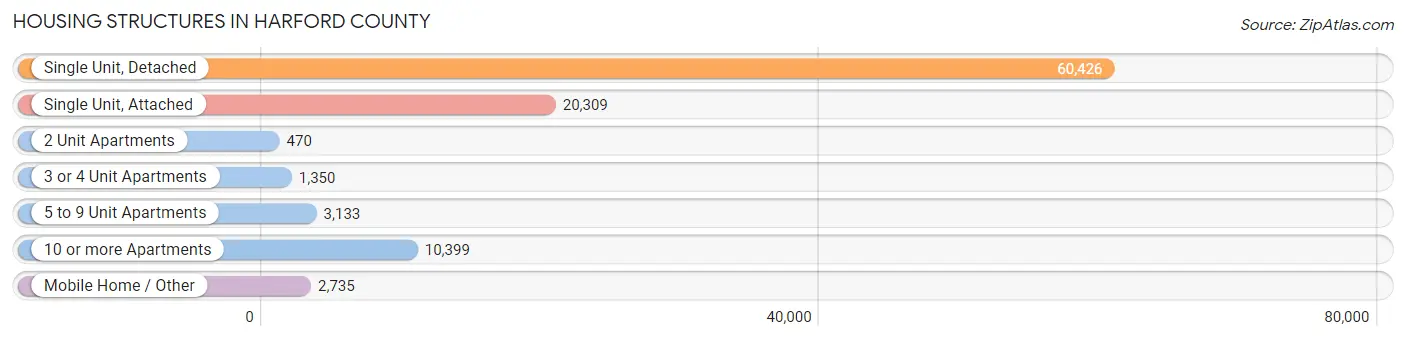
| Structure Type | # Housing Units | % Housing Units |
| Single Unit, Detached | 60,426 | 61.2% |
| Single Unit, Attached | 20,309 | 20.5% |
| 2 Unit Apartments | 470 | 0.5% |
| 3 or 4 Unit Apartments | 1,350 | 1.4% |
| 5 to 9 Unit Apartments | 3,133 | 3.2% |
| 10 or more Apartments | 10,399 | 10.5% |
| Mobile Home / Other | 2,735 | 2.8% |
| Total | 98,822 | 100.0% |
Housing Structures by Occupancy in Harford County
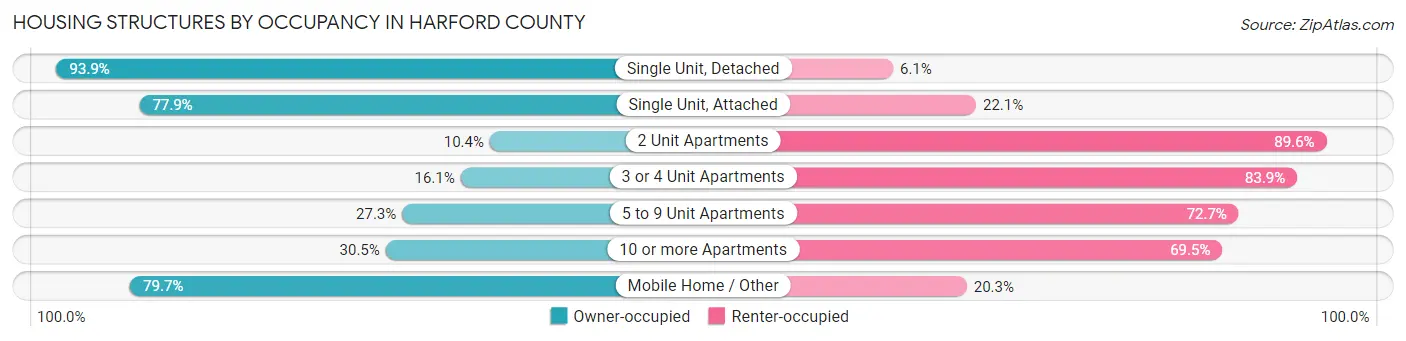
| Structure Type | Owner-occupied | Renter-occupied |
| Single Unit, Detached | 56,723 (93.9%) | 3,703 (6.1%) |
| Single Unit, Attached | 15,816 (77.9%) | 4,493 (22.1%) |
| 2 Unit Apartments | 49 (10.4%) | 421 (89.6%) |
| 3 or 4 Unit Apartments | 217 (16.1%) | 1,133 (83.9%) |
| 5 to 9 Unit Apartments | 856 (27.3%) | 2,277 (72.7%) |
| 10 or more Apartments | 3,171 (30.5%) | 7,228 (69.5%) |
| Mobile Home / Other | 2,179 (79.7%) | 556 (20.3%) |
| Total | 79,011 (79.9%) | 19,811 (20.1%) |
Housing Structures by Number of Rooms in Harford County
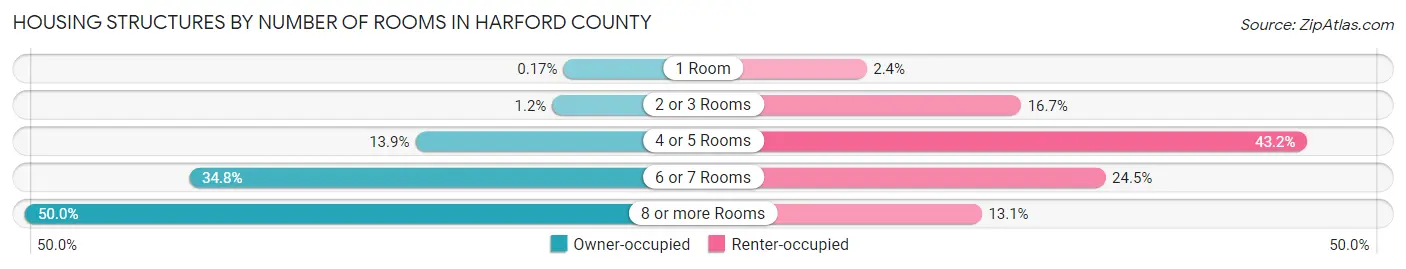
| Number of Rooms | Owner-occupied | Renter-occupied |
| 1 Room | 132 (0.2%) | 483 (2.4%) |
| 2 or 3 Rooms | 954 (1.2%) | 3,312 (16.7%) |
| 4 or 5 Rooms | 10,960 (13.9%) | 8,562 (43.2%) |
| 6 or 7 Rooms | 27,491 (34.8%) | 4,860 (24.5%) |
| 8 or more Rooms | 39,474 (50.0%) | 2,594 (13.1%) |
| Total | 79,011 (100.0%) | 19,811 (100.0%) |
Housing Structure by Heating Type in Harford County
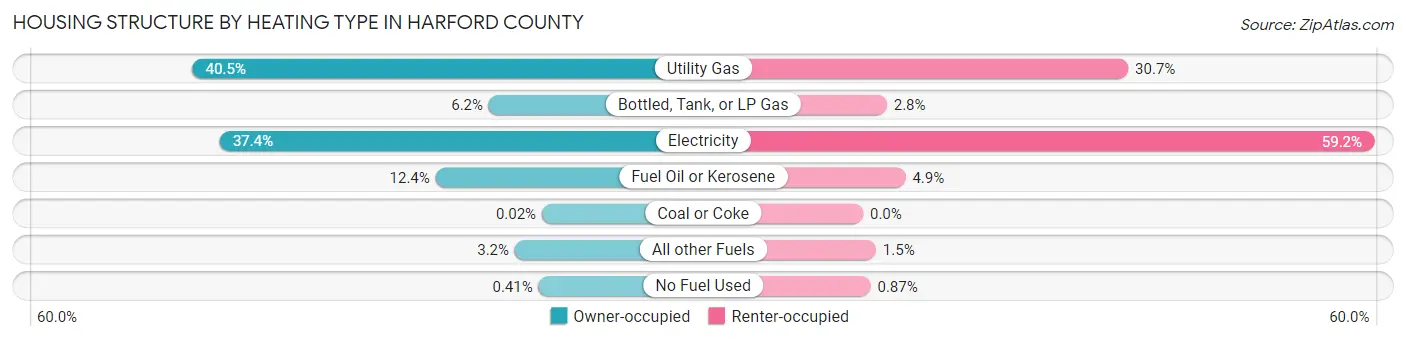
| Heating Type | Owner-occupied | Renter-occupied |
| Utility Gas | 32,018 (40.5%) | 6,090 (30.7%) |
| Bottled, Tank, or LP Gas | 4,875 (6.2%) | 545 (2.8%) |
| Electricity | 29,526 (37.4%) | 11,733 (59.2%) |
| Fuel Oil or Kerosene | 9,760 (12.3%) | 975 (4.9%) |
| Coal or Coke | 14 (0.0%) | 0 (0.0%) |
| All other Fuels | 2,496 (3.2%) | 296 (1.5%) |
| No Fuel Used | 322 (0.4%) | 172 (0.9%) |
| Total | 79,011 (100.0%) | 19,811 (100.0%) |
Household Vehicle Usage in Harford County
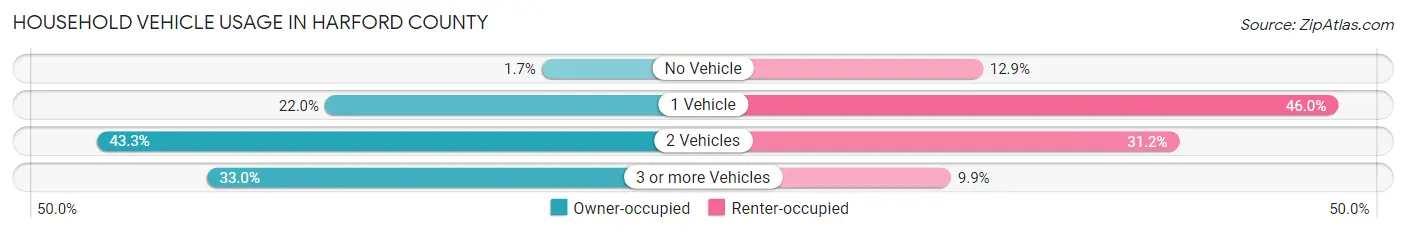
| Vehicles per Household | Owner-occupied | Renter-occupied |
| No Vehicle | 1,369 (1.7%) | 2,549 (12.9%) |
| 1 Vehicle | 17,356 (22.0%) | 9,119 (46.0%) |
| 2 Vehicles | 34,202 (43.3%) | 6,183 (31.2%) |
| 3 or more Vehicles | 26,084 (33.0%) | 1,960 (9.9%) |
| Total | 79,011 (100.0%) | 19,811 (100.0%) |
Real Estate & Mortgages in Harford County
Real Estate and Mortgage Overview in Harford County
| Characteristic | Without Mortgage | With Mortgage |
| Housing Units | 23,643 | 55,368 |
| Median Property Value | $332,800 | $359,100 |
| Median Household Income | $85,495 | $23,451 |
| Monthly Housing Costs | $649 | $9,642 |
| Real Estate Taxes | $3,343 | $1,475 |
Property Value by Mortgage Status in Harford County
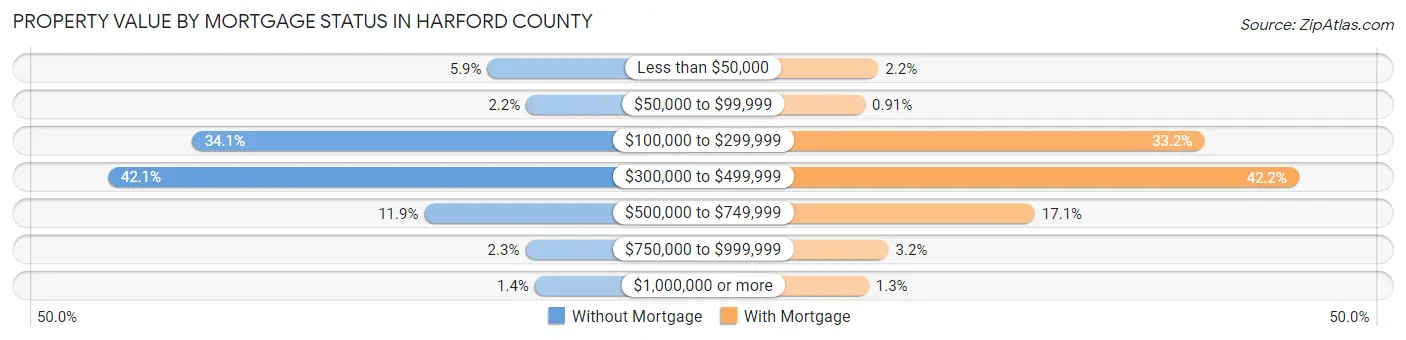
| Property Value | Without Mortgage | With Mortgage |
| Less than $50,000 | 1,403 (5.9%) | 1,207 (2.2%) |
| $50,000 to $99,999 | 530 (2.2%) | 503 (0.9%) |
| $100,000 to $299,999 | 8,057 (34.1%) | 18,384 (33.2%) |
| $300,000 to $499,999 | 9,946 (42.1%) | 23,370 (42.2%) |
| $500,000 to $749,999 | 2,823 (11.9%) | 9,459 (17.1%) |
| $750,000 to $999,999 | 549 (2.3%) | 1,744 (3.2%) |
| $1,000,000 or more | 335 (1.4%) | 701 (1.3%) |
| Total | 23,643 (100.0%) | 55,368 (100.0%) |
Household Income by Mortgage Status in Harford County
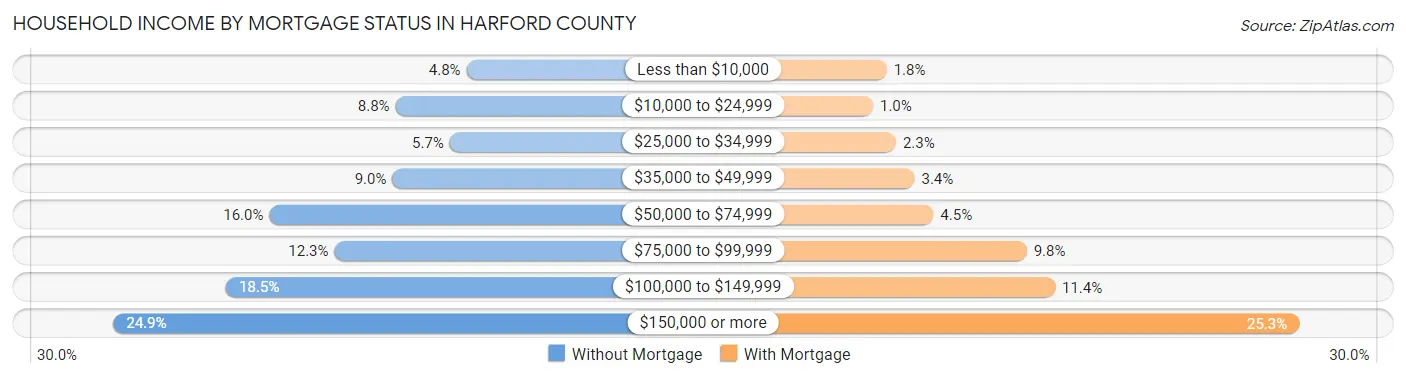
| Household Income | Without Mortgage | With Mortgage |
| Less than $10,000 | 1,122 (4.8%) | 985 (1.8%) |
| $10,000 to $24,999 | 2,083 (8.8%) | 552 (1.0%) |
| $25,000 to $34,999 | 1,350 (5.7%) | 1,280 (2.3%) |
| $35,000 to $49,999 | 2,125 (9.0%) | 1,864 (3.4%) |
| $50,000 to $74,999 | 3,788 (16.0%) | 2,463 (4.4%) |
| $75,000 to $99,999 | 2,908 (12.3%) | 5,414 (9.8%) |
| $100,000 to $149,999 | 4,372 (18.5%) | 6,314 (11.4%) |
| $150,000 or more | 5,895 (24.9%) | 14,030 (25.3%) |
| Total | 23,643 (100.0%) | 55,368 (100.0%) |
Property Value to Household Income Ratio in Harford County
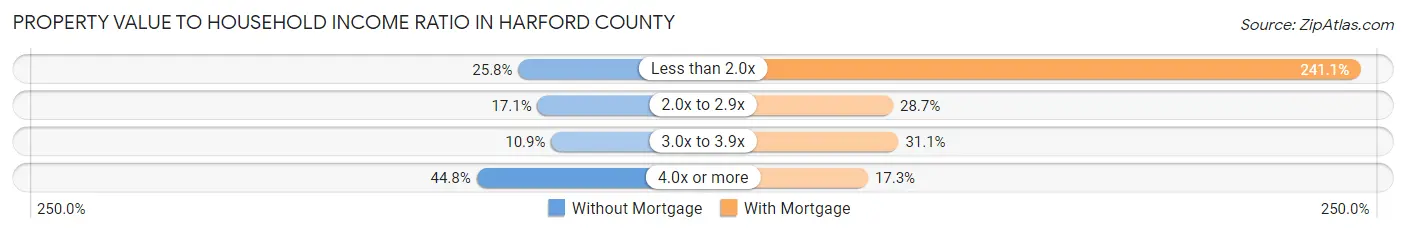
| Value-to-Income Ratio | Without Mortgage | With Mortgage |
| Less than 2.0x | 6,103 (25.8%) | 133,489 (241.1%) |
| 2.0x to 2.9x | 4,053 (17.1%) | 15,870 (28.7%) |
| 3.0x to 3.9x | 2,568 (10.9%) | 17,223 (31.1%) |
| 4.0x or more | 10,595 (44.8%) | 9,558 (17.3%) |
| Total | 23,643 (100.0%) | 55,368 (100.0%) |
Real Estate Taxes by Mortgage Status in Harford County

| Property Taxes | Without Mortgage | With Mortgage |
| Less than $800 | 504 (2.1%) | 177 (0.3%) |
| $800 to $1,499 | 1,288 (5.4%) | 1,769 (3.2%) |
| $800 to $1,499 | 19,921 (84.3%) | 3,202 (5.8%) |
| Total | 23,643 (100.0%) | 55,368 (100.0%) |
Health & Disability in Harford County
Health Insurance Coverage by Age in Harford County
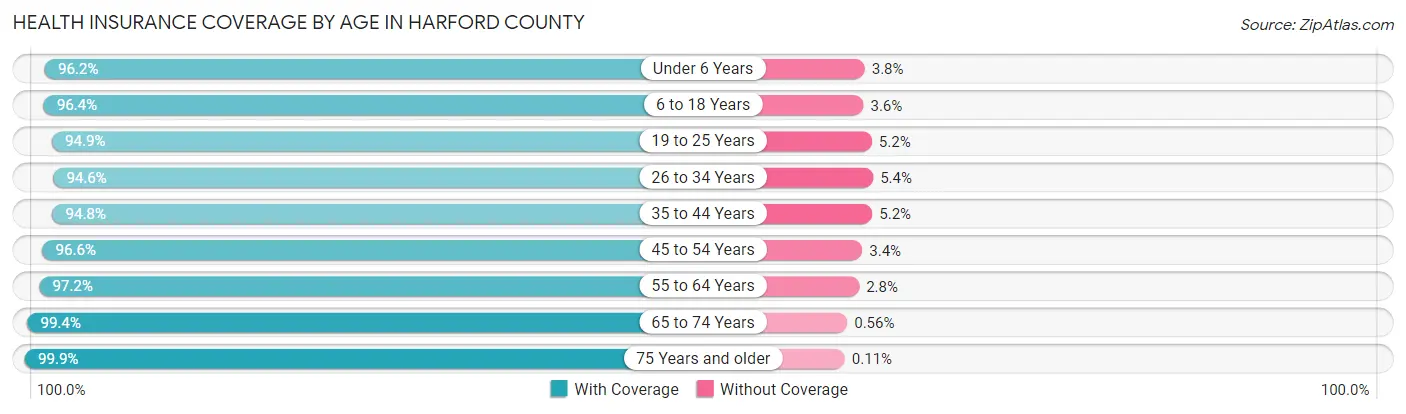
| Age Bracket | With Coverage | Without Coverage |
| Under 6 Years | 16,814 (96.2%) | 668 (3.8%) |
| 6 to 18 Years | 42,168 (96.4%) | 1,571 (3.6%) |
| 19 to 25 Years | 19,156 (94.9%) | 1,041 (5.1%) |
| 26 to 34 Years | 27,250 (94.6%) | 1,551 (5.4%) |
| 35 to 44 Years | 31,671 (94.8%) | 1,747 (5.2%) |
| 45 to 54 Years | 33,564 (96.6%) | 1,172 (3.4%) |
| 55 to 64 Years | 36,696 (97.2%) | 1,048 (2.8%) |
| 65 to 74 Years | 25,830 (99.4%) | 145 (0.6%) |
| 75 Years and older | 16,828 (99.9%) | 19 (0.1%) |
| Total | 249,977 (96.5%) | 8,962 (3.5%) |
Health Insurance Coverage by Citizenship Status in Harford County
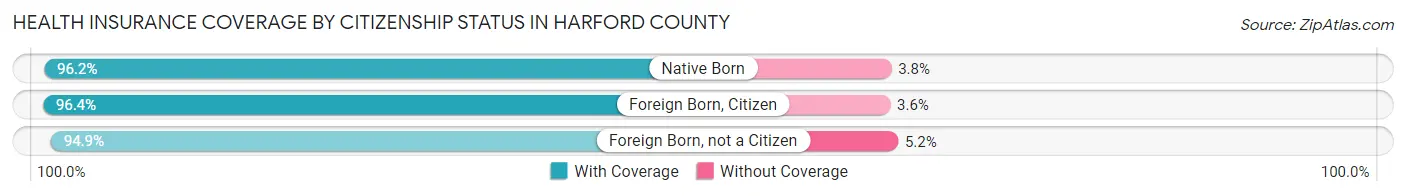
| Citizenship Status | With Coverage | Without Coverage |
| Native Born | 16,814 (96.2%) | 668 (3.8%) |
| Foreign Born, Citizen | 42,168 (96.4%) | 1,571 (3.6%) |
| Foreign Born, not a Citizen | 19,156 (94.9%) | 1,041 (5.1%) |
Health Insurance Coverage by Household Income in Harford County
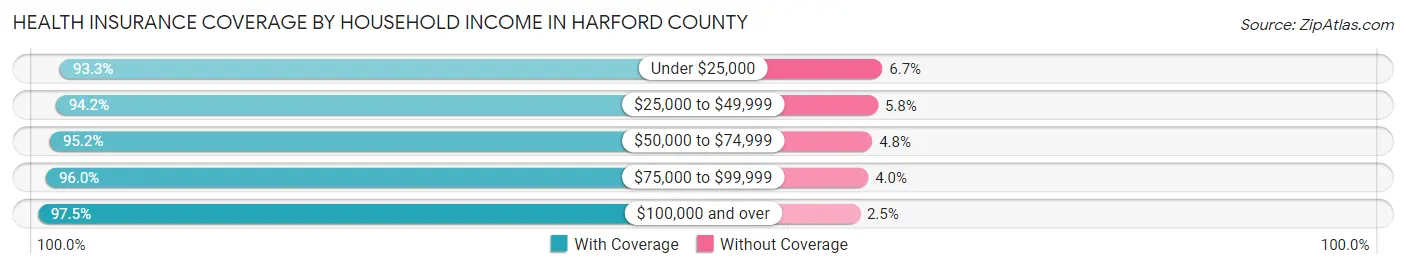
| Household Income | With Coverage | Without Coverage |
| Under $25,000 | 14,875 (93.3%) | 1,061 (6.7%) |
| $25,000 to $49,999 | 23,382 (94.2%) | 1,450 (5.8%) |
| $50,000 to $74,999 | 24,832 (95.2%) | 1,240 (4.8%) |
| $75,000 to $99,999 | 28,352 (96.0%) | 1,184 (4.0%) |
| $100,000 and over | 158,182 (97.5%) | 4,011 (2.5%) |
Public vs Private Health Insurance Coverage by Age in Harford County
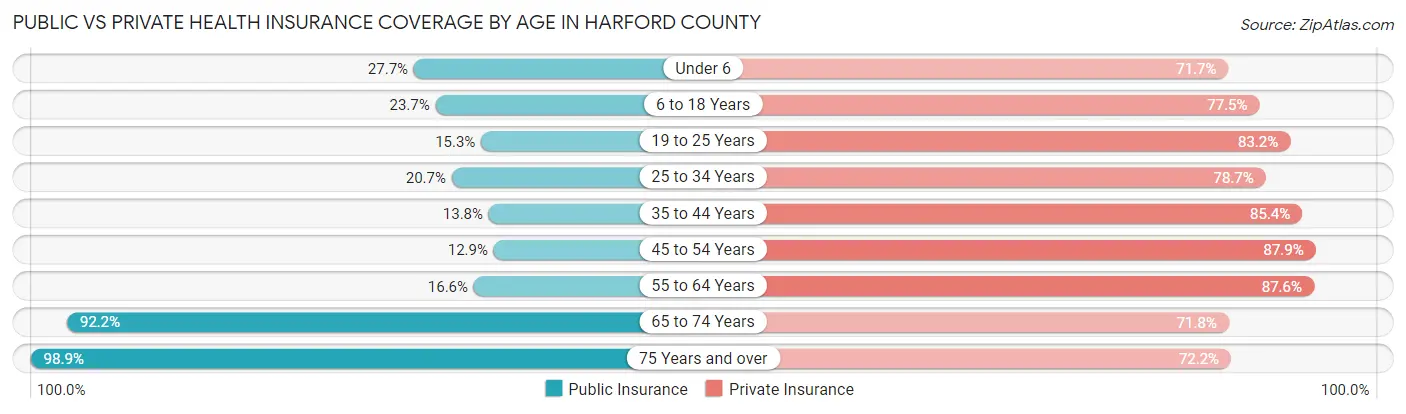
| Age Bracket | Public Insurance | Private Insurance |
| Under 6 | 4,849 (27.7%) | 12,541 (71.7%) |
| 6 to 18 Years | 10,379 (23.7%) | 33,897 (77.5%) |
| 19 to 25 Years | 3,081 (15.2%) | 16,803 (83.2%) |
| 25 to 34 Years | 5,965 (20.7%) | 22,654 (78.7%) |
| 35 to 44 Years | 4,621 (13.8%) | 28,550 (85.4%) |
| 45 to 54 Years | 4,483 (12.9%) | 30,545 (87.9%) |
| 55 to 64 Years | 6,270 (16.6%) | 33,068 (87.6%) |
| 65 to 74 Years | 23,938 (92.2%) | 18,652 (71.8%) |
| 75 Years and over | 16,656 (98.9%) | 12,168 (72.2%) |
| Total | 80,242 (31.0%) | 208,878 (80.7%) |
Disability Status by Sex by Age in Harford County
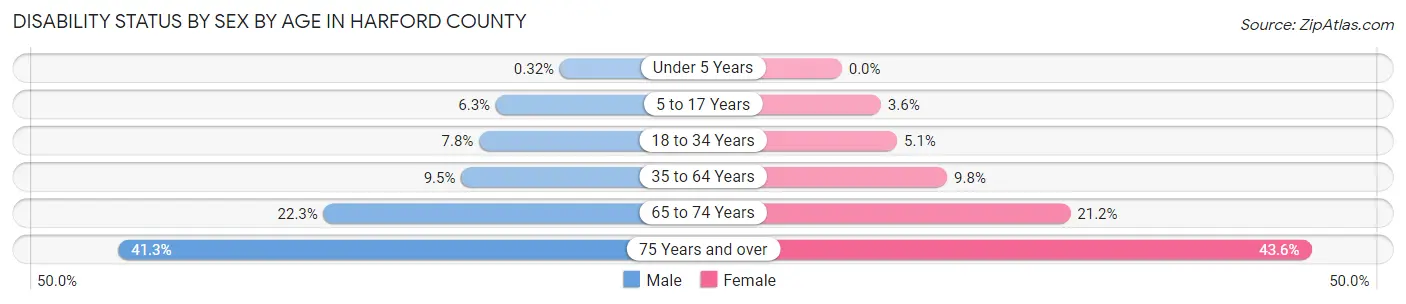
| Age Bracket | Male | Female |
| Under 5 Years | 23 (0.3%) | 0 (0.0%) |
| 5 to 17 Years | 1,406 (6.3%) | 772 (3.6%) |
| 18 to 34 Years | 2,065 (7.8%) | 1,324 (5.1%) |
| 35 to 64 Years | 4,928 (9.5%) | 5,266 (9.8%) |
| 65 to 74 Years | 2,740 (22.3%) | 2,897 (21.2%) |
| 75 Years and over | 2,824 (41.3%) | 4,361 (43.6%) |
Disability Class by Sex by Age in Harford County
Disability Class: Hearing Difficulty
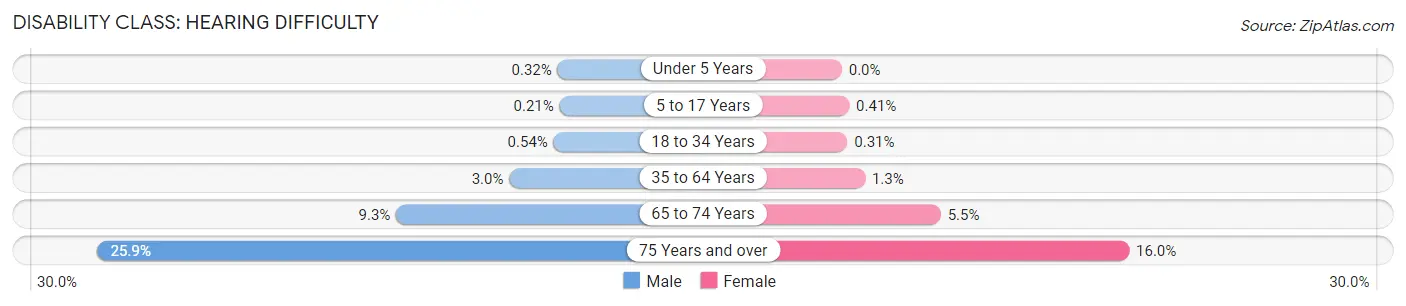
| Age Bracket | Male | Female |
| Under 5 Years | 23 (0.3%) | 0 (0.0%) |
| 5 to 17 Years | 48 (0.2%) | 87 (0.4%) |
| 18 to 34 Years | 143 (0.5%) | 79 (0.3%) |
| 35 to 64 Years | 1,566 (3.0%) | 697 (1.3%) |
| 65 to 74 Years | 1,147 (9.3%) | 753 (5.5%) |
| 75 Years and over | 1,774 (25.9%) | 1,601 (16.0%) |
Disability Class: Vision Difficulty
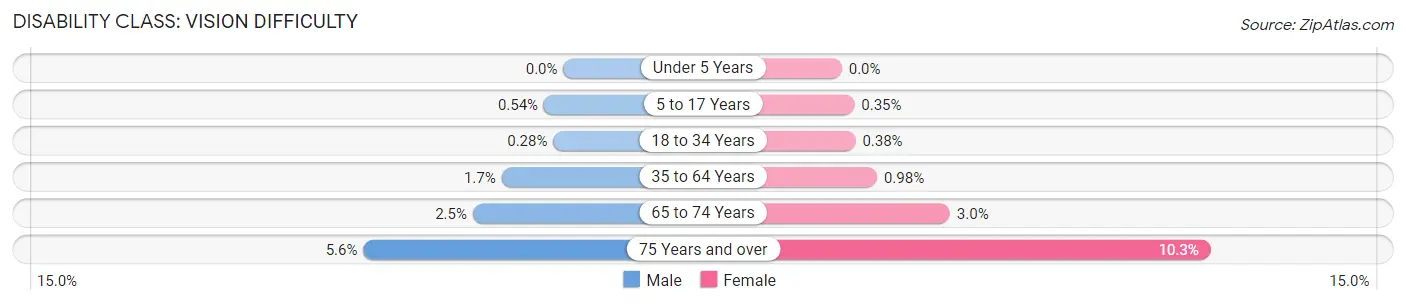
| Age Bracket | Male | Female |
| Under 5 Years | 0 (0.0%) | 0 (0.0%) |
| 5 to 17 Years | 121 (0.5%) | 74 (0.4%) |
| 18 to 34 Years | 75 (0.3%) | 98 (0.4%) |
| 35 to 64 Years | 894 (1.7%) | 529 (1.0%) |
| 65 to 74 Years | 310 (2.5%) | 411 (3.0%) |
| 75 Years and over | 381 (5.6%) | 1,028 (10.3%) |
Disability Class: Cognitive Difficulty
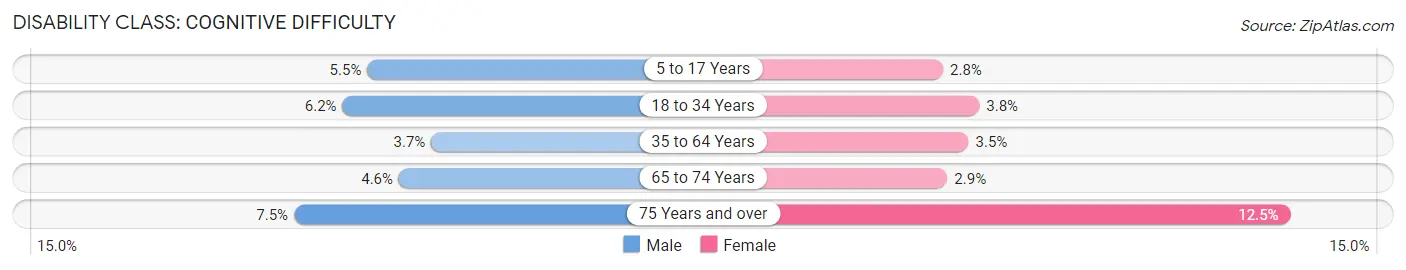
| Age Bracket | Male | Female |
| 5 to 17 Years | 1,227 (5.5%) | 600 (2.8%) |
| 18 to 34 Years | 1,626 (6.1%) | 988 (3.8%) |
| 35 to 64 Years | 1,917 (3.7%) | 1,899 (3.5%) |
| 65 to 74 Years | 564 (4.6%) | 402 (2.9%) |
| 75 Years and over | 513 (7.5%) | 1,250 (12.5%) |
Disability Class: Ambulatory Difficulty
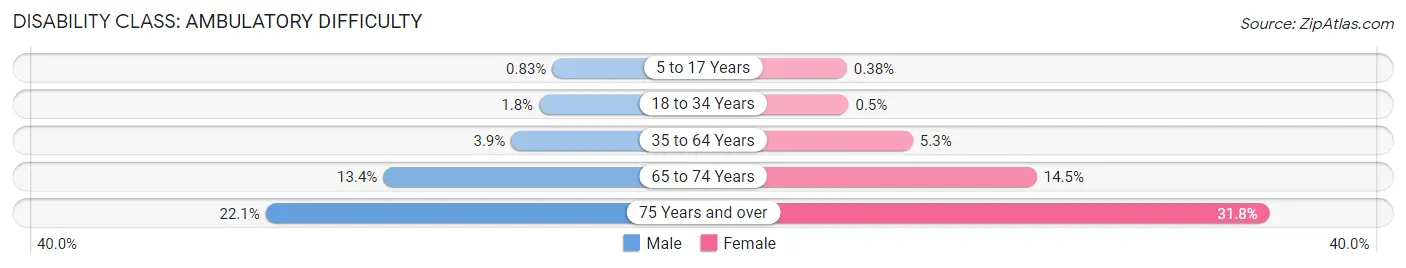
| Age Bracket | Male | Female |
| 5 to 17 Years | 186 (0.8%) | 80 (0.4%) |
| 18 to 34 Years | 478 (1.8%) | 128 (0.5%) |
| 35 to 64 Years | 2,019 (3.9%) | 2,841 (5.3%) |
| 65 to 74 Years | 1,648 (13.4%) | 1,978 (14.5%) |
| 75 Years and over | 1,512 (22.1%) | 3,179 (31.8%) |
Disability Class: Self-Care Difficulty
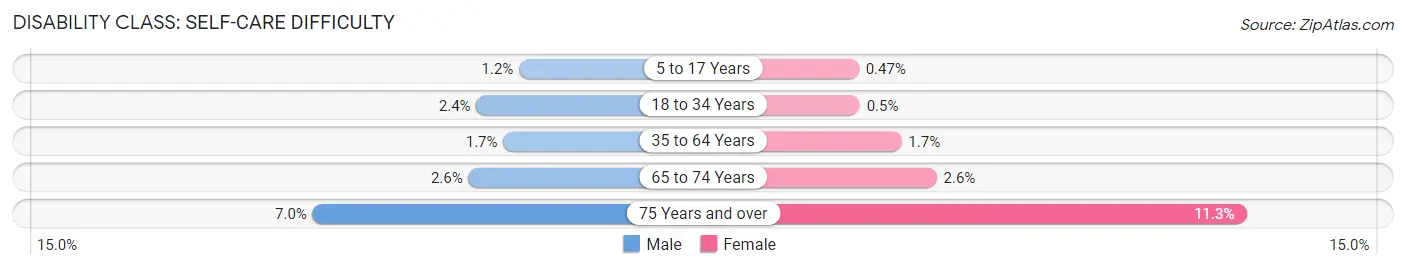
| Age Bracket | Male | Female |
| 5 to 17 Years | 277 (1.2%) | 99 (0.5%) |
| 18 to 34 Years | 640 (2.4%) | 129 (0.5%) |
| 35 to 64 Years | 869 (1.7%) | 893 (1.7%) |
| 65 to 74 Years | 325 (2.6%) | 360 (2.6%) |
| 75 Years and over | 477 (7.0%) | 1,127 (11.3%) |
Technology Access in Harford County
Computing Device Access in Harford County
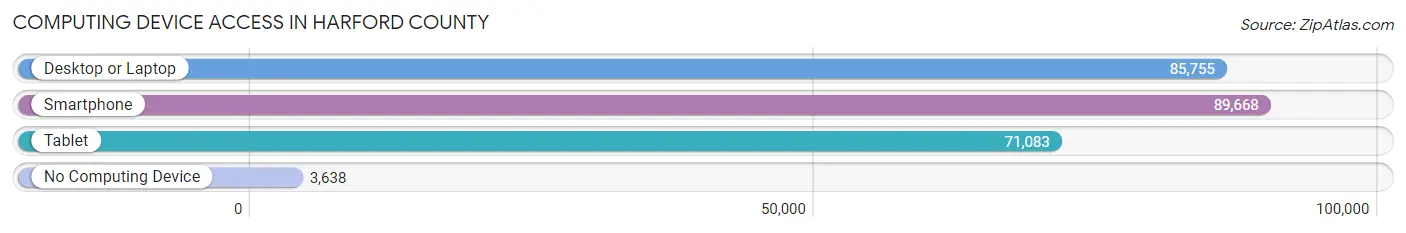
| Device Type | # Households | % Households |
| Desktop or Laptop | 85,755 | 86.8% |
| Smartphone | 89,668 | 90.7% |
| Tablet | 71,083 | 71.9% |
| No Computing Device | 3,638 | 3.7% |
| Total | 98,822 | 100.0% |
Internet Access in Harford County
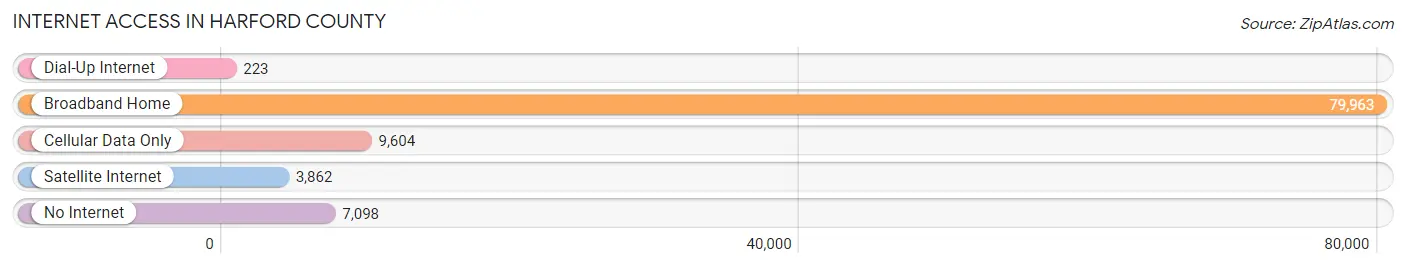
| Internet Type | # Households | % Households |
| Dial-Up Internet | 223 | 0.2% |
| Broadband Home | 79,963 | 80.9% |
| Cellular Data Only | 9,604 | 9.7% |
| Satellite Internet | 3,862 | 3.9% |
| No Internet | 7,098 | 7.2% |
| Total | 98,822 | 100.0% |
Harford County Summary
Harford County, Maryland is located in the northeastern part of the state, just south of the Pennsylvania border. It is part of the Baltimore-Washington metropolitan area and is home to a population of over 250,000 people. The county is known for its rich history, diverse geography, and vibrant economy.
History
Harford County was established in 1773 and is named after Henry Harford, the last Proprietary of Maryland. The county was originally part of Baltimore County, but was split off in 1773. The county was home to a variety of Native American tribes, including the Susquehannock, Piscataway, and Nanticoke. The first European settlers arrived in the area in the 1660s, and the county was officially established in 1773.
During the Revolutionary War, Harford County was a major center of activity. The Battle of Bush River, which took place in 1781, was one of the most important battles of the war. The county was also home to a number of prominent figures, including Francis Scott Key, who wrote the Star-Spangled Banner.
Geography
Harford County is located in the northeastern part of Maryland, just south of the Pennsylvania border. It is bordered by Cecil County to the north, Baltimore County to the south, and York County, Pennsylvania to the east. The county is home to a variety of landscapes, including rolling hills, forests, and farmland. The county is also home to a number of rivers, including the Susquehanna, Bush, and Deer Creek.
The county is divided into three regions: the Upper, Middle, and Lower Harford. The Upper Harford region is located in the northern part of the county and is home to the cities of Aberdeen and Havre de Grace. The Middle Harford region is located in the central part of the county and is home to the cities of Bel Air and Edgewood. The Lower Harford region is located in the southern part of the county and is home to the cities of Joppa and Abingdon.
Economy
Harford County is home to a vibrant economy. The county is home to a number of major employers, including Aberdeen Proving Ground, the largest employer in the county. Other major employers include Harford County Public Schools, the University of Maryland Upper Chesapeake Medical Center, and the Aberdeen IronBirds minor league baseball team.
The county is also home to a number of small businesses, including restaurants, retail stores, and professional services. The county is also home to a number of agricultural operations, including dairy farms, poultry farms, and vegetable farms.
Demographics
As of the 2010 census, Harford County had a population of 244,826. The population is made up of a variety of racial and ethnic groups, including White (77.3%), African American (14.2%), Hispanic or Latino (5.2%), and Asian (2.3%). The median household income in the county is $76,845, and the median home value is $269,400.
Harford County is home to a variety of religious groups, including Protestant (48.2%), Catholic (25.2%), and Other (26.6%). The county is also home to a variety of educational institutions, including Harford Community College, the University of Maryland Upper Chesapeake Medical Center, and the Aberdeen Proving Ground.
Common Questions
What is the Total Population of Harford County?
Total Population of Harford County is 261,059.
What is the Total Male Population of Harford County?
Total Male Population of Harford County is 128,609.
What is the Total Female Population of Harford County?
Total Female Population of Harford County is 132,450.
What is the Ratio of Males per 100 Females in Harford County?
There are 97.10 Males per 100 Females in Harford County.
What is the Ratio of Females per 100 Males in Harford County?
There are 102.99 Females per 100 Males in Harford County.
What is the Median Population Age in Harford County?
Median Population Age in Harford County is 40.4 Years.
What is the Average Family Size in Harford County
Average Family Size in Harford County is 3.1 People.
What is the Average Household Size in Harford County
Average Household Size in Harford County is 2.6 People.
What is Per Capita Income in Harford County?
Per Capita income in Harford County is $48,615.
What is the Median Family Income in Harford County?
Median Family Income in Harford County is $125,929.
What is the Median Household income in Harford County?
Median Household Income in Harford County is $106,417.
What is Income or Wage Gap in Harford County?
Income or Wage Gap in Harford County is 33.1%.
Women in Harford County earn 66.9 cents for every dollar earned by a man.
What is Family Income Deficit in Harford County?
Family Income Deficit in Harford County is $10,989.
Families that are below poverty line in Harford County earn $10,989 less on average than the poverty threshold level.
What is Inequality or Gini Index in Harford County?
Inequality or Gini Index in Harford County is 0.41.
How Large is the Labor Force in Harford County?
There are 142,215 People in the Labor Forcein in Harford County.
What is the Percentage of People in the Labor Force in Harford County?
67.7% of People are in the Labor Force in Harford County.
What is the Unemployment Rate in Harford County?
Unemployment Rate in Harford County is 3.7%.