Garrett County, MD
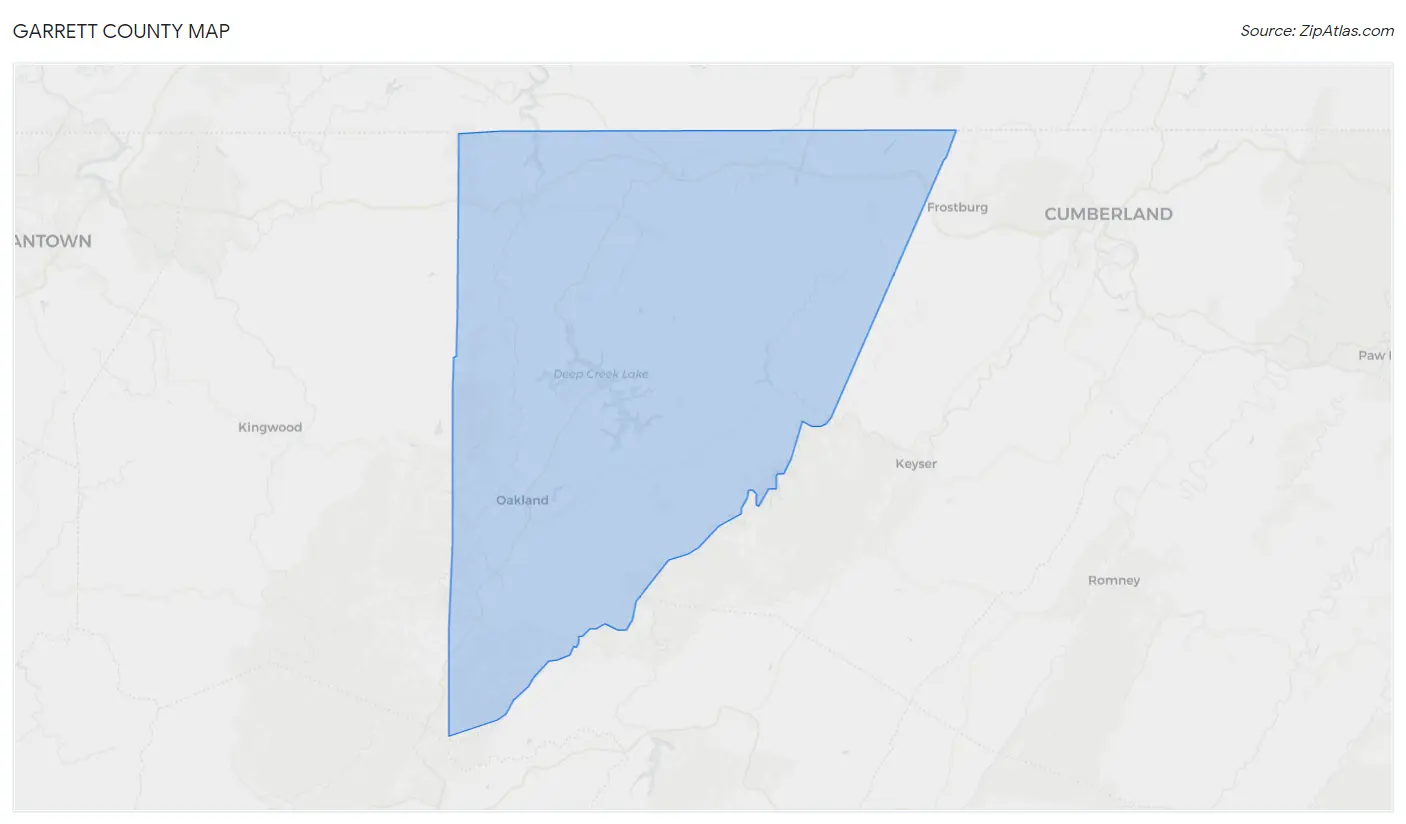
Garrett County Map
Garrett County Overview
28,856
TOTAL POPULATION
14,499
MALE POPULATION
14,357
FEMALE POPULATION
100.99
MALES / 100 FEMALES
99.02
FEMALES / 100 MALES
47.6
MEDIAN AGE
2.8
AVG FAMILY SIZE
2.3
AVG HOUSEHOLD SIZE
$41,130
PER CAPITA INCOME
$81,575
AVG FAMILY INCOME
$64,447
AVG HOUSEHOLD INCOME
28.8%
WAGE / INCOME GAP [ % ]
71.2¢/ $1
WAGE / INCOME GAP [ $ ]
$10,161
FAMILY INCOME DEFICIT
0.49
INEQUALITY / GINI INDEX
14,232
LABOR FORCE [ PEOPLE ]
58.3%
PERCENT IN LABOR FORCE
4.6%
UNEMPLOYMENT RATE
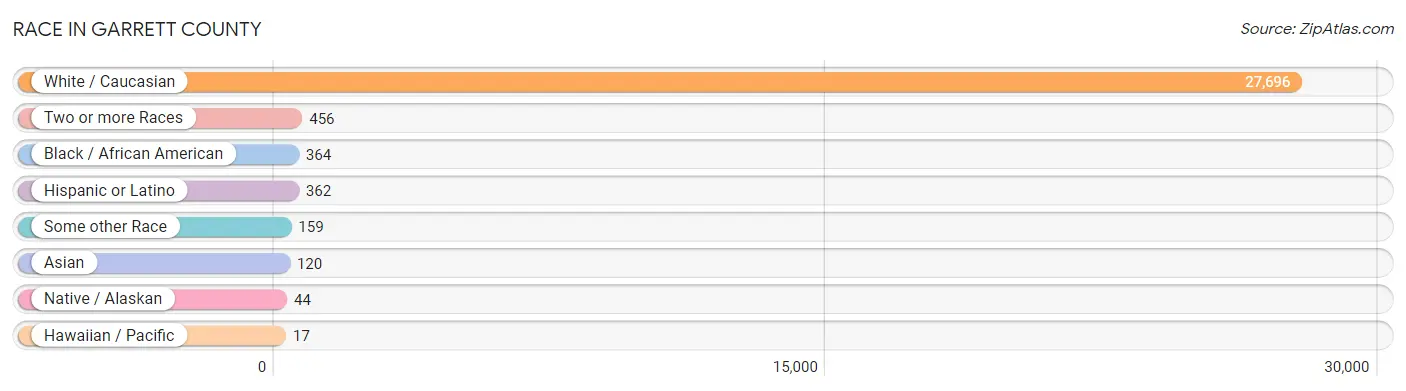
Race in Garrett County
The most populous races in Garrett County are White / Caucasian (27,696 | 96.0%), Two or more Races (456 | 1.6%), and Black / African American (364 | 1.3%).
| Race | # Population | % Population |
| Asian | 120 | 0.4% |
| Black / African American | 364 | 1.3% |
| Hawaiian / Pacific | 17 | 0.1% |
| Hispanic or Latino | 362 | 1.3% |
| Native / Alaskan | 44 | 0.2% |
| White / Caucasian | 27,696 | 96.0% |
| Two or more Races | 456 | 1.6% |
| Some other Race | 159 | 0.5% |
| Total | 28,856 | 100.0% |
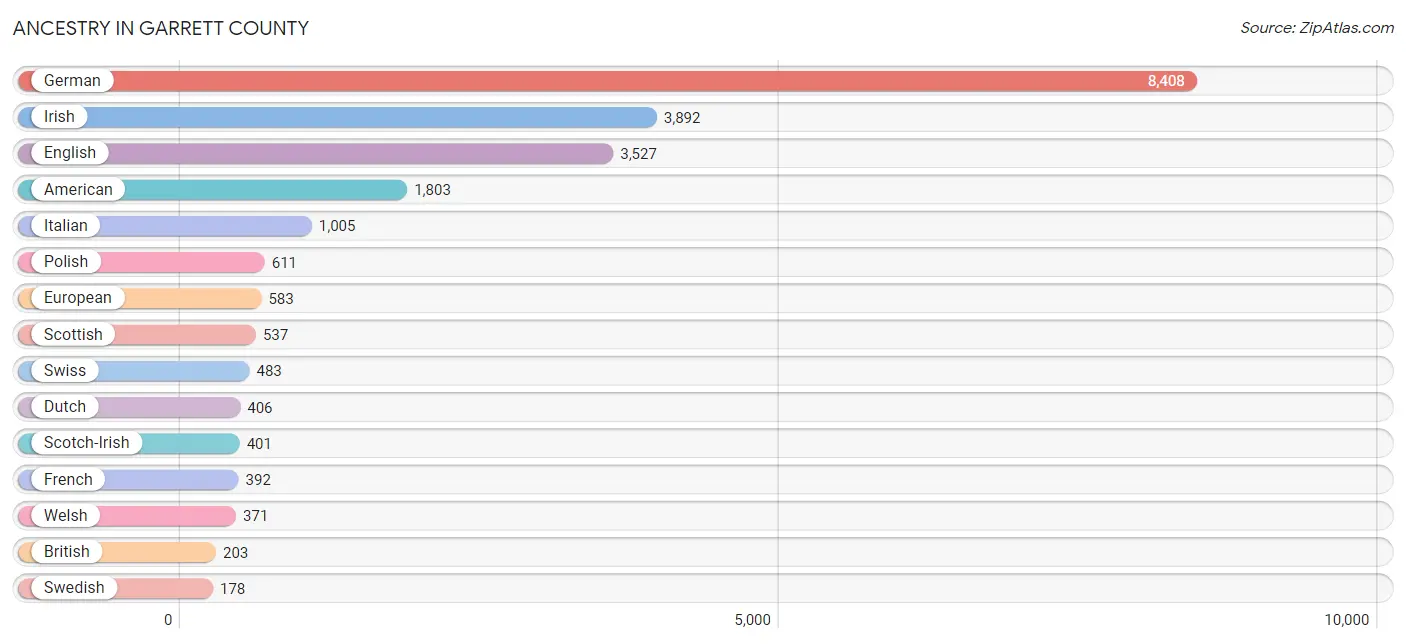
Ancestry in Garrett County
The most populous ancestries reported in Garrett County are German (8,408 | 29.1%), Irish (3,892 | 13.5%), English (3,527 | 12.2%), American (1,803 | 6.2%), and Italian (1,005 | 3.5%), together accounting for 64.6% of all Garrett County residents.
| Ancestry | # Population | % Population |
| African | 33 | 0.1% |
| American | 1,803 | 6.2% |
| Arab | 16 | 0.1% |
| Armenian | 93 | 0.3% |
| Austrian | 98 | 0.3% |
| Bhutanese | 50 | 0.2% |
| Blackfeet | 2 | 0.0% |
| British | 203 | 0.7% |
| Burmese | 18 | 0.1% |
| Canadian | 43 | 0.2% |
| Carpatho Rusyn | 18 | 0.1% |
| Celtic | 3 | 0.0% |
| Central American | 29 | 0.1% |
| Central American Indian | 7 | 0.0% |
| Cherokee | 20 | 0.1% |
| Colombian | 10 | 0.0% |
| Croatian | 155 | 0.5% |
| Cuban | 6 | 0.0% |
| Czech | 54 | 0.2% |
| Czechoslovakian | 14 | 0.1% |
| Danish | 11 | 0.0% |
| Dominican | 36 | 0.1% |
| Dutch | 406 | 1.4% |
| Eastern European | 15 | 0.1% |
| Ecuadorian | 17 | 0.1% |
| English | 3,527 | 12.2% |
| European | 583 | 2.0% |
| Finnish | 11 | 0.0% |
| French | 392 | 1.4% |
| French Canadian | 91 | 0.3% |
| German | 8,408 | 29.1% |
| Greek | 72 | 0.3% |
| Guamanian / Chamorro | 48 | 0.2% |
| Guatemalan | 7 | 0.0% |
| Haitian | 2 | 0.0% |
| Honduran | 12 | 0.0% |
| Hungarian | 111 | 0.4% |
| Indian (Asian) | 18 | 0.1% |
| Indonesian | 17 | 0.1% |
| Iranian | 2 | 0.0% |
| Irish | 3,892 | 13.5% |
| Iroquois | 1 | 0.0% |
| Italian | 1,005 | 3.5% |
| Jamaican | 1 | 0.0% |
| Korean | 86 | 0.3% |
| Latvian | 2 | 0.0% |
| Lebanese | 14 | 0.1% |
| Lithuanian | 37 | 0.1% |
| Mexican | 123 | 0.4% |
| Mexican American Indian | 35 | 0.1% |
| Native Hawaiian | 26 | 0.1% |
| New Zealander | 15 | 0.1% |
| Nicaraguan | 9 | 0.0% |
| Northern European | 46 | 0.2% |
| Norwegian | 102 | 0.4% |
| Pennsylvania German | 22 | 0.1% |
| Peruvian | 56 | 0.2% |
| Polish | 611 | 2.1% |
| Portuguese | 141 | 0.5% |
| Puerto Rican | 34 | 0.1% |
| Romanian | 31 | 0.1% |
| Russian | 80 | 0.3% |
| Salvadoran | 1 | 0.0% |
| Scandinavian | 42 | 0.2% |
| Scotch-Irish | 401 | 1.4% |
| Scottish | 537 | 1.9% |
| Serbian | 4 | 0.0% |
| Sioux | 1 | 0.0% |
| Slavic | 4 | 0.0% |
| Slovak | 1 | 0.0% |
| Slovene | 96 | 0.3% |
| South American | 84 | 0.3% |
| South American Indian | 11 | 0.0% |
| Spanish | 11 | 0.0% |
| Subsaharan African | 33 | 0.1% |
| Swedish | 178 | 0.6% |
| Swiss | 483 | 1.7% |
| Syrian | 2 | 0.0% |
| Thai | 8 | 0.0% |
| Ukrainian | 83 | 0.3% |
| Venezuelan | 1 | 0.0% |
| Welsh | 371 | 1.3% |
| West Indian | 6 | 0.0% | View All 83 Rows |
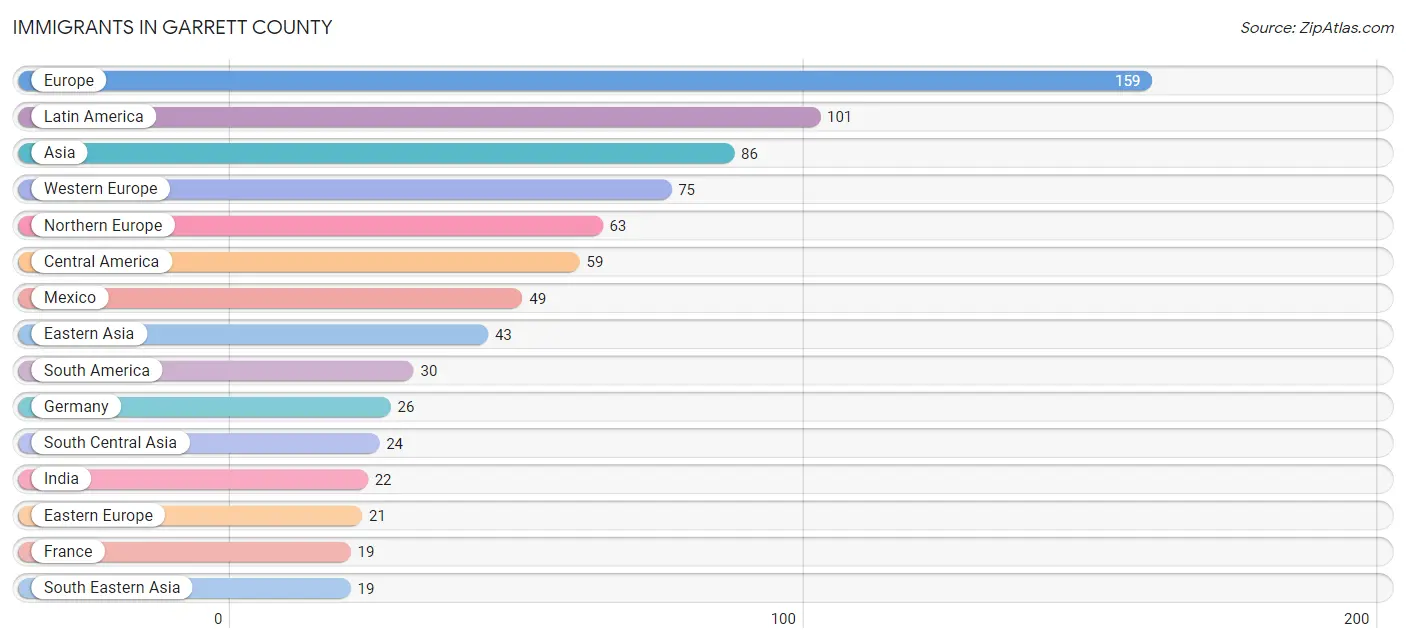
Immigrants in Garrett County
The most numerous immigrant groups reported in Garrett County came from Europe (159 | 0.5%), Latin America (101 | 0.4%), Asia (86 | 0.3%), Western Europe (75 | 0.3%), and Northern Europe (63 | 0.2%), together accounting for 1.7% of all Garrett County residents.
| Immigration Origin | # Population | % Population |
| Africa | 18 | 0.1% |
| Asia | 86 | 0.3% |
| Austria | 14 | 0.1% |
| Bolivia | 10 | 0.0% |
| Cameroon | 18 | 0.1% |
| Caribbean | 12 | 0.0% |
| Central America | 59 | 0.2% |
| China | 17 | 0.1% |
| Colombia | 1 | 0.0% |
| Dominican Republic | 10 | 0.0% |
| Eastern Asia | 43 | 0.2% |
| Eastern Europe | 21 | 0.1% |
| Ecuador | 13 | 0.1% |
| El Salvador | 1 | 0.0% |
| England | 9 | 0.0% |
| Europe | 159 | 0.5% |
| France | 19 | 0.1% |
| Germany | 26 | 0.1% |
| Haiti | 2 | 0.0% |
| India | 22 | 0.1% |
| Iran | 2 | 0.0% |
| Japan | 16 | 0.1% |
| Korea | 10 | 0.0% |
| Latin America | 101 | 0.4% |
| Mexico | 49 | 0.2% |
| Middle Africa | 18 | 0.1% |
| Netherlands | 16 | 0.1% |
| Nicaragua | 9 | 0.0% |
| Northern Europe | 63 | 0.2% |
| Norway | 1 | 0.0% |
| Oceania | 15 | 0.1% |
| Peru | 5 | 0.0% |
| Philippines | 2 | 0.0% |
| Romania | 15 | 0.1% |
| Russia | 6 | 0.0% |
| Scotland | 15 | 0.1% |
| South America | 30 | 0.1% |
| South Central Asia | 24 | 0.1% |
| South Eastern Asia | 19 | 0.1% |
| Taiwan | 1 | 0.0% |
| Venezuela | 1 | 0.0% |
| Western Europe | 75 | 0.3% | View All 42 Rows |
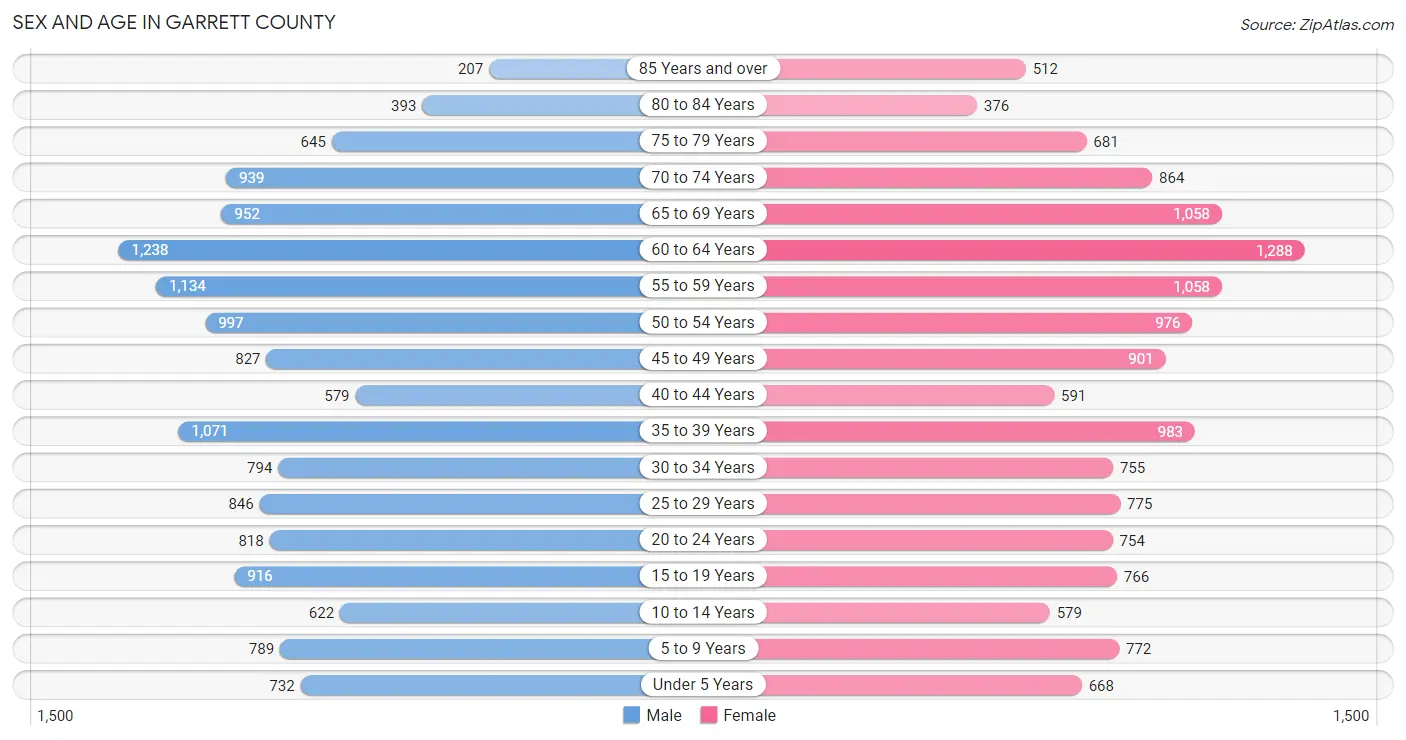
Sex and Age in Garrett County
Sex and Age in Garrett County
The most populous age groups in Garrett County are 60 to 64 Years (1,238 | 8.5%) for men and 60 to 64 Years (1,288 | 9.0%) for women.
| Age Bracket | Male | Female |
| Under 5 Years | 732 (5.1%) | 668 (4.6%) |
| 5 to 9 Years | 789 (5.4%) | 772 (5.4%) |
| 10 to 14 Years | 622 (4.3%) | 579 (4.0%) |
| 15 to 19 Years | 916 (6.3%) | 766 (5.3%) |
| 20 to 24 Years | 818 (5.6%) | 754 (5.2%) |
| 25 to 29 Years | 846 (5.8%) | 775 (5.4%) |
| 30 to 34 Years | 794 (5.5%) | 755 (5.3%) |
| 35 to 39 Years | 1,071 (7.4%) | 983 (6.9%) |
| 40 to 44 Years | 579 (4.0%) | 591 (4.1%) |
| 45 to 49 Years | 827 (5.7%) | 901 (6.3%) |
| 50 to 54 Years | 997 (6.9%) | 976 (6.8%) |
| 55 to 59 Years | 1,134 (7.8%) | 1,058 (7.4%) |
| 60 to 64 Years | 1,238 (8.5%) | 1,288 (9.0%) |
| 65 to 69 Years | 952 (6.6%) | 1,058 (7.4%) |
| 70 to 74 Years | 939 (6.5%) | 864 (6.0%) |
| 75 to 79 Years | 645 (4.4%) | 681 (4.7%) |
| 80 to 84 Years | 393 (2.7%) | 376 (2.6%) |
| 85 Years and over | 207 (1.4%) | 512 (3.6%) |
| Total | 14,499 (100.0%) | 14,357 (100.0%) |
Families and Households in Garrett County
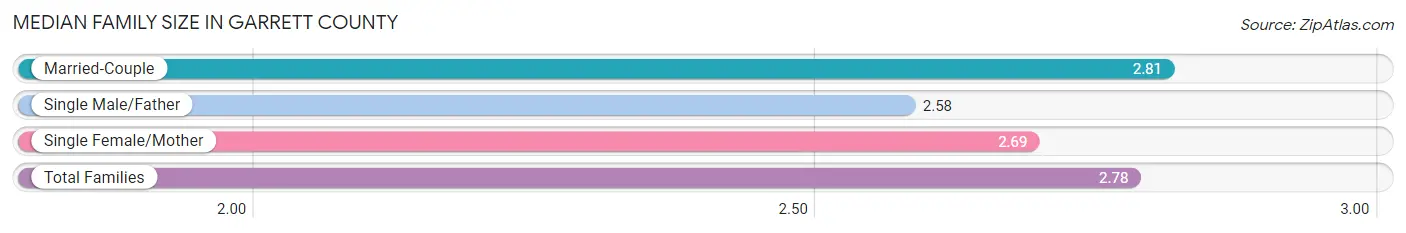
Median Family Size in Garrett County
The median family size in Garrett County is 2.78 persons per family, with married-couple families (6,548 | 78.9%) accounting for the largest median family size of 2.81 persons per family. On the other hand, single male/father families (516 | 6.2%) represent the smallest median family size with 2.58 persons per family.
| Family Type | # Families | Family Size |
| Married-Couple | 6,548 (78.9%) | 2.81 |
| Single Male/Father | 516 (6.2%) | 2.58 |
| Single Female/Mother | 1,232 (14.8%) | 2.69 |
| Total Families | 8,296 (100.0%) | 2.78 |
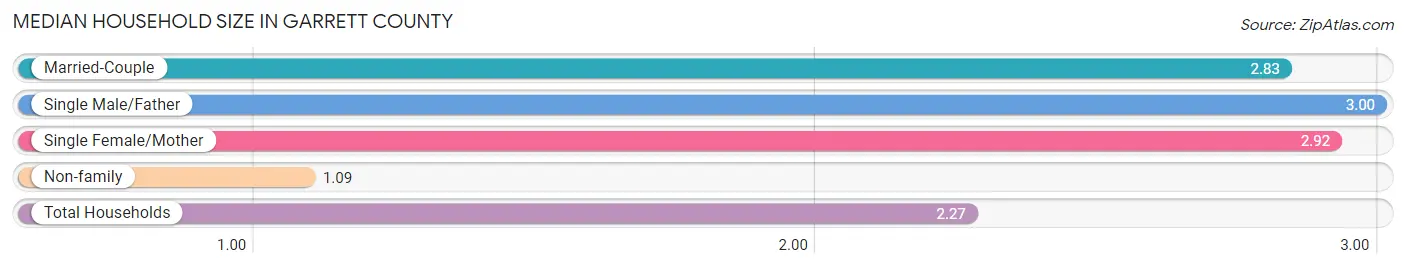
Median Household Size in Garrett County
The median household size in Garrett County is 2.27 persons per household, with single male/father households (516 | 4.2%) accounting for the largest median household size of 3 persons per household. non-family households (4,152 | 33.4%) represent the smallest median household size with 1.09 persons per household.
| Household Type | # Households | Household Size |
| Married-Couple | 6,548 (52.6%) | 2.83 |
| Single Male/Father | 516 (4.2%) | 3.00 |
| Single Female/Mother | 1,232 (9.9%) | 2.92 |
| Non-family | 4,152 (33.4%) | 1.09 |
| Total Households | 12,448 (100.0%) | 2.27 |
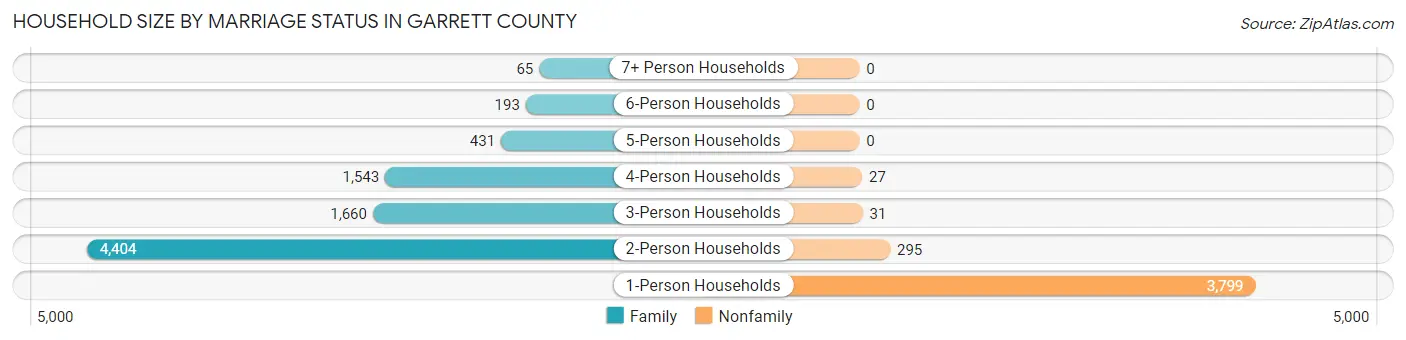
Household Size by Marriage Status in Garrett County
Out of a total of 12,448 households in Garrett County, 8,296 (66.6%) are family households, while 4,152 (33.4%) are nonfamily households. The most numerous type of family households are 2-person households, comprising 4,404, and the most common type of nonfamily households are 1-person households, comprising 3,799.
| Household Size | Family Households | Nonfamily Households |
| 1-Person Households | - | 3,799 (30.5%) |
| 2-Person Households | 4,404 (35.4%) | 295 (2.4%) |
| 3-Person Households | 1,660 (13.3%) | 31 (0.3%) |
| 4-Person Households | 1,543 (12.4%) | 27 (0.2%) |
| 5-Person Households | 431 (3.5%) | 0 (0.0%) |
| 6-Person Households | 193 (1.5%) | 0 (0.0%) |
| 7+ Person Households | 65 (0.5%) | 0 (0.0%) |
| Total | 8,296 (66.6%) | 4,152 (33.4%) |
Female Fertility in Garrett County
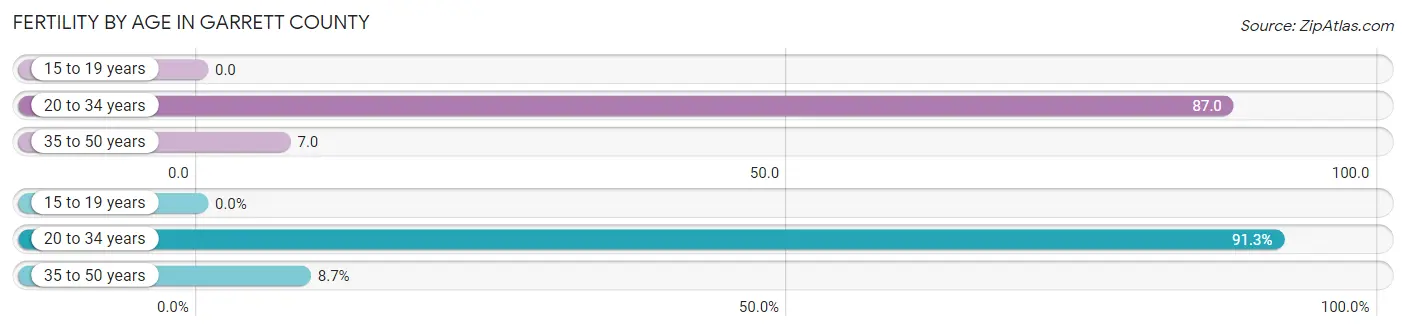
Fertility by Age in Garrett County
Average fertility rate in Garrett County is 38.0 births per 1,000 women. Women in the age bracket of 20 to 34 years have the highest fertility rate with 87.0 births per 1,000 women. Women in the age bracket of 20 to 34 years acount for 91.3% of all women with births.
| Age Bracket | Women with Births | Births / 1,000 Women |
| 15 to 19 years | 0 (0.0%) | 0.0 |
| 20 to 34 years | 199 (91.3%) | 87.0 |
| 35 to 50 years | 19 (8.7%) | 7.0 |
| Total | 218 (100.0%) | 38.0 |
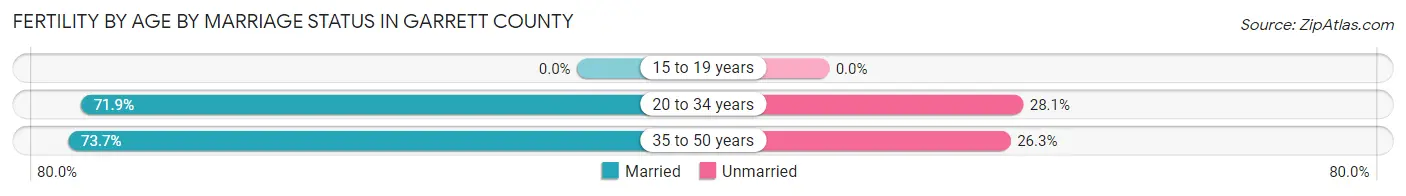
Fertility by Age by Marriage Status in Garrett County
72.0% of women with births (218) in Garrett County are married. The highest percentage of unmarried women with births falls into 20 to 34 years age bracket with 28.1% of them unmarried at the time of birth, while the lowest percentage of unmarried women with births belong to 35 to 50 years age bracket with 26.3% of them unmarried.
| Age Bracket | Married | Unmarried |
| 15 to 19 years | 0 (0.0%) | 0 (0.0%) |
| 20 to 34 years | 143 (71.9%) | 56 (28.1%) |
| 35 to 50 years | 14 (73.7%) | 5 (26.3%) |
| Total | 157 (72.0%) | 61 (28.0%) |
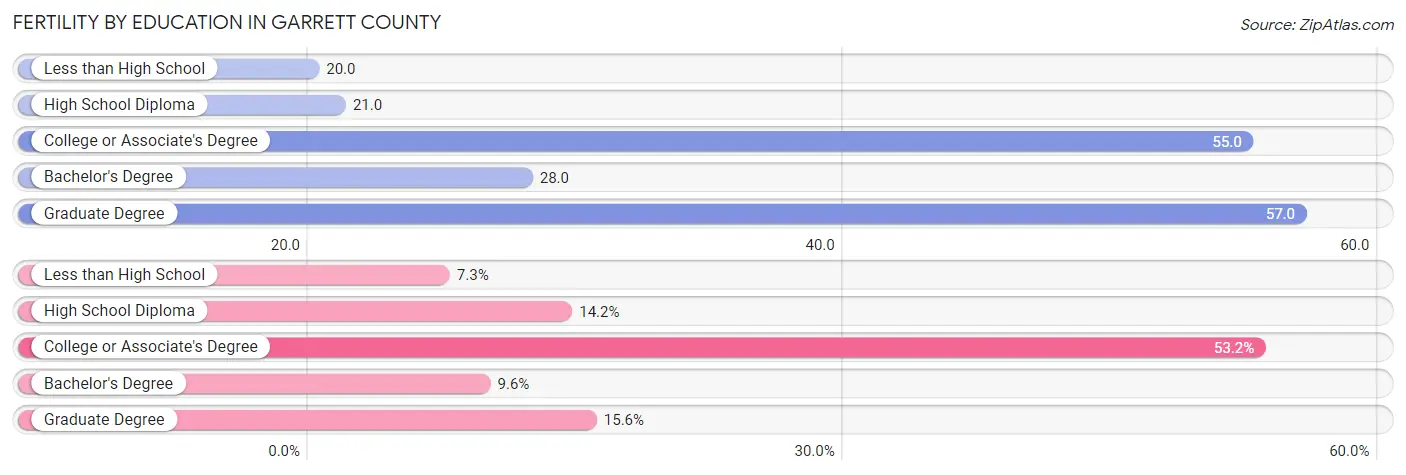
Fertility by Education in Garrett County
Average fertility rate in Garrett County is 38.0 births per 1,000 women. Women with the education attainment of graduate degree have the highest fertility rate of 57.0 births per 1,000 women, while women with the education attainment of less than high school have the lowest fertility at 20.0 births per 1,000 women. Women with the education attainment of college or associate's degree represent 53.2% of all women with births.
| Educational Attainment | Women with Births | Births / 1,000 Women |
| Less than High School | 16 (7.3%) | 20.0 |
| High School Diploma | 31 (14.2%) | 21.0 |
| College or Associate's Degree | 116 (53.2%) | 55.0 |
| Bachelor's Degree | 21 (9.6%) | 28.0 |
| Graduate Degree | 34 (15.6%) | 57.0 |
| Total | 218 (100.0%) | 38.0 |
Fertility by Education by Marriage Status in Garrett County
28.0% of women with births in Garrett County are unmarried. Women with the educational attainment of bachelor's degree are most likely to be married with 100.0% of them married at childbirth, while women with the educational attainment of high school diploma are least likely to be married with 51.6% of them unmarried at childbirth.
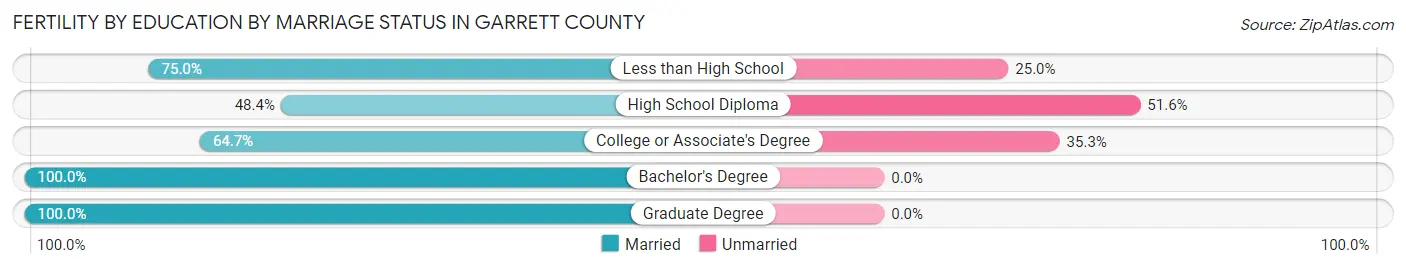
| Educational Attainment | Married | Unmarried |
| Less than High School | 12 (75.0%) | 4 (25.0%) |
| High School Diploma | 15 (48.4%) | 16 (51.6%) |
| College or Associate's Degree | 75 (64.7%) | 41 (35.3%) |
| Bachelor's Degree | 21 (100.0%) | 0 (0.0%) |
| Graduate Degree | 34 (100.0%) | 0 (0.0%) |
| Total | 157 (72.0%) | 61 (28.0%) |
Income in Garrett County
Income Overview in Garrett County
Per Capita Income in Garrett County is $41,130, while median incomes of families and households are $81,575 and $64,447 respectively.
| Characteristic | Number | Measure |
| Per Capita Income | 28,856 | $41,130 |
| Median Family Income | 8,296 | $81,575 |
| Mean Family Income | 8,296 | $115,206 |
| Median Household Income | 12,448 | $64,447 |
| Mean Household Income | 12,448 | $94,949 |
| Income Deficit | 8,296 | $10,161 |
| Wage / Income Gap (%) | 28,856 | 28.75% |
| Wage / Income Gap ($) | 28,856 | 71.25¢ per $1 |
| Gini / Inequality Index | 28,856 | 0.49 |
Earnings by Sex in Garrett County
Average Earnings in Garrett County are $38,546, $46,511 for men and $33,137 for women, a difference of 28.7%.
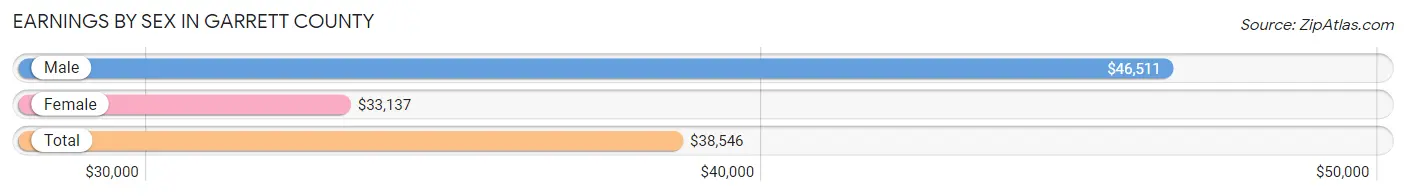
| Sex | Number | Average Earnings |
| Male | 8,251 (54.7%) | $46,511 |
| Female | 6,844 (45.3%) | $33,137 |
| Total | 15,095 (100.0%) | $38,546 |
Earnings by Sex by Income Bracket in Garrett County
The most common earnings brackets in Garrett County are $100,000+ for men (1,164 | 14.1%) and $30,000 to $34,999 for women (590 | 8.6%).
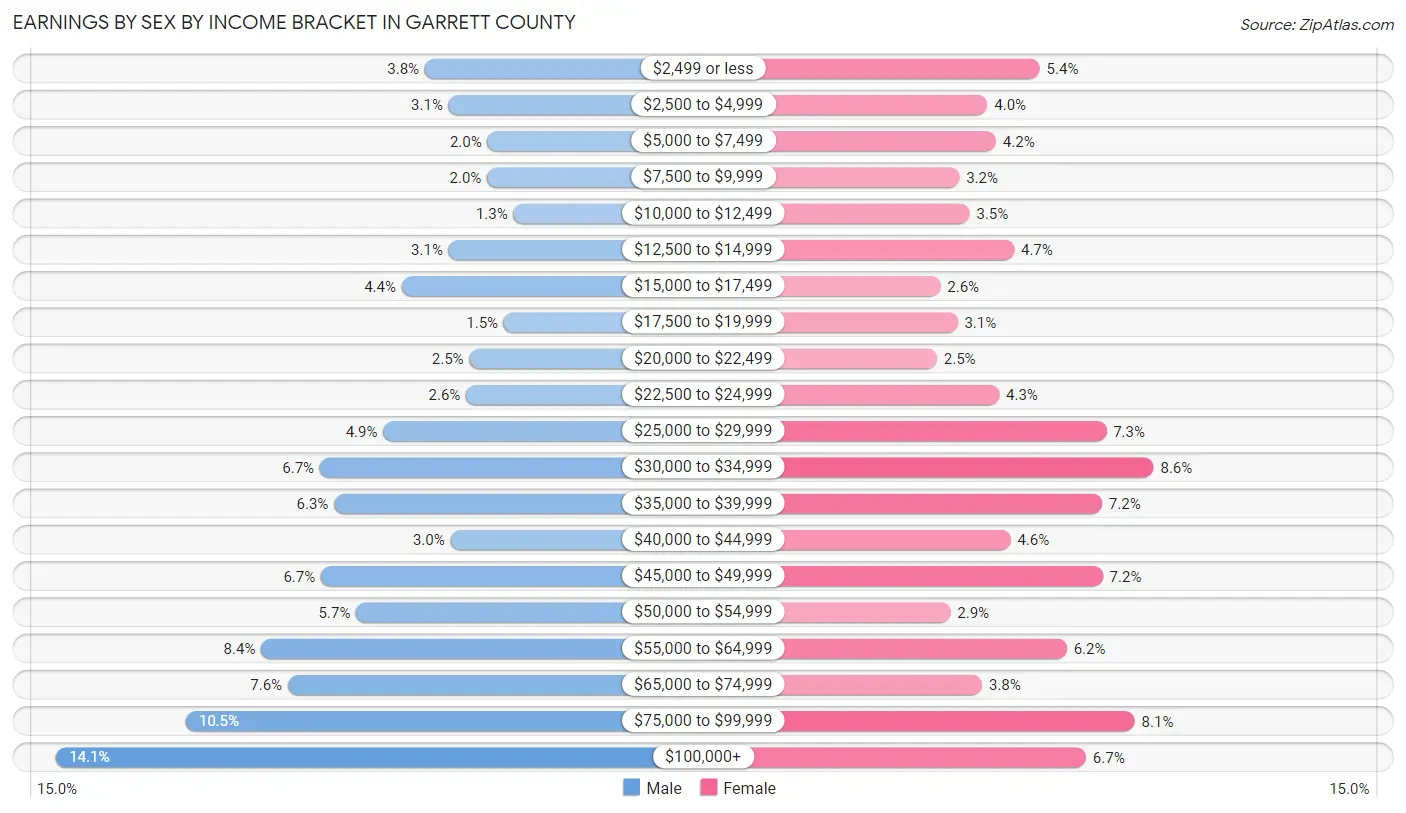
| Income | Male | Female |
| $2,499 or less | 309 (3.7%) | 371 (5.4%) |
| $2,500 to $4,999 | 254 (3.1%) | 270 (4.0%) |
| $5,000 to $7,499 | 164 (2.0%) | 287 (4.2%) |
| $7,500 to $9,999 | 165 (2.0%) | 216 (3.2%) |
| $10,000 to $12,499 | 104 (1.3%) | 236 (3.5%) |
| $12,500 to $14,999 | 254 (3.1%) | 322 (4.7%) |
| $15,000 to $17,499 | 363 (4.4%) | 180 (2.6%) |
| $17,500 to $19,999 | 126 (1.5%) | 213 (3.1%) |
| $20,000 to $22,499 | 206 (2.5%) | 173 (2.5%) |
| $22,500 to $24,999 | 214 (2.6%) | 293 (4.3%) |
| $25,000 to $29,999 | 406 (4.9%) | 499 (7.3%) |
| $30,000 to $34,999 | 553 (6.7%) | 590 (8.6%) |
| $35,000 to $39,999 | 520 (6.3%) | 491 (7.2%) |
| $40,000 to $44,999 | 250 (3.0%) | 315 (4.6%) |
| $45,000 to $49,999 | 550 (6.7%) | 492 (7.2%) |
| $50,000 to $54,999 | 469 (5.7%) | 199 (2.9%) |
| $55,000 to $64,999 | 689 (8.4%) | 423 (6.2%) |
| $65,000 to $74,999 | 627 (7.6%) | 260 (3.8%) |
| $75,000 to $99,999 | 864 (10.5%) | 554 (8.1%) |
| $100,000+ | 1,164 (14.1%) | 460 (6.7%) |
| Total | 8,251 (100.0%) | 6,844 (100.0%) |
Earnings by Sex by Educational Attainment in Garrett County
Average earnings in Garrett County are $53,201 for men and $36,637 for women, a difference of 31.1%. Men with an educational attainment of graduate degree enjoy the highest average annual earnings of $90,750, while those with less than high school education earn the least with $39,028. Women with an educational attainment of graduate degree earn the most with the average annual earnings of $71,477, while those with less than high school education have the smallest earnings of $10,333.
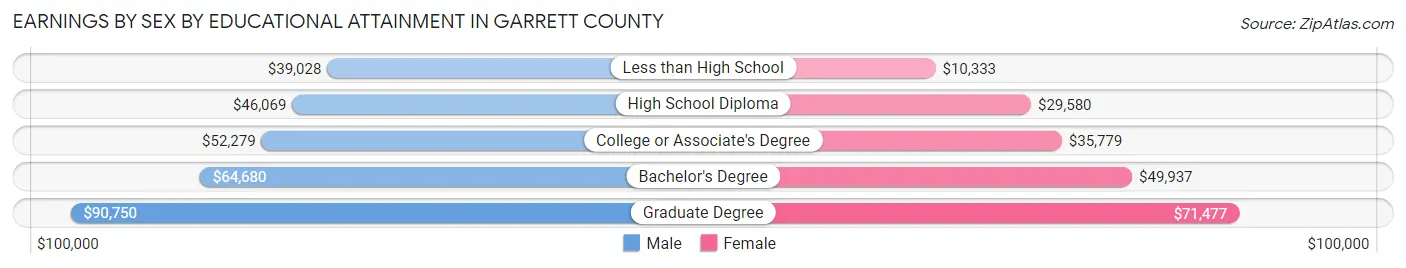
| Educational Attainment | Male Income | Female Income |
| Less than High School | $39,028 | $10,333 |
| High School Diploma | $46,069 | $29,580 |
| College or Associate's Degree | $52,279 | $35,779 |
| Bachelor's Degree | $64,680 | $49,937 |
| Graduate Degree | $90,750 | $71,477 |
| Total | $53,201 | $36,637 |
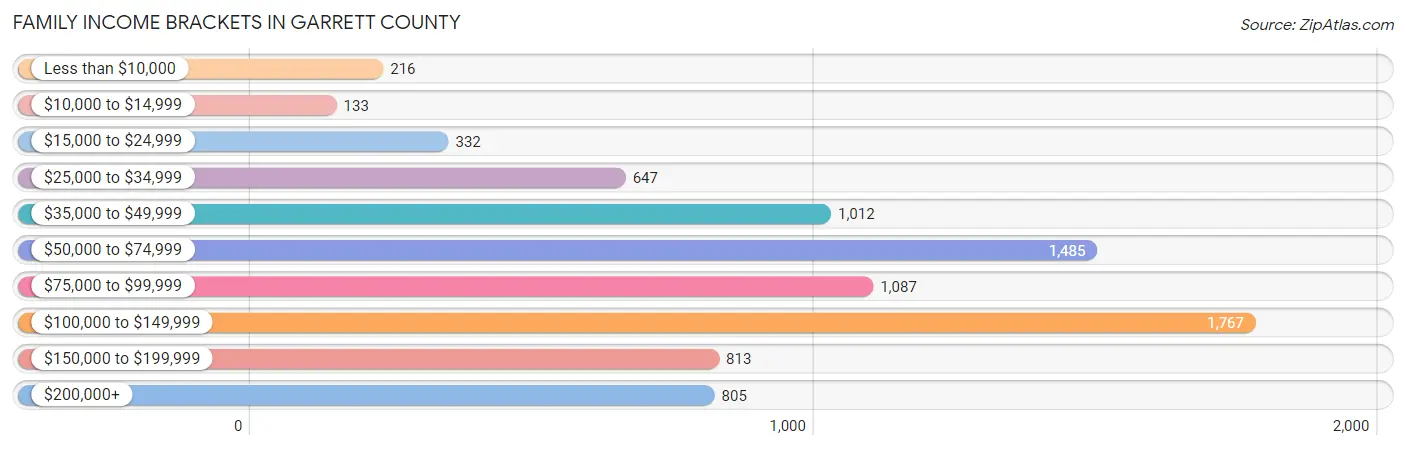
Family Income in Garrett County
Family Income Brackets in Garrett County
According to the Garrett County family income data, there are 1,767 families falling into the $100,000 to $149,999 income range, which is the most common income bracket and makes up 21.3% of all families. Conversely, the $10,000 to $14,999 income bracket is the least frequent group with only 133 families (1.6%) belonging to this category.
| Income Bracket | # Families | % Families |
| Less than $10,000 | 216 | 2.6% |
| $10,000 to $14,999 | 133 | 1.6% |
| $15,000 to $24,999 | 332 | 4.0% |
| $25,000 to $34,999 | 647 | 7.8% |
| $35,000 to $49,999 | 1,012 | 12.2% |
| $50,000 to $74,999 | 1,485 | 17.9% |
| $75,000 to $99,999 | 1,087 | 13.1% |
| $100,000 to $149,999 | 1,767 | 21.3% |
| $150,000 to $199,999 | 813 | 9.8% |
| $200,000+ | 805 | 9.7% |
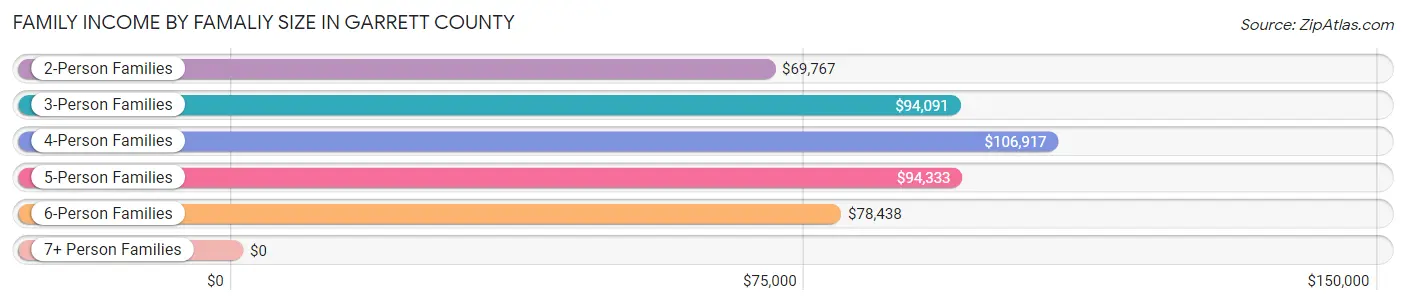
Family Income by Famaliy Size in Garrett County
4-person families (1,544 | 18.6%) account for the highest median family income in Garrett County with $106,917 per family, while 2-person families (4,689 | 56.5%) have the highest median income of $34,884 per family member.
| Income Bracket | # Families | Median Income |
| 2-Person Families | 4,689 (56.5%) | $69,767 |
| 3-Person Families | 1,530 (18.4%) | $94,091 |
| 4-Person Families | 1,544 (18.6%) | $106,917 |
| 5-Person Families | 276 (3.3%) | $94,333 |
| 6-Person Families | 215 (2.6%) | $78,438 |
| 7+ Person Families | 42 (0.5%) | $0 |
| Total | 8,296 (100.0%) | $81,575 |
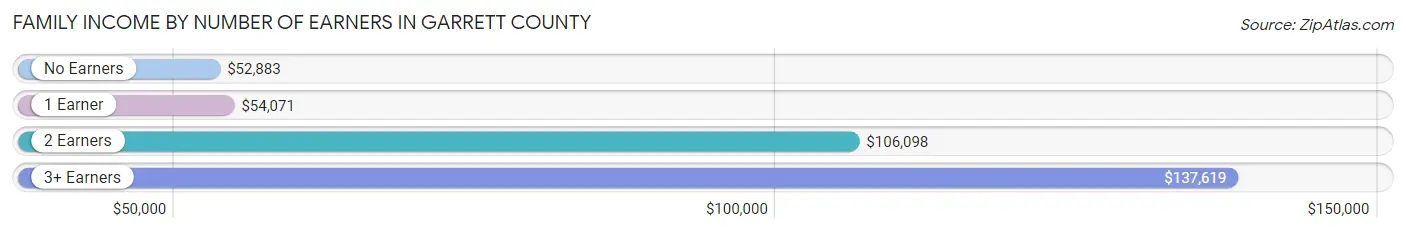
Family Income by Number of Earners in Garrett County
The median family income in Garrett County is $81,575, with families comprising 3+ earners (696) having the highest median family income of $137,619, while families with no earners (1,453) have the lowest median family income of $52,883, accounting for 8.4% and 17.5% of families, respectively.
| Number of Earners | # Families | Median Income |
| No Earners | 1,453 (17.5%) | $52,883 |
| 1 Earner | 2,576 (31.0%) | $54,071 |
| 2 Earners | 3,571 (43.0%) | $106,098 |
| 3+ Earners | 696 (8.4%) | $137,619 |
| Total | 8,296 (100.0%) | $81,575 |
Household Income in Garrett County
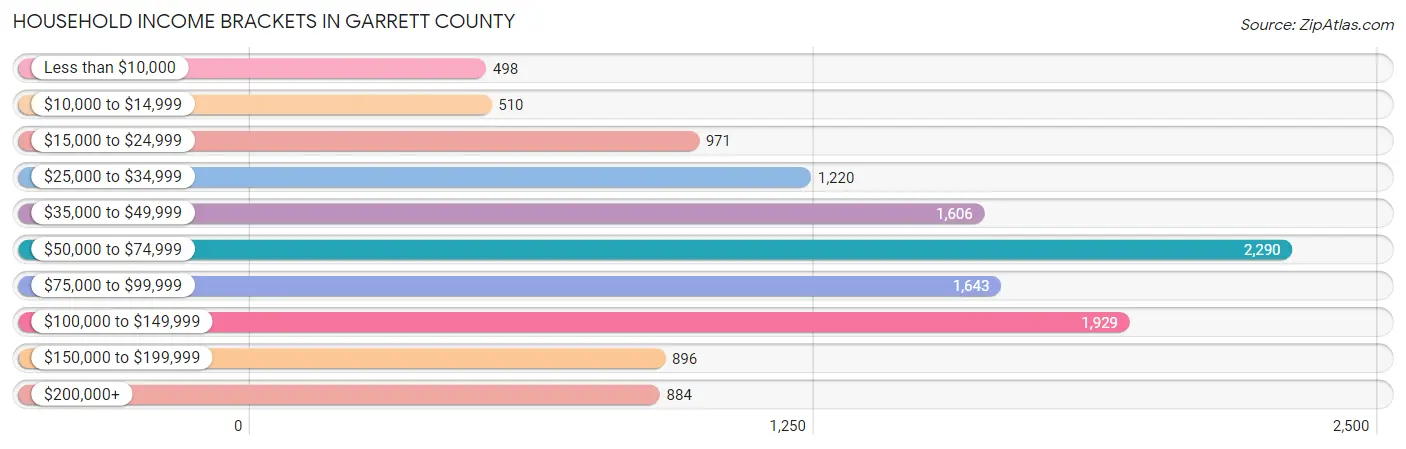
Household Income Brackets in Garrett County
With 2,290 households falling in the category, the $50,000 to $74,999 income range is the most frequent in Garrett County, accounting for 18.4% of all households. In contrast, only 498 households (4.0%) fall into the less than $10,000 income bracket, making it the least populous group.
| Income Bracket | # Households | % Households |
| Less than $10,000 | 498 | 4.0% |
| $10,000 to $14,999 | 510 | 4.1% |
| $15,000 to $24,999 | 971 | 7.8% |
| $25,000 to $34,999 | 1,220 | 9.8% |
| $35,000 to $49,999 | 1,606 | 12.9% |
| $50,000 to $74,999 | 2,290 | 18.4% |
| $75,000 to $99,999 | 1,643 | 13.2% |
| $100,000 to $149,999 | 1,929 | 15.5% |
| $150,000 to $199,999 | 896 | 7.2% |
| $200,000+ | 884 | 7.1% |
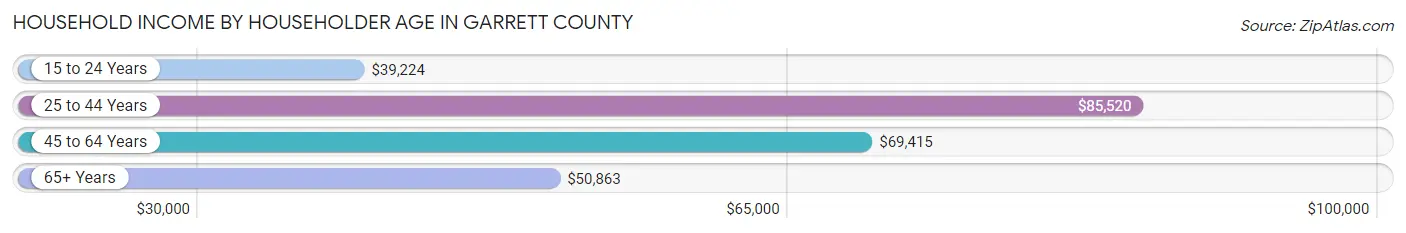
Household Income by Householder Age in Garrett County
The median household income in Garrett County is $64,447, with the highest median household income of $85,520 found in the 25 to 44 years age bracket for the primary householder. A total of 3,214 households (25.8%) fall into this category. Meanwhile, the 15 to 24 years age bracket for the primary householder has the lowest median household income of $39,224, with 370 households (3.0%) in this group.
| Income Bracket | # Households | Median Income |
| 15 to 24 Years | 370 (3.0%) | $39,224 |
| 25 to 44 Years | 3,214 (25.8%) | $85,520 |
| 45 to 64 Years | 4,743 (38.1%) | $69,415 |
| 65+ Years | 4,121 (33.1%) | $50,863 |
| Total | 12,448 (100.0%) | $64,447 |
Poverty in Garrett County
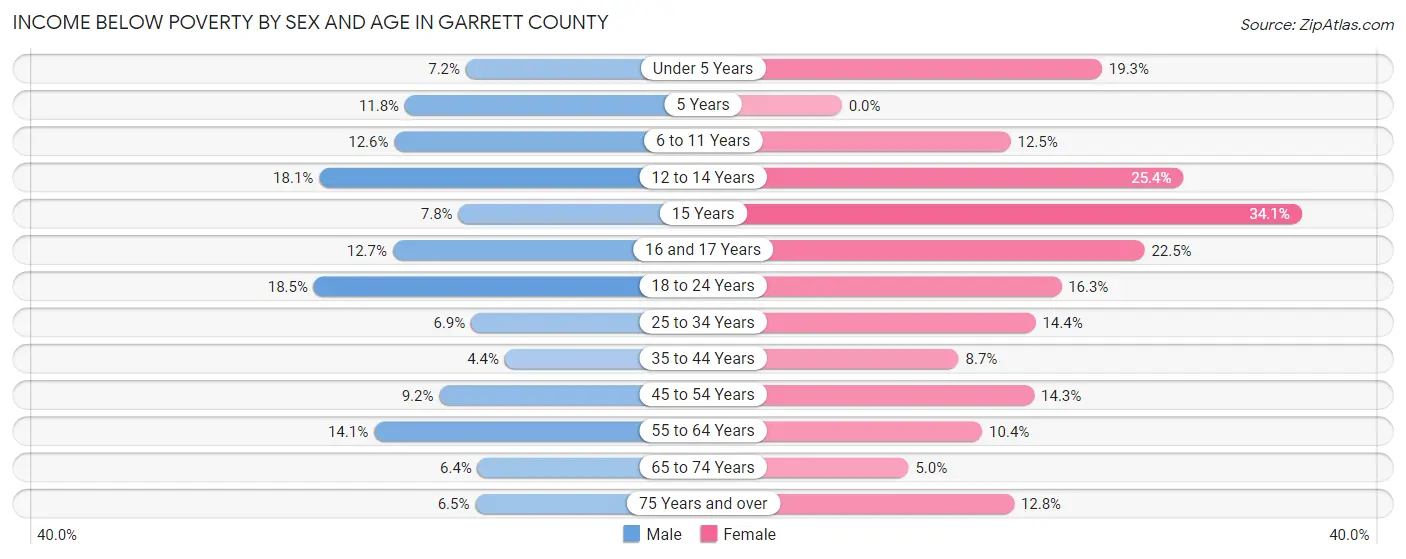
Income Below Poverty by Sex and Age in Garrett County
With 9.7% poverty level for males and 12.4% for females among the residents of Garrett County, 18 to 24 year old males and 15 year old females are the most vulnerable to poverty, with 199 males (18.5%) and 43 females (34.1%) in their respective age groups living below the poverty level.
| Age Bracket | Male | Female |
| Under 5 Years | 53 (7.2%) | 129 (19.3%) |
| 5 Years | 24 (11.8%) | 0 (0.0%) |
| 6 to 11 Years | 101 (12.6%) | 105 (12.5%) |
| 12 to 14 Years | 66 (18.1%) | 90 (25.4%) |
| 15 Years | 12 (7.8%) | 43 (34.1%) |
| 16 and 17 Years | 49 (12.7%) | 71 (22.5%) |
| 18 to 24 Years | 199 (18.5%) | 158 (16.3%) |
| 25 to 34 Years | 111 (6.9%) | 220 (14.4%) |
| 35 to 44 Years | 71 (4.3%) | 136 (8.7%) |
| 45 to 54 Years | 168 (9.2%) | 268 (14.3%) |
| 55 to 64 Years | 332 (14.1%) | 244 (10.4%) |
| 65 to 74 Years | 119 (6.4%) | 92 (5.0%) |
| 75 Years and over | 79 (6.5%) | 183 (12.8%) |
| Total | 1,384 (9.7%) | 1,739 (12.4%) |
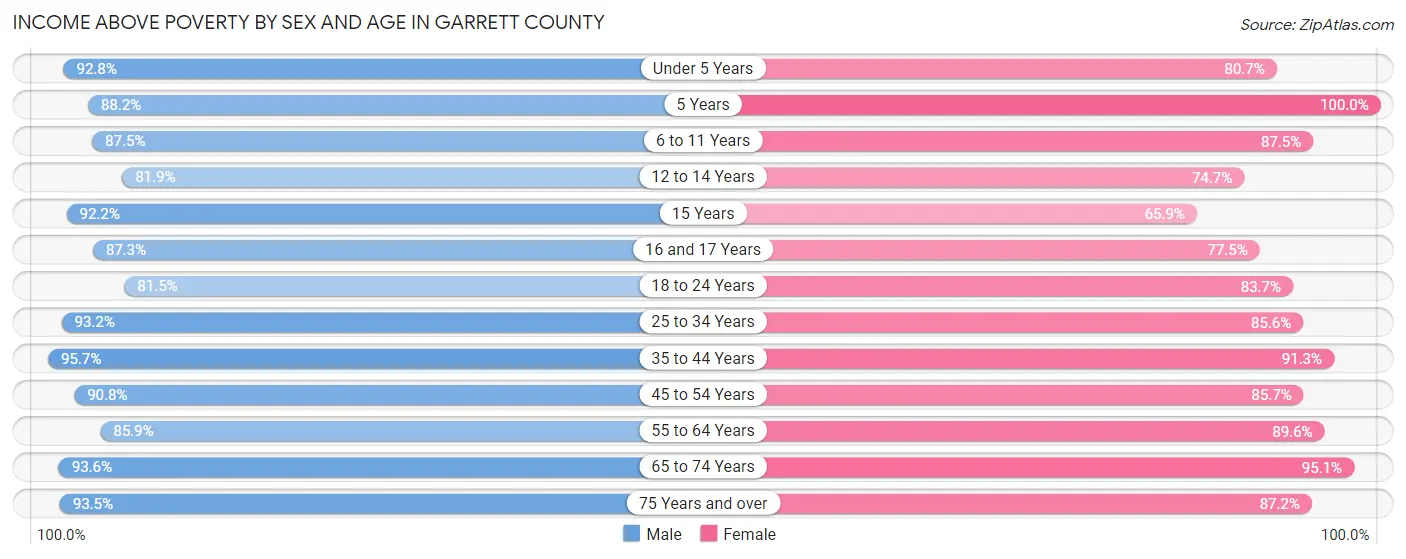
Income Above Poverty by Sex and Age in Garrett County
According to the poverty statistics in Garrett County, males aged 35 to 44 years and females aged 5 years are the age groups that are most secure financially, with 95.7% of males and 100.0% of females in these age groups living above the poverty line.
| Age Bracket | Male | Female |
| Under 5 Years | 679 (92.8%) | 539 (80.7%) |
| 5 Years | 180 (88.2%) | 122 (100.0%) |
| 6 to 11 Years | 704 (87.5%) | 733 (87.5%) |
| 12 to 14 Years | 298 (81.9%) | 265 (74.7%) |
| 15 Years | 142 (92.2%) | 83 (65.9%) |
| 16 and 17 Years | 338 (87.3%) | 245 (77.5%) |
| 18 to 24 Years | 875 (81.5%) | 812 (83.7%) |
| 25 to 34 Years | 1,509 (93.1%) | 1,310 (85.6%) |
| 35 to 44 Years | 1,561 (95.7%) | 1,433 (91.3%) |
| 45 to 54 Years | 1,656 (90.8%) | 1,609 (85.7%) |
| 55 to 64 Years | 2,029 (85.9%) | 2,097 (89.6%) |
| 65 to 74 Years | 1,751 (93.6%) | 1,765 (95.1%) |
| 75 Years and over | 1,129 (93.5%) | 1,249 (87.2%) |
| Total | 12,851 (90.3%) | 12,262 (87.6%) |
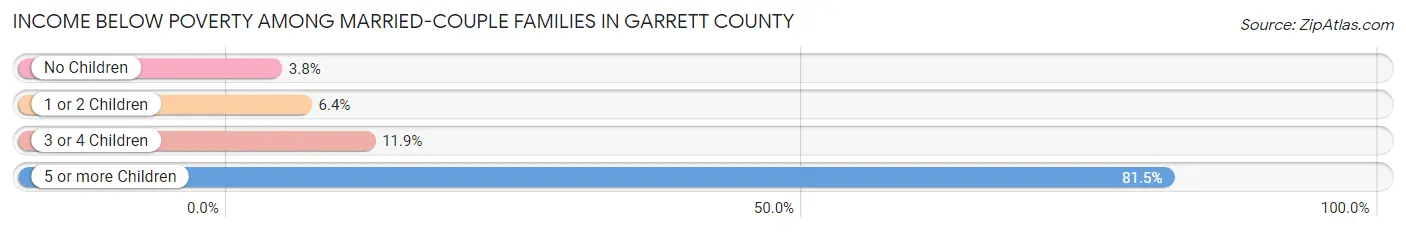
Income Below Poverty Among Married-Couple Families in Garrett County
The poverty statistics for married-couple families in Garrett County show that 5.3% or 348 of the total 6,548 families live below the poverty line. Families with 5 or more children have the highest poverty rate of 81.5%, comprising of 22 families. On the other hand, families with no children have the lowest poverty rate of 3.8%, which includes 166 families.
| Children | Above Poverty | Below Poverty |
| No Children | 4,180 (96.2%) | 166 (3.8%) |
| 1 or 2 Children | 1,683 (93.6%) | 115 (6.4%) |
| 3 or 4 Children | 332 (88.1%) | 45 (11.9%) |
| 5 or more Children | 5 (18.5%) | 22 (81.5%) |
| Total | 6,200 (94.7%) | 348 (5.3%) |
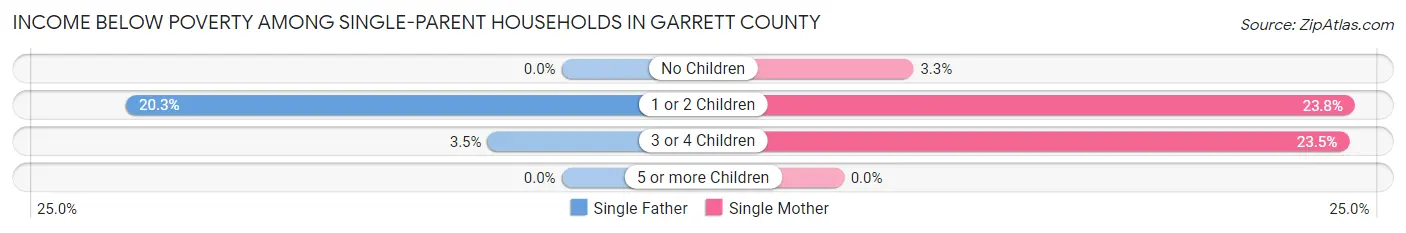
Income Below Poverty Among Single-Parent Households in Garrett County
According to the poverty data in Garrett County, 12.2% or 63 single-father households and 16.1% or 198 single-mother households are living below the poverty line. Among single-father households, those with 1 or 2 children have the highest poverty rate, with 61 households (20.3%) experiencing poverty. Likewise, among single-mother households, those with 1 or 2 children have the highest poverty rate, with 159 households (23.8%) falling below the poverty line.
| Children | Single Father | Single Mother |
| No Children | 0 (0.0%) | 15 (3.3%) |
| 1 or 2 Children | 61 (20.3%) | 159 (23.8%) |
| 3 or 4 Children | 2 (3.5%) | 24 (23.5%) |
| 5 or more Children | 0 (0.0%) | 0 (0.0%) |
| Total | 63 (12.2%) | 198 (16.1%) |
Income Below Poverty Among Married-Couple vs Single-Parent Households in Garrett County
The poverty data for Garrett County shows that 348 of the married-couple family households (5.3%) and 261 of the single-parent households (14.9%) are living below the poverty level. Within the married-couple family households, those with 5 or more children have the highest poverty rate, with 22 households (81.5%) falling below the poverty line. Among the single-parent households, those with 1 or 2 children have the highest poverty rate, with 220 household (22.7%) living below poverty.
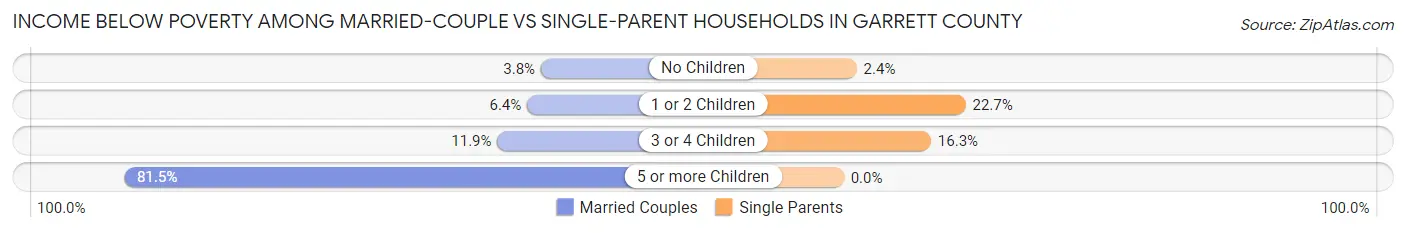
| Children | Married-Couple Families | Single-Parent Households |
| No Children | 166 (3.8%) | 15 (2.4%) |
| 1 or 2 Children | 115 (6.4%) | 220 (22.7%) |
| 3 or 4 Children | 45 (11.9%) | 26 (16.3%) |
| 5 or more Children | 22 (81.5%) | 0 (0.0%) |
| Total | 348 (5.3%) | 261 (14.9%) |
Employment Characteristics in Garrett County
Employment by Class of Employer in Garrett County
Among the 13,283 employed individuals in Garrett County, private company employees (7,749 | 58.3%), not-for-profit organizations (1,210 | 9.1%), and local government employees (1,179 | 8.9%) make up the most common classes of employment.
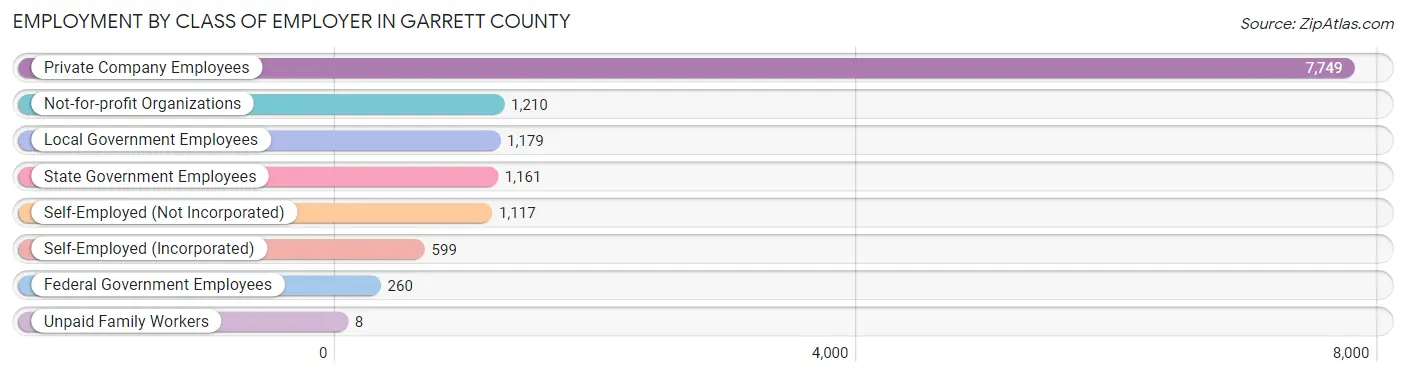
| Employer Class | # Employees | % Employees |
| Private Company Employees | 7,749 | 58.3% |
| Self-Employed (Incorporated) | 599 | 4.5% |
| Self-Employed (Not Incorporated) | 1,117 | 8.4% |
| Not-for-profit Organizations | 1,210 | 9.1% |
| Local Government Employees | 1,179 | 8.9% |
| State Government Employees | 1,161 | 8.7% |
| Federal Government Employees | 260 | 2.0% |
| Unpaid Family Workers | 8 | 0.1% |
| Total | 13,283 | 100.0% |
Employment Status by Age in Garrett County
According to the labor force statistics for Garrett County, out of the total population over 16 years of age (24,411), 58.3% or 14,232 individuals are in the labor force, with 4.6% or 655 of them unemployed. The age group with the highest labor force participation rate is 30 to 34 years, with 89.9% or 1,393 individuals in the labor force. Within the labor force, the 20 to 24 years age range has the highest percentage of unemployed individuals, with 11.8% or 134 of them being unemployed.
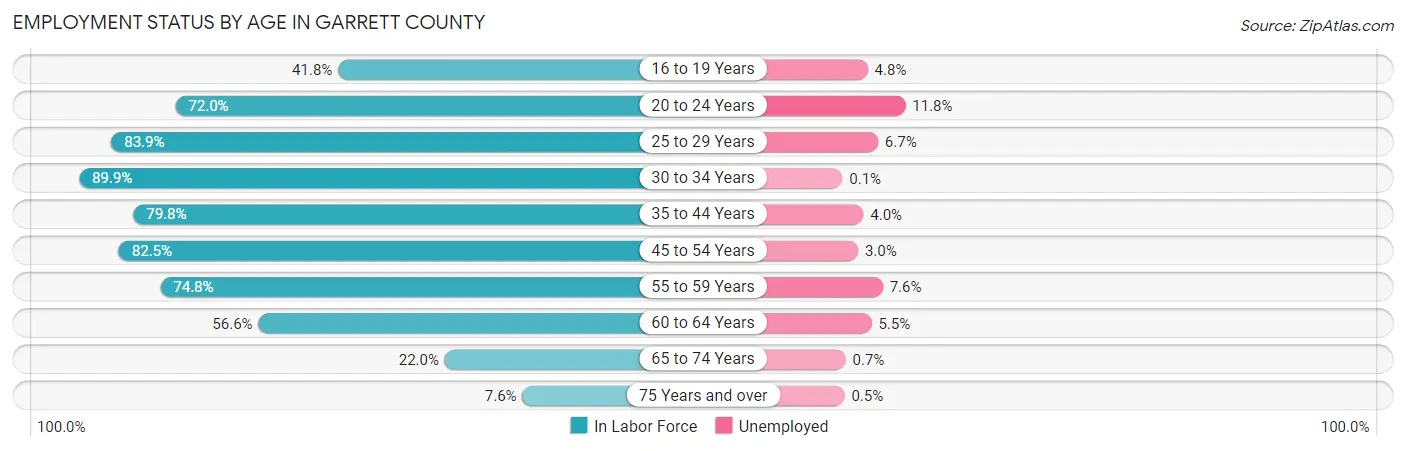
| Age Bracket | In Labor Force | Unemployed |
| 16 to 19 Years | 585 (41.8%) | 28 (4.8%) |
| 20 to 24 Years | 1,132 (72.0%) | 134 (11.8%) |
| 25 to 29 Years | 1,360 (83.9%) | 91 (6.7%) |
| 30 to 34 Years | 1,393 (89.9%) | 1 (0.1%) |
| 35 to 44 Years | 2,573 (79.8%) | 103 (4.0%) |
| 45 to 54 Years | 3,053 (82.5%) | 92 (3.0%) |
| 55 to 59 Years | 1,640 (74.8%) | 125 (7.6%) |
| 60 to 64 Years | 1,430 (56.6%) | 79 (5.5%) |
| 65 to 74 Years | 839 (22.0%) | 6 (0.7%) |
| 75 Years and over | 214 (7.6%) | 1 (0.5%) |
| Total | 14,232 (58.3%) | 655 (4.6%) |
Employment Status by Educational Attainment in Garrett County
According to labor force statistics for Garrett County, 77.3% of individuals (11,450) out of the total population between 25 and 64 years of age (14,813) are in the labor force, with 4.3% or 492 of them being unemployed. The group with the highest labor force participation rate are those with the educational attainment of bachelor's degree or higher, with 85.9% or 3,096 individuals in the labor force. Within the labor force, individuals with less than high school education have the highest percentage of unemployment, with 11.6% or 67 of them being unemployed.
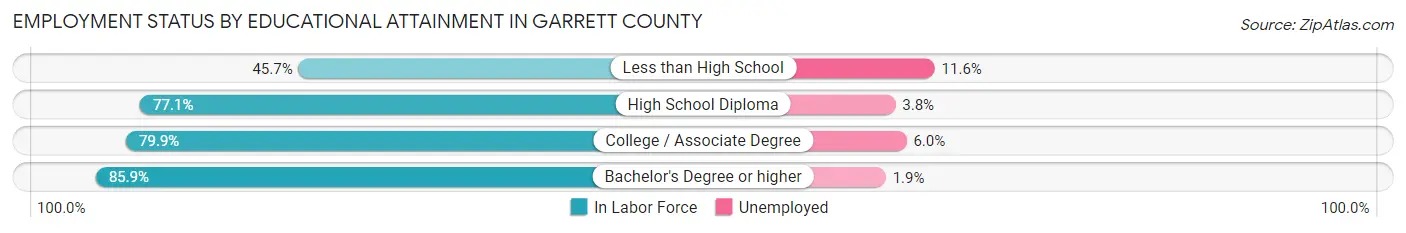
| Educational Attainment | In Labor Force | Unemployed |
| Less than High School | 579 (45.7%) | 147 (11.6%) |
| High School Diploma | 4,620 (77.1%) | 228 (3.8%) |
| College / Associate Degree | 3,157 (79.9%) | 237 (6.0%) |
| Bachelor's Degree or higher | 3,096 (85.9%) | 68 (1.9%) |
| Total | 11,450 (77.3%) | 637 (4.3%) |
Employment Occupations by Sex in Garrett County
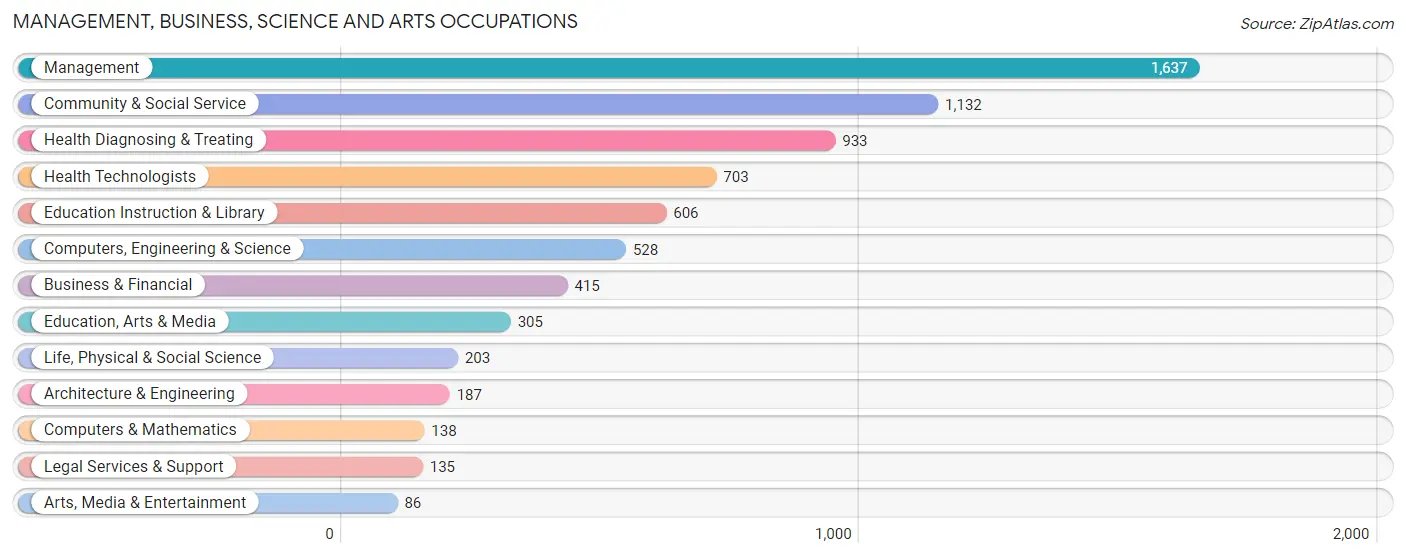
Management, Business, Science and Arts Occupations
The most common Management, Business, Science and Arts occupations in Garrett County are Management (1,637 | 12.1%), Community & Social Service (1,132 | 8.4%), Health Diagnosing & Treating (933 | 6.9%), Health Technologists (703 | 5.2%), and Education Instruction & Library (606 | 4.5%).
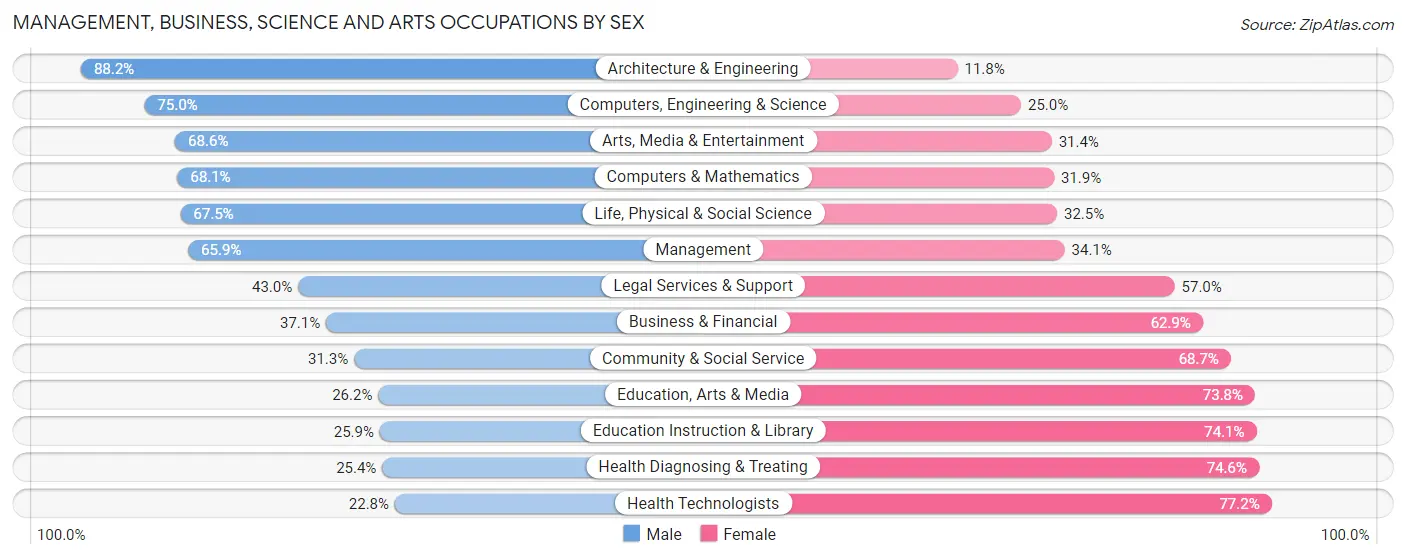
Management, Business, Science and Arts Occupations by Sex
Within the Management, Business, Science and Arts occupations in Garrett County, the most male-oriented occupations are Architecture & Engineering (88.2%), Computers, Engineering & Science (75.0%), and Arts, Media & Entertainment (68.6%), while the most female-oriented occupations are Health Technologists (77.2%), Health Diagnosing & Treating (74.6%), and Education Instruction & Library (74.1%).
| Occupation | Male | Female |
| Management | 1,079 (65.9%) | 558 (34.1%) |
| Business & Financial | 154 (37.1%) | 261 (62.9%) |
| Computers, Engineering & Science | 396 (75.0%) | 132 (25.0%) |
| Computers & Mathematics | 94 (68.1%) | 44 (31.9%) |
| Architecture & Engineering | 165 (88.2%) | 22 (11.8%) |
| Life, Physical & Social Science | 137 (67.5%) | 66 (32.5%) |
| Community & Social Service | 354 (31.3%) | 778 (68.7%) |
| Education, Arts & Media | 80 (26.2%) | 225 (73.8%) |
| Legal Services & Support | 58 (43.0%) | 77 (57.0%) |
| Education Instruction & Library | 157 (25.9%) | 449 (74.1%) |
| Arts, Media & Entertainment | 59 (68.6%) | 27 (31.4%) |
| Health Diagnosing & Treating | 237 (25.4%) | 696 (74.6%) |
| Health Technologists | 160 (22.8%) | 543 (77.2%) |
| Total (Category) | 2,220 (47.8%) | 2,425 (52.2%) |
| Total (Overall) | 7,445 (54.9%) | 6,110 (45.1%) |
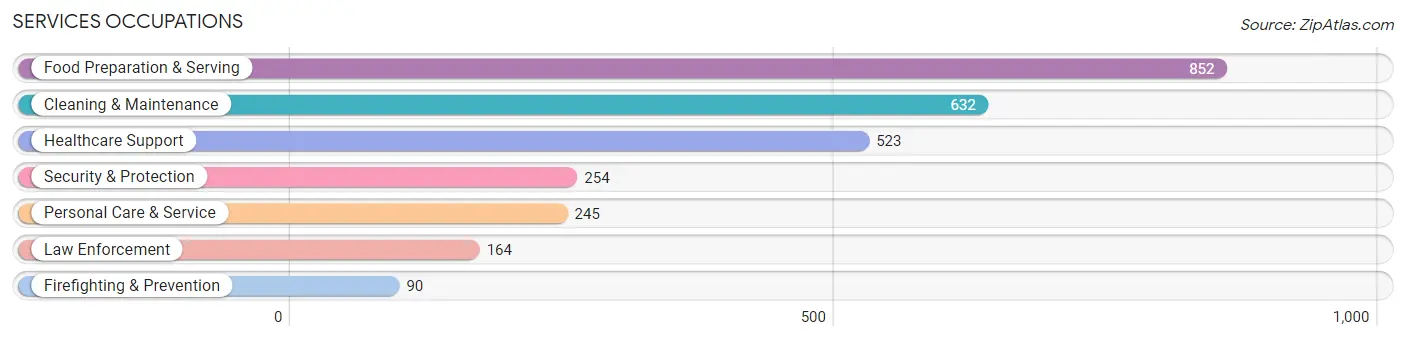
Services Occupations
The most common Services occupations in Garrett County are Food Preparation & Serving (852 | 6.3%), Cleaning & Maintenance (632 | 4.7%), Healthcare Support (523 | 3.9%), Security & Protection (254 | 1.9%), and Personal Care & Service (245 | 1.8%).
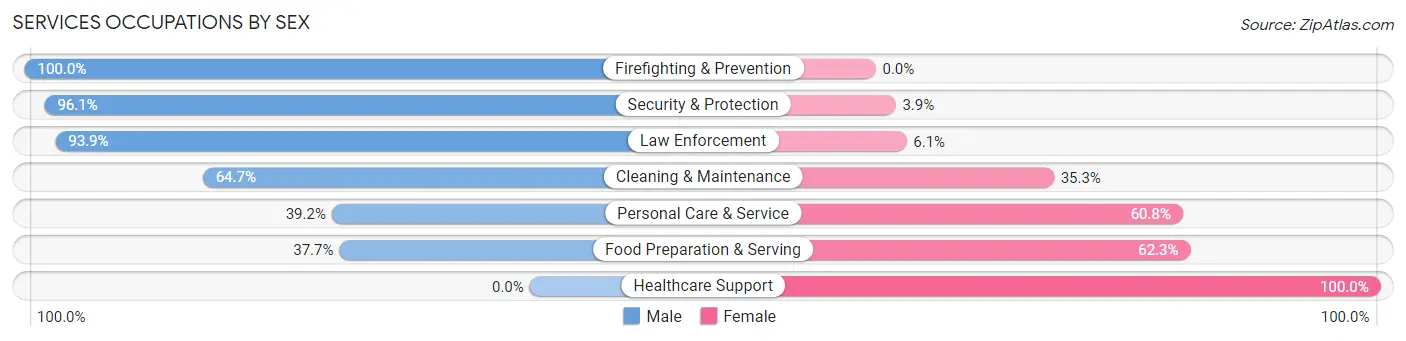
Services Occupations by Sex
Within the Services occupations in Garrett County, the most male-oriented occupations are Firefighting & Prevention (100.0%), Security & Protection (96.1%), and Law Enforcement (93.9%), while the most female-oriented occupations are Healthcare Support (100.0%), Food Preparation & Serving (62.3%), and Personal Care & Service (60.8%).
| Occupation | Male | Female |
| Healthcare Support | 0 (0.0%) | 523 (100.0%) |
| Security & Protection | 244 (96.1%) | 10 (3.9%) |
| Firefighting & Prevention | 90 (100.0%) | 0 (0.0%) |
| Law Enforcement | 154 (93.9%) | 10 (6.1%) |
| Food Preparation & Serving | 321 (37.7%) | 531 (62.3%) |
| Cleaning & Maintenance | 409 (64.7%) | 223 (35.3%) |
| Personal Care & Service | 96 (39.2%) | 149 (60.8%) |
| Total (Category) | 1,070 (42.7%) | 1,436 (57.3%) |
| Total (Overall) | 7,445 (54.9%) | 6,110 (45.1%) |
Sales and Office Occupations
The most common Sales and Office occupations in Garrett County are Office & Administration (1,553 | 11.5%), and Sales & Related (1,133 | 8.4%).
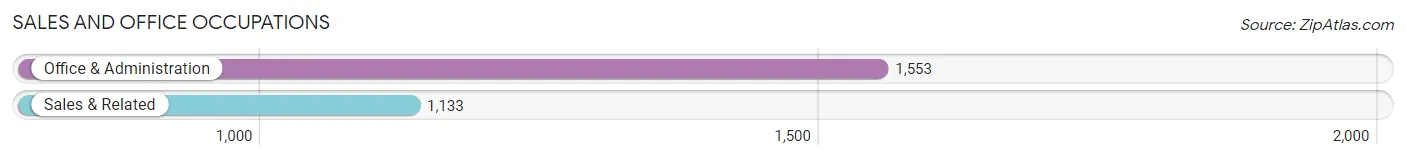
Sales and Office Occupations by Sex
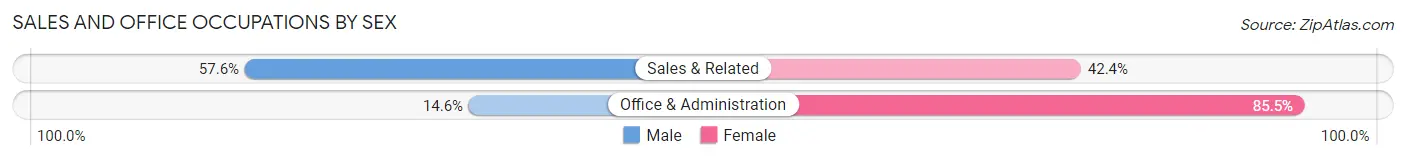
| Occupation | Male | Female |
| Sales & Related | 653 (57.6%) | 480 (42.4%) |
| Office & Administration | 226 (14.5%) | 1,327 (85.5%) |
| Total (Category) | 879 (32.7%) | 1,807 (67.3%) |
| Total (Overall) | 7,445 (54.9%) | 6,110 (45.1%) |
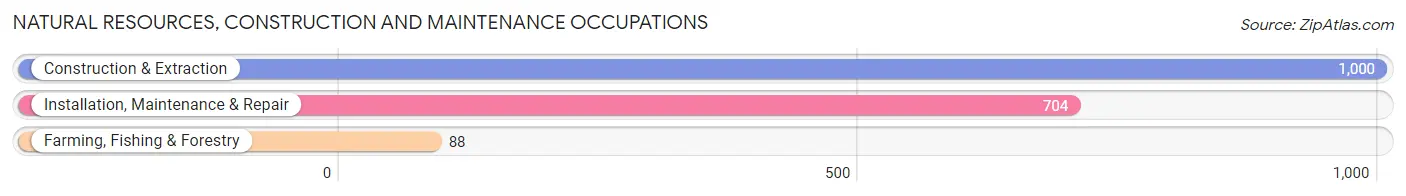
Natural Resources, Construction and Maintenance Occupations
The most common Natural Resources, Construction and Maintenance occupations in Garrett County are Construction & Extraction (1,000 | 7.4%), Installation, Maintenance & Repair (704 | 5.2%), and Farming, Fishing & Forestry (88 | 0.6%).
Natural Resources, Construction and Maintenance Occupations by Sex
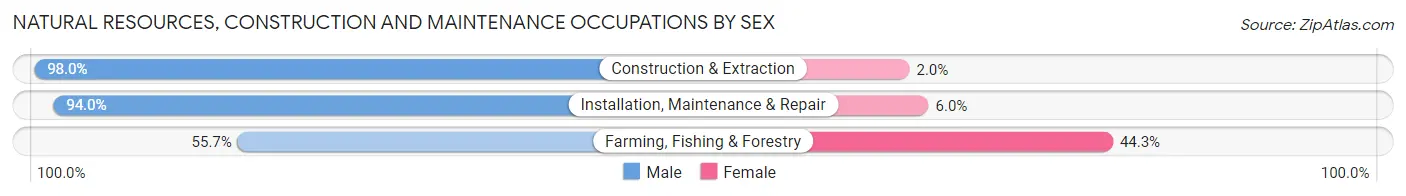
| Occupation | Male | Female |
| Farming, Fishing & Forestry | 49 (55.7%) | 39 (44.3%) |
| Construction & Extraction | 980 (98.0%) | 20 (2.0%) |
| Installation, Maintenance & Repair | 662 (94.0%) | 42 (6.0%) |
| Total (Category) | 1,691 (94.4%) | 101 (5.6%) |
| Total (Overall) | 7,445 (54.9%) | 6,110 (45.1%) |
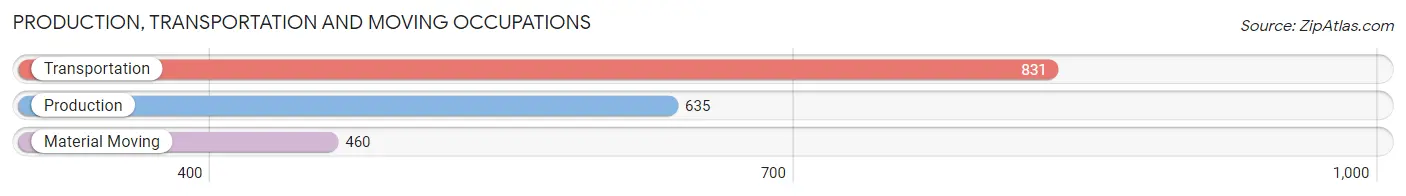
Production, Transportation and Moving Occupations
The most common Production, Transportation and Moving occupations in Garrett County are Transportation (831 | 6.1%), Production (635 | 4.7%), and Material Moving (460 | 3.4%).
Production, Transportation and Moving Occupations by Sex
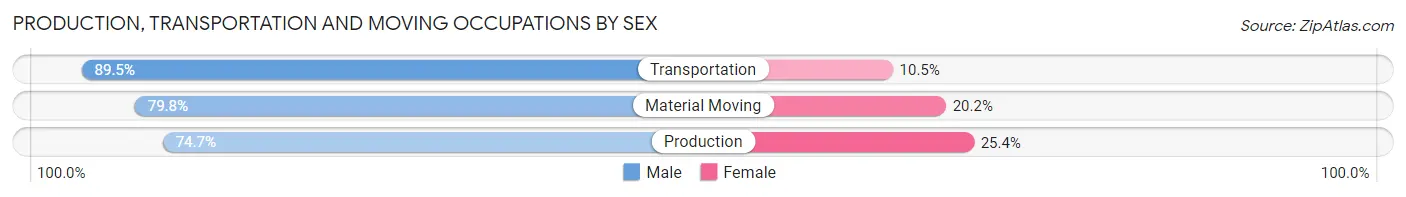
| Occupation | Male | Female |
| Production | 474 (74.7%) | 161 (25.4%) |
| Transportation | 744 (89.5%) | 87 (10.5%) |
| Material Moving | 367 (79.8%) | 93 (20.2%) |
| Total (Category) | 1,585 (82.3%) | 341 (17.7%) |
| Total (Overall) | 7,445 (54.9%) | 6,110 (45.1%) |
Employment Industries by Sex in Garrett County
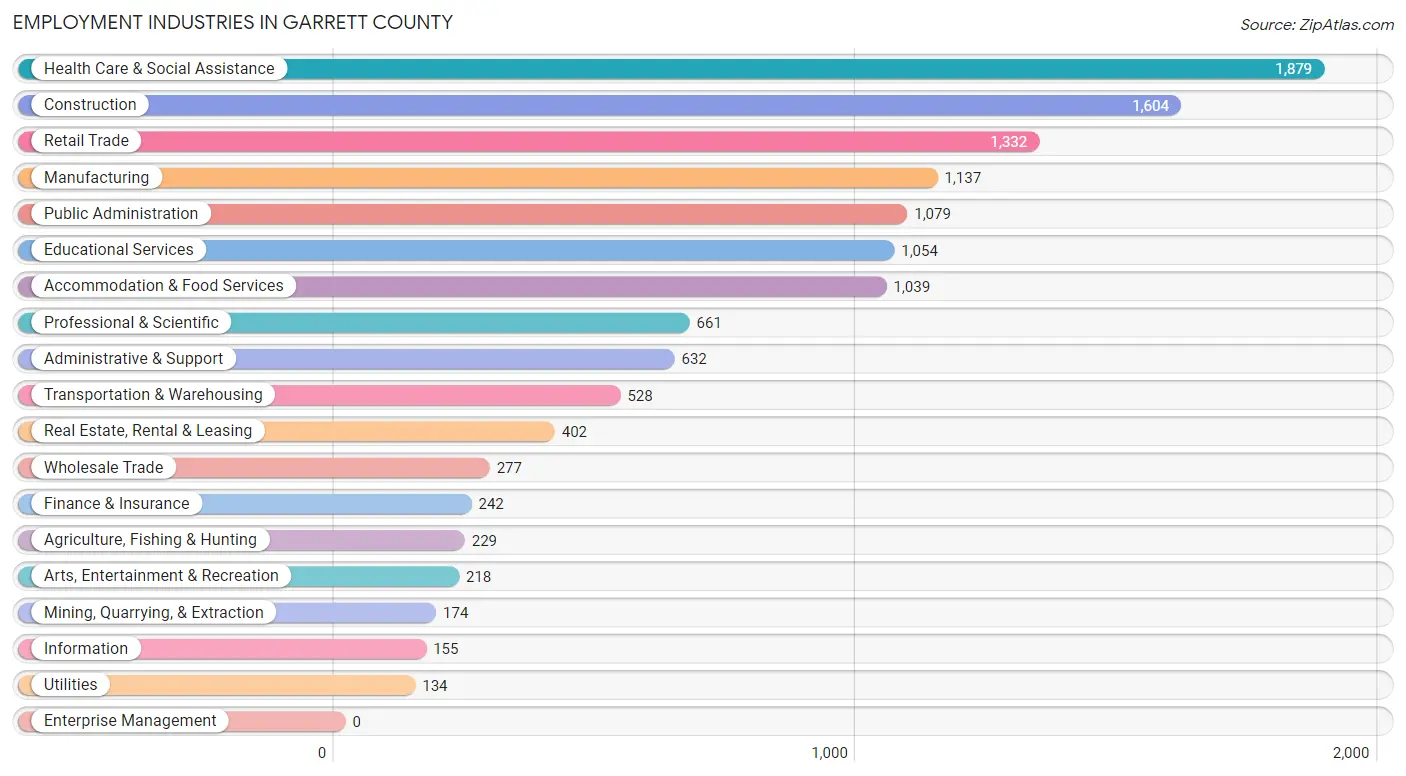
Employment Industries in Garrett County
The major employment industries in Garrett County include Health Care & Social Assistance (1,879 | 13.9%), Construction (1,604 | 11.8%), Retail Trade (1,332 | 9.8%), Manufacturing (1,137 | 8.4%), and Public Administration (1,079 | 8.0%).
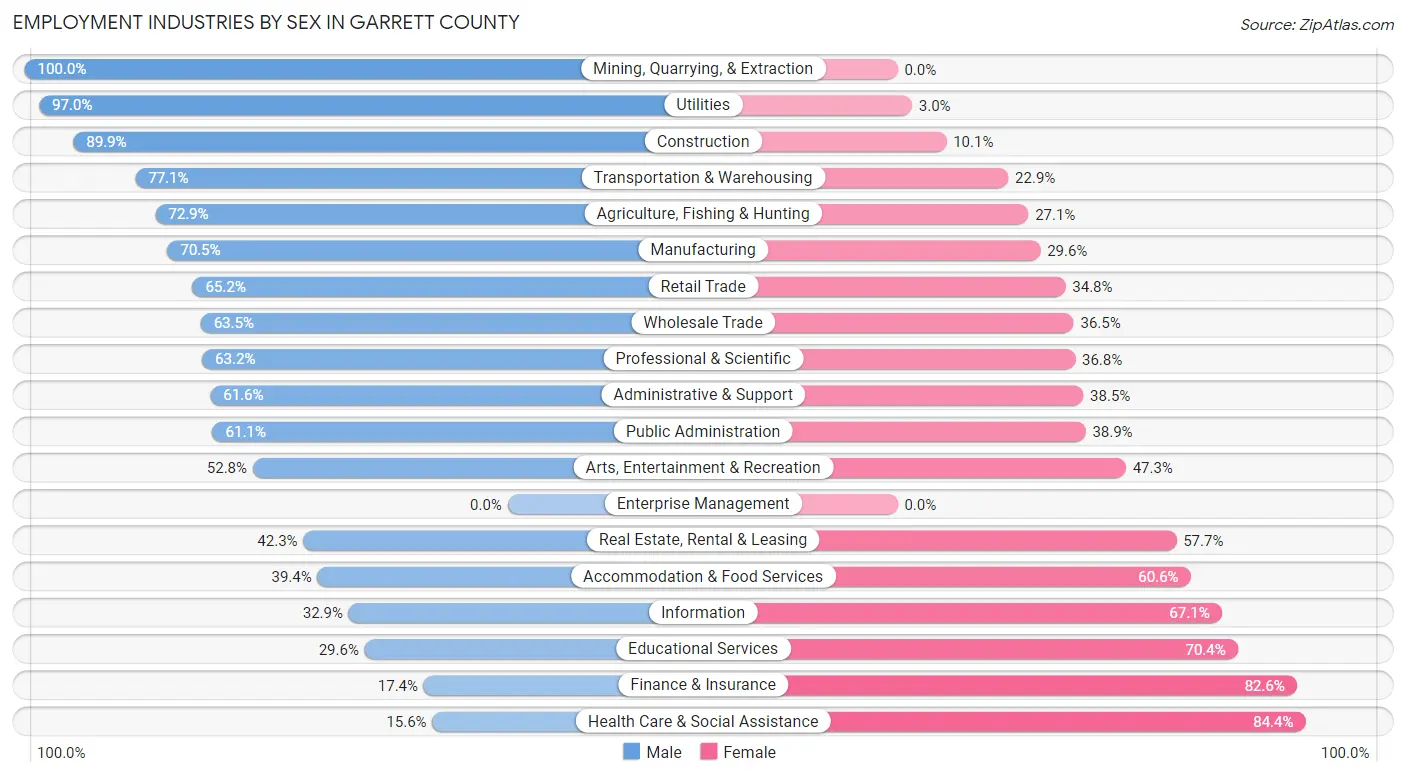
Employment Industries by Sex in Garrett County
The Garrett County industries that see more men than women are Mining, Quarrying, & Extraction (100.0%), Utilities (97.0%), and Construction (89.9%), whereas the industries that tend to have a higher number of women are Health Care & Social Assistance (84.4%), Finance & Insurance (82.6%), and Educational Services (70.4%).
| Industry | Male | Female |
| Agriculture, Fishing & Hunting | 167 (72.9%) | 62 (27.1%) |
| Mining, Quarrying, & Extraction | 174 (100.0%) | 0 (0.0%) |
| Construction | 1,442 (89.9%) | 162 (10.1%) |
| Manufacturing | 801 (70.5%) | 336 (29.5%) |
| Wholesale Trade | 176 (63.5%) | 101 (36.5%) |
| Retail Trade | 869 (65.2%) | 463 (34.8%) |
| Transportation & Warehousing | 407 (77.1%) | 121 (22.9%) |
| Utilities | 130 (97.0%) | 4 (3.0%) |
| Information | 51 (32.9%) | 104 (67.1%) |
| Finance & Insurance | 42 (17.4%) | 200 (82.6%) |
| Real Estate, Rental & Leasing | 170 (42.3%) | 232 (57.7%) |
| Professional & Scientific | 418 (63.2%) | 243 (36.8%) |
| Enterprise Management | 0 (0.0%) | 0 (0.0%) |
| Administrative & Support | 389 (61.6%) | 243 (38.5%) |
| Educational Services | 312 (29.6%) | 742 (70.4%) |
| Health Care & Social Assistance | 293 (15.6%) | 1,586 (84.4%) |
| Arts, Entertainment & Recreation | 115 (52.7%) | 103 (47.2%) |
| Accommodation & Food Services | 409 (39.4%) | 630 (60.6%) |
| Public Administration | 659 (61.1%) | 420 (38.9%) |
| Total | 7,445 (54.9%) | 6,110 (45.1%) |
Education in Garrett County
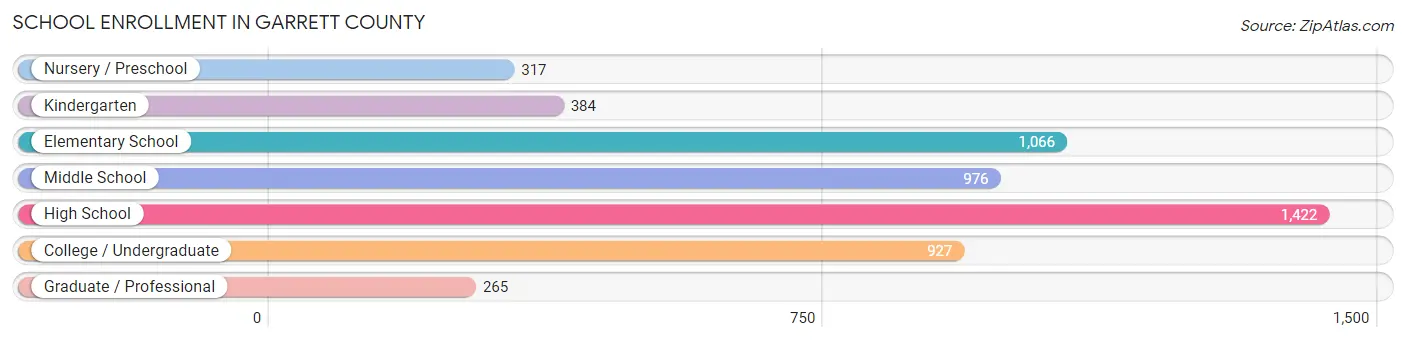
School Enrollment in Garrett County
The most common levels of schooling among the 5,357 students in Garrett County are high school (1,422 | 26.5%), elementary school (1,066 | 19.9%), and middle school (976 | 18.2%).
| School Level | # Students | % Students |
| Nursery / Preschool | 317 | 5.9% |
| Kindergarten | 384 | 7.2% |
| Elementary School | 1,066 | 19.9% |
| Middle School | 976 | 18.2% |
| High School | 1,422 | 26.5% |
| College / Undergraduate | 927 | 17.3% |
| Graduate / Professional | 265 | 5.0% |
| Total | 5,357 | 100.0% |
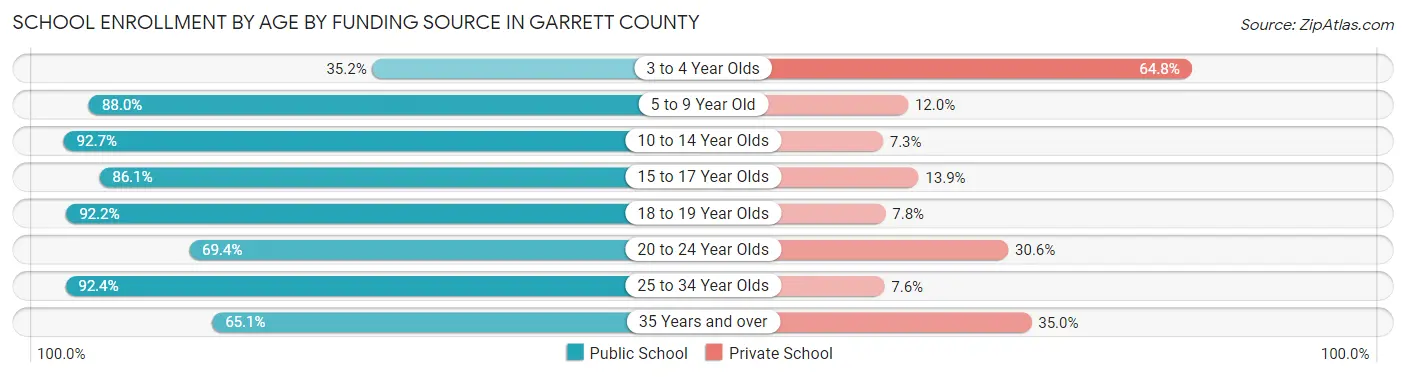
School Enrollment by Age by Funding Source in Garrett County
Out of a total of 5,357 students who are enrolled in schools in Garrett County, 820 (15.3%) attend a private institution, while the remaining 4,537 (84.7%) are enrolled in public schools. The age group of 3 to 4 year olds has the highest likelihood of being enrolled in private schools, with 116 (64.8% in the age bracket) enrolled. Conversely, the age group of 10 to 14 year olds has the lowest likelihood of being enrolled in a private school, with 1,095 (92.7% in the age bracket) attending a public institution.
| Age Bracket | Public School | Private School |
| 3 to 4 Year Olds | 63 (35.2%) | 116 (64.8%) |
| 5 to 9 Year Old | 1,308 (88.0%) | 178 (12.0%) |
| 10 to 14 Year Olds | 1,095 (92.7%) | 86 (7.3%) |
| 15 to 17 Year Olds | 872 (86.1%) | 141 (13.9%) |
| 18 to 19 Year Olds | 499 (92.2%) | 42 (7.8%) |
| 20 to 24 Year Olds | 317 (69.4%) | 140 (30.6%) |
| 25 to 34 Year Olds | 195 (92.4%) | 16 (7.6%) |
| 35 Years and over | 188 (65.0%) | 101 (34.9%) |
| Total | 4,537 (84.7%) | 820 (15.3%) |
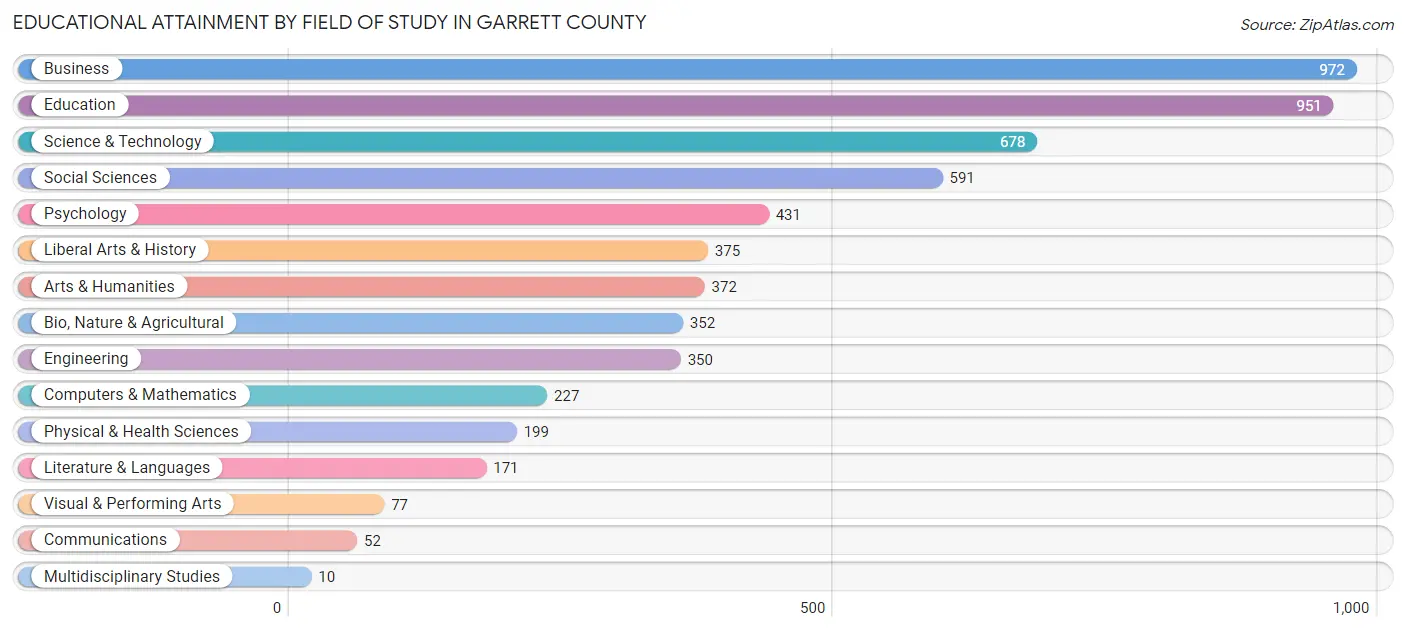
Educational Attainment by Field of Study in Garrett County
Business (972 | 16.7%), education (951 | 16.4%), science & technology (678 | 11.7%), social sciences (591 | 10.2%), and psychology (431 | 7.4%) are the most common fields of study among 5,808 individuals in Garrett County who have obtained a bachelor's degree or higher.
| Field of Study | # Graduates | % Graduates |
| Computers & Mathematics | 227 | 3.9% |
| Bio, Nature & Agricultural | 352 | 6.1% |
| Physical & Health Sciences | 199 | 3.4% |
| Psychology | 431 | 7.4% |
| Social Sciences | 591 | 10.2% |
| Engineering | 350 | 6.0% |
| Multidisciplinary Studies | 10 | 0.2% |
| Science & Technology | 678 | 11.7% |
| Business | 972 | 16.7% |
| Education | 951 | 16.4% |
| Literature & Languages | 171 | 2.9% |
| Liberal Arts & History | 375 | 6.5% |
| Visual & Performing Arts | 77 | 1.3% |
| Communications | 52 | 0.9% |
| Arts & Humanities | 372 | 6.4% |
| Total | 5,808 | 100.0% |
Transportation & Commute in Garrett County
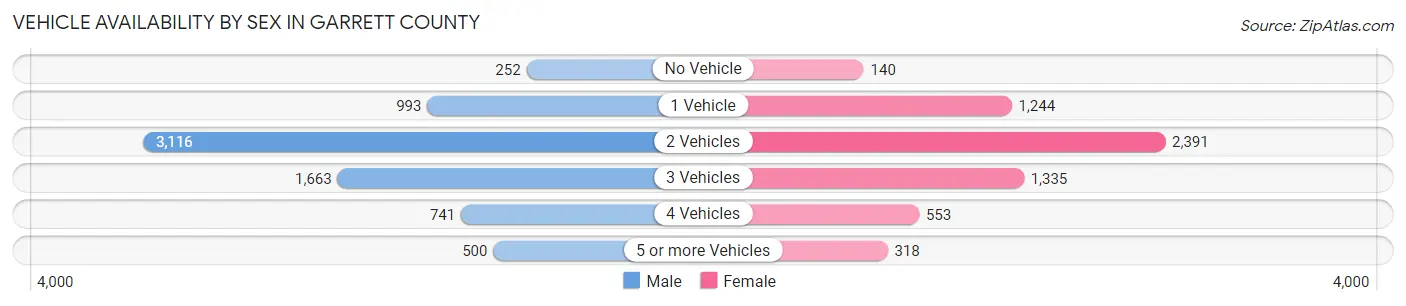
Vehicle Availability by Sex in Garrett County
The most prevalent vehicle ownership categories in Garrett County are males with 2 vehicles (3,116, accounting for 42.9%) and females with 2 vehicles (2,391, making up 52.1%).
| Vehicles Available | Male | Female |
| No Vehicle | 252 (3.5%) | 140 (2.3%) |
| 1 Vehicle | 993 (13.7%) | 1,244 (20.8%) |
| 2 Vehicles | 3,116 (42.9%) | 2,391 (40.0%) |
| 3 Vehicles | 1,663 (22.9%) | 1,335 (22.3%) |
| 4 Vehicles | 741 (10.2%) | 553 (9.2%) |
| 5 or more Vehicles | 500 (6.9%) | 318 (5.3%) |
| Total | 7,265 (100.0%) | 5,981 (100.0%) |
Commute Time in Garrett County
The most frequently occuring commute durations in Garrett County are 15 to 19 minutes (2,074 commuters, 17.3%), 5 to 9 minutes (1,710 commuters, 14.3%), and 10 to 14 minutes (1,538 commuters, 12.9%).
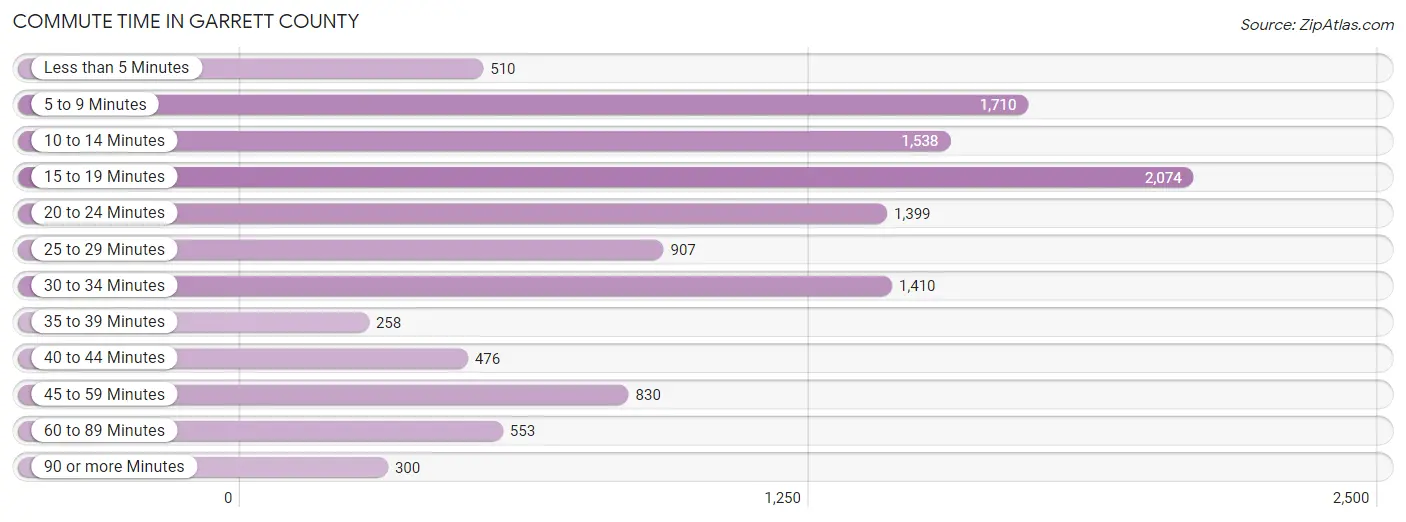
| Commute Time | # Commuters | % Commuters |
| Less than 5 Minutes | 510 | 4.3% |
| 5 to 9 Minutes | 1,710 | 14.3% |
| 10 to 14 Minutes | 1,538 | 12.9% |
| 15 to 19 Minutes | 2,074 | 17.3% |
| 20 to 24 Minutes | 1,399 | 11.7% |
| 25 to 29 Minutes | 907 | 7.6% |
| 30 to 34 Minutes | 1,410 | 11.8% |
| 35 to 39 Minutes | 258 | 2.2% |
| 40 to 44 Minutes | 476 | 4.0% |
| 45 to 59 Minutes | 830 | 6.9% |
| 60 to 89 Minutes | 553 | 4.6% |
| 90 or more Minutes | 300 | 2.5% |
Commute Time by Sex in Garrett County
The most common commute times in Garrett County are 15 to 19 minutes (1,186 commuters, 17.7%) for males and 15 to 19 minutes (888 commuters, 16.8%) for females.
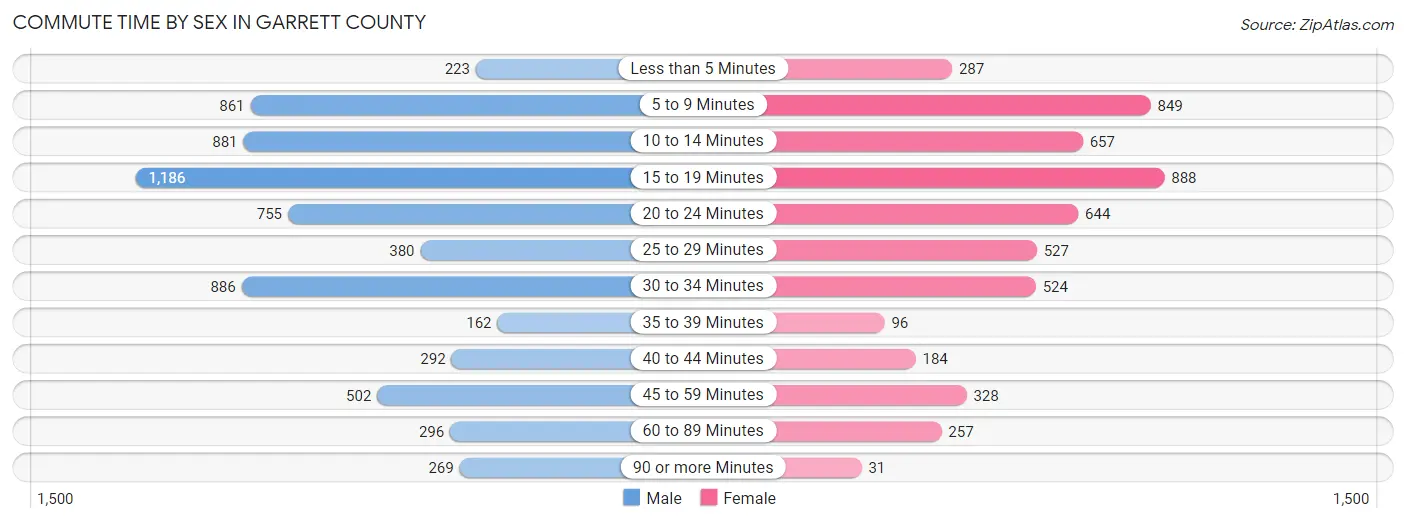
| Commute Time | Male | Female |
| Less than 5 Minutes | 223 (3.3%) | 287 (5.4%) |
| 5 to 9 Minutes | 861 (12.9%) | 849 (16.1%) |
| 10 to 14 Minutes | 881 (13.2%) | 657 (12.5%) |
| 15 to 19 Minutes | 1,186 (17.7%) | 888 (16.8%) |
| 20 to 24 Minutes | 755 (11.3%) | 644 (12.2%) |
| 25 to 29 Minutes | 380 (5.7%) | 527 (10.0%) |
| 30 to 34 Minutes | 886 (13.2%) | 524 (9.9%) |
| 35 to 39 Minutes | 162 (2.4%) | 96 (1.8%) |
| 40 to 44 Minutes | 292 (4.4%) | 184 (3.5%) |
| 45 to 59 Minutes | 502 (7.5%) | 328 (6.2%) |
| 60 to 89 Minutes | 296 (4.4%) | 257 (4.9%) |
| 90 or more Minutes | 269 (4.0%) | 31 (0.6%) |
Time of Departure to Work by Sex in Garrett County
The most frequent times of departure to work in Garrett County are 7:30 AM to 7:59 AM (1,112, 16.6%) for males and 7:30 AM to 7:59 AM (1,060, 20.1%) for females.
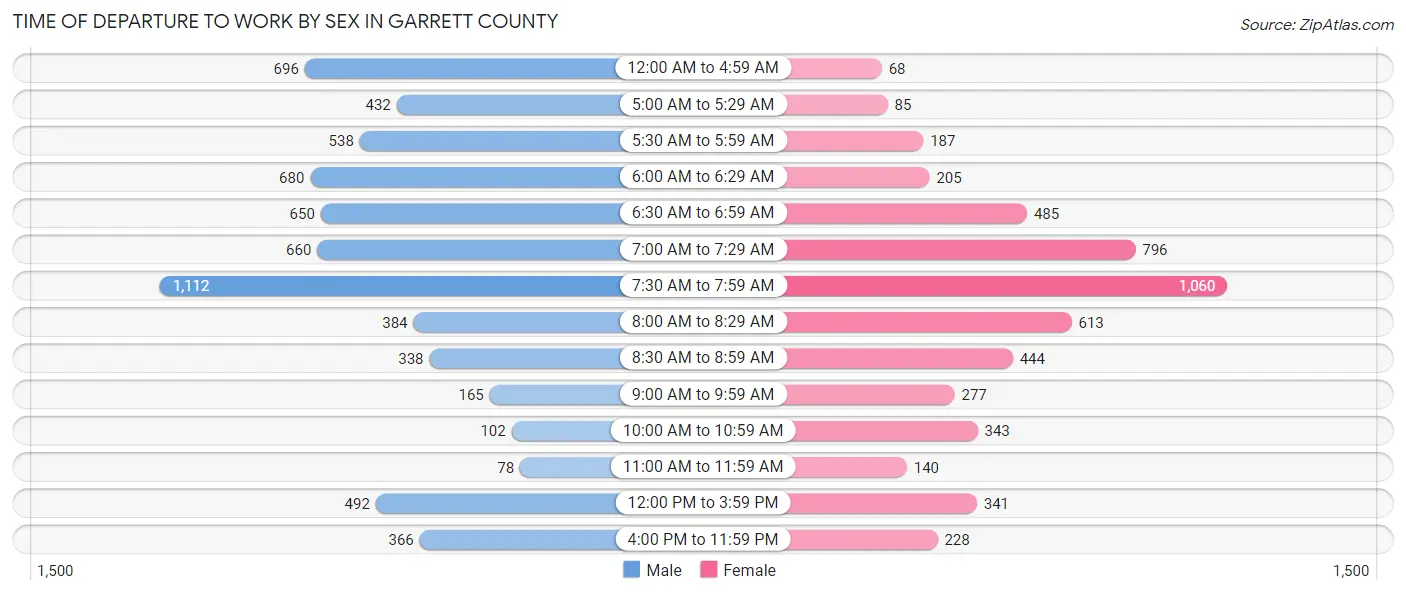
| Time of Departure | Male | Female |
| 12:00 AM to 4:59 AM | 696 (10.4%) | 68 (1.3%) |
| 5:00 AM to 5:29 AM | 432 (6.5%) | 85 (1.6%) |
| 5:30 AM to 5:59 AM | 538 (8.0%) | 187 (3.5%) |
| 6:00 AM to 6:29 AM | 680 (10.2%) | 205 (3.9%) |
| 6:30 AM to 6:59 AM | 650 (9.7%) | 485 (9.2%) |
| 7:00 AM to 7:29 AM | 660 (9.9%) | 796 (15.1%) |
| 7:30 AM to 7:59 AM | 1,112 (16.6%) | 1,060 (20.1%) |
| 8:00 AM to 8:29 AM | 384 (5.7%) | 613 (11.6%) |
| 8:30 AM to 8:59 AM | 338 (5.1%) | 444 (8.4%) |
| 9:00 AM to 9:59 AM | 165 (2.5%) | 277 (5.2%) |
| 10:00 AM to 10:59 AM | 102 (1.5%) | 343 (6.5%) |
| 11:00 AM to 11:59 AM | 78 (1.2%) | 140 (2.7%) |
| 12:00 PM to 3:59 PM | 492 (7.3%) | 341 (6.5%) |
| 4:00 PM to 11:59 PM | 366 (5.5%) | 228 (4.3%) |
| Total | 6,693 (100.0%) | 5,272 (100.0%) |
Housing Occupancy in Garrett County
Occupancy by Ownership in Garrett County
Of the total 12,448 dwellings in Garrett County, owner-occupied units account for 9,977 (80.1%), while renter-occupied units make up 2,471 (19.9%).
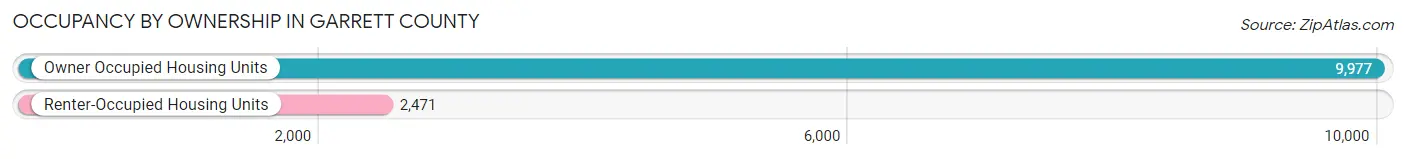
| Occupancy | # Housing Units | % Housing Units |
| Owner Occupied Housing Units | 9,977 | 80.1% |
| Renter-Occupied Housing Units | 2,471 | 19.9% |
| Total Occupied Housing Units | 12,448 | 100.0% |
Occupancy by Household Size in Garrett County
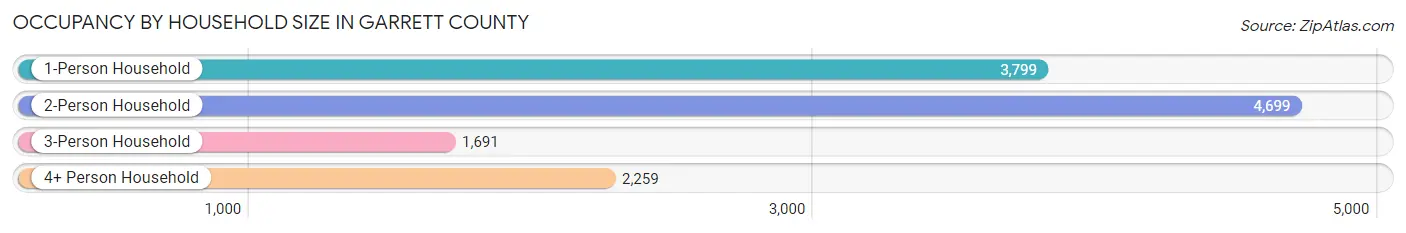
| Household Size | # Housing Units | % Housing Units |
| 1-Person Household | 3,799 | 30.5% |
| 2-Person Household | 4,699 | 37.8% |
| 3-Person Household | 1,691 | 13.6% |
| 4+ Person Household | 2,259 | 18.1% |
| Total Housing Units | 12,448 | 100.0% |
Occupancy by Ownership by Household Size in Garrett County
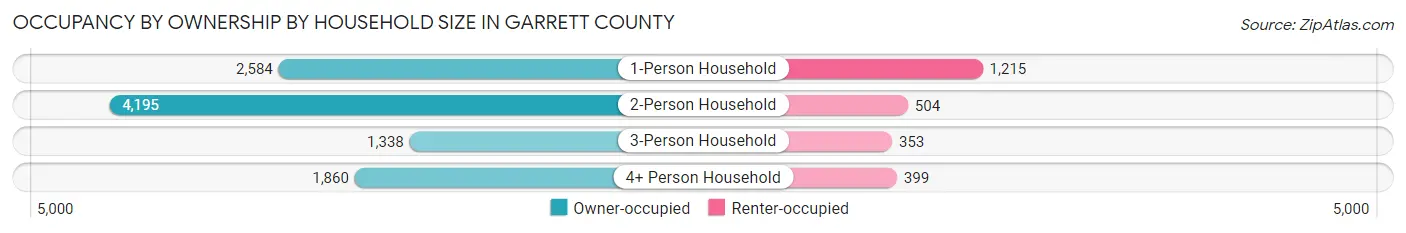
| Household Size | Owner-occupied | Renter-occupied |
| 1-Person Household | 2,584 (68.0%) | 1,215 (32.0%) |
| 2-Person Household | 4,195 (89.3%) | 504 (10.7%) |
| 3-Person Household | 1,338 (79.1%) | 353 (20.9%) |
| 4+ Person Household | 1,860 (82.3%) | 399 (17.7%) |
| Total Housing Units | 9,977 (80.1%) | 2,471 (19.9%) |
Occupancy by Educational Attainment in Garrett County
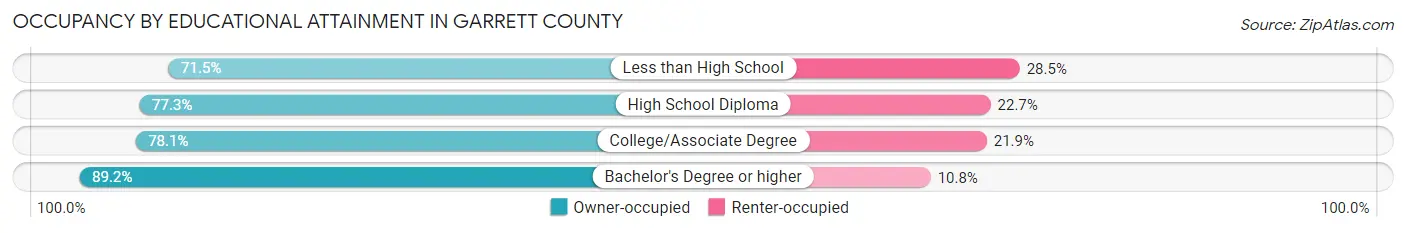
| Household Size | Owner-occupied | Renter-occupied |
| Less than High School | 709 (71.5%) | 282 (28.5%) |
| High School Diploma | 3,724 (77.3%) | 1,093 (22.7%) |
| College/Associate Degree | 2,656 (78.1%) | 746 (21.9%) |
| Bachelor's Degree or higher | 2,888 (89.2%) | 350 (10.8%) |
Occupancy by Age of Householder in Garrett County
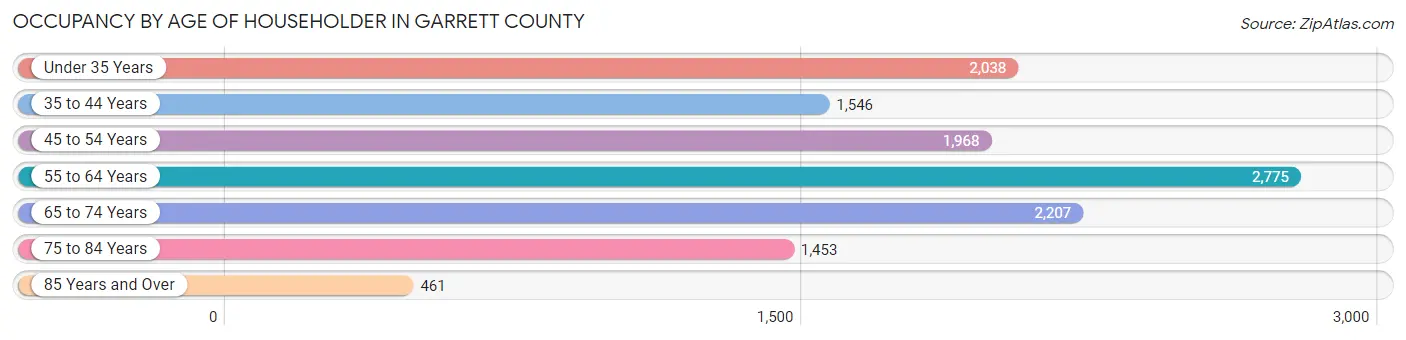
| Age Bracket | # Households | % Households |
| Under 35 Years | 2,038 | 16.4% |
| 35 to 44 Years | 1,546 | 12.4% |
| 45 to 54 Years | 1,968 | 15.8% |
| 55 to 64 Years | 2,775 | 22.3% |
| 65 to 74 Years | 2,207 | 17.7% |
| 75 to 84 Years | 1,453 | 11.7% |
| 85 Years and Over | 461 | 3.7% |
| Total | 12,448 | 100.0% |
Housing Finances in Garrett County
Median Income by Occupancy in Garrett County
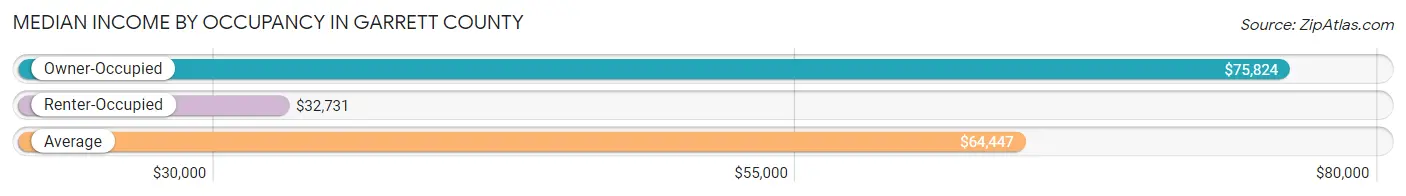
| Occupancy Type | # Households | Median Income |
| Owner-Occupied | 9,977 (80.1%) | $75,824 |
| Renter-Occupied | 2,471 (19.9%) | $32,731 |
| Average | 12,448 (100.0%) | $64,447 |
Occupancy by Householder Income Bracket in Garrett County
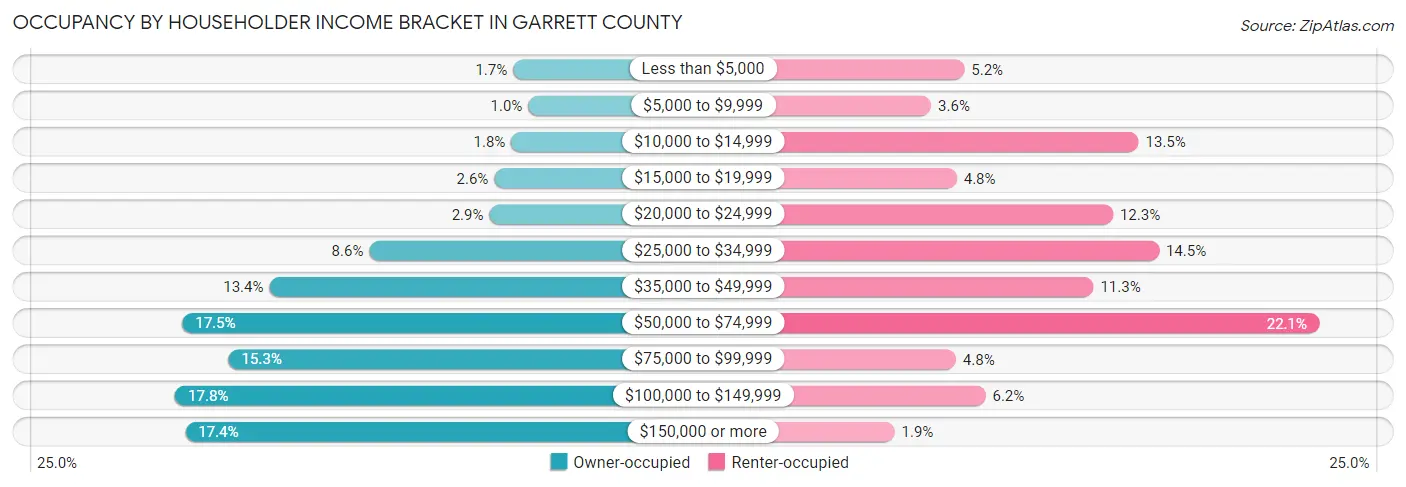
| Income Bracket | Owner-occupied | Renter-occupied |
| Less than $5,000 | 174 (1.7%) | 128 (5.2%) |
| $5,000 to $9,999 | 102 (1.0%) | 89 (3.6%) |
| $10,000 to $14,999 | 183 (1.8%) | 333 (13.5%) |
| $15,000 to $19,999 | 263 (2.6%) | 119 (4.8%) |
| $20,000 to $24,999 | 286 (2.9%) | 303 (12.3%) |
| $25,000 to $34,999 | 857 (8.6%) | 357 (14.4%) |
| $35,000 to $49,999 | 1,332 (13.4%) | 280 (11.3%) |
| $50,000 to $74,999 | 1,745 (17.5%) | 545 (22.1%) |
| $75,000 to $99,999 | 1,525 (15.3%) | 118 (4.8%) |
| $100,000 to $149,999 | 1,779 (17.8%) | 153 (6.2%) |
| $150,000 or more | 1,731 (17.3%) | 46 (1.9%) |
| Total | 9,977 (100.0%) | 2,471 (100.0%) |
Monthly Housing Cost Tiers in Garrett County
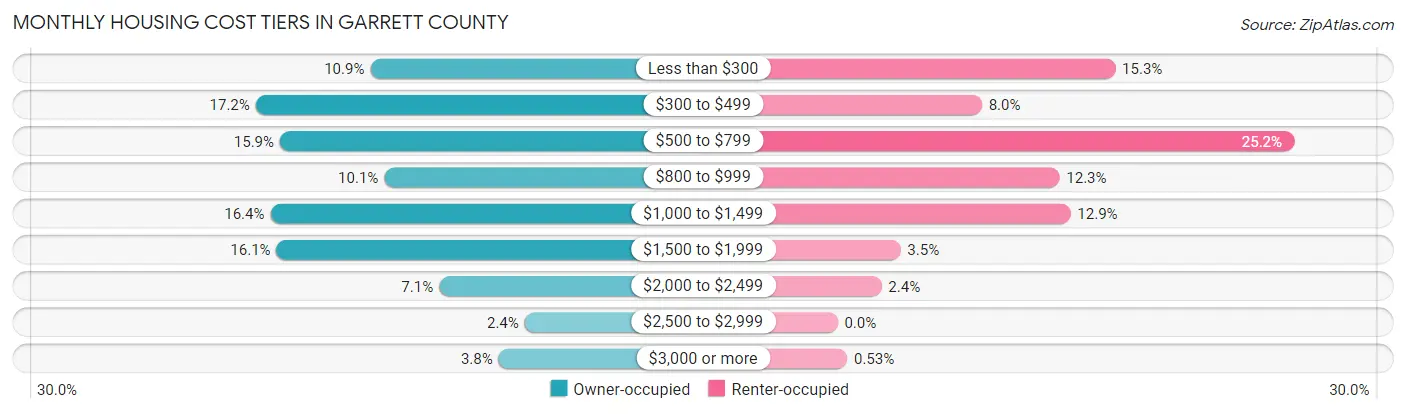
| Monthly Cost | Owner-occupied | Renter-occupied |
| Less than $300 | 1,088 (10.9%) | 379 (15.3%) |
| $300 to $499 | 1,720 (17.2%) | 197 (8.0%) |
| $500 to $799 | 1,586 (15.9%) | 623 (25.2%) |
| $800 to $999 | 1,012 (10.1%) | 303 (12.3%) |
| $1,000 to $1,499 | 1,639 (16.4%) | 318 (12.9%) |
| $1,500 to $1,999 | 1,605 (16.1%) | 86 (3.5%) |
| $2,000 to $2,499 | 709 (7.1%) | 60 (2.4%) |
| $2,500 to $2,999 | 237 (2.4%) | 0 (0.0%) |
| $3,000 or more | 381 (3.8%) | 13 (0.5%) |
| Total | 9,977 (100.0%) | 2,471 (100.0%) |
Physical Housing Characteristics in Garrett County
Housing Structures in Garrett County
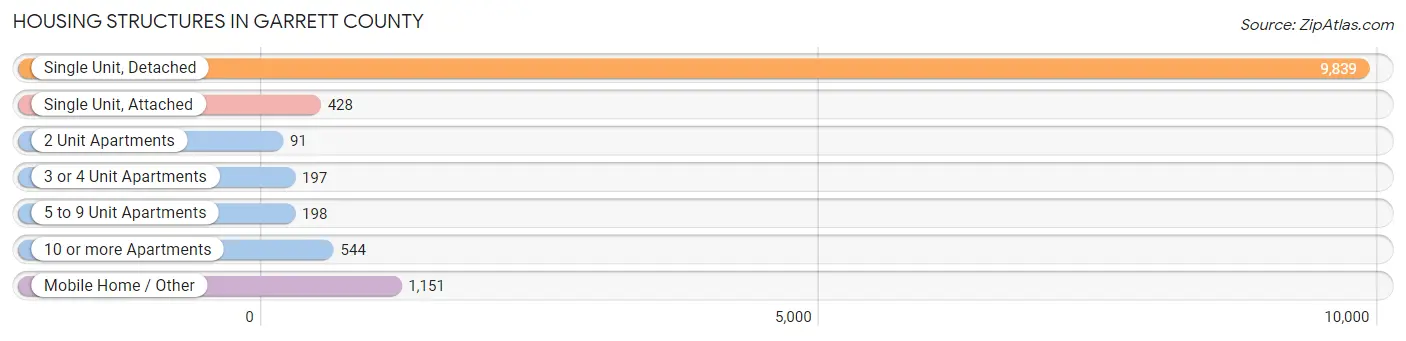
| Structure Type | # Housing Units | % Housing Units |
| Single Unit, Detached | 9,839 | 79.0% |
| Single Unit, Attached | 428 | 3.4% |
| 2 Unit Apartments | 91 | 0.7% |
| 3 or 4 Unit Apartments | 197 | 1.6% |
| 5 to 9 Unit Apartments | 198 | 1.6% |
| 10 or more Apartments | 544 | 4.4% |
| Mobile Home / Other | 1,151 | 9.2% |
| Total | 12,448 | 100.0% |
Housing Structures by Occupancy in Garrett County
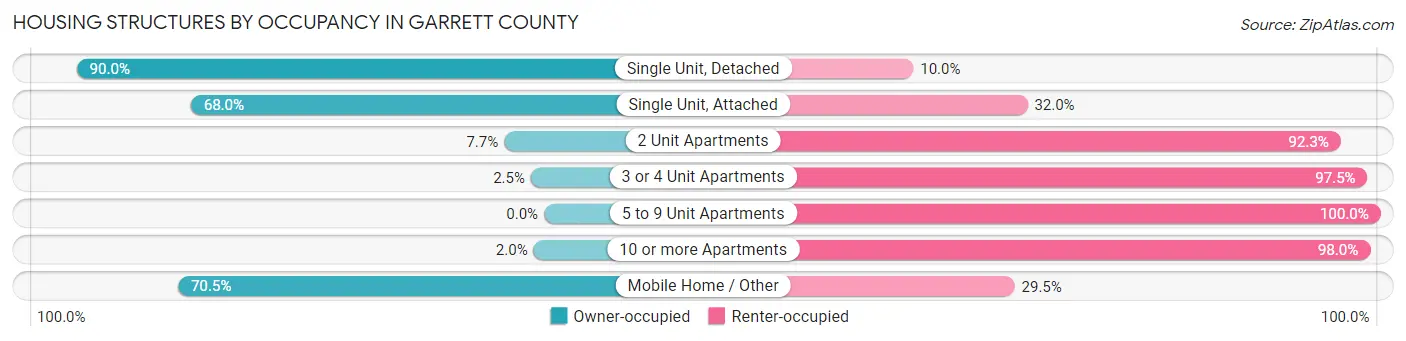
| Structure Type | Owner-occupied | Renter-occupied |
| Single Unit, Detached | 8,852 (90.0%) | 987 (10.0%) |
| Single Unit, Attached | 291 (68.0%) | 137 (32.0%) |
| 2 Unit Apartments | 7 (7.7%) | 84 (92.3%) |
| 3 or 4 Unit Apartments | 5 (2.5%) | 192 (97.5%) |
| 5 to 9 Unit Apartments | 0 (0.0%) | 198 (100.0%) |
| 10 or more Apartments | 11 (2.0%) | 533 (98.0%) |
| Mobile Home / Other | 811 (70.5%) | 340 (29.5%) |
| Total | 9,977 (80.1%) | 2,471 (19.9%) |
Housing Structures by Number of Rooms in Garrett County
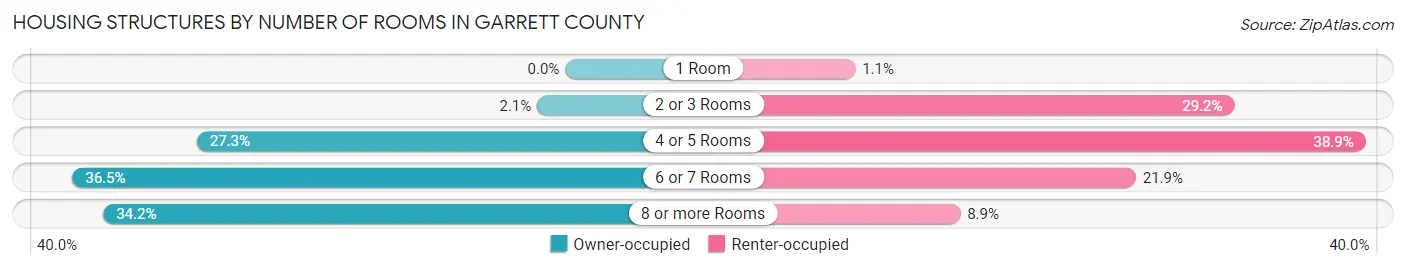
| Number of Rooms | Owner-occupied | Renter-occupied |
| 1 Room | 0 (0.0%) | 28 (1.1%) |
| 2 or 3 Rooms | 208 (2.1%) | 721 (29.2%) |
| 4 or 5 Rooms | 2,720 (27.3%) | 961 (38.9%) |
| 6 or 7 Rooms | 3,639 (36.5%) | 541 (21.9%) |
| 8 or more Rooms | 3,410 (34.2%) | 220 (8.9%) |
| Total | 9,977 (100.0%) | 2,471 (100.0%) |
Housing Structure by Heating Type in Garrett County
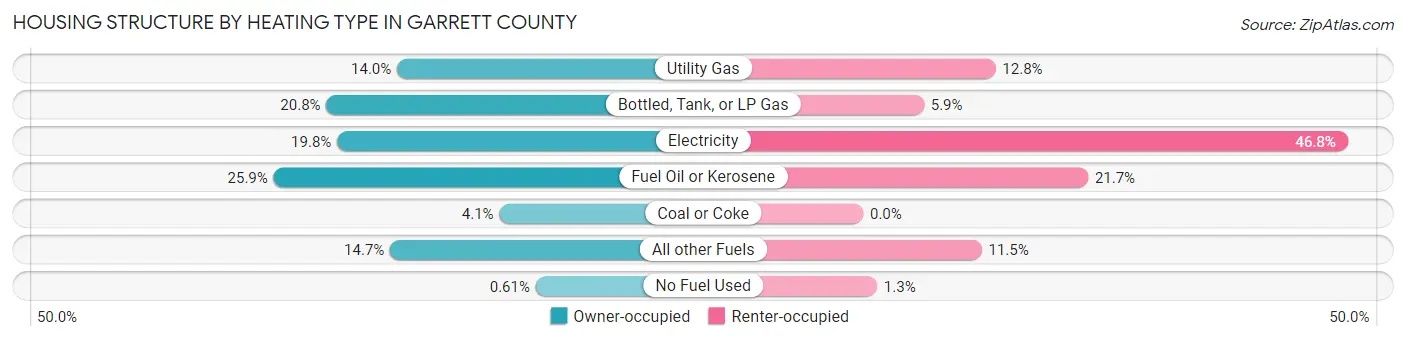
| Heating Type | Owner-occupied | Renter-occupied |
| Utility Gas | 1,398 (14.0%) | 316 (12.8%) |
| Bottled, Tank, or LP Gas | 2,079 (20.8%) | 145 (5.9%) |
| Electricity | 1,975 (19.8%) | 1,157 (46.8%) |
| Fuel Oil or Kerosene | 2,588 (25.9%) | 537 (21.7%) |
| Coal or Coke | 411 (4.1%) | 0 (0.0%) |
| All other Fuels | 1,465 (14.7%) | 283 (11.5%) |
| No Fuel Used | 61 (0.6%) | 33 (1.3%) |
| Total | 9,977 (100.0%) | 2,471 (100.0%) |
Household Vehicle Usage in Garrett County
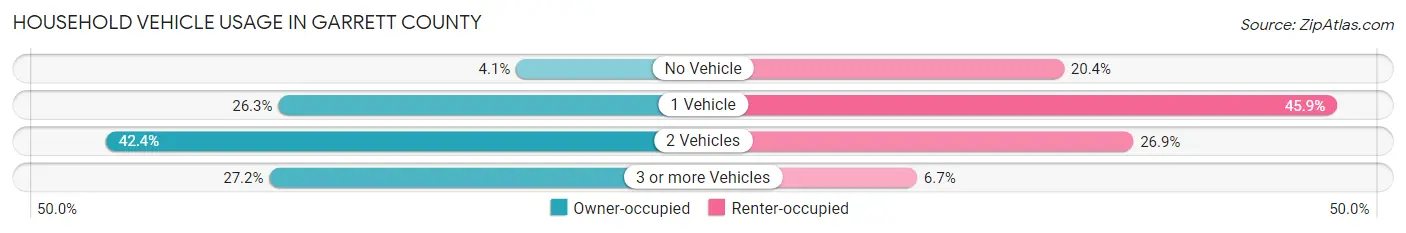
| Vehicles per Household | Owner-occupied | Renter-occupied |
| No Vehicle | 410 (4.1%) | 505 (20.4%) |
| 1 Vehicle | 2,626 (26.3%) | 1,135 (45.9%) |
| 2 Vehicles | 4,231 (42.4%) | 665 (26.9%) |
| 3 or more Vehicles | 2,710 (27.2%) | 166 (6.7%) |
| Total | 9,977 (100.0%) | 2,471 (100.0%) |
Real Estate & Mortgages in Garrett County
Real Estate and Mortgage Overview in Garrett County
| Characteristic | Without Mortgage | With Mortgage |
| Housing Units | 4,553 | 5,424 |
| Median Property Value | $192,300 | $236,300 |
| Median Household Income | $58,162 | $1,180 |
| Monthly Housing Costs | $440 | $381 |
| Real Estate Taxes | $1,474 | $88 |
Property Value by Mortgage Status in Garrett County
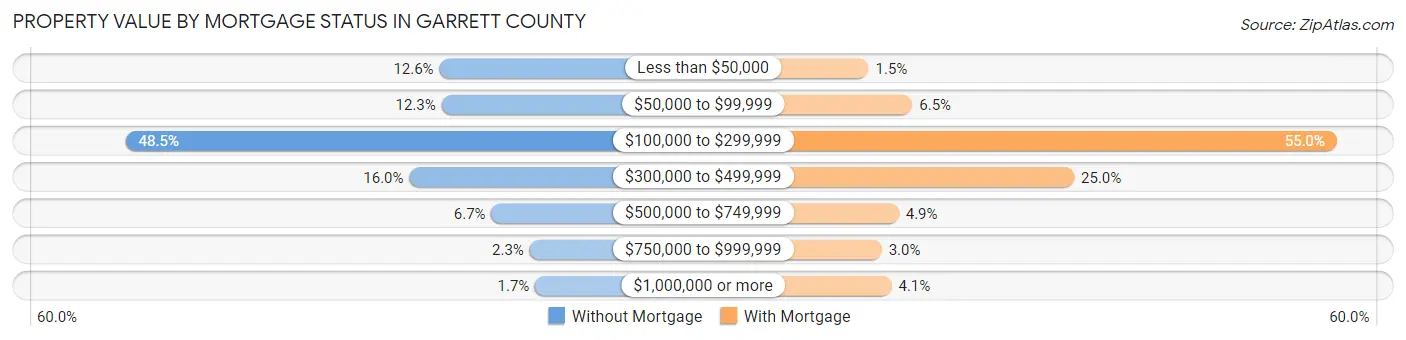
| Property Value | Without Mortgage | With Mortgage |
| Less than $50,000 | 573 (12.6%) | 81 (1.5%) |
| $50,000 to $99,999 | 562 (12.3%) | 352 (6.5%) |
| $100,000 to $299,999 | 2,206 (48.4%) | 2,983 (55.0%) |
| $300,000 to $499,999 | 730 (16.0%) | 1,355 (25.0%) |
| $500,000 to $749,999 | 303 (6.7%) | 268 (4.9%) |
| $750,000 to $999,999 | 104 (2.3%) | 162 (3.0%) |
| $1,000,000 or more | 75 (1.7%) | 223 (4.1%) |
| Total | 4,553 (100.0%) | 5,424 (100.0%) |
Household Income by Mortgage Status in Garrett County
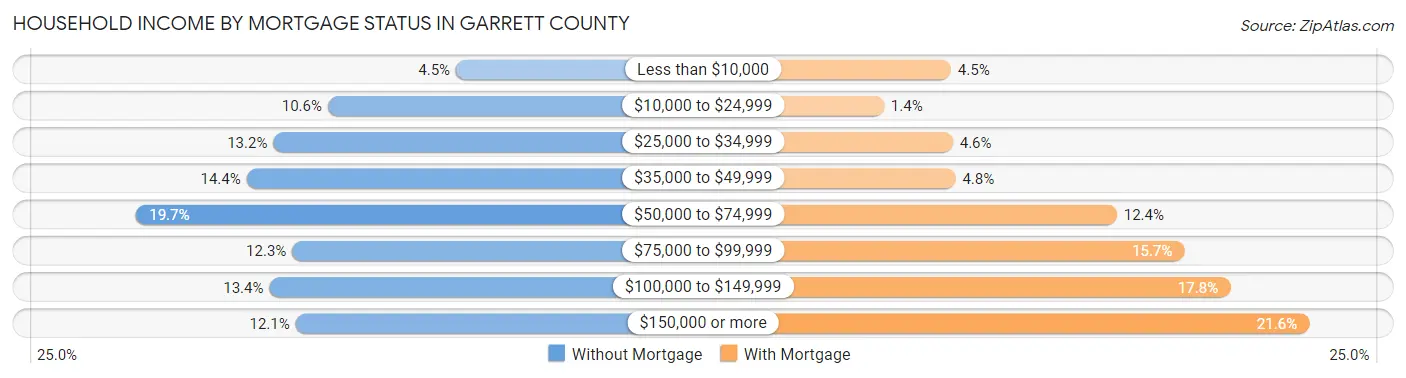
| Household Income | Without Mortgage | With Mortgage |
| Less than $10,000 | 203 (4.5%) | 246 (4.5%) |
| $10,000 to $24,999 | 481 (10.6%) | 73 (1.3%) |
| $25,000 to $34,999 | 599 (13.2%) | 251 (4.6%) |
| $35,000 to $49,999 | 657 (14.4%) | 258 (4.8%) |
| $50,000 to $74,999 | 896 (19.7%) | 675 (12.4%) |
| $75,000 to $99,999 | 558 (12.3%) | 849 (15.7%) |
| $100,000 to $149,999 | 608 (13.4%) | 967 (17.8%) |
| $150,000 or more | 551 (12.1%) | 1,171 (21.6%) |
| Total | 4,553 (100.0%) | 5,424 (100.0%) |
Property Value to Household Income Ratio in Garrett County
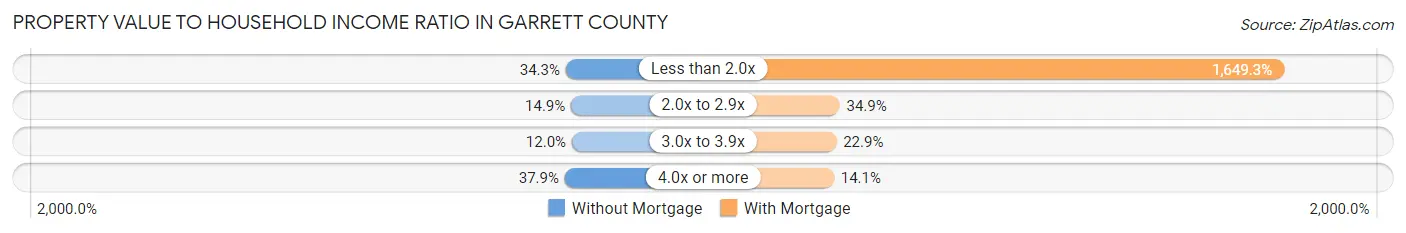
| Value-to-Income Ratio | Without Mortgage | With Mortgage |
| Less than 2.0x | 1,561 (34.3%) | 89,458 (1,649.3%) |
| 2.0x to 2.9x | 680 (14.9%) | 1,892 (34.9%) |
| 3.0x to 3.9x | 547 (12.0%) | 1,244 (22.9%) |
| 4.0x or more | 1,725 (37.9%) | 764 (14.1%) |
| Total | 4,553 (100.0%) | 5,424 (100.0%) |
Real Estate Taxes by Mortgage Status in Garrett County
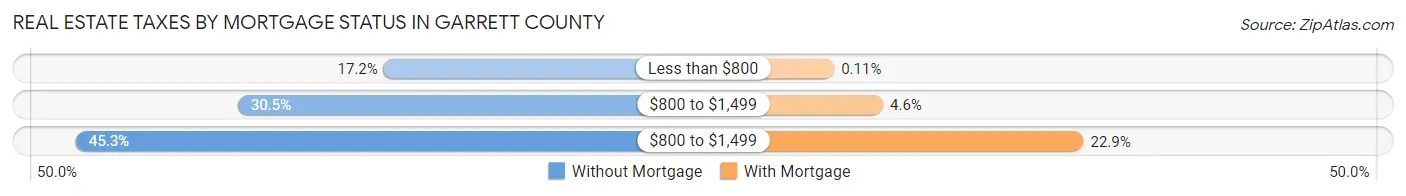
| Property Taxes | Without Mortgage | With Mortgage |
| Less than $800 | 784 (17.2%) | 6 (0.1%) |
| $800 to $1,499 | 1,390 (30.5%) | 248 (4.6%) |
| $800 to $1,499 | 2,063 (45.3%) | 1,241 (22.9%) |
| Total | 4,553 (100.0%) | 5,424 (100.0%) |
Health & Disability in Garrett County
Health Insurance Coverage by Age in Garrett County
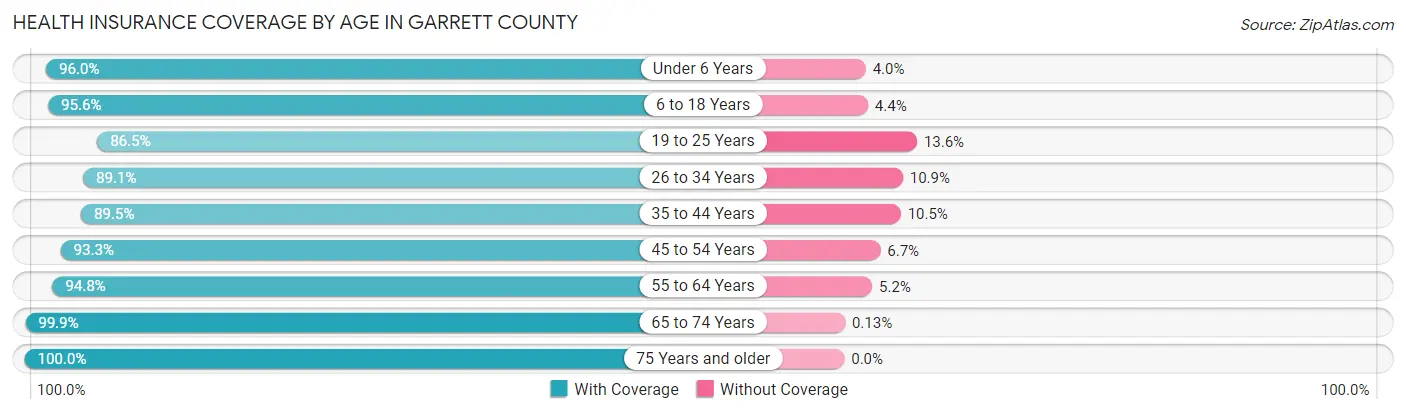
| Age Bracket | With Coverage | Without Coverage |
| Under 6 Years | 1,657 (96.0%) | 69 (4.0%) |
| 6 to 18 Years | 3,691 (95.6%) | 170 (4.4%) |
| 19 to 25 Years | 1,665 (86.5%) | 261 (13.6%) |
| 26 to 34 Years | 2,647 (89.1%) | 324 (10.9%) |
| 35 to 44 Years | 2,857 (89.5%) | 336 (10.5%) |
| 45 to 54 Years | 3,452 (93.3%) | 249 (6.7%) |
| 55 to 64 Years | 4,458 (94.8%) | 244 (5.2%) |
| 65 to 74 Years | 3,722 (99.9%) | 5 (0.1%) |
| 75 Years and older | 2,640 (100.0%) | 0 (0.0%) |
| Total | 26,789 (94.2%) | 1,658 (5.8%) |
Health Insurance Coverage by Citizenship Status in Garrett County
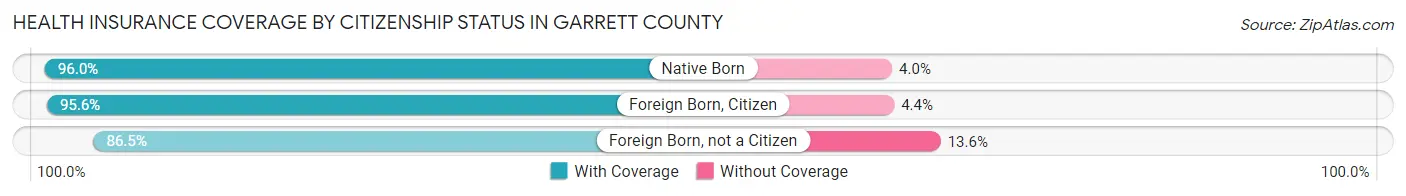
| Citizenship Status | With Coverage | Without Coverage |
| Native Born | 1,657 (96.0%) | 69 (4.0%) |
| Foreign Born, Citizen | 3,691 (95.6%) | 170 (4.4%) |
| Foreign Born, not a Citizen | 1,665 (86.5%) | 261 (13.6%) |
Health Insurance Coverage by Household Income in Garrett County
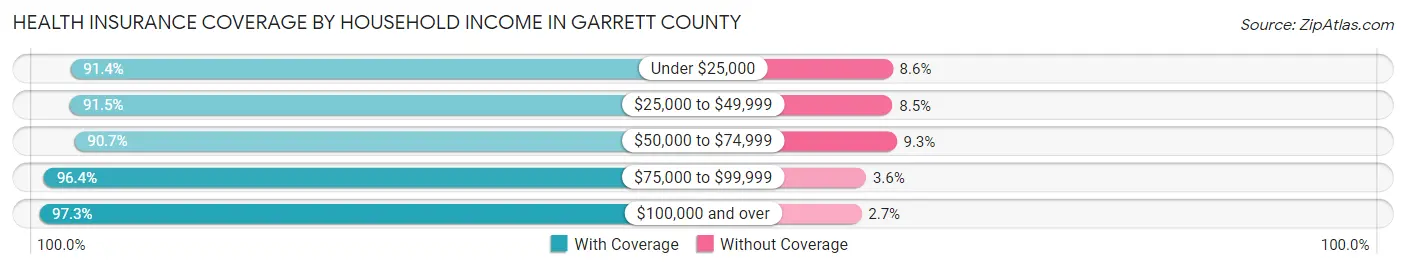
| Household Income | With Coverage | Without Coverage |
| Under $25,000 | 2,682 (91.4%) | 252 (8.6%) |
| $25,000 to $49,999 | 5,459 (91.5%) | 510 (8.5%) |
| $50,000 to $74,999 | 4,406 (90.7%) | 453 (9.3%) |
| $75,000 to $99,999 | 3,728 (96.4%) | 139 (3.6%) |
| $100,000 and over | 10,278 (97.3%) | 289 (2.7%) |
Public vs Private Health Insurance Coverage by Age in Garrett County
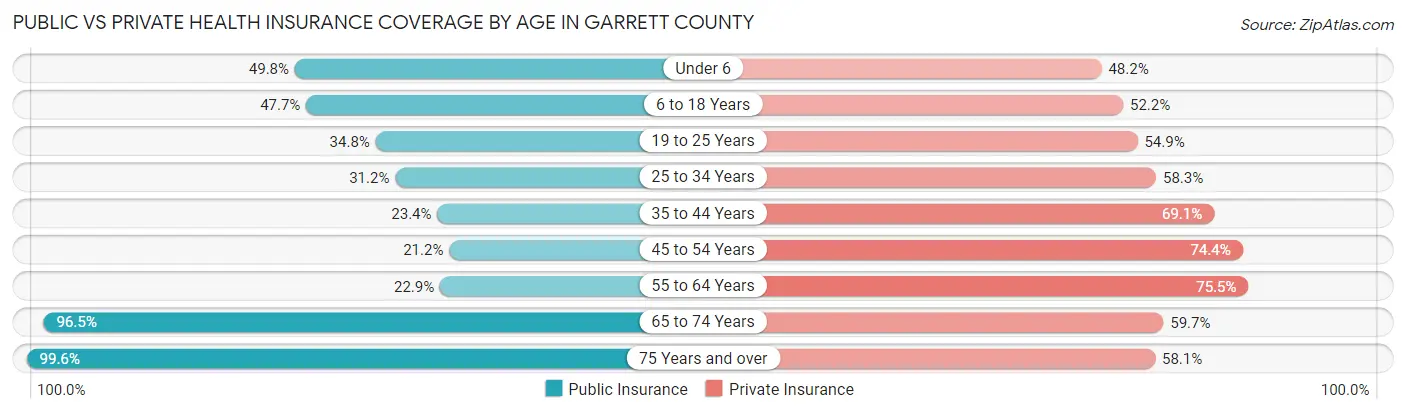
| Age Bracket | Public Insurance | Private Insurance |
| Under 6 | 860 (49.8%) | 832 (48.2%) |
| 6 to 18 Years | 1,843 (47.7%) | 2,016 (52.2%) |
| 19 to 25 Years | 671 (34.8%) | 1,057 (54.9%) |
| 25 to 34 Years | 927 (31.2%) | 1,733 (58.3%) |
| 35 to 44 Years | 747 (23.4%) | 2,206 (69.1%) |
| 45 to 54 Years | 784 (21.2%) | 2,753 (74.4%) |
| 55 to 64 Years | 1,076 (22.9%) | 3,548 (75.5%) |
| 65 to 74 Years | 3,596 (96.5%) | 2,224 (59.7%) |
| 75 Years and over | 2,630 (99.6%) | 1,535 (58.1%) |
| Total | 13,134 (46.2%) | 17,904 (62.9%) |
Disability Status by Sex by Age in Garrett County
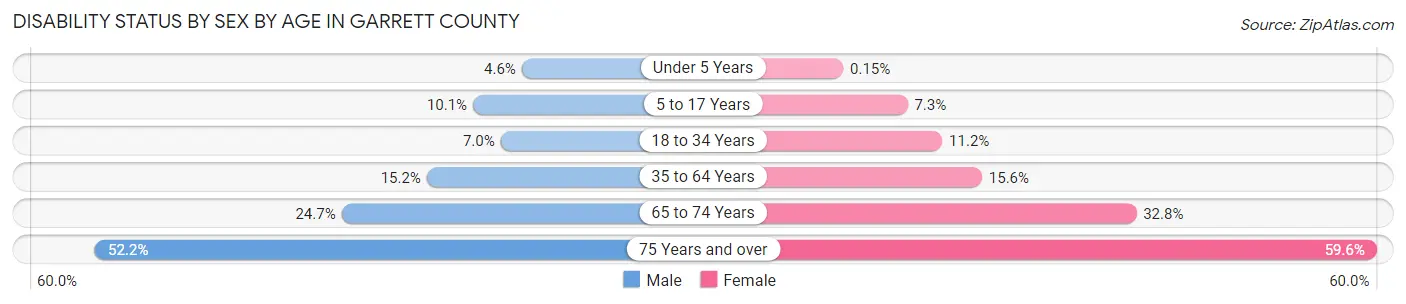
| Age Bracket | Male | Female |
| Under 5 Years | 34 (4.6%) | 1 (0.2%) |
| 5 to 17 Years | 196 (10.1%) | 131 (7.3%) |
| 18 to 34 Years | 193 (7.0%) | 289 (11.2%) |
| 35 to 64 Years | 884 (15.2%) | 903 (15.6%) |
| 65 to 74 Years | 462 (24.7%) | 609 (32.8%) |
| 75 Years and over | 630 (52.1%) | 853 (59.6%) |
Disability Class by Sex by Age in Garrett County
Disability Class: Hearing Difficulty
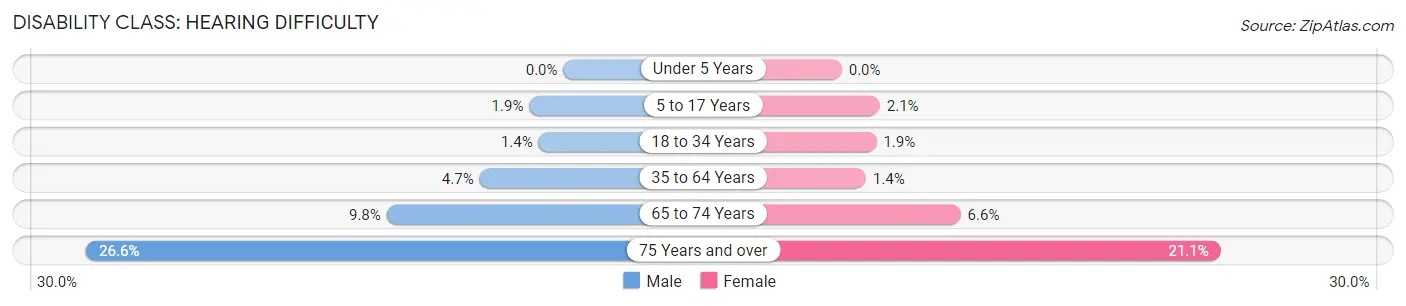
| Age Bracket | Male | Female |
| Under 5 Years | 0 (0.0%) | 0 (0.0%) |
| 5 to 17 Years | 37 (1.9%) | 38 (2.1%) |
| 18 to 34 Years | 38 (1.4%) | 50 (1.9%) |
| 35 to 64 Years | 271 (4.7%) | 78 (1.3%) |
| 65 to 74 Years | 184 (9.8%) | 123 (6.6%) |
| 75 Years and over | 321 (26.6%) | 302 (21.1%) |
Disability Class: Vision Difficulty
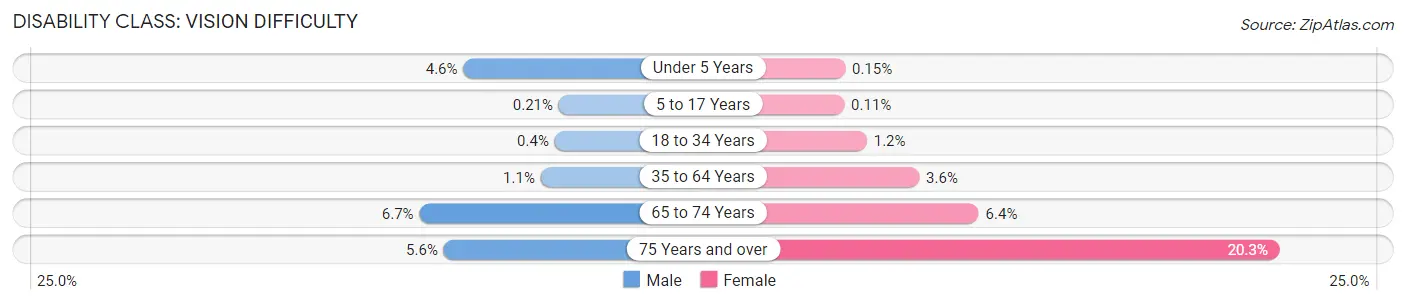
| Age Bracket | Male | Female |
| Under 5 Years | 34 (4.6%) | 1 (0.2%) |
| 5 to 17 Years | 4 (0.2%) | 2 (0.1%) |
| 18 to 34 Years | 11 (0.4%) | 30 (1.2%) |
| 35 to 64 Years | 61 (1.1%) | 208 (3.6%) |
| 65 to 74 Years | 125 (6.7%) | 118 (6.4%) |
| 75 Years and over | 67 (5.6%) | 291 (20.3%) |
Disability Class: Cognitive Difficulty
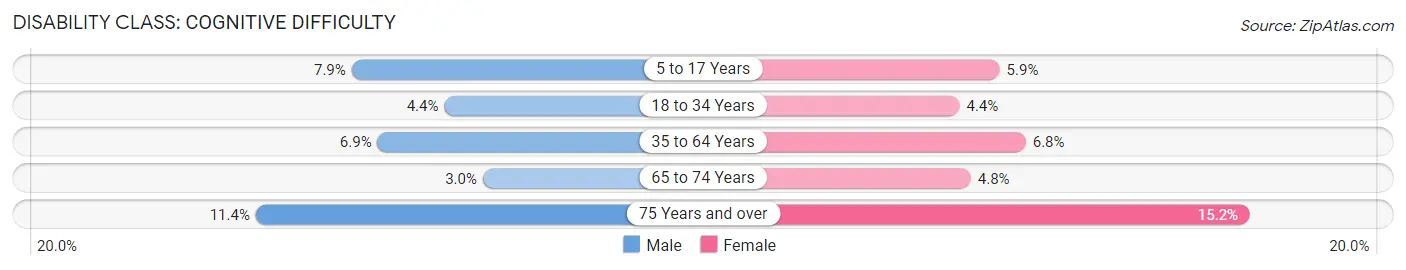
| Age Bracket | Male | Female |
| 5 to 17 Years | 153 (7.9%) | 105 (5.9%) |
| 18 to 34 Years | 122 (4.4%) | 113 (4.4%) |
| 35 to 64 Years | 401 (6.9%) | 395 (6.8%) |
| 65 to 74 Years | 56 (3.0%) | 89 (4.8%) |
| 75 Years and over | 138 (11.4%) | 217 (15.1%) |
Disability Class: Ambulatory Difficulty
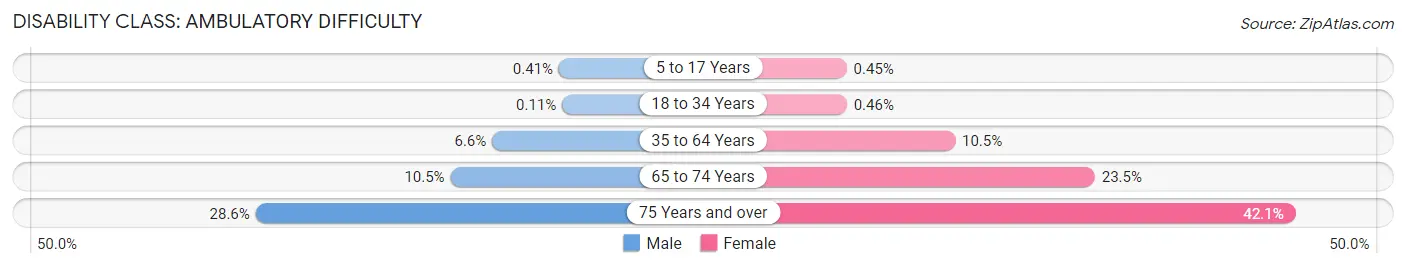
| Age Bracket | Male | Female |
| 5 to 17 Years | 8 (0.4%) | 8 (0.4%) |
| 18 to 34 Years | 3 (0.1%) | 12 (0.5%) |
| 35 to 64 Years | 384 (6.6%) | 608 (10.5%) |
| 65 to 74 Years | 196 (10.5%) | 436 (23.5%) |
| 75 Years and over | 345 (28.6%) | 603 (42.1%) |
Disability Class: Self-Care Difficulty
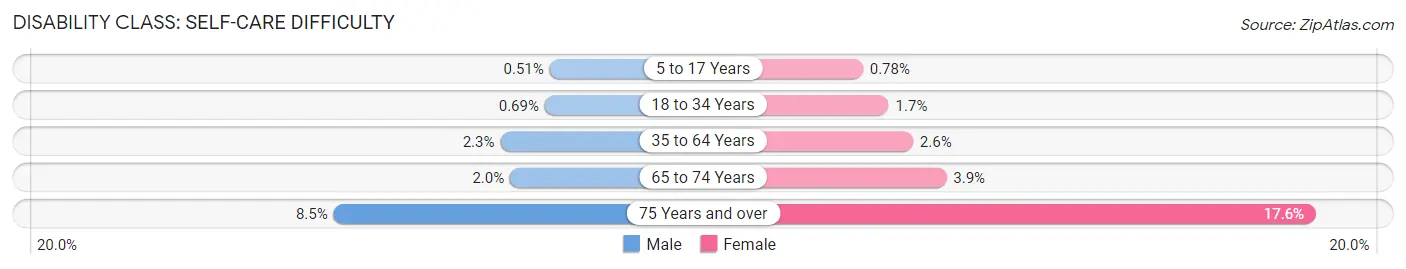
| Age Bracket | Male | Female |
| 5 to 17 Years | 10 (0.5%) | 14 (0.8%) |
| 18 to 34 Years | 19 (0.7%) | 45 (1.7%) |
| 35 to 64 Years | 136 (2.3%) | 153 (2.6%) |
| 65 to 74 Years | 37 (2.0%) | 72 (3.9%) |
| 75 Years and over | 103 (8.5%) | 252 (17.6%) |
Technology Access in Garrett County
Computing Device Access in Garrett County
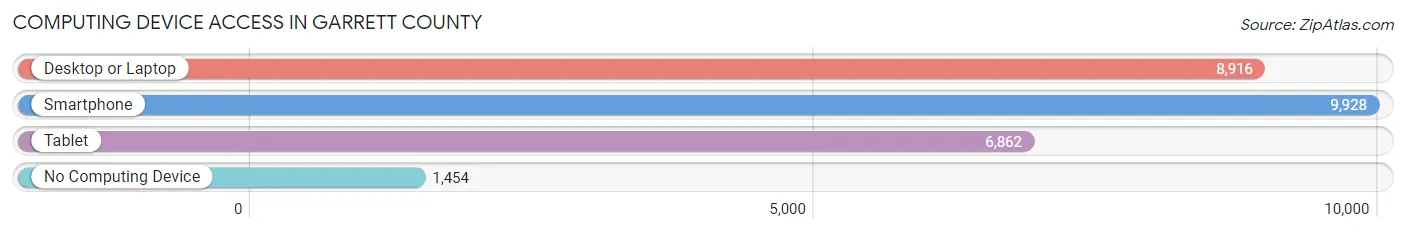
| Device Type | # Households | % Households |
| Desktop or Laptop | 8,916 | 71.6% |
| Smartphone | 9,928 | 79.8% |
| Tablet | 6,862 | 55.1% |
| No Computing Device | 1,454 | 11.7% |
| Total | 12,448 | 100.0% |
Internet Access in Garrett County
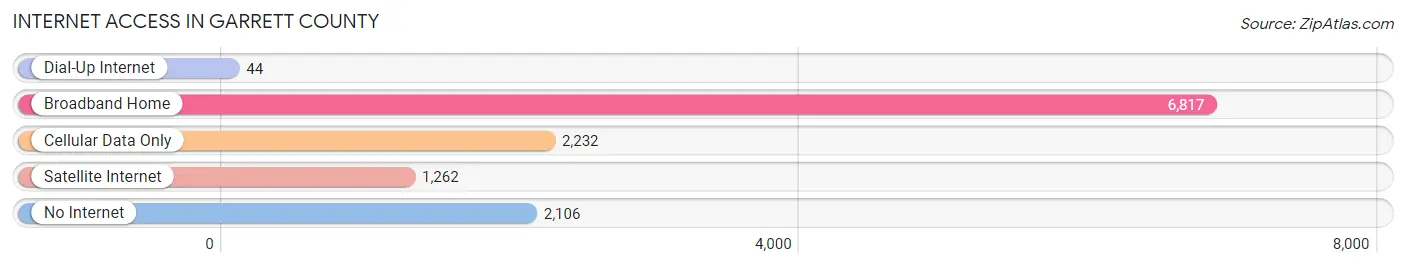
| Internet Type | # Households | % Households |
| Dial-Up Internet | 44 | 0.4% |
| Broadband Home | 6,817 | 54.8% |
| Cellular Data Only | 2,232 | 17.9% |
| Satellite Internet | 1,262 | 10.1% |
| No Internet | 2,106 | 16.9% |
| Total | 12,448 | 100.0% |
Garrett County Summary
Garrett County, Maryland is located in the westernmost part of the state, bordering West Virginia and Pennsylvania. It is the westernmost county in Maryland and the second largest in the state. The county is home to Deep Creek Lake, the largest inland body of water in Maryland. The county seat is Oakland, and the county is part of the Cumberland, MD-WV Metropolitan Statistical Area.
History
Garrett County was formed in 1872 from parts of Allegany and Washington Counties. It was named for John Work Garrett, president of the Baltimore and Ohio Railroad. The county was originally home to the Shawnee, Delaware, and Iroquois Native American tribes. The first European settlers arrived in the area in the late 1700s.
The county was largely rural until the early 1900s, when the development of the railroad and the timber industry brought more people to the area. The county was also home to several resorts, which attracted visitors from all over the country.
Geography
Garrett County is located in the Appalachian Mountains of western Maryland. It is bordered by West Virginia to the north and Pennsylvania to the west. The county is home to Deep Creek Lake, the largest inland body of water in Maryland. The lake is a popular destination for fishing, boating, and other recreational activities. The county is also home to several state parks, including Swallow Falls State Park and Herrington Manor State Park.
The county has a total area of 617 square miles, of which 590 square miles is land and 27 square miles is water. The highest point in the county is Backbone Mountain, which has an elevation of 3,360 feet.
Economy
Garrett County has a diverse economy, with a mix of agriculture, manufacturing, tourism, and service industries. The county is home to several large employers, including Garrett Regional Medical Center, Garrett College, and the Garrett County Public Schools.
Agriculture is an important part of the county’s economy, with dairy farming, beef cattle, and hay production being the main agricultural activities. The county is also home to several wineries and breweries, which produce a variety of wines and beers.
Tourism is a major industry in the county, with visitors coming to enjoy the area’s natural beauty and recreational activities. Deep Creek Lake is a popular destination for fishing, boating, and other outdoor activities. The county is also home to several ski resorts, which attract visitors from all over the country.
Demographics
As of the 2010 census, Garrett County had a population of 29,097. The population was spread out, with 24.3% under the age of 18, 8.2% from 18 to 24, 28.2% from 25 to 44, 24.7% from 45 to 64, and 14.6% who were 65 years of age or older. The median age was 38.4 years.
The racial makeup of the county was 95.2% White, 1.7% African American, 0.3% Native American, 0.7% Asian, 0.1% Pacific Islander, 0.7% from other races, and 1.3% from two or more races. Hispanic or Latino of any race were 2.2% of the population.
The median income for a household in the county was $45,837, and the median income for a family was $54,844. The per capita income for the county was $23,945. About 10.2% of families and 14.2% of the population were below the poverty line, including 19.2% of those under age 18 and 8.2% of those age 65 or over.
Common Questions
What is the Total Population of Garrett County?
Total Population of Garrett County is 28,856.
What is the Total Male Population of Garrett County?
Total Male Population of Garrett County is 14,499.
What is the Total Female Population of Garrett County?
Total Female Population of Garrett County is 14,357.
What is the Ratio of Males per 100 Females in Garrett County?
There are 100.99 Males per 100 Females in Garrett County.
What is the Ratio of Females per 100 Males in Garrett County?
There are 99.02 Females per 100 Males in Garrett County.
What is the Median Population Age in Garrett County?
Median Population Age in Garrett County is 47.6 Years.
What is the Average Family Size in Garrett County
Average Family Size in Garrett County is 2.8 People.
What is the Average Household Size in Garrett County
Average Household Size in Garrett County is 2.3 People.
What is Per Capita Income in Garrett County?
Per Capita income in Garrett County is $41,130.
What is the Median Family Income in Garrett County?
Median Family Income in Garrett County is $81,575.
What is the Median Household income in Garrett County?
Median Household Income in Garrett County is $64,447.
What is Income or Wage Gap in Garrett County?
Income or Wage Gap in Garrett County is 28.8%.
Women in Garrett County earn 71.2 cents for every dollar earned by a man.
What is Family Income Deficit in Garrett County?
Family Income Deficit in Garrett County is $10,161.
Families that are below poverty line in Garrett County earn $10,161 less on average than the poverty threshold level.
What is Inequality or Gini Index in Garrett County?
Inequality or Gini Index in Garrett County is 0.49.
How Large is the Labor Force in Garrett County?
There are 14,232 People in the Labor Forcein in Garrett County.
What is the Percentage of People in the Labor Force in Garrett County?
58.3% of People are in the Labor Force in Garrett County.
What is the Unemployment Rate in Garrett County?
Unemployment Rate in Garrett County is 4.6%.