Dorchester County, MD
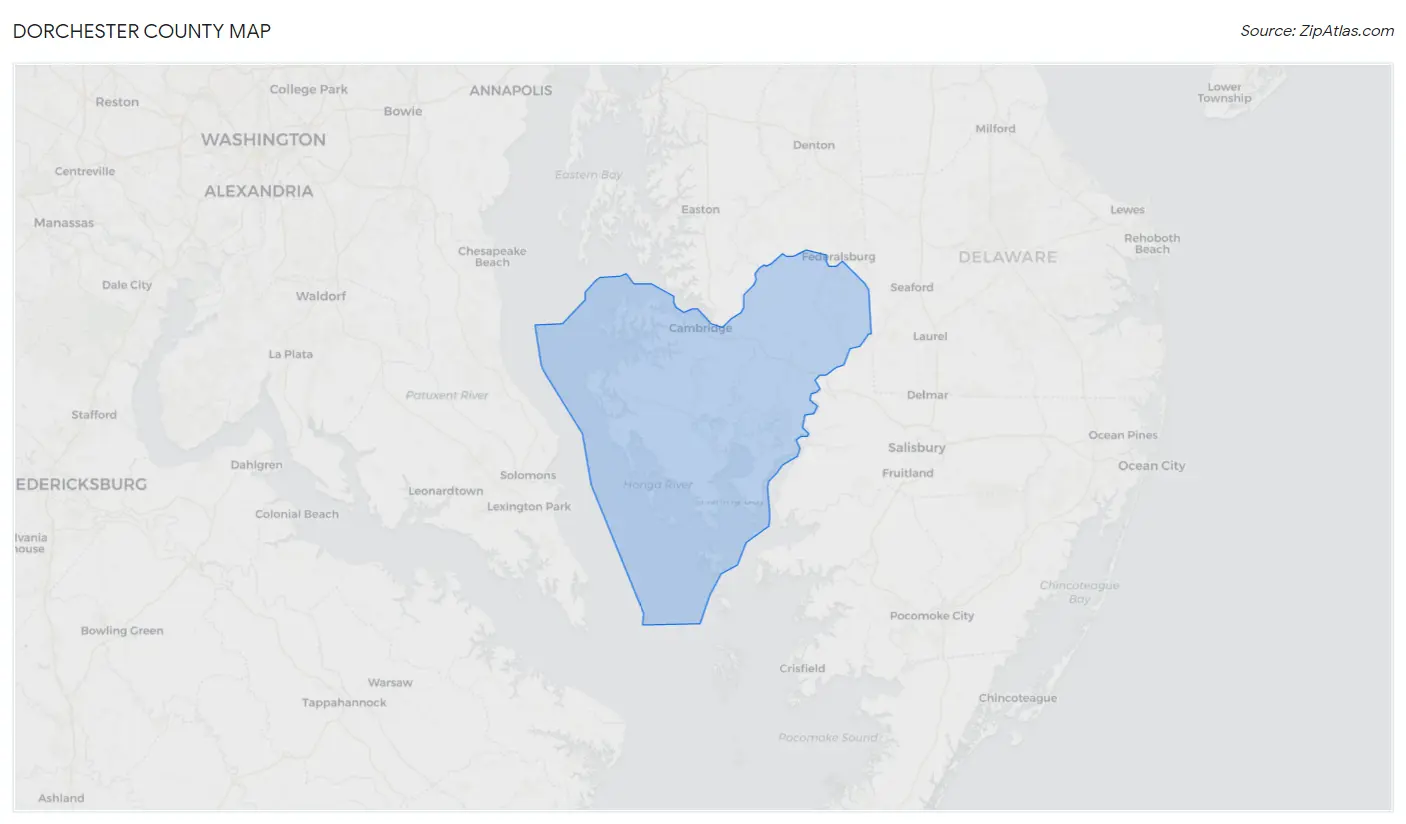
Dorchester County Map
Dorchester County Overview
32,557
TOTAL POPULATION
15,261
MALE POPULATION
17,296
FEMALE POPULATION
88.23
MALES / 100 FEMALES
113.33
FEMALES / 100 MALES
43.8
MEDIAN AGE
3.0
AVG FAMILY SIZE
2.4
AVG HOUSEHOLD SIZE
$33,950
PER CAPITA INCOME
$74,254
AVG FAMILY INCOME
$57,490
AVG HOUSEHOLD INCOME
27.4%
WAGE / INCOME GAP [ % ]
72.6¢/ $1
WAGE / INCOME GAP [ $ ]
$10,037
FAMILY INCOME DEFICIT
0.47
INEQUALITY / GINI INDEX
15,879
LABOR FORCE [ PEOPLE ]
59.5%
PERCENT IN LABOR FORCE
5.5%
UNEMPLOYMENT RATE
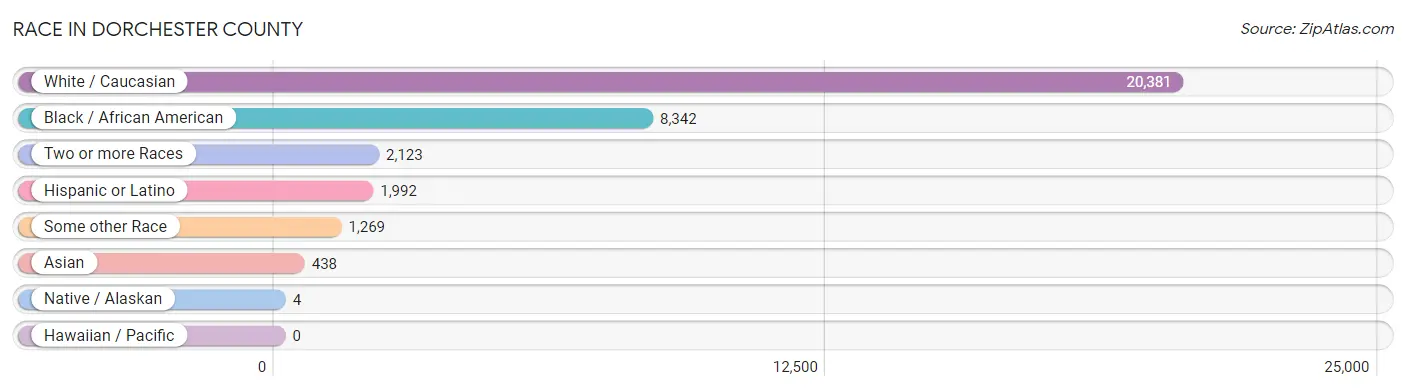
Race in Dorchester County
The most populous races in Dorchester County are White / Caucasian (20,381 | 62.6%), Black / African American (8,342 | 25.6%), and Two or more Races (2,123 | 6.5%).
| Race | # Population | % Population |
| Asian | 438 | 1.3% |
| Black / African American | 8,342 | 25.6% |
| Hawaiian / Pacific | 0 | 0.0% |
| Hispanic or Latino | 1,992 | 6.1% |
| Native / Alaskan | 4 | 0.0% |
| White / Caucasian | 20,381 | 62.6% |
| Two or more Races | 2,123 | 6.5% |
| Some other Race | 1,269 | 3.9% |
| Total | 32,557 | 100.0% |
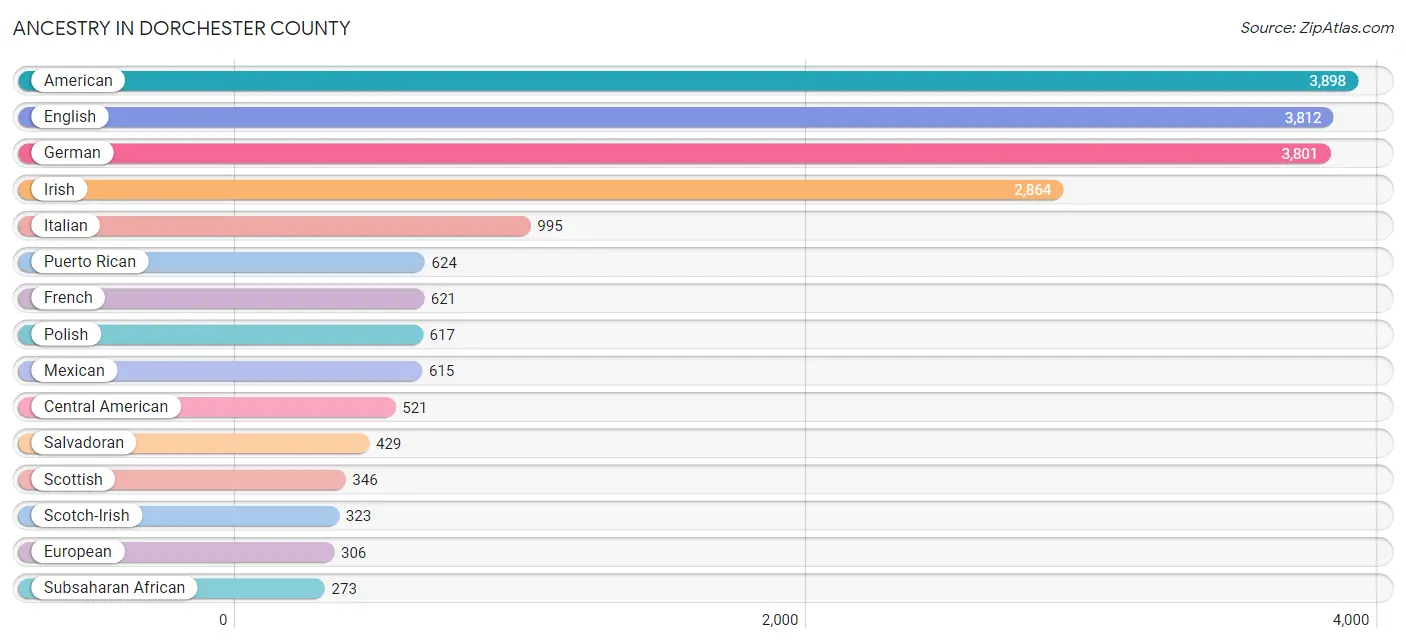
Ancestry in Dorchester County
The most populous ancestries reported in Dorchester County are American (3,898 | 12.0%), English (3,812 | 11.7%), German (3,801 | 11.7%), Irish (2,864 | 8.8%), and Italian (995 | 3.1%), together accounting for 47.2% of all Dorchester County residents.
| Ancestry | # Population | % Population |
| African | 99 | 0.3% |
| American | 3,898 | 12.0% |
| Arab | 16 | 0.1% |
| Armenian | 8 | 0.0% |
| Australian | 2 | 0.0% |
| Austrian | 22 | 0.1% |
| Barbadian | 5 | 0.0% |
| Belgian | 4 | 0.0% |
| Bhutanese | 29 | 0.1% |
| Blackfeet | 8 | 0.0% |
| Brazilian | 2 | 0.0% |
| British | 221 | 0.7% |
| British West Indian | 148 | 0.4% |
| Burmese | 6 | 0.0% |
| Canadian | 24 | 0.1% |
| Central American | 521 | 1.6% |
| Cherokee | 200 | 0.6% |
| Colombian | 10 | 0.0% |
| Croatian | 5 | 0.0% |
| Cuban | 56 | 0.2% |
| Czech | 92 | 0.3% |
| Czechoslovakian | 15 | 0.1% |
| Danish | 23 | 0.1% |
| Dominican | 116 | 0.4% |
| Dutch | 170 | 0.5% |
| Eastern European | 59 | 0.2% |
| English | 3,812 | 11.7% |
| European | 306 | 0.9% |
| Finnish | 13 | 0.0% |
| French | 621 | 1.9% |
| French Canadian | 90 | 0.3% |
| German | 3,801 | 11.7% |
| Ghanaian | 10 | 0.0% |
| Greek | 30 | 0.1% |
| Guatemalan | 81 | 0.3% |
| Haitian | 41 | 0.1% |
| Honduran | 11 | 0.0% |
| Hungarian | 10 | 0.0% |
| Indian (Asian) | 56 | 0.2% |
| Irish | 2,864 | 8.8% |
| Italian | 995 | 3.1% |
| Jamaican | 52 | 0.2% |
| Japanese | 212 | 0.6% |
| Korean | 16 | 0.1% |
| Laotian | 14 | 0.0% |
| Lebanese | 16 | 0.1% |
| Lithuanian | 91 | 0.3% |
| Lumbee | 2 | 0.0% |
| Mexican | 615 | 1.9% |
| Navajo | 29 | 0.1% |
| Nigerian | 132 | 0.4% |
| Northern European | 19 | 0.1% |
| Norwegian | 46 | 0.1% |
| Pakistani | 46 | 0.1% |
| Pennsylvania German | 7 | 0.0% |
| Polish | 617 | 1.9% |
| Portuguese | 36 | 0.1% |
| Puerto Rican | 624 | 1.9% |
| Romanian | 9 | 0.0% |
| Russian | 45 | 0.1% |
| Salvadoran | 429 | 1.3% |
| Scandinavian | 57 | 0.2% |
| Scotch-Irish | 323 | 1.0% |
| Scottish | 346 | 1.1% |
| Sioux | 56 | 0.2% |
| Slavic | 40 | 0.1% |
| Slovak | 12 | 0.0% |
| South African | 32 | 0.1% |
| South American | 10 | 0.0% |
| Spanish | 5 | 0.0% |
| Sri Lankan | 9 | 0.0% |
| Subsaharan African | 273 | 0.8% |
| Swedish | 142 | 0.4% |
| Swiss | 32 | 0.1% |
| Thai | 73 | 0.2% |
| Trinidadian and Tobagonian | 33 | 0.1% |
| Turkish | 14 | 0.0% |
| Ukrainian | 34 | 0.1% |
| Welsh | 211 | 0.6% |
| West Indian | 22 | 0.1% |
| Yugoslavian | 15 | 0.1% | View All 81 Rows |
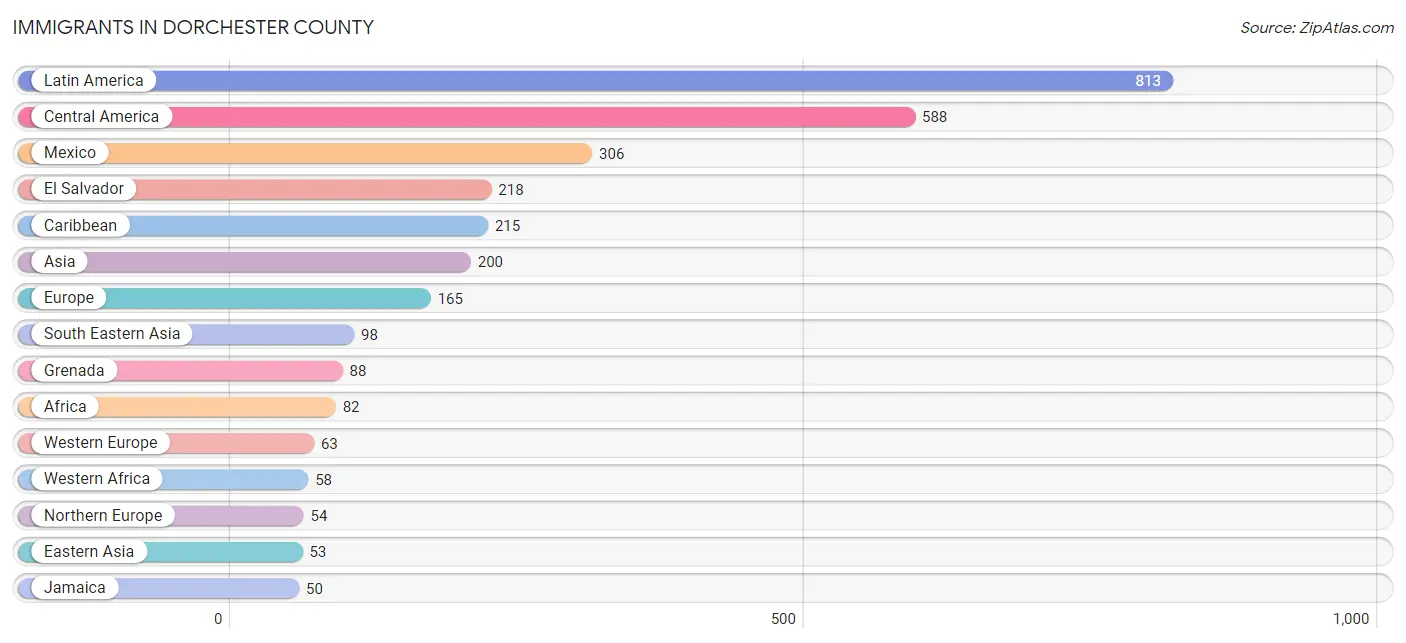
Immigrants in Dorchester County
The most numerous immigrant groups reported in Dorchester County came from Latin America (813 | 2.5%), Central America (588 | 1.8%), Mexico (306 | 0.9%), El Salvador (218 | 0.7%), and Caribbean (215 | 0.7%), together accounting for 6.6% of all Dorchester County residents.
| Immigration Origin | # Population | % Population |
| Africa | 82 | 0.3% |
| Asia | 200 | 0.6% |
| Australia | 2 | 0.0% |
| Bangladesh | 4 | 0.0% |
| Cambodia | 26 | 0.1% |
| Caribbean | 215 | 0.7% |
| Central America | 588 | 1.8% |
| China | 44 | 0.1% |
| Colombia | 10 | 0.0% |
| Croatia | 5 | 0.0% |
| Cuba | 8 | 0.0% |
| Dominican Republic | 2 | 0.0% |
| Eastern Africa | 2 | 0.0% |
| Eastern Asia | 53 | 0.2% |
| Eastern Europe | 6 | 0.0% |
| El Salvador | 218 | 0.7% |
| England | 6 | 0.0% |
| Ethiopia | 2 | 0.0% |
| Europe | 165 | 0.5% |
| Germany | 22 | 0.1% |
| Ghana | 10 | 0.0% |
| Grenada | 88 | 0.3% |
| Guatemala | 30 | 0.1% |
| Haiti | 38 | 0.1% |
| Honduras | 31 | 0.1% |
| India | 23 | 0.1% |
| Italy | 12 | 0.0% |
| Jamaica | 50 | 0.2% |
| Japan | 3 | 0.0% |
| Korea | 6 | 0.0% |
| Latin America | 813 | 2.5% |
| Malaysia | 12 | 0.0% |
| Mexico | 306 | 0.9% |
| Netherlands | 41 | 0.1% |
| Nigeria | 48 | 0.2% |
| Northern Europe | 54 | 0.2% |
| Norway | 12 | 0.0% |
| Oceania | 10 | 0.0% |
| Pakistan | 8 | 0.0% |
| Panama | 3 | 0.0% |
| Philippines | 16 | 0.1% |
| Portugal | 30 | 0.1% |
| Romania | 1 | 0.0% |
| South America | 10 | 0.0% |
| South Central Asia | 35 | 0.1% |
| South Eastern Asia | 98 | 0.3% |
| Southern Europe | 42 | 0.1% |
| St. Vincent and the Grenadines | 18 | 0.1% |
| Sweden | 23 | 0.1% |
| Thailand | 35 | 0.1% |
| Trinidad and Tobago | 11 | 0.0% |
| Turkey | 14 | 0.0% |
| Vietnam | 9 | 0.0% |
| Western Africa | 58 | 0.2% |
| Western Asia | 14 | 0.0% |
| Western Europe | 63 | 0.2% | View All 56 Rows |
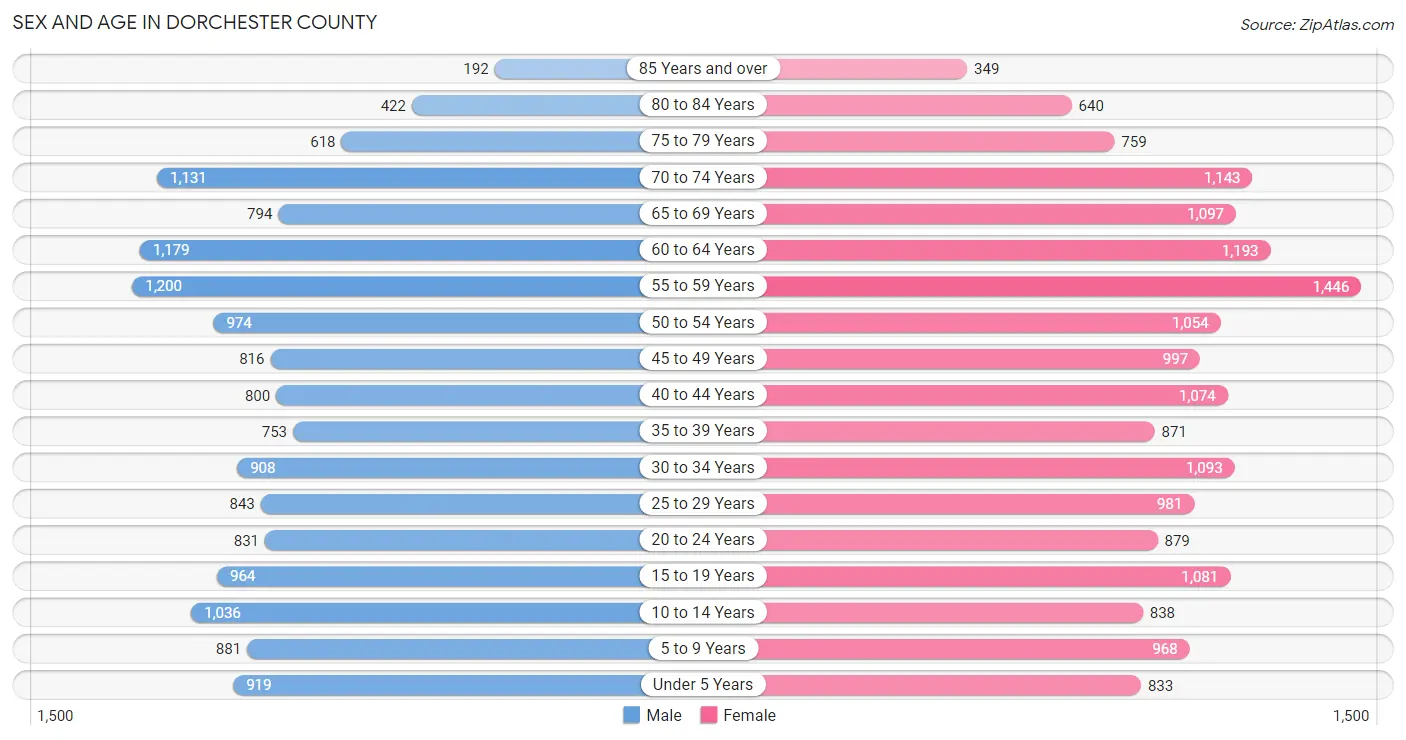
Sex and Age in Dorchester County
Sex and Age in Dorchester County
The most populous age groups in Dorchester County are 55 to 59 Years (1,200 | 7.9%) for men and 55 to 59 Years (1,446 | 8.4%) for women.
| Age Bracket | Male | Female |
| Under 5 Years | 919 (6.0%) | 833 (4.8%) |
| 5 to 9 Years | 881 (5.8%) | 968 (5.6%) |
| 10 to 14 Years | 1,036 (6.8%) | 838 (4.9%) |
| 15 to 19 Years | 964 (6.3%) | 1,081 (6.2%) |
| 20 to 24 Years | 831 (5.4%) | 879 (5.1%) |
| 25 to 29 Years | 843 (5.5%) | 981 (5.7%) |
| 30 to 34 Years | 908 (5.9%) | 1,093 (6.3%) |
| 35 to 39 Years | 753 (4.9%) | 871 (5.0%) |
| 40 to 44 Years | 800 (5.2%) | 1,074 (6.2%) |
| 45 to 49 Years | 816 (5.3%) | 997 (5.8%) |
| 50 to 54 Years | 974 (6.4%) | 1,054 (6.1%) |
| 55 to 59 Years | 1,200 (7.9%) | 1,446 (8.4%) |
| 60 to 64 Years | 1,179 (7.7%) | 1,193 (6.9%) |
| 65 to 69 Years | 794 (5.2%) | 1,097 (6.3%) |
| 70 to 74 Years | 1,131 (7.4%) | 1,143 (6.6%) |
| 75 to 79 Years | 618 (4.1%) | 759 (4.4%) |
| 80 to 84 Years | 422 (2.8%) | 640 (3.7%) |
| 85 Years and over | 192 (1.3%) | 349 (2.0%) |
| Total | 15,261 (100.0%) | 17,296 (100.0%) |
Families and Households in Dorchester County
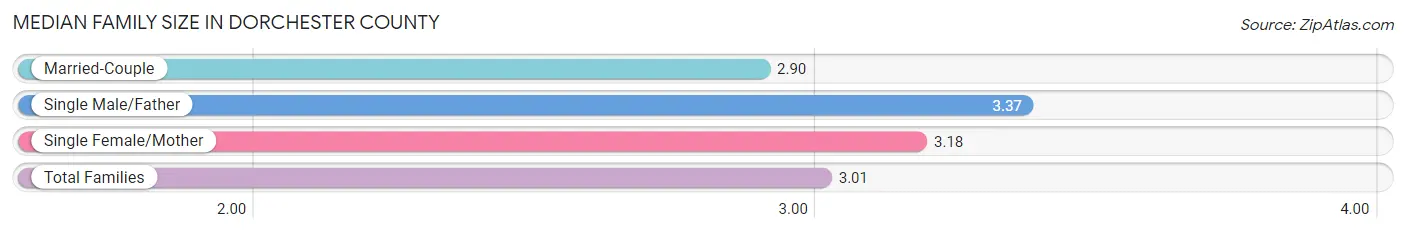
Median Family Size in Dorchester County
The median family size in Dorchester County is 3.01 persons per family, with single male/father families (673 | 8.0%) accounting for the largest median family size of 3.37 persons per family. On the other hand, married-couple families (5,580 | 66.6%) represent the smallest median family size with 2.90 persons per family.
| Family Type | # Families | Family Size |
| Married-Couple | 5,580 (66.6%) | 2.90 |
| Single Male/Father | 673 (8.0%) | 3.37 |
| Single Female/Mother | 2,124 (25.4%) | 3.18 |
| Total Families | 8,377 (100.0%) | 3.01 |
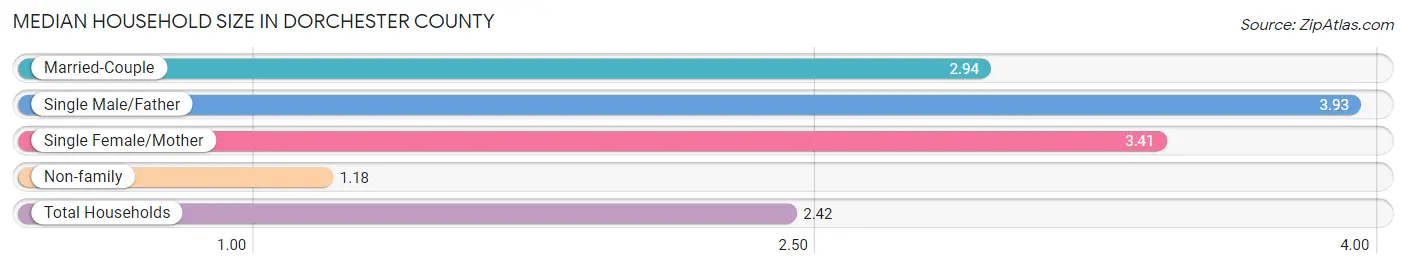
Median Household Size in Dorchester County
The median household size in Dorchester County is 2.42 persons per household, with single male/father households (673 | 5.1%) accounting for the largest median household size of 3.93 persons per household. non-family households (4,839 | 36.6%) represent the smallest median household size with 1.18 persons per household.
| Household Type | # Households | Household Size |
| Married-Couple | 5,580 (42.2%) | 2.94 |
| Single Male/Father | 673 (5.1%) | 3.93 |
| Single Female/Mother | 2,124 (16.1%) | 3.41 |
| Non-family | 4,839 (36.6%) | 1.18 |
| Total Households | 13,216 (100.0%) | 2.42 |
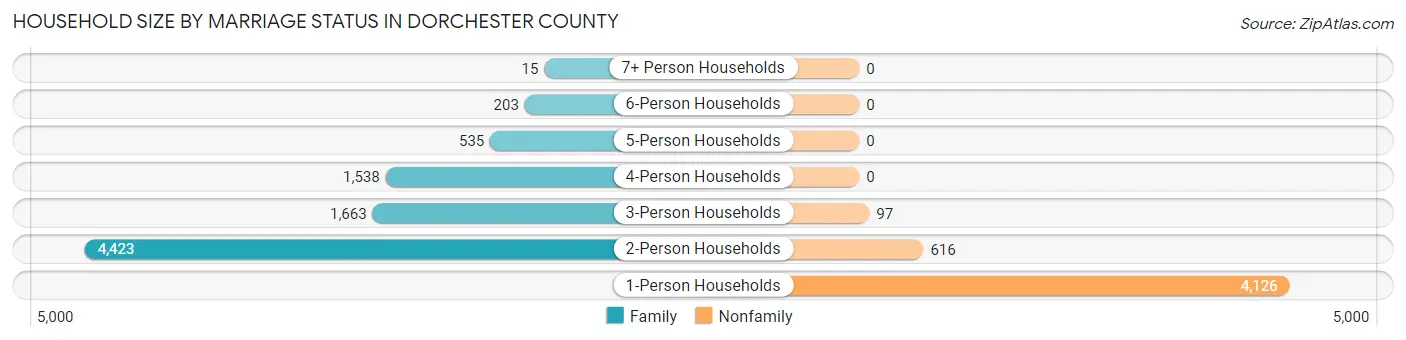
Household Size by Marriage Status in Dorchester County
Out of a total of 13,216 households in Dorchester County, 8,377 (63.4%) are family households, while 4,839 (36.6%) are nonfamily households. The most numerous type of family households are 2-person households, comprising 4,423, and the most common type of nonfamily households are 1-person households, comprising 4,126.
| Household Size | Family Households | Nonfamily Households |
| 1-Person Households | - | 4,126 (31.2%) |
| 2-Person Households | 4,423 (33.5%) | 616 (4.7%) |
| 3-Person Households | 1,663 (12.6%) | 97 (0.7%) |
| 4-Person Households | 1,538 (11.6%) | 0 (0.0%) |
| 5-Person Households | 535 (4.1%) | 0 (0.0%) |
| 6-Person Households | 203 (1.5%) | 0 (0.0%) |
| 7+ Person Households | 15 (0.1%) | 0 (0.0%) |
| Total | 8,377 (63.4%) | 4,839 (36.6%) |
Female Fertility in Dorchester County
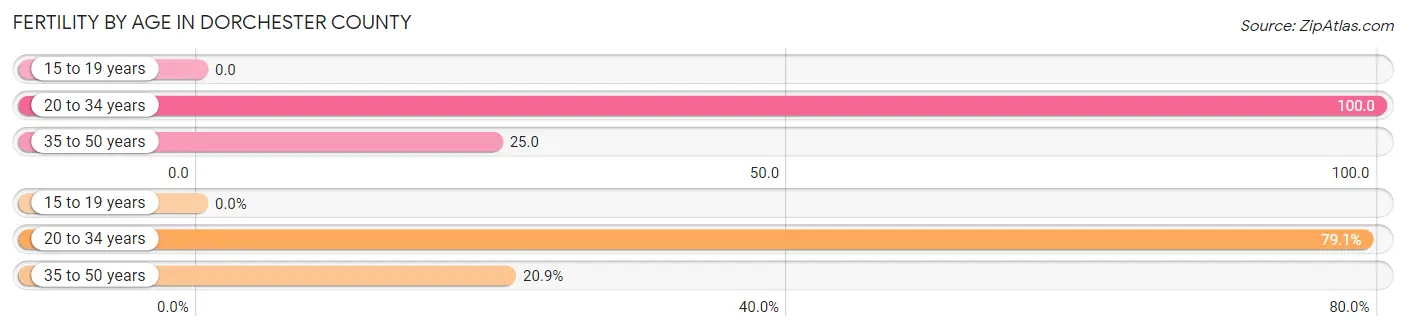
Fertility by Age in Dorchester County
Average fertility rate in Dorchester County is 52.0 births per 1,000 women. Women in the age bracket of 20 to 34 years have the highest fertility rate with 100.0 births per 1,000 women. Women in the age bracket of 20 to 34 years acount for 79.1% of all women with births.
| Age Bracket | Women with Births | Births / 1,000 Women |
| 15 to 19 years | 0 (0.0%) | 0.0 |
| 20 to 34 years | 295 (79.1%) | 100.0 |
| 35 to 50 years | 78 (20.9%) | 25.0 |
| Total | 373 (100.0%) | 52.0 |
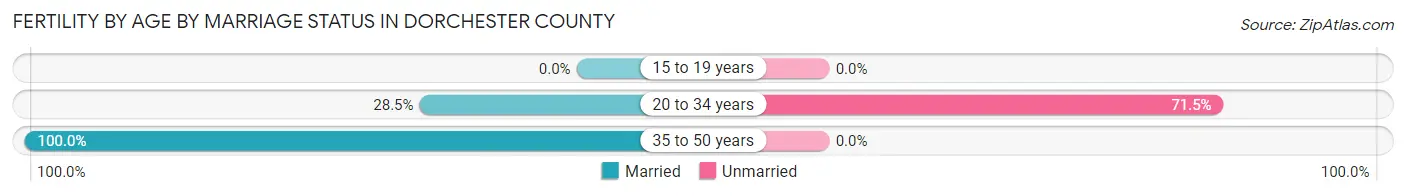
Fertility by Age by Marriage Status in Dorchester County
43.4% of women with births (373) in Dorchester County are married. The highest percentage of unmarried women with births falls into 20 to 34 years age bracket with 71.5% of them unmarried at the time of birth, while the lowest percentage of unmarried women with births belong to 35 to 50 years age bracket with 0.0% of them unmarried.
| Age Bracket | Married | Unmarried |
| 15 to 19 years | 0 (0.0%) | 0 (0.0%) |
| 20 to 34 years | 84 (28.5%) | 211 (71.5%) |
| 35 to 50 years | 78 (100.0%) | 0 (0.0%) |
| Total | 162 (43.4%) | 211 (56.6%) |
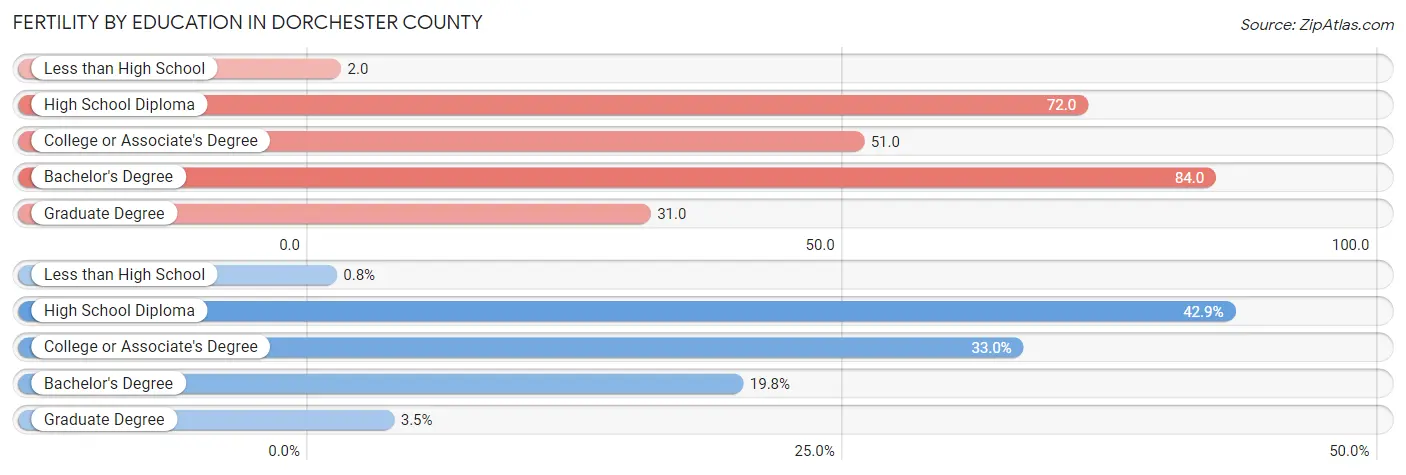
Fertility by Education in Dorchester County
Average fertility rate in Dorchester County is 52.0 births per 1,000 women. Women with the education attainment of bachelor's degree have the highest fertility rate of 84.0 births per 1,000 women, while women with the education attainment of less than high school have the lowest fertility at 2.0 births per 1,000 women. Women with the education attainment of high school diploma represent 42.9% of all women with births.
| Educational Attainment | Women with Births | Births / 1,000 Women |
| Less than High School | 3 (0.8%) | 2.0 |
| High School Diploma | 160 (42.9%) | 72.0 |
| College or Associate's Degree | 123 (33.0%) | 51.0 |
| Bachelor's Degree | 74 (19.8%) | 84.0 |
| Graduate Degree | 13 (3.5%) | 31.0 |
| Total | 373 (100.0%) | 52.0 |
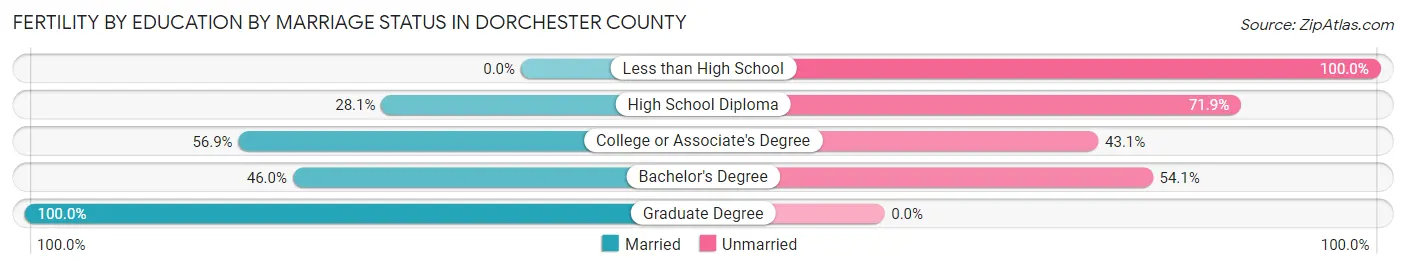
Fertility by Education by Marriage Status in Dorchester County
56.6% of women with births in Dorchester County are unmarried. Women with the educational attainment of graduate degree are most likely to be married with 100.0% of them married at childbirth, while women with the educational attainment of less than high school are least likely to be married with 100.0% of them unmarried at childbirth.
| Educational Attainment | Married | Unmarried |
| Less than High School | 0 (0.0%) | 3 (100.0%) |
| High School Diploma | 45 (28.1%) | 115 (71.9%) |
| College or Associate's Degree | 70 (56.9%) | 53 (43.1%) |
| Bachelor's Degree | 34 (46.0%) | 40 (54.0%) |
| Graduate Degree | 13 (100.0%) | 0 (0.0%) |
| Total | 162 (43.4%) | 211 (56.6%) |
Income in Dorchester County
Income Overview in Dorchester County
Per Capita Income in Dorchester County is $33,950, while median incomes of families and households are $74,254 and $57,490 respectively.
| Characteristic | Number | Measure |
| Per Capita Income | 32,557 | $33,950 |
| Median Family Income | 8,377 | $74,254 |
| Mean Family Income | 8,377 | $96,647 |
| Median Household Income | 13,216 | $57,490 |
| Mean Household Income | 13,216 | $80,396 |
| Income Deficit | 8,377 | $10,037 |
| Wage / Income Gap (%) | 32,557 | 27.42% |
| Wage / Income Gap ($) | 32,557 | 72.58¢ per $1 |
| Gini / Inequality Index | 32,557 | 0.47 |
Earnings by Sex in Dorchester County
Average Earnings in Dorchester County are $34,958, $40,738 for men and $29,568 for women, a difference of 27.4%.
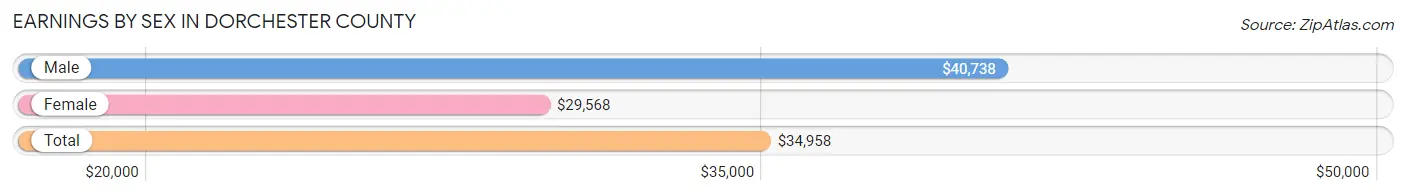
| Sex | Number | Average Earnings |
| Male | 8,255 (49.0%) | $40,738 |
| Female | 8,600 (51.0%) | $29,568 |
| Total | 16,855 (100.0%) | $34,958 |
Earnings by Sex by Income Bracket in Dorchester County
The most common earnings brackets in Dorchester County are $100,000+ for men (810 | 9.8%) and $25,000 to $29,999 for women (1,113 | 12.9%).
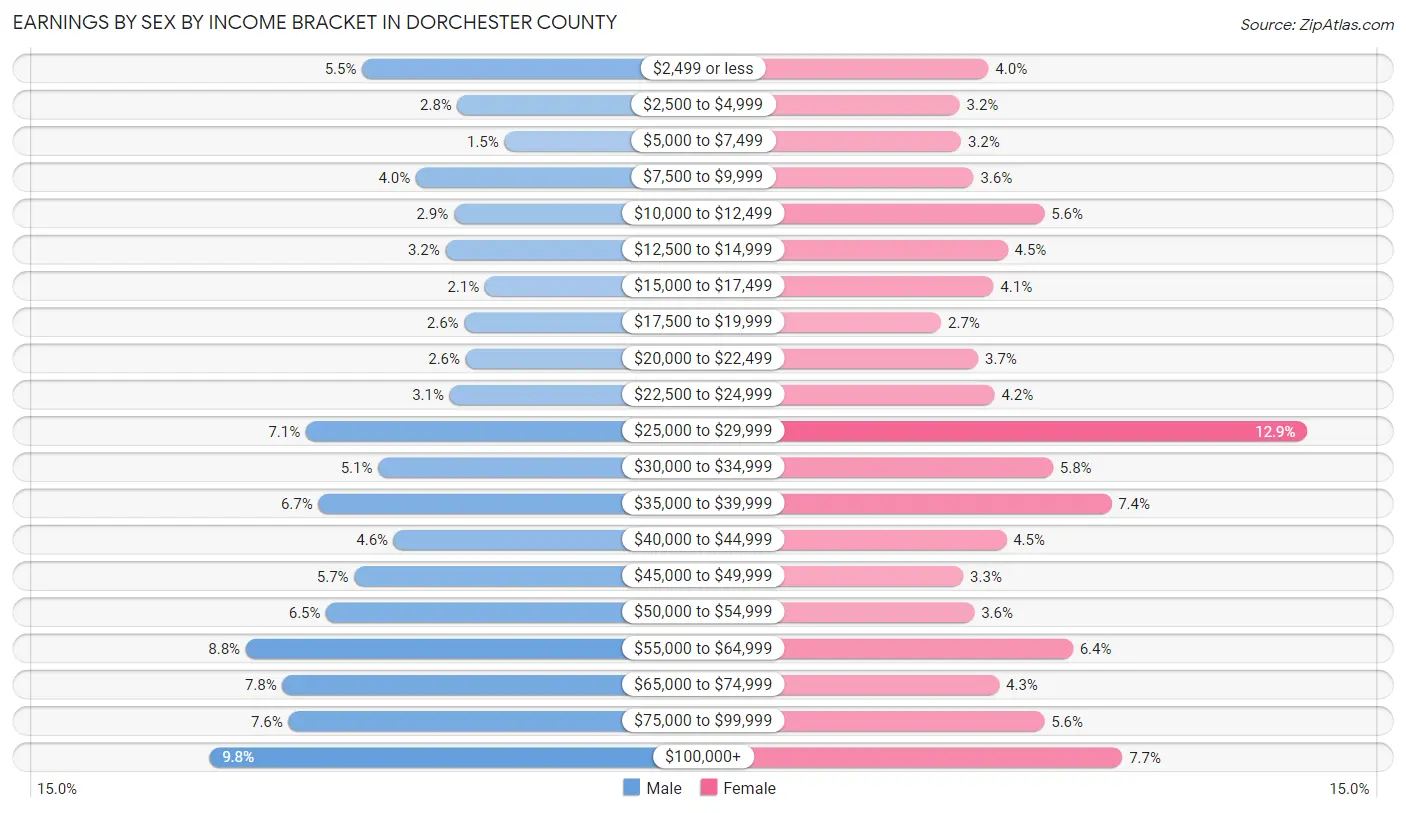
| Income | Male | Female |
| $2,499 or less | 455 (5.5%) | 342 (4.0%) |
| $2,500 to $4,999 | 234 (2.8%) | 273 (3.2%) |
| $5,000 to $7,499 | 125 (1.5%) | 276 (3.2%) |
| $7,500 to $9,999 | 330 (4.0%) | 306 (3.6%) |
| $10,000 to $12,499 | 242 (2.9%) | 477 (5.6%) |
| $12,500 to $14,999 | 262 (3.2%) | 389 (4.5%) |
| $15,000 to $17,499 | 170 (2.1%) | 354 (4.1%) |
| $17,500 to $19,999 | 218 (2.6%) | 228 (2.6%) |
| $20,000 to $22,499 | 215 (2.6%) | 317 (3.7%) |
| $22,500 to $24,999 | 252 (3.0%) | 357 (4.2%) |
| $25,000 to $29,999 | 585 (7.1%) | 1,113 (12.9%) |
| $30,000 to $34,999 | 418 (5.1%) | 498 (5.8%) |
| $35,000 to $39,999 | 556 (6.7%) | 639 (7.4%) |
| $40,000 to $44,999 | 381 (4.6%) | 385 (4.5%) |
| $45,000 to $49,999 | 473 (5.7%) | 281 (3.3%) |
| $50,000 to $54,999 | 538 (6.5%) | 308 (3.6%) |
| $55,000 to $64,999 | 725 (8.8%) | 546 (6.4%) |
| $65,000 to $74,999 | 640 (7.7%) | 368 (4.3%) |
| $75,000 to $99,999 | 626 (7.6%) | 477 (5.6%) |
| $100,000+ | 810 (9.8%) | 666 (7.7%) |
| Total | 8,255 (100.0%) | 8,600 (100.0%) |
Earnings by Sex by Educational Attainment in Dorchester County
Average earnings in Dorchester County are $46,447 for men and $33,744 for women, a difference of 27.4%. Men with an educational attainment of bachelor's degree enjoy the highest average annual earnings of $59,485, while those with less than high school education earn the least with $36,036. Women with an educational attainment of graduate degree earn the most with the average annual earnings of $81,635, while those with high school diploma education have the smallest earnings of $27,887.
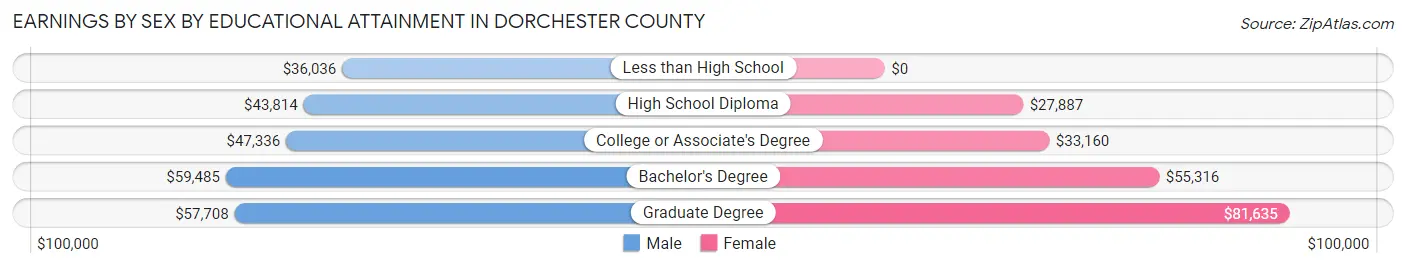
| Educational Attainment | Male Income | Female Income |
| Less than High School | $36,036 | $0 |
| High School Diploma | $43,814 | $27,887 |
| College or Associate's Degree | $47,336 | $33,160 |
| Bachelor's Degree | $59,485 | $55,316 |
| Graduate Degree | $57,708 | $81,635 |
| Total | $46,447 | $33,744 |
Family Income in Dorchester County
Family Income Brackets in Dorchester County
According to the Dorchester County family income data, there are 1,592 families falling into the $100,000 to $149,999 income range, which is the most common income bracket and makes up 19.0% of all families. Conversely, the less than $10,000 income bracket is the least frequent group with only 209 families (2.5%) belonging to this category.
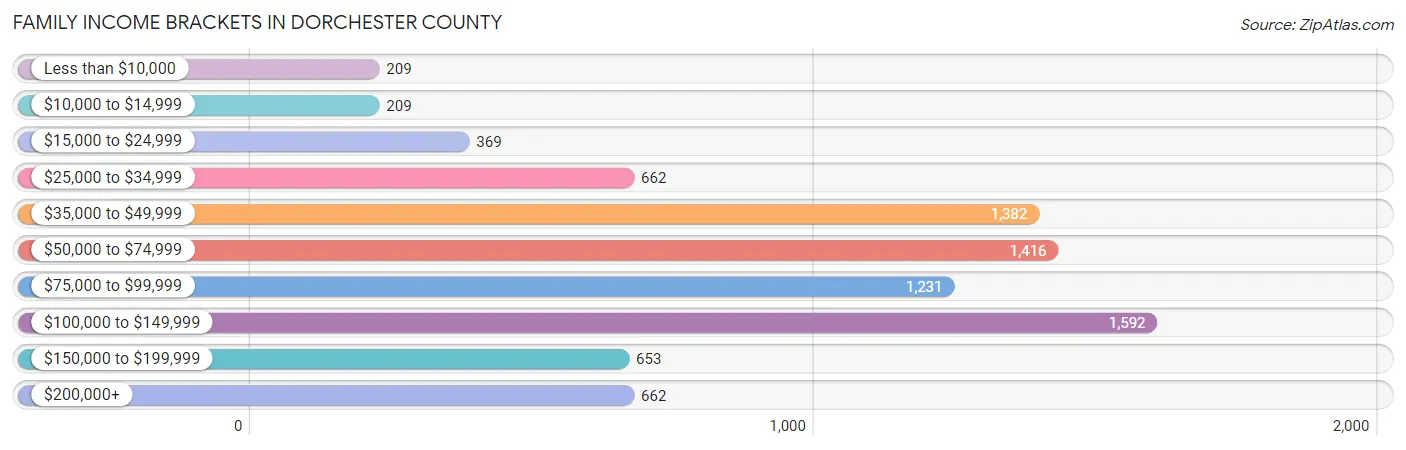
| Income Bracket | # Families | % Families |
| Less than $10,000 | 209 | 2.5% |
| $10,000 to $14,999 | 209 | 2.5% |
| $15,000 to $24,999 | 369 | 4.4% |
| $25,000 to $34,999 | 662 | 7.9% |
| $35,000 to $49,999 | 1,382 | 16.5% |
| $50,000 to $74,999 | 1,416 | 16.9% |
| $75,000 to $99,999 | 1,231 | 14.7% |
| $100,000 to $149,999 | 1,592 | 19.0% |
| $150,000 to $199,999 | 653 | 7.8% |
| $200,000+ | 662 | 7.9% |
Family Income by Famaliy Size in Dorchester County
6-person families (135 | 1.6%) account for the highest median family income in Dorchester County with $143,309 per family, while 2-person families (4,780 | 57.1%) have the highest median income of $34,241 per family member.
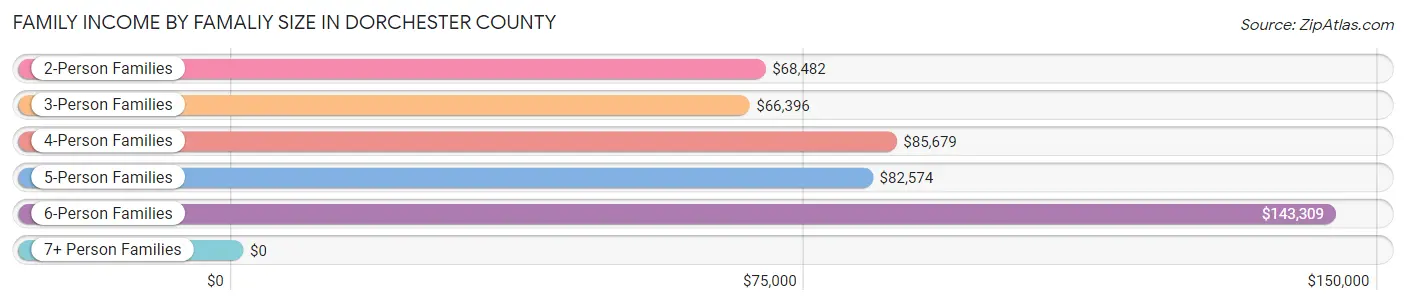
| Income Bracket | # Families | Median Income |
| 2-Person Families | 4,780 (57.1%) | $68,482 |
| 3-Person Families | 1,567 (18.7%) | $66,396 |
| 4-Person Families | 1,471 (17.6%) | $85,679 |
| 5-Person Families | 409 (4.9%) | $82,574 |
| 6-Person Families | 135 (1.6%) | $143,309 |
| 7+ Person Families | 15 (0.2%) | $0 |
| Total | 8,377 (100.0%) | $74,254 |
Family Income by Number of Earners in Dorchester County
The median family income in Dorchester County is $74,254, with families comprising 3+ earners (1,021) having the highest median family income of $147,577, while families with no earners (1,432) have the lowest median family income of $39,471, accounting for 12.2% and 17.1% of families, respectively.
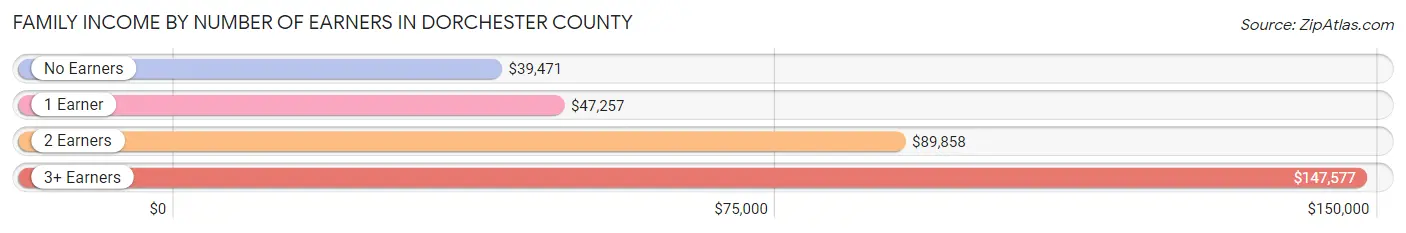
| Number of Earners | # Families | Median Income |
| No Earners | 1,432 (17.1%) | $39,471 |
| 1 Earner | 2,799 (33.4%) | $47,257 |
| 2 Earners | 3,125 (37.3%) | $89,858 |
| 3+ Earners | 1,021 (12.2%) | $147,577 |
| Total | 8,377 (100.0%) | $74,254 |
Household Income in Dorchester County
Household Income Brackets in Dorchester County
With 2,234 households falling in the category, the $50,000 to $74,999 income range is the most frequent in Dorchester County, accounting for 16.9% of all households. In contrast, only 753 households (5.7%) fall into the $200,000+ income bracket, making it the least populous group.
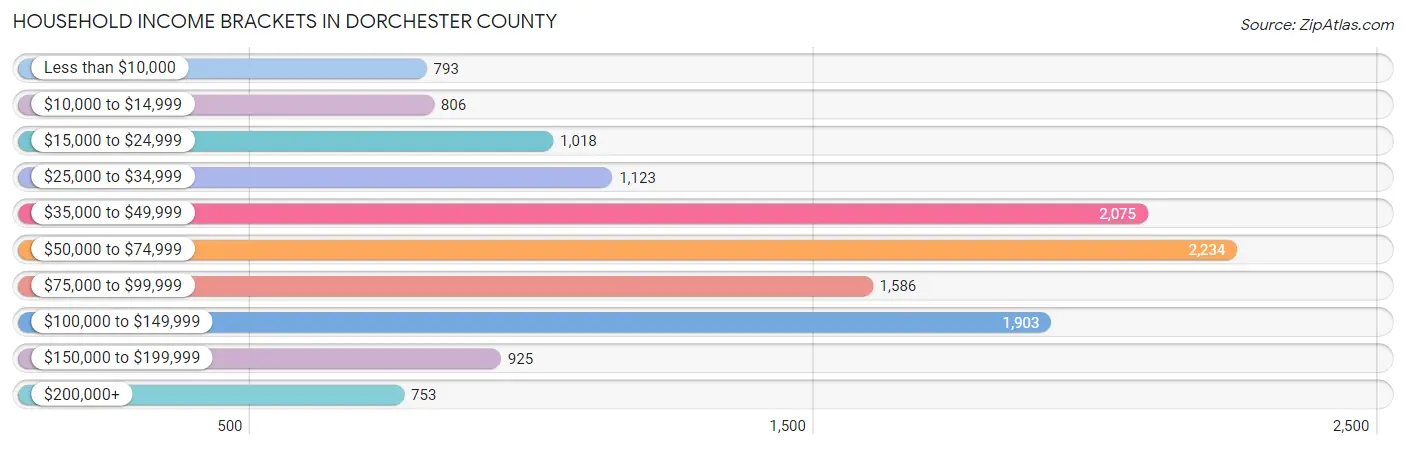
| Income Bracket | # Households | % Households |
| Less than $10,000 | 793 | 6.0% |
| $10,000 to $14,999 | 806 | 6.1% |
| $15,000 to $24,999 | 1,018 | 7.7% |
| $25,000 to $34,999 | 1,123 | 8.5% |
| $35,000 to $49,999 | 2,075 | 15.7% |
| $50,000 to $74,999 | 2,234 | 16.9% |
| $75,000 to $99,999 | 1,586 | 12.0% |
| $100,000 to $149,999 | 1,903 | 14.4% |
| $150,000 to $199,999 | 925 | 7.0% |
| $200,000+ | 753 | 5.7% |
Household Income by Householder Age in Dorchester County
The median household income in Dorchester County is $57,490, with the highest median household income of $78,698 found in the 45 to 64 years age bracket for the primary householder. A total of 4,889 households (37.0%) fall into this category. Meanwhile, the 15 to 24 years age bracket for the primary householder has the lowest median household income of $41,441, with 192 households (1.5%) in this group.
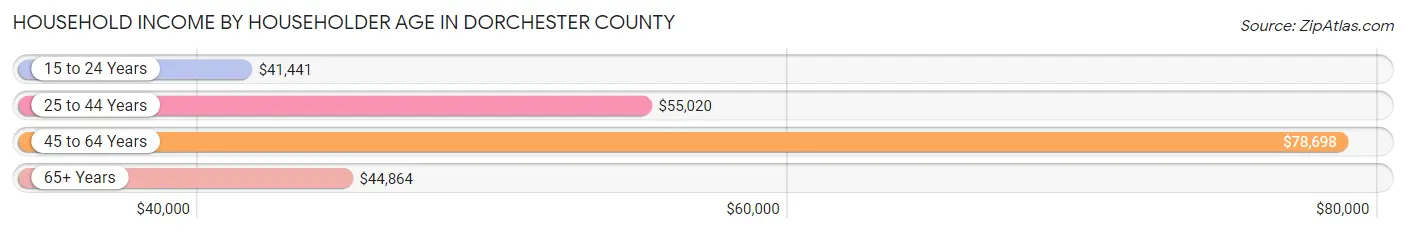
| Income Bracket | # Households | Median Income |
| 15 to 24 Years | 192 (1.5%) | $41,441 |
| 25 to 44 Years | 3,588 (27.2%) | $55,020 |
| 45 to 64 Years | 4,889 (37.0%) | $78,698 |
| 65+ Years | 4,547 (34.4%) | $44,864 |
| Total | 13,216 (100.0%) | $57,490 |
Poverty in Dorchester County
Income Below Poverty by Sex and Age in Dorchester County
With 13.7% poverty level for males and 16.9% for females among the residents of Dorchester County, under 5 year old males and 16 and 17 year old females are the most vulnerable to poverty, with 335 males (36.4%) and 186 females (32.4%) in their respective age groups living below the poverty level.
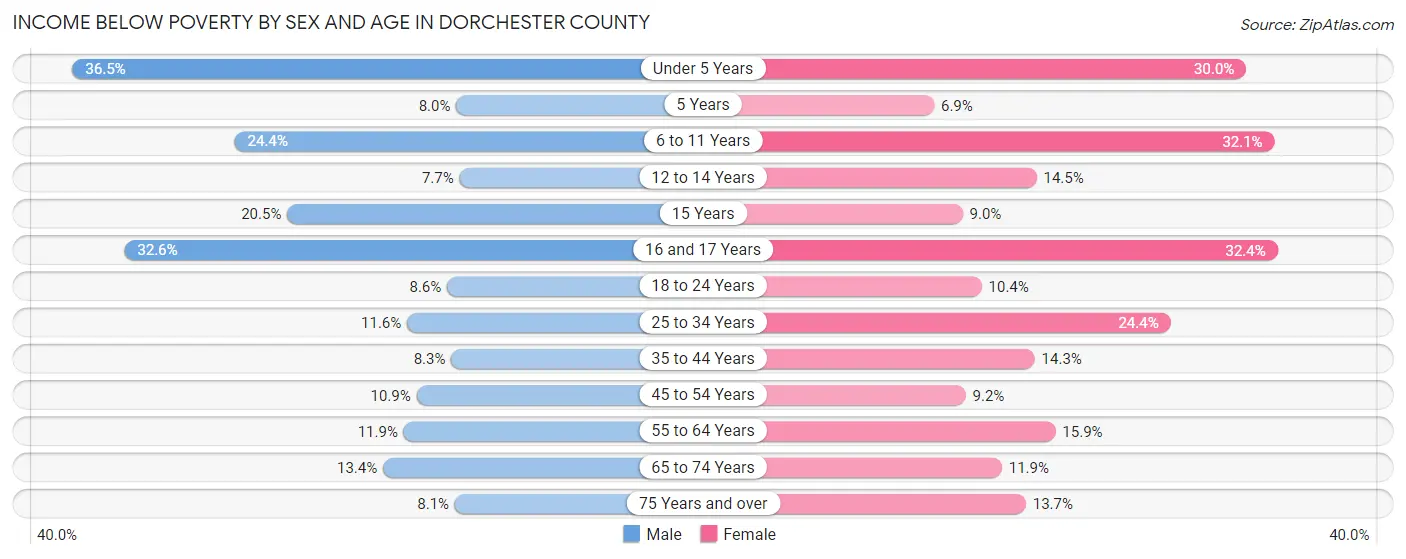
| Age Bracket | Male | Female |
| Under 5 Years | 335 (36.4%) | 248 (30.0%) |
| 5 Years | 14 (8.0%) | 10 (6.9%) |
| 6 to 11 Years | 239 (24.4%) | 345 (32.1%) |
| 12 to 14 Years | 57 (7.7%) | 84 (14.5%) |
| 15 Years | 33 (20.5%) | 21 (9.0%) |
| 16 and 17 Years | 131 (32.6%) | 186 (32.4%) |
| 18 to 24 Years | 103 (8.6%) | 118 (10.4%) |
| 25 to 34 Years | 198 (11.6%) | 506 (24.4%) |
| 35 to 44 Years | 127 (8.3%) | 278 (14.3%) |
| 45 to 54 Years | 192 (10.9%) | 188 (9.2%) |
| 55 to 64 Years | 280 (11.8%) | 418 (15.9%) |
| 65 to 74 Years | 251 (13.4%) | 265 (11.9%) |
| 75 Years and over | 95 (8.1%) | 229 (13.7%) |
| Total | 2,055 (13.7%) | 2,896 (16.9%) |
Income Above Poverty by Sex and Age in Dorchester County
According to the poverty statistics in Dorchester County, males aged 12 to 14 years and females aged 5 years are the age groups that are most secure financially, with 92.3% of males and 93.1% of females in these age groups living above the poverty line.
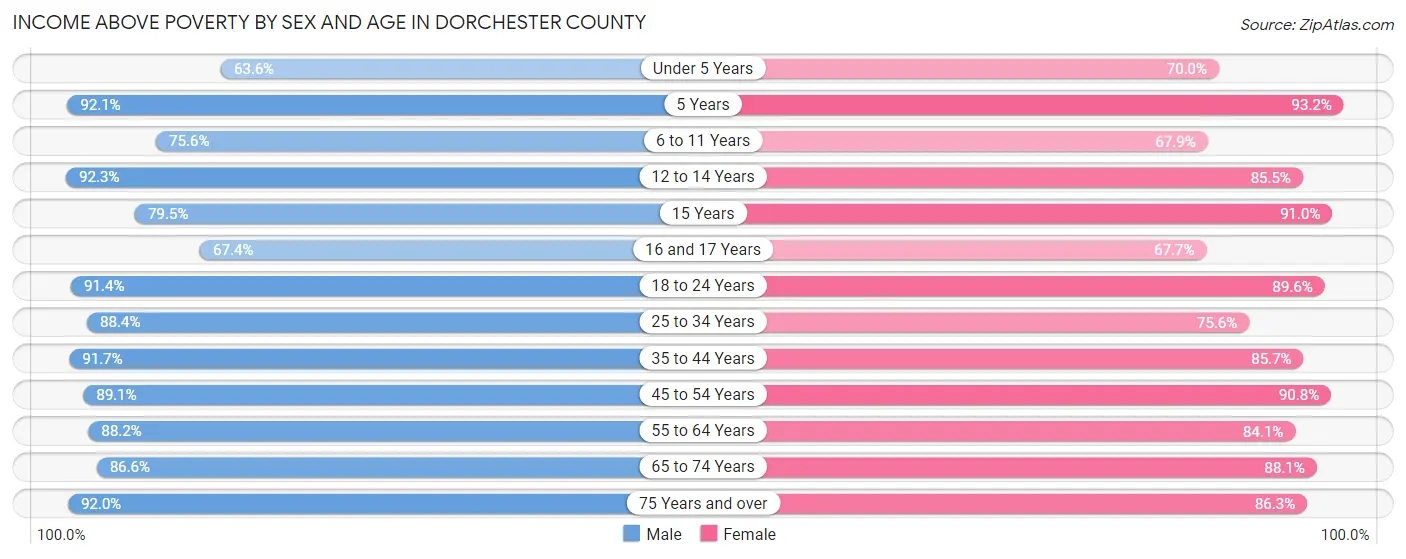
| Age Bracket | Male | Female |
| Under 5 Years | 584 (63.5%) | 578 (70.0%) |
| 5 Years | 162 (92.0%) | 136 (93.1%) |
| 6 to 11 Years | 740 (75.6%) | 729 (67.9%) |
| 12 to 14 Years | 682 (92.3%) | 497 (85.5%) |
| 15 Years | 128 (79.5%) | 213 (91.0%) |
| 16 and 17 Years | 271 (67.4%) | 389 (67.6%) |
| 18 to 24 Years | 1,091 (91.4%) | 1,019 (89.6%) |
| 25 to 34 Years | 1,509 (88.4%) | 1,568 (75.6%) |
| 35 to 44 Years | 1,399 (91.7%) | 1,663 (85.7%) |
| 45 to 54 Years | 1,569 (89.1%) | 1,858 (90.8%) |
| 55 to 64 Years | 2,083 (88.1%) | 2,217 (84.1%) |
| 65 to 74 Years | 1,624 (86.6%) | 1,965 (88.1%) |
| 75 Years and over | 1,085 (91.9%) | 1,447 (86.3%) |
| Total | 12,927 (86.3%) | 14,279 (83.1%) |
Income Below Poverty Among Married-Couple Families in Dorchester County
The poverty statistics for married-couple families in Dorchester County show that 3.4% or 189 of the total 5,580 families live below the poverty line. Families with 1 or 2 children have the highest poverty rate of 7.3%, comprising of 97 families. On the other hand, families with 3 or 4 children have the lowest poverty rate of 0.0%, which includes 0 families.
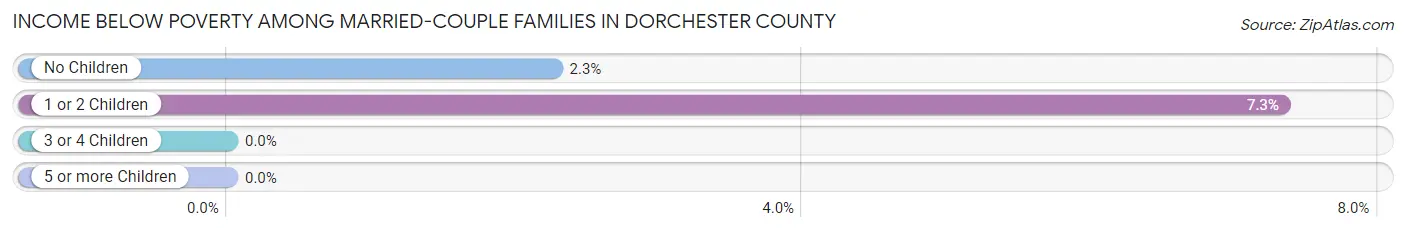
| Children | Above Poverty | Below Poverty |
| No Children | 3,971 (97.7%) | 92 (2.3%) |
| 1 or 2 Children | 1,227 (92.7%) | 97 (7.3%) |
| 3 or 4 Children | 193 (100.0%) | 0 (0.0%) |
| 5 or more Children | 0 (0.0%) | 0 (0.0%) |
| Total | 5,391 (96.6%) | 189 (3.4%) |
Income Below Poverty Among Single-Parent Households in Dorchester County
According to the poverty data in Dorchester County, 19.5% or 131 single-father households and 19.2% or 407 single-mother households are living below the poverty line. Among single-father households, those with 1 or 2 children have the highest poverty rate, with 115 households (26.6%) experiencing poverty. Likewise, among single-mother households, those with 3 or 4 children have the highest poverty rate, with 123 households (52.3%) falling below the poverty line.
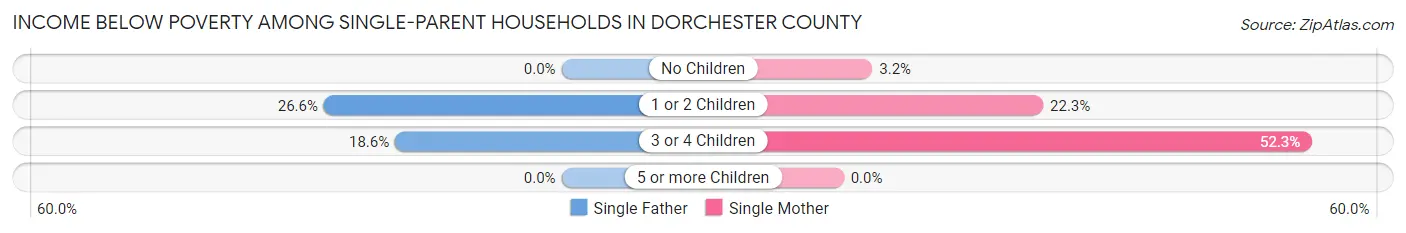
| Children | Single Father | Single Mother |
| No Children | 0 (0.0%) | 23 (3.2%) |
| 1 or 2 Children | 115 (26.6%) | 261 (22.3%) |
| 3 or 4 Children | 16 (18.6%) | 123 (52.3%) |
| 5 or more Children | 0 (0.0%) | 0 (0.0%) |
| Total | 131 (19.5%) | 407 (19.2%) |
Income Below Poverty Among Married-Couple vs Single-Parent Households in Dorchester County
The poverty data for Dorchester County shows that 189 of the married-couple family households (3.4%) and 538 of the single-parent households (19.2%) are living below the poverty level. Within the married-couple family households, those with 1 or 2 children have the highest poverty rate, with 97 households (7.3%) falling below the poverty line. Among the single-parent households, those with 3 or 4 children have the highest poverty rate, with 139 household (43.3%) living below poverty.
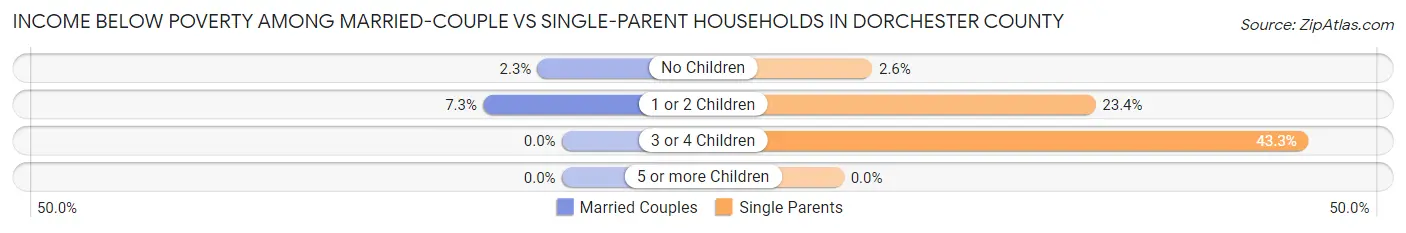
| Children | Married-Couple Families | Single-Parent Households |
| No Children | 92 (2.3%) | 23 (2.6%) |
| 1 or 2 Children | 97 (7.3%) | 376 (23.4%) |
| 3 or 4 Children | 0 (0.0%) | 139 (43.3%) |
| 5 or more Children | 0 (0.0%) | 0 (0.0%) |
| Total | 189 (3.4%) | 538 (19.2%) |
Employment Characteristics in Dorchester County
Employment by Class of Employer in Dorchester County
Among the 14,681 employed individuals in Dorchester County, private company employees (8,899 | 60.6%), local government employees (1,508 | 10.3%), and self-employed (not incorporated) (1,293 | 8.8%) make up the most common classes of employment.
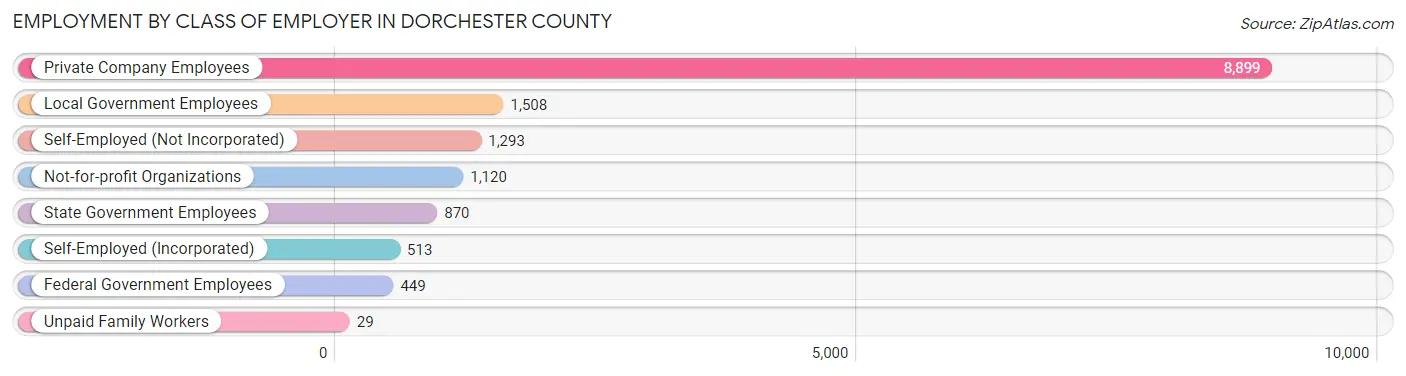
| Employer Class | # Employees | % Employees |
| Private Company Employees | 8,899 | 60.6% |
| Self-Employed (Incorporated) | 513 | 3.5% |
| Self-Employed (Not Incorporated) | 1,293 | 8.8% |
| Not-for-profit Organizations | 1,120 | 7.6% |
| Local Government Employees | 1,508 | 10.3% |
| State Government Employees | 870 | 5.9% |
| Federal Government Employees | 449 | 3.1% |
| Unpaid Family Workers | 29 | 0.2% |
| Total | 14,681 | 100.0% |
Employment Status by Age in Dorchester County
According to the labor force statistics for Dorchester County, out of the total population over 16 years of age (26,687), 59.5% or 15,879 individuals are in the labor force, with 5.5% or 873 of them unemployed. The age group with the highest labor force participation rate is 35 to 44 years, with 84.1% or 2,942 individuals in the labor force. Within the labor force, the 16 to 19 years age range has the highest percentage of unemployed individuals, with 15.1% or 110 of them being unemployed.
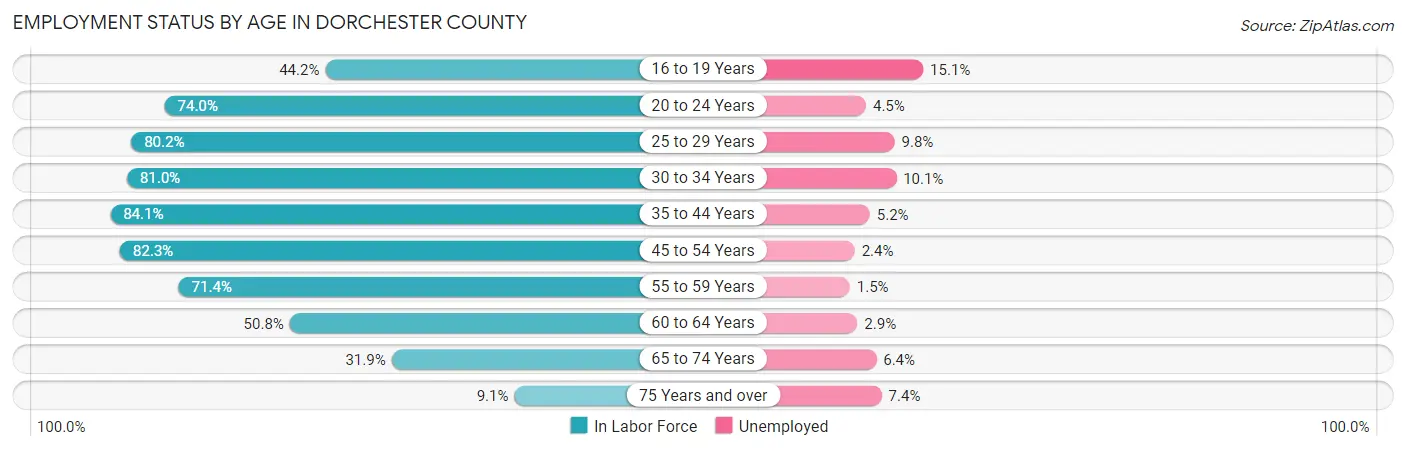
| Age Bracket | In Labor Force | Unemployed |
| 16 to 19 Years | 729 (44.2%) | 110 (15.1%) |
| 20 to 24 Years | 1,265 (74.0%) | 57 (4.5%) |
| 25 to 29 Years | 1,463 (80.2%) | 143 (9.8%) |
| 30 to 34 Years | 1,621 (81.0%) | 164 (10.1%) |
| 35 to 44 Years | 2,942 (84.1%) | 153 (5.2%) |
| 45 to 54 Years | 3,161 (82.3%) | 76 (2.4%) |
| 55 to 59 Years | 1,889 (71.4%) | 28 (1.5%) |
| 60 to 64 Years | 1,205 (50.8%) | 35 (2.9%) |
| 65 to 74 Years | 1,329 (31.9%) | 85 (6.4%) |
| 75 Years and over | 271 (9.1%) | 20 (7.4%) |
| Total | 15,879 (59.5%) | 873 (5.5%) |
Employment Status by Educational Attainment in Dorchester County
According to labor force statistics for Dorchester County, 75.9% of individuals (12,282) out of the total population between 25 and 64 years of age (16,182) are in the labor force, with 4.9% or 602 of them being unemployed. The group with the highest labor force participation rate are those with the educational attainment of bachelor's degree or higher, with 84.9% or 2,386 individuals in the labor force. Within the labor force, individuals with less than high school education have the highest percentage of unemployment, with 13.7% or 130 of them being unemployed.
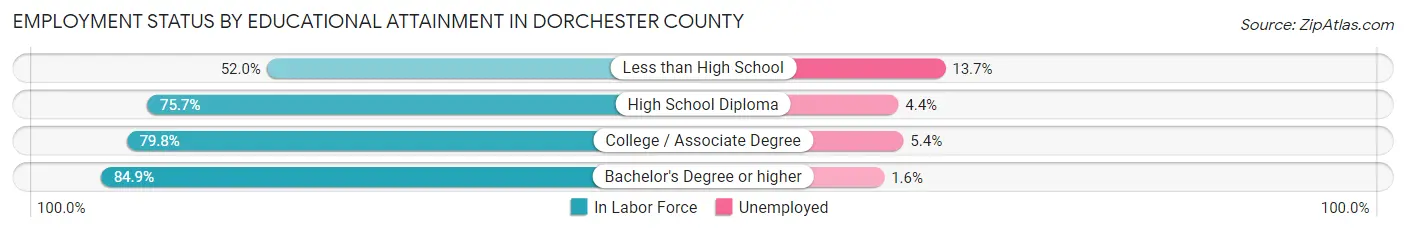
| Educational Attainment | In Labor Force | Unemployed |
| Less than High School | 951 (52.0%) | 250 (13.7%) |
| High School Diploma | 5,075 (75.7%) | 295 (4.4%) |
| College / Associate Degree | 3,862 (79.8%) | 261 (5.4%) |
| Bachelor's Degree or higher | 2,386 (84.9%) | 45 (1.6%) |
| Total | 12,282 (75.9%) | 793 (4.9%) |
Employment Occupations by Sex in Dorchester County
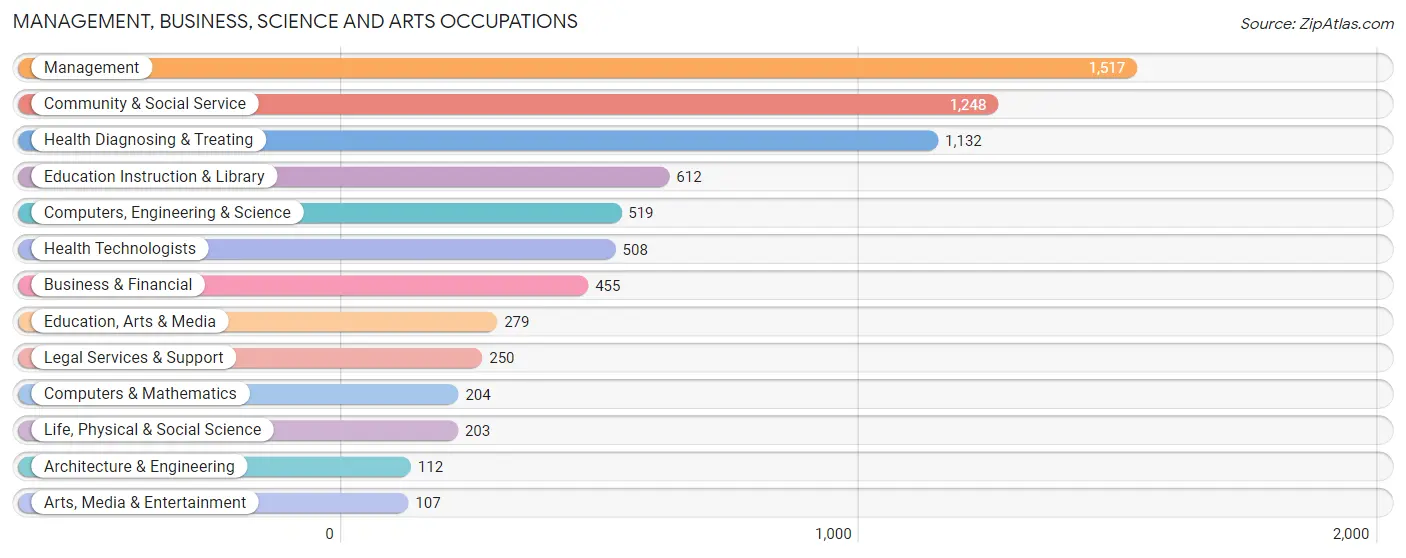
Management, Business, Science and Arts Occupations
The most common Management, Business, Science and Arts occupations in Dorchester County are Management (1,517 | 10.1%), Community & Social Service (1,248 | 8.3%), Health Diagnosing & Treating (1,132 | 7.5%), Education Instruction & Library (612 | 4.1%), and Computers, Engineering & Science (519 | 3.5%).
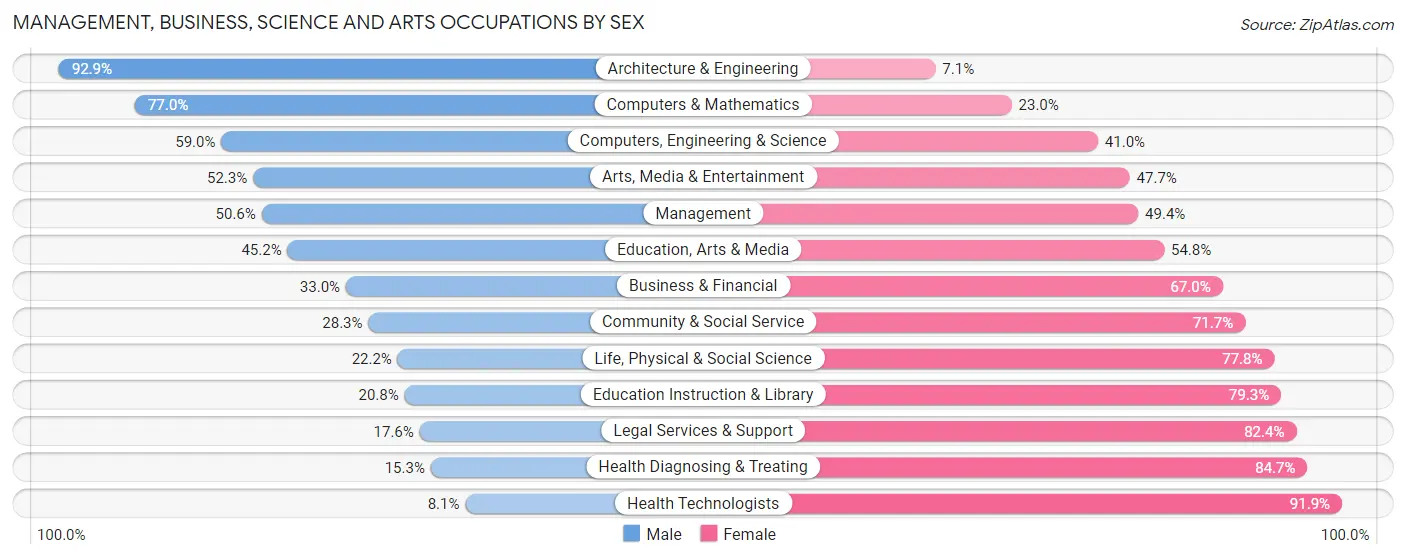
Management, Business, Science and Arts Occupations by Sex
Within the Management, Business, Science and Arts occupations in Dorchester County, the most male-oriented occupations are Architecture & Engineering (92.9%), Computers & Mathematics (77.0%), and Computers, Engineering & Science (59.0%), while the most female-oriented occupations are Health Technologists (91.9%), Health Diagnosing & Treating (84.7%), and Legal Services & Support (82.4%).
| Occupation | Male | Female |
| Management | 767 (50.6%) | 750 (49.4%) |
| Business & Financial | 150 (33.0%) | 305 (67.0%) |
| Computers, Engineering & Science | 306 (59.0%) | 213 (41.0%) |
| Computers & Mathematics | 157 (77.0%) | 47 (23.0%) |
| Architecture & Engineering | 104 (92.9%) | 8 (7.1%) |
| Life, Physical & Social Science | 45 (22.2%) | 158 (77.8%) |
| Community & Social Service | 353 (28.3%) | 895 (71.7%) |
| Education, Arts & Media | 126 (45.2%) | 153 (54.8%) |
| Legal Services & Support | 44 (17.6%) | 206 (82.4%) |
| Education Instruction & Library | 127 (20.7%) | 485 (79.2%) |
| Arts, Media & Entertainment | 56 (52.3%) | 51 (47.7%) |
| Health Diagnosing & Treating | 173 (15.3%) | 959 (84.7%) |
| Health Technologists | 41 (8.1%) | 467 (91.9%) |
| Total (Category) | 1,749 (35.9%) | 3,122 (64.1%) |
| Total (Overall) | 7,272 (48.5%) | 7,729 (51.5%) |
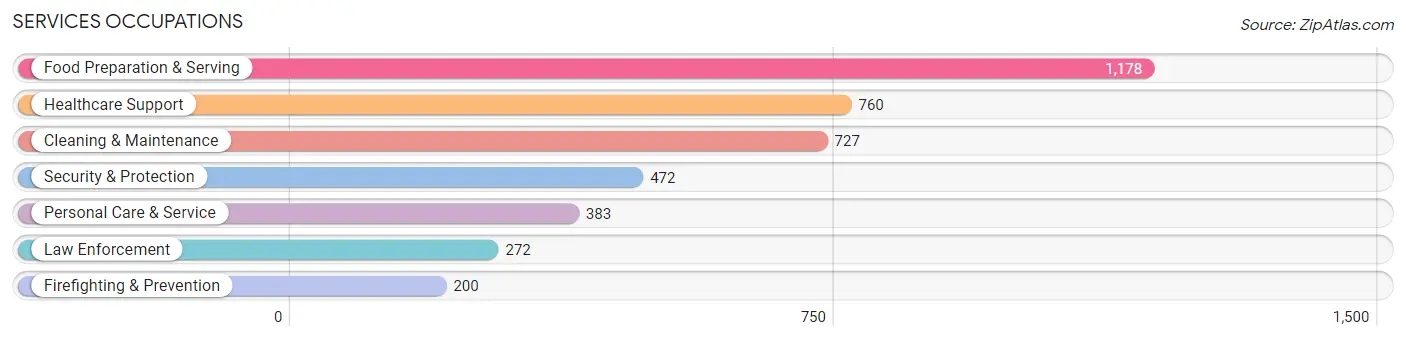
Services Occupations
The most common Services occupations in Dorchester County are Food Preparation & Serving (1,178 | 7.9%), Healthcare Support (760 | 5.1%), Cleaning & Maintenance (727 | 4.9%), Security & Protection (472 | 3.2%), and Personal Care & Service (383 | 2.5%).
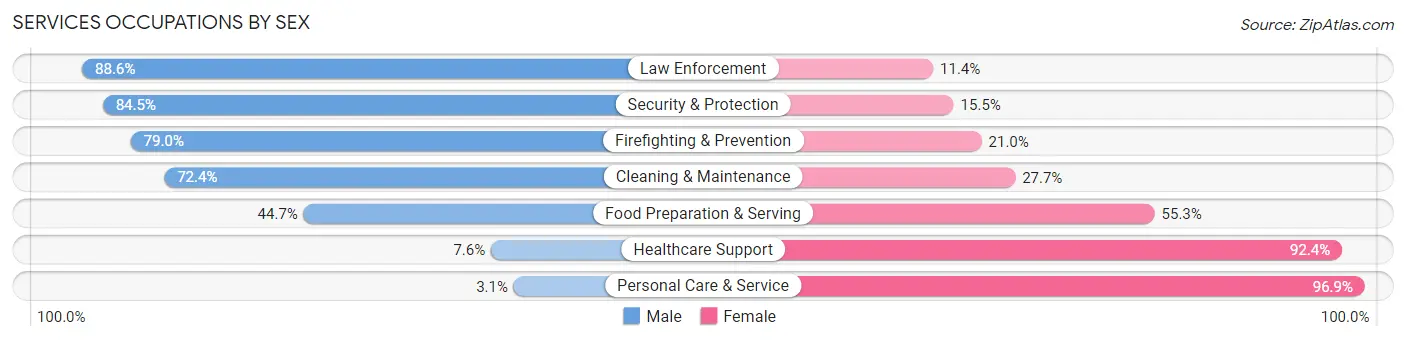
Services Occupations by Sex
Within the Services occupations in Dorchester County, the most male-oriented occupations are Law Enforcement (88.6%), Security & Protection (84.5%), and Firefighting & Prevention (79.0%), while the most female-oriented occupations are Personal Care & Service (96.9%), Healthcare Support (92.4%), and Food Preparation & Serving (55.3%).
| Occupation | Male | Female |
| Healthcare Support | 58 (7.6%) | 702 (92.4%) |
| Security & Protection | 399 (84.5%) | 73 (15.5%) |
| Firefighting & Prevention | 158 (79.0%) | 42 (21.0%) |
| Law Enforcement | 241 (88.6%) | 31 (11.4%) |
| Food Preparation & Serving | 527 (44.7%) | 651 (55.3%) |
| Cleaning & Maintenance | 526 (72.4%) | 201 (27.7%) |
| Personal Care & Service | 12 (3.1%) | 371 (96.9%) |
| Total (Category) | 1,522 (43.2%) | 1,998 (56.8%) |
| Total (Overall) | 7,272 (48.5%) | 7,729 (51.5%) |
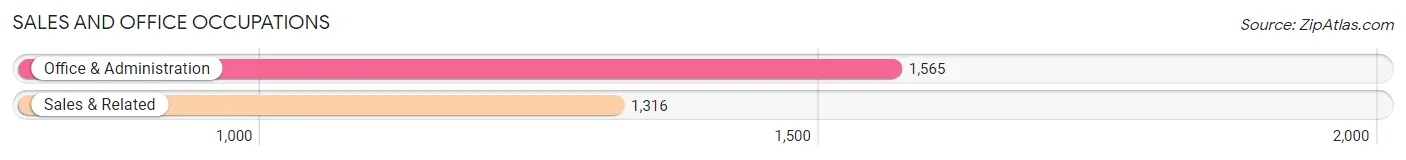
Sales and Office Occupations
The most common Sales and Office occupations in Dorchester County are Office & Administration (1,565 | 10.4%), and Sales & Related (1,316 | 8.8%).
Sales and Office Occupations by Sex
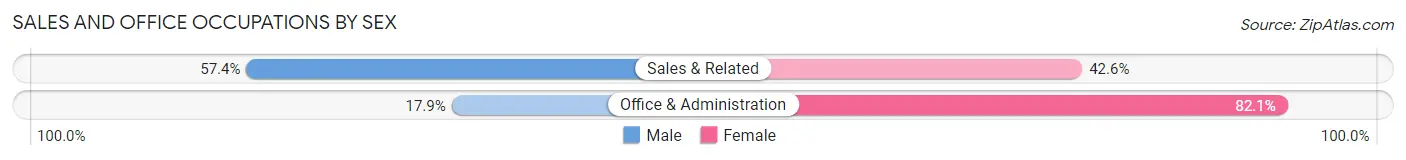
| Occupation | Male | Female |
| Sales & Related | 755 (57.4%) | 561 (42.6%) |
| Office & Administration | 280 (17.9%) | 1,285 (82.1%) |
| Total (Category) | 1,035 (35.9%) | 1,846 (64.1%) |
| Total (Overall) | 7,272 (48.5%) | 7,729 (51.5%) |
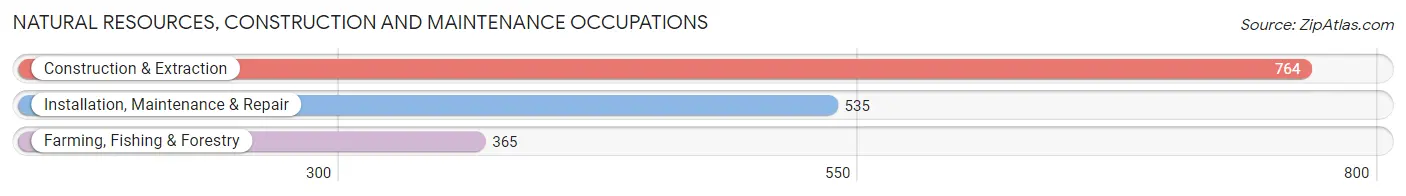
Natural Resources, Construction and Maintenance Occupations
The most common Natural Resources, Construction and Maintenance occupations in Dorchester County are Construction & Extraction (764 | 5.1%), Installation, Maintenance & Repair (535 | 3.6%), and Farming, Fishing & Forestry (365 | 2.4%).
Natural Resources, Construction and Maintenance Occupations by Sex
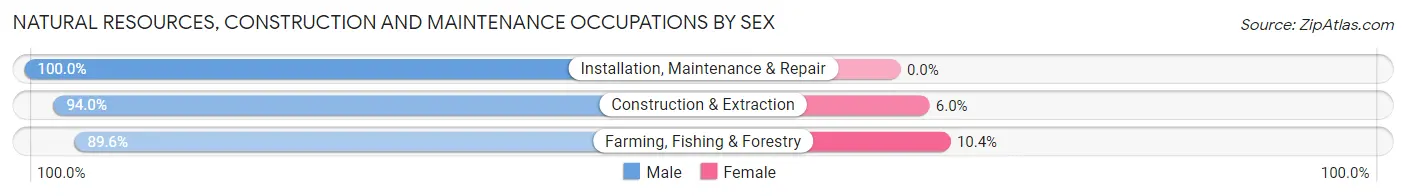
| Occupation | Male | Female |
| Farming, Fishing & Forestry | 327 (89.6%) | 38 (10.4%) |
| Construction & Extraction | 718 (94.0%) | 46 (6.0%) |
| Installation, Maintenance & Repair | 535 (100.0%) | 0 (0.0%) |
| Total (Category) | 1,580 (95.0%) | 84 (5.1%) |
| Total (Overall) | 7,272 (48.5%) | 7,729 (51.5%) |
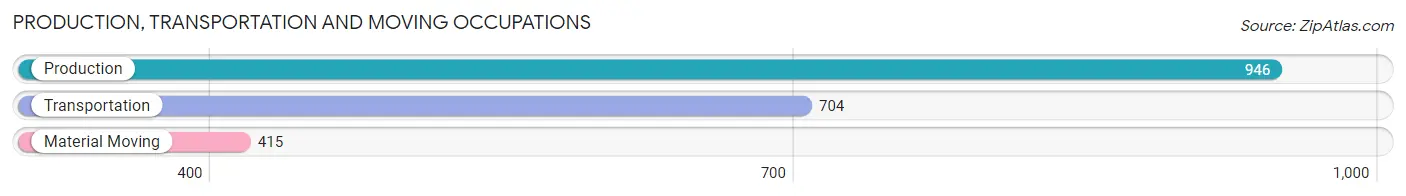
Production, Transportation and Moving Occupations
The most common Production, Transportation and Moving occupations in Dorchester County are Production (946 | 6.3%), Transportation (704 | 4.7%), and Material Moving (415 | 2.8%).
Production, Transportation and Moving Occupations by Sex
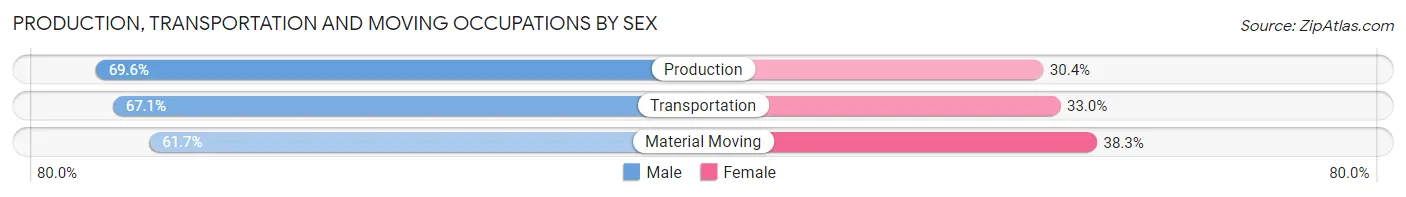
| Occupation | Male | Female |
| Production | 658 (69.6%) | 288 (30.4%) |
| Transportation | 472 (67.0%) | 232 (33.0%) |
| Material Moving | 256 (61.7%) | 159 (38.3%) |
| Total (Category) | 1,386 (67.1%) | 679 (32.9%) |
| Total (Overall) | 7,272 (48.5%) | 7,729 (51.5%) |
Employment Industries by Sex in Dorchester County
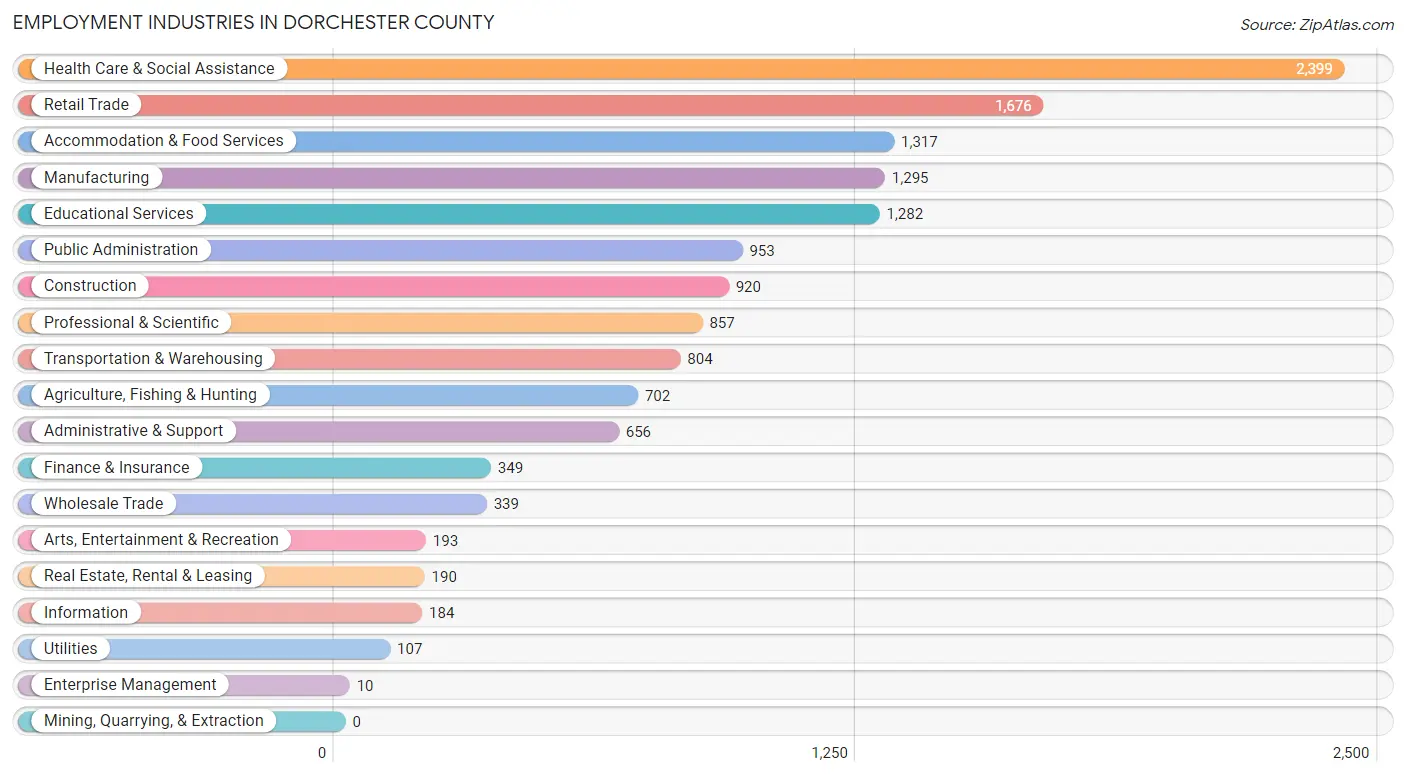
Employment Industries in Dorchester County
The major employment industries in Dorchester County include Health Care & Social Assistance (2,399 | 16.0%), Retail Trade (1,676 | 11.2%), Accommodation & Food Services (1,317 | 8.8%), Manufacturing (1,295 | 8.6%), and Educational Services (1,282 | 8.6%).
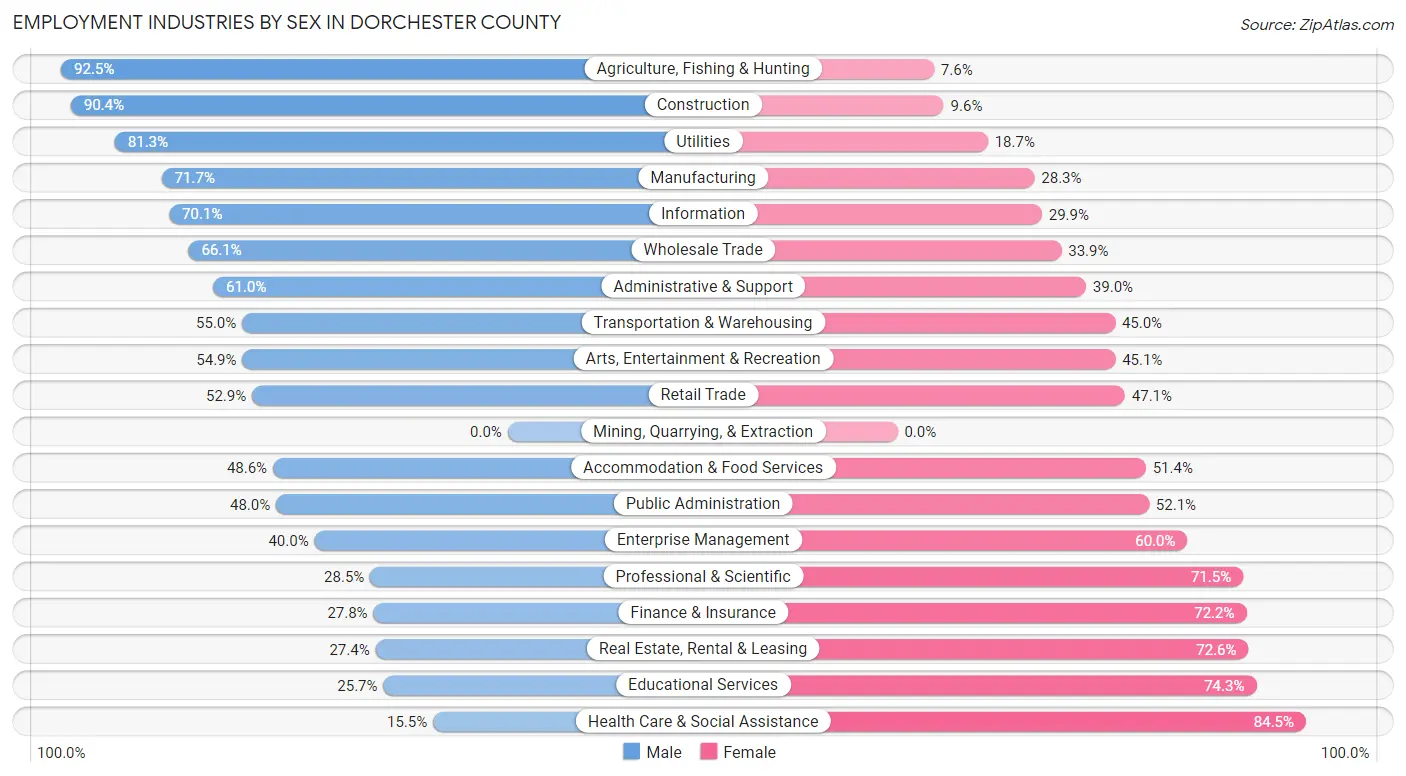
Employment Industries by Sex in Dorchester County
The Dorchester County industries that see more men than women are Agriculture, Fishing & Hunting (92.4%), Construction (90.4%), and Utilities (81.3%), whereas the industries that tend to have a higher number of women are Health Care & Social Assistance (84.5%), Educational Services (74.3%), and Real Estate, Rental & Leasing (72.6%).
| Industry | Male | Female |
| Agriculture, Fishing & Hunting | 649 (92.4%) | 53 (7.5%) |
| Mining, Quarrying, & Extraction | 0 (0.0%) | 0 (0.0%) |
| Construction | 832 (90.4%) | 88 (9.6%) |
| Manufacturing | 928 (71.7%) | 367 (28.3%) |
| Wholesale Trade | 224 (66.1%) | 115 (33.9%) |
| Retail Trade | 887 (52.9%) | 789 (47.1%) |
| Transportation & Warehousing | 442 (55.0%) | 362 (45.0%) |
| Utilities | 87 (81.3%) | 20 (18.7%) |
| Information | 129 (70.1%) | 55 (29.9%) |
| Finance & Insurance | 97 (27.8%) | 252 (72.2%) |
| Real Estate, Rental & Leasing | 52 (27.4%) | 138 (72.6%) |
| Professional & Scientific | 244 (28.5%) | 613 (71.5%) |
| Enterprise Management | 4 (40.0%) | 6 (60.0%) |
| Administrative & Support | 400 (61.0%) | 256 (39.0%) |
| Educational Services | 330 (25.7%) | 952 (74.3%) |
| Health Care & Social Assistance | 371 (15.5%) | 2,028 (84.5%) |
| Arts, Entertainment & Recreation | 106 (54.9%) | 87 (45.1%) |
| Accommodation & Food Services | 640 (48.6%) | 677 (51.4%) |
| Public Administration | 457 (47.9%) | 496 (52.0%) |
| Total | 7,272 (48.5%) | 7,729 (51.5%) |
Education in Dorchester County
School Enrollment in Dorchester County
The most common levels of schooling among the 7,006 students in Dorchester County are high school (1,799 | 25.7%), elementary school (1,512 | 21.6%), and middle school (1,507 | 21.5%).
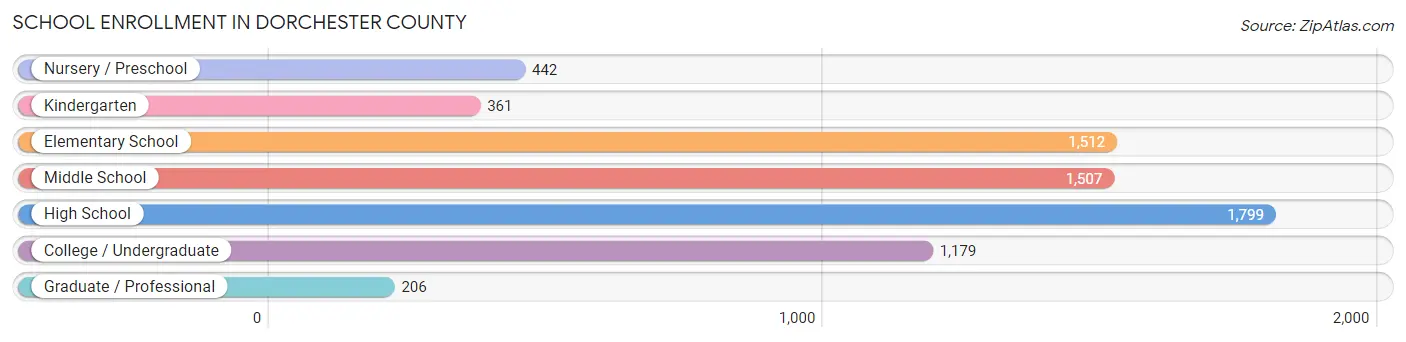
| School Level | # Students | % Students |
| Nursery / Preschool | 442 | 6.3% |
| Kindergarten | 361 | 5.1% |
| Elementary School | 1,512 | 21.6% |
| Middle School | 1,507 | 21.5% |
| High School | 1,799 | 25.7% |
| College / Undergraduate | 1,179 | 16.8% |
| Graduate / Professional | 206 | 2.9% |
| Total | 7,006 | 100.0% |
School Enrollment by Age by Funding Source in Dorchester County
Out of a total of 7,006 students who are enrolled in schools in Dorchester County, 792 (11.3%) attend a private institution, while the remaining 6,214 (88.7%) are enrolled in public schools. The age group of 25 to 34 year olds has the highest likelihood of being enrolled in private schools, with 134 (24.5% in the age bracket) enrolled. Conversely, the age group of 18 to 19 year olds has the lowest likelihood of being enrolled in a private school, with 374 (96.9% in the age bracket) attending a public institution.
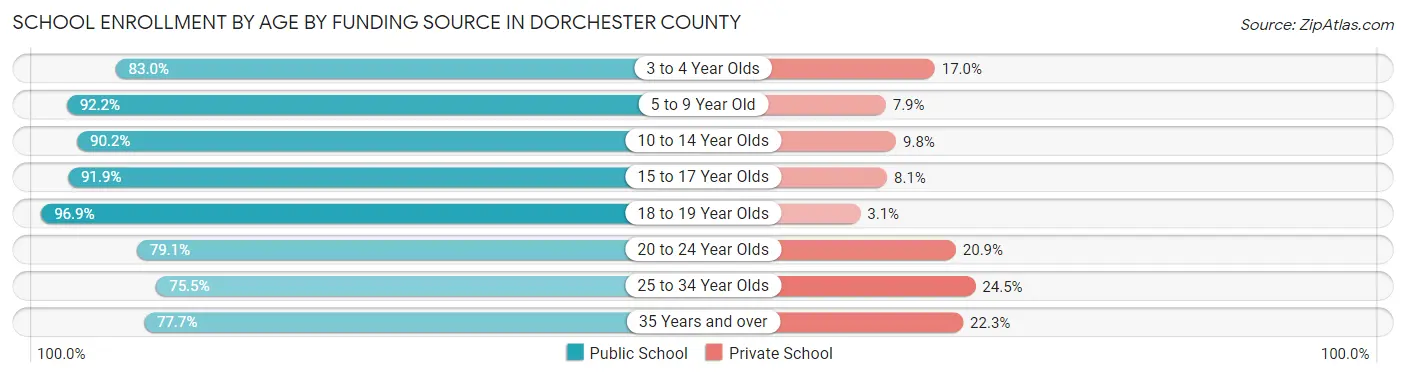
| Age Bracket | Public School | Private School |
| 3 to 4 Year Olds | 318 (83.0%) | 65 (17.0%) |
| 5 to 9 Year Old | 1,643 (92.1%) | 140 (7.9%) |
| 10 to 14 Year Olds | 1,662 (90.2%) | 180 (9.8%) |
| 15 to 17 Year Olds | 1,261 (91.9%) | 111 (8.1%) |
| 18 to 19 Year Olds | 374 (96.9%) | 12 (3.1%) |
| 20 to 24 Year Olds | 318 (79.1%) | 84 (20.9%) |
| 25 to 34 Year Olds | 412 (75.5%) | 134 (24.5%) |
| 35 Years and over | 227 (77.7%) | 65 (22.3%) |
| Total | 6,214 (88.7%) | 792 (11.3%) |
Educational Attainment by Field of Study in Dorchester County
Education (901 | 19.2%), business (808 | 17.2%), science & technology (532 | 11.3%), bio, nature & agricultural (438 | 9.3%), and social sciences (299 | 6.4%) are the most common fields of study among 4,692 individuals in Dorchester County who have obtained a bachelor's degree or higher.
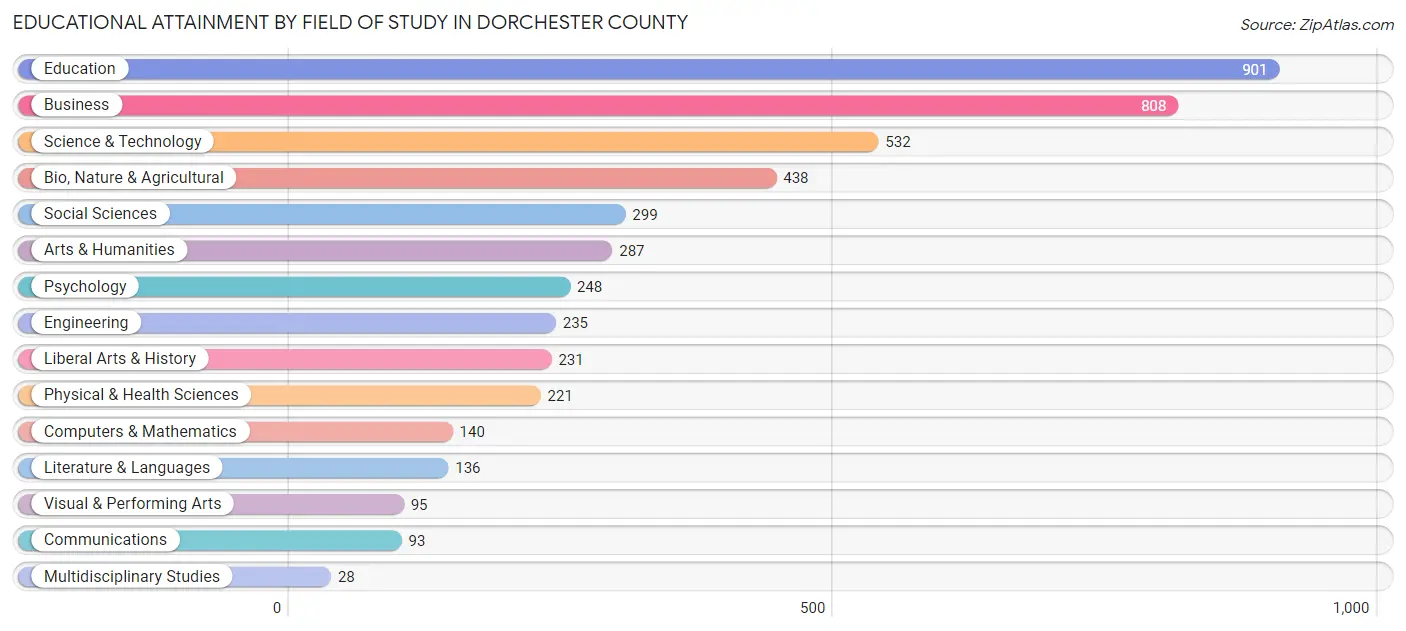
| Field of Study | # Graduates | % Graduates |
| Computers & Mathematics | 140 | 3.0% |
| Bio, Nature & Agricultural | 438 | 9.3% |
| Physical & Health Sciences | 221 | 4.7% |
| Psychology | 248 | 5.3% |
| Social Sciences | 299 | 6.4% |
| Engineering | 235 | 5.0% |
| Multidisciplinary Studies | 28 | 0.6% |
| Science & Technology | 532 | 11.3% |
| Business | 808 | 17.2% |
| Education | 901 | 19.2% |
| Literature & Languages | 136 | 2.9% |
| Liberal Arts & History | 231 | 4.9% |
| Visual & Performing Arts | 95 | 2.0% |
| Communications | 93 | 2.0% |
| Arts & Humanities | 287 | 6.1% |
| Total | 4,692 | 100.0% |
Transportation & Commute in Dorchester County
Vehicle Availability by Sex in Dorchester County
The most prevalent vehicle ownership categories in Dorchester County are males with 2 vehicles (2,665, accounting for 37.3%) and females with 2 vehicles (2,927, making up 35.5%).
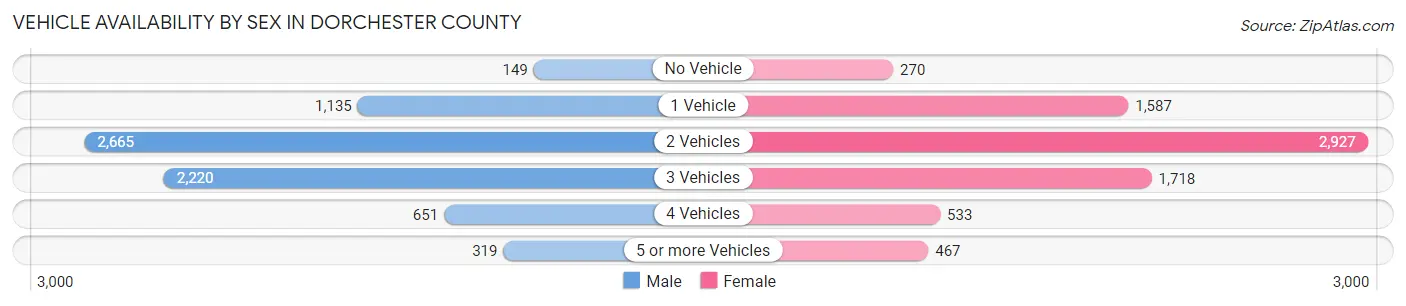
| Vehicles Available | Male | Female |
| No Vehicle | 149 (2.1%) | 270 (3.6%) |
| 1 Vehicle | 1,135 (15.9%) | 1,587 (21.1%) |
| 2 Vehicles | 2,665 (37.3%) | 2,927 (39.0%) |
| 3 Vehicles | 2,220 (31.1%) | 1,718 (22.9%) |
| 4 Vehicles | 651 (9.1%) | 533 (7.1%) |
| 5 or more Vehicles | 319 (4.5%) | 467 (6.2%) |
| Total | 7,139 (100.0%) | 7,502 (100.0%) |
Commute Time in Dorchester County
The most frequently occuring commute durations in Dorchester County are 10 to 14 minutes (2,213 commuters, 16.2%), 5 to 9 minutes (2,047 commuters, 15.0%), and 30 to 34 minutes (1,747 commuters, 12.8%).
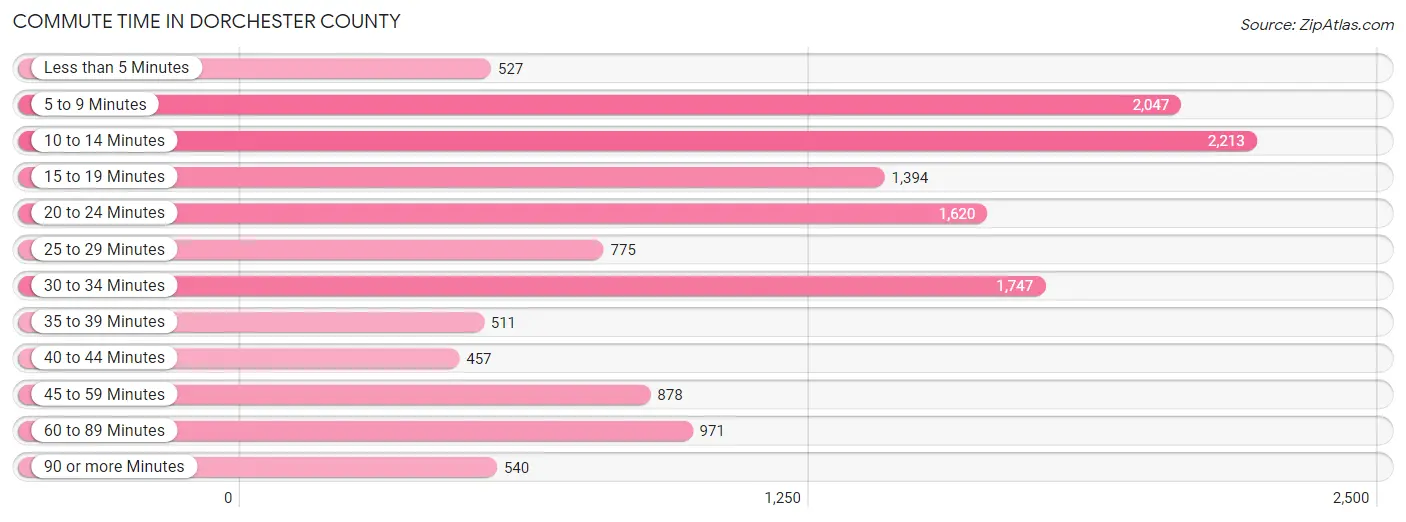
| Commute Time | # Commuters | % Commuters |
| Less than 5 Minutes | 527 | 3.8% |
| 5 to 9 Minutes | 2,047 | 15.0% |
| 10 to 14 Minutes | 2,213 | 16.2% |
| 15 to 19 Minutes | 1,394 | 10.2% |
| 20 to 24 Minutes | 1,620 | 11.8% |
| 25 to 29 Minutes | 775 | 5.7% |
| 30 to 34 Minutes | 1,747 | 12.8% |
| 35 to 39 Minutes | 511 | 3.7% |
| 40 to 44 Minutes | 457 | 3.3% |
| 45 to 59 Minutes | 878 | 6.4% |
| 60 to 89 Minutes | 971 | 7.1% |
| 90 or more Minutes | 540 | 4.0% |
Commute Time by Sex in Dorchester County
The most common commute times in Dorchester County are 10 to 14 minutes (1,123 commuters, 16.7%) for males and 10 to 14 minutes (1,090 commuters, 15.7%) for females.
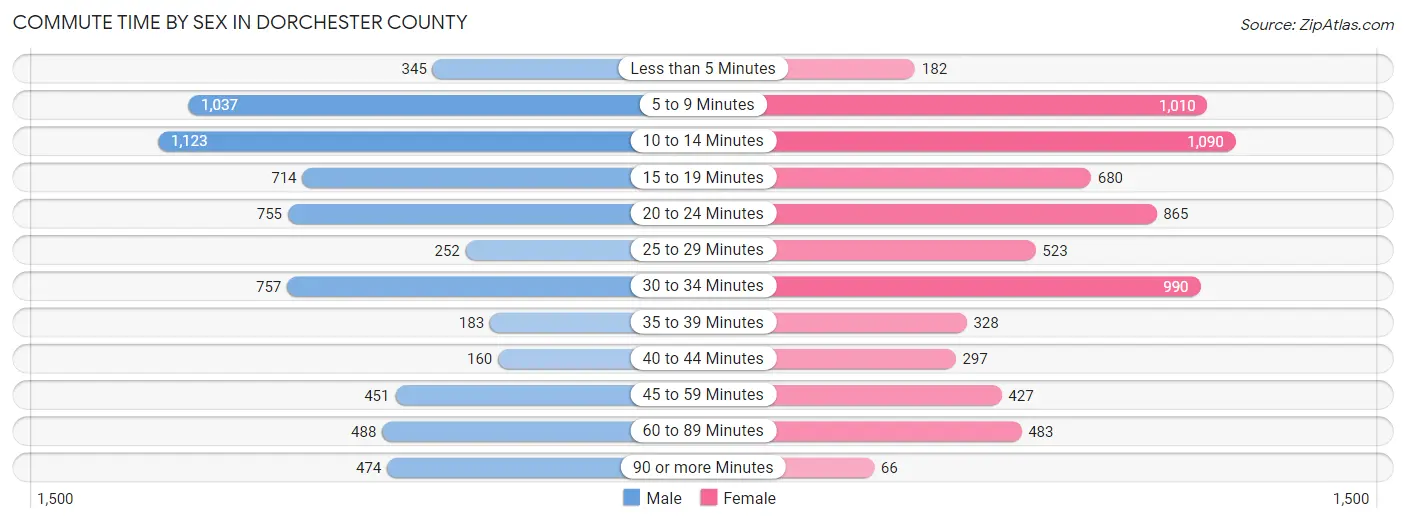
| Commute Time | Male | Female |
| Less than 5 Minutes | 345 (5.1%) | 182 (2.6%) |
| 5 to 9 Minutes | 1,037 (15.4%) | 1,010 (14.5%) |
| 10 to 14 Minutes | 1,123 (16.7%) | 1,090 (15.7%) |
| 15 to 19 Minutes | 714 (10.6%) | 680 (9.8%) |
| 20 to 24 Minutes | 755 (11.2%) | 865 (12.5%) |
| 25 to 29 Minutes | 252 (3.7%) | 523 (7.5%) |
| 30 to 34 Minutes | 757 (11.2%) | 990 (14.3%) |
| 35 to 39 Minutes | 183 (2.7%) | 328 (4.7%) |
| 40 to 44 Minutes | 160 (2.4%) | 297 (4.3%) |
| 45 to 59 Minutes | 451 (6.7%) | 427 (6.1%) |
| 60 to 89 Minutes | 488 (7.2%) | 483 (7.0%) |
| 90 or more Minutes | 474 (7.0%) | 66 (0.9%) |
Time of Departure to Work by Sex in Dorchester County
The most frequent times of departure to work in Dorchester County are 7:00 AM to 7:29 AM (1,101, 16.3%) for males and 7:30 AM to 7:59 AM (1,293, 18.6%) for females.
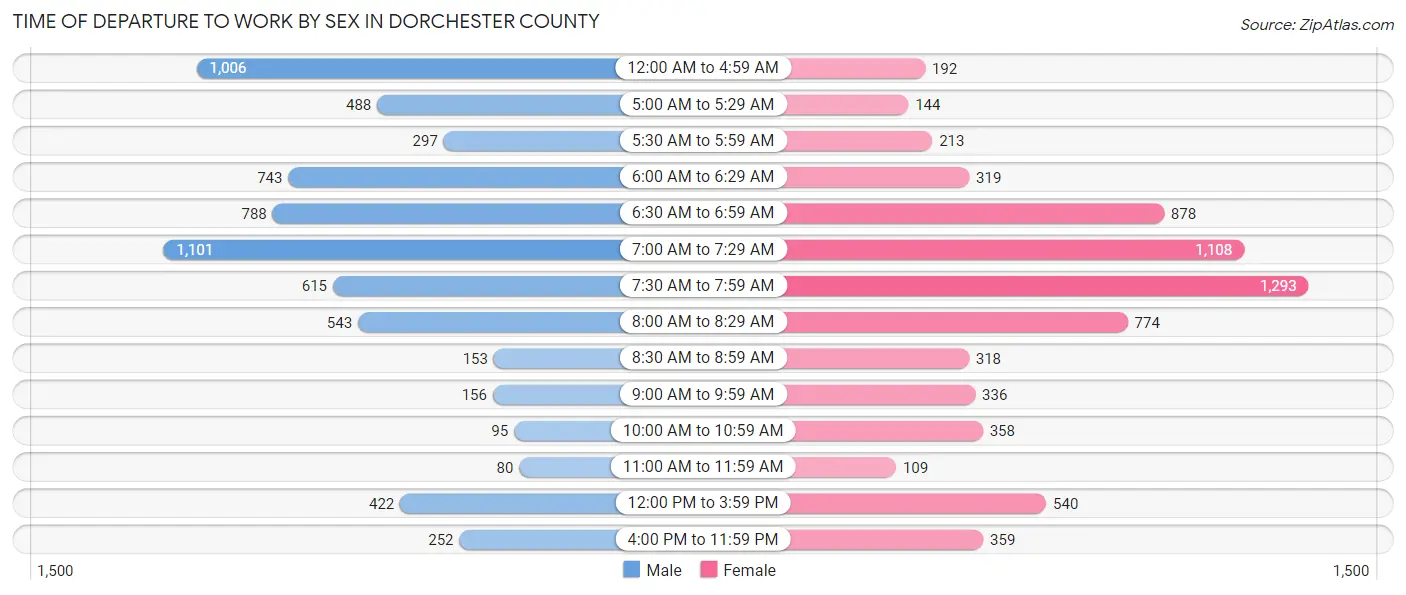
| Time of Departure | Male | Female |
| 12:00 AM to 4:59 AM | 1,006 (14.9%) | 192 (2.8%) |
| 5:00 AM to 5:29 AM | 488 (7.2%) | 144 (2.1%) |
| 5:30 AM to 5:59 AM | 297 (4.4%) | 213 (3.1%) |
| 6:00 AM to 6:29 AM | 743 (11.0%) | 319 (4.6%) |
| 6:30 AM to 6:59 AM | 788 (11.7%) | 878 (12.7%) |
| 7:00 AM to 7:29 AM | 1,101 (16.3%) | 1,108 (16.0%) |
| 7:30 AM to 7:59 AM | 615 (9.1%) | 1,293 (18.6%) |
| 8:00 AM to 8:29 AM | 543 (8.1%) | 774 (11.2%) |
| 8:30 AM to 8:59 AM | 153 (2.3%) | 318 (4.6%) |
| 9:00 AM to 9:59 AM | 156 (2.3%) | 336 (4.8%) |
| 10:00 AM to 10:59 AM | 95 (1.4%) | 358 (5.2%) |
| 11:00 AM to 11:59 AM | 80 (1.2%) | 109 (1.6%) |
| 12:00 PM to 3:59 PM | 422 (6.3%) | 540 (7.8%) |
| 4:00 PM to 11:59 PM | 252 (3.7%) | 359 (5.2%) |
| Total | 6,739 (100.0%) | 6,941 (100.0%) |
Housing Occupancy in Dorchester County
Occupancy by Ownership in Dorchester County
Of the total 13,216 dwellings in Dorchester County, owner-occupied units account for 9,046 (68.4%), while renter-occupied units make up 4,170 (31.6%).
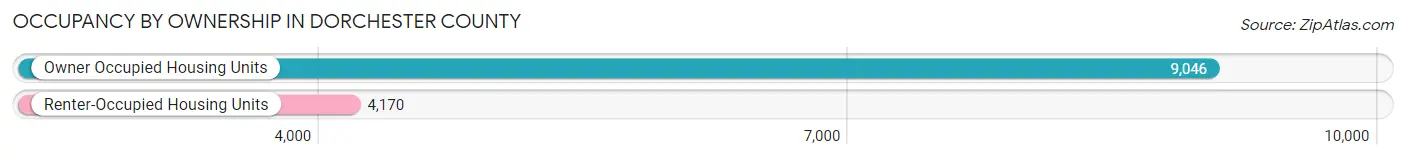
| Occupancy | # Housing Units | % Housing Units |
| Owner Occupied Housing Units | 9,046 | 68.4% |
| Renter-Occupied Housing Units | 4,170 | 31.6% |
| Total Occupied Housing Units | 13,216 | 100.0% |
Occupancy by Household Size in Dorchester County
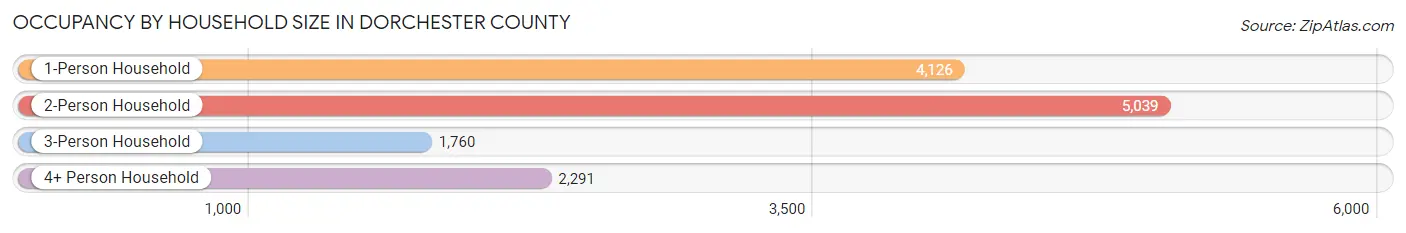
| Household Size | # Housing Units | % Housing Units |
| 1-Person Household | 4,126 | 31.2% |
| 2-Person Household | 5,039 | 38.1% |
| 3-Person Household | 1,760 | 13.3% |
| 4+ Person Household | 2,291 | 17.3% |
| Total Housing Units | 13,216 | 100.0% |
Occupancy by Ownership by Household Size in Dorchester County
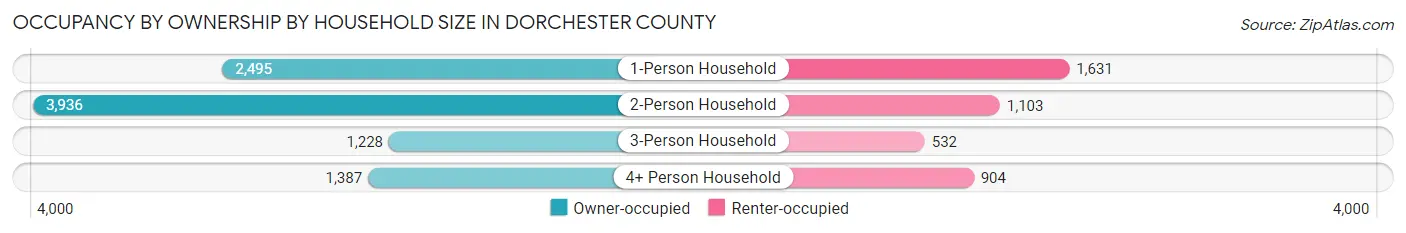
| Household Size | Owner-occupied | Renter-occupied |
| 1-Person Household | 2,495 (60.5%) | 1,631 (39.5%) |
| 2-Person Household | 3,936 (78.1%) | 1,103 (21.9%) |
| 3-Person Household | 1,228 (69.8%) | 532 (30.2%) |
| 4+ Person Household | 1,387 (60.5%) | 904 (39.5%) |
| Total Housing Units | 9,046 (68.4%) | 4,170 (31.6%) |
Occupancy by Educational Attainment in Dorchester County
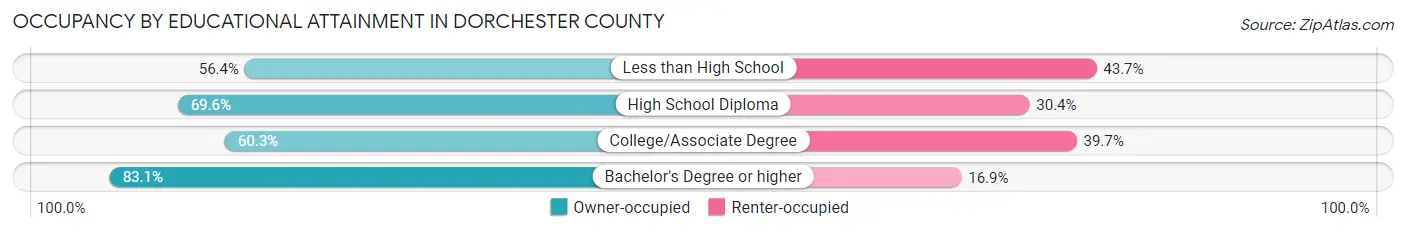
| Household Size | Owner-occupied | Renter-occupied |
| Less than High School | 777 (56.4%) | 602 (43.6%) |
| High School Diploma | 3,527 (69.6%) | 1,538 (30.4%) |
| College/Associate Degree | 2,339 (60.3%) | 1,542 (39.7%) |
| Bachelor's Degree or higher | 2,403 (83.1%) | 488 (16.9%) |
Occupancy by Age of Householder in Dorchester County
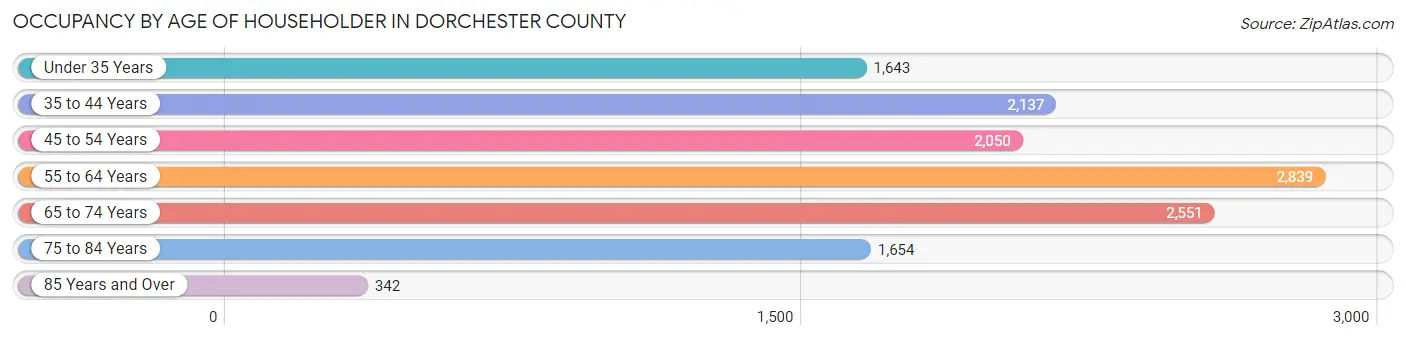
| Age Bracket | # Households | % Households |
| Under 35 Years | 1,643 | 12.4% |
| 35 to 44 Years | 2,137 | 16.2% |
| 45 to 54 Years | 2,050 | 15.5% |
| 55 to 64 Years | 2,839 | 21.5% |
| 65 to 74 Years | 2,551 | 19.3% |
| 75 to 84 Years | 1,654 | 12.5% |
| 85 Years and Over | 342 | 2.6% |
| Total | 13,216 | 100.0% |
Housing Finances in Dorchester County
Median Income by Occupancy in Dorchester County
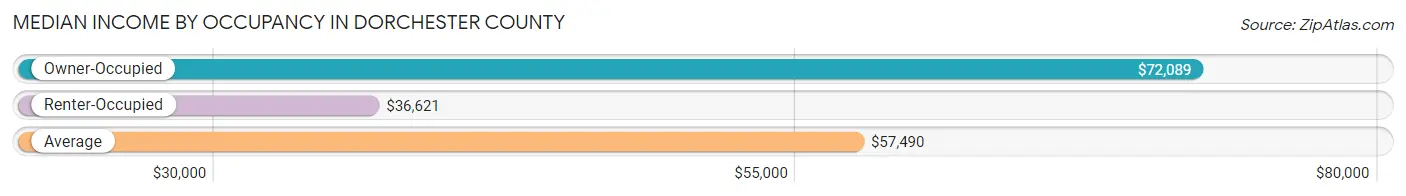
| Occupancy Type | # Households | Median Income |
| Owner-Occupied | 9,046 (68.4%) | $72,089 |
| Renter-Occupied | 4,170 (31.6%) | $36,621 |
| Average | 13,216 (100.0%) | $57,490 |
Occupancy by Householder Income Bracket in Dorchester County
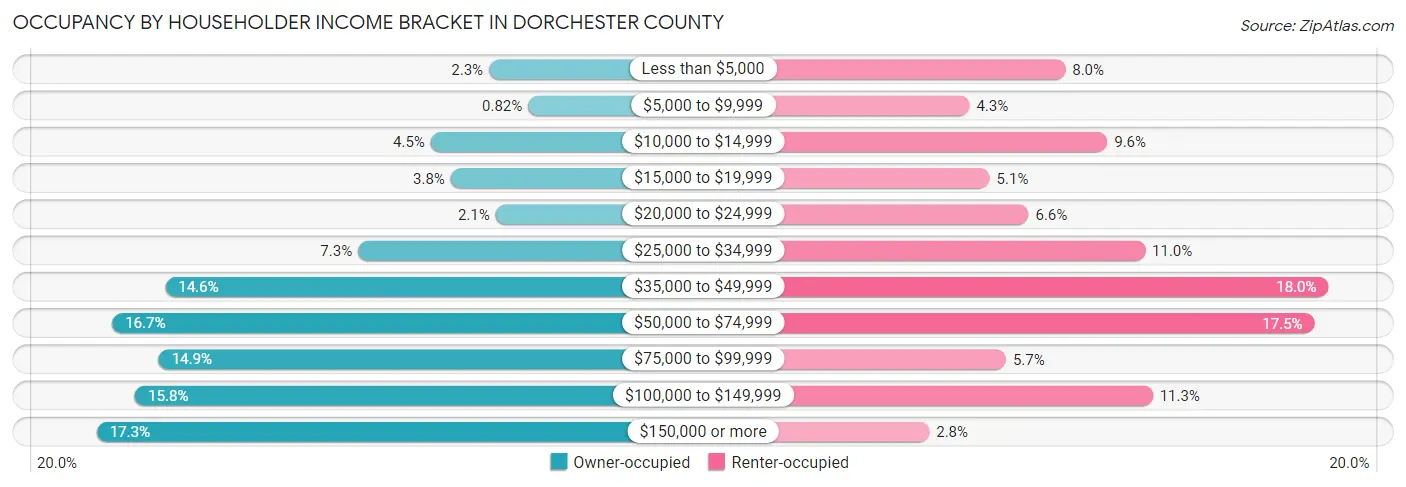
| Income Bracket | Owner-occupied | Renter-occupied |
| Less than $5,000 | 209 (2.3%) | 333 (8.0%) |
| $5,000 to $9,999 | 74 (0.8%) | 181 (4.3%) |
| $10,000 to $14,999 | 410 (4.5%) | 400 (9.6%) |
| $15,000 to $19,999 | 341 (3.8%) | 213 (5.1%) |
| $20,000 to $24,999 | 186 (2.1%) | 275 (6.6%) |
| $25,000 to $34,999 | 660 (7.3%) | 460 (11.0%) |
| $35,000 to $49,999 | 1,324 (14.6%) | 751 (18.0%) |
| $50,000 to $74,999 | 1,507 (16.7%) | 729 (17.5%) |
| $75,000 to $99,999 | 1,347 (14.9%) | 239 (5.7%) |
| $100,000 to $149,999 | 1,428 (15.8%) | 472 (11.3%) |
| $150,000 or more | 1,560 (17.2%) | 117 (2.8%) |
| Total | 9,046 (100.0%) | 4,170 (100.0%) |
Monthly Housing Cost Tiers in Dorchester County
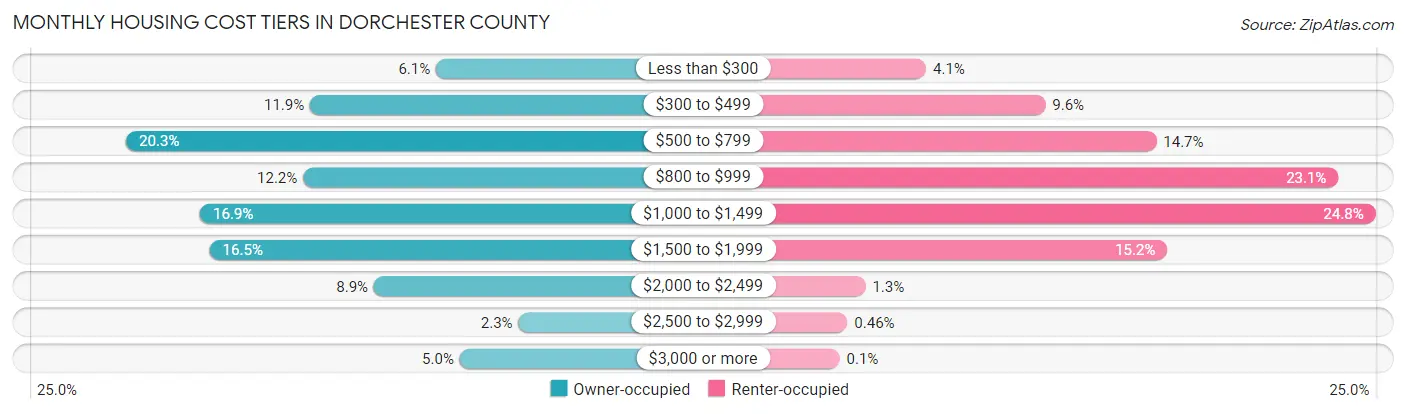
| Monthly Cost | Owner-occupied | Renter-occupied |
| Less than $300 | 548 (6.1%) | 170 (4.1%) |
| $300 to $499 | 1,073 (11.9%) | 399 (9.6%) |
| $500 to $799 | 1,839 (20.3%) | 612 (14.7%) |
| $800 to $999 | 1,102 (12.2%) | 961 (23.1%) |
| $1,000 to $1,499 | 1,531 (16.9%) | 1,033 (24.8%) |
| $1,500 to $1,999 | 1,491 (16.5%) | 633 (15.2%) |
| $2,000 to $2,499 | 807 (8.9%) | 54 (1.3%) |
| $2,500 to $2,999 | 205 (2.3%) | 19 (0.5%) |
| $3,000 or more | 450 (5.0%) | 4 (0.1%) |
| Total | 9,046 (100.0%) | 4,170 (100.0%) |
Physical Housing Characteristics in Dorchester County
Housing Structures in Dorchester County
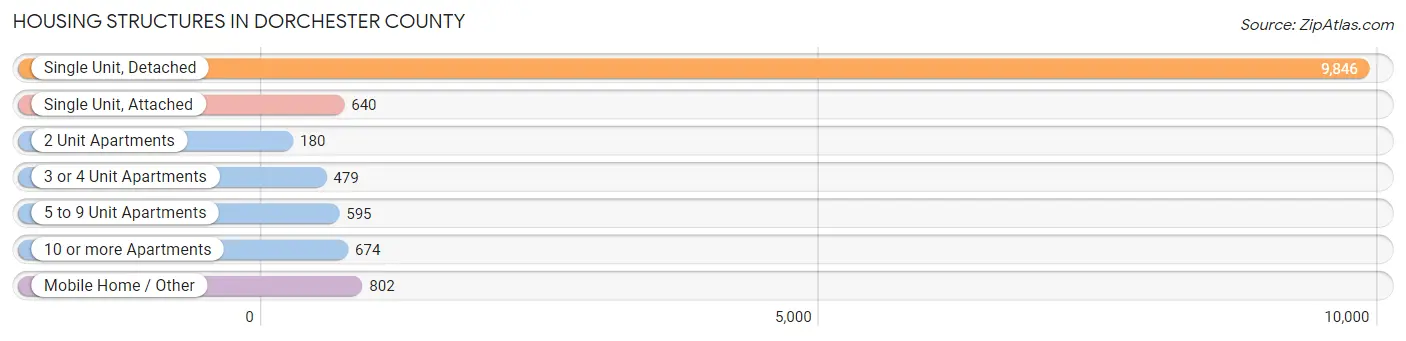
| Structure Type | # Housing Units | % Housing Units |
| Single Unit, Detached | 9,846 | 74.5% |
| Single Unit, Attached | 640 | 4.8% |
| 2 Unit Apartments | 180 | 1.4% |
| 3 or 4 Unit Apartments | 479 | 3.6% |
| 5 to 9 Unit Apartments | 595 | 4.5% |
| 10 or more Apartments | 674 | 5.1% |
| Mobile Home / Other | 802 | 6.1% |
| Total | 13,216 | 100.0% |
Housing Structures by Occupancy in Dorchester County
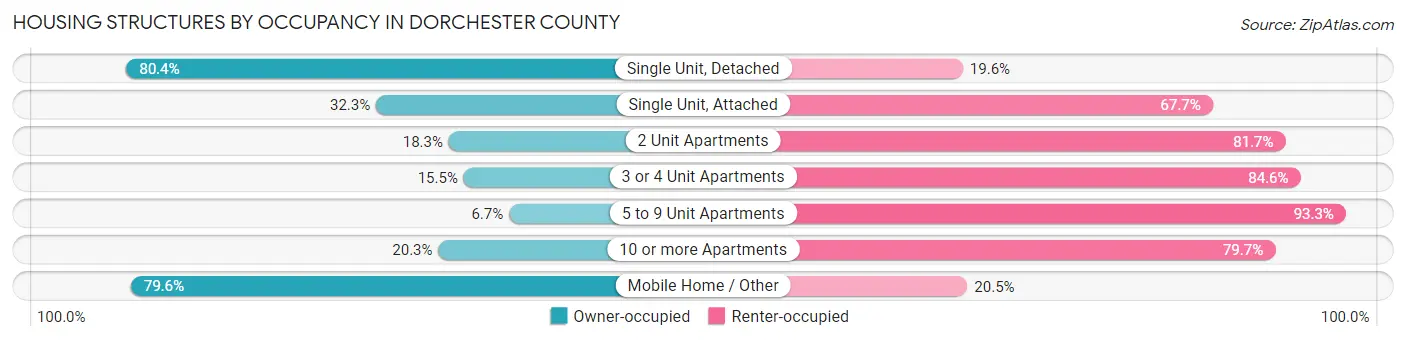
| Structure Type | Owner-occupied | Renter-occupied |
| Single Unit, Detached | 7,917 (80.4%) | 1,929 (19.6%) |
| Single Unit, Attached | 207 (32.3%) | 433 (67.7%) |
| 2 Unit Apartments | 33 (18.3%) | 147 (81.7%) |
| 3 or 4 Unit Apartments | 74 (15.4%) | 405 (84.6%) |
| 5 to 9 Unit Apartments | 40 (6.7%) | 555 (93.3%) |
| 10 or more Apartments | 137 (20.3%) | 537 (79.7%) |
| Mobile Home / Other | 638 (79.5%) | 164 (20.4%) |
| Total | 9,046 (68.4%) | 4,170 (31.6%) |
Housing Structures by Number of Rooms in Dorchester County
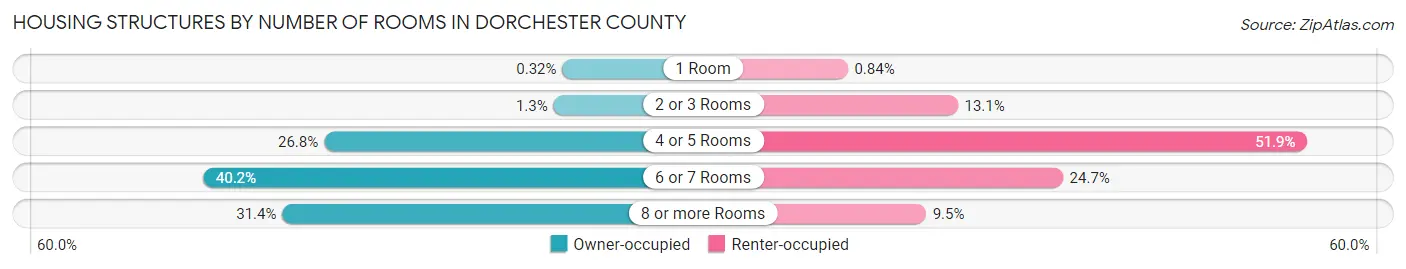
| Number of Rooms | Owner-occupied | Renter-occupied |
| 1 Room | 29 (0.3%) | 35 (0.8%) |
| 2 or 3 Rooms | 118 (1.3%) | 544 (13.1%) |
| 4 or 5 Rooms | 2,422 (26.8%) | 2,163 (51.9%) |
| 6 or 7 Rooms | 3,637 (40.2%) | 1,031 (24.7%) |
| 8 or more Rooms | 2,840 (31.4%) | 397 (9.5%) |
| Total | 9,046 (100.0%) | 4,170 (100.0%) |
Housing Structure by Heating Type in Dorchester County
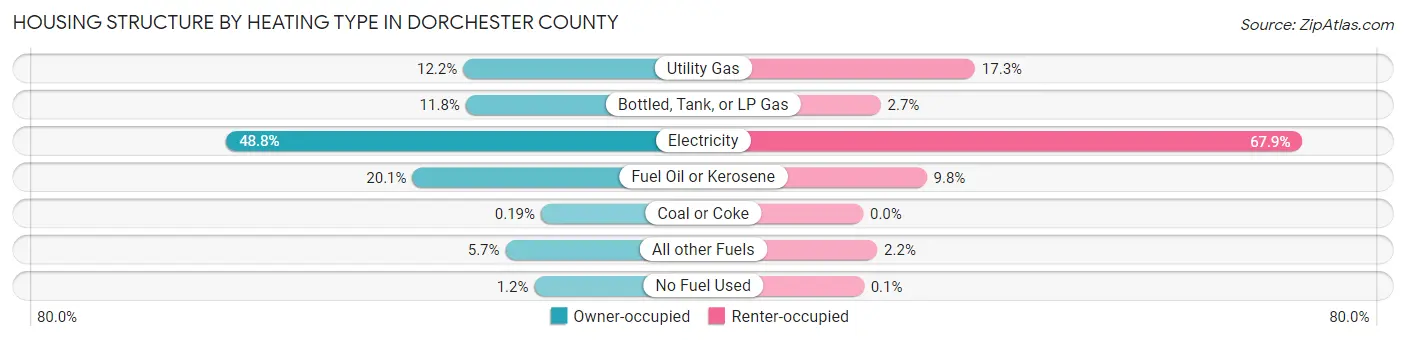
| Heating Type | Owner-occupied | Renter-occupied |
| Utility Gas | 1,105 (12.2%) | 721 (17.3%) |
| Bottled, Tank, or LP Gas | 1,069 (11.8%) | 113 (2.7%) |
| Electricity | 4,417 (48.8%) | 2,831 (67.9%) |
| Fuel Oil or Kerosene | 1,815 (20.1%) | 410 (9.8%) |
| Coal or Coke | 17 (0.2%) | 0 (0.0%) |
| All other Fuels | 514 (5.7%) | 91 (2.2%) |
| No Fuel Used | 109 (1.2%) | 4 (0.1%) |
| Total | 9,046 (100.0%) | 4,170 (100.0%) |
Household Vehicle Usage in Dorchester County
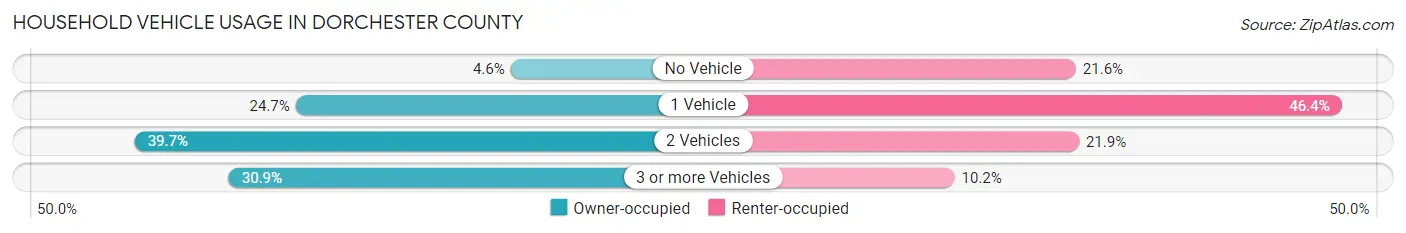
| Vehicles per Household | Owner-occupied | Renter-occupied |
| No Vehicle | 420 (4.6%) | 899 (21.6%) |
| 1 Vehicle | 2,235 (24.7%) | 1,933 (46.4%) |
| 2 Vehicles | 3,593 (39.7%) | 911 (21.8%) |
| 3 or more Vehicles | 2,798 (30.9%) | 427 (10.2%) |
| Total | 9,046 (100.0%) | 4,170 (100.0%) |
Real Estate & Mortgages in Dorchester County
Real Estate and Mortgage Overview in Dorchester County
| Characteristic | Without Mortgage | With Mortgage |
| Housing Units | 4,113 | 4,933 |
| Median Property Value | $192,700 | $239,600 |
| Median Household Income | $52,226 | $1,118 |
| Monthly Housing Costs | $577 | $433 |
| Real Estate Taxes | $1,997 | $153 |
Property Value by Mortgage Status in Dorchester County
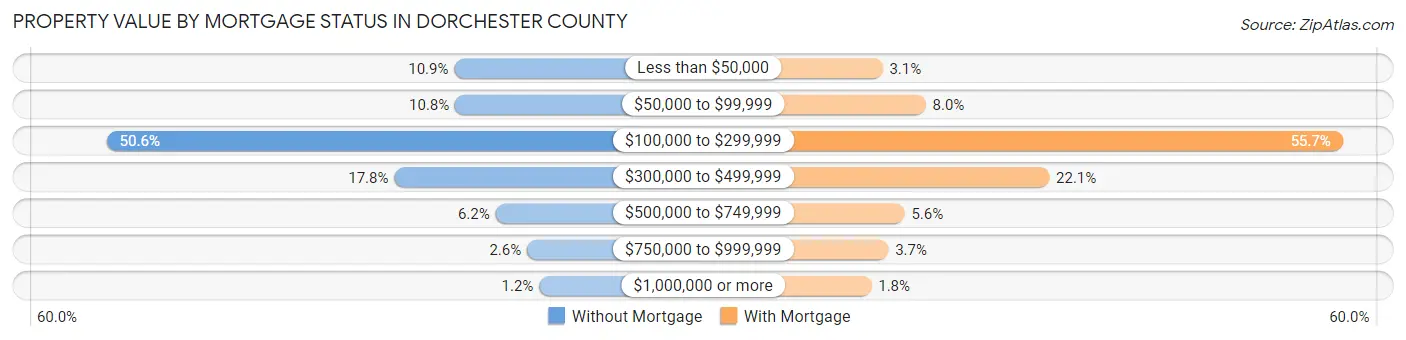
| Property Value | Without Mortgage | With Mortgage |
| Less than $50,000 | 448 (10.9%) | 152 (3.1%) |
| $50,000 to $99,999 | 444 (10.8%) | 395 (8.0%) |
| $100,000 to $299,999 | 2,082 (50.6%) | 2,746 (55.7%) |
| $300,000 to $499,999 | 730 (17.7%) | 1,091 (22.1%) |
| $500,000 to $749,999 | 254 (6.2%) | 276 (5.6%) |
| $750,000 to $999,999 | 106 (2.6%) | 184 (3.7%) |
| $1,000,000 or more | 49 (1.2%) | 89 (1.8%) |
| Total | 4,113 (100.0%) | 4,933 (100.0%) |
Household Income by Mortgage Status in Dorchester County
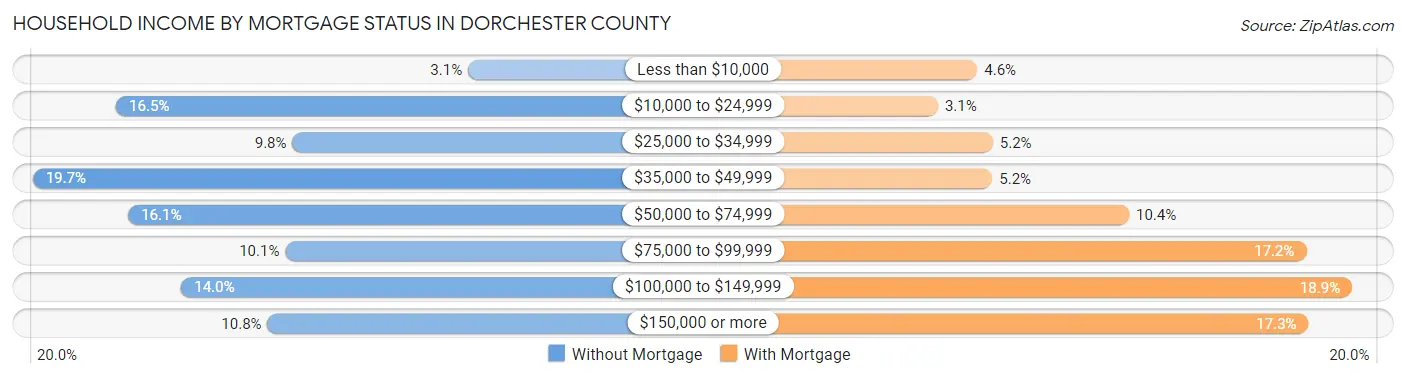
| Household Income | Without Mortgage | With Mortgage |
| Less than $10,000 | 128 (3.1%) | 229 (4.6%) |
| $10,000 to $24,999 | 679 (16.5%) | 155 (3.1%) |
| $25,000 to $34,999 | 403 (9.8%) | 258 (5.2%) |
| $35,000 to $49,999 | 810 (19.7%) | 257 (5.2%) |
| $50,000 to $74,999 | 660 (16.1%) | 514 (10.4%) |
| $75,000 to $99,999 | 414 (10.1%) | 847 (17.2%) |
| $100,000 to $149,999 | 577 (14.0%) | 933 (18.9%) |
| $150,000 or more | 442 (10.7%) | 851 (17.2%) |
| Total | 4,113 (100.0%) | 4,933 (100.0%) |
Property Value to Household Income Ratio in Dorchester County
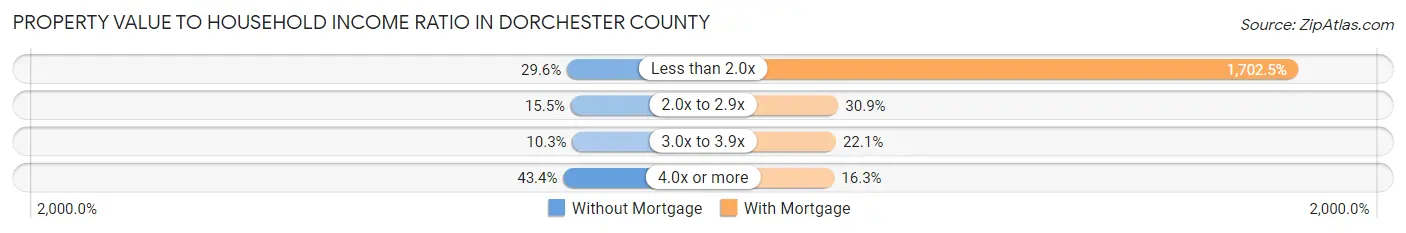
| Value-to-Income Ratio | Without Mortgage | With Mortgage |
| Less than 2.0x | 1,216 (29.6%) | 83,983 (1,702.5%) |
| 2.0x to 2.9x | 637 (15.5%) | 1,525 (30.9%) |
| 3.0x to 3.9x | 423 (10.3%) | 1,090 (22.1%) |
| 4.0x or more | 1,783 (43.3%) | 804 (16.3%) |
| Total | 4,113 (100.0%) | 4,933 (100.0%) |
Real Estate Taxes by Mortgage Status in Dorchester County
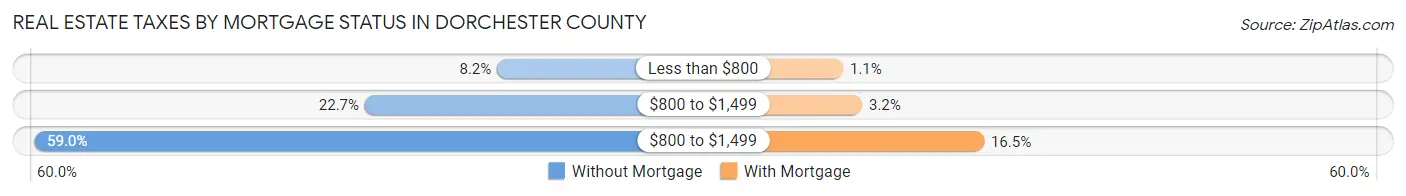
| Property Taxes | Without Mortgage | With Mortgage |
| Less than $800 | 338 (8.2%) | 54 (1.1%) |
| $800 to $1,499 | 934 (22.7%) | 157 (3.2%) |
| $800 to $1,499 | 2,425 (59.0%) | 816 (16.5%) |
| Total | 4,113 (100.0%) | 4,933 (100.0%) |
Health & Disability in Dorchester County
Health Insurance Coverage by Age in Dorchester County
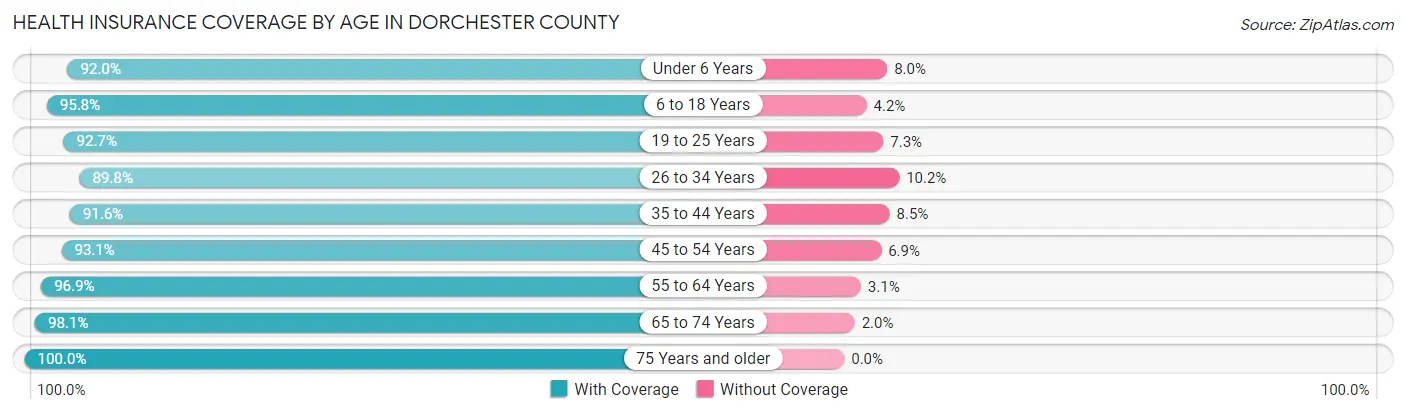
| Age Bracket | With Coverage | Without Coverage |
| Under 6 Years | 1,908 (92.0%) | 166 (8.0%) |
| 6 to 18 Years | 4,908 (95.8%) | 213 (4.2%) |
| 19 to 25 Years | 2,205 (92.7%) | 173 (7.3%) |
| 26 to 34 Years | 3,049 (89.8%) | 348 (10.2%) |
| 35 to 44 Years | 3,174 (91.5%) | 293 (8.5%) |
| 45 to 54 Years | 3,545 (93.1%) | 262 (6.9%) |
| 55 to 64 Years | 4,843 (96.9%) | 155 (3.1%) |
| 65 to 74 Years | 4,025 (98.1%) | 80 (1.9%) |
| 75 Years and older | 2,856 (100.0%) | 0 (0.0%) |
| Total | 30,513 (94.8%) | 1,690 (5.2%) |
Health Insurance Coverage by Citizenship Status in Dorchester County
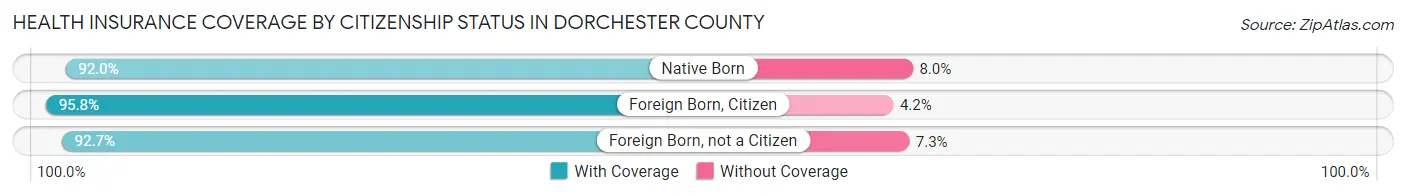
| Citizenship Status | With Coverage | Without Coverage |
| Native Born | 1,908 (92.0%) | 166 (8.0%) |
| Foreign Born, Citizen | 4,908 (95.8%) | 213 (4.2%) |
| Foreign Born, not a Citizen | 2,205 (92.7%) | 173 (7.3%) |
Health Insurance Coverage by Household Income in Dorchester County
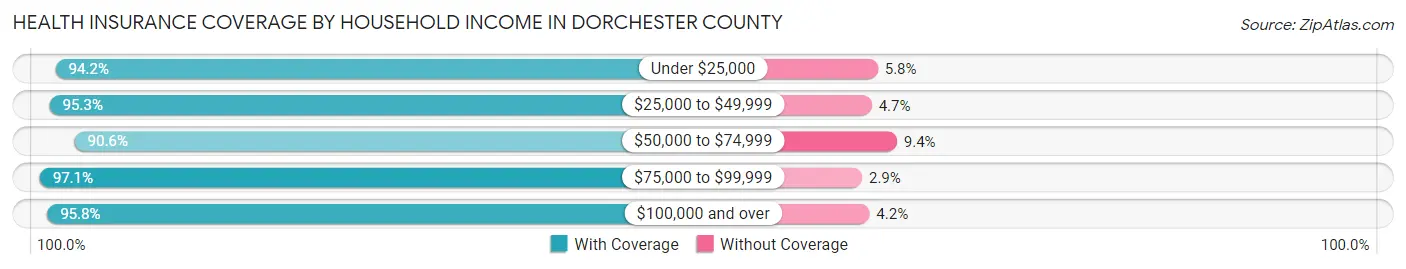
| Household Income | With Coverage | Without Coverage |
| Under $25,000 | 4,164 (94.2%) | 257 (5.8%) |
| $25,000 to $49,999 | 6,672 (95.3%) | 327 (4.7%) |
| $50,000 to $74,999 | 5,110 (90.6%) | 529 (9.4%) |
| $75,000 to $99,999 | 3,979 (97.1%) | 117 (2.9%) |
| $100,000 and over | 10,397 (95.8%) | 460 (4.2%) |
Public vs Private Health Insurance Coverage by Age in Dorchester County
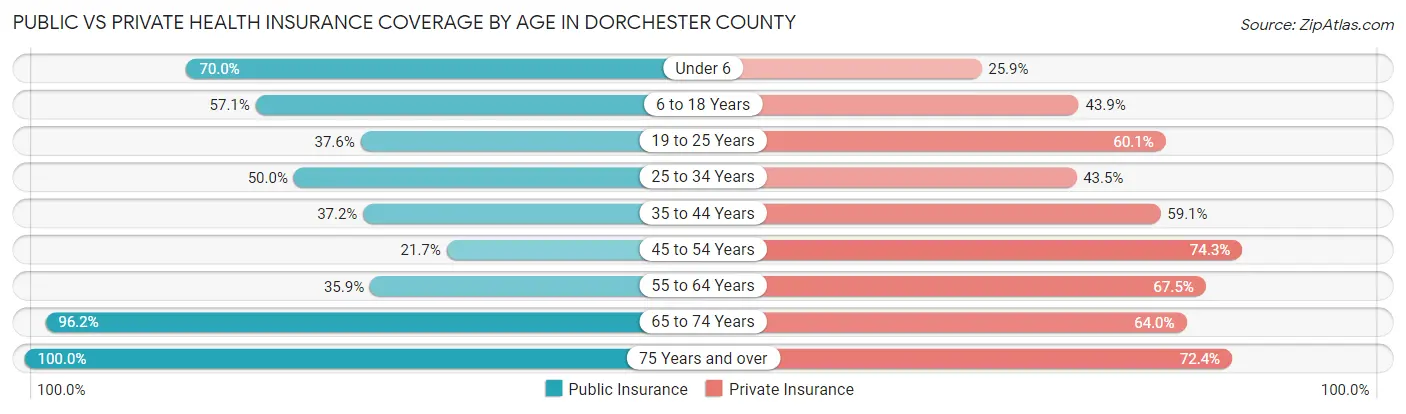
| Age Bracket | Public Insurance | Private Insurance |
| Under 6 | 1,451 (70.0%) | 537 (25.9%) |
| 6 to 18 Years | 2,925 (57.1%) | 2,250 (43.9%) |
| 19 to 25 Years | 895 (37.6%) | 1,429 (60.1%) |
| 25 to 34 Years | 1,700 (50.0%) | 1,478 (43.5%) |
| 35 to 44 Years | 1,288 (37.1%) | 2,050 (59.1%) |
| 45 to 54 Years | 825 (21.7%) | 2,829 (74.3%) |
| 55 to 64 Years | 1,794 (35.9%) | 3,375 (67.5%) |
| 65 to 74 Years | 3,947 (96.2%) | 2,625 (63.9%) |
| 75 Years and over | 2,856 (100.0%) | 2,068 (72.4%) |
| Total | 17,681 (54.9%) | 18,641 (57.9%) |
Disability Status by Sex by Age in Dorchester County
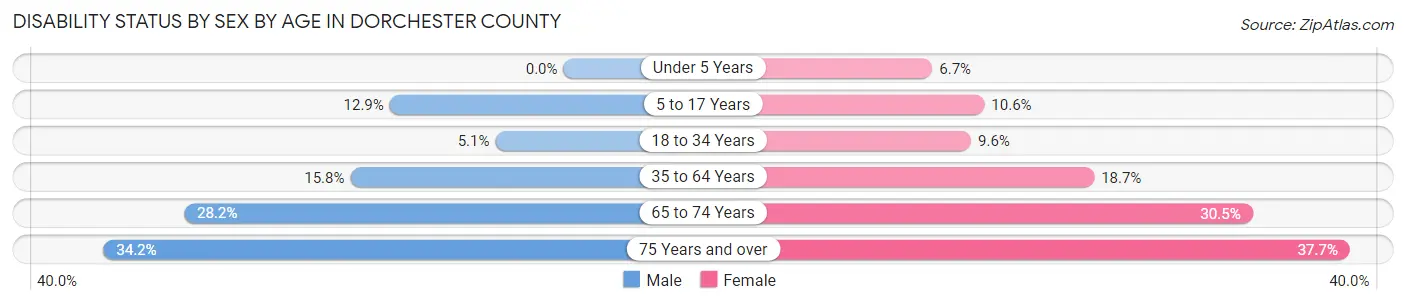
| Age Bracket | Male | Female |
| Under 5 Years | 0 (0.0%) | 56 (6.7%) |
| 5 to 17 Years | 319 (12.9%) | 277 (10.6%) |
| 18 to 34 Years | 147 (5.1%) | 309 (9.6%) |
| 35 to 64 Years | 894 (15.8%) | 1,241 (18.7%) |
| 65 to 74 Years | 528 (28.2%) | 680 (30.5%) |
| 75 Years and over | 403 (34.2%) | 632 (37.7%) |
Disability Class by Sex by Age in Dorchester County
Disability Class: Hearing Difficulty
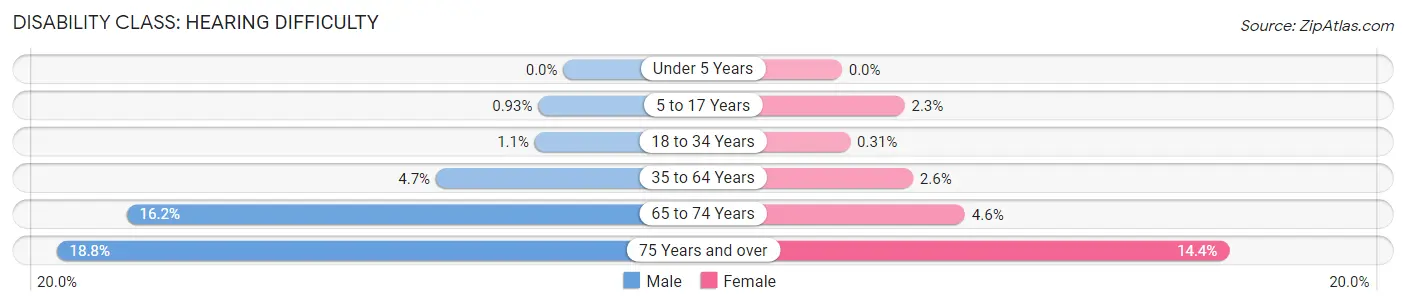
| Age Bracket | Male | Female |
| Under 5 Years | 0 (0.0%) | 0 (0.0%) |
| 5 to 17 Years | 23 (0.9%) | 61 (2.3%) |
| 18 to 34 Years | 31 (1.1%) | 10 (0.3%) |
| 35 to 64 Years | 267 (4.7%) | 175 (2.6%) |
| 65 to 74 Years | 304 (16.2%) | 102 (4.6%) |
| 75 Years and over | 222 (18.8%) | 241 (14.4%) |
Disability Class: Vision Difficulty
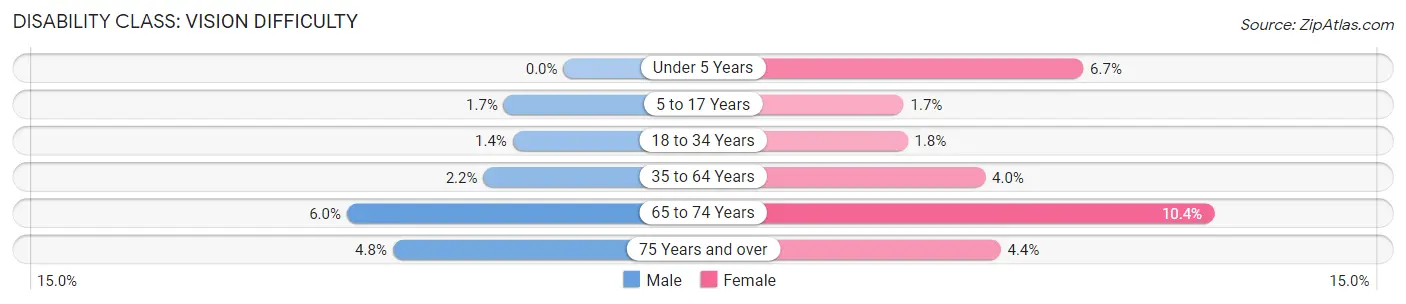
| Age Bracket | Male | Female |
| Under 5 Years | 0 (0.0%) | 56 (6.7%) |
| 5 to 17 Years | 41 (1.7%) | 45 (1.7%) |
| 18 to 34 Years | 41 (1.4%) | 59 (1.8%) |
| 35 to 64 Years | 126 (2.2%) | 264 (4.0%) |
| 65 to 74 Years | 113 (6.0%) | 231 (10.4%) |
| 75 Years and over | 56 (4.8%) | 74 (4.4%) |
Disability Class: Cognitive Difficulty
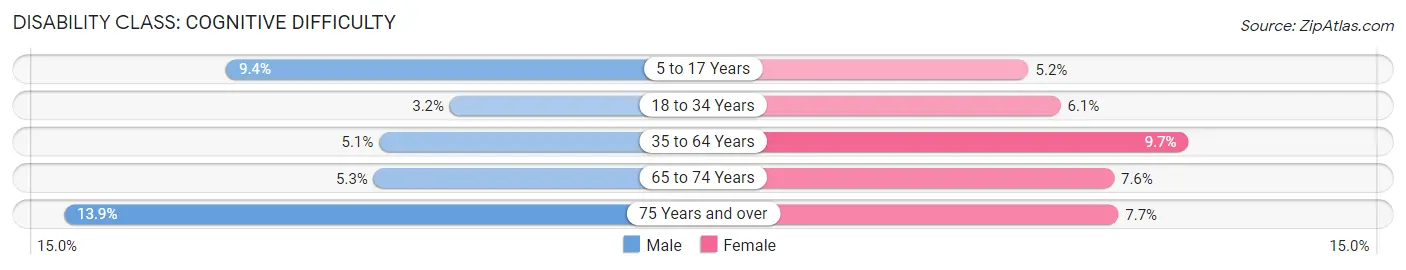
| Age Bracket | Male | Female |
| 5 to 17 Years | 232 (9.4%) | 136 (5.2%) |
| 18 to 34 Years | 92 (3.2%) | 196 (6.1%) |
| 35 to 64 Years | 290 (5.1%) | 639 (9.7%) |
| 65 to 74 Years | 99 (5.3%) | 169 (7.6%) |
| 75 Years and over | 164 (13.9%) | 129 (7.7%) |
Disability Class: Ambulatory Difficulty
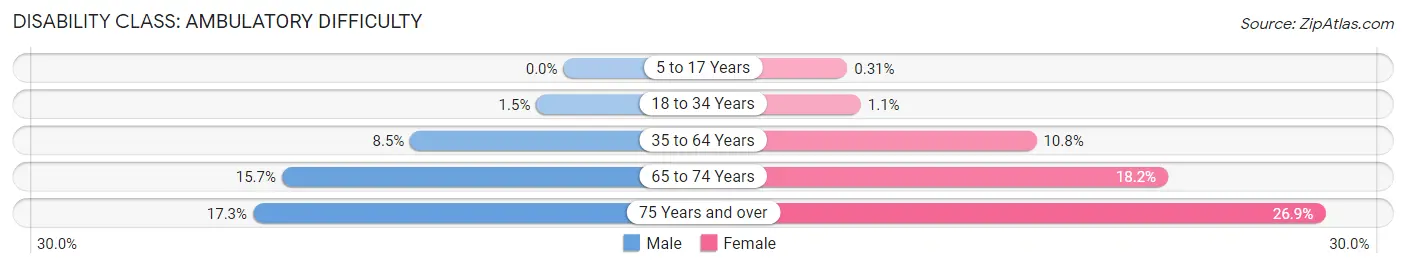
| Age Bracket | Male | Female |
| 5 to 17 Years | 0 (0.0%) | 8 (0.3%) |
| 18 to 34 Years | 44 (1.5%) | 34 (1.1%) |
| 35 to 64 Years | 482 (8.5%) | 718 (10.8%) |
| 65 to 74 Years | 294 (15.7%) | 405 (18.2%) |
| 75 Years and over | 204 (17.3%) | 451 (26.9%) |
Disability Class: Self-Care Difficulty
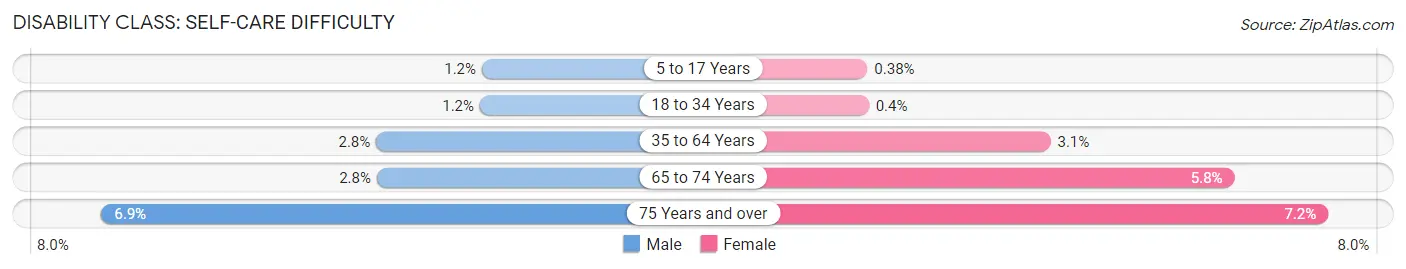
| Age Bracket | Male | Female |
| 5 to 17 Years | 30 (1.2%) | 10 (0.4%) |
| 18 to 34 Years | 36 (1.2%) | 13 (0.4%) |
| 35 to 64 Years | 157 (2.8%) | 205 (3.1%) |
| 65 to 74 Years | 52 (2.8%) | 130 (5.8%) |
| 75 Years and over | 81 (6.9%) | 121 (7.2%) |
Technology Access in Dorchester County
Computing Device Access in Dorchester County
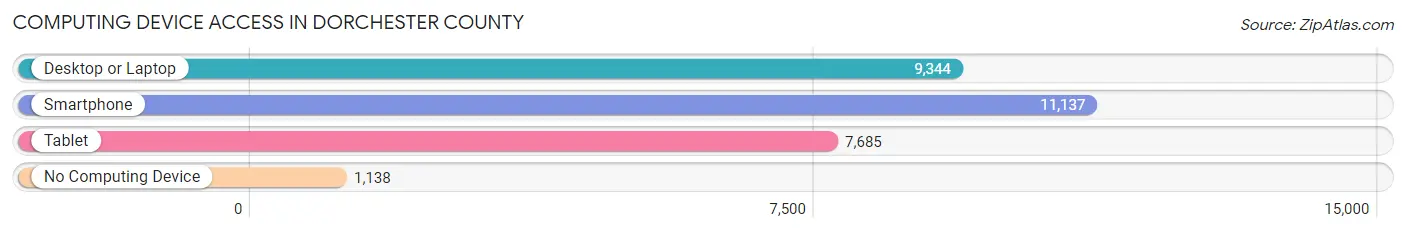
| Device Type | # Households | % Households |
| Desktop or Laptop | 9,344 | 70.7% |
| Smartphone | 11,137 | 84.3% |
| Tablet | 7,685 | 58.2% |
| No Computing Device | 1,138 | 8.6% |
| Total | 13,216 | 100.0% |
Internet Access in Dorchester County
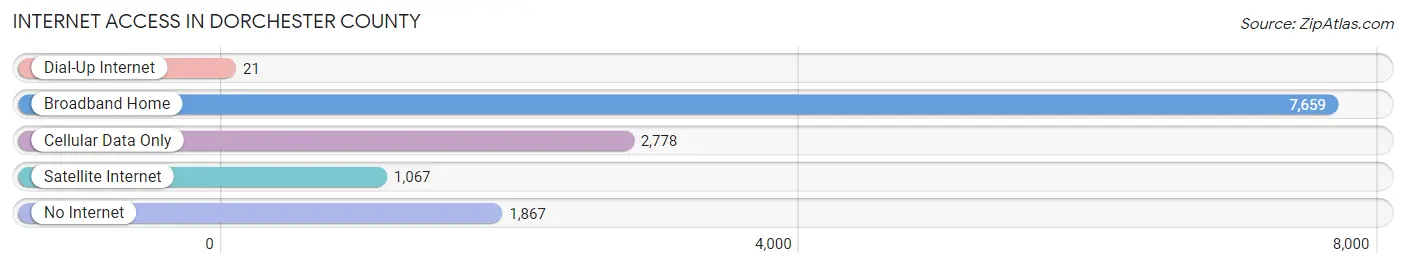
| Internet Type | # Households | % Households |
| Dial-Up Internet | 21 | 0.2% |
| Broadband Home | 7,659 | 58.0% |
| Cellular Data Only | 2,778 | 21.0% |
| Satellite Internet | 1,067 | 8.1% |
| No Internet | 1,867 | 14.1% |
| Total | 13,216 | 100.0% |
Dorchester County Summary
Dorchester County, Maryland is located in the Eastern Shore region of the state and is the largest county in Maryland by land area. It is bordered by Caroline, Talbot, Wicomico, and Somerset counties, as well as the Chesapeake Bay. The county seat is Cambridge, and the county is home to a population of 32,618 as of the 2010 census.
History
Dorchester County was established in 1669, making it one of the oldest counties in Maryland. It was named after the Earl of Dorset, who was a prominent figure in the English court at the time. The county was originally part of Somerset County, but was split off in 1669. The county was home to a number of prominent figures in American history, including Harriet Tubman, who was born a slave in Dorchester County in 1822.
Geography
Dorchester County is located in the Eastern Shore region of Maryland, and is the largest county in the state by land area. It is bordered by Caroline, Talbot, Wicomico, and Somerset counties, as well as the Chesapeake Bay. The county is mostly rural, with a few small towns and villages scattered throughout. The terrain is mostly flat, with some rolling hills in the northern part of the county. The county is home to a number of rivers, including the Choptank, Nanticoke, and Wicomico rivers.
Economy
Dorchester County has a largely agricultural economy, with the majority of the population employed in farming and related industries. The county is home to a number of large poultry farms, as well as a number of smaller farms that produce a variety of crops, including corn, soybeans, and wheat. The county is also home to a number of seafood processing plants, which process and package seafood for sale in the region. The county is also home to a number of manufacturing plants, which produce a variety of products, including furniture, paper products, and plastics.
Demographics
As of the 2010 census, Dorchester County had a population of 32,618. The population is largely white (83.3%), with African Americans making up the largest minority group (14.2%). The median household income in the county is $45,845, and the median age is 42.7. The county is home to a number of small towns and villages, including Cambridge, East New Market, Hurlock, and Vienna.
Conclusion
Dorchester County, Maryland is a rural county located in the Eastern Shore region of the state. It is the largest county in Maryland by land area, and is home to a population of 32,618 as of the 2010 census. The county has a largely agricultural economy, with the majority of the population employed in farming and related industries. The county is also home to a number of manufacturing plants, which produce a variety of products. The population is largely white, with African Americans making up the largest minority group.
Common Questions
What is the Total Population of Dorchester County?
Total Population of Dorchester County is 32,557.
What is the Total Male Population of Dorchester County?
Total Male Population of Dorchester County is 15,261.
What is the Total Female Population of Dorchester County?
Total Female Population of Dorchester County is 17,296.
What is the Ratio of Males per 100 Females in Dorchester County?
There are 88.23 Males per 100 Females in Dorchester County.
What is the Ratio of Females per 100 Males in Dorchester County?
There are 113.33 Females per 100 Males in Dorchester County.
What is the Median Population Age in Dorchester County?
Median Population Age in Dorchester County is 43.8 Years.
What is the Average Family Size in Dorchester County
Average Family Size in Dorchester County is 3.0 People.
What is the Average Household Size in Dorchester County
Average Household Size in Dorchester County is 2.4 People.
What is Per Capita Income in Dorchester County?
Per Capita income in Dorchester County is $33,950.
What is the Median Family Income in Dorchester County?
Median Family Income in Dorchester County is $74,254.
What is the Median Household income in Dorchester County?
Median Household Income in Dorchester County is $57,490.
What is Income or Wage Gap in Dorchester County?
Income or Wage Gap in Dorchester County is 27.4%.
Women in Dorchester County earn 72.6 cents for every dollar earned by a man.
What is Family Income Deficit in Dorchester County?
Family Income Deficit in Dorchester County is $10,037.
Families that are below poverty line in Dorchester County earn $10,037 less on average than the poverty threshold level.
What is Inequality or Gini Index in Dorchester County?
Inequality or Gini Index in Dorchester County is 0.47.
How Large is the Labor Force in Dorchester County?
There are 15,879 People in the Labor Forcein in Dorchester County.
What is the Percentage of People in the Labor Force in Dorchester County?
59.5% of People are in the Labor Force in Dorchester County.
What is the Unemployment Rate in Dorchester County?
Unemployment Rate in Dorchester County is 5.5%.