Charles County, MD
Charles County Map
Charles County Overview
167,035
TOTAL POPULATION
80,711
MALE POPULATION
86,324
FEMALE POPULATION
93.50
MALES / 100 FEMALES
106.95
FEMALES / 100 MALES
38.8
MEDIAN AGE
3.3
AVG FAMILY SIZE
2.8
AVG HOUSEHOLD SIZE
$47,977
PER CAPITA INCOME
$130,440
AVG FAMILY INCOME
$116,882
AVG HOUSEHOLD INCOME
19.3%
WAGE / INCOME GAP [ % ]
80.7¢/ $1
WAGE / INCOME GAP [ $ ]
$12,391
FAMILY INCOME DEFICIT
0.38
INEQUALITY / GINI INDEX
90,960
LABOR FORCE [ PEOPLE ]
68.8%
PERCENT IN LABOR FORCE
4.9%
UNEMPLOYMENT RATE
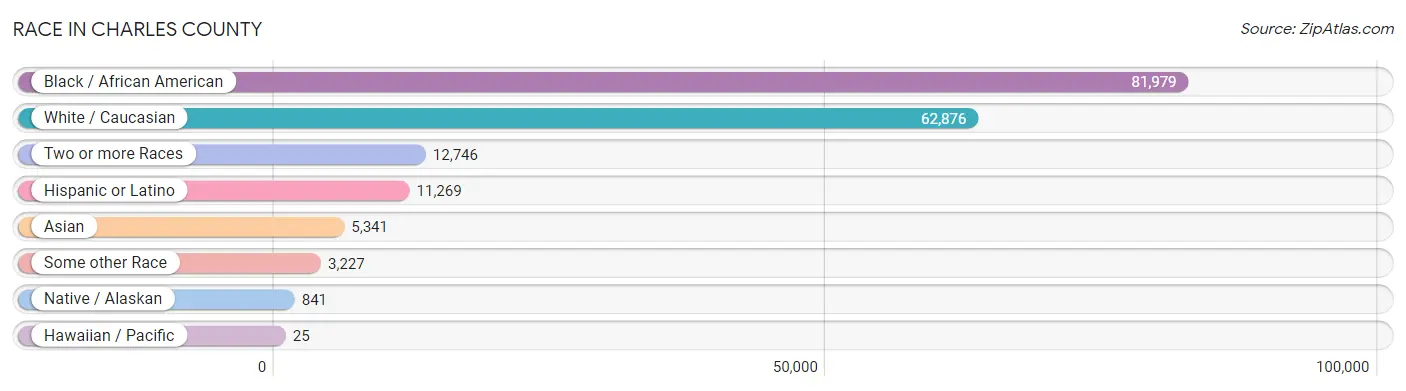
Race in Charles County
The most populous races in Charles County are Black / African American (81,979 | 49.1%), White / Caucasian (62,876 | 37.6%), and Two or more Races (12,746 | 7.6%).
| Race | # Population | % Population |
| Asian | 5,341 | 3.2% |
| Black / African American | 81,979 | 49.1% |
| Hawaiian / Pacific | 25 | 0.0% |
| Hispanic or Latino | 11,269 | 6.8% |
| Native / Alaskan | 841 | 0.5% |
| White / Caucasian | 62,876 | 37.6% |
| Two or more Races | 12,746 | 7.6% |
| Some other Race | 3,227 | 1.9% |
| Total | 167,035 | 100.0% |
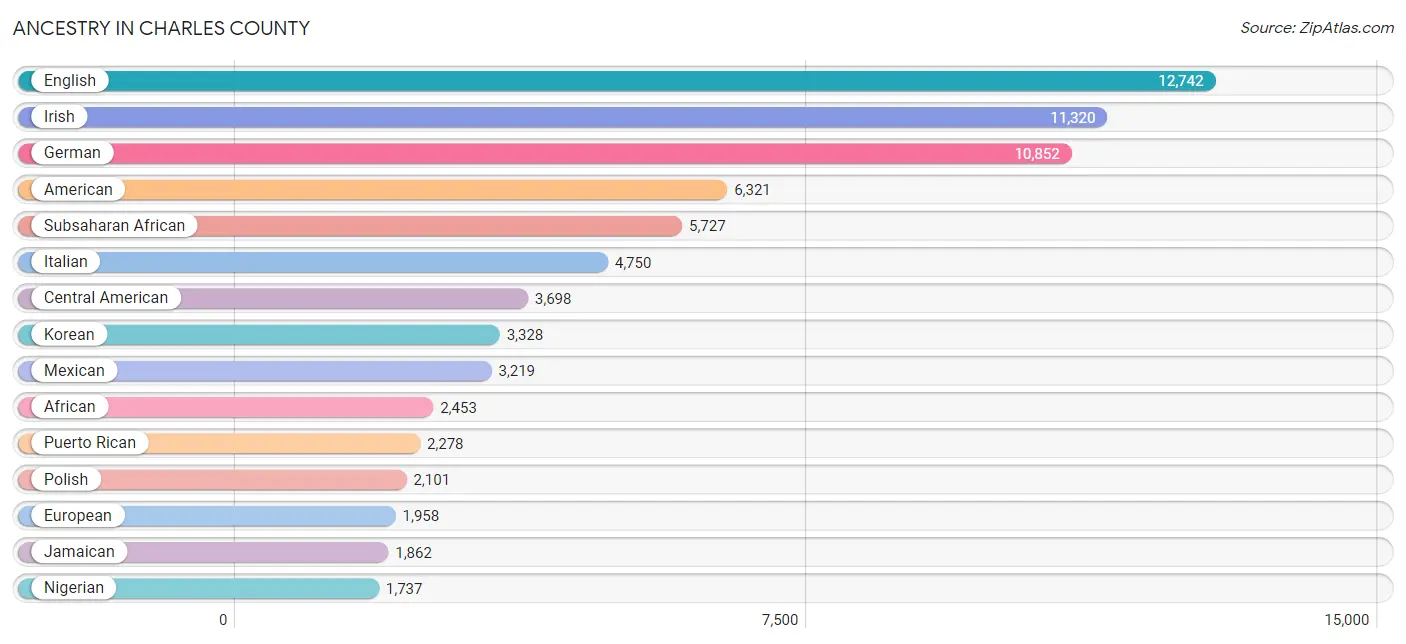
Ancestry in Charles County
The most populous ancestries reported in Charles County are English (12,742 | 7.6%), Irish (11,320 | 6.8%), German (10,852 | 6.5%), American (6,321 | 3.8%), and Subsaharan African (5,727 | 3.4%), together accounting for 28.1% of all Charles County residents.
| Ancestry | # Population | % Population |
| African | 2,453 | 1.5% |
| American | 6,321 | 3.8% |
| Apache | 5 | 0.0% |
| Arab | 383 | 0.2% |
| Armenian | 40 | 0.0% |
| Austrian | 116 | 0.1% |
| Bangladeshi | 8 | 0.0% |
| Barbadian | 21 | 0.0% |
| Belgian | 21 | 0.0% |
| Belizean | 8 | 0.0% |
| Bermudan | 135 | 0.1% |
| Bhutanese | 649 | 0.4% |
| Blackfeet | 395 | 0.2% |
| Brazilian | 135 | 0.1% |
| British | 825 | 0.5% |
| British West Indian | 46 | 0.0% |
| Bulgarian | 42 | 0.0% |
| Burmese | 409 | 0.2% |
| Canadian | 113 | 0.1% |
| Celtic | 14 | 0.0% |
| Central American | 3,698 | 2.2% |
| Central American Indian | 206 | 0.1% |
| Cherokee | 593 | 0.4% |
| Cheyenne | 16 | 0.0% |
| Chickasaw | 2 | 0.0% |
| Chilean | 1 | 0.0% |
| Chippewa | 50 | 0.0% |
| Choctaw | 15 | 0.0% |
| Colombian | 437 | 0.3% |
| Comanche | 10 | 0.0% |
| Costa Rican | 30 | 0.0% |
| Cree | 16 | 0.0% |
| Croatian | 33 | 0.0% |
| Cuban | 196 | 0.1% |
| Czech | 291 | 0.2% |
| Danish | 233 | 0.1% |
| Delaware | 191 | 0.1% |
| Dominican | 528 | 0.3% |
| Dutch | 1,035 | 0.6% |
| Eastern European | 130 | 0.1% |
| Ecuadorian | 14 | 0.0% |
| English | 12,742 | 7.6% |
| Ethiopian | 316 | 0.2% |
| European | 1,958 | 1.2% |
| Filipino | 99 | 0.1% |
| Finnish | 132 | 0.1% |
| French | 1,504 | 0.9% |
| French American Indian | 30 | 0.0% |
| French Canadian | 167 | 0.1% |
| German | 10,852 | 6.5% |
| Ghanaian | 154 | 0.1% |
| Greek | 444 | 0.3% |
| Guamanian / Chamorro | 34 | 0.0% |
| Guatemalan | 1,223 | 0.7% |
| Guyanese | 155 | 0.1% |
| Haitian | 453 | 0.3% |
| Honduran | 321 | 0.2% |
| Hungarian | 529 | 0.3% |
| Icelander | 6 | 0.0% |
| Indian (Asian) | 1,265 | 0.8% |
| Iranian | 58 | 0.0% |
| Iraqi | 99 | 0.1% |
| Irish | 11,320 | 6.8% |
| Iroquois | 8 | 0.0% |
| Israeli | 2 | 0.0% |
| Italian | 4,750 | 2.8% |
| Jamaican | 1,862 | 1.1% |
| Japanese | 134 | 0.1% |
| Kenyan | 22 | 0.0% |
| Korean | 3,328 | 2.0% |
| Laotian | 13 | 0.0% |
| Latvian | 11 | 0.0% |
| Lebanese | 141 | 0.1% |
| Liberian | 26 | 0.0% |
| Lithuanian | 91 | 0.1% |
| Lumbee | 11 | 0.0% |
| Luxembourger | 11 | 0.0% |
| Mexican | 3,219 | 1.9% |
| Mexican American Indian | 274 | 0.2% |
| Mongolian | 188 | 0.1% |
| Moroccan | 64 | 0.0% |
| Native Hawaiian | 235 | 0.1% |
| Navajo | 68 | 0.0% |
| Nicaraguan | 42 | 0.0% |
| Nigerian | 1,737 | 1.0% |
| Northern European | 161 | 0.1% |
| Norwegian | 797 | 0.5% |
| Pakistani | 99 | 0.1% |
| Palestinian | 6 | 0.0% |
| Panamanian | 434 | 0.3% |
| Pennsylvania German | 364 | 0.2% |
| Peruvian | 281 | 0.2% |
| Polish | 2,101 | 1.3% |
| Portuguese | 128 | 0.1% |
| Puerto Rican | 2,278 | 1.4% |
| Romanian | 43 | 0.0% |
| Russian | 208 | 0.1% |
| Salvadoran | 1,645 | 1.0% |
| Samoan | 31 | 0.0% |
| Scandinavian | 193 | 0.1% |
| Scotch-Irish | 679 | 0.4% |
| Scottish | 1,324 | 0.8% |
| Senegalese | 15 | 0.0% |
| Serbian | 50 | 0.0% |
| Sierra Leonean | 322 | 0.2% |
| Sioux | 29 | 0.0% |
| Slavic | 5 | 0.0% |
| Slovak | 112 | 0.1% |
| Slovene | 48 | 0.0% |
| South American | 733 | 0.4% |
| South American Indian | 86 | 0.1% |
| Spaniard | 137 | 0.1% |
| Spanish | 248 | 0.2% |
| Sri Lankan | 489 | 0.3% |
| Subsaharan African | 5,727 | 3.4% |
| Swedish | 327 | 0.2% |
| Swiss | 140 | 0.1% |
| Syrian | 31 | 0.0% |
| Thai | 1,075 | 0.6% |
| Trinidadian and Tobagonian | 212 | 0.1% |
| U.S. Virgin Islander | 25 | 0.0% |
| Ugandan | 335 | 0.2% |
| Ukrainian | 370 | 0.2% |
| Vietnamese | 61 | 0.0% |
| Welsh | 880 | 0.5% |
| West Indian | 187 | 0.1% | View All 126 Rows |
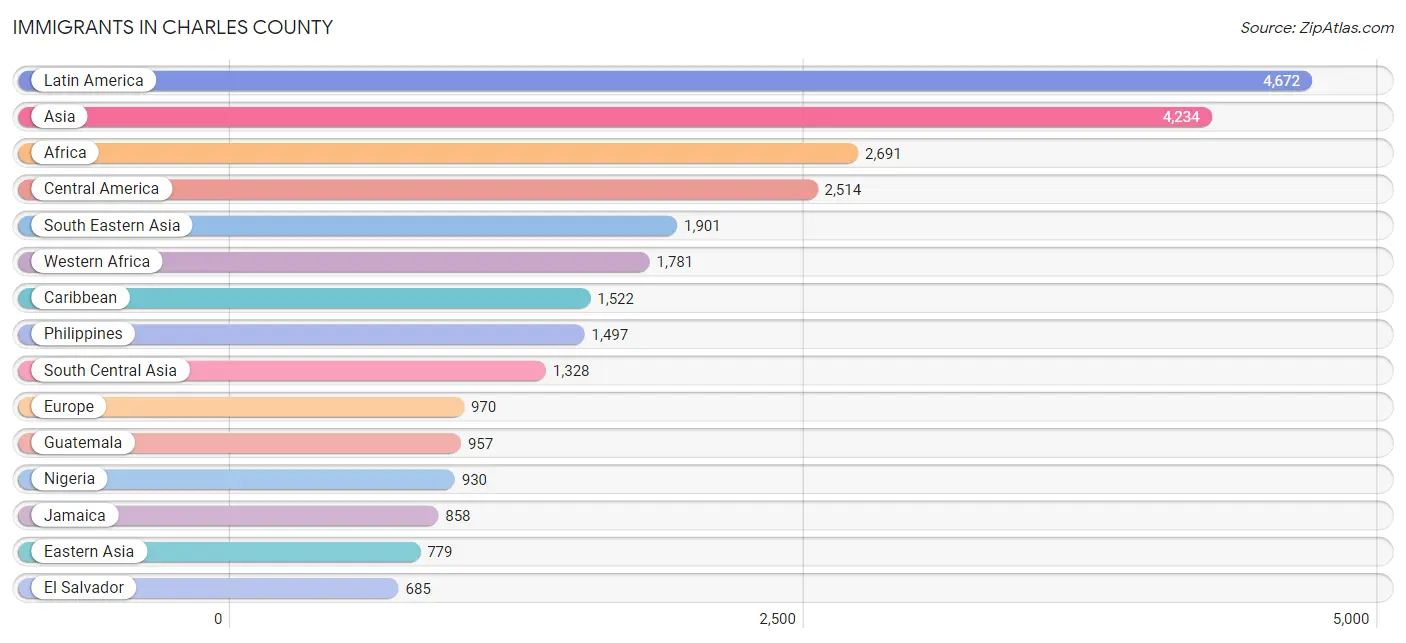
Immigrants in Charles County
The most numerous immigrant groups reported in Charles County came from Latin America (4,672 | 2.8%), Asia (4,234 | 2.5%), Africa (2,691 | 1.6%), Central America (2,514 | 1.5%), and South Eastern Asia (1,901 | 1.1%), together accounting for 9.6% of all Charles County residents.
| Immigration Origin | # Population | % Population |
| Africa | 2,691 | 1.6% |
| Asia | 4,234 | 2.5% |
| Bangladesh | 41 | 0.0% |
| Barbados | 39 | 0.0% |
| Belgium | 26 | 0.0% |
| Belize | 139 | 0.1% |
| Brazil | 56 | 0.0% |
| Bulgaria | 39 | 0.0% |
| Cambodia | 85 | 0.1% |
| Cameroon | 210 | 0.1% |
| Canada | 6 | 0.0% |
| Caribbean | 1,522 | 0.9% |
| Central America | 2,514 | 1.5% |
| China | 385 | 0.2% |
| Colombia | 76 | 0.1% |
| Cuba | 15 | 0.0% |
| Denmark | 10 | 0.0% |
| Dominican Republic | 263 | 0.2% |
| Eastern Africa | 271 | 0.2% |
| Eastern Asia | 779 | 0.5% |
| Eastern Europe | 142 | 0.1% |
| Ecuador | 14 | 0.0% |
| El Salvador | 685 | 0.4% |
| England | 240 | 0.1% |
| Ethiopia | 167 | 0.1% |
| Europe | 970 | 0.6% |
| Fiji | 8 | 0.0% |
| France | 13 | 0.0% |
| Germany | 191 | 0.1% |
| Ghana | 115 | 0.1% |
| Grenada | 17 | 0.0% |
| Guatemala | 957 | 0.6% |
| Guyana | 239 | 0.1% |
| Haiti | 129 | 0.1% |
| Honduras | 73 | 0.0% |
| India | 592 | 0.4% |
| Indonesia | 7 | 0.0% |
| Iran | 3 | 0.0% |
| Iraq | 99 | 0.1% |
| Ireland | 10 | 0.0% |
| Israel | 2 | 0.0% |
| Italy | 110 | 0.1% |
| Jamaica | 858 | 0.5% |
| Japan | 110 | 0.1% |
| Kenya | 86 | 0.1% |
| Korea | 284 | 0.2% |
| Kuwait | 34 | 0.0% |
| Latin America | 4,672 | 2.8% |
| Lebanon | 17 | 0.0% |
| Liberia | 182 | 0.1% |
| Malaysia | 67 | 0.0% |
| Mexico | 570 | 0.3% |
| Middle Africa | 210 | 0.1% |
| Morocco | 64 | 0.0% |
| Nepal | 247 | 0.2% |
| Netherlands | 34 | 0.0% |
| Nicaragua | 29 | 0.0% |
| Nigeria | 930 | 0.6% |
| Northern Africa | 64 | 0.0% |
| Northern Europe | 408 | 0.2% |
| Oceania | 8 | 0.0% |
| Pakistan | 414 | 0.3% |
| Panama | 61 | 0.0% |
| Peru | 180 | 0.1% |
| Philippines | 1,497 | 0.9% |
| Poland | 27 | 0.0% |
| Romania | 34 | 0.0% |
| Russia | 7 | 0.0% |
| Scotland | 16 | 0.0% |
| Sierra Leone | 297 | 0.2% |
| Singapore | 9 | 0.0% |
| Somalia | 18 | 0.0% |
| South Africa | 30 | 0.0% |
| South America | 636 | 0.4% |
| South Central Asia | 1,328 | 0.8% |
| South Eastern Asia | 1,901 | 1.1% |
| Southern Europe | 147 | 0.1% |
| Spain | 37 | 0.0% |
| Sri Lanka | 31 | 0.0% |
| Switzerland | 9 | 0.0% |
| Taiwan | 73 | 0.0% |
| Thailand | 50 | 0.0% |
| Trinidad and Tobago | 127 | 0.1% |
| Ukraine | 35 | 0.0% |
| Venezuela | 71 | 0.0% |
| Vietnam | 186 | 0.1% |
| West Indies | 28 | 0.0% |
| Western Africa | 1,781 | 1.1% |
| Western Asia | 217 | 0.1% |
| Western Europe | 273 | 0.2% | View All 90 Rows |
Sex and Age in Charles County
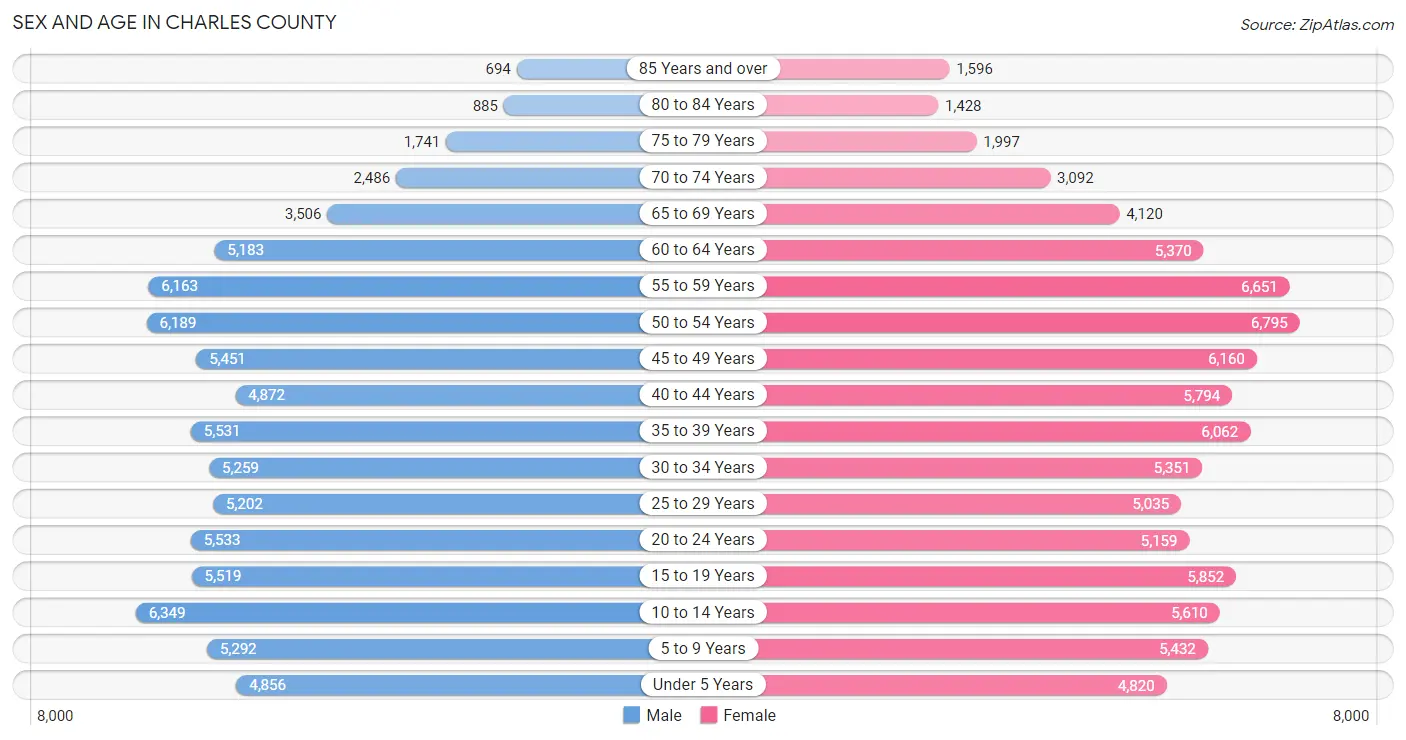
Sex and Age in Charles County
The most populous age groups in Charles County are 10 to 14 Years (6,349 | 7.9%) for men and 50 to 54 Years (6,795 | 7.9%) for women.
| Age Bracket | Male | Female |
| Under 5 Years | 4,856 (6.0%) | 4,820 (5.6%) |
| 5 to 9 Years | 5,292 (6.6%) | 5,432 (6.3%) |
| 10 to 14 Years | 6,349 (7.9%) | 5,610 (6.5%) |
| 15 to 19 Years | 5,519 (6.8%) | 5,852 (6.8%) |
| 20 to 24 Years | 5,533 (6.9%) | 5,159 (6.0%) |
| 25 to 29 Years | 5,202 (6.5%) | 5,035 (5.8%) |
| 30 to 34 Years | 5,259 (6.5%) | 5,351 (6.2%) |
| 35 to 39 Years | 5,531 (6.9%) | 6,062 (7.0%) |
| 40 to 44 Years | 4,872 (6.0%) | 5,794 (6.7%) |
| 45 to 49 Years | 5,451 (6.8%) | 6,160 (7.1%) |
| 50 to 54 Years | 6,189 (7.7%) | 6,795 (7.9%) |
| 55 to 59 Years | 6,163 (7.6%) | 6,651 (7.7%) |
| 60 to 64 Years | 5,183 (6.4%) | 5,370 (6.2%) |
| 65 to 69 Years | 3,506 (4.3%) | 4,120 (4.8%) |
| 70 to 74 Years | 2,486 (3.1%) | 3,092 (3.6%) |
| 75 to 79 Years | 1,741 (2.2%) | 1,997 (2.3%) |
| 80 to 84 Years | 885 (1.1%) | 1,428 (1.7%) |
| 85 Years and over | 694 (0.9%) | 1,596 (1.8%) |
| Total | 80,711 (100.0%) | 86,324 (100.0%) |
Families and Households in Charles County
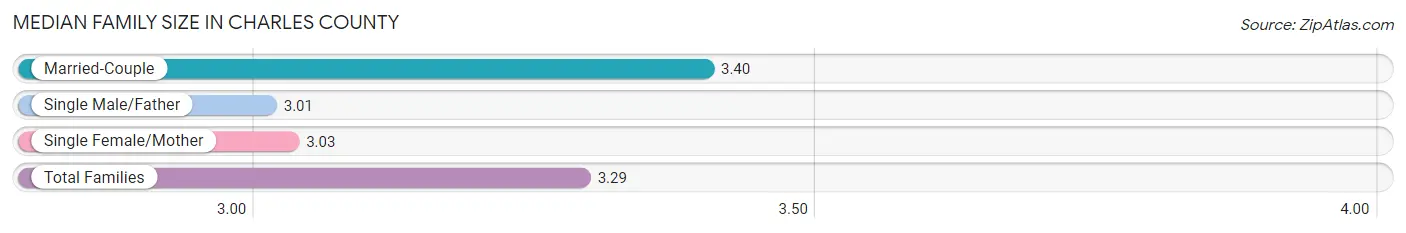
Median Family Size in Charles County
The median family size in Charles County is 3.29 persons per family, with married-couple families (30,828 | 71.4%) accounting for the largest median family size of 3.4 persons per family. On the other hand, single male/father families (2,946 | 6.8%) represent the smallest median family size with 3.01 persons per family.
| Family Type | # Families | Family Size |
| Married-Couple | 30,828 (71.4%) | 3.40 |
| Single Male/Father | 2,946 (6.8%) | 3.01 |
| Single Female/Mother | 9,431 (21.8%) | 3.03 |
| Total Families | 43,205 (100.0%) | 3.29 |
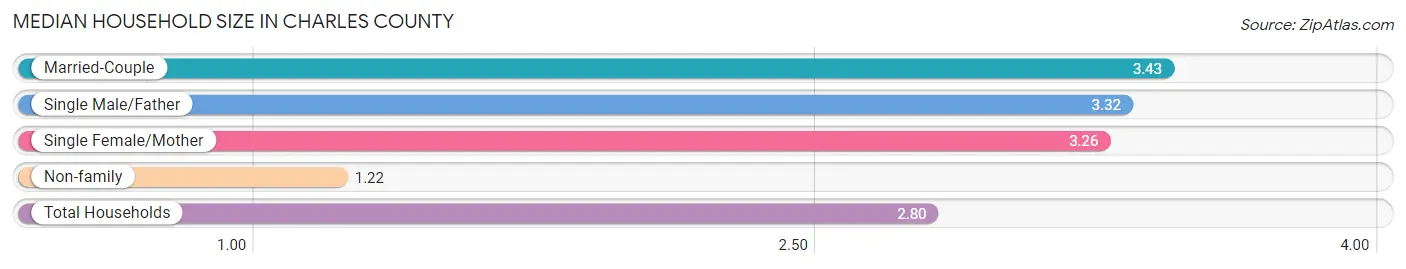
Median Household Size in Charles County
The median household size in Charles County is 2.80 persons per household, with married-couple households (30,828 | 52.1%) accounting for the largest median household size of 3.43 persons per household. non-family households (16,000 | 27.0%) represent the smallest median household size with 1.22 persons per household.
| Household Type | # Households | Household Size |
| Married-Couple | 30,828 (52.1%) | 3.43 |
| Single Male/Father | 2,946 (5.0%) | 3.32 |
| Single Female/Mother | 9,431 (15.9%) | 3.26 |
| Non-family | 16,000 (27.0%) | 1.22 |
| Total Households | 59,205 (100.0%) | 2.80 |
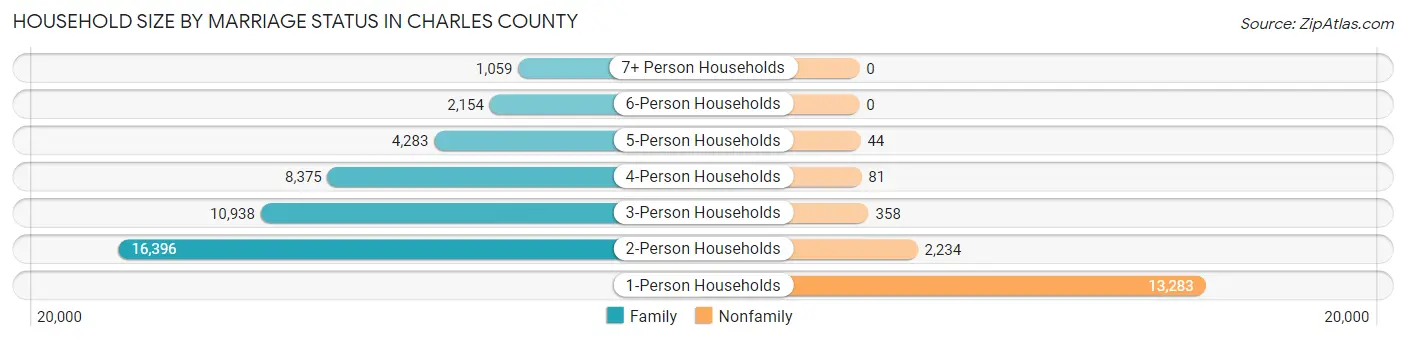
Household Size by Marriage Status in Charles County
Out of a total of 59,205 households in Charles County, 43,205 (73.0%) are family households, while 16,000 (27.0%) are nonfamily households. The most numerous type of family households are 2-person households, comprising 16,396, and the most common type of nonfamily households are 1-person households, comprising 13,283.
| Household Size | Family Households | Nonfamily Households |
| 1-Person Households | - | 13,283 (22.4%) |
| 2-Person Households | 16,396 (27.7%) | 2,234 (3.8%) |
| 3-Person Households | 10,938 (18.5%) | 358 (0.6%) |
| 4-Person Households | 8,375 (14.1%) | 81 (0.1%) |
| 5-Person Households | 4,283 (7.2%) | 44 (0.1%) |
| 6-Person Households | 2,154 (3.6%) | 0 (0.0%) |
| 7+ Person Households | 1,059 (1.8%) | 0 (0.0%) |
| Total | 43,205 (73.0%) | 16,000 (27.0%) |
Female Fertility in Charles County
Fertility by Age in Charles County
Average fertility rate in Charles County is 64.0 births per 1,000 women. Women in the age bracket of 20 to 34 years have the highest fertility rate with 116.0 births per 1,000 women. Women in the age bracket of 20 to 34 years acount for 68.5% of all women with births.
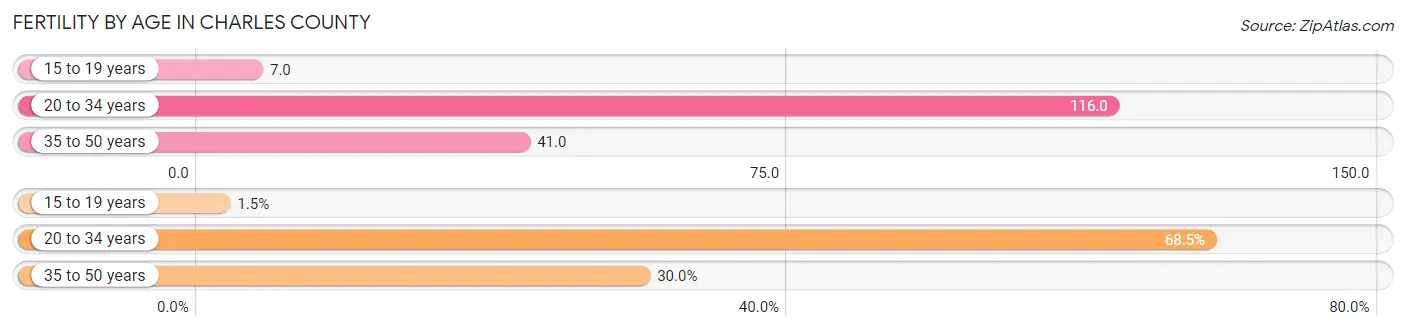
| Age Bracket | Women with Births | Births / 1,000 Women |
| 15 to 19 years | 40 (1.5%) | 7.0 |
| 20 to 34 years | 1,800 (68.5%) | 116.0 |
| 35 to 50 years | 789 (30.0%) | 41.0 |
| Total | 2,629 (100.0%) | 64.0 |
Fertility by Age by Marriage Status in Charles County
63.0% of women with births (2,629) in Charles County are married. The highest percentage of unmarried women with births falls into 15 to 19 years age bracket with 100.0% of them unmarried at the time of birth, while the lowest percentage of unmarried women with births belong to 35 to 50 years age bracket with 29.9% of them unmarried.
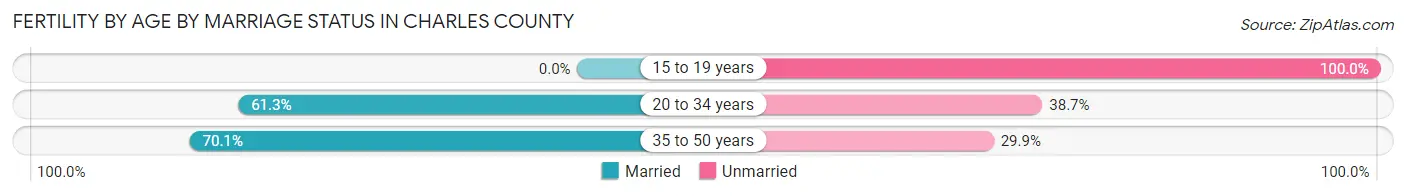
| Age Bracket | Married | Unmarried |
| 15 to 19 years | 0 (0.0%) | 40 (100.0%) |
| 20 to 34 years | 1,103 (61.3%) | 697 (38.7%) |
| 35 to 50 years | 553 (70.1%) | 236 (29.9%) |
| Total | 1,656 (63.0%) | 973 (37.0%) |
Fertility by Education in Charles County
Average fertility rate in Charles County is 64.0 births per 1,000 women. Women with the education attainment of graduate degree have the highest fertility rate of 97.0 births per 1,000 women, while women with the education attainment of less than high school have the lowest fertility at 28.0 births per 1,000 women. Women with the education attainment of college or associate's degree represent 33.1% of all women with births.
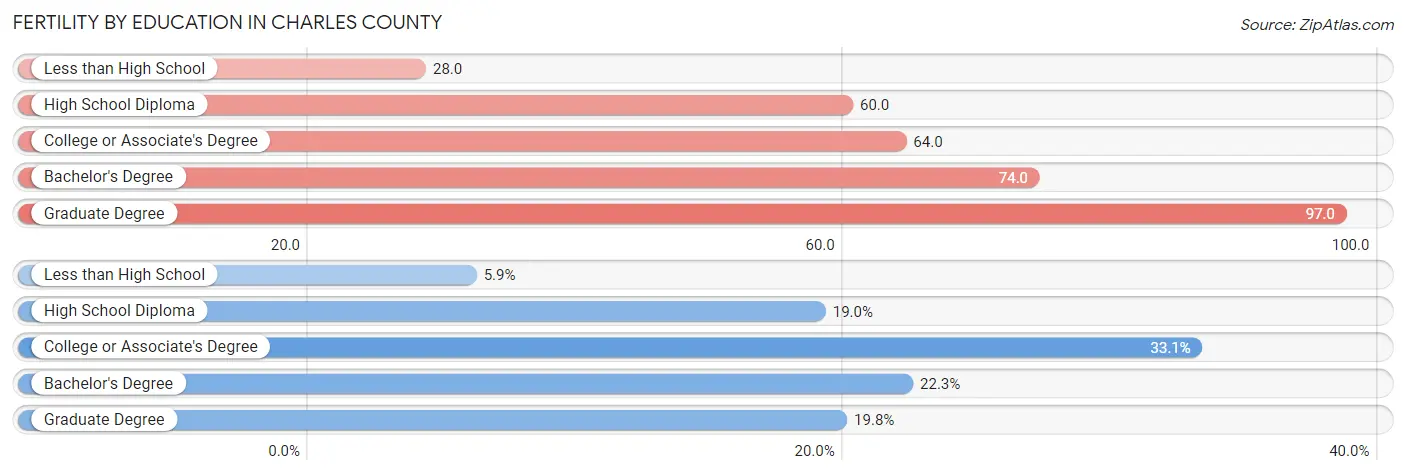
| Educational Attainment | Women with Births | Births / 1,000 Women |
| Less than High School | 155 (5.9%) | 28.0 |
| High School Diploma | 499 (19.0%) | 60.0 |
| College or Associate's Degree | 870 (33.1%) | 64.0 |
| Bachelor's Degree | 585 (22.3%) | 74.0 |
| Graduate Degree | 520 (19.8%) | 97.0 |
| Total | 2,629 (100.0%) | 64.0 |
Fertility by Education by Marriage Status in Charles County
37.0% of women with births in Charles County are unmarried. Women with the educational attainment of graduate degree are most likely to be married with 83.9% of them married at childbirth, while women with the educational attainment of less than high school are least likely to be married with 79.3% of them unmarried at childbirth.
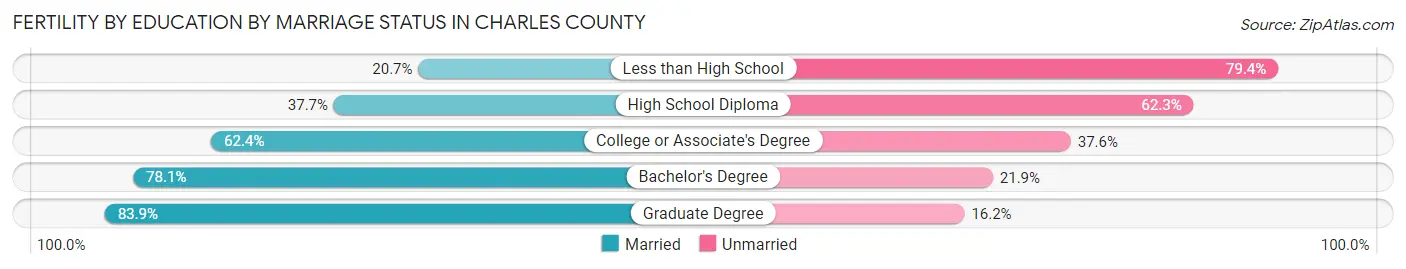
| Educational Attainment | Married | Unmarried |
| Less than High School | 32 (20.6%) | 123 (79.3%) |
| High School Diploma | 188 (37.7%) | 311 (62.3%) |
| College or Associate's Degree | 543 (62.4%) | 327 (37.6%) |
| Bachelor's Degree | 457 (78.1%) | 128 (21.9%) |
| Graduate Degree | 436 (83.9%) | 84 (16.2%) |
| Total | 1,656 (63.0%) | 973 (37.0%) |
Income in Charles County
Income Overview in Charles County
Per Capita Income in Charles County is $47,977, while median incomes of families and households are $130,440 and $116,882 respectively.
| Characteristic | Number | Measure |
| Per Capita Income | 167,035 | $47,977 |
| Median Family Income | 43,205 | $130,440 |
| Mean Family Income | 43,205 | $147,461 |
| Median Household Income | 59,205 | $116,882 |
| Mean Household Income | 59,205 | $133,710 |
| Income Deficit | 43,205 | $12,391 |
| Wage / Income Gap (%) | 167,035 | 19.29% |
| Wage / Income Gap ($) | 167,035 | 80.71¢ per $1 |
| Gini / Inequality Index | 167,035 | 0.38 |
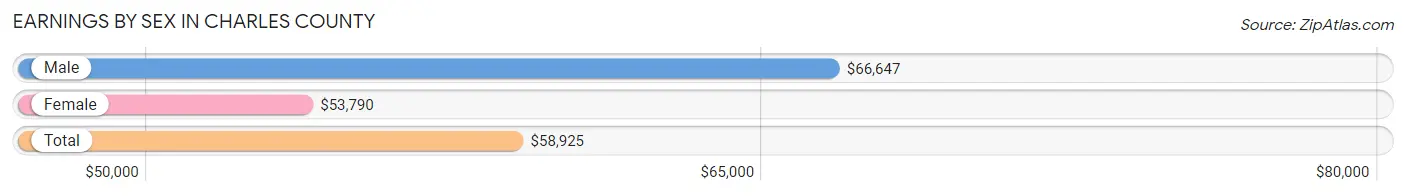
Earnings by Sex in Charles County
Average Earnings in Charles County are $58,925, $66,647 for men and $53,790 for women, a difference of 19.3%.
| Sex | Number | Average Earnings |
| Male | 46,780 (50.4%) | $66,647 |
| Female | 45,974 (49.6%) | $53,790 |
| Total | 92,754 (100.0%) | $58,925 |
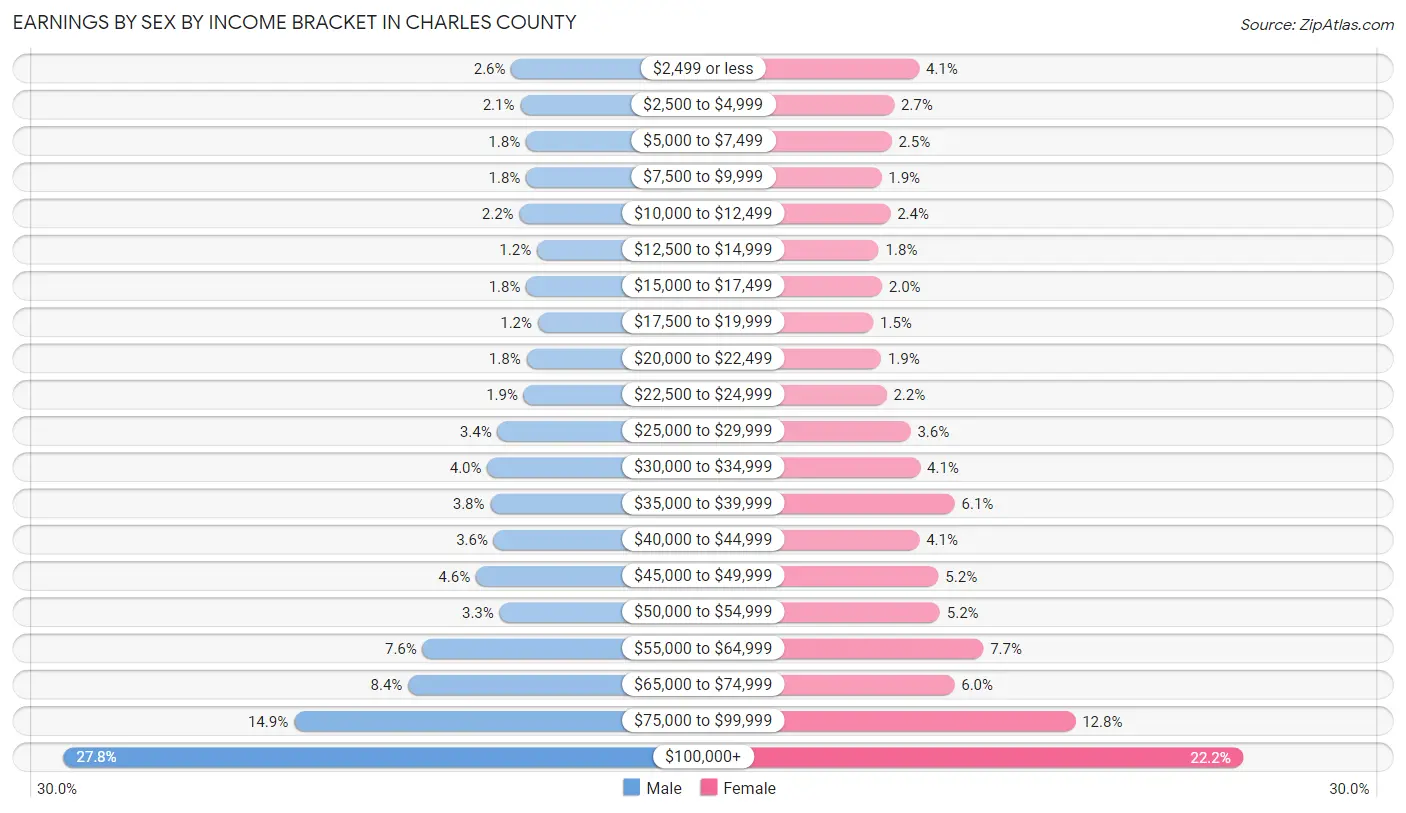
Earnings by Sex by Income Bracket in Charles County
The most common earnings brackets in Charles County are $100,000+ for men (13,012 | 27.8%) and $100,000+ for women (10,223 | 22.2%).
| Income | Male | Female |
| $2,499 or less | 1,236 (2.6%) | 1,866 (4.1%) |
| $2,500 to $4,999 | 999 (2.1%) | 1,219 (2.6%) |
| $5,000 to $7,499 | 852 (1.8%) | 1,156 (2.5%) |
| $7,500 to $9,999 | 848 (1.8%) | 891 (1.9%) |
| $10,000 to $12,499 | 1,023 (2.2%) | 1,122 (2.4%) |
| $12,500 to $14,999 | 561 (1.2%) | 821 (1.8%) |
| $15,000 to $17,499 | 840 (1.8%) | 905 (2.0%) |
| $17,500 to $19,999 | 538 (1.1%) | 682 (1.5%) |
| $20,000 to $22,499 | 839 (1.8%) | 882 (1.9%) |
| $22,500 to $24,999 | 907 (1.9%) | 1,026 (2.2%) |
| $25,000 to $29,999 | 1,602 (3.4%) | 1,646 (3.6%) |
| $30,000 to $34,999 | 1,867 (4.0%) | 1,896 (4.1%) |
| $35,000 to $39,999 | 1,787 (3.8%) | 2,788 (6.1%) |
| $40,000 to $44,999 | 1,696 (3.6%) | 1,870 (4.1%) |
| $45,000 to $49,999 | 2,164 (4.6%) | 2,367 (5.1%) |
| $50,000 to $54,999 | 1,544 (3.3%) | 2,404 (5.2%) |
| $55,000 to $64,999 | 3,568 (7.6%) | 3,528 (7.7%) |
| $65,000 to $74,999 | 3,947 (8.4%) | 2,778 (6.0%) |
| $75,000 to $99,999 | 6,950 (14.9%) | 5,904 (12.8%) |
| $100,000+ | 13,012 (27.8%) | 10,223 (22.2%) |
| Total | 46,780 (100.0%) | 45,974 (100.0%) |
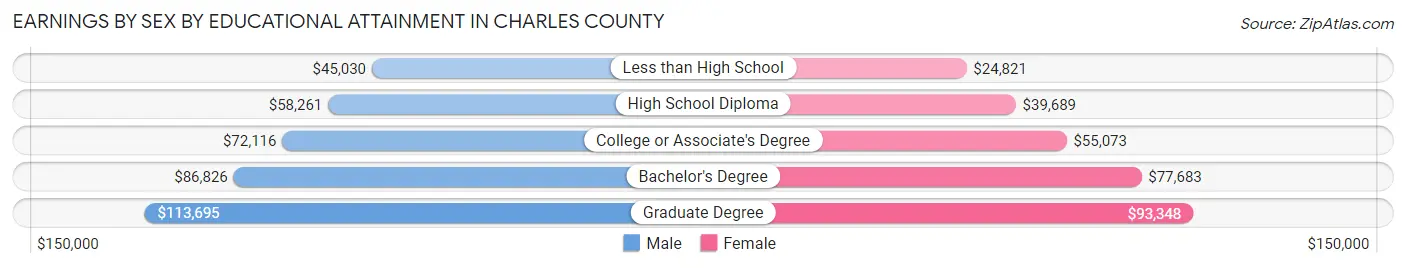
Earnings by Sex by Educational Attainment in Charles County
Average earnings in Charles County are $72,553 for men and $59,998 for women, a difference of 17.3%. Men with an educational attainment of graduate degree enjoy the highest average annual earnings of $113,695, while those with less than high school education earn the least with $45,030. Women with an educational attainment of graduate degree earn the most with the average annual earnings of $93,348, while those with less than high school education have the smallest earnings of $24,821.
| Educational Attainment | Male Income | Female Income |
| Less than High School | $45,030 | $24,821 |
| High School Diploma | $58,261 | $39,689 |
| College or Associate's Degree | $72,116 | $55,073 |
| Bachelor's Degree | $86,826 | $77,683 |
| Graduate Degree | $113,695 | $93,348 |
| Total | $72,553 | $59,998 |
Family Income in Charles County
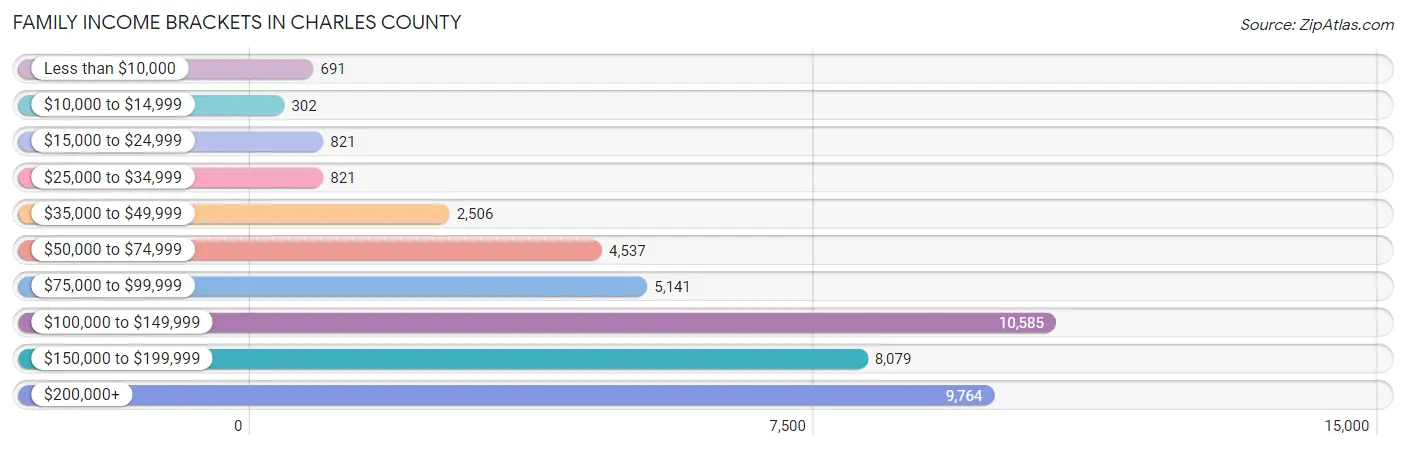
Family Income Brackets in Charles County
According to the Charles County family income data, there are 10,585 families falling into the $100,000 to $149,999 income range, which is the most common income bracket and makes up 24.5% of all families. Conversely, the $10,000 to $14,999 income bracket is the least frequent group with only 302 families (0.7%) belonging to this category.
| Income Bracket | # Families | % Families |
| Less than $10,000 | 691 | 1.6% |
| $10,000 to $14,999 | 302 | 0.7% |
| $15,000 to $24,999 | 821 | 1.9% |
| $25,000 to $34,999 | 821 | 1.9% |
| $35,000 to $49,999 | 2,506 | 5.8% |
| $50,000 to $74,999 | 4,537 | 10.5% |
| $75,000 to $99,999 | 5,141 | 11.9% |
| $100,000 to $149,999 | 10,585 | 24.5% |
| $150,000 to $199,999 | 8,079 | 18.7% |
| $200,000+ | 9,764 | 22.6% |
Family Income by Famaliy Size in Charles County
7+ person families (910 | 2.1%) account for the highest median family income in Charles County with $172,786 per family, while 2-person families (17,648 | 40.8%) have the highest median income of $57,999 per family member.
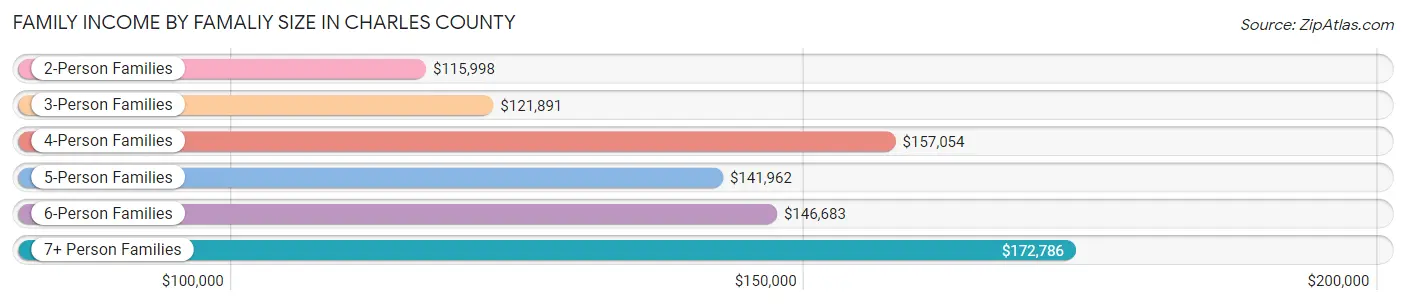
| Income Bracket | # Families | Median Income |
| 2-Person Families | 17,648 (40.8%) | $115,998 |
| 3-Person Families | 11,020 (25.5%) | $121,891 |
| 4-Person Families | 7,672 (17.8%) | $157,054 |
| 5-Person Families | 4,099 (9.5%) | $141,962 |
| 6-Person Families | 1,856 (4.3%) | $146,683 |
| 7+ Person Families | 910 (2.1%) | $172,786 |
| Total | 43,205 (100.0%) | $130,440 |
Family Income by Number of Earners in Charles County
The median family income in Charles County is $130,440, with families comprising 3+ earners (6,402) having the highest median family income of $184,457, while families with no earners (4,043) have the lowest median family income of $78,927, accounting for 14.8% and 9.4% of families, respectively.
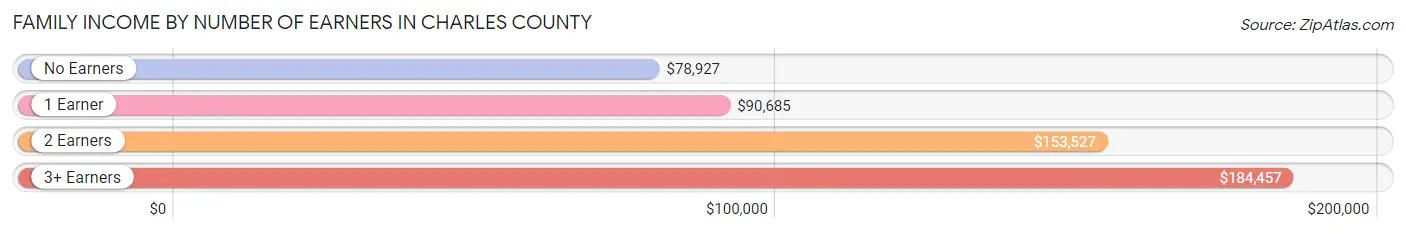
| Number of Earners | # Families | Median Income |
| No Earners | 4,043 (9.4%) | $78,927 |
| 1 Earner | 13,291 (30.8%) | $90,685 |
| 2 Earners | 19,469 (45.1%) | $153,527 |
| 3+ Earners | 6,402 (14.8%) | $184,457 |
| Total | 43,205 (100.0%) | $130,440 |
Household Income in Charles County
Household Income Brackets in Charles County
With 14,328 households falling in the category, the $100,000 to $149,999 income range is the most frequent in Charles County, accounting for 24.2% of all households. In contrast, only 770 households (1.3%) fall into the $10,000 to $14,999 income bracket, making it the least populous group.
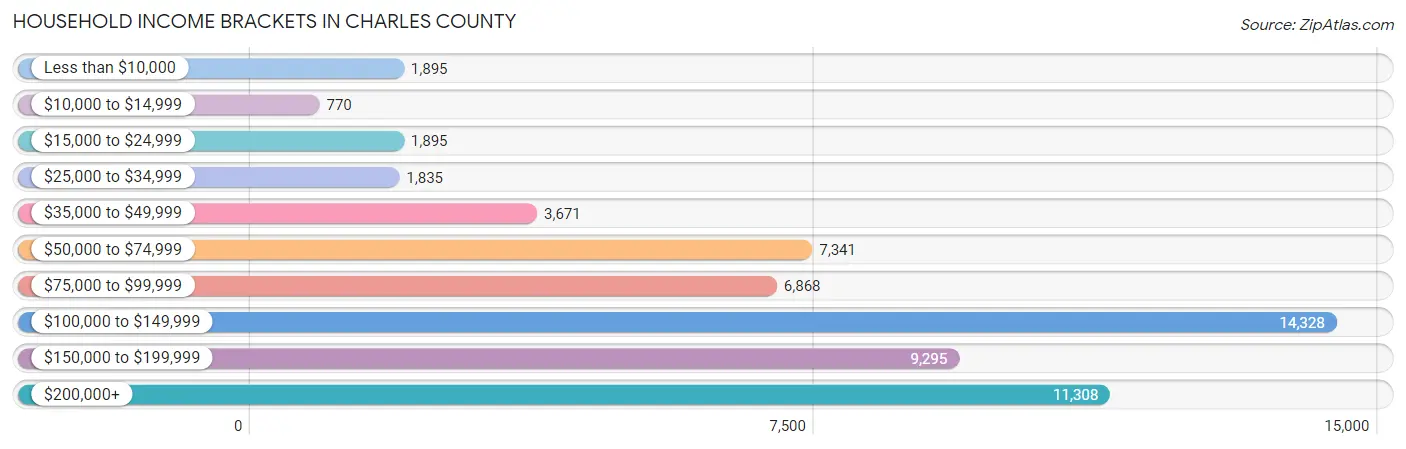
| Income Bracket | # Households | % Households |
| Less than $10,000 | 1,895 | 3.2% |
| $10,000 to $14,999 | 770 | 1.3% |
| $15,000 to $24,999 | 1,895 | 3.2% |
| $25,000 to $34,999 | 1,835 | 3.1% |
| $35,000 to $49,999 | 3,671 | 6.2% |
| $50,000 to $74,999 | 7,341 | 12.4% |
| $75,000 to $99,999 | 6,868 | 11.6% |
| $100,000 to $149,999 | 14,328 | 24.2% |
| $150,000 to $199,999 | 9,295 | 15.7% |
| $200,000+ | 11,308 | 19.1% |
Household Income by Householder Age in Charles County
The median household income in Charles County is $116,882, with the highest median household income of $135,723 found in the 45 to 64 years age bracket for the primary householder. A total of 27,309 households (46.1%) fall into this category. Meanwhile, the 65+ years age bracket for the primary householder has the lowest median household income of $77,964, with 12,243 households (20.7%) in this group.
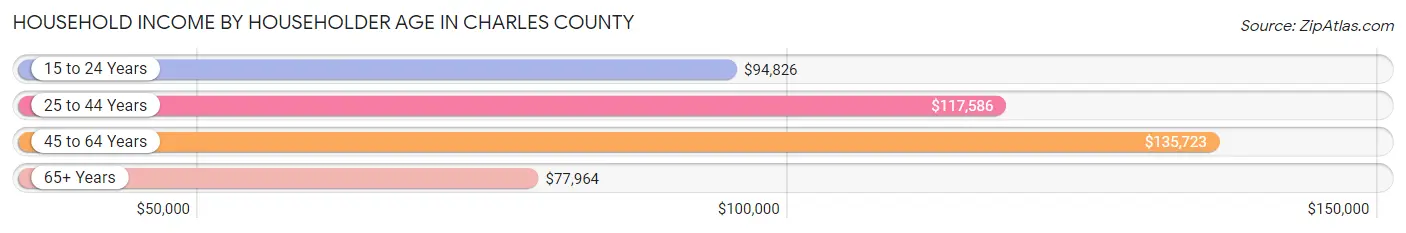
| Income Bracket | # Households | Median Income |
| 15 to 24 Years | 879 (1.5%) | $94,826 |
| 25 to 44 Years | 18,774 (31.7%) | $117,586 |
| 45 to 64 Years | 27,309 (46.1%) | $135,723 |
| 65+ Years | 12,243 (20.7%) | $77,964 |
| Total | 59,205 (100.0%) | $116,882 |
Poverty in Charles County
Income Below Poverty by Sex and Age in Charles County
With 6.2% poverty level for males and 5.5% for females among the residents of Charles County, under 5 year old males and 75 year old and over females are the most vulnerable to poverty, with 504 males (10.6%) and 553 females (11.6%) in their respective age groups living below the poverty level.
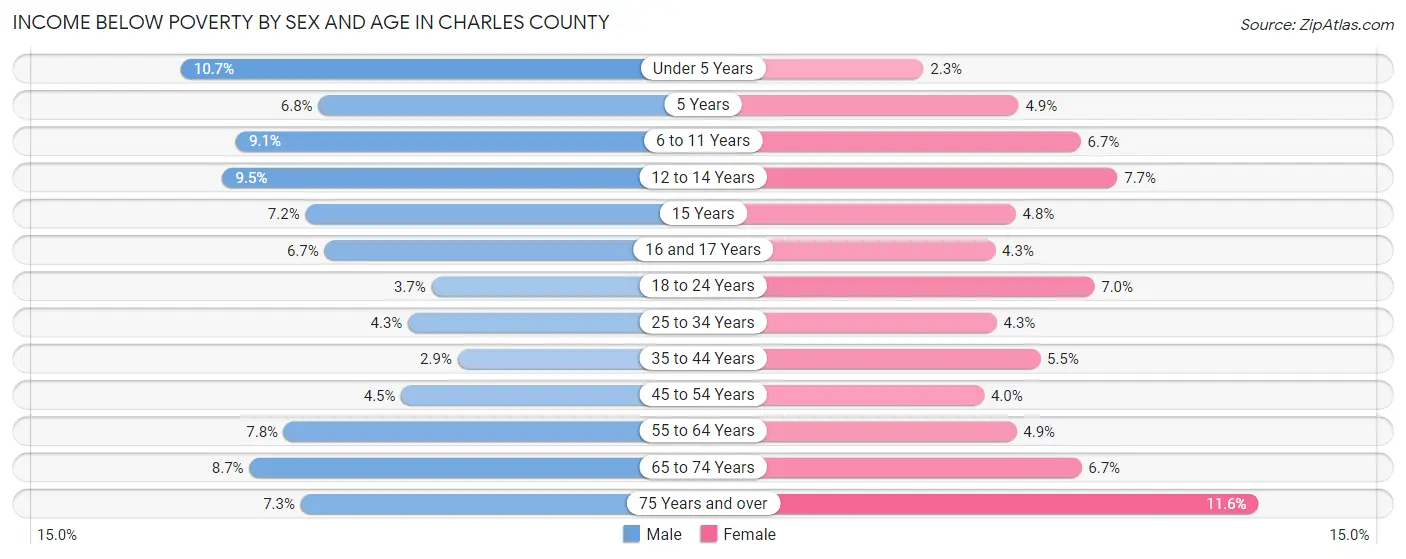
| Age Bracket | Male | Female |
| Under 5 Years | 504 (10.6%) | 109 (2.3%) |
| 5 Years | 51 (6.8%) | 44 (4.9%) |
| 6 to 11 Years | 629 (9.1%) | 455 (6.7%) |
| 12 to 14 Years | 367 (9.5%) | 249 (7.7%) |
| 15 Years | 91 (7.2%) | 58 (4.8%) |
| 16 and 17 Years | 149 (6.7%) | 114 (4.3%) |
| 18 to 24 Years | 271 (3.7%) | 502 (7.0%) |
| 25 to 34 Years | 446 (4.3%) | 446 (4.3%) |
| 35 to 44 Years | 302 (2.9%) | 654 (5.5%) |
| 45 to 54 Years | 518 (4.5%) | 512 (4.0%) |
| 55 to 64 Years | 881 (7.8%) | 583 (4.9%) |
| 65 to 74 Years | 522 (8.7%) | 479 (6.7%) |
| 75 Years and over | 240 (7.3%) | 553 (11.6%) |
| Total | 4,971 (6.2%) | 4,758 (5.5%) |
Income Above Poverty by Sex and Age in Charles County
According to the poverty statistics in Charles County, males aged 35 to 44 years and females aged under 5 years are the age groups that are most secure financially, with 97.1% of males and 97.7% of females in these age groups living above the poverty line.
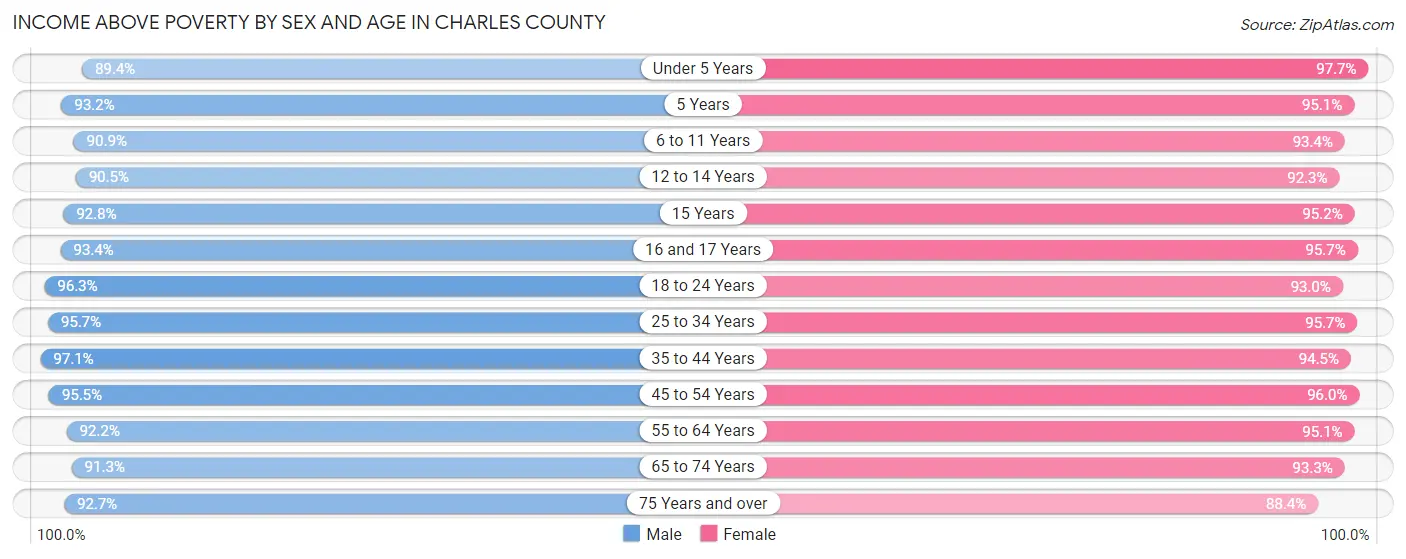
| Age Bracket | Male | Female |
| Under 5 Years | 4,227 (89.3%) | 4,701 (97.7%) |
| 5 Years | 697 (93.2%) | 850 (95.1%) |
| 6 to 11 Years | 6,275 (90.9%) | 6,383 (93.3%) |
| 12 to 14 Years | 3,502 (90.5%) | 2,999 (92.3%) |
| 15 Years | 1,177 (92.8%) | 1,141 (95.2%) |
| 16 and 17 Years | 2,093 (93.3%) | 2,554 (95.7%) |
| 18 to 24 Years | 7,111 (96.3%) | 6,640 (93.0%) |
| 25 to 34 Years | 9,879 (95.7%) | 9,907 (95.7%) |
| 35 to 44 Years | 9,962 (97.1%) | 11,184 (94.5%) |
| 45 to 54 Years | 10,975 (95.5%) | 12,432 (96.0%) |
| 55 to 64 Years | 10,436 (92.2%) | 11,401 (95.1%) |
| 65 to 74 Years | 5,452 (91.3%) | 6,704 (93.3%) |
| 75 Years and over | 3,042 (92.7%) | 4,215 (88.4%) |
| Total | 74,828 (93.8%) | 81,111 (94.5%) |
Income Below Poverty Among Married-Couple Families in Charles County
The poverty statistics for married-couple families in Charles County show that 2.1% or 643 of the total 30,828 families live below the poverty line. Families with 3 or 4 children have the highest poverty rate of 7.4%, comprising of 242 families. On the other hand, families with 1 or 2 children have the lowest poverty rate of 0.7%, which includes 76 families.
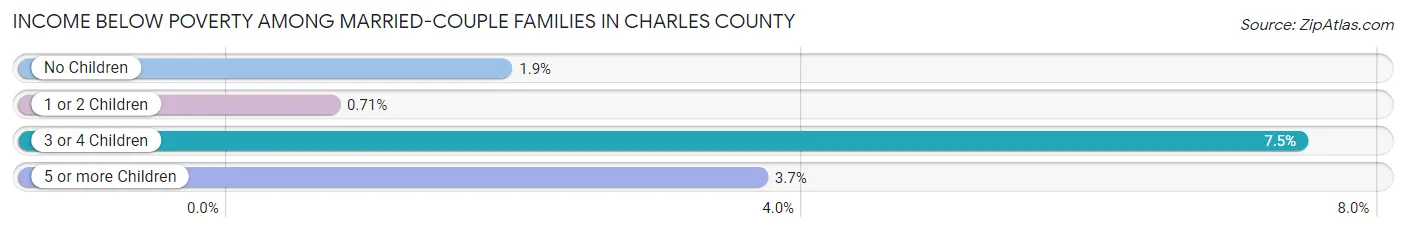
| Children | Above Poverty | Below Poverty |
| No Children | 16,240 (98.1%) | 316 (1.9%) |
| 1 or 2 Children | 10,704 (99.3%) | 76 (0.7%) |
| 3 or 4 Children | 3,006 (92.5%) | 242 (7.4%) |
| 5 or more Children | 235 (96.3%) | 9 (3.7%) |
| Total | 30,185 (97.9%) | 643 (2.1%) |
Income Below Poverty Among Single-Parent Households in Charles County
According to the poverty data in Charles County, 8.5% or 250 single-father households and 7.7% or 726 single-mother households are living below the poverty line. Among single-father households, those with 3 or 4 children have the highest poverty rate, with 124 households (43.4%) experiencing poverty. Likewise, among single-mother households, those with 3 or 4 children have the highest poverty rate, with 109 households (20.0%) falling below the poverty line.
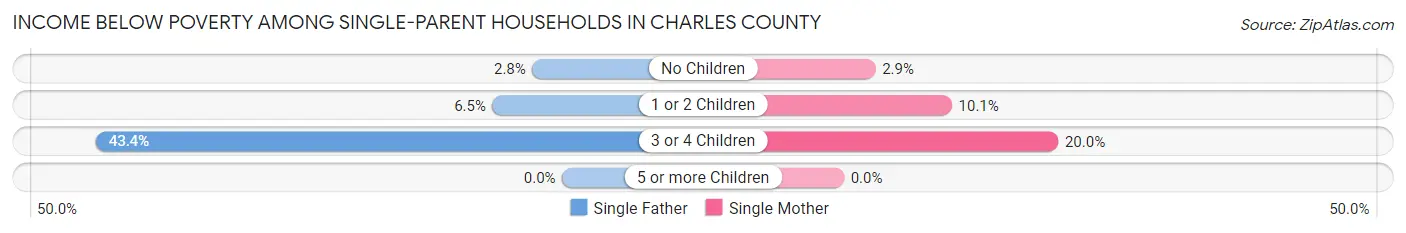
| Children | Single Father | Single Mother |
| No Children | 35 (2.8%) | 114 (2.9%) |
| 1 or 2 Children | 91 (6.5%) | 503 (10.1%) |
| 3 or 4 Children | 124 (43.4%) | 109 (20.0%) |
| 5 or more Children | 0 (0.0%) | 0 (0.0%) |
| Total | 250 (8.5%) | 726 (7.7%) |
Income Below Poverty Among Married-Couple vs Single-Parent Households in Charles County
The poverty data for Charles County shows that 643 of the married-couple family households (2.1%) and 976 of the single-parent households (7.9%) are living below the poverty level. Within the married-couple family households, those with 3 or 4 children have the highest poverty rate, with 242 households (7.4%) falling below the poverty line. Among the single-parent households, those with 3 or 4 children have the highest poverty rate, with 233 household (28.0%) living below poverty.
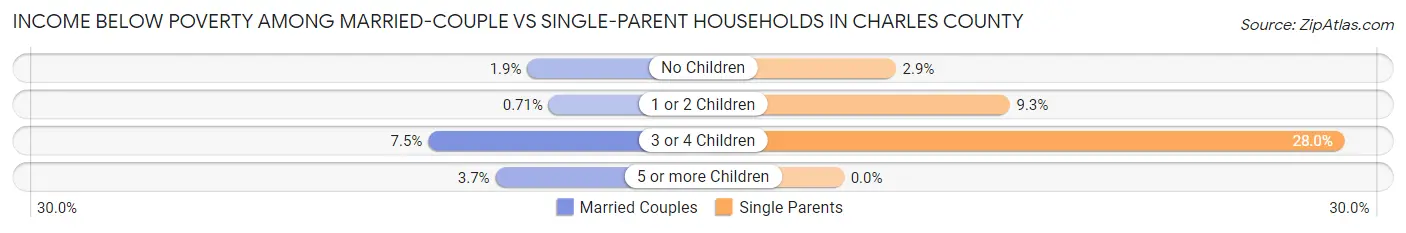
| Children | Married-Couple Families | Single-Parent Households |
| No Children | 316 (1.9%) | 149 (2.9%) |
| 1 or 2 Children | 76 (0.7%) | 594 (9.3%) |
| 3 or 4 Children | 242 (7.4%) | 233 (28.0%) |
| 5 or more Children | 9 (3.7%) | 0 (0.0%) |
| Total | 643 (2.1%) | 976 (7.9%) |
Employment Characteristics in Charles County
Employment by Class of Employer in Charles County
Among the 84,812 employed individuals in Charles County, private company employees (42,783 | 50.4%), federal government employees (20,064 | 23.7%), and local government employees (8,259 | 9.7%) make up the most common classes of employment.
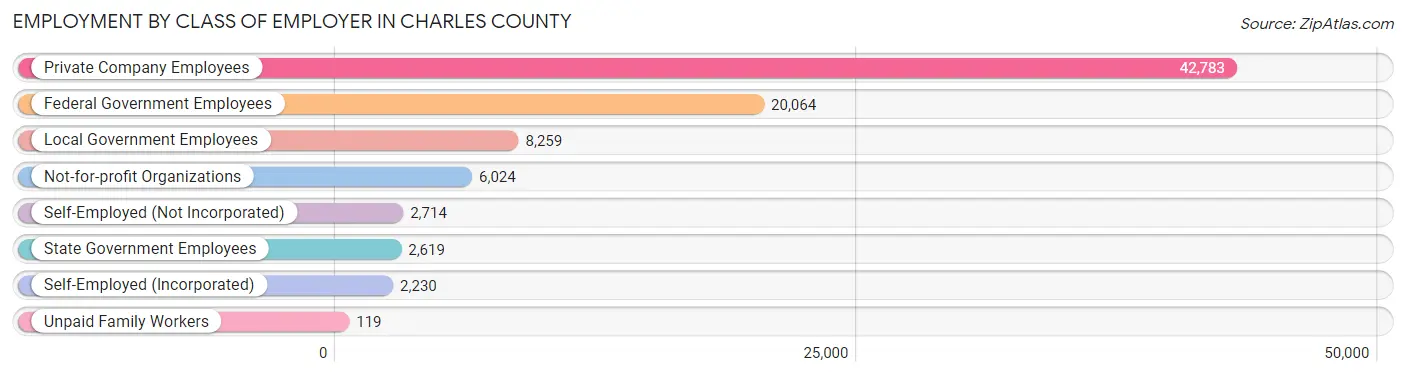
| Employer Class | # Employees | % Employees |
| Private Company Employees | 42,783 | 50.4% |
| Self-Employed (Incorporated) | 2,230 | 2.6% |
| Self-Employed (Not Incorporated) | 2,714 | 3.2% |
| Not-for-profit Organizations | 6,024 | 7.1% |
| Local Government Employees | 8,259 | 9.7% |
| State Government Employees | 2,619 | 3.1% |
| Federal Government Employees | 20,064 | 23.7% |
| Unpaid Family Workers | 119 | 0.1% |
| Total | 84,812 | 100.0% |
Employment Status by Age in Charles County
According to the labor force statistics for Charles County, out of the total population over 16 years of age (132,209), 68.8% or 90,960 individuals are in the labor force, with 4.9% or 4,457 of them unemployed. The age group with the highest labor force participation rate is 35 to 44 years, with 88.8% or 19,766 individuals in the labor force. Within the labor force, the 16 to 19 years age range has the highest percentage of unemployed individuals, with 23.6% or 719 of them being unemployed.
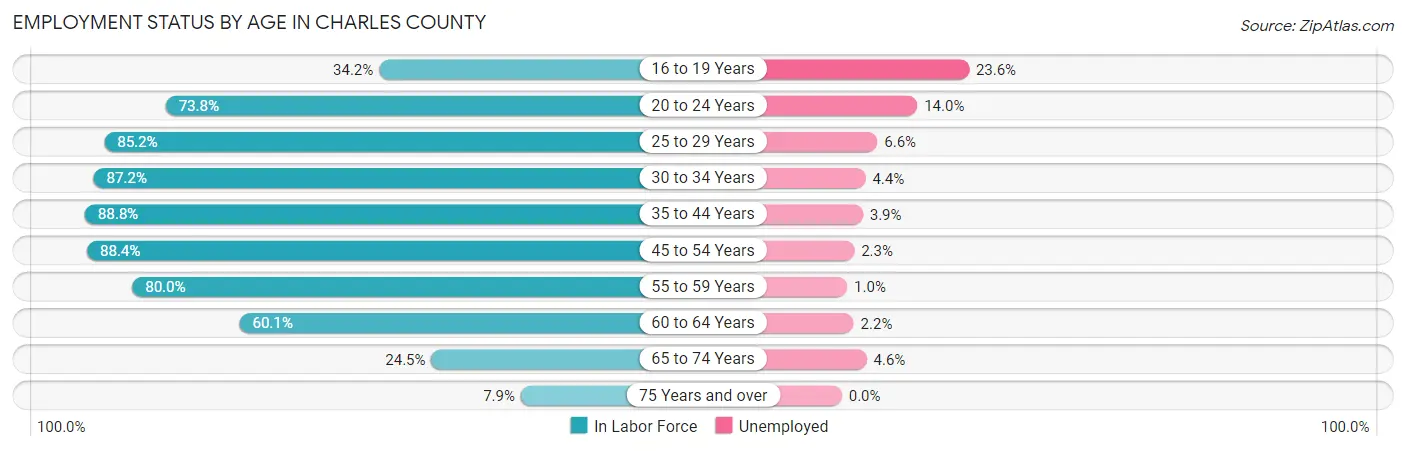
| Age Bracket | In Labor Force | Unemployed |
| 16 to 19 Years | 3,045 (34.2%) | 719 (23.6%) |
| 20 to 24 Years | 7,891 (73.8%) | 1,105 (14.0%) |
| 25 to 29 Years | 8,722 (85.2%) | 576 (6.6%) |
| 30 to 34 Years | 9,252 (87.2%) | 407 (4.4%) |
| 35 to 44 Years | 19,766 (88.8%) | 771 (3.9%) |
| 45 to 54 Years | 21,742 (88.4%) | 500 (2.3%) |
| 55 to 59 Years | 10,251 (80.0%) | 103 (1.0%) |
| 60 to 64 Years | 6,342 (60.1%) | 140 (2.2%) |
| 65 to 74 Years | 3,235 (24.5%) | 149 (4.6%) |
| 75 Years and over | 659 (7.9%) | 0 (0.0%) |
| Total | 90,960 (68.8%) | 4,457 (4.9%) |
Employment Status by Educational Attainment in Charles County
According to labor force statistics for Charles County, 83.5% of individuals (76,042) out of the total population between 25 and 64 years of age (91,068) are in the labor force, with 3.2% or 2,433 of them being unemployed. The group with the highest labor force participation rate are those with the educational attainment of bachelor's degree or higher, with 91.2% or 26,994 individuals in the labor force. Within the labor force, individuals with less than high school education have the highest percentage of unemployment, with 7.0% or 174 of them being unemployed.
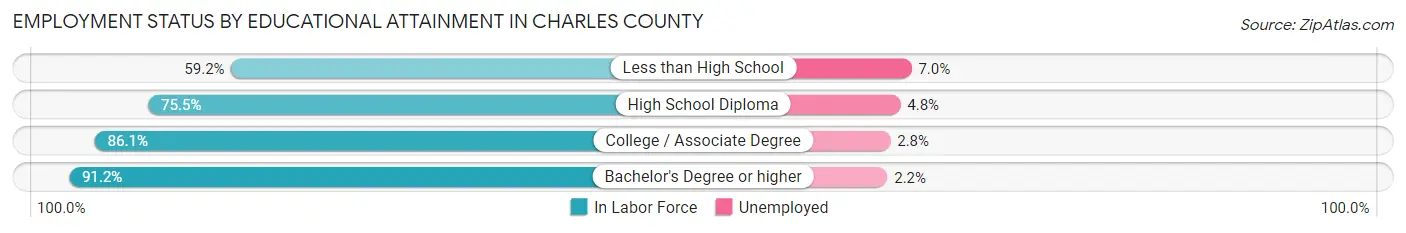
| Educational Attainment | In Labor Force | Unemployed |
| Less than High School | 2,479 (59.2%) | 293 (7.0%) |
| High School Diploma | 19,333 (75.5%) | 1,229 (4.8%) |
| College / Associate Degree | 27,272 (86.1%) | 887 (2.8%) |
| Bachelor's Degree or higher | 26,994 (91.2%) | 651 (2.2%) |
| Total | 76,042 (83.5%) | 2,914 (3.2%) |
Employment Occupations by Sex in Charles County
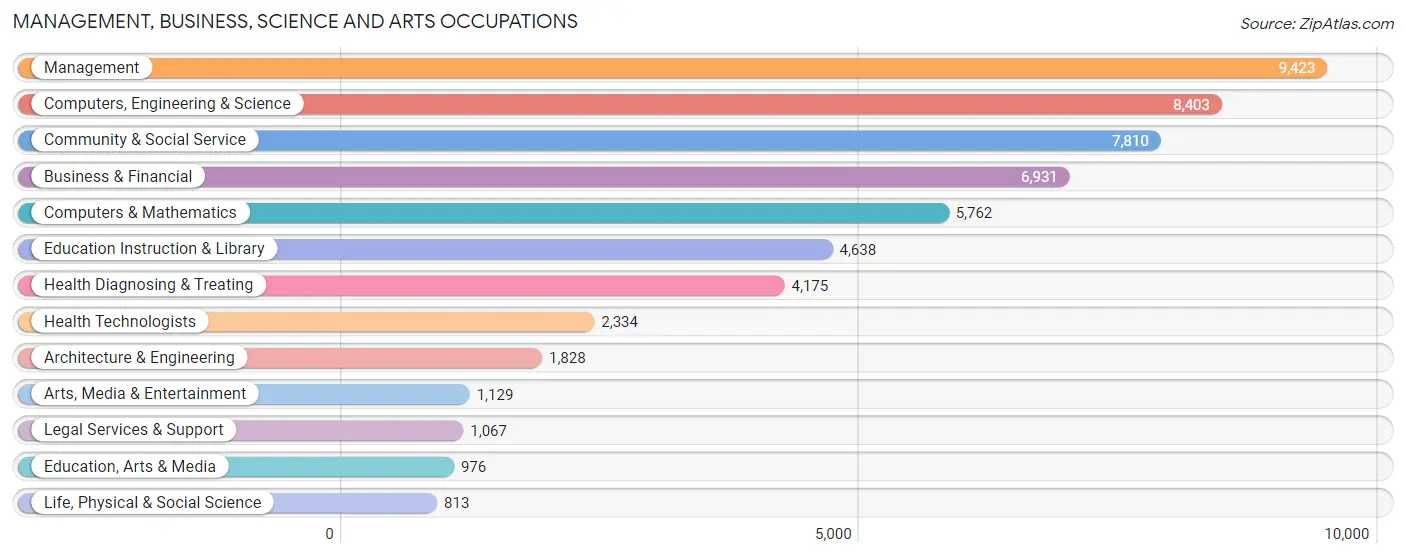
Management, Business, Science and Arts Occupations
The most common Management, Business, Science and Arts occupations in Charles County are Management (9,423 | 11.1%), Computers, Engineering & Science (8,403 | 9.9%), Community & Social Service (7,810 | 9.2%), Business & Financial (6,931 | 8.2%), and Computers & Mathematics (5,762 | 6.8%).
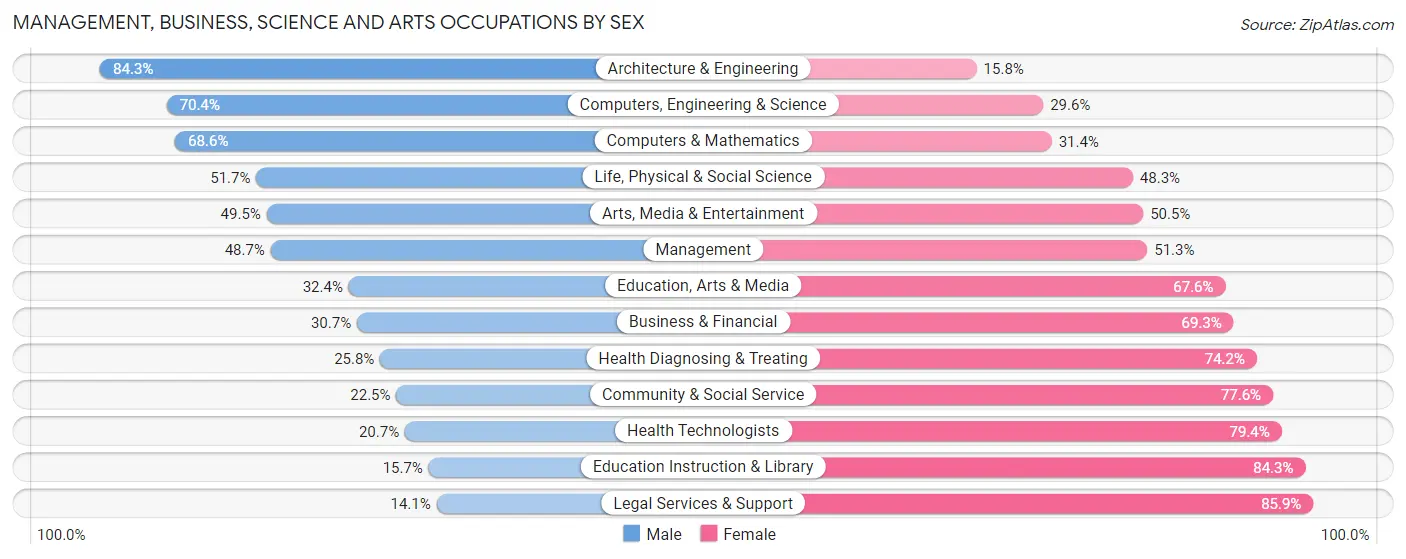
Management, Business, Science and Arts Occupations by Sex
Within the Management, Business, Science and Arts occupations in Charles County, the most male-oriented occupations are Architecture & Engineering (84.3%), Computers, Engineering & Science (70.4%), and Computers & Mathematics (68.6%), while the most female-oriented occupations are Legal Services & Support (85.9%), Education Instruction & Library (84.3%), and Health Technologists (79.3%).
| Occupation | Male | Female |
| Management | 4,585 (48.7%) | 4,838 (51.3%) |
| Business & Financial | 2,125 (30.7%) | 4,806 (69.3%) |
| Computers, Engineering & Science | 5,913 (70.4%) | 2,490 (29.6%) |
| Computers & Mathematics | 3,953 (68.6%) | 1,809 (31.4%) |
| Architecture & Engineering | 1,540 (84.3%) | 288 (15.8%) |
| Life, Physical & Social Science | 420 (51.7%) | 393 (48.3%) |
| Community & Social Service | 1,753 (22.5%) | 6,057 (77.5%) |
| Education, Arts & Media | 316 (32.4%) | 660 (67.6%) |
| Legal Services & Support | 150 (14.1%) | 917 (85.9%) |
| Education Instruction & Library | 728 (15.7%) | 3,910 (84.3%) |
| Arts, Media & Entertainment | 559 (49.5%) | 570 (50.5%) |
| Health Diagnosing & Treating | 1,078 (25.8%) | 3,097 (74.2%) |
| Health Technologists | 482 (20.6%) | 1,852 (79.3%) |
| Total (Category) | 15,454 (42.1%) | 21,288 (57.9%) |
| Total (Overall) | 42,057 (49.7%) | 42,585 (50.3%) |
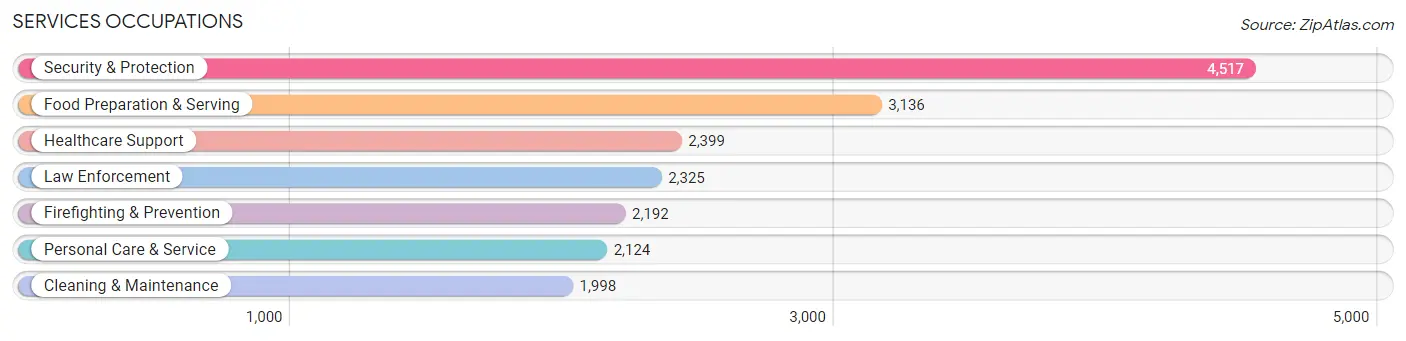
Services Occupations
The most common Services occupations in Charles County are Security & Protection (4,517 | 5.3%), Food Preparation & Serving (3,136 | 3.7%), Healthcare Support (2,399 | 2.8%), Law Enforcement (2,325 | 2.8%), and Firefighting & Prevention (2,192 | 2.6%).
Services Occupations by Sex
Within the Services occupations in Charles County, the most male-oriented occupations are Firefighting & Prevention (79.1%), Security & Protection (75.3%), and Cleaning & Maintenance (72.5%), while the most female-oriented occupations are Healthcare Support (90.1%), Personal Care & Service (66.0%), and Food Preparation & Serving (57.8%).

| Occupation | Male | Female |
| Healthcare Support | 237 (9.9%) | 2,162 (90.1%) |
| Security & Protection | 3,401 (75.3%) | 1,116 (24.7%) |
| Firefighting & Prevention | 1,733 (79.1%) | 459 (20.9%) |
| Law Enforcement | 1,668 (71.7%) | 657 (28.3%) |
| Food Preparation & Serving | 1,324 (42.2%) | 1,812 (57.8%) |
| Cleaning & Maintenance | 1,449 (72.5%) | 549 (27.5%) |
| Personal Care & Service | 723 (34.0%) | 1,401 (66.0%) |
| Total (Category) | 7,134 (50.3%) | 7,040 (49.7%) |
| Total (Overall) | 42,057 (49.7%) | 42,585 (50.3%) |
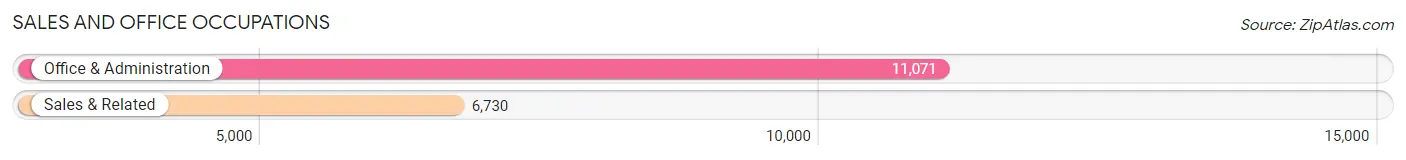
Sales and Office Occupations
The most common Sales and Office occupations in Charles County are Office & Administration (11,071 | 13.1%), and Sales & Related (6,730 | 8.0%).
Sales and Office Occupations by Sex
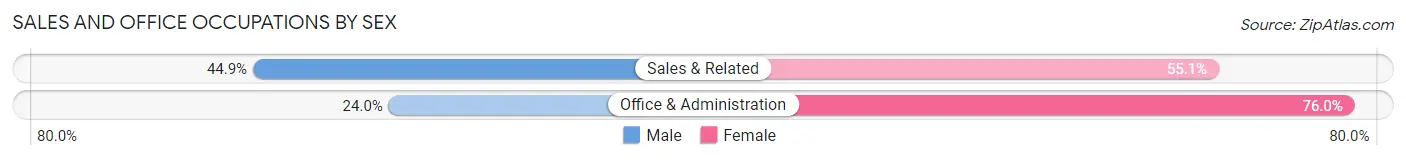
| Occupation | Male | Female |
| Sales & Related | 3,020 (44.9%) | 3,710 (55.1%) |
| Office & Administration | 2,656 (24.0%) | 8,415 (76.0%) |
| Total (Category) | 5,676 (31.9%) | 12,125 (68.1%) |
| Total (Overall) | 42,057 (49.7%) | 42,585 (50.3%) |
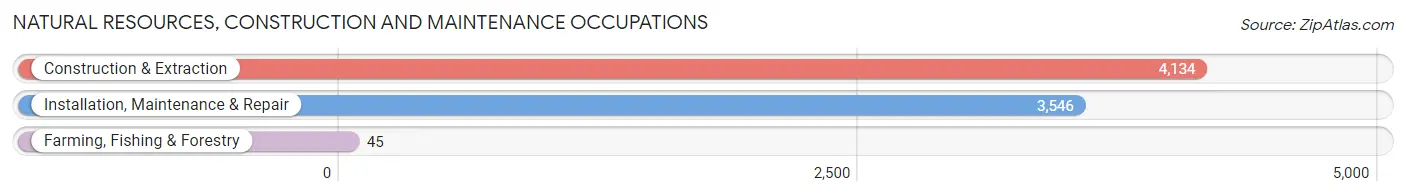
Natural Resources, Construction and Maintenance Occupations
The most common Natural Resources, Construction and Maintenance occupations in Charles County are Construction & Extraction (4,134 | 4.9%), Installation, Maintenance & Repair (3,546 | 4.2%), and Farming, Fishing & Forestry (45 | 0.1%).
Natural Resources, Construction and Maintenance Occupations by Sex
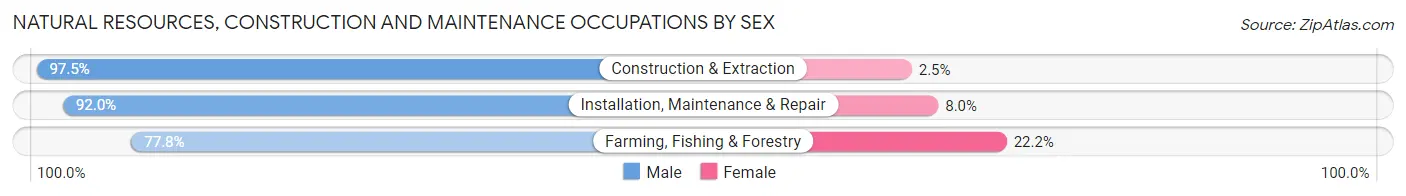
| Occupation | Male | Female |
| Farming, Fishing & Forestry | 35 (77.8%) | 10 (22.2%) |
| Construction & Extraction | 4,032 (97.5%) | 102 (2.5%) |
| Installation, Maintenance & Repair | 3,263 (92.0%) | 283 (8.0%) |
| Total (Category) | 7,330 (94.9%) | 395 (5.1%) |
| Total (Overall) | 42,057 (49.7%) | 42,585 (50.3%) |
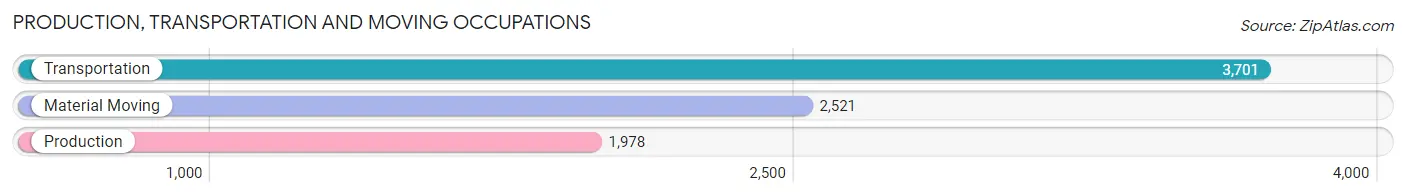
Production, Transportation and Moving Occupations
The most common Production, Transportation and Moving occupations in Charles County are Transportation (3,701 | 4.4%), Material Moving (2,521 | 3.0%), and Production (1,978 | 2.3%).
Production, Transportation and Moving Occupations by Sex
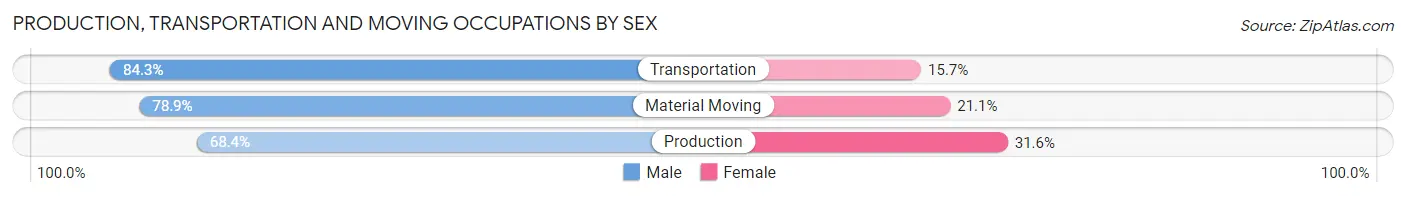
| Occupation | Male | Female |
| Production | 1,353 (68.4%) | 625 (31.6%) |
| Transportation | 3,120 (84.3%) | 581 (15.7%) |
| Material Moving | 1,990 (78.9%) | 531 (21.1%) |
| Total (Category) | 6,463 (78.8%) | 1,737 (21.2%) |
| Total (Overall) | 42,057 (49.7%) | 42,585 (50.3%) |
Employment Industries by Sex in Charles County
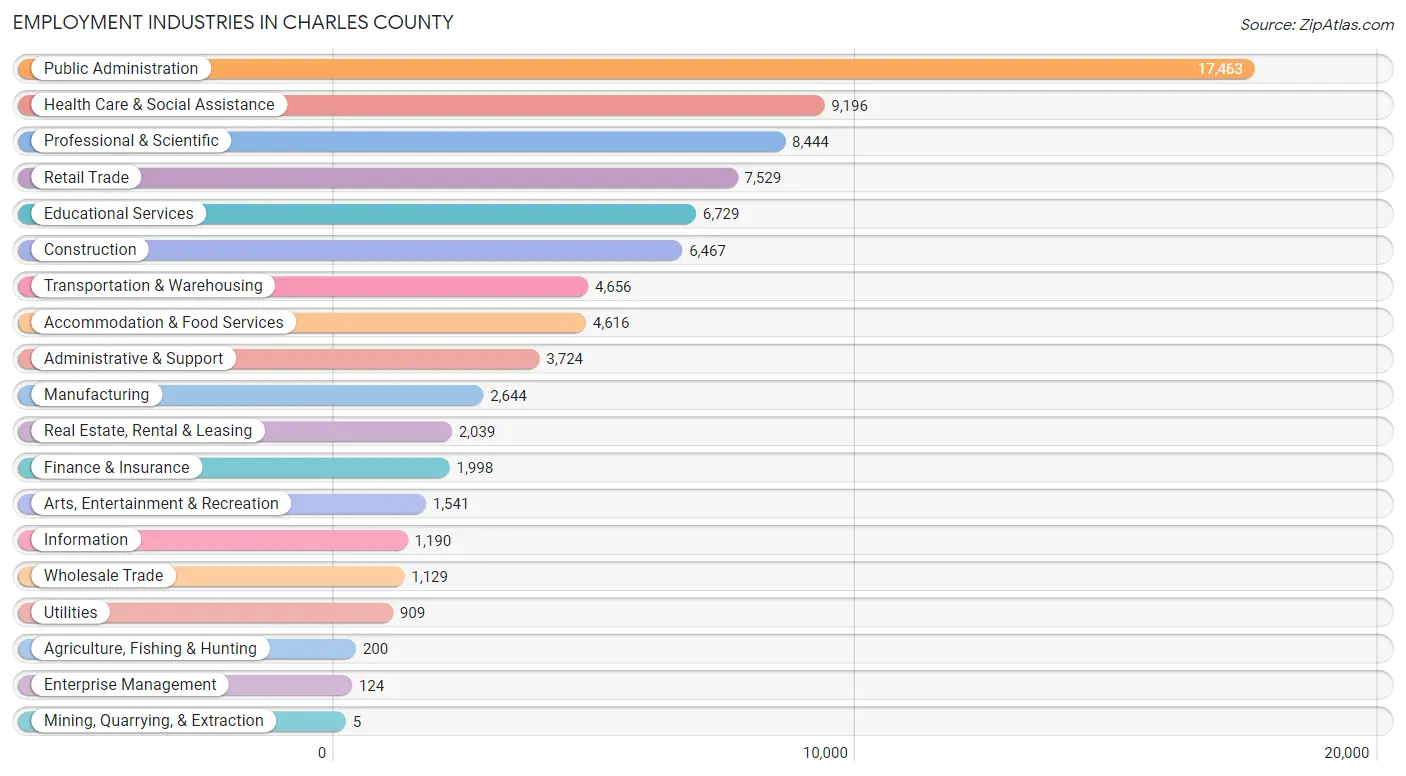
Employment Industries in Charles County
The major employment industries in Charles County include Public Administration (17,463 | 20.6%), Health Care & Social Assistance (9,196 | 10.9%), Professional & Scientific (8,444 | 10.0%), Retail Trade (7,529 | 8.9%), and Educational Services (6,729 | 8.0%).
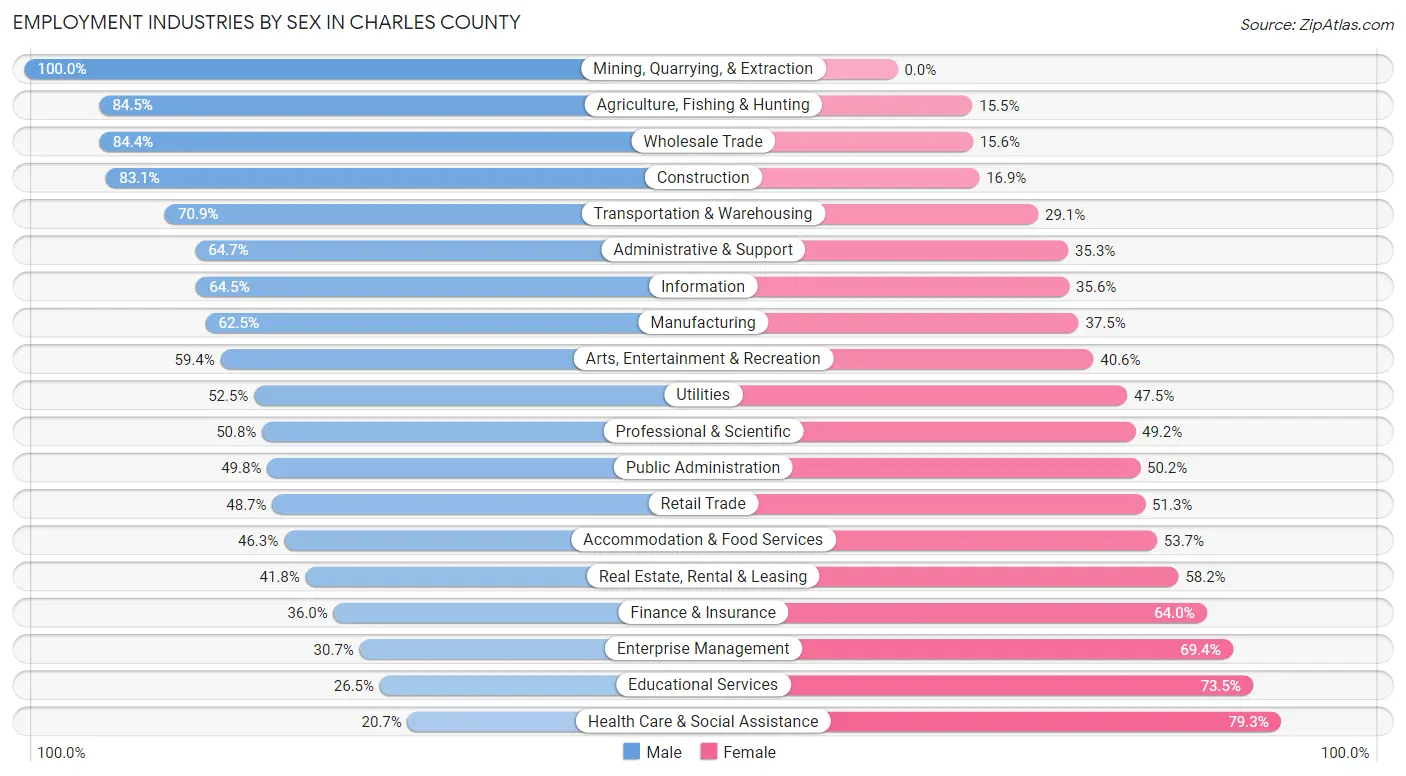
Employment Industries by Sex in Charles County
The Charles County industries that see more men than women are Mining, Quarrying, & Extraction (100.0%), Agriculture, Fishing & Hunting (84.5%), and Wholesale Trade (84.4%), whereas the industries that tend to have a higher number of women are Health Care & Social Assistance (79.3%), Educational Services (73.5%), and Enterprise Management (69.4%).
| Industry | Male | Female |
| Agriculture, Fishing & Hunting | 169 (84.5%) | 31 (15.5%) |
| Mining, Quarrying, & Extraction | 5 (100.0%) | 0 (0.0%) |
| Construction | 5,372 (83.1%) | 1,095 (16.9%) |
| Manufacturing | 1,653 (62.5%) | 991 (37.5%) |
| Wholesale Trade | 953 (84.4%) | 176 (15.6%) |
| Retail Trade | 3,668 (48.7%) | 3,861 (51.3%) |
| Transportation & Warehousing | 3,301 (70.9%) | 1,355 (29.1%) |
| Utilities | 477 (52.5%) | 432 (47.5%) |
| Information | 767 (64.4%) | 423 (35.5%) |
| Finance & Insurance | 720 (36.0%) | 1,278 (64.0%) |
| Real Estate, Rental & Leasing | 853 (41.8%) | 1,186 (58.2%) |
| Professional & Scientific | 4,291 (50.8%) | 4,153 (49.2%) |
| Enterprise Management | 38 (30.6%) | 86 (69.4%) |
| Administrative & Support | 2,408 (64.7%) | 1,316 (35.3%) |
| Educational Services | 1,781 (26.5%) | 4,948 (73.5%) |
| Health Care & Social Assistance | 1,905 (20.7%) | 7,291 (79.3%) |
| Arts, Entertainment & Recreation | 916 (59.4%) | 625 (40.6%) |
| Accommodation & Food Services | 2,137 (46.3%) | 2,479 (53.7%) |
| Public Administration | 8,693 (49.8%) | 8,770 (50.2%) |
| Total | 42,057 (49.7%) | 42,585 (50.3%) |
Education in Charles County
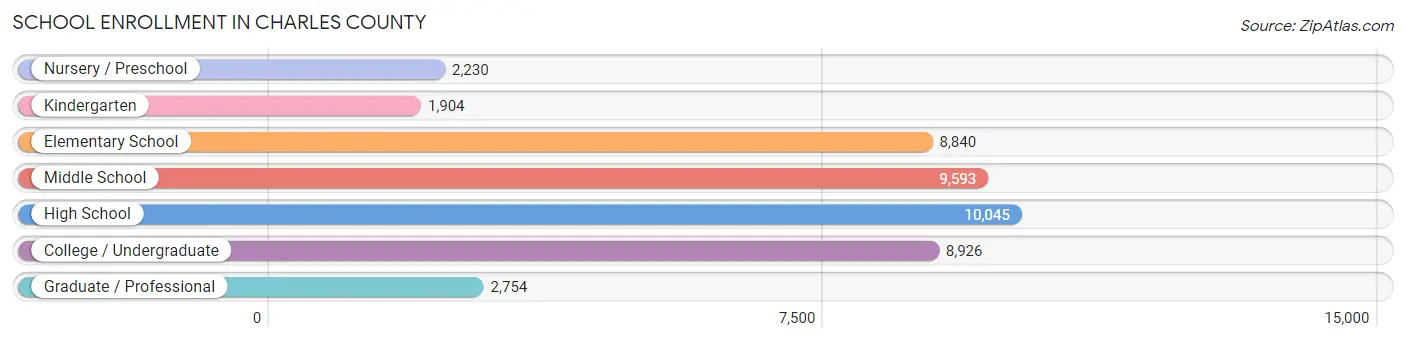
School Enrollment in Charles County
The most common levels of schooling among the 44,292 students in Charles County are high school (10,045 | 22.7%), middle school (9,593 | 21.7%), and college / undergraduate (8,926 | 20.2%).
| School Level | # Students | % Students |
| Nursery / Preschool | 2,230 | 5.0% |
| Kindergarten | 1,904 | 4.3% |
| Elementary School | 8,840 | 20.0% |
| Middle School | 9,593 | 21.7% |
| High School | 10,045 | 22.7% |
| College / Undergraduate | 8,926 | 20.2% |
| Graduate / Professional | 2,754 | 6.2% |
| Total | 44,292 | 100.0% |
School Enrollment by Age by Funding Source in Charles County
Out of a total of 44,292 students who are enrolled in schools in Charles County, 7,087 (16.0%) attend a private institution, while the remaining 37,205 (84.0%) are enrolled in public schools. The age group of 3 to 4 year olds has the highest likelihood of being enrolled in private schools, with 592 (32.9% in the age bracket) enrolled. Conversely, the age group of 18 to 19 year olds has the lowest likelihood of being enrolled in a private school, with 2,568 (94.1% in the age bracket) attending a public institution.
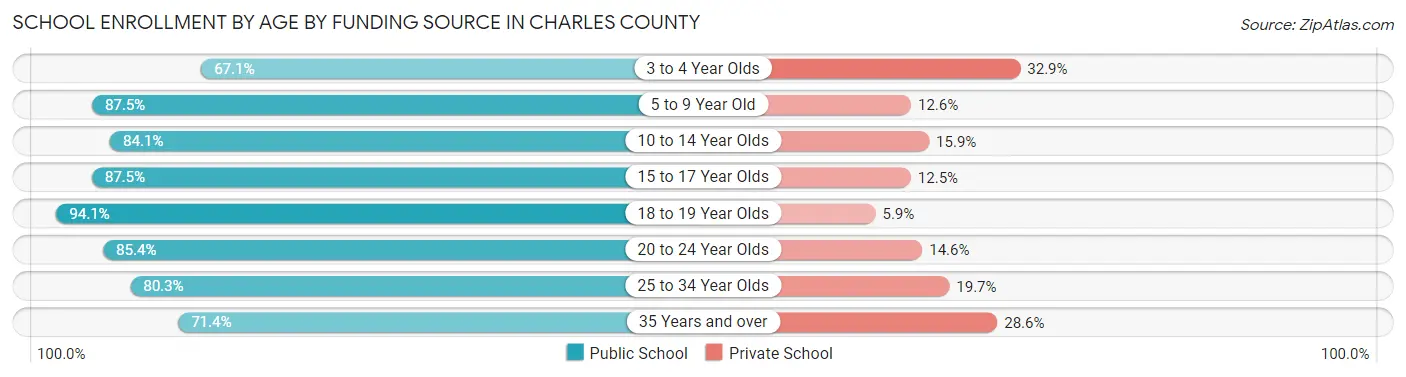
| Age Bracket | Public School | Private School |
| 3 to 4 Year Olds | 1,207 (67.1%) | 592 (32.9%) |
| 5 to 9 Year Old | 8,845 (87.5%) | 1,269 (12.6%) |
| 10 to 14 Year Olds | 9,852 (84.1%) | 1,865 (15.9%) |
| 15 to 17 Year Olds | 6,268 (87.5%) | 897 (12.5%) |
| 18 to 19 Year Olds | 2,568 (94.1%) | 162 (5.9%) |
| 20 to 24 Year Olds | 2,903 (85.4%) | 498 (14.6%) |
| 25 to 34 Year Olds | 2,863 (80.3%) | 702 (19.7%) |
| 35 Years and over | 2,713 (71.4%) | 1,088 (28.6%) |
| Total | 37,205 (84.0%) | 7,087 (16.0%) |
Educational Attainment by Field of Study in Charles County
Business (9,298 | 24.7%), education (3,922 | 10.4%), arts & humanities (3,463 | 9.2%), science & technology (3,112 | 8.3%), and social sciences (3,104 | 8.2%) are the most common fields of study among 37,675 individuals in Charles County who have obtained a bachelor's degree or higher.
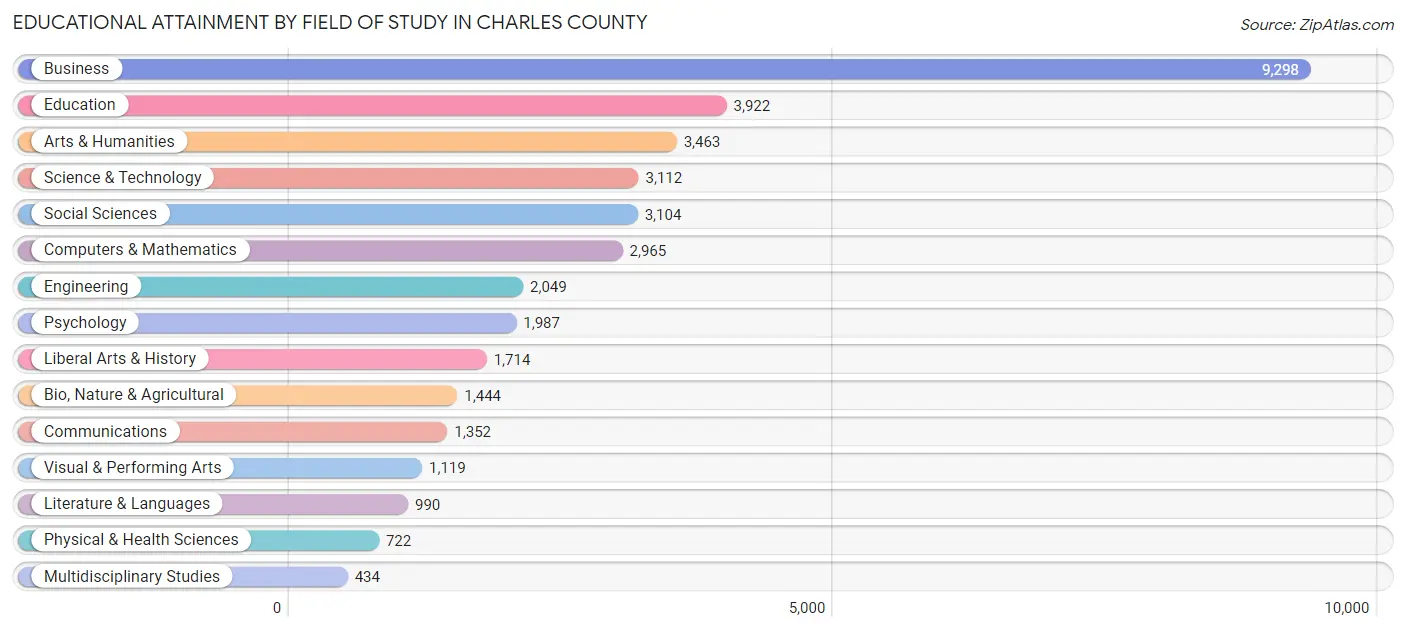
| Field of Study | # Graduates | % Graduates |
| Computers & Mathematics | 2,965 | 7.9% |
| Bio, Nature & Agricultural | 1,444 | 3.8% |
| Physical & Health Sciences | 722 | 1.9% |
| Psychology | 1,987 | 5.3% |
| Social Sciences | 3,104 | 8.2% |
| Engineering | 2,049 | 5.4% |
| Multidisciplinary Studies | 434 | 1.1% |
| Science & Technology | 3,112 | 8.3% |
| Business | 9,298 | 24.7% |
| Education | 3,922 | 10.4% |
| Literature & Languages | 990 | 2.6% |
| Liberal Arts & History | 1,714 | 4.5% |
| Visual & Performing Arts | 1,119 | 3.0% |
| Communications | 1,352 | 3.6% |
| Arts & Humanities | 3,463 | 9.2% |
| Total | 37,675 | 100.0% |
Transportation & Commute in Charles County
Vehicle Availability by Sex in Charles County
The most prevalent vehicle ownership categories in Charles County are males with 2 vehicles (17,958, accounting for 41.9%) and females with 2 vehicles (16,217, making up 42.9%).
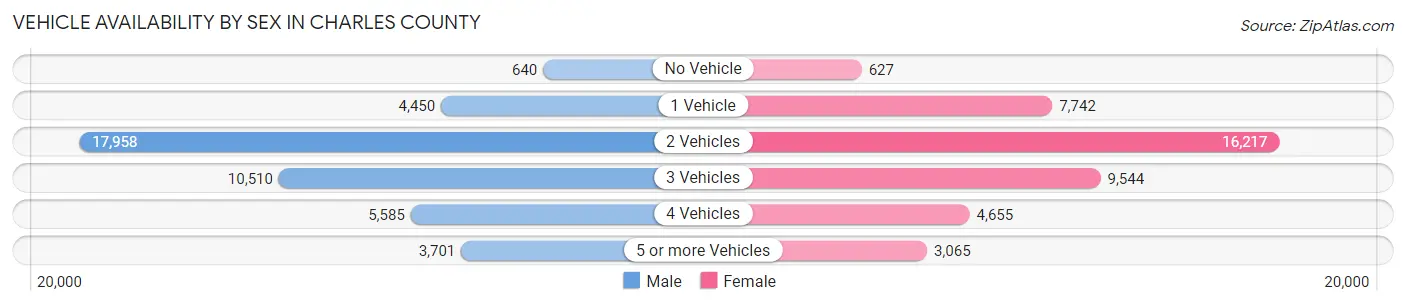
| Vehicles Available | Male | Female |
| No Vehicle | 640 (1.5%) | 627 (1.5%) |
| 1 Vehicle | 4,450 (10.4%) | 7,742 (18.5%) |
| 2 Vehicles | 17,958 (41.9%) | 16,217 (38.8%) |
| 3 Vehicles | 10,510 (24.5%) | 9,544 (22.8%) |
| 4 Vehicles | 5,585 (13.0%) | 4,655 (11.1%) |
| 5 or more Vehicles | 3,701 (8.6%) | 3,065 (7.3%) |
| Total | 42,844 (100.0%) | 41,850 (100.0%) |
Commute Time in Charles County
The most frequently occuring commute durations in Charles County are 60 to 89 minutes (16,253 commuters, 21.7%), 45 to 59 minutes (11,405 commuters, 15.2%), and 90 or more minutes (8,455 commuters, 11.3%).
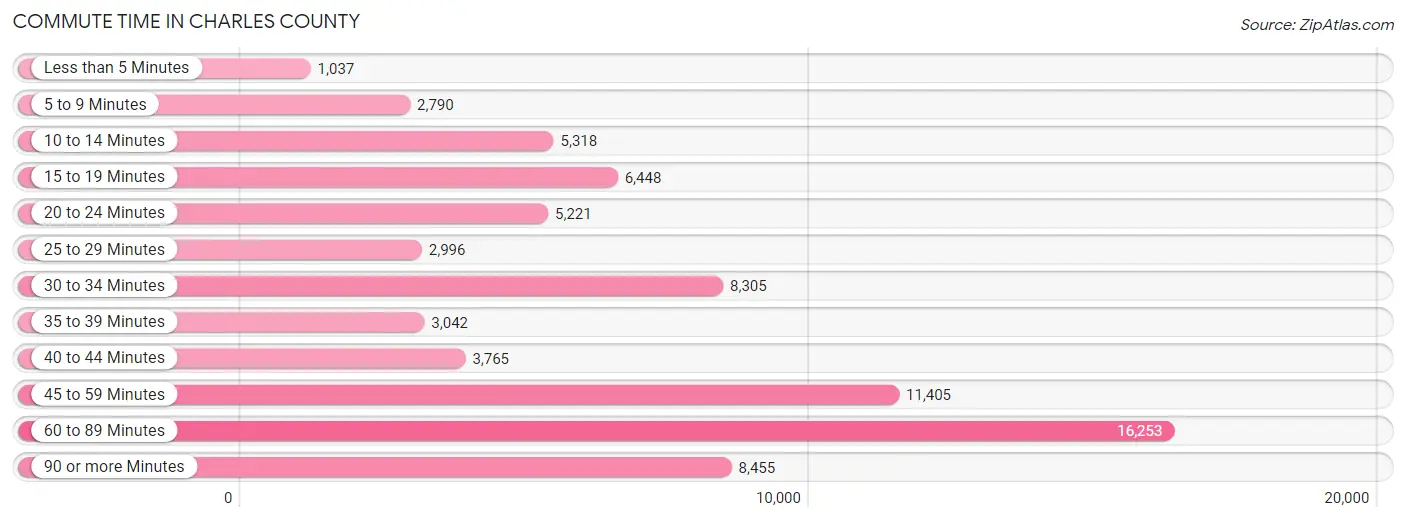
| Commute Time | # Commuters | % Commuters |
| Less than 5 Minutes | 1,037 | 1.4% |
| 5 to 9 Minutes | 2,790 | 3.7% |
| 10 to 14 Minutes | 5,318 | 7.1% |
| 15 to 19 Minutes | 6,448 | 8.6% |
| 20 to 24 Minutes | 5,221 | 7.0% |
| 25 to 29 Minutes | 2,996 | 4.0% |
| 30 to 34 Minutes | 8,305 | 11.1% |
| 35 to 39 Minutes | 3,042 | 4.1% |
| 40 to 44 Minutes | 3,765 | 5.0% |
| 45 to 59 Minutes | 11,405 | 15.2% |
| 60 to 89 Minutes | 16,253 | 21.7% |
| 90 or more Minutes | 8,455 | 11.3% |
Commute Time by Sex in Charles County
The most common commute times in Charles County are 60 to 89 minutes (8,414 commuters, 21.5%) for males and 60 to 89 minutes (7,839 commuters, 21.8%) for females.
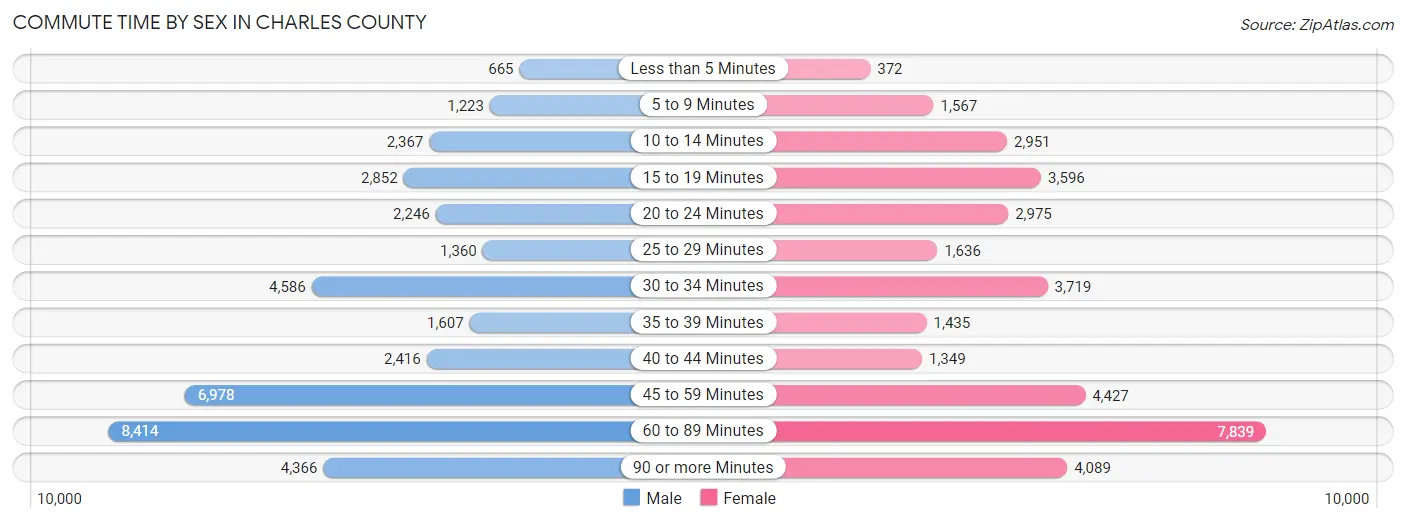
| Commute Time | Male | Female |
| Less than 5 Minutes | 665 (1.7%) | 372 (1.0%) |
| 5 to 9 Minutes | 1,223 (3.1%) | 1,567 (4.4%) |
| 10 to 14 Minutes | 2,367 (6.1%) | 2,951 (8.2%) |
| 15 to 19 Minutes | 2,852 (7.3%) | 3,596 (10.0%) |
| 20 to 24 Minutes | 2,246 (5.8%) | 2,975 (8.3%) |
| 25 to 29 Minutes | 1,360 (3.5%) | 1,636 (4.5%) |
| 30 to 34 Minutes | 4,586 (11.7%) | 3,719 (10.3%) |
| 35 to 39 Minutes | 1,607 (4.1%) | 1,435 (4.0%) |
| 40 to 44 Minutes | 2,416 (6.2%) | 1,349 (3.7%) |
| 45 to 59 Minutes | 6,978 (17.9%) | 4,427 (12.3%) |
| 60 to 89 Minutes | 8,414 (21.5%) | 7,839 (21.8%) |
| 90 or more Minutes | 4,366 (11.2%) | 4,089 (11.4%) |
Time of Departure to Work by Sex in Charles County
The most frequent times of departure to work in Charles County are 12:00 AM to 4:59 AM (4,920, 12.6%) for males and 7:00 AM to 7:29 AM (5,277, 14.7%) for females.
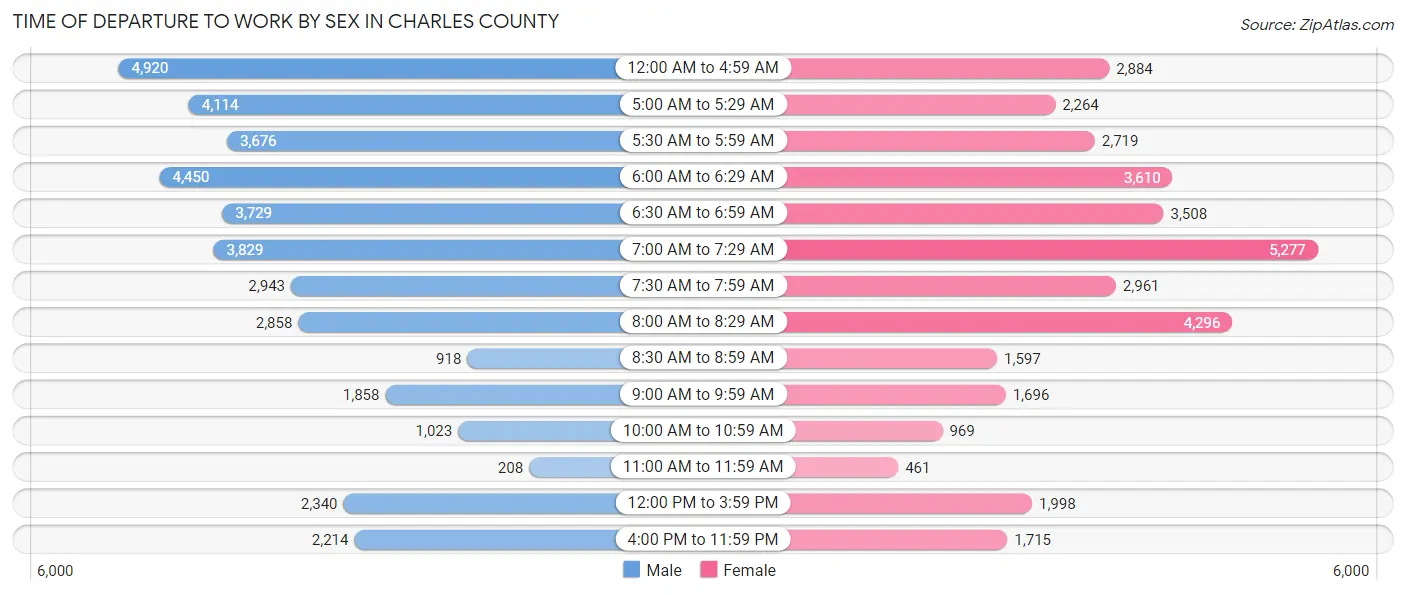
| Time of Departure | Male | Female |
| 12:00 AM to 4:59 AM | 4,920 (12.6%) | 2,884 (8.0%) |
| 5:00 AM to 5:29 AM | 4,114 (10.5%) | 2,264 (6.3%) |
| 5:30 AM to 5:59 AM | 3,676 (9.4%) | 2,719 (7.6%) |
| 6:00 AM to 6:29 AM | 4,450 (11.4%) | 3,610 (10.0%) |
| 6:30 AM to 6:59 AM | 3,729 (9.5%) | 3,508 (9.8%) |
| 7:00 AM to 7:29 AM | 3,829 (9.8%) | 5,277 (14.7%) |
| 7:30 AM to 7:59 AM | 2,943 (7.5%) | 2,961 (8.2%) |
| 8:00 AM to 8:29 AM | 2,858 (7.3%) | 4,296 (11.9%) |
| 8:30 AM to 8:59 AM | 918 (2.4%) | 1,597 (4.4%) |
| 9:00 AM to 9:59 AM | 1,858 (4.8%) | 1,696 (4.7%) |
| 10:00 AM to 10:59 AM | 1,023 (2.6%) | 969 (2.7%) |
| 11:00 AM to 11:59 AM | 208 (0.5%) | 461 (1.3%) |
| 12:00 PM to 3:59 PM | 2,340 (6.0%) | 1,998 (5.6%) |
| 4:00 PM to 11:59 PM | 2,214 (5.7%) | 1,715 (4.8%) |
| Total | 39,080 (100.0%) | 35,955 (100.0%) |
Housing Occupancy in Charles County
Occupancy by Ownership in Charles County
Of the total 59,205 dwellings in Charles County, owner-occupied units account for 47,245 (79.8%), while renter-occupied units make up 11,960 (20.2%).
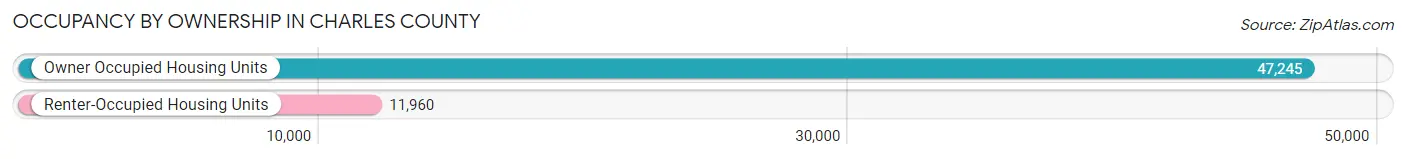
| Occupancy | # Housing Units | % Housing Units |
| Owner Occupied Housing Units | 47,245 | 79.8% |
| Renter-Occupied Housing Units | 11,960 | 20.2% |
| Total Occupied Housing Units | 59,205 | 100.0% |
Occupancy by Household Size in Charles County
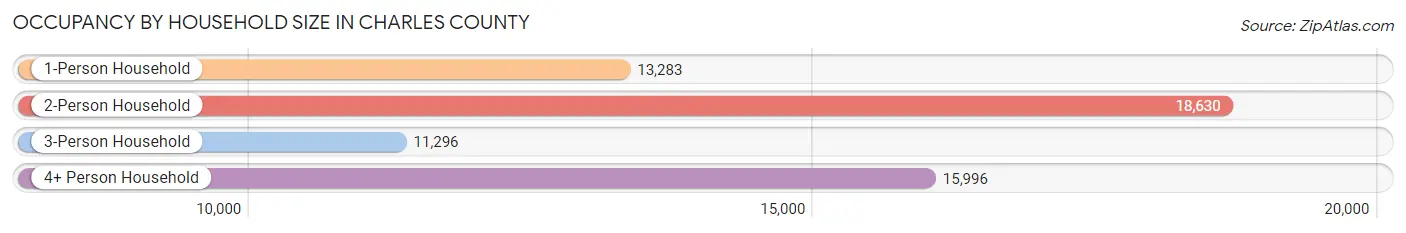
| Household Size | # Housing Units | % Housing Units |
| 1-Person Household | 13,283 | 22.4% |
| 2-Person Household | 18,630 | 31.5% |
| 3-Person Household | 11,296 | 19.1% |
| 4+ Person Household | 15,996 | 27.0% |
| Total Housing Units | 59,205 | 100.0% |
Occupancy by Ownership by Household Size in Charles County
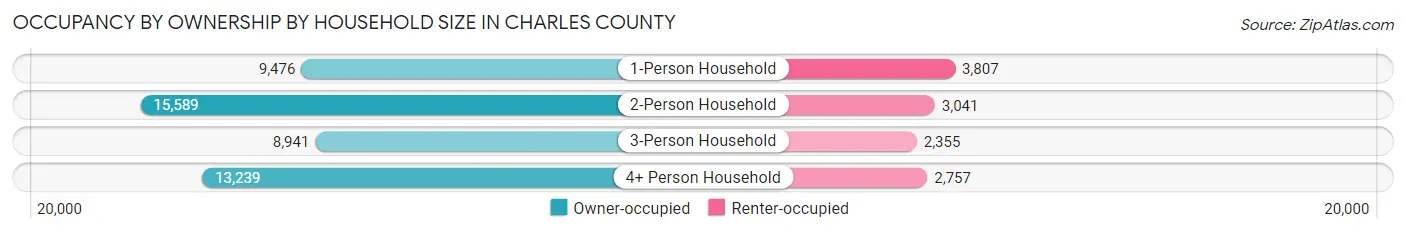
| Household Size | Owner-occupied | Renter-occupied |
| 1-Person Household | 9,476 (71.3%) | 3,807 (28.7%) |
| 2-Person Household | 15,589 (83.7%) | 3,041 (16.3%) |
| 3-Person Household | 8,941 (79.1%) | 2,355 (20.8%) |
| 4+ Person Household | 13,239 (82.8%) | 2,757 (17.2%) |
| Total Housing Units | 47,245 (79.8%) | 11,960 (20.2%) |
Occupancy by Educational Attainment in Charles County
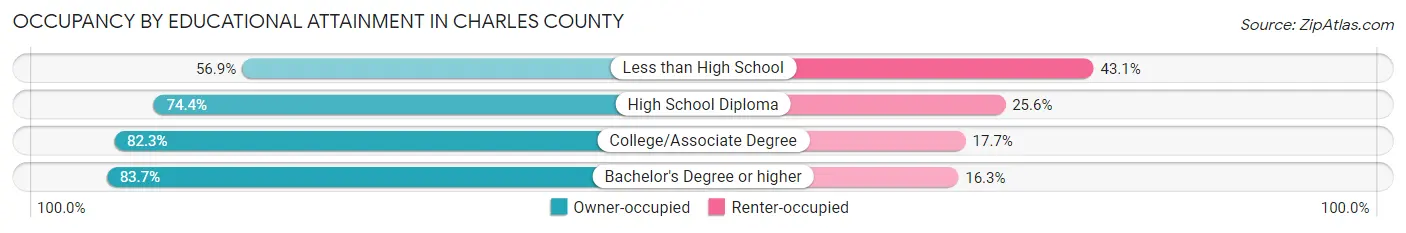
| Household Size | Owner-occupied | Renter-occupied |
| Less than High School | 1,415 (56.9%) | 1,072 (43.1%) |
| High School Diploma | 10,772 (74.4%) | 3,705 (25.6%) |
| College/Associate Degree | 17,090 (82.3%) | 3,686 (17.7%) |
| Bachelor's Degree or higher | 17,968 (83.7%) | 3,497 (16.3%) |
Occupancy by Age of Householder in Charles County
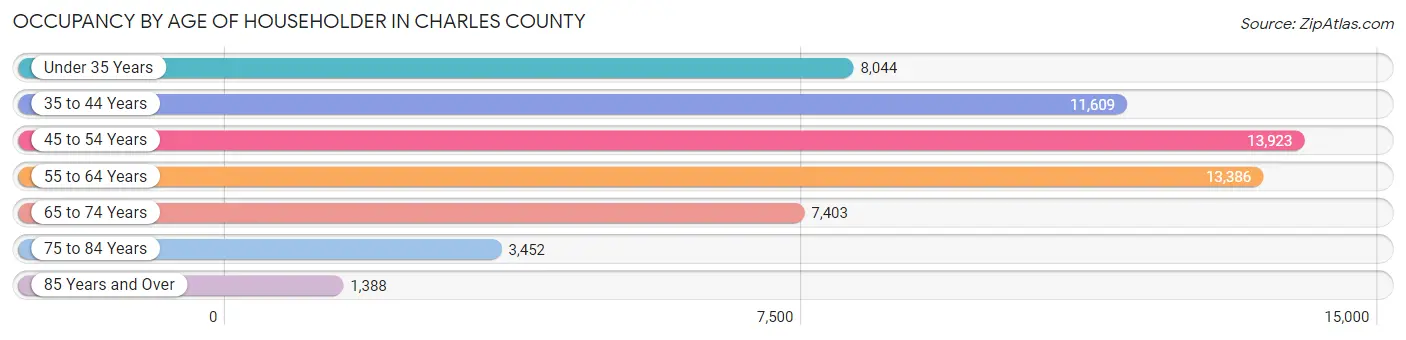
| Age Bracket | # Households | % Households |
| Under 35 Years | 8,044 | 13.6% |
| 35 to 44 Years | 11,609 | 19.6% |
| 45 to 54 Years | 13,923 | 23.5% |
| 55 to 64 Years | 13,386 | 22.6% |
| 65 to 74 Years | 7,403 | 12.5% |
| 75 to 84 Years | 3,452 | 5.8% |
| 85 Years and Over | 1,388 | 2.3% |
| Total | 59,205 | 100.0% |
Housing Finances in Charles County
Median Income by Occupancy in Charles County
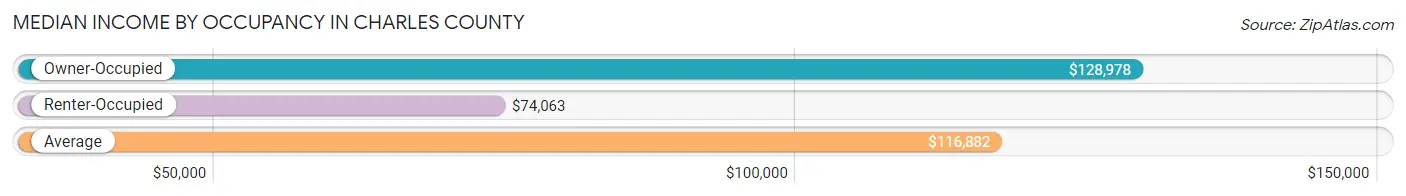
| Occupancy Type | # Households | Median Income |
| Owner-Occupied | 47,245 (79.8%) | $128,978 |
| Renter-Occupied | 11,960 (20.2%) | $74,063 |
| Average | 59,205 (100.0%) | $116,882 |
Occupancy by Householder Income Bracket in Charles County
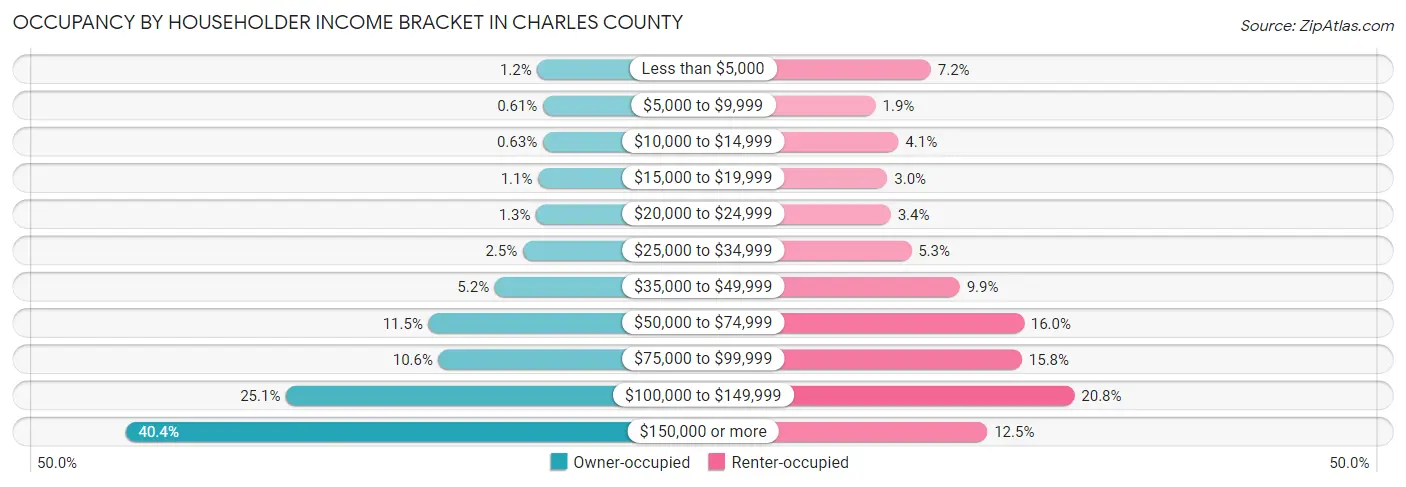
| Income Bracket | Owner-occupied | Renter-occupied |
| Less than $5,000 | 543 (1.1%) | 857 (7.2%) |
| $5,000 to $9,999 | 289 (0.6%) | 229 (1.9%) |
| $10,000 to $14,999 | 296 (0.6%) | 488 (4.1%) |
| $15,000 to $19,999 | 512 (1.1%) | 362 (3.0%) |
| $20,000 to $24,999 | 600 (1.3%) | 401 (3.4%) |
| $25,000 to $34,999 | 1,193 (2.5%) | 634 (5.3%) |
| $35,000 to $49,999 | 2,458 (5.2%) | 1,186 (9.9%) |
| $50,000 to $74,999 | 5,439 (11.5%) | 1,916 (16.0%) |
| $75,000 to $99,999 | 4,986 (10.5%) | 1,894 (15.8%) |
| $100,000 to $149,999 | 11,849 (25.1%) | 2,493 (20.8%) |
| $150,000 or more | 19,080 (40.4%) | 1,500 (12.5%) |
| Total | 47,245 (100.0%) | 11,960 (100.0%) |
Monthly Housing Cost Tiers in Charles County
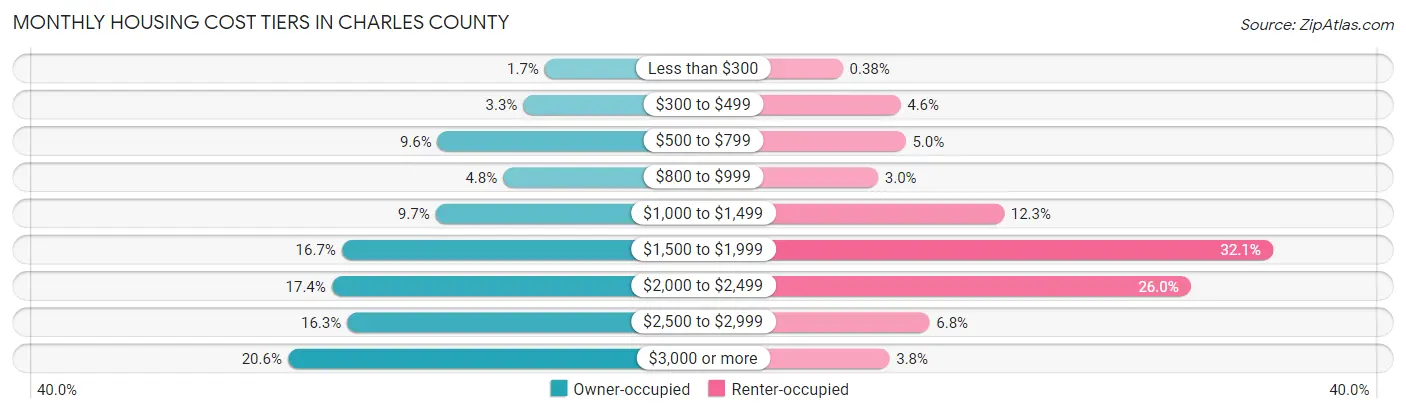
| Monthly Cost | Owner-occupied | Renter-occupied |
| Less than $300 | 804 (1.7%) | 46 (0.4%) |
| $300 to $499 | 1,549 (3.3%) | 554 (4.6%) |
| $500 to $799 | 4,533 (9.6%) | 599 (5.0%) |
| $800 to $999 | 2,251 (4.8%) | 356 (3.0%) |
| $1,000 to $1,499 | 4,602 (9.7%) | 1,465 (12.2%) |
| $1,500 to $1,999 | 7,868 (16.7%) | 3,833 (32.1%) |
| $2,000 to $2,499 | 8,217 (17.4%) | 3,110 (26.0%) |
| $2,500 to $2,999 | 7,678 (16.3%) | 810 (6.8%) |
| $3,000 or more | 9,743 (20.6%) | 457 (3.8%) |
| Total | 47,245 (100.0%) | 11,960 (100.0%) |
Physical Housing Characteristics in Charles County
Housing Structures in Charles County
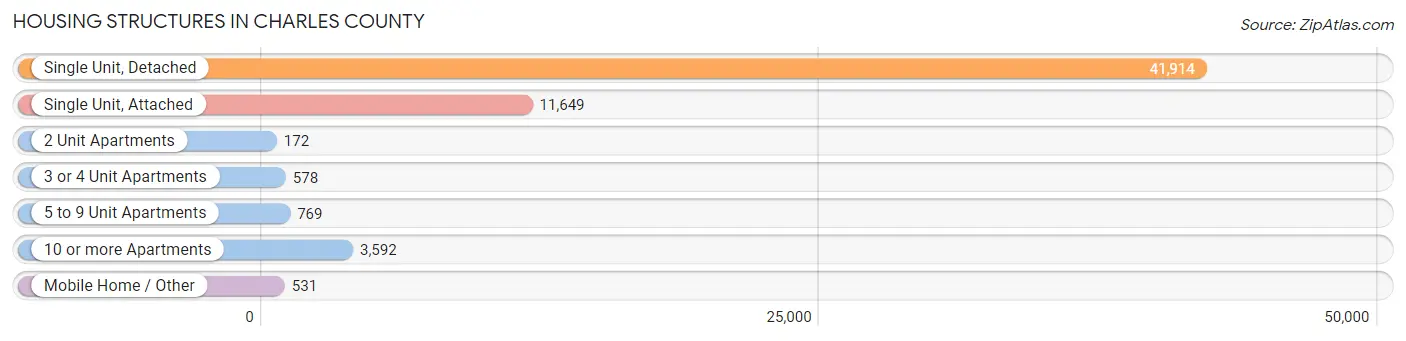
| Structure Type | # Housing Units | % Housing Units |
| Single Unit, Detached | 41,914 | 70.8% |
| Single Unit, Attached | 11,649 | 19.7% |
| 2 Unit Apartments | 172 | 0.3% |
| 3 or 4 Unit Apartments | 578 | 1.0% |
| 5 to 9 Unit Apartments | 769 | 1.3% |
| 10 or more Apartments | 3,592 | 6.1% |
| Mobile Home / Other | 531 | 0.9% |
| Total | 59,205 | 100.0% |
Housing Structures by Occupancy in Charles County
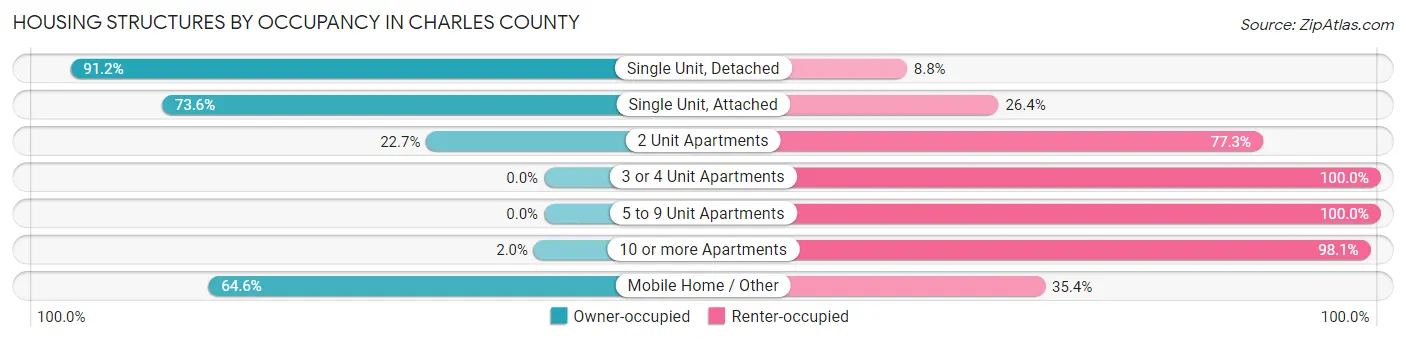
| Structure Type | Owner-occupied | Renter-occupied |
| Single Unit, Detached | 38,224 (91.2%) | 3,690 (8.8%) |
| Single Unit, Attached | 8,569 (73.6%) | 3,080 (26.4%) |
| 2 Unit Apartments | 39 (22.7%) | 133 (77.3%) |
| 3 or 4 Unit Apartments | 0 (0.0%) | 578 (100.0%) |
| 5 to 9 Unit Apartments | 0 (0.0%) | 769 (100.0%) |
| 10 or more Apartments | 70 (1.9%) | 3,522 (98.1%) |
| Mobile Home / Other | 343 (64.6%) | 188 (35.4%) |
| Total | 47,245 (79.8%) | 11,960 (20.2%) |
Housing Structures by Number of Rooms in Charles County
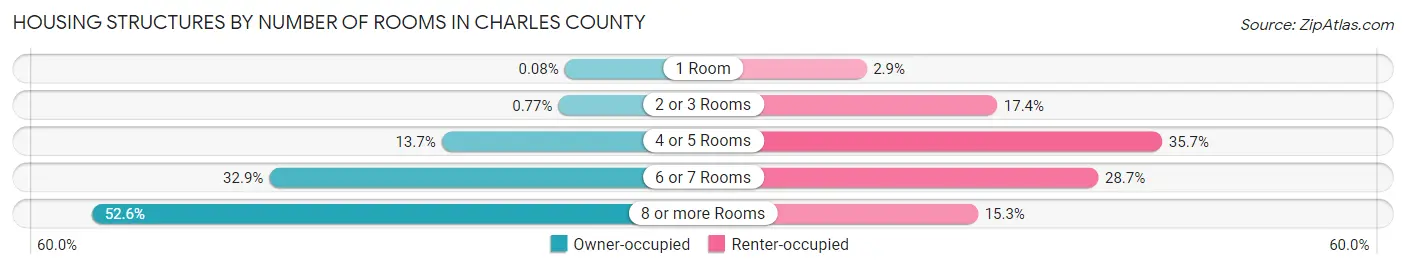
| Number of Rooms | Owner-occupied | Renter-occupied |
| 1 Room | 40 (0.1%) | 349 (2.9%) |
| 2 or 3 Rooms | 362 (0.8%) | 2,083 (17.4%) |
| 4 or 5 Rooms | 6,488 (13.7%) | 4,273 (35.7%) |
| 6 or 7 Rooms | 15,527 (32.9%) | 3,426 (28.6%) |
| 8 or more Rooms | 24,828 (52.5%) | 1,829 (15.3%) |
| Total | 47,245 (100.0%) | 11,960 (100.0%) |
Housing Structure by Heating Type in Charles County
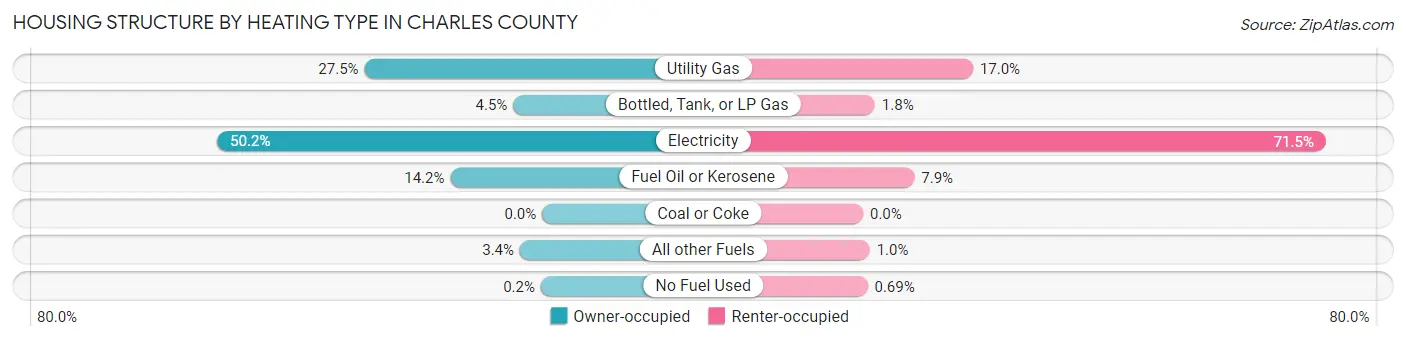
| Heating Type | Owner-occupied | Renter-occupied |
| Utility Gas | 12,980 (27.5%) | 2,032 (17.0%) |
| Bottled, Tank, or LP Gas | 2,114 (4.5%) | 219 (1.8%) |
| Electricity | 23,729 (50.2%) | 8,554 (71.5%) |
| Fuel Oil or Kerosene | 6,702 (14.2%) | 949 (7.9%) |
| Coal or Coke | 0 (0.0%) | 0 (0.0%) |
| All other Fuels | 1,627 (3.4%) | 123 (1.0%) |
| No Fuel Used | 93 (0.2%) | 83 (0.7%) |
| Total | 47,245 (100.0%) | 11,960 (100.0%) |
Household Vehicle Usage in Charles County
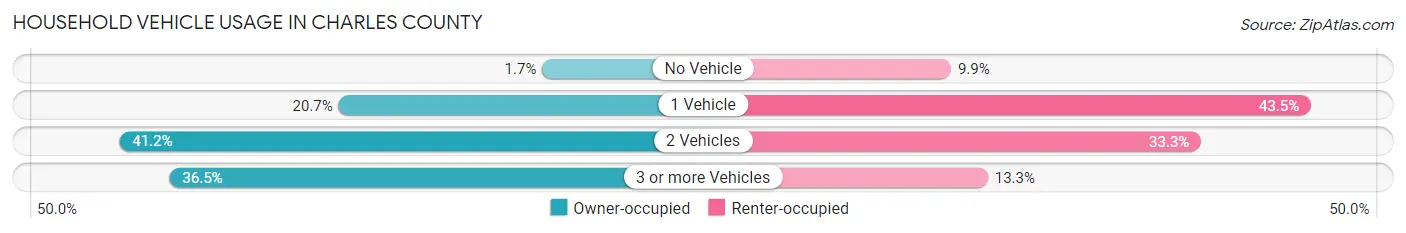
| Vehicles per Household | Owner-occupied | Renter-occupied |
| No Vehicle | 792 (1.7%) | 1,184 (9.9%) |
| 1 Vehicle | 9,776 (20.7%) | 5,204 (43.5%) |
| 2 Vehicles | 19,444 (41.2%) | 3,977 (33.3%) |
| 3 or more Vehicles | 17,233 (36.5%) | 1,595 (13.3%) |
| Total | 47,245 (100.0%) | 11,960 (100.0%) |
Real Estate & Mortgages in Charles County
Real Estate and Mortgage Overview in Charles County
| Characteristic | Without Mortgage | With Mortgage |
| Housing Units | 9,467 | 37,778 |
| Median Property Value | $354,600 | $389,500 |
| Median Household Income | $99,763 | $16,199 |
| Monthly Housing Costs | $705 | $9,743 |
| Real Estate Taxes | $3,871 | $1,228 |
Property Value by Mortgage Status in Charles County
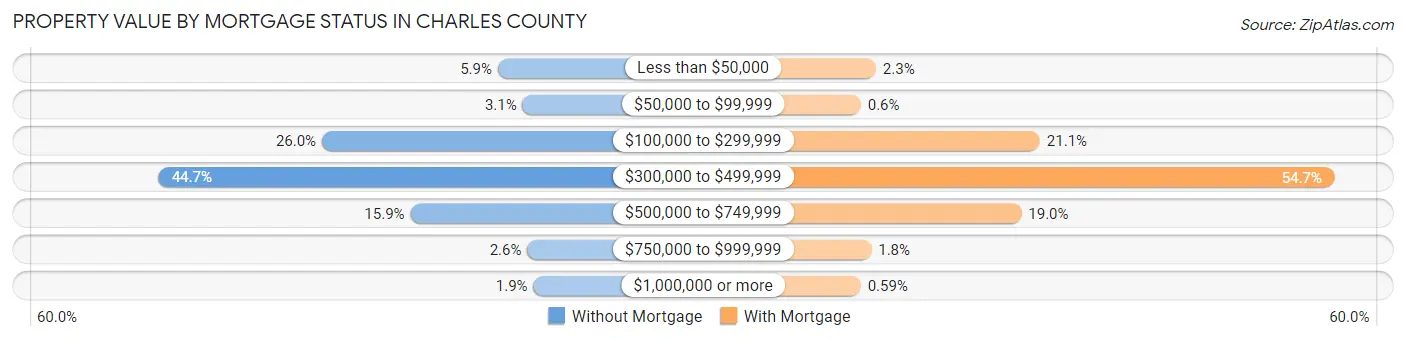
| Property Value | Without Mortgage | With Mortgage |
| Less than $50,000 | 560 (5.9%) | 882 (2.3%) |
| $50,000 to $99,999 | 293 (3.1%) | 228 (0.6%) |
| $100,000 to $299,999 | 2,463 (26.0%) | 7,958 (21.1%) |
| $300,000 to $499,999 | 4,229 (44.7%) | 20,649 (54.7%) |
| $500,000 to $749,999 | 1,506 (15.9%) | 7,159 (19.0%) |
| $750,000 to $999,999 | 241 (2.5%) | 679 (1.8%) |
| $1,000,000 or more | 175 (1.8%) | 223 (0.6%) |
| Total | 9,467 (100.0%) | 37,778 (100.0%) |
Household Income by Mortgage Status in Charles County
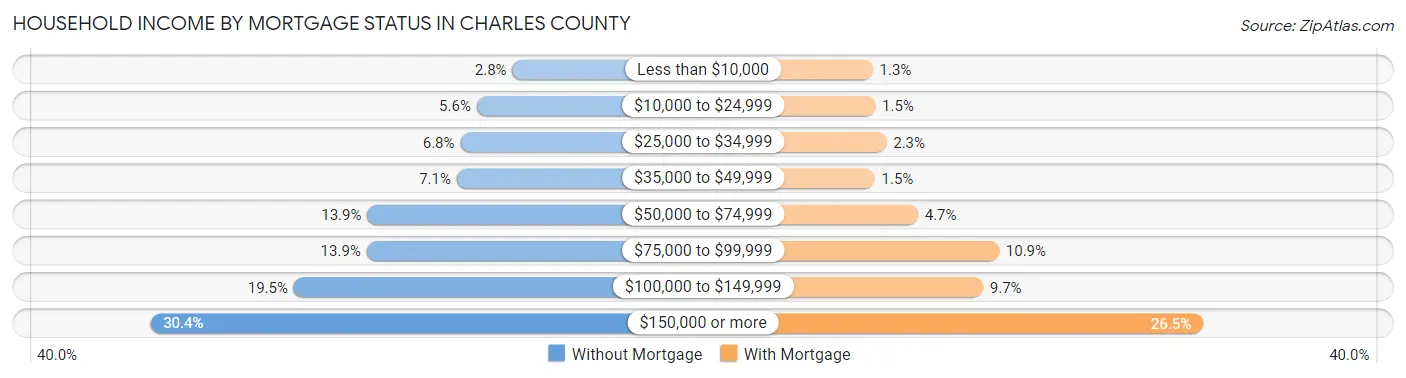
| Household Income | Without Mortgage | With Mortgage |
| Less than $10,000 | 268 (2.8%) | 493 (1.3%) |
| $10,000 to $24,999 | 525 (5.6%) | 564 (1.5%) |
| $25,000 to $34,999 | 644 (6.8%) | 883 (2.3%) |
| $35,000 to $49,999 | 669 (7.1%) | 549 (1.5%) |
| $50,000 to $74,999 | 1,315 (13.9%) | 1,789 (4.7%) |
| $75,000 to $99,999 | 1,320 (13.9%) | 4,124 (10.9%) |
| $100,000 to $149,999 | 1,845 (19.5%) | 3,666 (9.7%) |
| $150,000 or more | 2,881 (30.4%) | 10,004 (26.5%) |
| Total | 9,467 (100.0%) | 37,778 (100.0%) |
Property Value to Household Income Ratio in Charles County
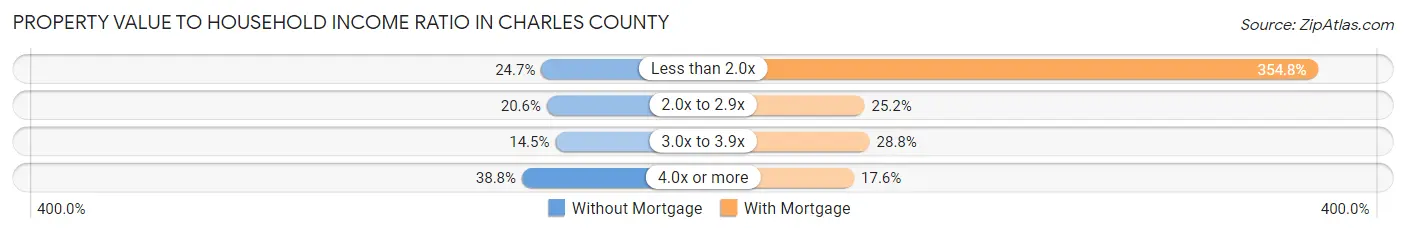
| Value-to-Income Ratio | Without Mortgage | With Mortgage |
| Less than 2.0x | 2,338 (24.7%) | 134,017 (354.7%) |
| 2.0x to 2.9x | 1,953 (20.6%) | 9,505 (25.2%) |
| 3.0x to 3.9x | 1,372 (14.5%) | 10,886 (28.8%) |
| 4.0x or more | 3,670 (38.8%) | 6,635 (17.6%) |
| Total | 9,467 (100.0%) | 37,778 (100.0%) |
Real Estate Taxes by Mortgage Status in Charles County
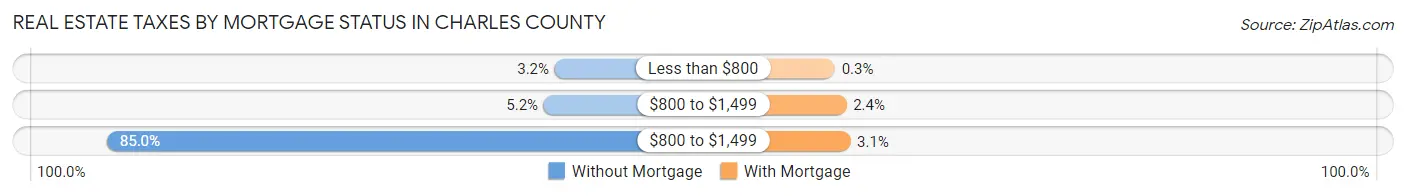
| Property Taxes | Without Mortgage | With Mortgage |
| Less than $800 | 298 (3.2%) | 114 (0.3%) |
| $800 to $1,499 | 488 (5.1%) | 907 (2.4%) |
| $800 to $1,499 | 8,044 (85.0%) | 1,180 (3.1%) |
| Total | 9,467 (100.0%) | 37,778 (100.0%) |
Health & Disability in Charles County
Health Insurance Coverage by Age in Charles County
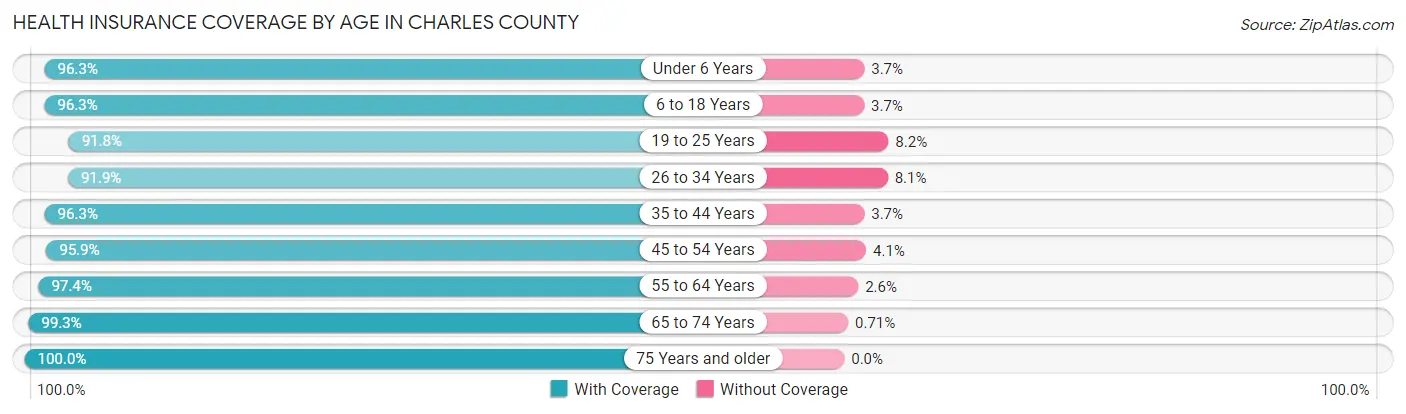
| Age Bracket | With Coverage | Without Coverage |
| Under 6 Years | 10,904 (96.3%) | 422 (3.7%) |
| 6 to 18 Years | 29,570 (96.3%) | 1,132 (3.7%) |
| 19 to 25 Years | 12,843 (91.8%) | 1,152 (8.2%) |
| 26 to 34 Years | 16,363 (91.9%) | 1,441 (8.1%) |
| 35 to 44 Years | 20,783 (96.3%) | 806 (3.7%) |
| 45 to 54 Years | 23,247 (95.9%) | 985 (4.1%) |
| 55 to 64 Years | 22,691 (97.4%) | 605 (2.6%) |
| 65 to 74 Years | 13,063 (99.3%) | 94 (0.7%) |
| 75 Years and older | 8,050 (100.0%) | 0 (0.0%) |
| Total | 157,514 (96.0%) | 6,637 (4.0%) |
Health Insurance Coverage by Citizenship Status in Charles County
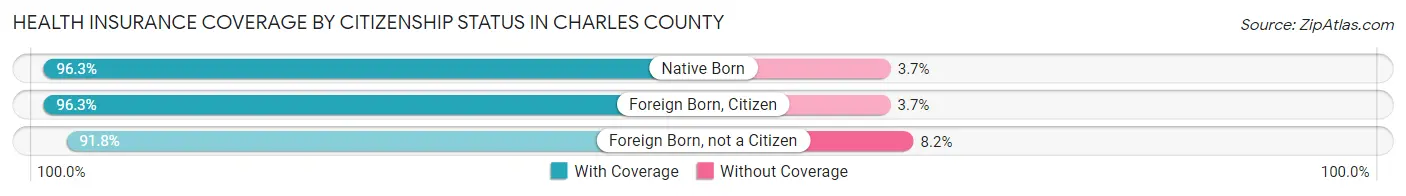
| Citizenship Status | With Coverage | Without Coverage |
| Native Born | 10,904 (96.3%) | 422 (3.7%) |
| Foreign Born, Citizen | 29,570 (96.3%) | 1,132 (3.7%) |
| Foreign Born, not a Citizen | 12,843 (91.8%) | 1,152 (8.2%) |
Health Insurance Coverage by Household Income in Charles County
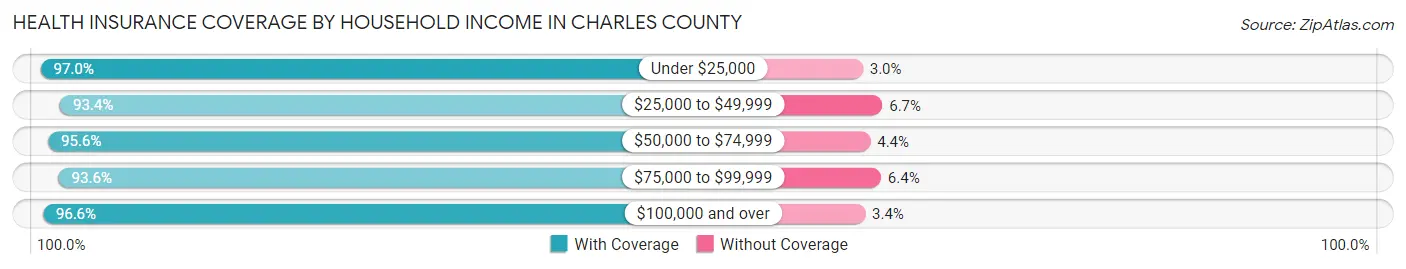
| Household Income | With Coverage | Without Coverage |
| Under $25,000 | 7,799 (97.0%) | 241 (3.0%) |
| $25,000 to $49,999 | 10,975 (93.3%) | 782 (6.7%) |
| $50,000 to $74,999 | 16,511 (95.6%) | 760 (4.4%) |
| $75,000 to $99,999 | 15,999 (93.6%) | 1,093 (6.4%) |
| $100,000 and over | 105,894 (96.6%) | 3,759 (3.4%) |
Public vs Private Health Insurance Coverage by Age in Charles County
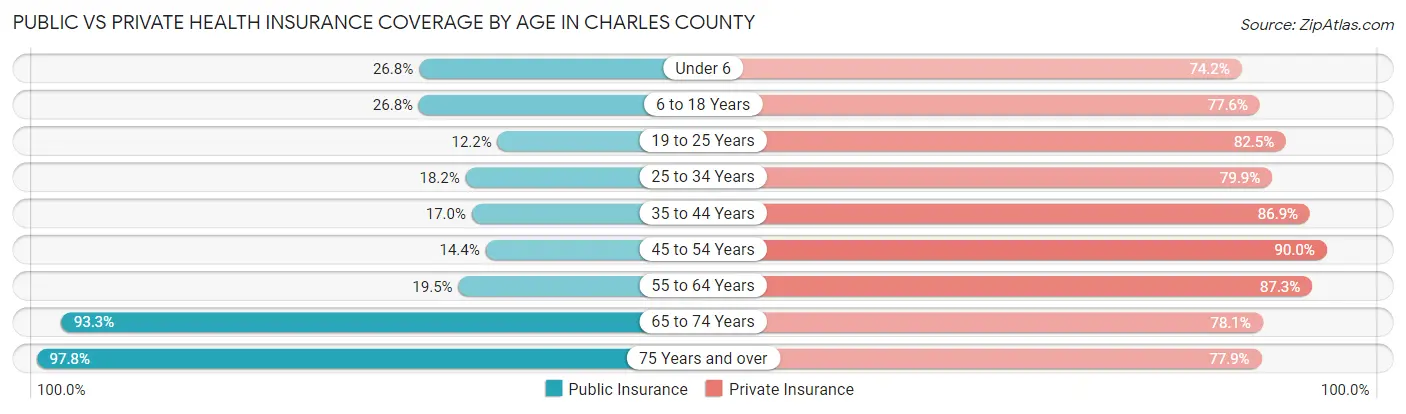
| Age Bracket | Public Insurance | Private Insurance |
| Under 6 | 3,035 (26.8%) | 8,403 (74.2%) |
| 6 to 18 Years | 8,231 (26.8%) | 23,823 (77.6%) |
| 19 to 25 Years | 1,710 (12.2%) | 11,540 (82.5%) |
| 25 to 34 Years | 3,234 (18.2%) | 14,220 (79.9%) |
| 35 to 44 Years | 3,670 (17.0%) | 18,757 (86.9%) |
| 45 to 54 Years | 3,499 (14.4%) | 21,806 (90.0%) |
| 55 to 64 Years | 4,538 (19.5%) | 20,334 (87.3%) |
| 65 to 74 Years | 12,270 (93.3%) | 10,276 (78.1%) |
| 75 Years and over | 7,870 (97.8%) | 6,269 (77.9%) |
| Total | 48,057 (29.3%) | 135,428 (82.5%) |
Disability Status by Sex by Age in Charles County
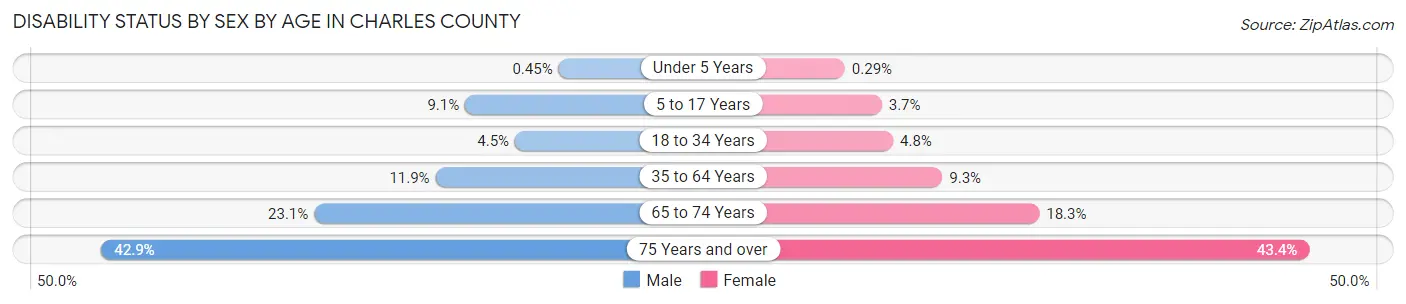
| Age Bracket | Male | Female |
| Under 5 Years | 22 (0.4%) | 14 (0.3%) |
| 5 to 17 Years | 1,382 (9.1%) | 553 (3.7%) |
| 18 to 34 Years | 757 (4.5%) | 821 (4.8%) |
| 35 to 64 Years | 3,852 (11.9%) | 3,420 (9.3%) |
| 65 to 74 Years | 1,382 (23.1%) | 1,317 (18.3%) |
| 75 Years and over | 1,407 (42.9%) | 2,068 (43.4%) |
Disability Class by Sex by Age in Charles County
Disability Class: Hearing Difficulty
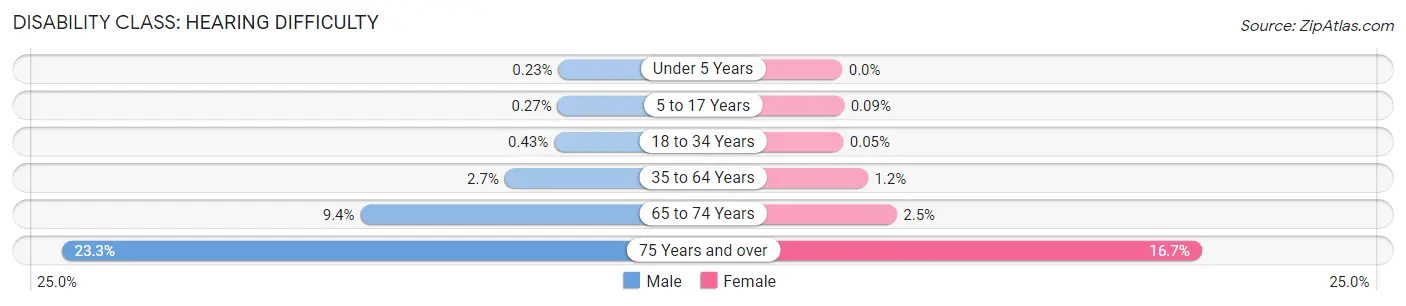
| Age Bracket | Male | Female |
| Under 5 Years | 11 (0.2%) | 0 (0.0%) |
| 5 to 17 Years | 41 (0.3%) | 13 (0.1%) |
| 18 to 34 Years | 73 (0.4%) | 8 (0.1%) |
| 35 to 64 Years | 883 (2.7%) | 436 (1.2%) |
| 65 to 74 Years | 563 (9.4%) | 182 (2.5%) |
| 75 Years and over | 764 (23.3%) | 796 (16.7%) |
Disability Class: Vision Difficulty
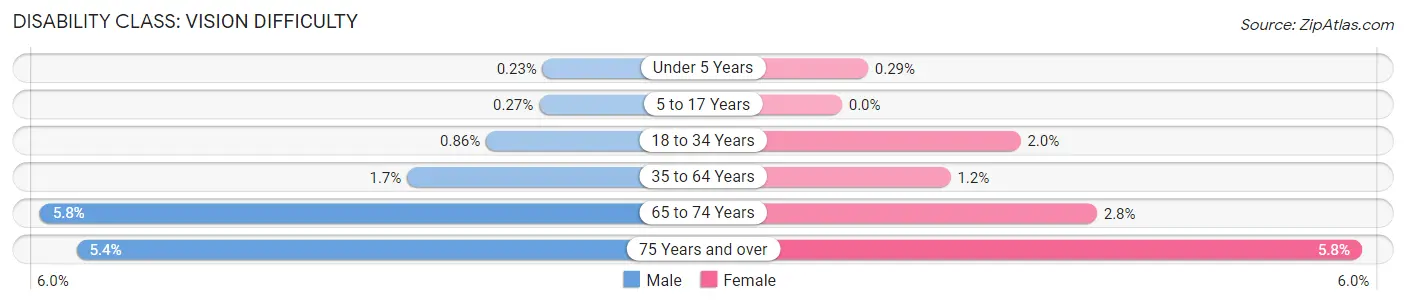
| Age Bracket | Male | Female |
| Under 5 Years | 11 (0.2%) | 14 (0.3%) |
| 5 to 17 Years | 41 (0.3%) | 0 (0.0%) |
| 18 to 34 Years | 145 (0.9%) | 343 (2.0%) |
| 35 to 64 Years | 565 (1.7%) | 442 (1.2%) |
| 65 to 74 Years | 348 (5.8%) | 204 (2.8%) |
| 75 Years and over | 178 (5.4%) | 276 (5.8%) |
Disability Class: Cognitive Difficulty
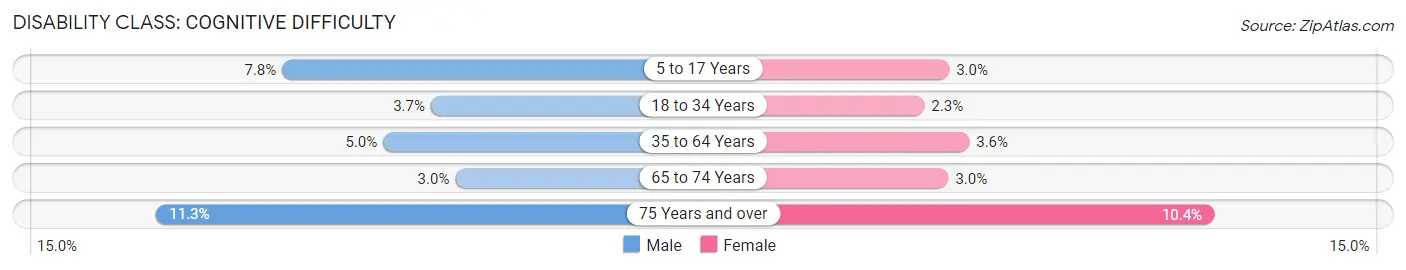
| Age Bracket | Male | Female |
| 5 to 17 Years | 1,187 (7.8%) | 446 (3.0%) |
| 18 to 34 Years | 622 (3.7%) | 397 (2.3%) |
| 35 to 64 Years | 1,629 (5.0%) | 1,303 (3.5%) |
| 65 to 74 Years | 180 (3.0%) | 213 (3.0%) |
| 75 Years and over | 372 (11.3%) | 494 (10.4%) |
Disability Class: Ambulatory Difficulty
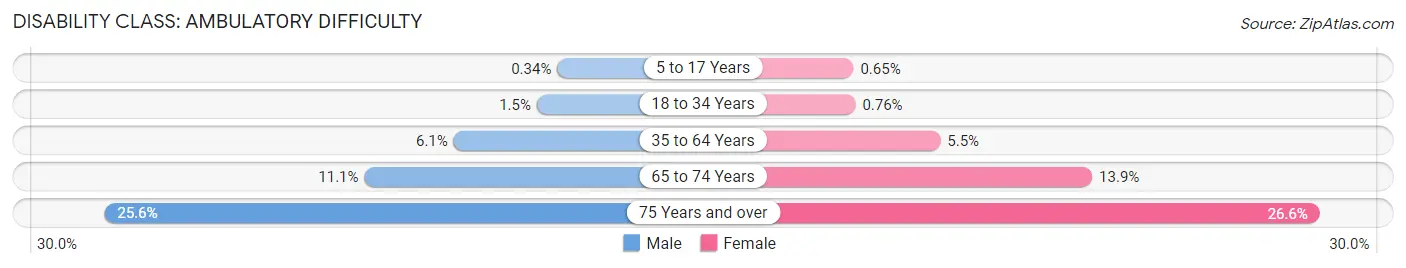
| Age Bracket | Male | Female |
| 5 to 17 Years | 51 (0.3%) | 97 (0.6%) |
| 18 to 34 Years | 249 (1.5%) | 131 (0.8%) |
| 35 to 64 Years | 1,982 (6.1%) | 2,011 (5.5%) |
| 65 to 74 Years | 662 (11.1%) | 1,001 (13.9%) |
| 75 Years and over | 839 (25.6%) | 1,269 (26.6%) |
Disability Class: Self-Care Difficulty
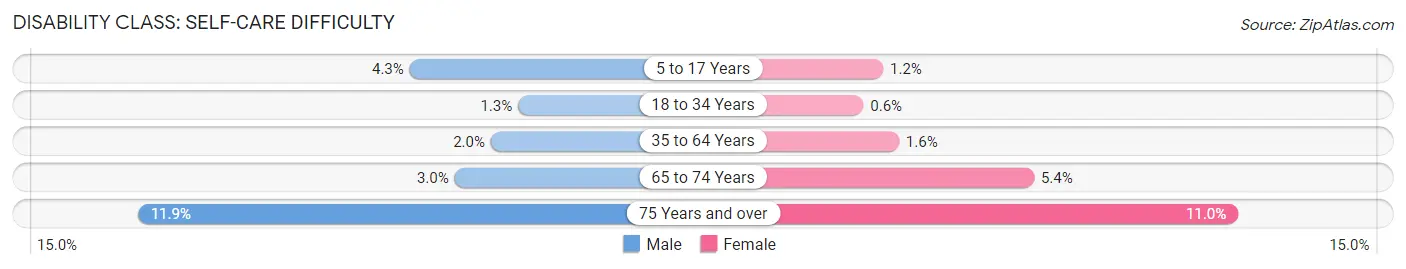
| Age Bracket | Male | Female |
| 5 to 17 Years | 648 (4.3%) | 171 (1.1%) |
| 18 to 34 Years | 212 (1.3%) | 104 (0.6%) |
| 35 to 64 Years | 655 (2.0%) | 583 (1.6%) |
| 65 to 74 Years | 181 (3.0%) | 384 (5.3%) |
| 75 Years and over | 389 (11.8%) | 526 (11.0%) |
Technology Access in Charles County
Computing Device Access in Charles County
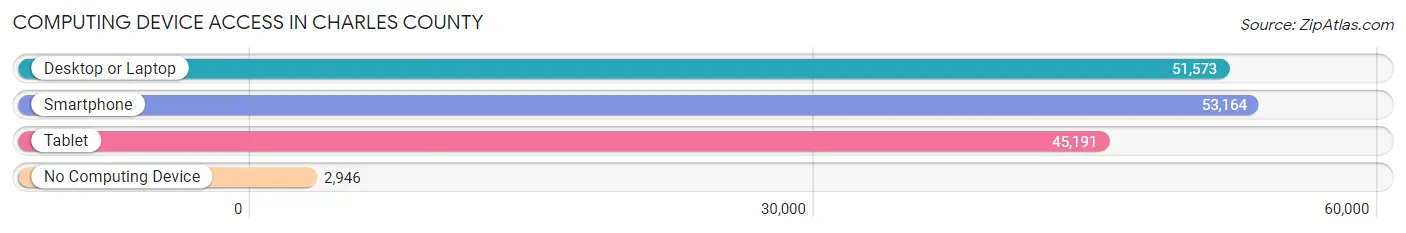
| Device Type | # Households | % Households |
| Desktop or Laptop | 51,573 | 87.1% |
| Smartphone | 53,164 | 89.8% |
| Tablet | 45,191 | 76.3% |
| No Computing Device | 2,946 | 5.0% |
| Total | 59,205 | 100.0% |
Internet Access in Charles County
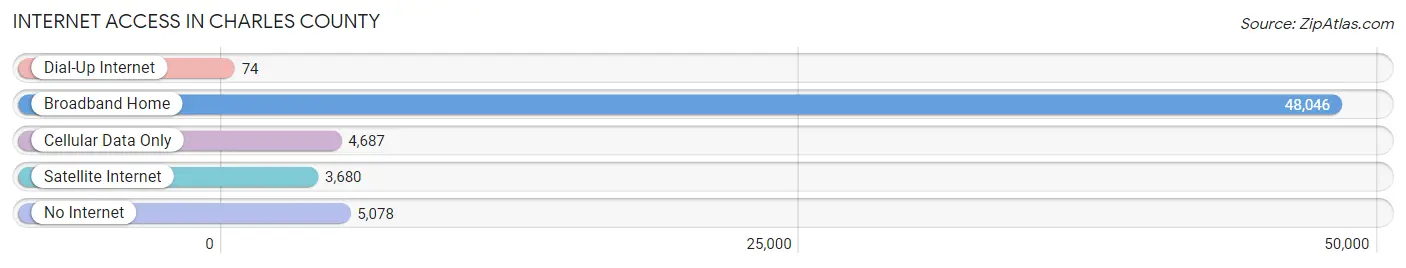
| Internet Type | # Households | % Households |
| Dial-Up Internet | 74 | 0.1% |
| Broadband Home | 48,046 | 81.1% |
| Cellular Data Only | 4,687 | 7.9% |
| Satellite Internet | 3,680 | 6.2% |
| No Internet | 5,078 | 8.6% |
| Total | 59,205 | 100.0% |
Charles County Summary
Charles County, Maryland is located in the southernmost part of the state, just south of Washington, D.C. and is part of the Washington Metropolitan Area. It is bordered by Prince George’s County to the north, Calvert County to the south, and the Potomac River to the east. Charles County is home to a population of over 150,000 people and covers an area of 437 square miles.
History
Charles County was established in 1658 and was named for Charles Calvert, the third Lord Baltimore. The county was originally part of St. Mary’s County, but was split off in 1658. The county was initially divided into six districts, which were later divided into nine districts. The county was home to a large population of Native Americans, including the Piscataway, Mattawoman, and Nanjemoy tribes.
In the late 17th century, Charles County was home to a large population of tobacco farmers. The county was also home to a large population of African Americans, who were brought to the area as slaves to work on the tobacco plantations.
In the 19th century, Charles County was home to a large population of farmers and fishermen. The county was also home to a large population of African Americans, who were freed after the Civil War.
In the 20th century, Charles County experienced rapid growth due to its proximity to Washington, D.C. The county was home to a large population of military personnel, as well as a large population of African Americans.
Geography
Charles County is located in the southernmost part of Maryland, just south of Washington, D.C. The county is bordered by Prince George’s County to the north, Calvert County to the south, and the Potomac River to the east. The county covers an area of 437 square miles and is home to a population of over 150,000 people.
The county is divided into nine districts, which are further divided into towns and villages. The county is home to a variety of landscapes, including forests, wetlands, and farmland. The county is also home to a variety of wildlife, including deer, foxes, and bald eagles.
Economy
Charles County is home to a variety of industries, including manufacturing, retail, and tourism. The county is home to a number of large employers, including the Naval Surface Warfare Center, the Patuxent River Naval Air Station, and the Indian Head Naval Surface Warfare Center.
The county is also home to a number of small businesses, including restaurants, shops, and other services. The county is home to a number of tourist attractions, including the National Colonial Farm, the National Harbor, and the Charles County Fairgrounds.
Demographics
As of the 2010 census, Charles County had a population of 146,551. The population was spread out with a median age of 37.7 years. The racial makeup of the county was 63.2% White, 28.2% African American, 0.5% Native American, 2.7% Asian, 0.1% Pacific Islander, 2.3% from other races, and 2.9% from two or more races.
The median income for a household in the county was $76,845 and the median income for a family was $86,945. The per capita income for the county was $31,945. About 8.2% of the population was below the poverty line.
Common Questions
What is the Total Population of Charles County?
Total Population of Charles County is 167,035.
What is the Total Male Population of Charles County?
Total Male Population of Charles County is 80,711.
What is the Total Female Population of Charles County?
Total Female Population of Charles County is 86,324.
What is the Ratio of Males per 100 Females in Charles County?
There are 93.50 Males per 100 Females in Charles County.
What is the Ratio of Females per 100 Males in Charles County?
There are 106.95 Females per 100 Males in Charles County.
What is the Median Population Age in Charles County?
Median Population Age in Charles County is 38.8 Years.
What is the Average Family Size in Charles County
Average Family Size in Charles County is 3.3 People.
What is the Average Household Size in Charles County
Average Household Size in Charles County is 2.8 People.
What is Per Capita Income in Charles County?
Per Capita income in Charles County is $47,977.
What is the Median Family Income in Charles County?
Median Family Income in Charles County is $130,440.
What is the Median Household income in Charles County?
Median Household Income in Charles County is $116,882.
What is Income or Wage Gap in Charles County?
Income or Wage Gap in Charles County is 19.3%.
Women in Charles County earn 80.7 cents for every dollar earned by a man.
What is Family Income Deficit in Charles County?
Family Income Deficit in Charles County is $12,391.
Families that are below poverty line in Charles County earn $12,391 less on average than the poverty threshold level.
What is Inequality or Gini Index in Charles County?
Inequality or Gini Index in Charles County is 0.38.
How Large is the Labor Force in Charles County?
There are 90,960 People in the Labor Forcein in Charles County.
What is the Percentage of People in the Labor Force in Charles County?
68.8% of People are in the Labor Force in Charles County.
What is the Unemployment Rate in Charles County?
Unemployment Rate in Charles County is 4.9%.