Cecil County, MD
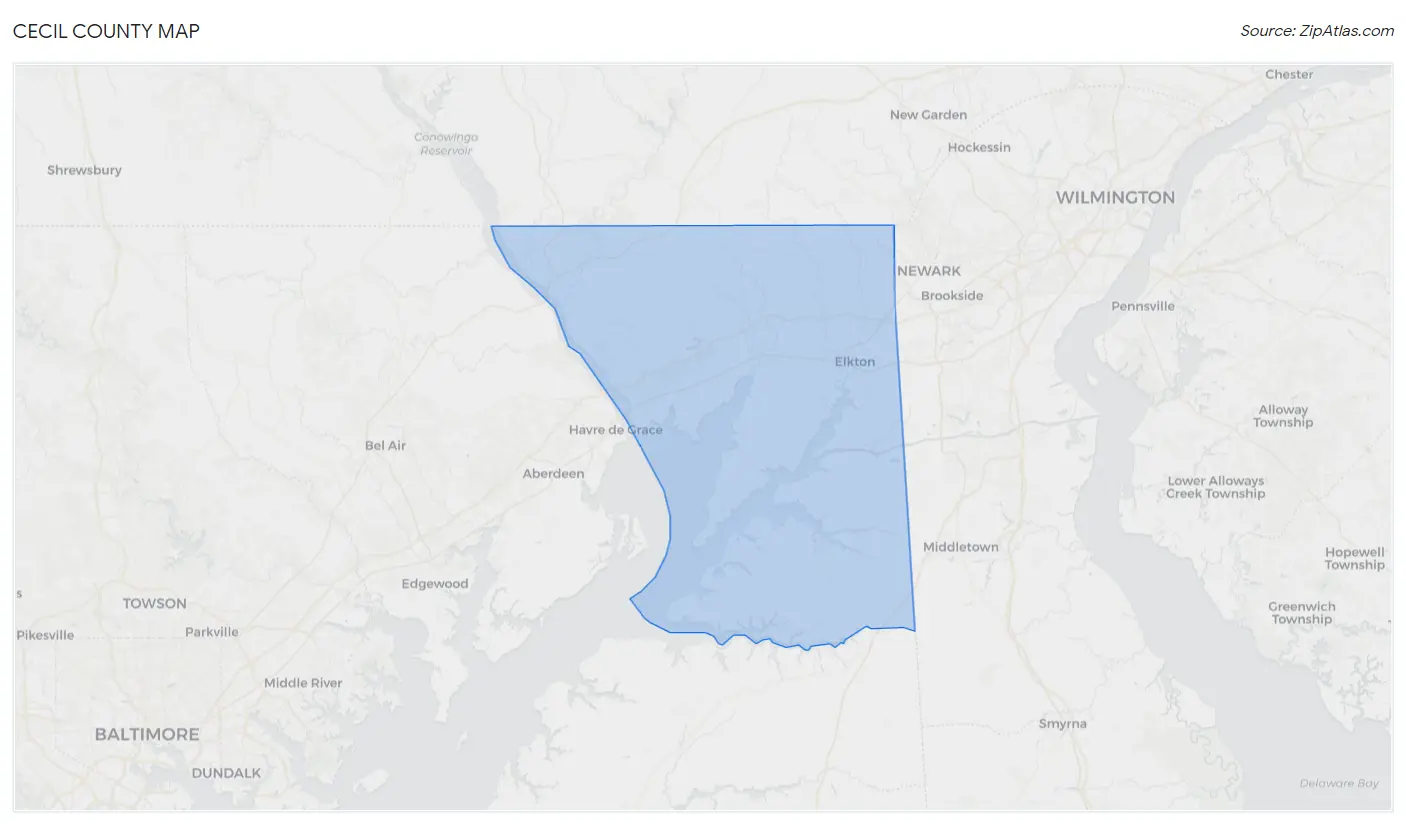
Cecil County Map
Cecil County Overview
103,876
TOTAL POPULATION
51,773
MALE POPULATION
52,103
FEMALE POPULATION
99.37
MALES / 100 FEMALES
100.64
FEMALES / 100 MALES
41.0
MEDIAN AGE
3.1
AVG FAMILY SIZE
2.6
AVG HOUSEHOLD SIZE
$40,520
PER CAPITA INCOME
$103,315
AVG FAMILY INCOME
$86,869
AVG HOUSEHOLD INCOME
32.8%
WAGE / INCOME GAP [ % ]
67.2¢/ $1
WAGE / INCOME GAP [ $ ]
$13,873
FAMILY INCOME DEFICIT
0.43
INEQUALITY / GINI INDEX
52,847
LABOR FORCE [ PEOPLE ]
63.2%
PERCENT IN LABOR FORCE
4.9%
UNEMPLOYMENT RATE
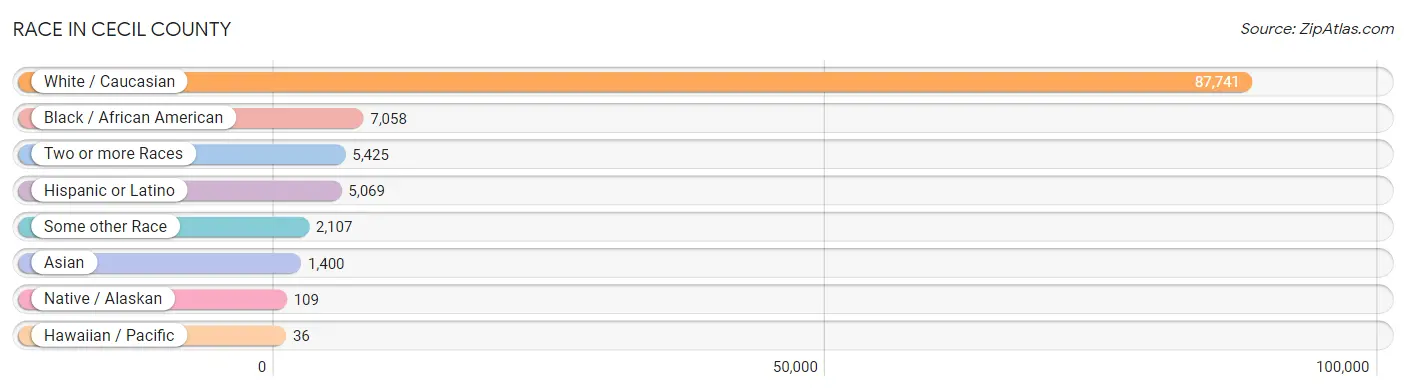
Race in Cecil County
The most populous races in Cecil County are White / Caucasian (87,741 | 84.5%), Black / African American (7,058 | 6.8%), and Two or more Races (5,425 | 5.2%).
| Race | # Population | % Population |
| Asian | 1,400 | 1.3% |
| Black / African American | 7,058 | 6.8% |
| Hawaiian / Pacific | 36 | 0.0% |
| Hispanic or Latino | 5,069 | 4.9% |
| Native / Alaskan | 109 | 0.1% |
| White / Caucasian | 87,741 | 84.5% |
| Two or more Races | 5,425 | 5.2% |
| Some other Race | 2,107 | 2.0% |
| Total | 103,876 | 100.0% |
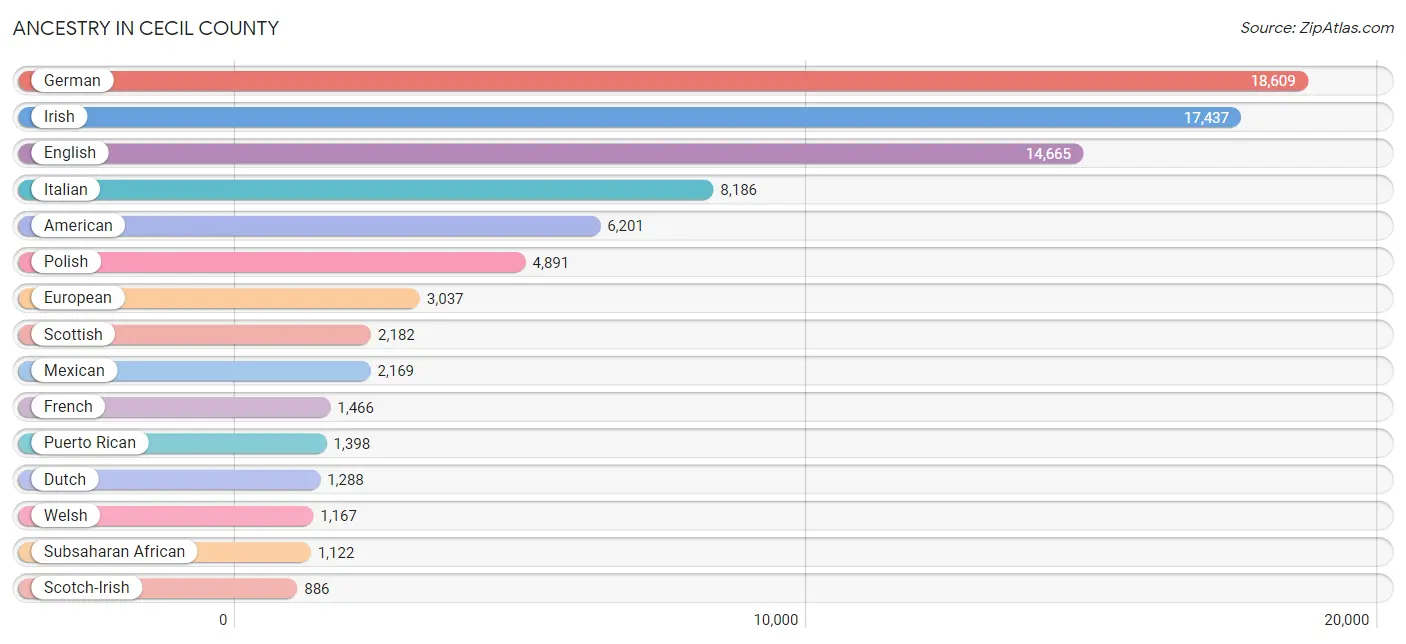
Ancestry in Cecil County
The most populous ancestries reported in Cecil County are German (18,609 | 17.9%), Irish (17,437 | 16.8%), English (14,665 | 14.1%), Italian (8,186 | 7.9%), and American (6,201 | 6.0%), together accounting for 62.7% of all Cecil County residents.
| Ancestry | # Population | % Population |
| African | 485 | 0.5% |
| Albanian | 28 | 0.0% |
| American | 6,201 | 6.0% |
| Arab | 220 | 0.2% |
| Armenian | 17 | 0.0% |
| Australian | 12 | 0.0% |
| Austrian | 167 | 0.2% |
| Belgian | 17 | 0.0% |
| Belizean | 21 | 0.0% |
| Bhutanese | 252 | 0.2% |
| Blackfeet | 23 | 0.0% |
| Brazilian | 50 | 0.1% |
| British | 598 | 0.6% |
| British West Indian | 12 | 0.0% |
| Burmese | 194 | 0.2% |
| Canadian | 153 | 0.2% |
| Celtic | 31 | 0.0% |
| Central American | 439 | 0.4% |
| Cherokee | 213 | 0.2% |
| Cheyenne | 51 | 0.1% |
| Chickasaw | 48 | 0.1% |
| Chilean | 17 | 0.0% |
| Colombian | 27 | 0.0% |
| Costa Rican | 52 | 0.1% |
| Croatian | 59 | 0.1% |
| Cuban | 183 | 0.2% |
| Czech | 293 | 0.3% |
| Czechoslovakian | 147 | 0.1% |
| Danish | 151 | 0.2% |
| Delaware | 12 | 0.0% |
| Dominican | 371 | 0.4% |
| Dutch | 1,288 | 1.2% |
| Eastern European | 185 | 0.2% |
| Ecuadorian | 35 | 0.0% |
| Egyptian | 87 | 0.1% |
| English | 14,665 | 14.1% |
| European | 3,037 | 2.9% |
| Filipino | 8 | 0.0% |
| Finnish | 175 | 0.2% |
| French | 1,466 | 1.4% |
| French Canadian | 168 | 0.2% |
| German | 18,609 | 17.9% |
| Ghanaian | 45 | 0.0% |
| Greek | 376 | 0.4% |
| Guatemalan | 210 | 0.2% |
| Haitian | 176 | 0.2% |
| Honduran | 38 | 0.0% |
| Hungarian | 263 | 0.3% |
| Icelander | 15 | 0.0% |
| Indian (Asian) | 554 | 0.5% |
| Iranian | 60 | 0.1% |
| Irish | 17,437 | 16.8% |
| Iroquois | 2 | 0.0% |
| Italian | 8,186 | 7.9% |
| Jamaican | 74 | 0.1% |
| Kenyan | 65 | 0.1% |
| Korean | 714 | 0.7% |
| Lebanese | 46 | 0.0% |
| Lithuanian | 216 | 0.2% |
| Lumbee | 47 | 0.1% |
| Mexican | 2,169 | 2.1% |
| Native Hawaiian | 36 | 0.0% |
| Navajo | 28 | 0.0% |
| Nicaraguan | 20 | 0.0% |
| Nigerian | 283 | 0.3% |
| Northern European | 87 | 0.1% |
| Norwegian | 615 | 0.6% |
| Pakistani | 9 | 0.0% |
| Panamanian | 31 | 0.0% |
| Pennsylvania German | 214 | 0.2% |
| Peruvian | 100 | 0.1% |
| Polish | 4,891 | 4.7% |
| Portuguese | 204 | 0.2% |
| Puerto Rican | 1,398 | 1.3% |
| Romanian | 30 | 0.0% |
| Russian | 396 | 0.4% |
| Salvadoran | 88 | 0.1% |
| Scandinavian | 209 | 0.2% |
| Scotch-Irish | 886 | 0.9% |
| Scottish | 2,182 | 2.1% |
| Sierra Leonean | 3 | 0.0% |
| Slavic | 31 | 0.0% |
| Slovak | 28 | 0.0% |
| South African | 39 | 0.0% |
| South American | 210 | 0.2% |
| Spaniard | 22 | 0.0% |
| Spanish | 248 | 0.2% |
| Sri Lankan | 148 | 0.1% |
| Subsaharan African | 1,122 | 1.1% |
| Swedish | 851 | 0.8% |
| Swiss | 152 | 0.2% |
| Thai | 250 | 0.2% |
| Trinidadian and Tobagonian | 162 | 0.2% |
| Turkish | 412 | 0.4% |
| U.S. Virgin Islander | 16 | 0.0% |
| Ukrainian | 654 | 0.6% |
| Venezuelan | 31 | 0.0% |
| Welsh | 1,167 | 1.1% |
| Yugoslavian | 79 | 0.1% | View All 99 Rows |
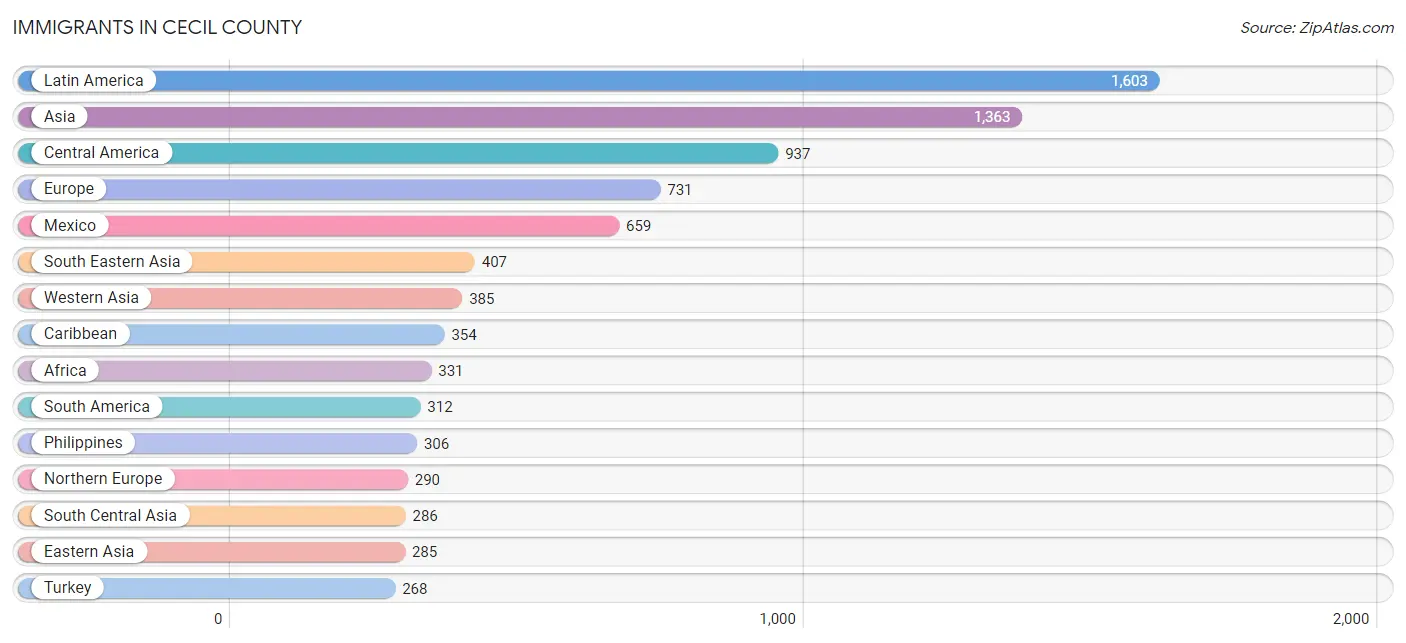
Immigrants in Cecil County
The most numerous immigrant groups reported in Cecil County came from Latin America (1,603 | 1.5%), Asia (1,363 | 1.3%), Central America (937 | 0.9%), Europe (731 | 0.7%), and Mexico (659 | 0.6%), together accounting for 5.1% of all Cecil County residents.
| Immigration Origin | # Population | % Population |
| Africa | 331 | 0.3% |
| Asia | 1,363 | 1.3% |
| Belize | 21 | 0.0% |
| Bosnia and Herzegovina | 61 | 0.1% |
| Brazil | 173 | 0.2% |
| Canada | 73 | 0.1% |
| Caribbean | 354 | 0.3% |
| Central America | 937 | 0.9% |
| Chile | 17 | 0.0% |
| China | 222 | 0.2% |
| Colombia | 8 | 0.0% |
| Congo | 2 | 0.0% |
| Costa Rica | 21 | 0.0% |
| Croatia | 13 | 0.0% |
| Cuba | 27 | 0.0% |
| Denmark | 23 | 0.0% |
| Dominican Republic | 52 | 0.1% |
| Eastern Africa | 230 | 0.2% |
| Eastern Asia | 285 | 0.3% |
| Eastern Europe | 149 | 0.1% |
| El Salvador | 15 | 0.0% |
| England | 131 | 0.1% |
| Europe | 731 | 0.7% |
| Germany | 252 | 0.2% |
| Greece | 15 | 0.0% |
| Guatemala | 184 | 0.2% |
| Haiti | 135 | 0.1% |
| Hong Kong | 17 | 0.0% |
| Hungary | 9 | 0.0% |
| India | 133 | 0.1% |
| Ireland | 41 | 0.0% |
| Jamaica | 46 | 0.0% |
| Kazakhstan | 5 | 0.0% |
| Kenya | 46 | 0.0% |
| Korea | 63 | 0.1% |
| Latin America | 1,603 | 1.5% |
| Liberia | 45 | 0.0% |
| Mexico | 659 | 0.6% |
| Middle Africa | 2 | 0.0% |
| Morocco | 10 | 0.0% |
| Netherlands | 15 | 0.0% |
| Nicaragua | 16 | 0.0% |
| Nigeria | 22 | 0.0% |
| Northern Africa | 10 | 0.0% |
| Northern Europe | 290 | 0.3% |
| Pakistan | 148 | 0.1% |
| Panama | 21 | 0.0% |
| Peru | 55 | 0.1% |
| Philippines | 306 | 0.3% |
| Poland | 12 | 0.0% |
| Russia | 54 | 0.1% |
| Saudi Arabia | 117 | 0.1% |
| Scotland | 14 | 0.0% |
| Sierra Leone | 2 | 0.0% |
| South Africa | 20 | 0.0% |
| South America | 312 | 0.3% |
| South Central Asia | 286 | 0.3% |
| South Eastern Asia | 407 | 0.4% |
| Southern Europe | 25 | 0.0% |
| Spain | 10 | 0.0% |
| St. Vincent and the Grenadines | 12 | 0.0% |
| Sweden | 11 | 0.0% |
| Taiwan | 26 | 0.0% |
| Thailand | 9 | 0.0% |
| Trinidad and Tobago | 82 | 0.1% |
| Turkey | 268 | 0.3% |
| Uganda | 29 | 0.0% |
| Uruguay | 2 | 0.0% |
| Venezuela | 57 | 0.1% |
| Vietnam | 92 | 0.1% |
| Western Africa | 69 | 0.1% |
| Western Asia | 385 | 0.4% |
| Western Europe | 267 | 0.3% | View All 73 Rows |
Sex and Age in Cecil County
Sex and Age in Cecil County
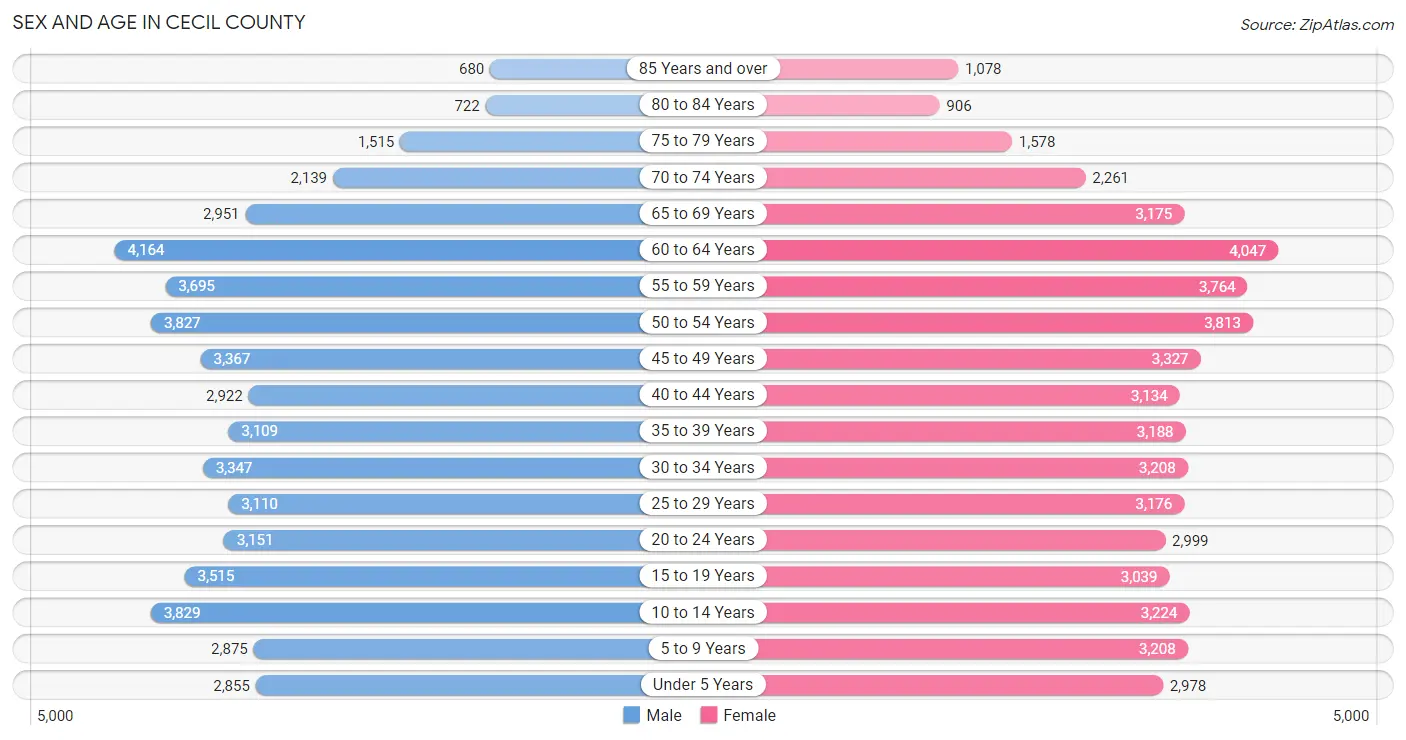
The most populous age groups in Cecil County are 60 to 64 Years (4,164 | 8.0%) for men and 60 to 64 Years (4,047 | 7.8%) for women.
| Age Bracket | Male | Female |
| Under 5 Years | 2,855 (5.5%) | 2,978 (5.7%) |
| 5 to 9 Years | 2,875 (5.6%) | 3,208 (6.2%) |
| 10 to 14 Years | 3,829 (7.4%) | 3,224 (6.2%) |
| 15 to 19 Years | 3,515 (6.8%) | 3,039 (5.8%) |
| 20 to 24 Years | 3,151 (6.1%) | 2,999 (5.8%) |
| 25 to 29 Years | 3,110 (6.0%) | 3,176 (6.1%) |
| 30 to 34 Years | 3,347 (6.5%) | 3,208 (6.2%) |
| 35 to 39 Years | 3,109 (6.0%) | 3,188 (6.1%) |
| 40 to 44 Years | 2,922 (5.6%) | 3,134 (6.0%) |
| 45 to 49 Years | 3,367 (6.5%) | 3,327 (6.4%) |
| 50 to 54 Years | 3,827 (7.4%) | 3,813 (7.3%) |
| 55 to 59 Years | 3,695 (7.1%) | 3,764 (7.2%) |
| 60 to 64 Years | 4,164 (8.0%) | 4,047 (7.8%) |
| 65 to 69 Years | 2,951 (5.7%) | 3,175 (6.1%) |
| 70 to 74 Years | 2,139 (4.1%) | 2,261 (4.3%) |
| 75 to 79 Years | 1,515 (2.9%) | 1,578 (3.0%) |
| 80 to 84 Years | 722 (1.4%) | 906 (1.7%) |
| 85 Years and over | 680 (1.3%) | 1,078 (2.1%) |
| Total | 51,773 (100.0%) | 52,103 (100.0%) |
Families and Households in Cecil County
Median Family Size in Cecil County
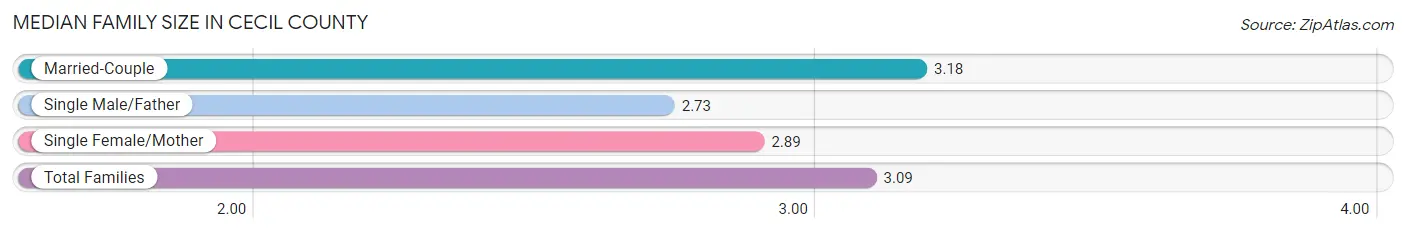
The median family size in Cecil County is 3.09 persons per family, with married-couple families (20,743 | 75.3%) accounting for the largest median family size of 3.18 persons per family. On the other hand, single male/father families (2,014 | 7.3%) represent the smallest median family size with 2.73 persons per family.
| Family Type | # Families | Family Size |
| Married-Couple | 20,743 (75.3%) | 3.18 |
| Single Male/Father | 2,014 (7.3%) | 2.73 |
| Single Female/Mother | 4,781 (17.4%) | 2.89 |
| Total Families | 27,538 (100.0%) | 3.09 |
Median Household Size in Cecil County
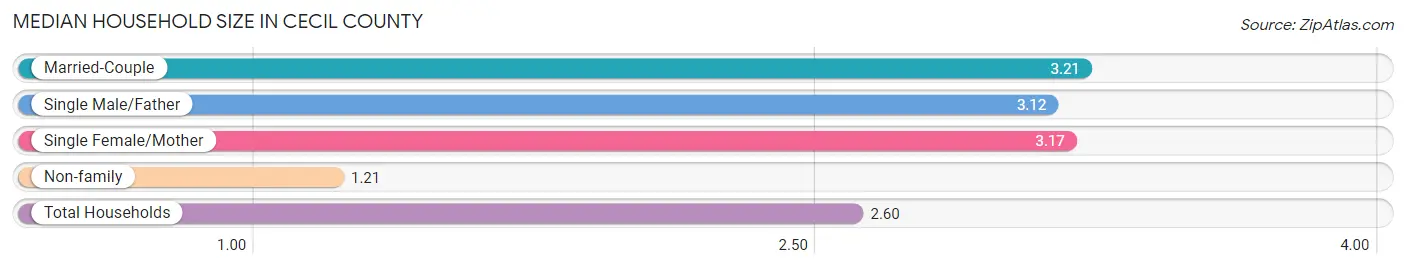
The median household size in Cecil County is 2.60 persons per household, with married-couple households (20,743 | 52.7%) accounting for the largest median household size of 3.21 persons per household. non-family households (11,800 | 30.0%) represent the smallest median household size with 1.21 persons per household.
| Household Type | # Households | Household Size |
| Married-Couple | 20,743 (52.7%) | 3.21 |
| Single Male/Father | 2,014 (5.1%) | 3.12 |
| Single Female/Mother | 4,781 (12.1%) | 3.17 |
| Non-family | 11,800 (30.0%) | 1.21 |
| Total Households | 39,338 (100.0%) | 2.60 |
Household Size by Marriage Status in Cecil County
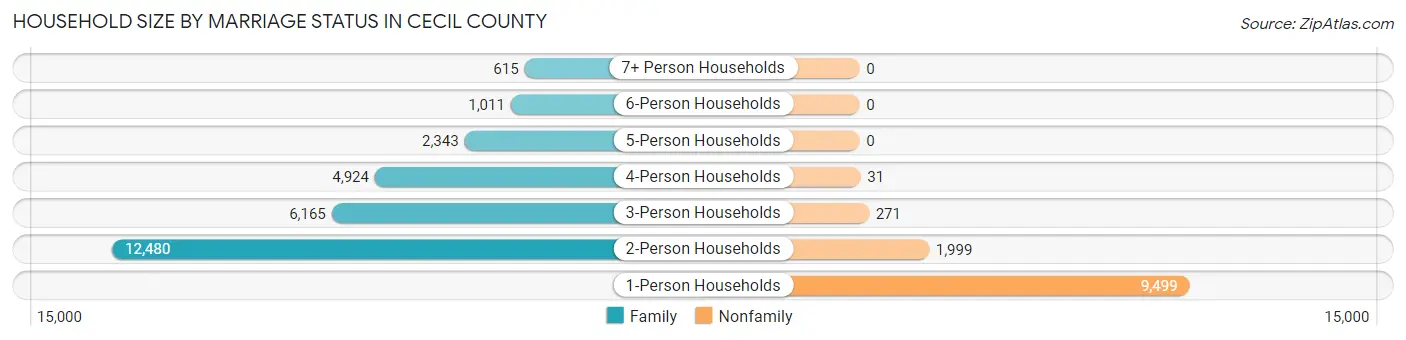
Out of a total of 39,338 households in Cecil County, 27,538 (70.0%) are family households, while 11,800 (30.0%) are nonfamily households. The most numerous type of family households are 2-person households, comprising 12,480, and the most common type of nonfamily households are 1-person households, comprising 9,499.
| Household Size | Family Households | Nonfamily Households |
| 1-Person Households | - | 9,499 (24.1%) |
| 2-Person Households | 12,480 (31.7%) | 1,999 (5.1%) |
| 3-Person Households | 6,165 (15.7%) | 271 (0.7%) |
| 4-Person Households | 4,924 (12.5%) | 31 (0.1%) |
| 5-Person Households | 2,343 (6.0%) | 0 (0.0%) |
| 6-Person Households | 1,011 (2.6%) | 0 (0.0%) |
| 7+ Person Households | 615 (1.6%) | 0 (0.0%) |
| Total | 27,538 (70.0%) | 11,800 (30.0%) |
Female Fertility in Cecil County
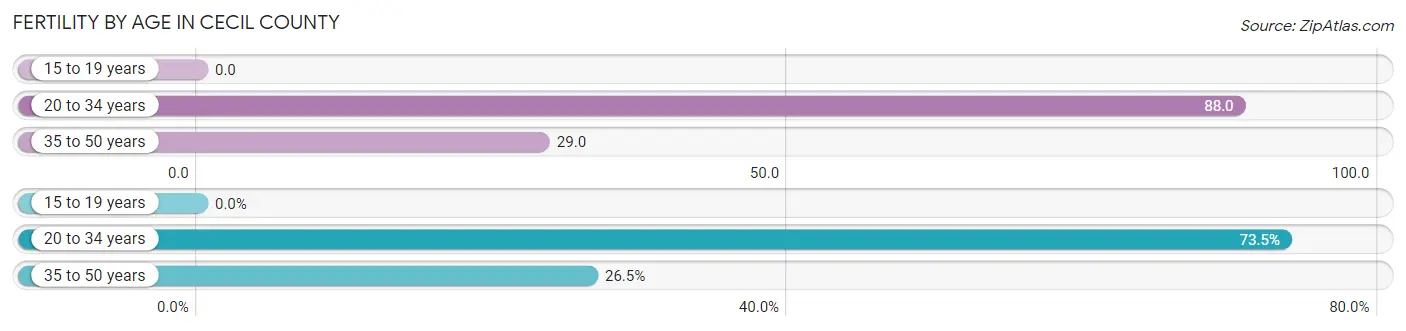
Fertility by Age in Cecil County
Average fertility rate in Cecil County is 49.0 births per 1,000 women. Women in the age bracket of 20 to 34 years have the highest fertility rate with 88.0 births per 1,000 women. Women in the age bracket of 20 to 34 years acount for 73.5% of all women with births.
| Age Bracket | Women with Births | Births / 1,000 Women |
| 15 to 19 years | 0 (0.0%) | 0.0 |
| 20 to 34 years | 825 (73.5%) | 88.0 |
| 35 to 50 years | 297 (26.5%) | 29.0 |
| Total | 1,122 (100.0%) | 49.0 |
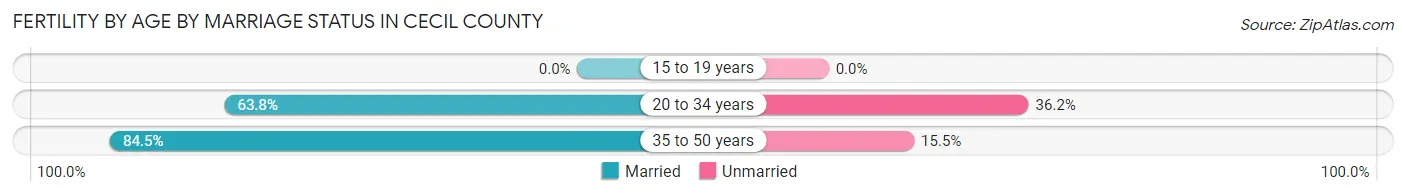
Fertility by Age by Marriage Status in Cecil County
69.3% of women with births (1,122) in Cecil County are married. The highest percentage of unmarried women with births falls into 20 to 34 years age bracket with 36.2% of them unmarried at the time of birth, while the lowest percentage of unmarried women with births belong to 35 to 50 years age bracket with 15.5% of them unmarried.
| Age Bracket | Married | Unmarried |
| 15 to 19 years | 0 (0.0%) | 0 (0.0%) |
| 20 to 34 years | 526 (63.8%) | 299 (36.2%) |
| 35 to 50 years | 251 (84.5%) | 46 (15.5%) |
| Total | 778 (69.3%) | 344 (30.7%) |
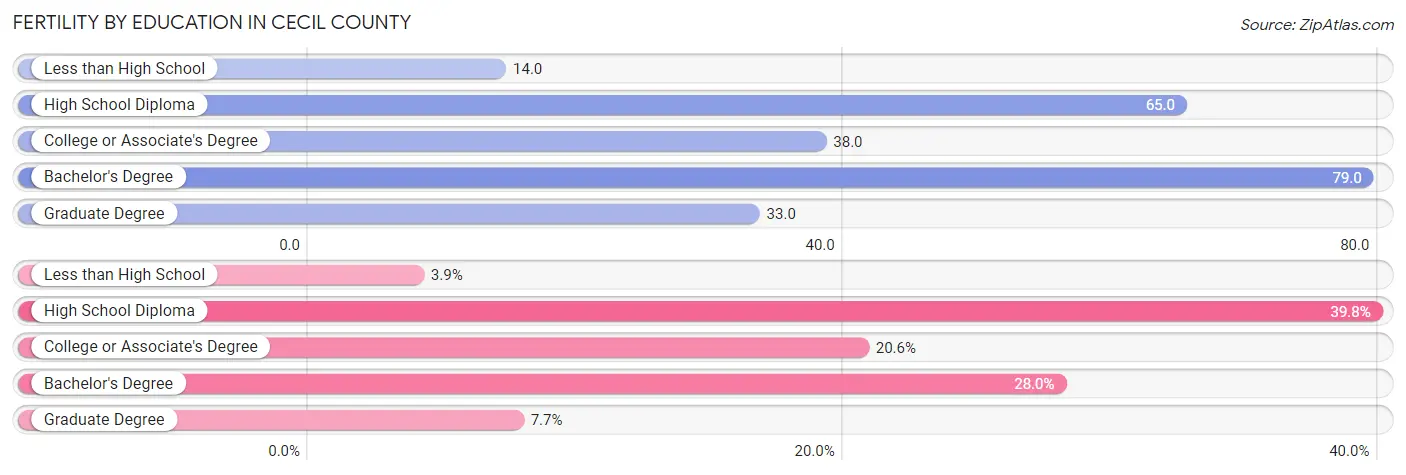
Fertility by Education in Cecil County
Average fertility rate in Cecil County is 49.0 births per 1,000 women. Women with the education attainment of bachelor's degree have the highest fertility rate of 79.0 births per 1,000 women, while women with the education attainment of less than high school have the lowest fertility at 14.0 births per 1,000 women. Women with the education attainment of high school diploma represent 39.8% of all women with births.
| Educational Attainment | Women with Births | Births / 1,000 Women |
| Less than High School | 44 (3.9%) | 14.0 |
| High School Diploma | 447 (39.8%) | 65.0 |
| College or Associate's Degree | 231 (20.6%) | 38.0 |
| Bachelor's Degree | 314 (28.0%) | 79.0 |
| Graduate Degree | 86 (7.7%) | 33.0 |
| Total | 1,122 (100.0%) | 49.0 |
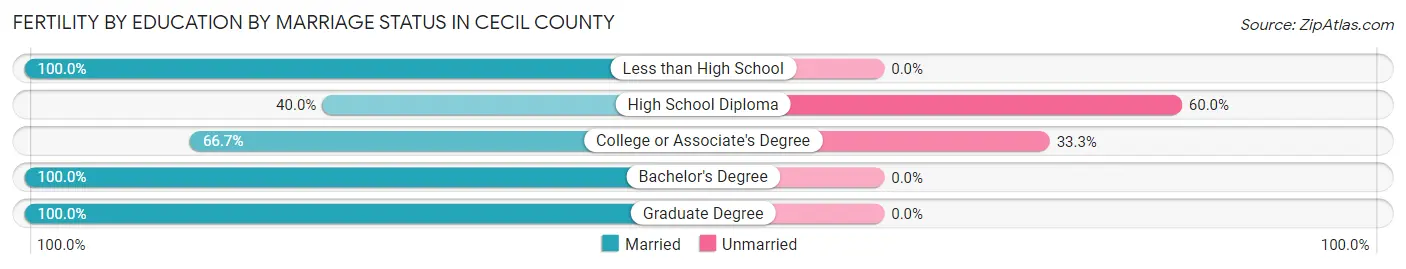
Fertility by Education by Marriage Status in Cecil County
30.7% of women with births in Cecil County are unmarried. Women with the educational attainment of less than high school are most likely to be married with 100.0% of them married at childbirth, while women with the educational attainment of high school diploma are least likely to be married with 60.0% of them unmarried at childbirth.
| Educational Attainment | Married | Unmarried |
| Less than High School | 44 (100.0%) | 0 (0.0%) |
| High School Diploma | 179 (40.0%) | 268 (60.0%) |
| College or Associate's Degree | 154 (66.7%) | 77 (33.3%) |
| Bachelor's Degree | 314 (100.0%) | 0 (0.0%) |
| Graduate Degree | 86 (100.0%) | 0 (0.0%) |
| Total | 778 (69.3%) | 344 (30.7%) |
Income in Cecil County
Income Overview in Cecil County
Per Capita Income in Cecil County is $40,520, while median incomes of families and households are $103,315 and $86,869 respectively.
| Characteristic | Number | Measure |
| Per Capita Income | 103,876 | $40,520 |
| Median Family Income | 27,538 | $103,315 |
| Mean Family Income | 27,538 | $119,591 |
| Median Household Income | 39,338 | $86,869 |
| Mean Household Income | 39,338 | $105,463 |
| Income Deficit | 27,538 | $13,873 |
| Wage / Income Gap (%) | 103,876 | 32.83% |
| Wage / Income Gap ($) | 103,876 | 67.17¢ per $1 |
| Gini / Inequality Index | 103,876 | 0.43 |
Earnings by Sex in Cecil County
Average Earnings in Cecil County are $49,174, $58,794 for men and $39,494 for women, a difference of 32.8%.
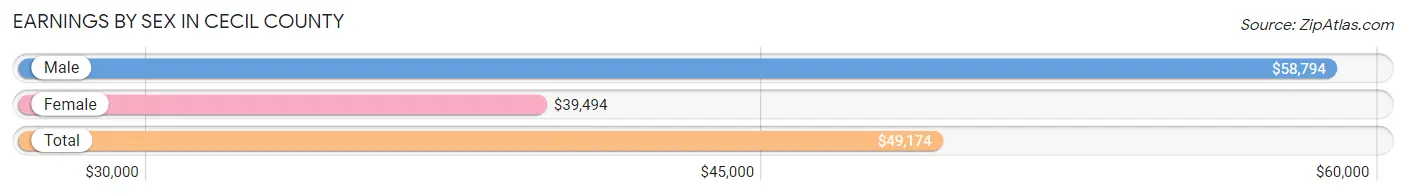
| Sex | Number | Average Earnings |
| Male | 28,741 (53.0%) | $58,794 |
| Female | 25,507 (47.0%) | $39,494 |
| Total | 54,248 (100.0%) | $49,174 |
Earnings by Sex by Income Bracket in Cecil County
The most common earnings brackets in Cecil County are $100,000+ for men (5,379 | 18.7%) and $75,000 to $99,999 for women (3,315 | 13.0%).
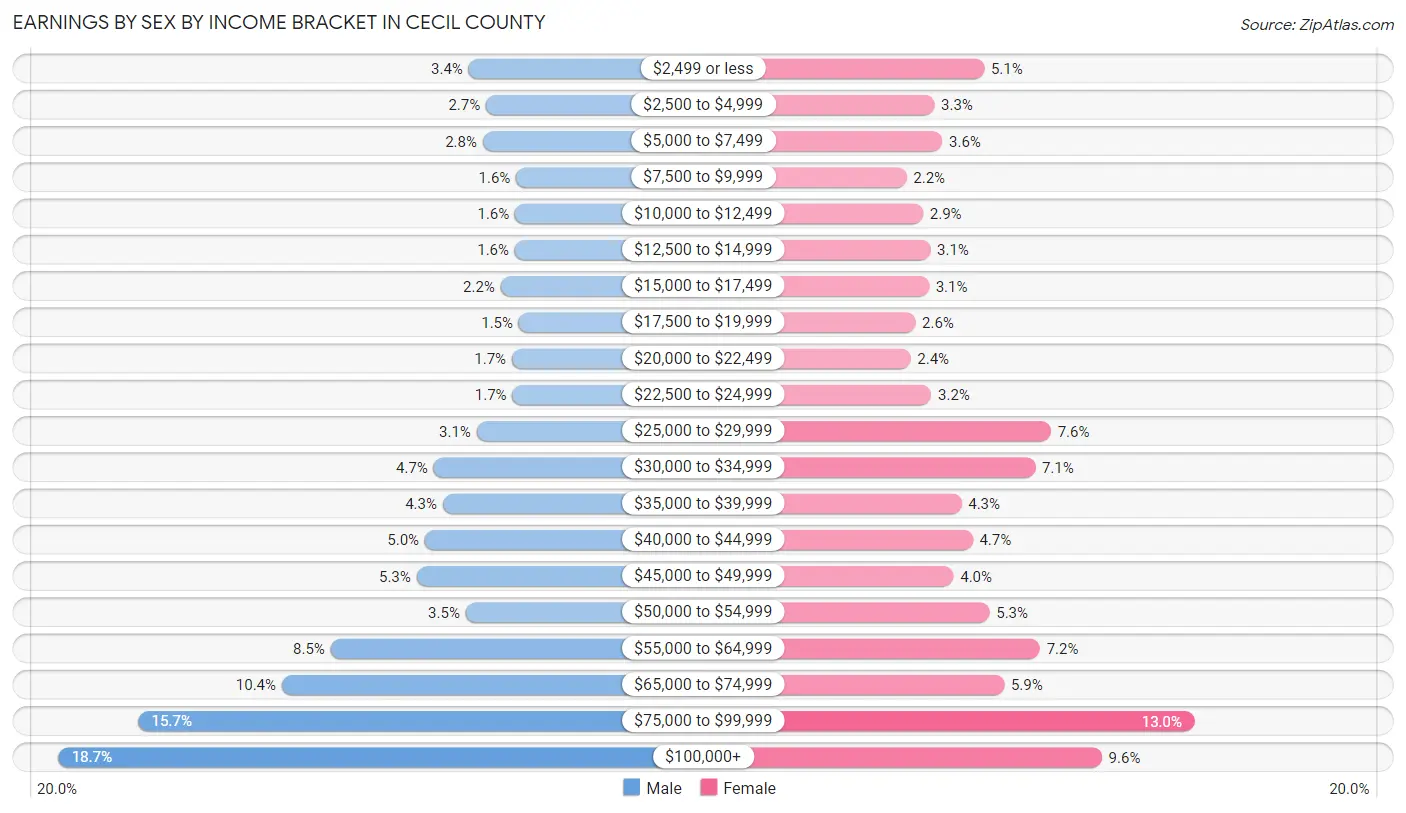
| Income | Male | Female |
| $2,499 or less | 967 (3.4%) | 1,311 (5.1%) |
| $2,500 to $4,999 | 778 (2.7%) | 833 (3.3%) |
| $5,000 to $7,499 | 814 (2.8%) | 911 (3.6%) |
| $7,500 to $9,999 | 453 (1.6%) | 569 (2.2%) |
| $10,000 to $12,499 | 466 (1.6%) | 726 (2.9%) |
| $12,500 to $14,999 | 469 (1.6%) | 797 (3.1%) |
| $15,000 to $17,499 | 621 (2.2%) | 783 (3.1%) |
| $17,500 to $19,999 | 424 (1.5%) | 652 (2.6%) |
| $20,000 to $22,499 | 500 (1.7%) | 607 (2.4%) |
| $22,500 to $24,999 | 495 (1.7%) | 805 (3.2%) |
| $25,000 to $29,999 | 879 (3.1%) | 1,948 (7.6%) |
| $30,000 to $34,999 | 1,343 (4.7%) | 1,797 (7.0%) |
| $35,000 to $39,999 | 1,244 (4.3%) | 1,093 (4.3%) |
| $40,000 to $44,999 | 1,436 (5.0%) | 1,201 (4.7%) |
| $45,000 to $49,999 | 1,525 (5.3%) | 1,018 (4.0%) |
| $50,000 to $54,999 | 996 (3.5%) | 1,361 (5.3%) |
| $55,000 to $64,999 | 2,453 (8.5%) | 1,843 (7.2%) |
| $65,000 to $74,999 | 2,979 (10.4%) | 1,502 (5.9%) |
| $75,000 to $99,999 | 4,520 (15.7%) | 3,315 (13.0%) |
| $100,000+ | 5,379 (18.7%) | 2,435 (9.6%) |
| Total | 28,741 (100.0%) | 25,507 (100.0%) |
Earnings by Sex by Educational Attainment in Cecil County
Average earnings in Cecil County are $66,326 for men and $46,285 for women, a difference of 30.2%. Men with an educational attainment of graduate degree enjoy the highest average annual earnings of $100,516, while those with less than high school education earn the least with $41,758. Women with an educational attainment of graduate degree earn the most with the average annual earnings of $77,525, while those with less than high school education have the smallest earnings of $16,939.
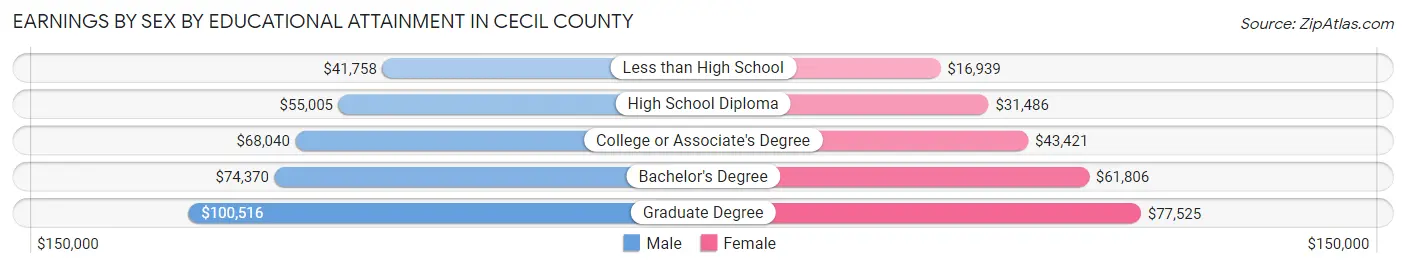
| Educational Attainment | Male Income | Female Income |
| Less than High School | $41,758 | $16,939 |
| High School Diploma | $55,005 | $31,486 |
| College or Associate's Degree | $68,040 | $43,421 |
| Bachelor's Degree | $74,370 | $61,806 |
| Graduate Degree | $100,516 | $77,525 |
| Total | $66,326 | $46,285 |
Family Income in Cecil County
Family Income Brackets in Cecil County
According to the Cecil County family income data, there are 7,242 families falling into the $100,000 to $149,999 income range, which is the most common income bracket and makes up 26.3% of all families. Conversely, the $10,000 to $14,999 income bracket is the least frequent group with only 330 families (1.2%) belonging to this category.
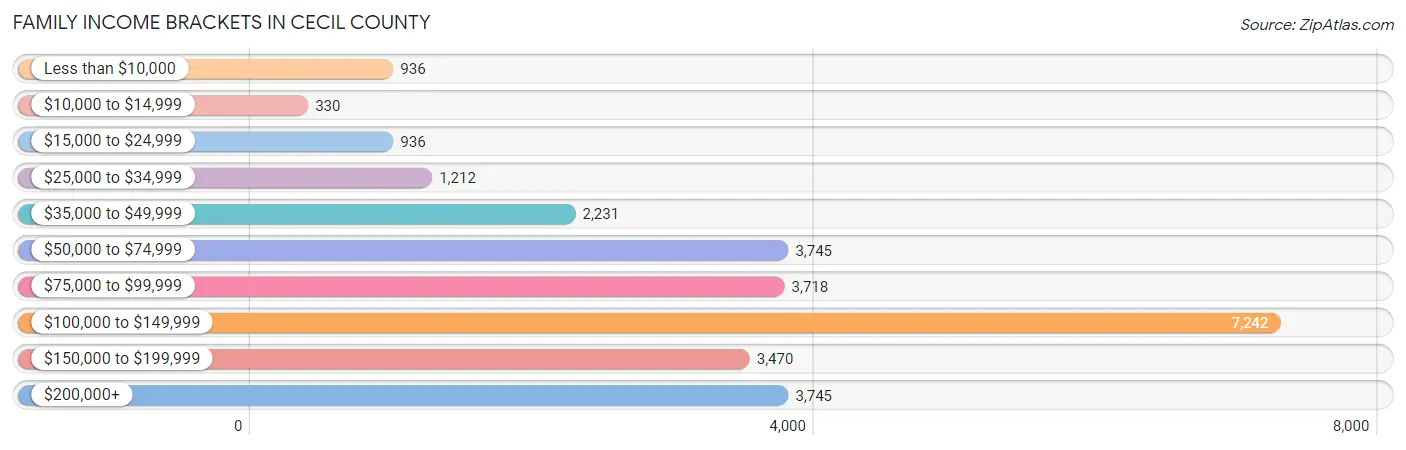
| Income Bracket | # Families | % Families |
| Less than $10,000 | 936 | 3.4% |
| $10,000 to $14,999 | 330 | 1.2% |
| $15,000 to $24,999 | 936 | 3.4% |
| $25,000 to $34,999 | 1,212 | 4.4% |
| $35,000 to $49,999 | 2,231 | 8.1% |
| $50,000 to $74,999 | 3,745 | 13.6% |
| $75,000 to $99,999 | 3,718 | 13.5% |
| $100,000 to $149,999 | 7,242 | 26.3% |
| $150,000 to $199,999 | 3,470 | 12.6% |
| $200,000+ | 3,745 | 13.6% |
Family Income by Famaliy Size in Cecil County
4-person families (4,762 | 17.3%) account for the highest median family income in Cecil County with $130,565 per family, while 2-person families (13,313 | 48.3%) have the highest median income of $45,796 per family member.
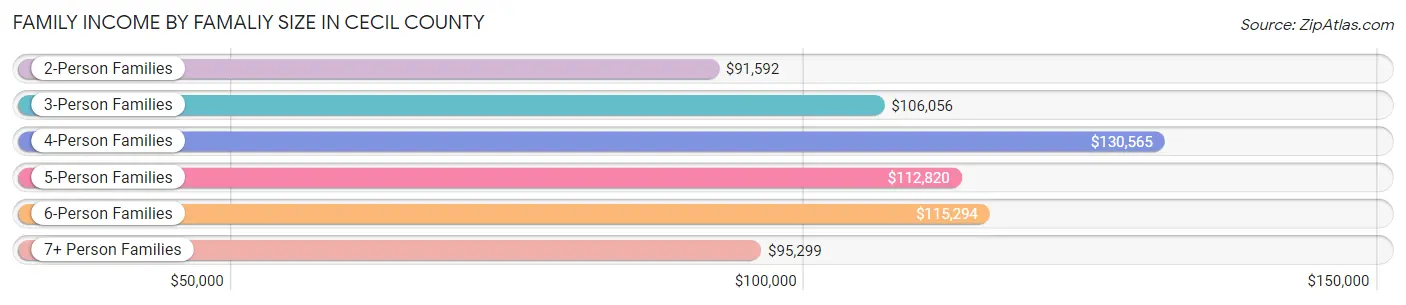
| Income Bracket | # Families | Median Income |
| 2-Person Families | 13,313 (48.3%) | $91,592 |
| 3-Person Families | 5,932 (21.5%) | $106,056 |
| 4-Person Families | 4,762 (17.3%) | $130,565 |
| 5-Person Families | 2,368 (8.6%) | $112,820 |
| 6-Person Families | 658 (2.4%) | $115,294 |
| 7+ Person Families | 505 (1.8%) | $95,299 |
| Total | 27,538 (100.0%) | $103,315 |
Family Income by Number of Earners in Cecil County
The median family income in Cecil County is $103,315, with families comprising 3+ earners (3,363) having the highest median family income of $158,523, while families with no earners (4,229) have the lowest median family income of $53,957, accounting for 12.2% and 15.4% of families, respectively.
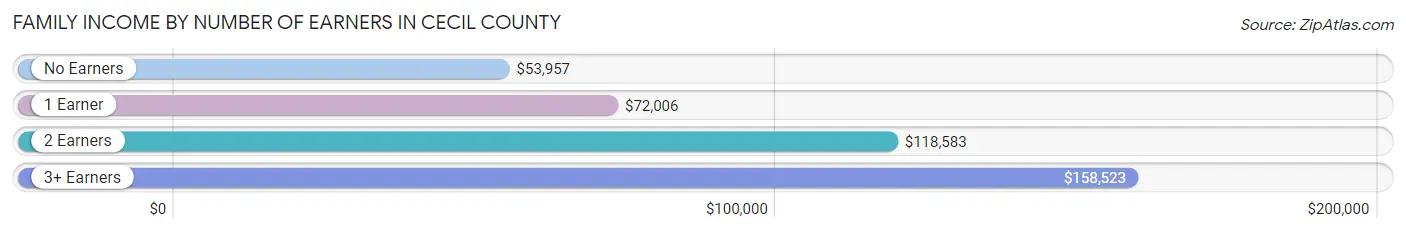
| Number of Earners | # Families | Median Income |
| No Earners | 4,229 (15.4%) | $53,957 |
| 1 Earner | 8,357 (30.3%) | $72,006 |
| 2 Earners | 11,589 (42.1%) | $118,583 |
| 3+ Earners | 3,363 (12.2%) | $158,523 |
| Total | 27,538 (100.0%) | $103,315 |
Household Income in Cecil County
Household Income Brackets in Cecil County
With 8,969 households falling in the category, the $100,000 to $149,999 income range is the most frequent in Cecil County, accounting for 22.8% of all households. In contrast, only 865 households (2.2%) fall into the $10,000 to $14,999 income bracket, making it the least populous group.
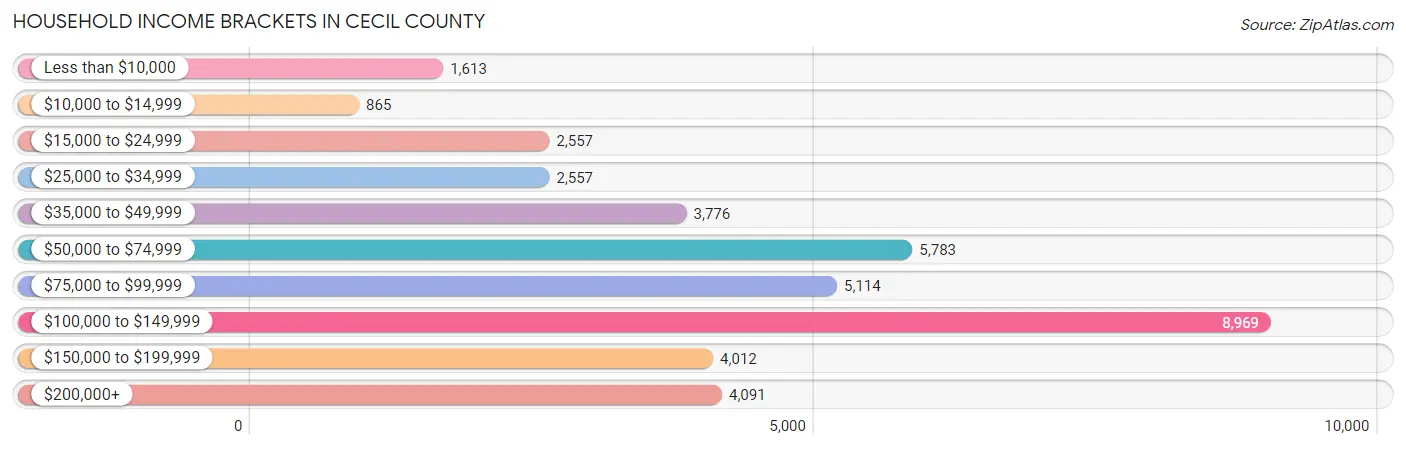
| Income Bracket | # Households | % Households |
| Less than $10,000 | 1,613 | 4.1% |
| $10,000 to $14,999 | 865 | 2.2% |
| $15,000 to $24,999 | 2,557 | 6.5% |
| $25,000 to $34,999 | 2,557 | 6.5% |
| $35,000 to $49,999 | 3,776 | 9.6% |
| $50,000 to $74,999 | 5,783 | 14.7% |
| $75,000 to $99,999 | 5,114 | 13.0% |
| $100,000 to $149,999 | 8,969 | 22.8% |
| $150,000 to $199,999 | 4,012 | 10.2% |
| $200,000+ | 4,091 | 10.4% |
Household Income by Householder Age in Cecil County
The median household income in Cecil County is $86,869, with the highest median household income of $104,357 found in the 45 to 64 years age bracket for the primary householder. A total of 16,612 households (42.2%) fall into this category. Meanwhile, the 15 to 24 years age bracket for the primary householder has the lowest median household income of $48,818, with 1,015 households (2.6%) in this group.
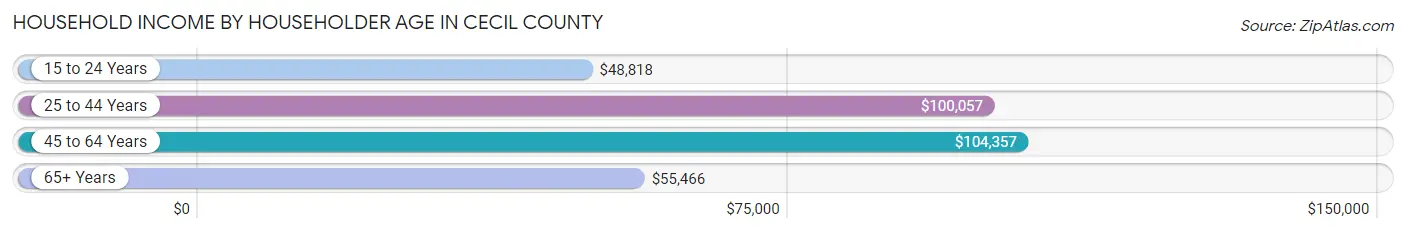
| Income Bracket | # Households | Median Income |
| 15 to 24 Years | 1,015 (2.6%) | $48,818 |
| 25 to 44 Years | 11,273 (28.7%) | $100,057 |
| 45 to 64 Years | 16,612 (42.2%) | $104,357 |
| 65+ Years | 10,438 (26.5%) | $55,466 |
| Total | 39,338 (100.0%) | $86,869 |
Poverty in Cecil County
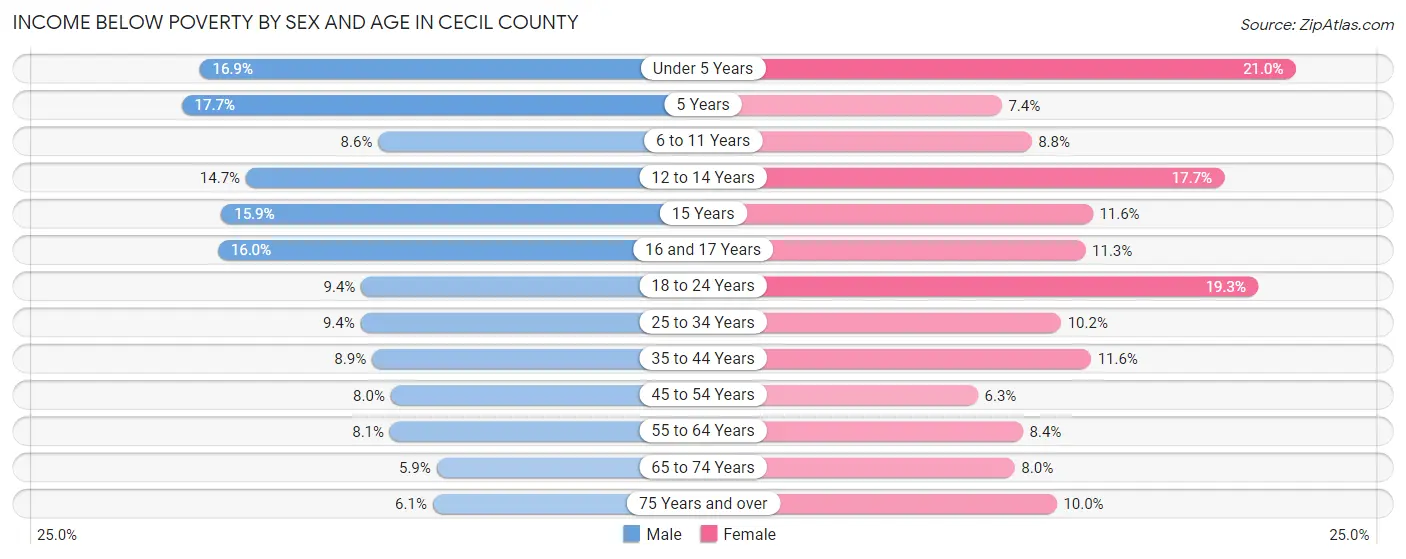
Income Below Poverty by Sex and Age in Cecil County
With 9.3% poverty level for males and 10.8% for females among the residents of Cecil County, 5 year old males and under 5 year old females are the most vulnerable to poverty, with 79 males (17.7%) and 625 females (21.0%) in their respective age groups living below the poverty level.
| Age Bracket | Male | Female |
| Under 5 Years | 475 (16.9%) | 625 (21.0%) |
| 5 Years | 79 (17.7%) | 43 (7.4%) |
| 6 to 11 Years | 341 (8.6%) | 337 (8.8%) |
| 12 to 14 Years | 315 (14.7%) | 332 (17.7%) |
| 15 Years | 113 (15.9%) | 67 (11.6%) |
| 16 and 17 Years | 243 (16.0%) | 156 (11.3%) |
| 18 to 24 Years | 407 (9.4%) | 786 (19.3%) |
| 25 to 34 Years | 590 (9.4%) | 646 (10.2%) |
| 35 to 44 Years | 530 (8.9%) | 727 (11.6%) |
| 45 to 54 Years | 569 (8.0%) | 448 (6.3%) |
| 55 to 64 Years | 622 (8.1%) | 651 (8.4%) |
| 65 to 74 Years | 295 (5.9%) | 429 (8.0%) |
| 75 Years and over | 171 (6.1%) | 344 (10.0%) |
| Total | 4,750 (9.3%) | 5,591 (10.8%) |
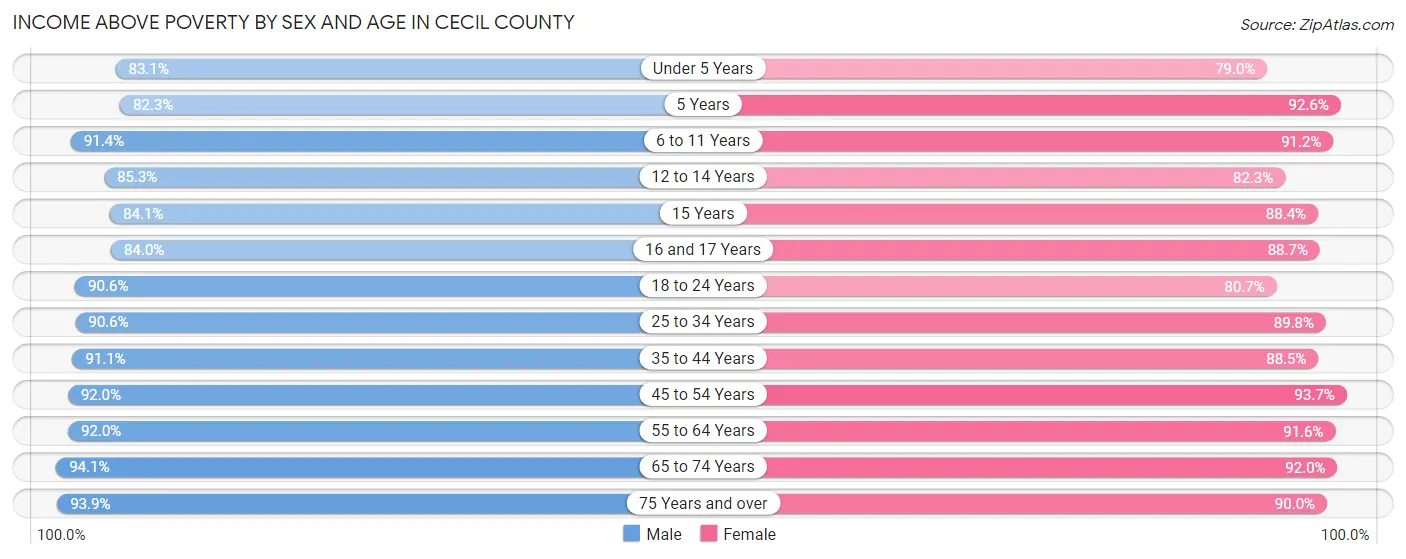
Income Above Poverty by Sex and Age in Cecil County
According to the poverty statistics in Cecil County, males aged 65 to 74 years and females aged 45 to 54 years are the age groups that are most secure financially, with 94.1% of males and 93.7% of females in these age groups living above the poverty line.
| Age Bracket | Male | Female |
| Under 5 Years | 2,339 (83.1%) | 2,345 (79.0%) |
| 5 Years | 367 (82.3%) | 537 (92.6%) |
| 6 to 11 Years | 3,631 (91.4%) | 3,499 (91.2%) |
| 12 to 14 Years | 1,824 (85.3%) | 1,541 (82.3%) |
| 15 Years | 599 (84.1%) | 509 (88.4%) |
| 16 and 17 Years | 1,273 (84.0%) | 1,226 (88.7%) |
| 18 to 24 Years | 3,930 (90.6%) | 3,286 (80.7%) |
| 25 to 34 Years | 5,683 (90.6%) | 5,715 (89.8%) |
| 35 to 44 Years | 5,436 (91.1%) | 5,567 (88.4%) |
| 45 to 54 Years | 6,537 (92.0%) | 6,658 (93.7%) |
| 55 to 64 Years | 7,101 (91.9%) | 7,110 (91.6%) |
| 65 to 74 Years | 4,726 (94.1%) | 4,927 (92.0%) |
| 75 Years and over | 2,649 (93.9%) | 3,109 (90.0%) |
| Total | 46,095 (90.7%) | 46,029 (89.2%) |
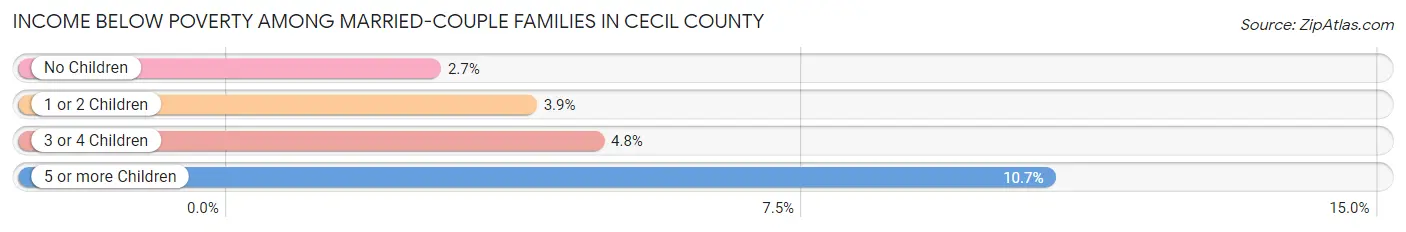
Income Below Poverty Among Married-Couple Families in Cecil County
The poverty statistics for married-couple families in Cecil County show that 3.2% or 673 of the total 20,743 families live below the poverty line. Families with 5 or more children have the highest poverty rate of 10.7%, comprising of 19 families. On the other hand, families with no children have the lowest poverty rate of 2.6%, which includes 341 families.
| Children | Above Poverty | Below Poverty |
| No Children | 12,545 (97.4%) | 341 (2.6%) |
| 1 or 2 Children | 5,911 (96.1%) | 240 (3.9%) |
| 3 or 4 Children | 1,455 (95.2%) | 73 (4.8%) |
| 5 or more Children | 159 (89.3%) | 19 (10.7%) |
| Total | 20,070 (96.8%) | 673 (3.2%) |
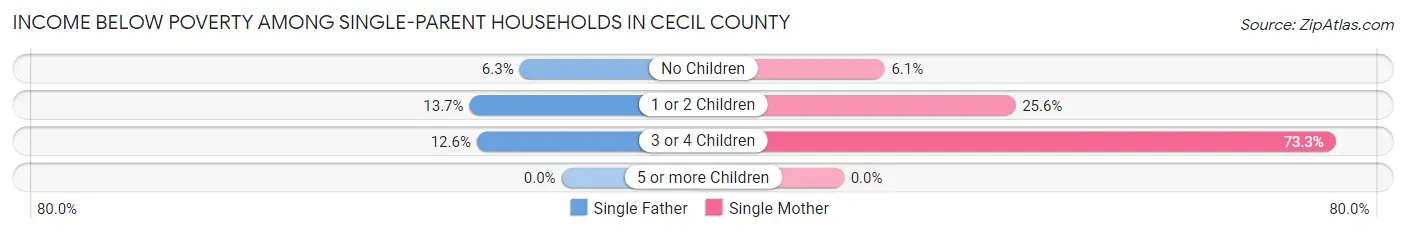
Income Below Poverty Among Single-Parent Households in Cecil County
According to the poverty data in Cecil County, 10.5% or 211 single-father households and 23.2% or 1,109 single-mother households are living below the poverty line. Among single-father households, those with 1 or 2 children have the highest poverty rate, with 145 households (13.7%) experiencing poverty. Likewise, among single-mother households, those with 3 or 4 children have the highest poverty rate, with 412 households (73.3%) falling below the poverty line.
| Children | Single Father | Single Mother |
| No Children | 54 (6.3%) | 119 (6.1%) |
| 1 or 2 Children | 145 (13.7%) | 578 (25.6%) |
| 3 or 4 Children | 12 (12.6%) | 412 (73.3%) |
| 5 or more Children | 0 (0.0%) | 0 (0.0%) |
| Total | 211 (10.5%) | 1,109 (23.2%) |
Income Below Poverty Among Married-Couple vs Single-Parent Households in Cecil County
The poverty data for Cecil County shows that 673 of the married-couple family households (3.2%) and 1,320 of the single-parent households (19.4%) are living below the poverty level. Within the married-couple family households, those with 5 or more children have the highest poverty rate, with 19 households (10.7%) falling below the poverty line. Among the single-parent households, those with 3 or 4 children have the highest poverty rate, with 424 household (64.5%) living below poverty.
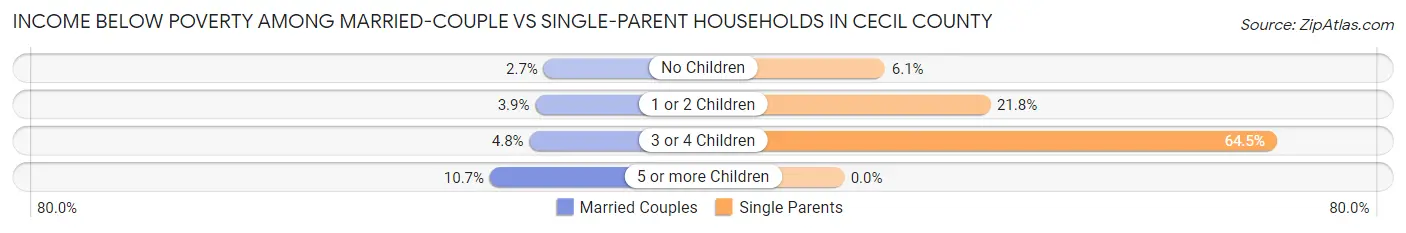
| Children | Married-Couple Families | Single-Parent Households |
| No Children | 341 (2.6%) | 173 (6.1%) |
| 1 or 2 Children | 240 (3.9%) | 723 (21.8%) |
| 3 or 4 Children | 73 (4.8%) | 424 (64.5%) |
| 5 or more Children | 19 (10.7%) | 0 (0.0%) |
| Total | 673 (3.2%) | 1,320 (19.4%) |
Employment Characteristics in Cecil County
Employment by Class of Employer in Cecil County
Among the 49,384 employed individuals in Cecil County, private company employees (32,157 | 65.1%), local government employees (3,911 | 7.9%), and not-for-profit organizations (3,756 | 7.6%) make up the most common classes of employment.
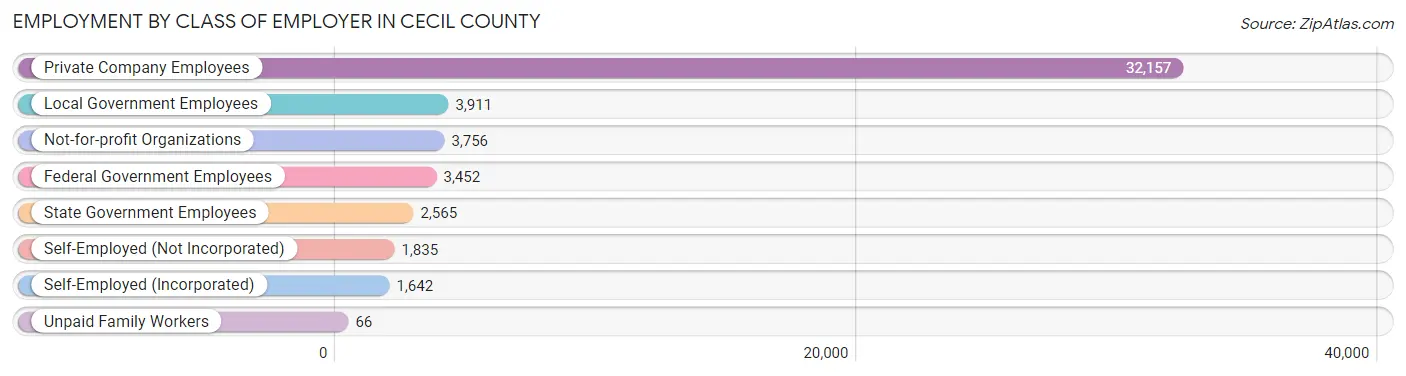
| Employer Class | # Employees | % Employees |
| Private Company Employees | 32,157 | 65.1% |
| Self-Employed (Incorporated) | 1,642 | 3.3% |
| Self-Employed (Not Incorporated) | 1,835 | 3.7% |
| Not-for-profit Organizations | 3,756 | 7.6% |
| Local Government Employees | 3,911 | 7.9% |
| State Government Employees | 2,565 | 5.2% |
| Federal Government Employees | 3,452 | 7.0% |
| Unpaid Family Workers | 66 | 0.1% |
| Total | 49,384 | 100.0% |
Employment Status by Age in Cecil County
According to the labor force statistics for Cecil County, out of the total population over 16 years of age (83,618), 63.2% or 52,847 individuals are in the labor force, with 4.9% or 2,590 of them unemployed. The age group with the highest labor force participation rate is 30 to 34 years, with 82.8% or 5,428 individuals in the labor force. Within the labor force, the 16 to 19 years age range has the highest percentage of unemployed individuals, with 13.3% or 316 of them being unemployed.
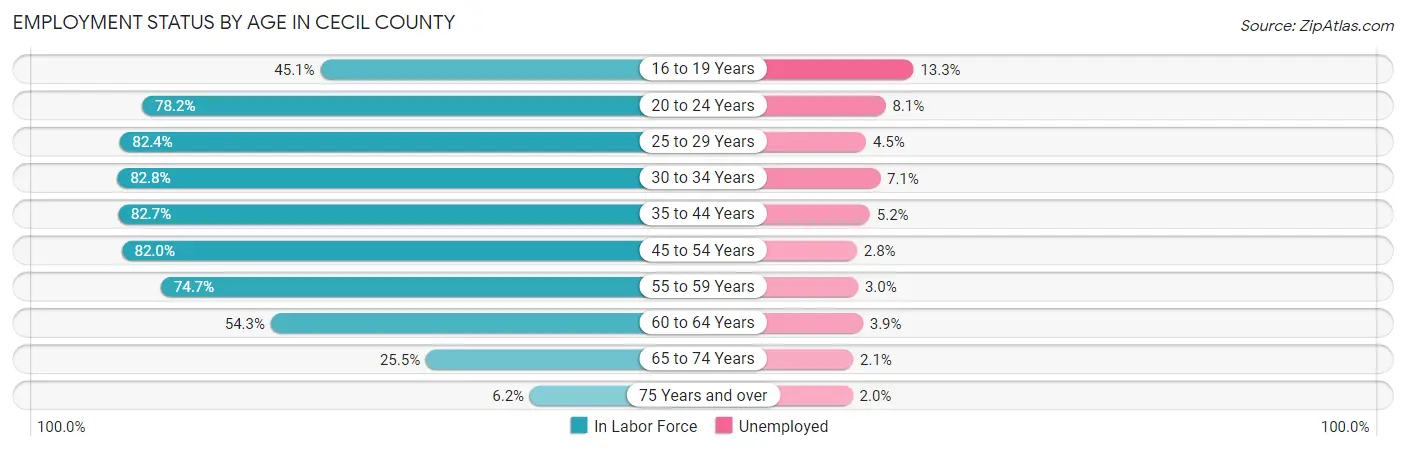
| Age Bracket | In Labor Force | Unemployed |
| 16 to 19 Years | 2,375 (45.1%) | 316 (13.3%) |
| 20 to 24 Years | 4,809 (78.2%) | 390 (8.1%) |
| 25 to 29 Years | 5,180 (82.4%) | 233 (4.5%) |
| 30 to 34 Years | 5,428 (82.8%) | 385 (7.1%) |
| 35 to 44 Years | 10,216 (82.7%) | 531 (5.2%) |
| 45 to 54 Years | 11,754 (82.0%) | 329 (2.8%) |
| 55 to 59 Years | 5,572 (74.7%) | 167 (3.0%) |
| 60 to 64 Years | 4,459 (54.3%) | 174 (3.9%) |
| 65 to 74 Years | 2,684 (25.5%) | 56 (2.1%) |
| 75 Years and over | 402 (6.2%) | 8 (2.0%) |
| Total | 52,847 (63.2%) | 2,590 (4.9%) |
Employment Status by Educational Attainment in Cecil County
According to labor force statistics for Cecil County, 77.2% of individuals (42,613) out of the total population between 25 and 64 years of age (55,198) are in the labor force, with 4.3% or 1,832 of them being unemployed. The group with the highest labor force participation rate are those with the educational attainment of bachelor's degree or higher, with 87.4% or 13,457 individuals in the labor force. Within the labor force, individuals with high school diploma education have the highest percentage of unemployment, with 6.6% or 929 of them being unemployed.
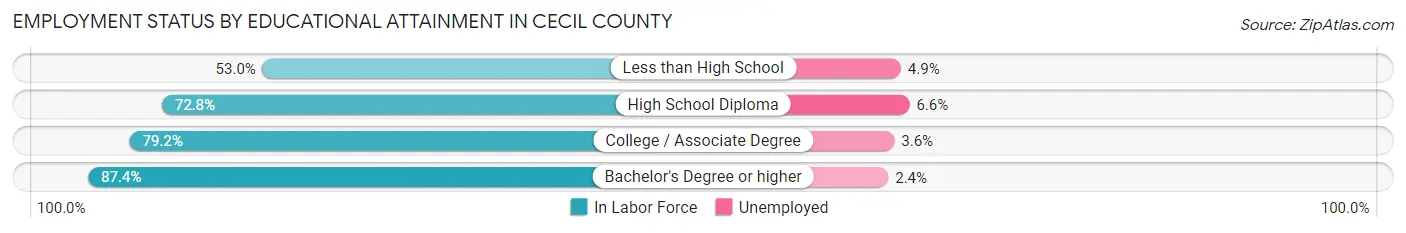
| Educational Attainment | In Labor Force | Unemployed |
| Less than High School | 2,279 (53.0%) | 211 (4.9%) |
| High School Diploma | 14,083 (72.8%) | 1,277 (6.6%) |
| College / Associate Degree | 12,796 (79.2%) | 582 (3.6%) |
| Bachelor's Degree or higher | 13,457 (87.4%) | 370 (2.4%) |
| Total | 42,613 (77.2%) | 2,374 (4.3%) |
Employment Occupations by Sex in Cecil County
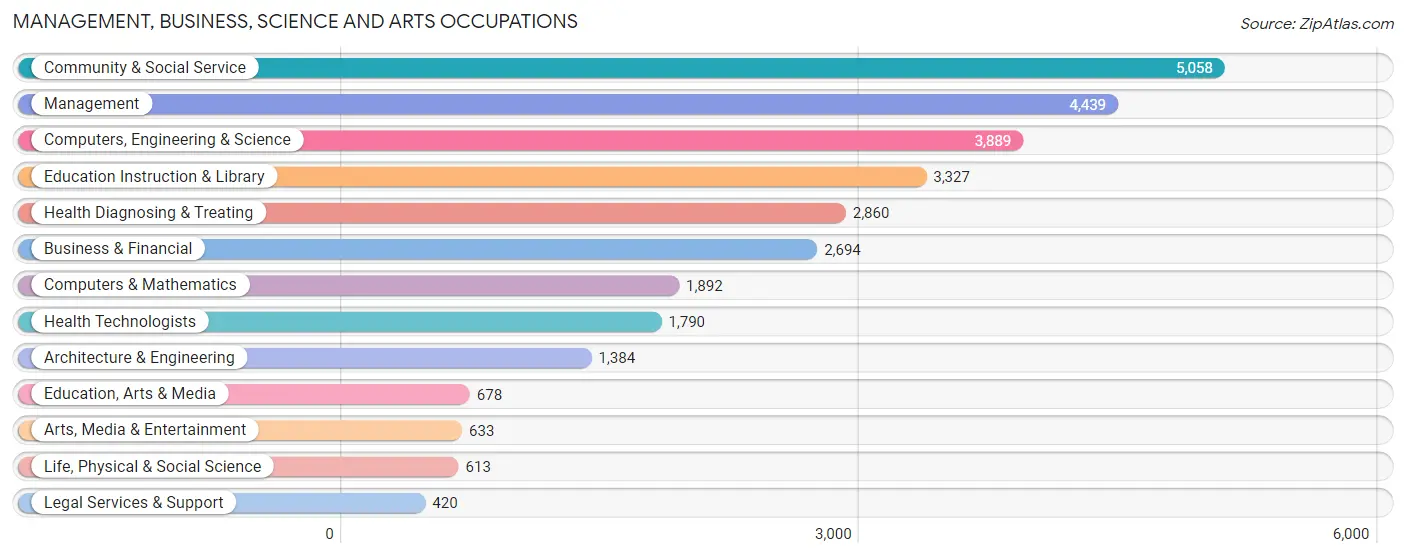
Management, Business, Science and Arts Occupations
The most common Management, Business, Science and Arts occupations in Cecil County are Community & Social Service (5,058 | 10.1%), Management (4,439 | 8.8%), Computers, Engineering & Science (3,889 | 7.7%), Education Instruction & Library (3,327 | 6.6%), and Health Diagnosing & Treating (2,860 | 5.7%).
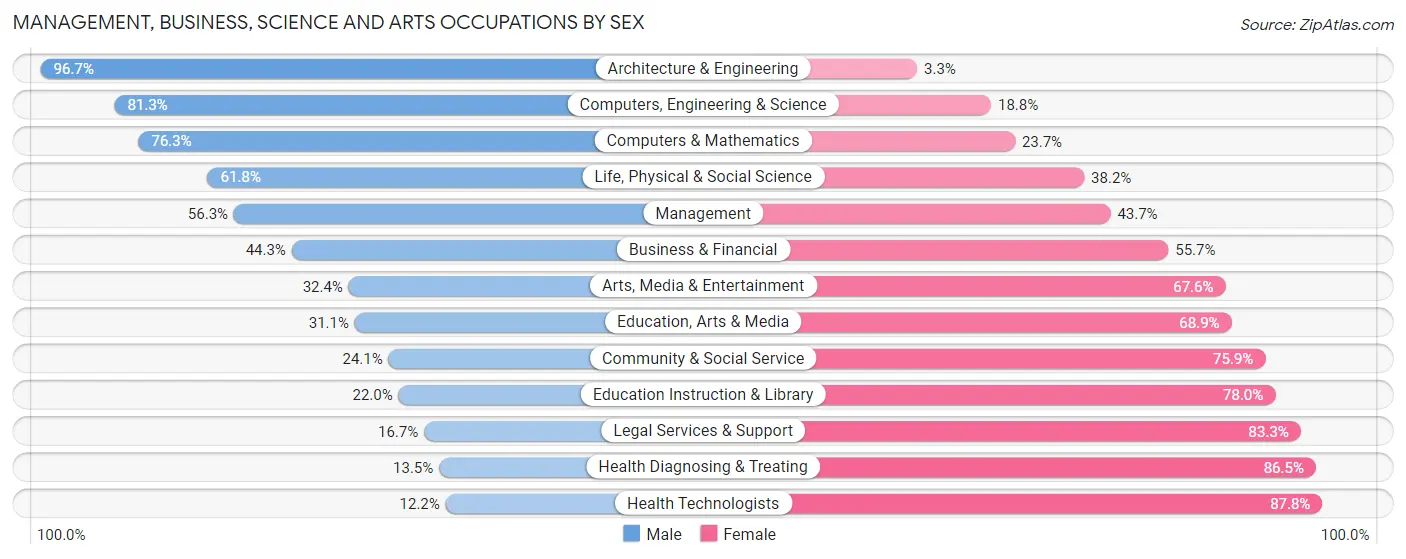
Management, Business, Science and Arts Occupations by Sex
Within the Management, Business, Science and Arts occupations in Cecil County, the most male-oriented occupations are Architecture & Engineering (96.7%), Computers, Engineering & Science (81.2%), and Computers & Mathematics (76.3%), while the most female-oriented occupations are Health Technologists (87.8%), Health Diagnosing & Treating (86.5%), and Legal Services & Support (83.3%).
| Occupation | Male | Female |
| Management | 2,501 (56.3%) | 1,938 (43.7%) |
| Business & Financial | 1,193 (44.3%) | 1,501 (55.7%) |
| Computers, Engineering & Science | 3,160 (81.2%) | 729 (18.8%) |
| Computers & Mathematics | 1,443 (76.3%) | 449 (23.7%) |
| Architecture & Engineering | 1,338 (96.7%) | 46 (3.3%) |
| Life, Physical & Social Science | 379 (61.8%) | 234 (38.2%) |
| Community & Social Service | 1,218 (24.1%) | 3,840 (75.9%) |
| Education, Arts & Media | 211 (31.1%) | 467 (68.9%) |
| Legal Services & Support | 70 (16.7%) | 350 (83.3%) |
| Education Instruction & Library | 732 (22.0%) | 2,595 (78.0%) |
| Arts, Media & Entertainment | 205 (32.4%) | 428 (67.6%) |
| Health Diagnosing & Treating | 387 (13.5%) | 2,473 (86.5%) |
| Health Technologists | 218 (12.2%) | 1,572 (87.8%) |
| Total (Category) | 8,459 (44.7%) | 10,481 (55.3%) |
| Total (Overall) | 26,632 (53.1%) | 23,564 (46.9%) |
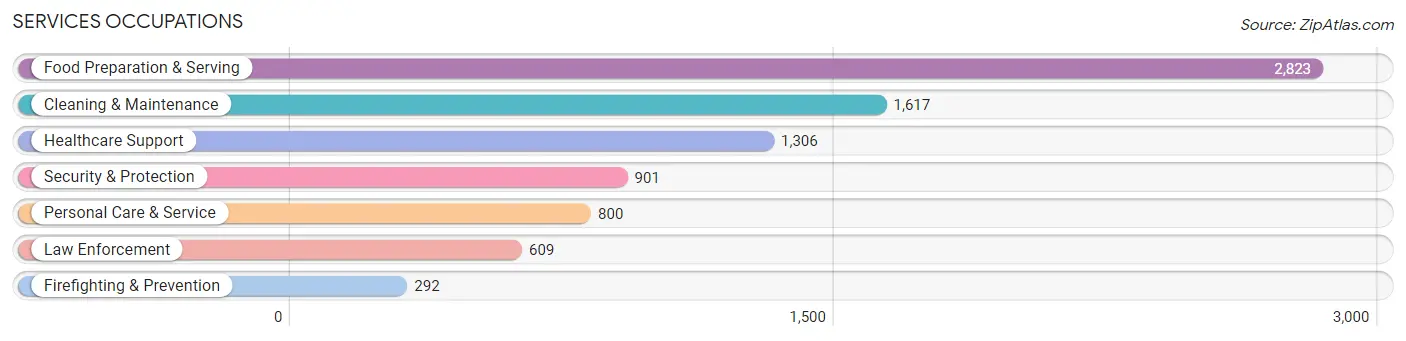
Services Occupations
The most common Services occupations in Cecil County are Food Preparation & Serving (2,823 | 5.6%), Cleaning & Maintenance (1,617 | 3.2%), Healthcare Support (1,306 | 2.6%), Security & Protection (901 | 1.8%), and Personal Care & Service (800 | 1.6%).
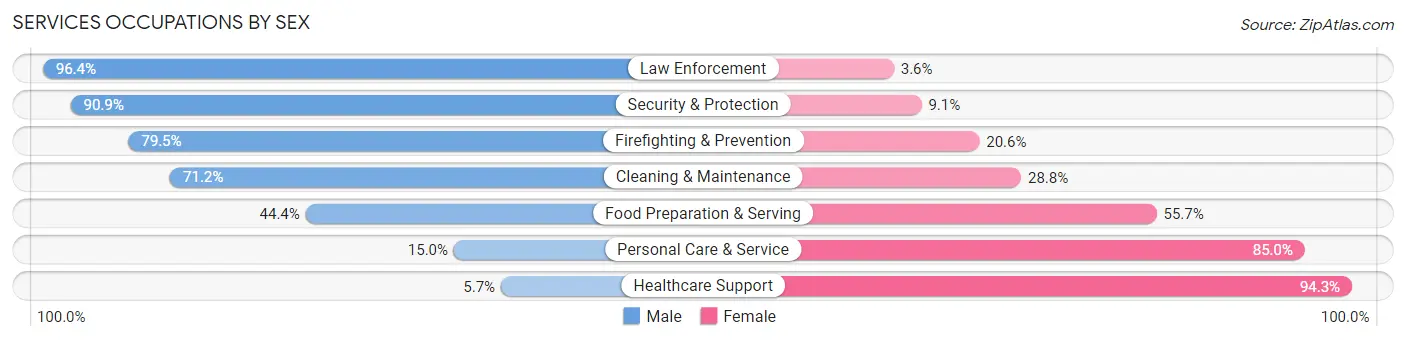
Services Occupations by Sex
Within the Services occupations in Cecil County, the most male-oriented occupations are Law Enforcement (96.4%), Security & Protection (90.9%), and Firefighting & Prevention (79.4%), while the most female-oriented occupations are Healthcare Support (94.3%), Personal Care & Service (85.0%), and Food Preparation & Serving (55.6%).
| Occupation | Male | Female |
| Healthcare Support | 74 (5.7%) | 1,232 (94.3%) |
| Security & Protection | 819 (90.9%) | 82 (9.1%) |
| Firefighting & Prevention | 232 (79.4%) | 60 (20.5%) |
| Law Enforcement | 587 (96.4%) | 22 (3.6%) |
| Food Preparation & Serving | 1,252 (44.4%) | 1,571 (55.6%) |
| Cleaning & Maintenance | 1,151 (71.2%) | 466 (28.8%) |
| Personal Care & Service | 120 (15.0%) | 680 (85.0%) |
| Total (Category) | 3,416 (45.9%) | 4,031 (54.1%) |
| Total (Overall) | 26,632 (53.1%) | 23,564 (46.9%) |
Sales and Office Occupations
The most common Sales and Office occupations in Cecil County are Office & Administration (6,289 | 12.5%), and Sales & Related (4,608 | 9.2%).

Sales and Office Occupations by Sex
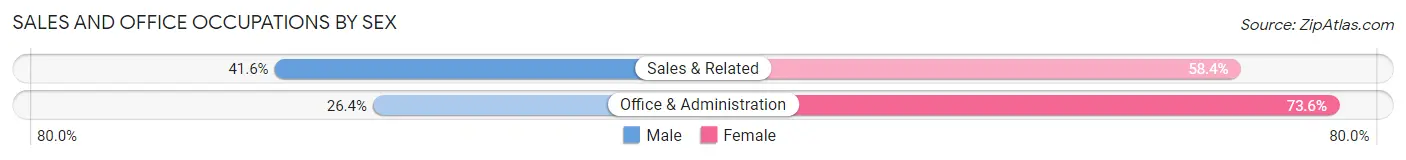
| Occupation | Male | Female |
| Sales & Related | 1,915 (41.6%) | 2,693 (58.4%) |
| Office & Administration | 1,662 (26.4%) | 4,627 (73.6%) |
| Total (Category) | 3,577 (32.8%) | 7,320 (67.2%) |
| Total (Overall) | 26,632 (53.1%) | 23,564 (46.9%) |
Natural Resources, Construction and Maintenance Occupations
The most common Natural Resources, Construction and Maintenance occupations in Cecil County are Construction & Extraction (3,365 | 6.7%), Installation, Maintenance & Repair (2,094 | 4.2%), and Farming, Fishing & Forestry (115 | 0.2%).

Natural Resources, Construction and Maintenance Occupations by Sex
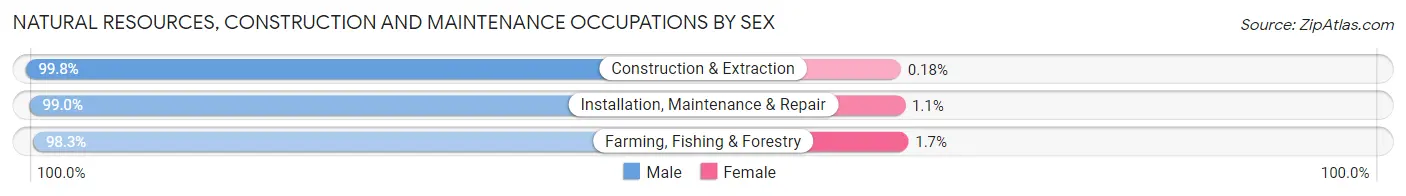
| Occupation | Male | Female |
| Farming, Fishing & Forestry | 113 (98.3%) | 2 (1.7%) |
| Construction & Extraction | 3,359 (99.8%) | 6 (0.2%) |
| Installation, Maintenance & Repair | 2,072 (99.0%) | 22 (1.1%) |
| Total (Category) | 5,544 (99.5%) | 30 (0.5%) |
| Total (Overall) | 26,632 (53.1%) | 23,564 (46.9%) |
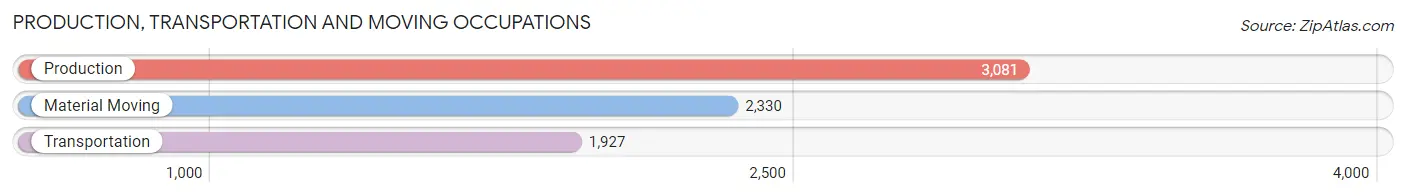
Production, Transportation and Moving Occupations
The most common Production, Transportation and Moving occupations in Cecil County are Production (3,081 | 6.1%), Material Moving (2,330 | 4.6%), and Transportation (1,927 | 3.8%).
Production, Transportation and Moving Occupations by Sex
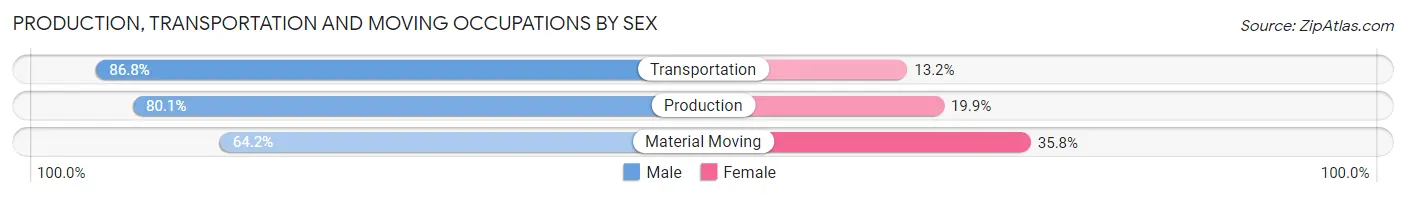
| Occupation | Male | Female |
| Production | 2,468 (80.1%) | 613 (19.9%) |
| Transportation | 1,673 (86.8%) | 254 (13.2%) |
| Material Moving | 1,495 (64.2%) | 835 (35.8%) |
| Total (Category) | 5,636 (76.8%) | 1,702 (23.2%) |
| Total (Overall) | 26,632 (53.1%) | 23,564 (46.9%) |
Employment Industries by Sex in Cecil County
Employment Industries in Cecil County
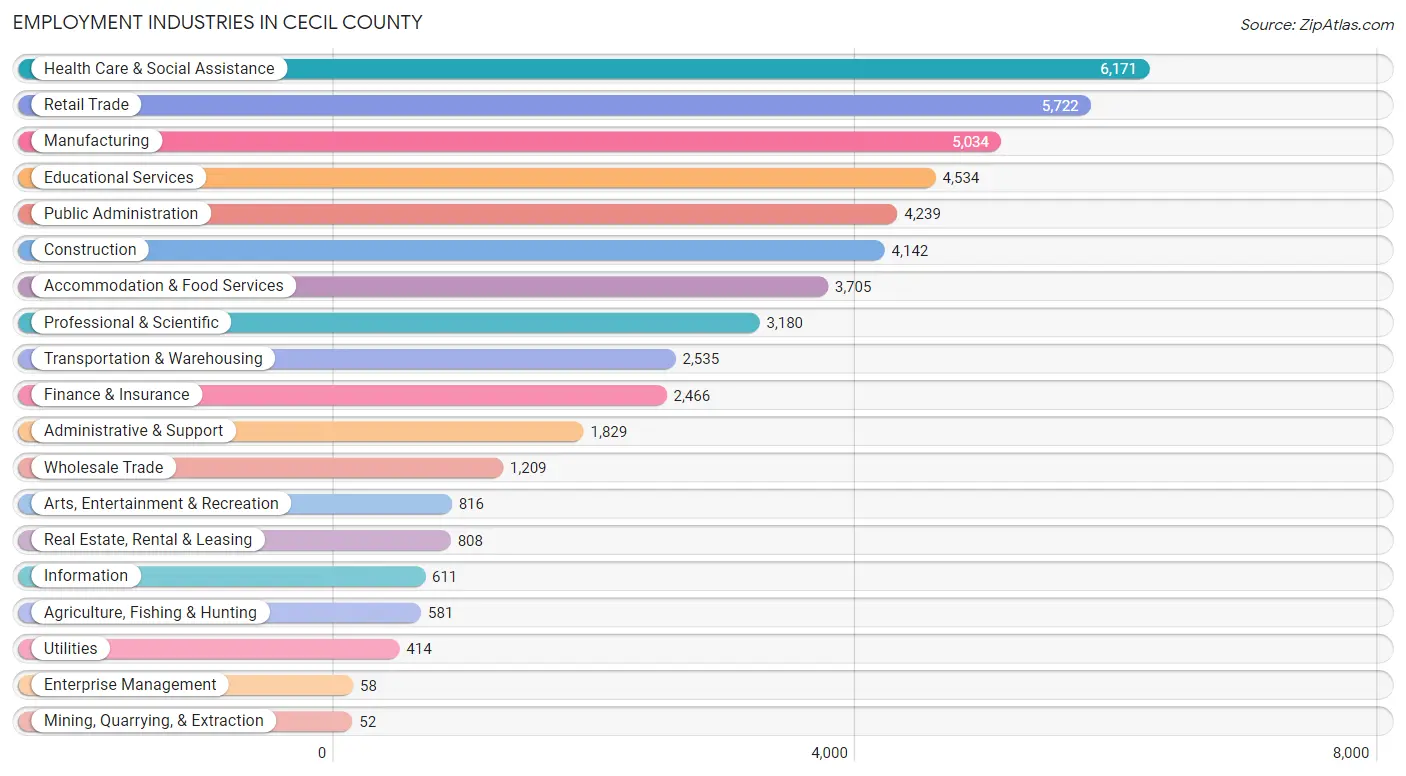
The major employment industries in Cecil County include Health Care & Social Assistance (6,171 | 12.3%), Retail Trade (5,722 | 11.4%), Manufacturing (5,034 | 10.0%), Educational Services (4,534 | 9.0%), and Public Administration (4,239 | 8.4%).
Employment Industries by Sex in Cecil County
The Cecil County industries that see more men than women are Construction (92.8%), Utilities (91.1%), and Agriculture, Fishing & Hunting (82.8%), whereas the industries that tend to have a higher number of women are Health Care & Social Assistance (87.2%), Educational Services (71.4%), and Finance & Insurance (62.4%).
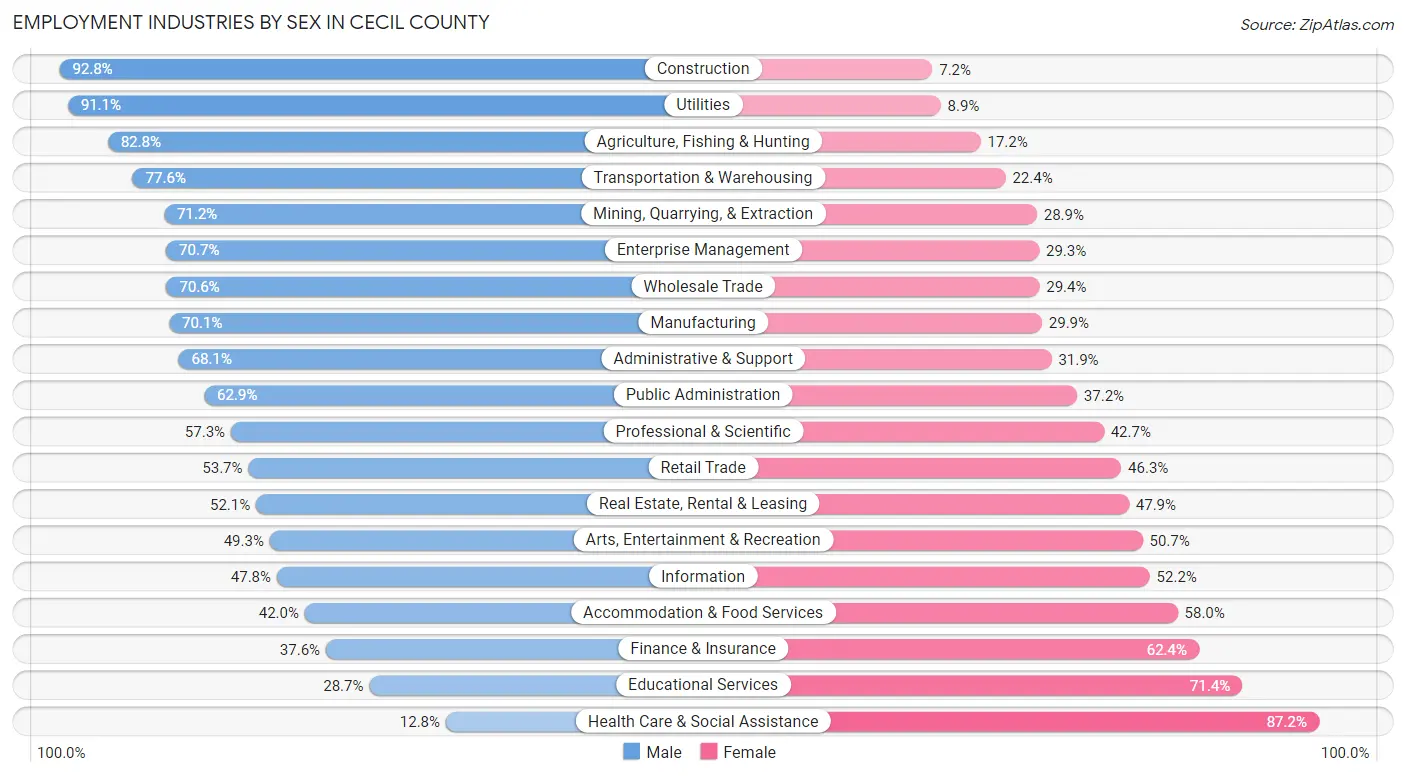
| Industry | Male | Female |
| Agriculture, Fishing & Hunting | 481 (82.8%) | 100 (17.2%) |
| Mining, Quarrying, & Extraction | 37 (71.2%) | 15 (28.8%) |
| Construction | 3,843 (92.8%) | 299 (7.2%) |
| Manufacturing | 3,529 (70.1%) | 1,505 (29.9%) |
| Wholesale Trade | 854 (70.6%) | 355 (29.4%) |
| Retail Trade | 3,072 (53.7%) | 2,650 (46.3%) |
| Transportation & Warehousing | 1,968 (77.6%) | 567 (22.4%) |
| Utilities | 377 (91.1%) | 37 (8.9%) |
| Information | 292 (47.8%) | 319 (52.2%) |
| Finance & Insurance | 928 (37.6%) | 1,538 (62.4%) |
| Real Estate, Rental & Leasing | 421 (52.1%) | 387 (47.9%) |
| Professional & Scientific | 1,822 (57.3%) | 1,358 (42.7%) |
| Enterprise Management | 41 (70.7%) | 17 (29.3%) |
| Administrative & Support | 1,246 (68.1%) | 583 (31.9%) |
| Educational Services | 1,299 (28.6%) | 3,235 (71.4%) |
| Health Care & Social Assistance | 790 (12.8%) | 5,381 (87.2%) |
| Arts, Entertainment & Recreation | 402 (49.3%) | 414 (50.7%) |
| Accommodation & Food Services | 1,556 (42.0%) | 2,149 (58.0%) |
| Public Administration | 2,664 (62.8%) | 1,575 (37.1%) |
| Total | 26,632 (53.1%) | 23,564 (46.9%) |
Education in Cecil County
School Enrollment in Cecil County
The most common levels of schooling among the 23,428 students in Cecil County are high school (5,655 | 24.1%), middle school (5,370 | 22.9%), and elementary school (5,108 | 21.8%).
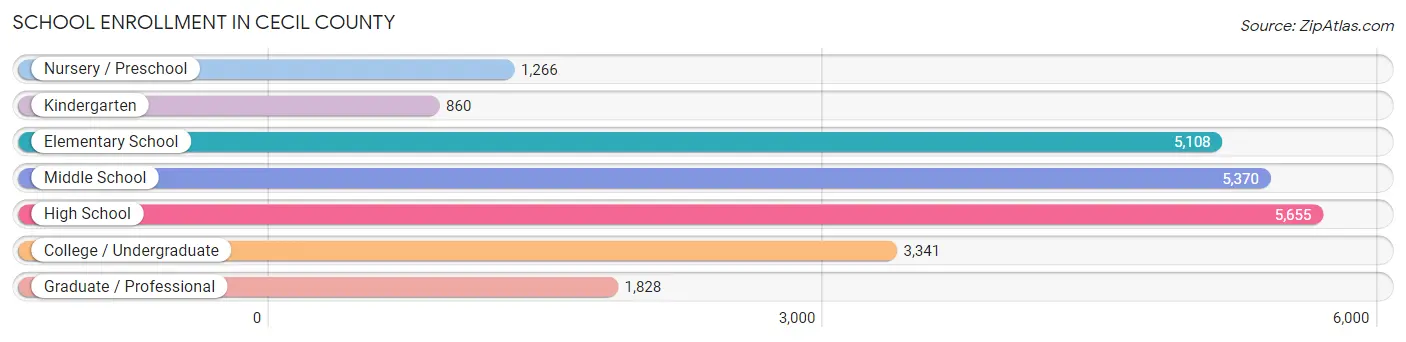
| School Level | # Students | % Students |
| Nursery / Preschool | 1,266 | 5.4% |
| Kindergarten | 860 | 3.7% |
| Elementary School | 5,108 | 21.8% |
| Middle School | 5,370 | 22.9% |
| High School | 5,655 | 24.1% |
| College / Undergraduate | 3,341 | 14.3% |
| Graduate / Professional | 1,828 | 7.8% |
| Total | 23,428 | 100.0% |
School Enrollment by Age by Funding Source in Cecil County
Out of a total of 23,428 students who are enrolled in schools in Cecil County, 4,194 (17.9%) attend a private institution, while the remaining 19,234 (82.1%) are enrolled in public schools. The age group of 3 to 4 year olds has the highest likelihood of being enrolled in private schools, with 353 (38.9% in the age bracket) enrolled. Conversely, the age group of 15 to 17 year olds has the lowest likelihood of being enrolled in a private school, with 3,387 (85.9% in the age bracket) attending a public institution.
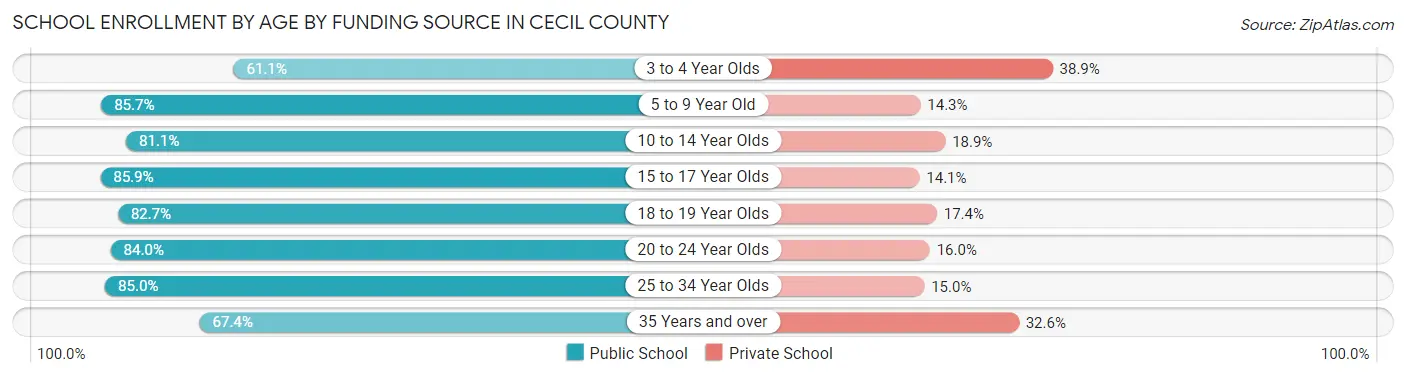
| Age Bracket | Public School | Private School |
| 3 to 4 Year Olds | 554 (61.1%) | 353 (38.9%) |
| 5 to 9 Year Old | 4,797 (85.7%) | 799 (14.3%) |
| 10 to 14 Year Olds | 5,571 (81.1%) | 1,299 (18.9%) |
| 15 to 17 Year Olds | 3,387 (85.9%) | 556 (14.1%) |
| 18 to 19 Year Olds | 1,091 (82.7%) | 229 (17.3%) |
| 20 to 24 Year Olds | 1,702 (84.0%) | 325 (16.0%) |
| 25 to 34 Year Olds | 1,297 (85.0%) | 229 (15.0%) |
| 35 Years and over | 835 (67.4%) | 404 (32.6%) |
| Total | 19,234 (82.1%) | 4,194 (17.9%) |
Educational Attainment by Field of Study in Cecil County
Business (3,501 | 17.2%), education (3,235 | 15.9%), science & technology (1,928 | 9.5%), engineering (1,879 | 9.2%), and social sciences (1,585 | 7.8%) are the most common fields of study among 20,359 individuals in Cecil County who have obtained a bachelor's degree or higher.
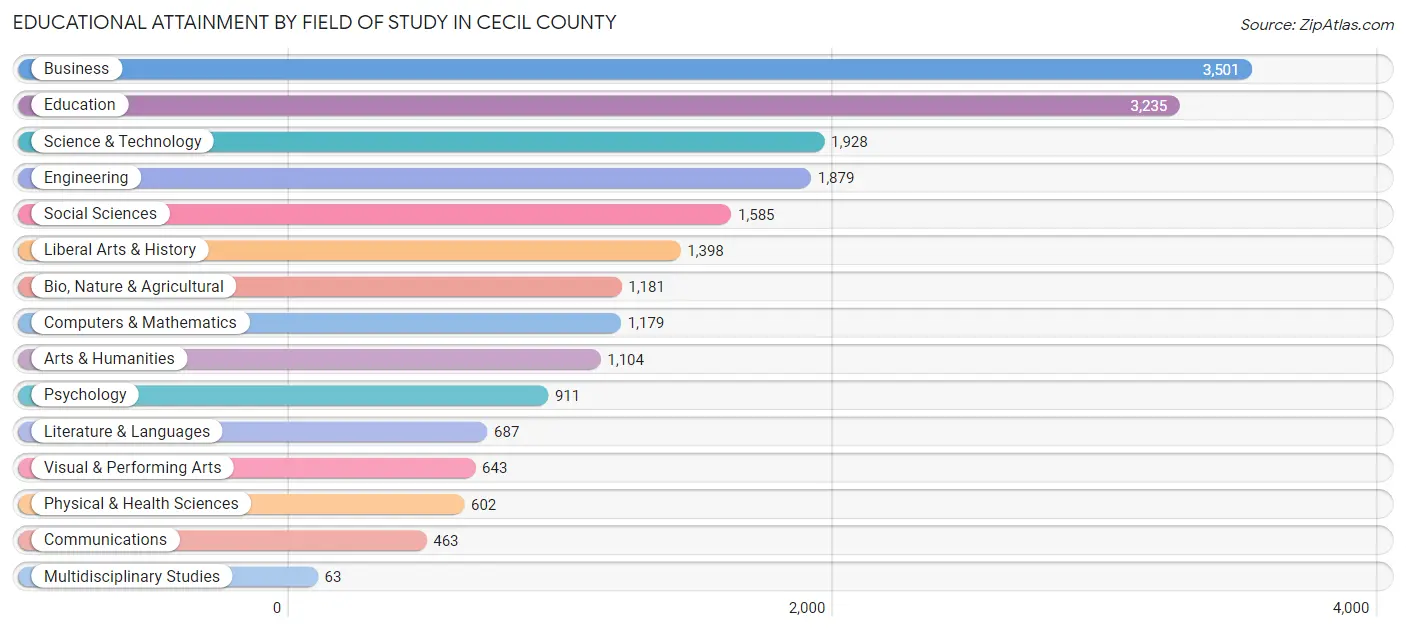
| Field of Study | # Graduates | % Graduates |
| Computers & Mathematics | 1,179 | 5.8% |
| Bio, Nature & Agricultural | 1,181 | 5.8% |
| Physical & Health Sciences | 602 | 3.0% |
| Psychology | 911 | 4.5% |
| Social Sciences | 1,585 | 7.8% |
| Engineering | 1,879 | 9.2% |
| Multidisciplinary Studies | 63 | 0.3% |
| Science & Technology | 1,928 | 9.5% |
| Business | 3,501 | 17.2% |
| Education | 3,235 | 15.9% |
| Literature & Languages | 687 | 3.4% |
| Liberal Arts & History | 1,398 | 6.9% |
| Visual & Performing Arts | 643 | 3.2% |
| Communications | 463 | 2.3% |
| Arts & Humanities | 1,104 | 5.4% |
| Total | 20,359 | 100.0% |
Transportation & Commute in Cecil County
Vehicle Availability by Sex in Cecil County
The most prevalent vehicle ownership categories in Cecil County are males with 2 vehicles (10,661, accounting for 40.7%) and females with 2 vehicles (8,544, making up 46.1%).
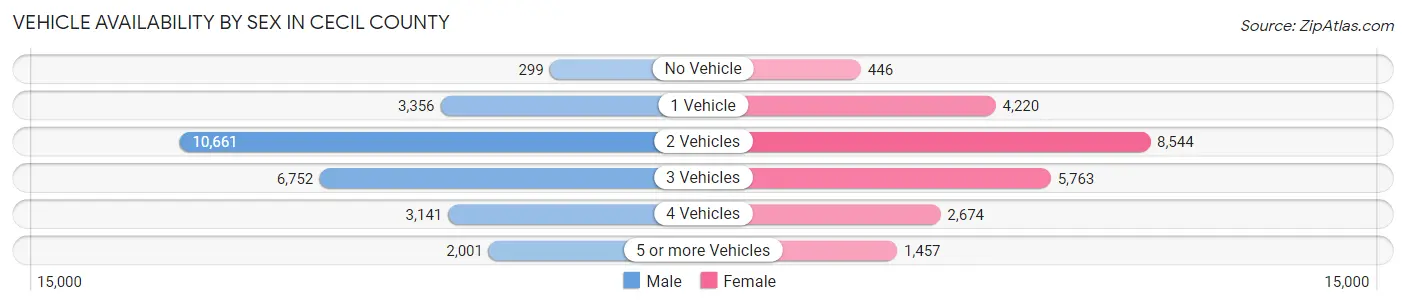
| Vehicles Available | Male | Female |
| No Vehicle | 299 (1.1%) | 446 (1.9%) |
| 1 Vehicle | 3,356 (12.8%) | 4,220 (18.3%) |
| 2 Vehicles | 10,661 (40.7%) | 8,544 (37.0%) |
| 3 Vehicles | 6,752 (25.8%) | 5,763 (24.9%) |
| 4 Vehicles | 3,141 (12.0%) | 2,674 (11.6%) |
| 5 or more Vehicles | 2,001 (7.6%) | 1,457 (6.3%) |
| Total | 26,210 (100.0%) | 23,104 (100.0%) |
Commute Time in Cecil County
The most frequently occuring commute durations in Cecil County are 30 to 34 minutes (6,510 commuters, 14.4%), 20 to 24 minutes (6,148 commuters, 13.6%), and 15 to 19 minutes (5,787 commuters, 12.8%).
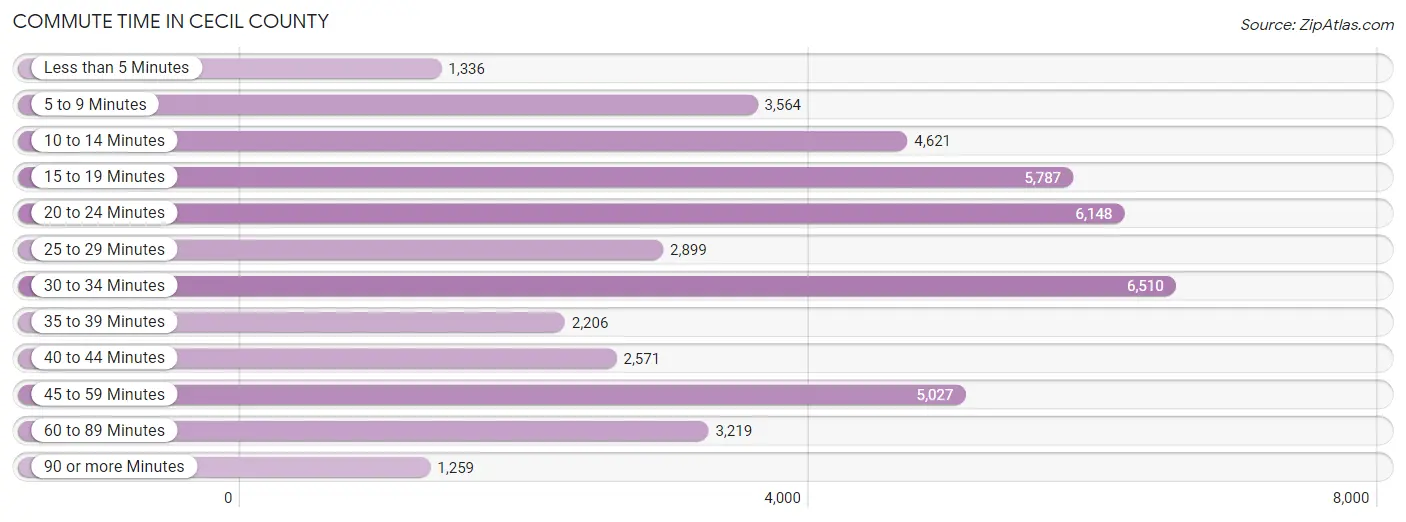
| Commute Time | # Commuters | % Commuters |
| Less than 5 Minutes | 1,336 | 3.0% |
| 5 to 9 Minutes | 3,564 | 7.9% |
| 10 to 14 Minutes | 4,621 | 10.2% |
| 15 to 19 Minutes | 5,787 | 12.8% |
| 20 to 24 Minutes | 6,148 | 13.6% |
| 25 to 29 Minutes | 2,899 | 6.4% |
| 30 to 34 Minutes | 6,510 | 14.4% |
| 35 to 39 Minutes | 2,206 | 4.9% |
| 40 to 44 Minutes | 2,571 | 5.7% |
| 45 to 59 Minutes | 5,027 | 11.1% |
| 60 to 89 Minutes | 3,219 | 7.1% |
| 90 or more Minutes | 1,259 | 2.8% |
Commute Time by Sex in Cecil County
The most common commute times in Cecil County are 30 to 34 minutes (3,368 commuters, 13.9%) for males and 30 to 34 minutes (3,142 commuters, 15.0%) for females.
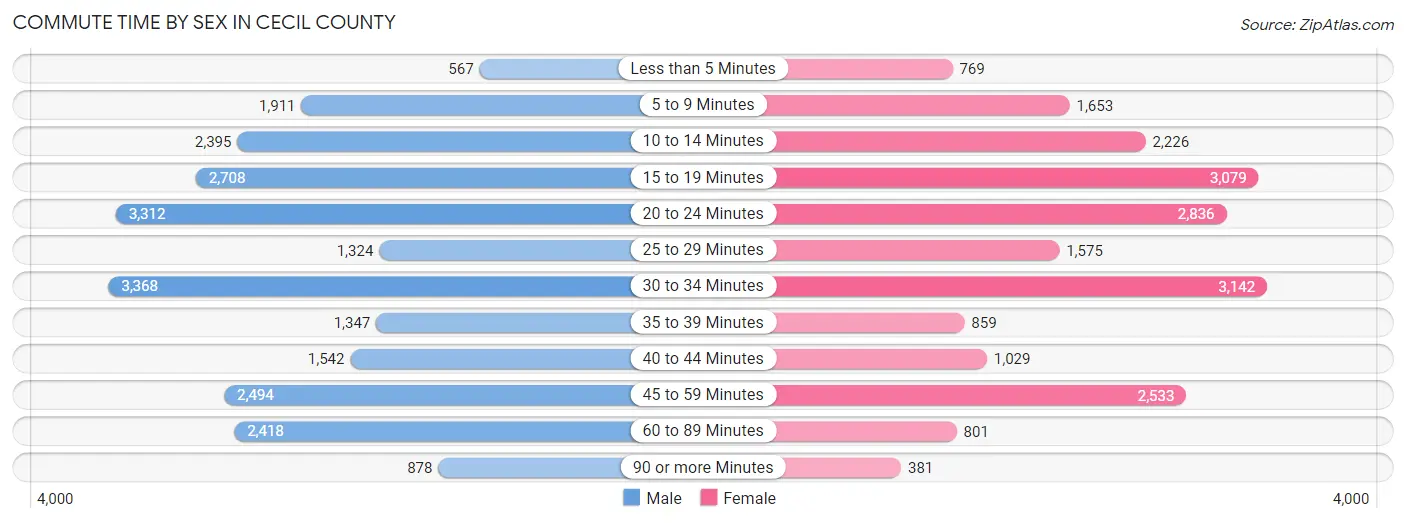
| Commute Time | Male | Female |
| Less than 5 Minutes | 567 (2.3%) | 769 (3.7%) |
| 5 to 9 Minutes | 1,911 (7.9%) | 1,653 (7.9%) |
| 10 to 14 Minutes | 2,395 (9.9%) | 2,226 (10.7%) |
| 15 to 19 Minutes | 2,708 (11.2%) | 3,079 (14.7%) |
| 20 to 24 Minutes | 3,312 (13.7%) | 2,836 (13.6%) |
| 25 to 29 Minutes | 1,324 (5.5%) | 1,575 (7.5%) |
| 30 to 34 Minutes | 3,368 (13.9%) | 3,142 (15.0%) |
| 35 to 39 Minutes | 1,347 (5.6%) | 859 (4.1%) |
| 40 to 44 Minutes | 1,542 (6.4%) | 1,029 (4.9%) |
| 45 to 59 Minutes | 2,494 (10.3%) | 2,533 (12.1%) |
| 60 to 89 Minutes | 2,418 (10.0%) | 801 (3.8%) |
| 90 or more Minutes | 878 (3.6%) | 381 (1.8%) |
Time of Departure to Work by Sex in Cecil County
The most frequent times of departure to work in Cecil County are 7:00 AM to 7:29 AM (3,026, 12.5%) for males and 7:00 AM to 7:29 AM (4,270, 20.4%) for females.
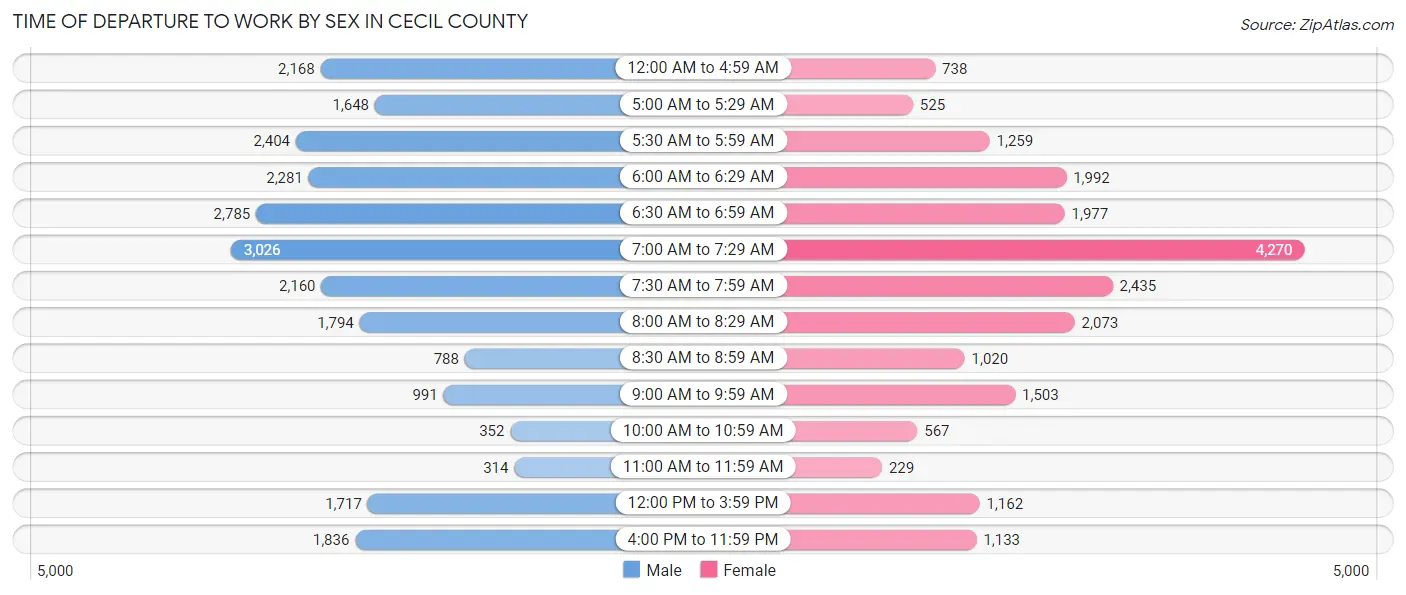
| Time of Departure | Male | Female |
| 12:00 AM to 4:59 AM | 2,168 (8.9%) | 738 (3.5%) |
| 5:00 AM to 5:29 AM | 1,648 (6.8%) | 525 (2.5%) |
| 5:30 AM to 5:59 AM | 2,404 (9.9%) | 1,259 (6.0%) |
| 6:00 AM to 6:29 AM | 2,281 (9.4%) | 1,992 (9.5%) |
| 6:30 AM to 6:59 AM | 2,785 (11.5%) | 1,977 (9.5%) |
| 7:00 AM to 7:29 AM | 3,026 (12.5%) | 4,270 (20.4%) |
| 7:30 AM to 7:59 AM | 2,160 (8.9%) | 2,435 (11.7%) |
| 8:00 AM to 8:29 AM | 1,794 (7.4%) | 2,073 (9.9%) |
| 8:30 AM to 8:59 AM | 788 (3.3%) | 1,020 (4.9%) |
| 9:00 AM to 9:59 AM | 991 (4.1%) | 1,503 (7.2%) |
| 10:00 AM to 10:59 AM | 352 (1.5%) | 567 (2.7%) |
| 11:00 AM to 11:59 AM | 314 (1.3%) | 229 (1.1%) |
| 12:00 PM to 3:59 PM | 1,717 (7.1%) | 1,162 (5.6%) |
| 4:00 PM to 11:59 PM | 1,836 (7.6%) | 1,133 (5.4%) |
| Total | 24,264 (100.0%) | 20,883 (100.0%) |
Housing Occupancy in Cecil County
Occupancy by Ownership in Cecil County
Of the total 39,338 dwellings in Cecil County, owner-occupied units account for 29,560 (75.1%), while renter-occupied units make up 9,778 (24.9%).
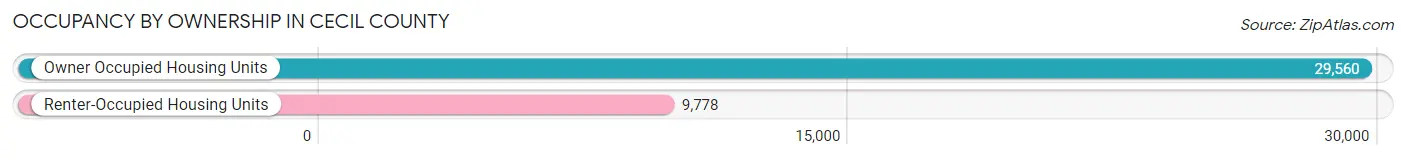
| Occupancy | # Housing Units | % Housing Units |
| Owner Occupied Housing Units | 29,560 | 75.1% |
| Renter-Occupied Housing Units | 9,778 | 24.9% |
| Total Occupied Housing Units | 39,338 | 100.0% |
Occupancy by Household Size in Cecil County
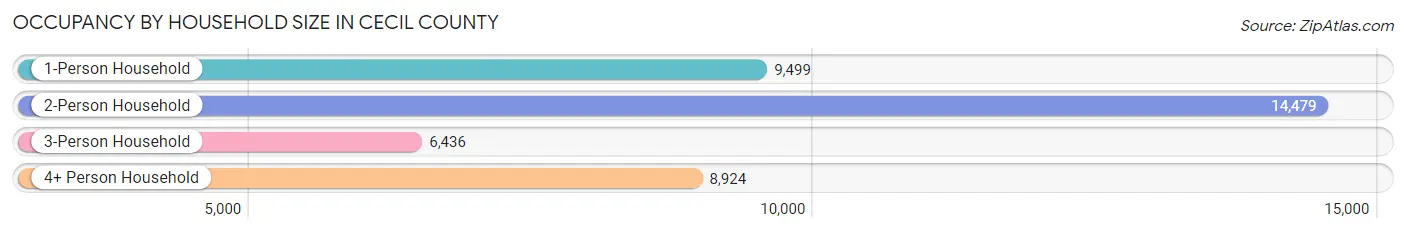
| Household Size | # Housing Units | % Housing Units |
| 1-Person Household | 9,499 | 24.1% |
| 2-Person Household | 14,479 | 36.8% |
| 3-Person Household | 6,436 | 16.4% |
| 4+ Person Household | 8,924 | 22.7% |
| Total Housing Units | 39,338 | 100.0% |
Occupancy by Ownership by Household Size in Cecil County
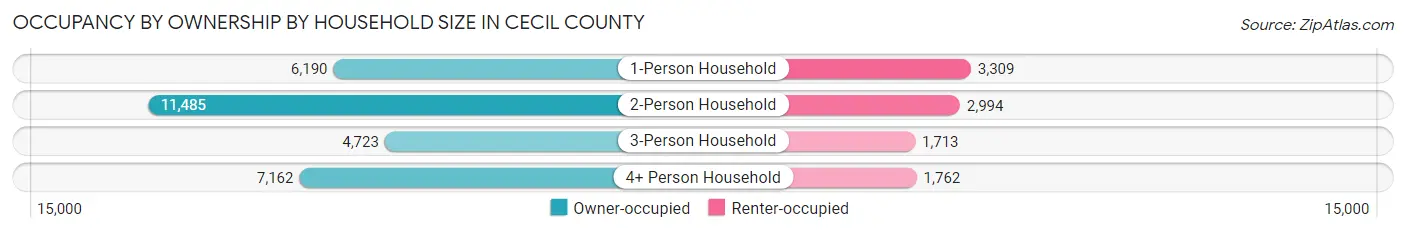
| Household Size | Owner-occupied | Renter-occupied |
| 1-Person Household | 6,190 (65.2%) | 3,309 (34.8%) |
| 2-Person Household | 11,485 (79.3%) | 2,994 (20.7%) |
| 3-Person Household | 4,723 (73.4%) | 1,713 (26.6%) |
| 4+ Person Household | 7,162 (80.3%) | 1,762 (19.7%) |
| Total Housing Units | 29,560 (75.1%) | 9,778 (24.9%) |
Occupancy by Educational Attainment in Cecil County
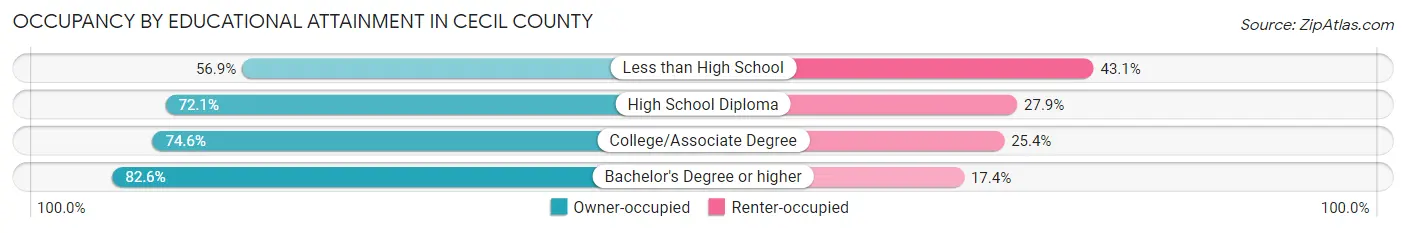
| Household Size | Owner-occupied | Renter-occupied |
| Less than High School | 1,411 (56.9%) | 1,069 (43.1%) |
| High School Diploma | 8,933 (72.1%) | 3,463 (27.9%) |
| College/Associate Degree | 9,249 (74.6%) | 3,145 (25.4%) |
| Bachelor's Degree or higher | 9,967 (82.6%) | 2,101 (17.4%) |
Occupancy by Age of Householder in Cecil County
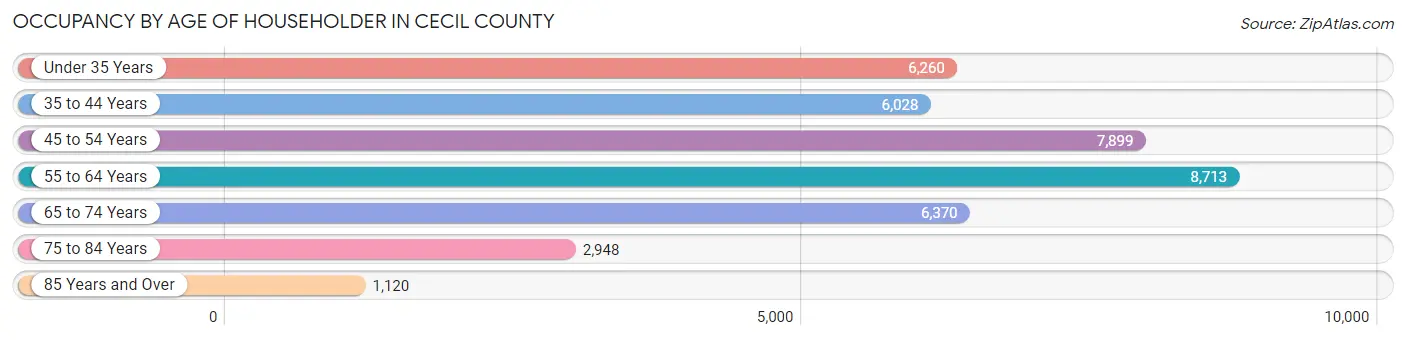
| Age Bracket | # Households | % Households |
| Under 35 Years | 6,260 | 15.9% |
| 35 to 44 Years | 6,028 | 15.3% |
| 45 to 54 Years | 7,899 | 20.1% |
| 55 to 64 Years | 8,713 | 22.2% |
| 65 to 74 Years | 6,370 | 16.2% |
| 75 to 84 Years | 2,948 | 7.5% |
| 85 Years and Over | 1,120 | 2.9% |
| Total | 39,338 | 100.0% |
Housing Finances in Cecil County
Median Income by Occupancy in Cecil County
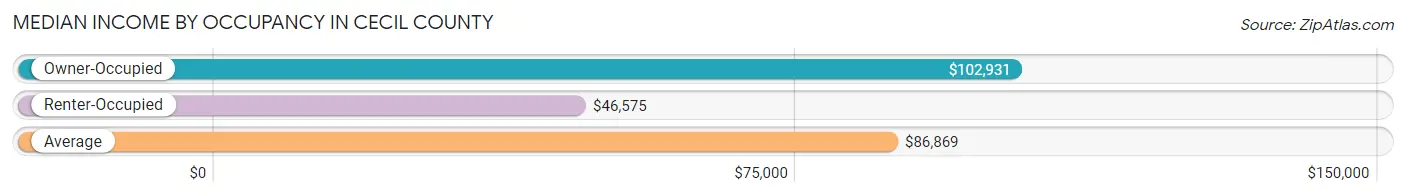
| Occupancy Type | # Households | Median Income |
| Owner-Occupied | 29,560 (75.1%) | $102,931 |
| Renter-Occupied | 9,778 (24.9%) | $46,575 |
| Average | 39,338 (100.0%) | $86,869 |
Occupancy by Householder Income Bracket in Cecil County
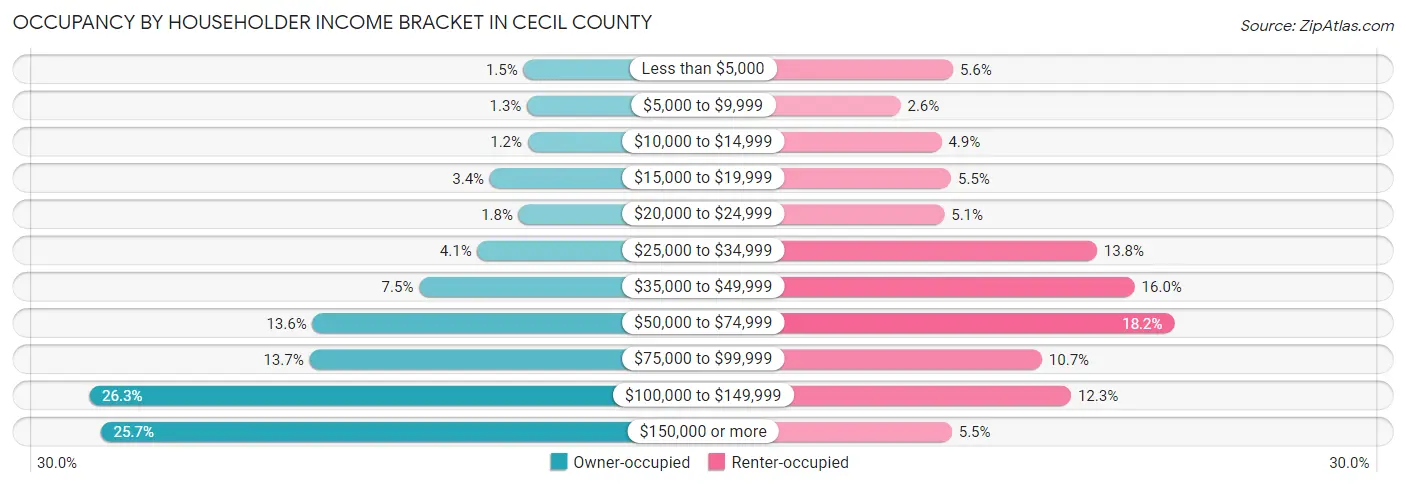
| Income Bracket | Owner-occupied | Renter-occupied |
| Less than $5,000 | 439 (1.5%) | 545 (5.6%) |
| $5,000 to $9,999 | 379 (1.3%) | 251 (2.6%) |
| $10,000 to $14,999 | 368 (1.2%) | 480 (4.9%) |
| $15,000 to $19,999 | 1,007 (3.4%) | 534 (5.5%) |
| $20,000 to $24,999 | 521 (1.8%) | 496 (5.1%) |
| $25,000 to $34,999 | 1,217 (4.1%) | 1,348 (13.8%) |
| $35,000 to $49,999 | 2,202 (7.4%) | 1,560 (16.0%) |
| $50,000 to $74,999 | 4,006 (13.6%) | 1,781 (18.2%) |
| $75,000 to $99,999 | 4,057 (13.7%) | 1,041 (10.6%) |
| $100,000 to $149,999 | 7,778 (26.3%) | 1,204 (12.3%) |
| $150,000 or more | 7,586 (25.7%) | 538 (5.5%) |
| Total | 29,560 (100.0%) | 9,778 (100.0%) |
Monthly Housing Cost Tiers in Cecil County
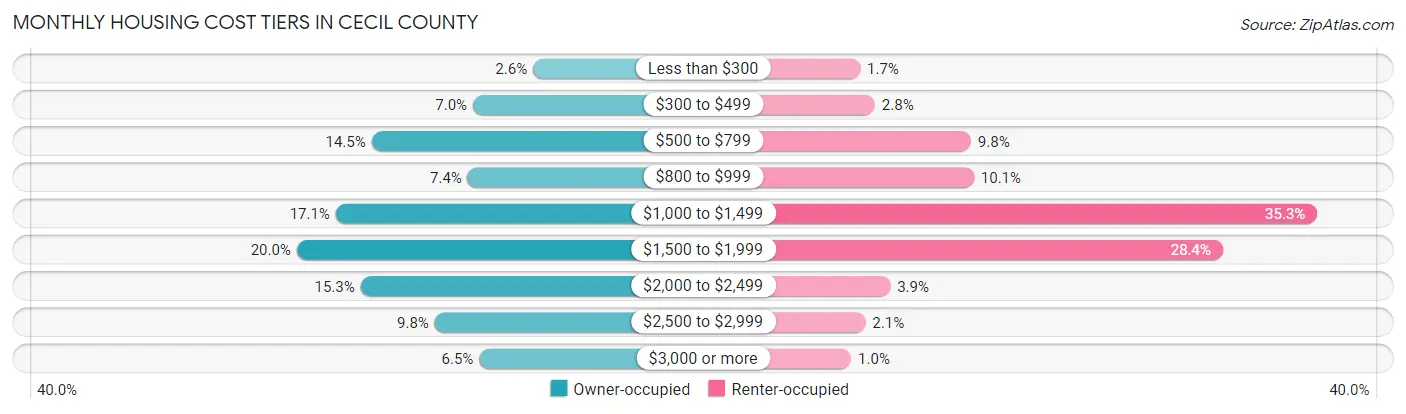
| Monthly Cost | Owner-occupied | Renter-occupied |
| Less than $300 | 757 (2.6%) | 163 (1.7%) |
| $300 to $499 | 2,064 (7.0%) | 270 (2.8%) |
| $500 to $799 | 4,271 (14.4%) | 961 (9.8%) |
| $800 to $999 | 2,179 (7.4%) | 983 (10.1%) |
| $1,000 to $1,499 | 5,053 (17.1%) | 3,455 (35.3%) |
| $1,500 to $1,999 | 5,901 (20.0%) | 2,775 (28.4%) |
| $2,000 to $2,499 | 4,512 (15.3%) | 380 (3.9%) |
| $2,500 to $2,999 | 2,897 (9.8%) | 201 (2.1%) |
| $3,000 or more | 1,926 (6.5%) | 99 (1.0%) |
| Total | 29,560 (100.0%) | 9,778 (100.0%) |
Physical Housing Characteristics in Cecil County
Housing Structures in Cecil County
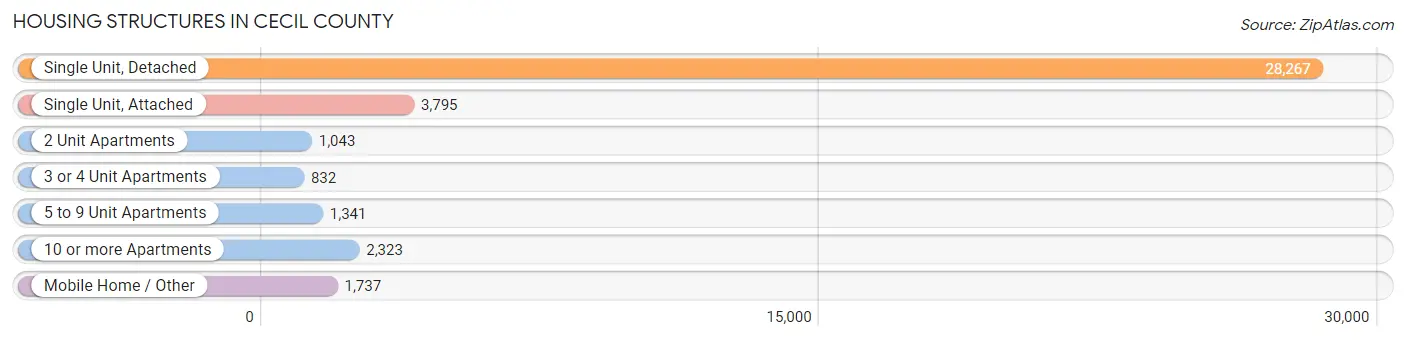
| Structure Type | # Housing Units | % Housing Units |
| Single Unit, Detached | 28,267 | 71.9% |
| Single Unit, Attached | 3,795 | 9.7% |
| 2 Unit Apartments | 1,043 | 2.6% |
| 3 or 4 Unit Apartments | 832 | 2.1% |
| 5 to 9 Unit Apartments | 1,341 | 3.4% |
| 10 or more Apartments | 2,323 | 5.9% |
| Mobile Home / Other | 1,737 | 4.4% |
| Total | 39,338 | 100.0% |
Housing Structures by Occupancy in Cecil County
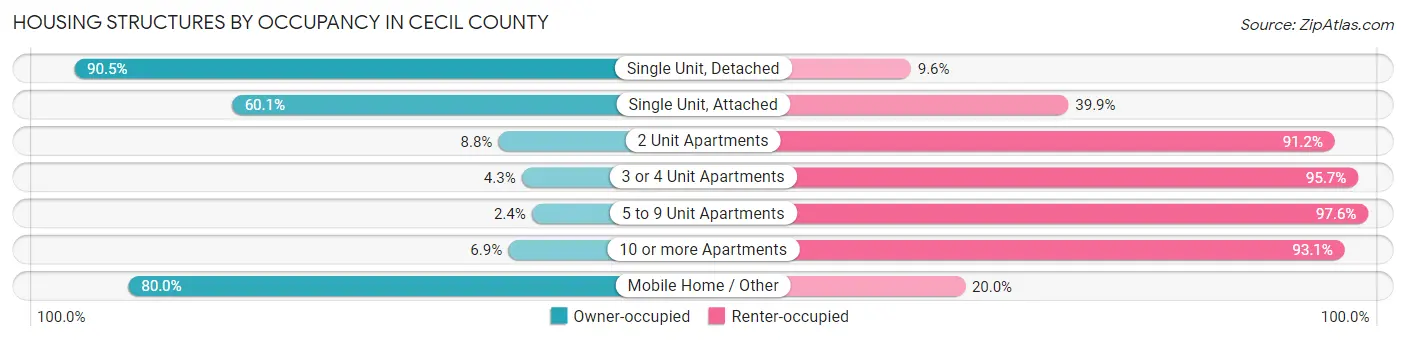
| Structure Type | Owner-occupied | Renter-occupied |
| Single Unit, Detached | 25,568 (90.4%) | 2,699 (9.6%) |
| Single Unit, Attached | 2,281 (60.1%) | 1,514 (39.9%) |
| 2 Unit Apartments | 92 (8.8%) | 951 (91.2%) |
| 3 or 4 Unit Apartments | 36 (4.3%) | 796 (95.7%) |
| 5 to 9 Unit Apartments | 32 (2.4%) | 1,309 (97.6%) |
| 10 or more Apartments | 161 (6.9%) | 2,162 (93.1%) |
| Mobile Home / Other | 1,390 (80.0%) | 347 (20.0%) |
| Total | 29,560 (75.1%) | 9,778 (24.9%) |
Housing Structures by Number of Rooms in Cecil County
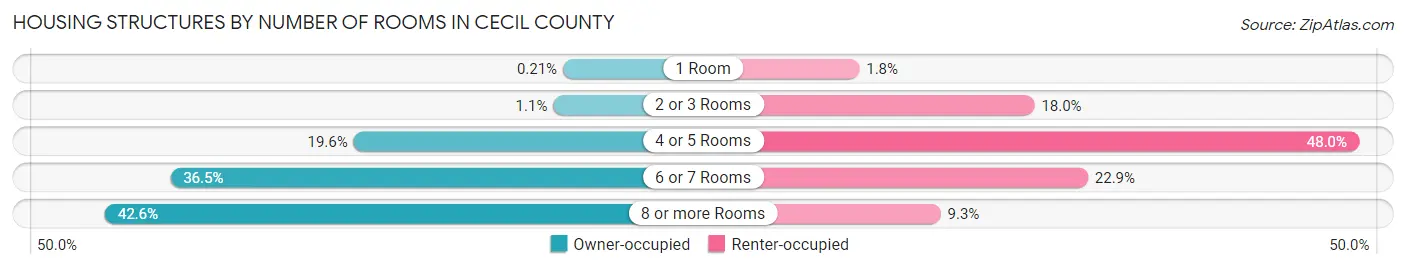
| Number of Rooms | Owner-occupied | Renter-occupied |
| 1 Room | 62 (0.2%) | 175 (1.8%) |
| 2 or 3 Rooms | 328 (1.1%) | 1,759 (18.0%) |
| 4 or 5 Rooms | 5,787 (19.6%) | 4,692 (48.0%) |
| 6 or 7 Rooms | 10,797 (36.5%) | 2,242 (22.9%) |
| 8 or more Rooms | 12,586 (42.6%) | 910 (9.3%) |
| Total | 29,560 (100.0%) | 9,778 (100.0%) |
Housing Structure by Heating Type in Cecil County
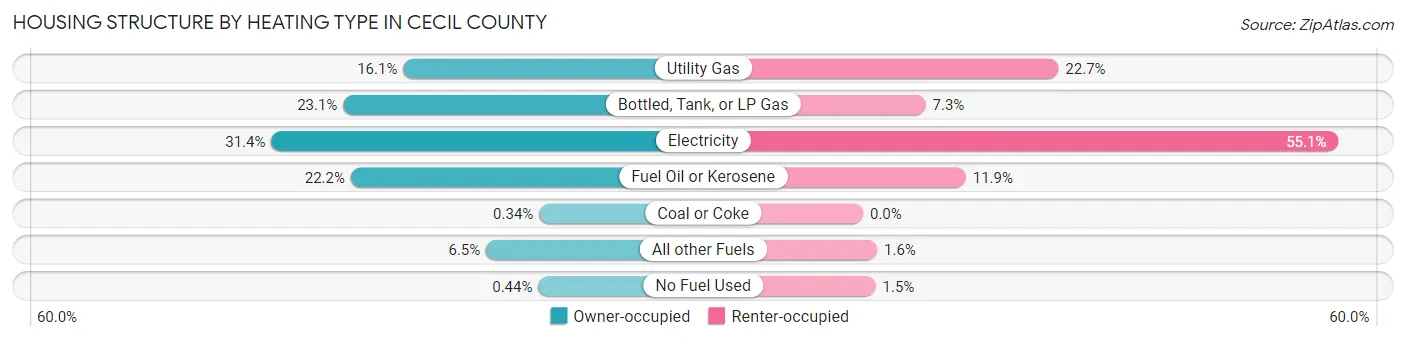
| Heating Type | Owner-occupied | Renter-occupied |
| Utility Gas | 4,758 (16.1%) | 2,215 (22.7%) |
| Bottled, Tank, or LP Gas | 6,818 (23.1%) | 709 (7.2%) |
| Electricity | 9,281 (31.4%) | 5,387 (55.1%) |
| Fuel Oil or Kerosene | 6,555 (22.2%) | 1,165 (11.9%) |
| Coal or Coke | 100 (0.3%) | 0 (0.0%) |
| All other Fuels | 1,917 (6.5%) | 159 (1.6%) |
| No Fuel Used | 131 (0.4%) | 143 (1.5%) |
| Total | 29,560 (100.0%) | 9,778 (100.0%) |
Household Vehicle Usage in Cecil County
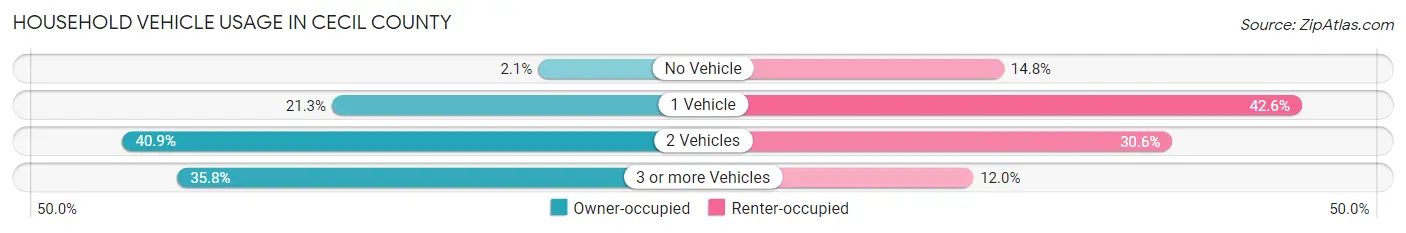
| Vehicles per Household | Owner-occupied | Renter-occupied |
| No Vehicle | 611 (2.1%) | 1,451 (14.8%) |
| 1 Vehicle | 6,302 (21.3%) | 4,169 (42.6%) |
| 2 Vehicles | 12,079 (40.9%) | 2,987 (30.5%) |
| 3 or more Vehicles | 10,568 (35.7%) | 1,171 (12.0%) |
| Total | 29,560 (100.0%) | 9,778 (100.0%) |
Real Estate & Mortgages in Cecil County
Real Estate and Mortgage Overview in Cecil County
| Characteristic | Without Mortgage | With Mortgage |
| Housing Units | 9,066 | 20,494 |
| Median Property Value | $280,700 | $296,100 |
| Median Household Income | $70,600 | $5,822 |
| Monthly Housing Costs | $642 | $1,902 |
| Real Estate Taxes | $2,953 | $822 |
Property Value by Mortgage Status in Cecil County
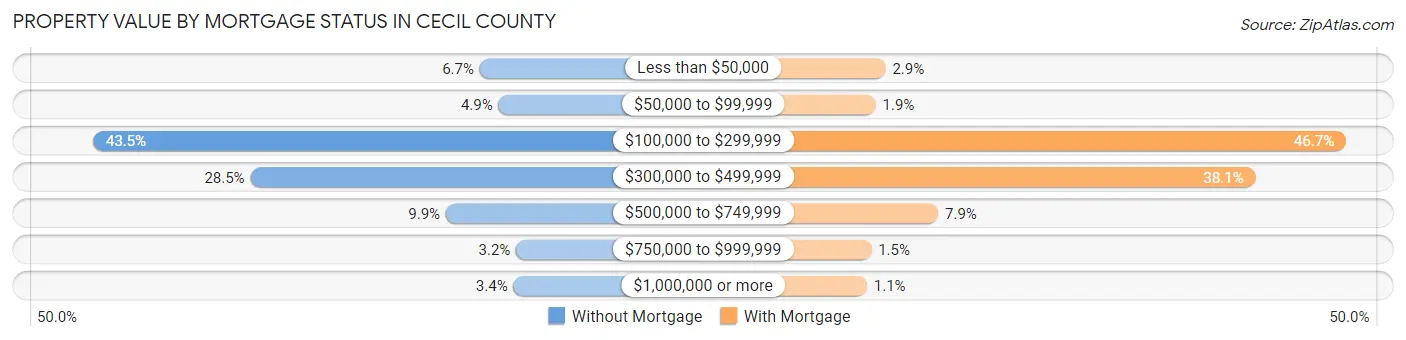
| Property Value | Without Mortgage | With Mortgage |
| Less than $50,000 | 603 (6.7%) | 585 (2.9%) |
| $50,000 to $99,999 | 441 (4.9%) | 392 (1.9%) |
| $100,000 to $299,999 | 3,944 (43.5%) | 9,574 (46.7%) |
| $300,000 to $499,999 | 2,583 (28.5%) | 7,806 (38.1%) |
| $500,000 to $749,999 | 895 (9.9%) | 1,610 (7.9%) |
| $750,000 to $999,999 | 288 (3.2%) | 306 (1.5%) |
| $1,000,000 or more | 312 (3.4%) | 221 (1.1%) |
| Total | 9,066 (100.0%) | 20,494 (100.0%) |
Household Income by Mortgage Status in Cecil County
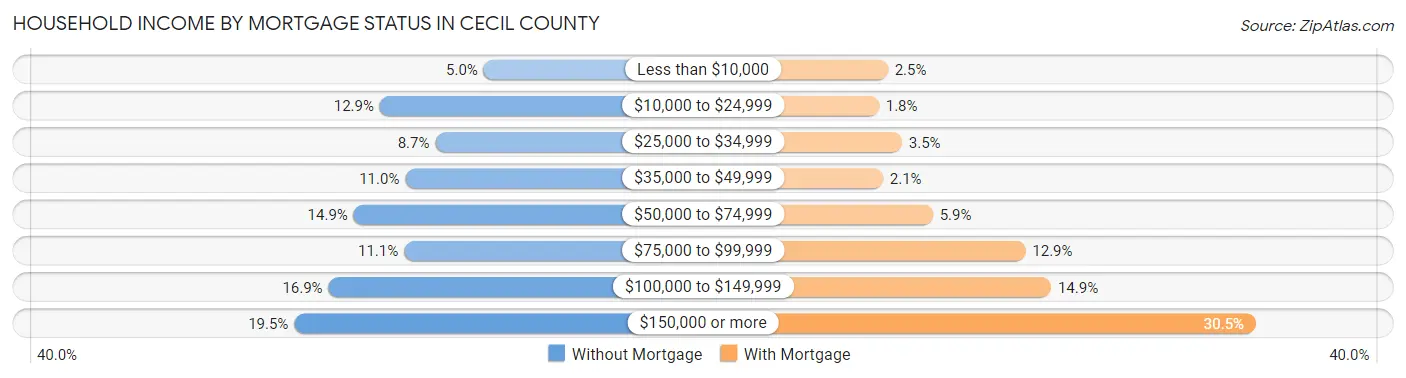
| Household Income | Without Mortgage | With Mortgage |
| Less than $10,000 | 455 (5.0%) | 502 (2.5%) |
| $10,000 to $24,999 | 1,173 (12.9%) | 363 (1.8%) |
| $25,000 to $34,999 | 790 (8.7%) | 723 (3.5%) |
| $35,000 to $49,999 | 997 (11.0%) | 427 (2.1%) |
| $50,000 to $74,999 | 1,354 (14.9%) | 1,205 (5.9%) |
| $75,000 to $99,999 | 1,005 (11.1%) | 2,652 (12.9%) |
| $100,000 to $149,999 | 1,528 (16.9%) | 3,052 (14.9%) |
| $150,000 or more | 1,764 (19.5%) | 6,250 (30.5%) |
| Total | 9,066 (100.0%) | 20,494 (100.0%) |
Property Value to Household Income Ratio in Cecil County
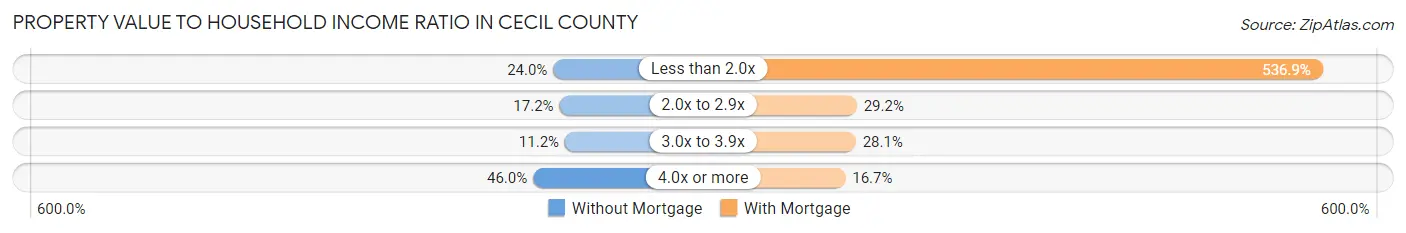
| Value-to-Income Ratio | Without Mortgage | With Mortgage |
| Less than 2.0x | 2,175 (24.0%) | 110,033 (536.9%) |
| 2.0x to 2.9x | 1,562 (17.2%) | 5,987 (29.2%) |
| 3.0x to 3.9x | 1,018 (11.2%) | 5,760 (28.1%) |
| 4.0x or more | 4,166 (46.0%) | 3,427 (16.7%) |
| Total | 9,066 (100.0%) | 20,494 (100.0%) |
Real Estate Taxes by Mortgage Status in Cecil County
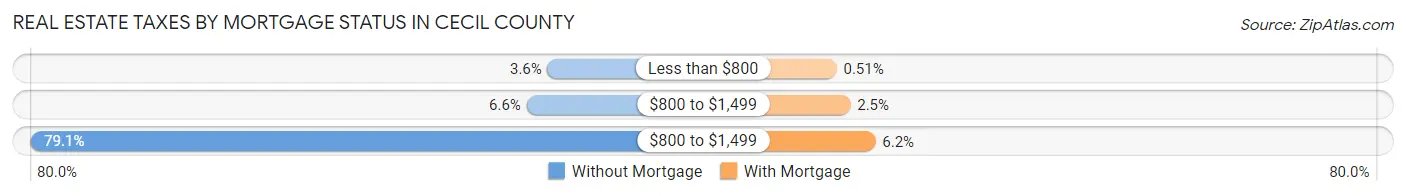
| Property Taxes | Without Mortgage | With Mortgage |
| Less than $800 | 325 (3.6%) | 105 (0.5%) |
| $800 to $1,499 | 602 (6.6%) | 516 (2.5%) |
| $800 to $1,499 | 7,167 (79.0%) | 1,266 (6.2%) |
| Total | 9,066 (100.0%) | 20,494 (100.0%) |
Health & Disability in Cecil County
Health Insurance Coverage by Age in Cecil County
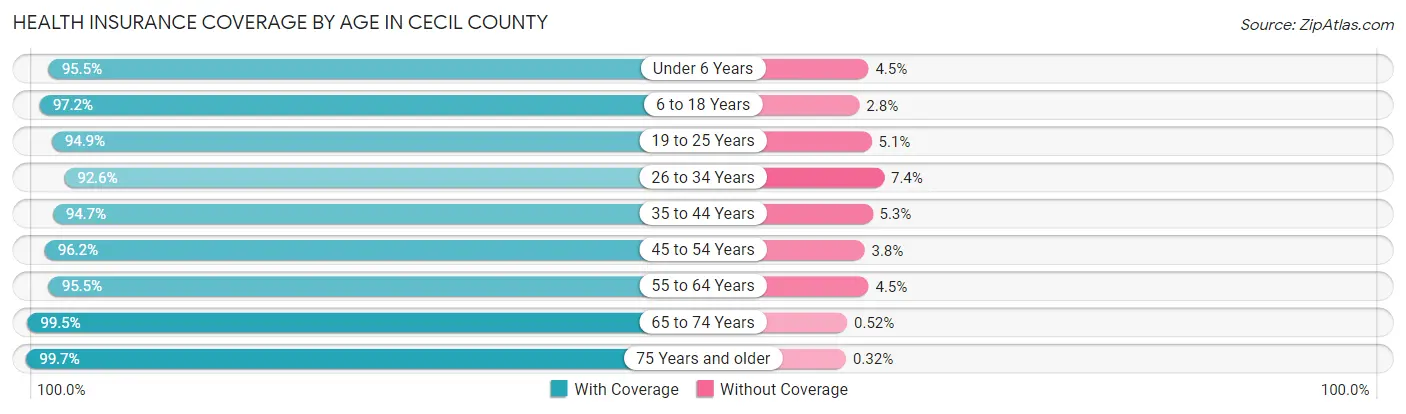
| Age Bracket | With Coverage | Without Coverage |
| Under 6 Years | 6,562 (95.5%) | 310 (4.5%) |
| 6 to 18 Years | 17,086 (97.2%) | 495 (2.8%) |
| 19 to 25 Years | 7,819 (94.9%) | 419 (5.1%) |
| 26 to 34 Years | 10,634 (92.6%) | 851 (7.4%) |
| 35 to 44 Years | 11,587 (94.7%) | 643 (5.3%) |
| 45 to 54 Years | 13,627 (96.2%) | 536 (3.8%) |
| 55 to 64 Years | 14,784 (95.5%) | 700 (4.5%) |
| 65 to 74 Years | 10,323 (99.5%) | 54 (0.5%) |
| 75 Years and older | 6,253 (99.7%) | 20 (0.3%) |
| Total | 98,675 (96.1%) | 4,028 (3.9%) |
Health Insurance Coverage by Citizenship Status in Cecil County
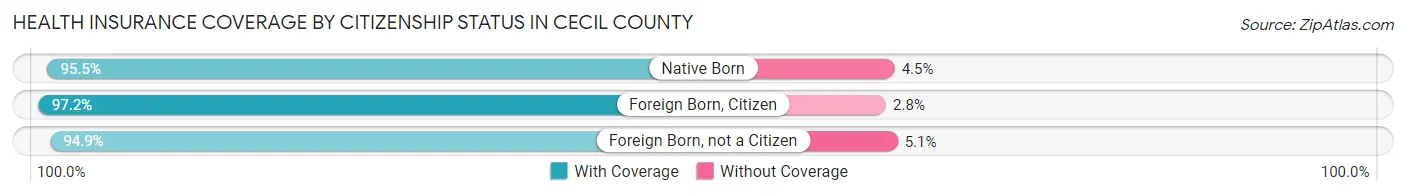
| Citizenship Status | With Coverage | Without Coverage |
| Native Born | 6,562 (95.5%) | 310 (4.5%) |
| Foreign Born, Citizen | 17,086 (97.2%) | 495 (2.8%) |
| Foreign Born, not a Citizen | 7,819 (94.9%) | 419 (5.1%) |
Health Insurance Coverage by Household Income in Cecil County
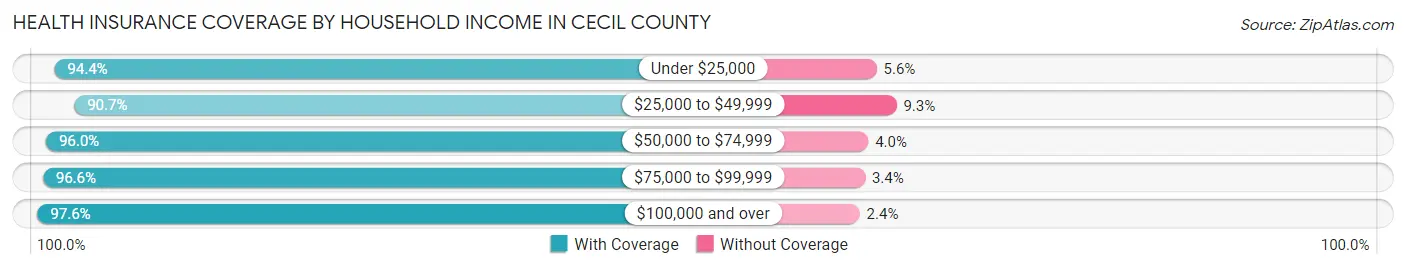
| Household Income | With Coverage | Without Coverage |
| Under $25,000 | 8,243 (94.4%) | 488 (5.6%) |
| $25,000 to $49,999 | 12,128 (90.7%) | 1,243 (9.3%) |
| $50,000 to $74,999 | 13,081 (96.0%) | 547 (4.0%) |
| $75,000 to $99,999 | 13,371 (96.6%) | 472 (3.4%) |
| $100,000 and over | 51,373 (97.6%) | 1,268 (2.4%) |
Public vs Private Health Insurance Coverage by Age in Cecil County
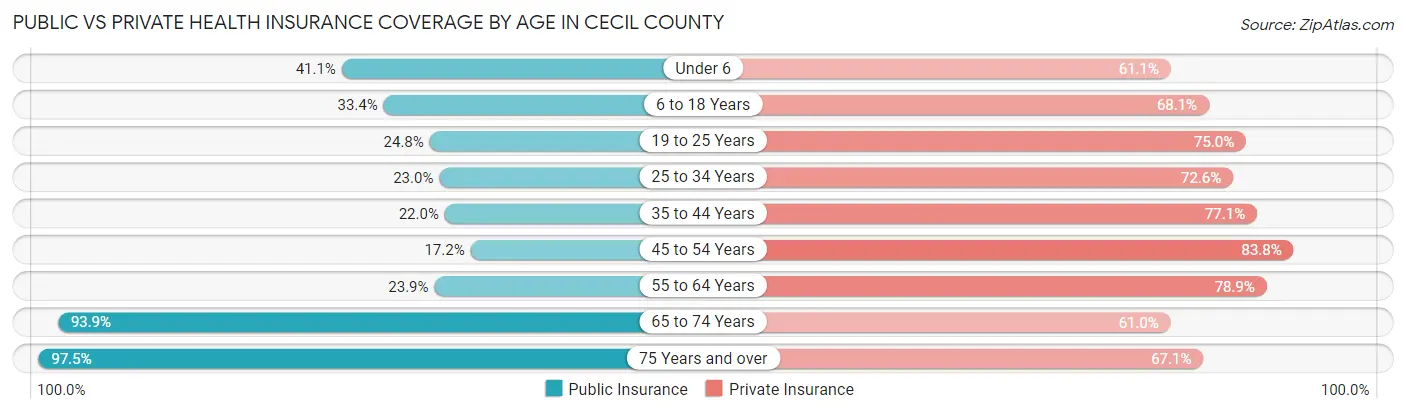
| Age Bracket | Public Insurance | Private Insurance |
| Under 6 | 2,827 (41.1%) | 4,196 (61.1%) |
| 6 to 18 Years | 5,866 (33.4%) | 11,980 (68.1%) |
| 19 to 25 Years | 2,045 (24.8%) | 6,182 (75.0%) |
| 25 to 34 Years | 2,646 (23.0%) | 8,340 (72.6%) |
| 35 to 44 Years | 2,693 (22.0%) | 9,425 (77.1%) |
| 45 to 54 Years | 2,441 (17.2%) | 11,874 (83.8%) |
| 55 to 64 Years | 3,707 (23.9%) | 12,210 (78.9%) |
| 65 to 74 Years | 9,739 (93.9%) | 6,334 (61.0%) |
| 75 Years and over | 6,113 (97.5%) | 4,208 (67.1%) |
| Total | 38,077 (37.1%) | 74,749 (72.8%) |
Disability Status by Sex by Age in Cecil County
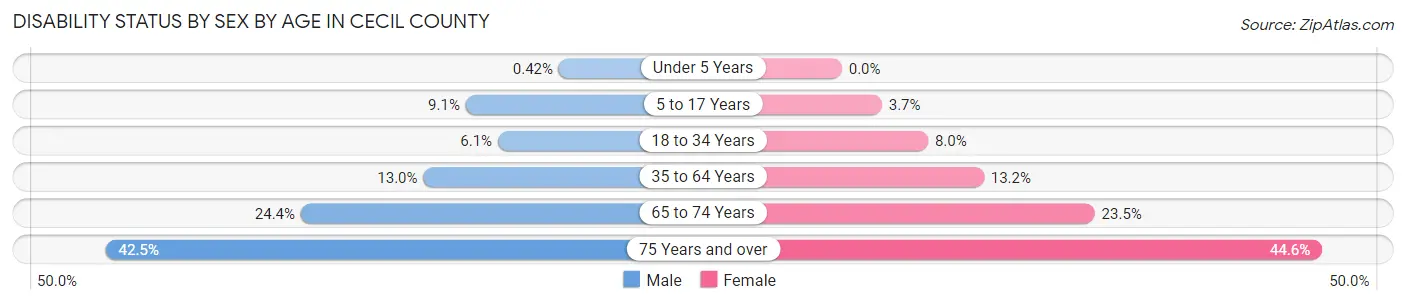
| Age Bracket | Male | Female |
| Under 5 Years | 12 (0.4%) | 0 (0.0%) |
| 5 to 17 Years | 809 (9.1%) | 311 (3.7%) |
| 18 to 34 Years | 643 (6.1%) | 835 (8.0%) |
| 35 to 64 Years | 2,690 (13.0%) | 2,789 (13.2%) |
| 65 to 74 Years | 1,223 (24.4%) | 1,257 (23.5%) |
| 75 Years and over | 1,198 (42.5%) | 1,539 (44.6%) |
Disability Class by Sex by Age in Cecil County
Disability Class: Hearing Difficulty
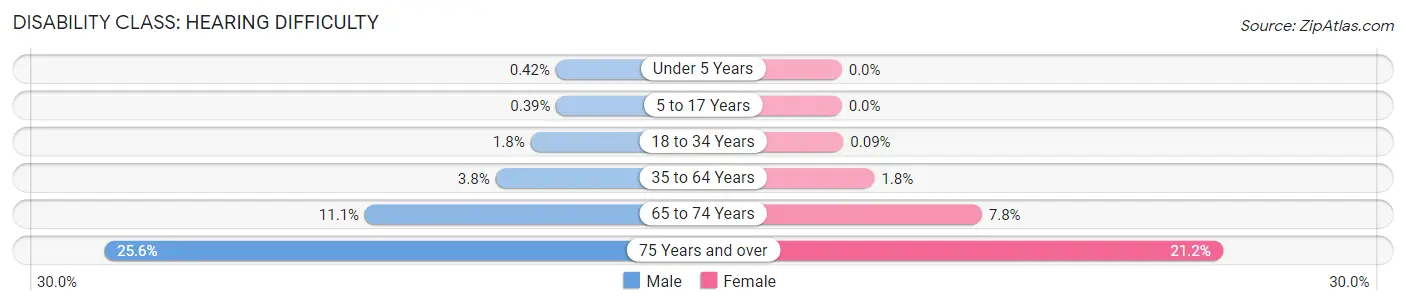
| Age Bracket | Male | Female |
| Under 5 Years | 12 (0.4%) | 0 (0.0%) |
| 5 to 17 Years | 35 (0.4%) | 0 (0.0%) |
| 18 to 34 Years | 194 (1.8%) | 9 (0.1%) |
| 35 to 64 Years | 784 (3.8%) | 386 (1.8%) |
| 65 to 74 Years | 555 (11.1%) | 418 (7.8%) |
| 75 Years and over | 721 (25.6%) | 732 (21.2%) |
Disability Class: Vision Difficulty
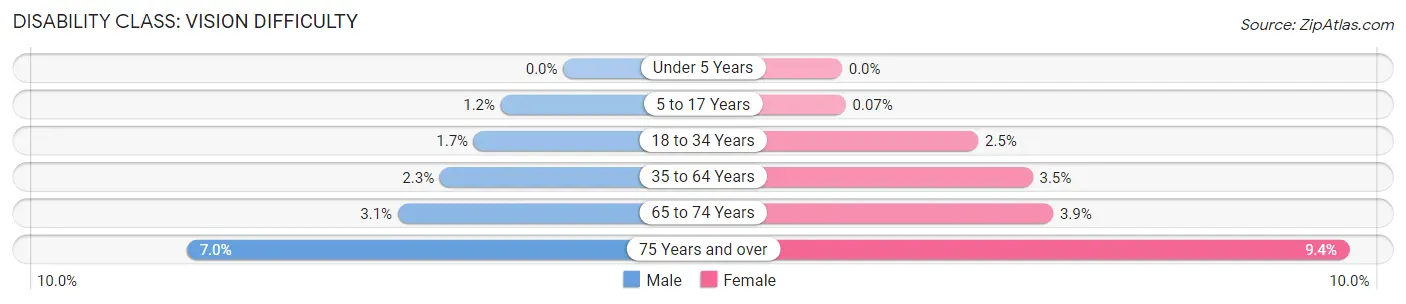
| Age Bracket | Male | Female |
| Under 5 Years | 0 (0.0%) | 0 (0.0%) |
| 5 to 17 Years | 104 (1.2%) | 6 (0.1%) |
| 18 to 34 Years | 176 (1.7%) | 264 (2.5%) |
| 35 to 64 Years | 475 (2.3%) | 749 (3.5%) |
| 65 to 74 Years | 154 (3.1%) | 210 (3.9%) |
| 75 Years and over | 197 (7.0%) | 325 (9.4%) |
Disability Class: Cognitive Difficulty
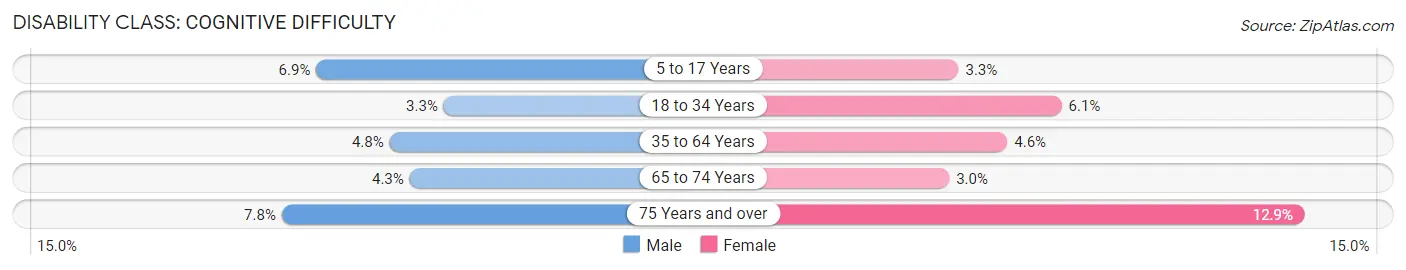
| Age Bracket | Male | Female |
| 5 to 17 Years | 614 (6.9%) | 273 (3.3%) |
| 18 to 34 Years | 353 (3.3%) | 638 (6.1%) |
| 35 to 64 Years | 1,002 (4.8%) | 976 (4.6%) |
| 65 to 74 Years | 215 (4.3%) | 160 (3.0%) |
| 75 Years and over | 221 (7.8%) | 445 (12.9%) |
Disability Class: Ambulatory Difficulty
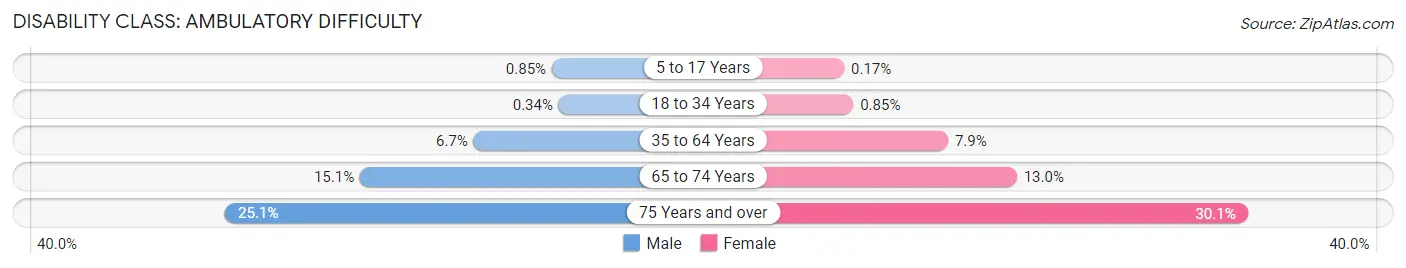
| Age Bracket | Male | Female |
| 5 to 17 Years | 76 (0.9%) | 14 (0.2%) |
| 18 to 34 Years | 36 (0.3%) | 89 (0.9%) |
| 35 to 64 Years | 1,380 (6.7%) | 1,668 (7.9%) |
| 65 to 74 Years | 758 (15.1%) | 696 (13.0%) |
| 75 Years and over | 708 (25.1%) | 1,040 (30.1%) |
Disability Class: Self-Care Difficulty
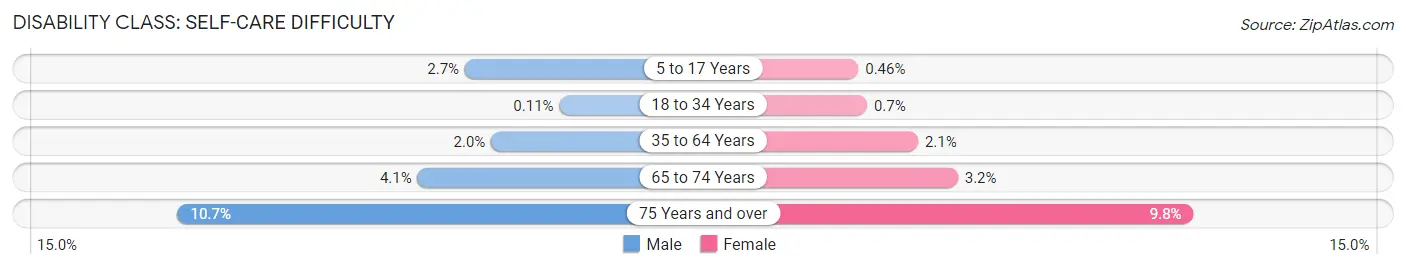
| Age Bracket | Male | Female |
| 5 to 17 Years | 245 (2.7%) | 39 (0.5%) |
| 18 to 34 Years | 12 (0.1%) | 73 (0.7%) |
| 35 to 64 Years | 417 (2.0%) | 449 (2.1%) |
| 65 to 74 Years | 204 (4.1%) | 173 (3.2%) |
| 75 Years and over | 303 (10.7%) | 338 (9.8%) |
Technology Access in Cecil County
Computing Device Access in Cecil County
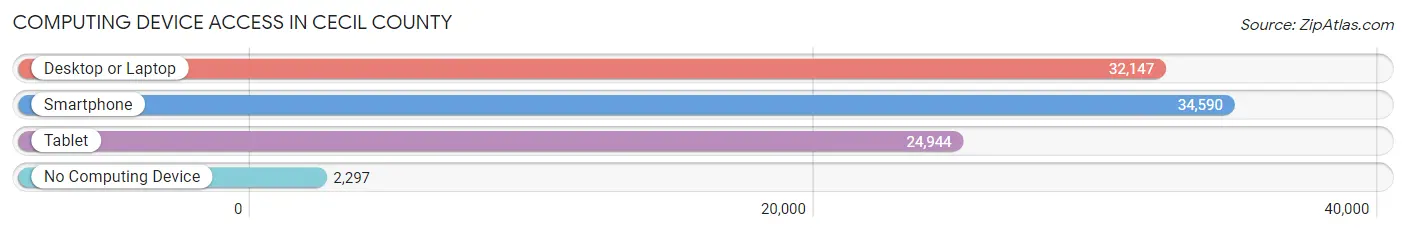
| Device Type | # Households | % Households |
| Desktop or Laptop | 32,147 | 81.7% |
| Smartphone | 34,590 | 87.9% |
| Tablet | 24,944 | 63.4% |
| No Computing Device | 2,297 | 5.8% |
| Total | 39,338 | 100.0% |
Internet Access in Cecil County
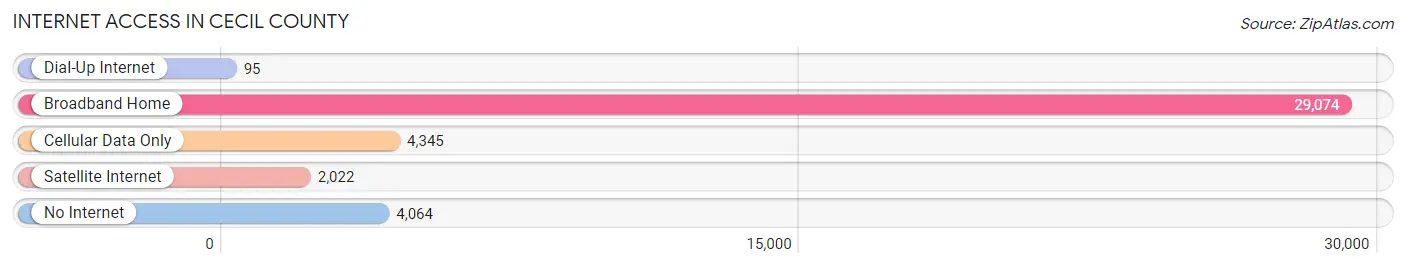
| Internet Type | # Households | % Households |
| Dial-Up Internet | 95 | 0.2% |
| Broadband Home | 29,074 | 73.9% |
| Cellular Data Only | 4,345 | 11.1% |
| Satellite Internet | 2,022 | 5.1% |
| No Internet | 4,064 | 10.3% |
| Total | 39,338 | 100.0% |
Cecil County Summary
Cecil County, Maryland is located in the northeastern corner of the state, bordered by Pennsylvania to the north, Delaware to the east, and the Chesapeake Bay to the south. It is part of the Baltimore-Washington metropolitan area and is the second-most populous county in Maryland. The county seat is Elkton, and the largest city is North East.
History
Cecil County was established in 1674, making it one of the oldest counties in Maryland. It was named for Cecil Calvert, the second Lord Baltimore and the founder of the Maryland colony. The county was originally part of Baltimore County, but was split off in 1674.
The county was home to a number of prominent historical figures, including Francis Scott Key, who wrote the lyrics to the Star-Spangled Banner, and John Wilkes Booth, who assassinated President Abraham Lincoln.
Geography
Cecil County is located in the northeastern corner of Maryland, bordered by Pennsylvania to the north, Delaware to the east, and the Chesapeake Bay to the south. It is part of the Baltimore-Washington metropolitan area.
The county is mostly flat, with rolling hills in the northern and eastern parts. The highest point in the county is the summit of Turkey Point, which is located in the northern part of the county and has an elevation of 441 feet.
The county is home to several rivers, including the Susquehanna, Bohemia, and Sassafras. The Chesapeake Bay forms the southern border of the county.
Economy
Cecil County has a diverse economy, with a mix of manufacturing, agriculture, and services. The county is home to several large employers, including the Aberdeen Proving Ground, a U.S. Army installation, and the Perry Point VA Medical Center.
Agriculture is an important part of the county’s economy, with crops such as corn, soybeans, and wheat being grown. The county is also home to several wineries and breweries.
The county is home to several tourist attractions, including the Chesapeake Bay Maritime Museum, the Elk Neck State Park, and the Fair Hill Natural Resources Management Area.
Demographics
As of the 2010 census, Cecil County had a population of 101,108. The population is predominantly white (87.3%), with African Americans making up 8.2% of the population. Other racial groups include Asians (2.2%), Native Americans (0.5%), and Pacific Islanders (0.1%).
The median household income in the county is $68,845, and the median family income is $77,845. The per capita income is $30,945. The poverty rate is 8.3%.
The county is home to several colleges and universities, including Cecil College, the University of Maryland, and the University of Delaware.
Common Questions
What is the Total Population of Cecil County?
Total Population of Cecil County is 103,876.
What is the Total Male Population of Cecil County?
Total Male Population of Cecil County is 51,773.
What is the Total Female Population of Cecil County?
Total Female Population of Cecil County is 52,103.
What is the Ratio of Males per 100 Females in Cecil County?
There are 99.37 Males per 100 Females in Cecil County.
What is the Ratio of Females per 100 Males in Cecil County?
There are 100.64 Females per 100 Males in Cecil County.
What is the Median Population Age in Cecil County?
Median Population Age in Cecil County is 41.0 Years.
What is the Average Family Size in Cecil County
Average Family Size in Cecil County is 3.1 People.
What is the Average Household Size in Cecil County
Average Household Size in Cecil County is 2.6 People.
What is Per Capita Income in Cecil County?
Per Capita income in Cecil County is $40,520.
What is the Median Family Income in Cecil County?
Median Family Income in Cecil County is $103,315.
What is the Median Household income in Cecil County?
Median Household Income in Cecil County is $86,869.
What is Income or Wage Gap in Cecil County?
Income or Wage Gap in Cecil County is 32.8%.
Women in Cecil County earn 67.2 cents for every dollar earned by a man.
What is Family Income Deficit in Cecil County?
Family Income Deficit in Cecil County is $13,873.
Families that are below poverty line in Cecil County earn $13,873 less on average than the poverty threshold level.
What is Inequality or Gini Index in Cecil County?
Inequality or Gini Index in Cecil County is 0.43.
How Large is the Labor Force in Cecil County?
There are 52,847 People in the Labor Forcein in Cecil County.
What is the Percentage of People in the Labor Force in Cecil County?
63.2% of People are in the Labor Force in Cecil County.
What is the Unemployment Rate in Cecil County?
Unemployment Rate in Cecil County is 4.9%.