Calvert County, MD
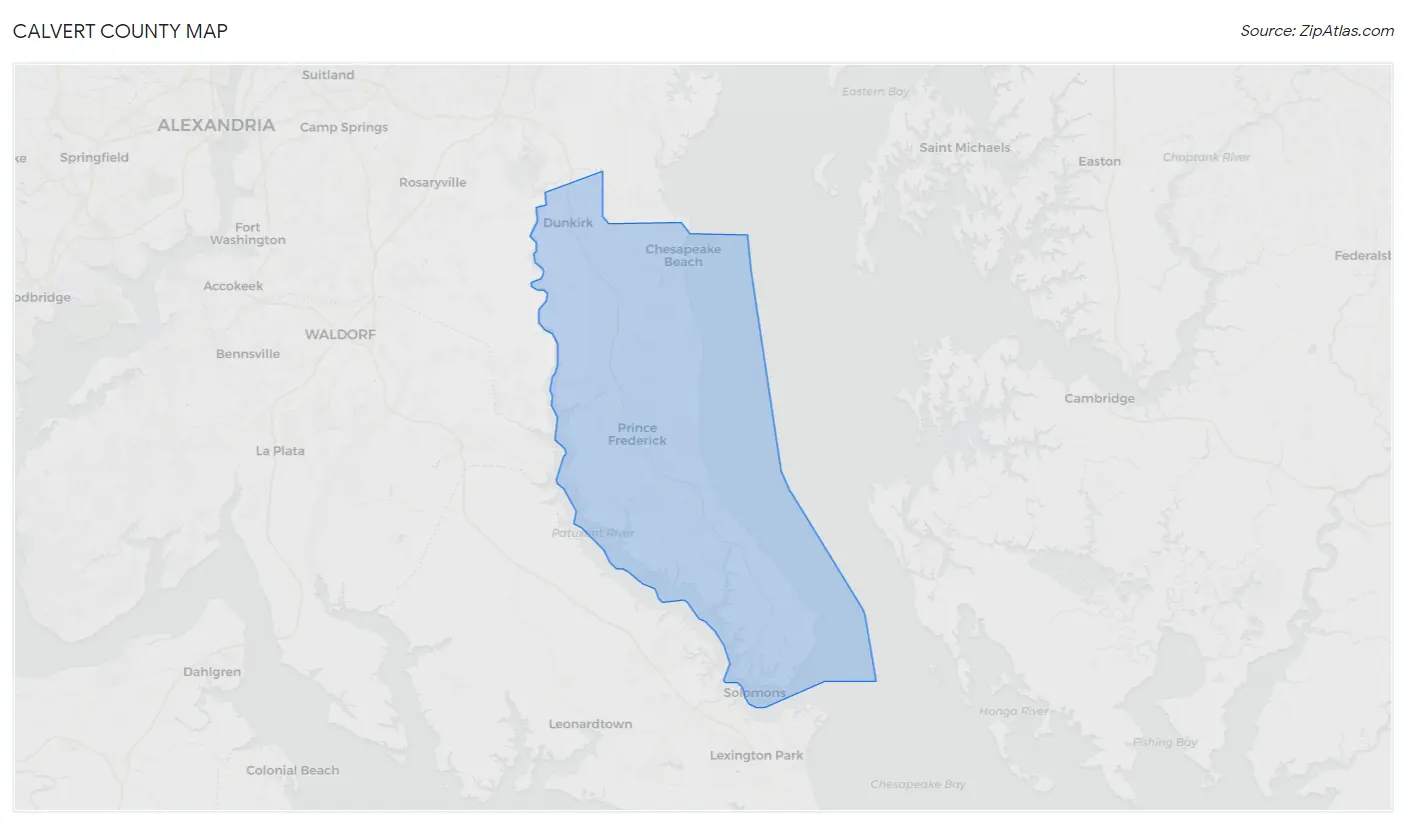
Calvert County Map
Calvert County Overview
93,244
TOTAL POPULATION
46,543
MALE POPULATION
46,701
FEMALE POPULATION
99.66
MALES / 100 FEMALES
100.34
FEMALES / 100 MALES
40.4
MEDIAN AGE
3.2
AVG FAMILY SIZE
2.8
AVG HOUSEHOLD SIZE
$54,038
PER CAPITA INCOME
$145,175
AVG FAMILY INCOME
$128,078
AVG HOUSEHOLD INCOME
34.8%
WAGE / INCOME GAP [ % ]
65.2¢/ $1
WAGE / INCOME GAP [ $ ]
$12,448
FAMILY INCOME DEFICIT
0.38
INEQUALITY / GINI INDEX
50,024
LABOR FORCE [ PEOPLE ]
67.2%
PERCENT IN LABOR FORCE
3.2%
UNEMPLOYMENT RATE
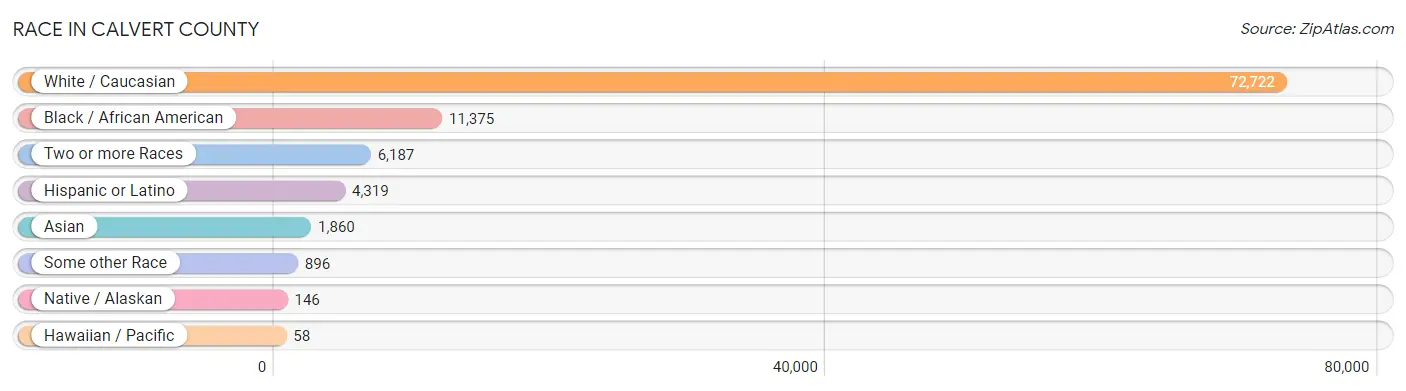
Race in Calvert County
The most populous races in Calvert County are White / Caucasian (72,722 | 78.0%), Black / African American (11,375 | 12.2%), and Two or more Races (6,187 | 6.6%).
| Race | # Population | % Population |
| Asian | 1,860 | 2.0% |
| Black / African American | 11,375 | 12.2% |
| Hawaiian / Pacific | 58 | 0.1% |
| Hispanic or Latino | 4,319 | 4.6% |
| Native / Alaskan | 146 | 0.2% |
| White / Caucasian | 72,722 | 78.0% |
| Two or more Races | 6,187 | 6.6% |
| Some other Race | 896 | 1.0% |
| Total | 93,244 | 100.0% |
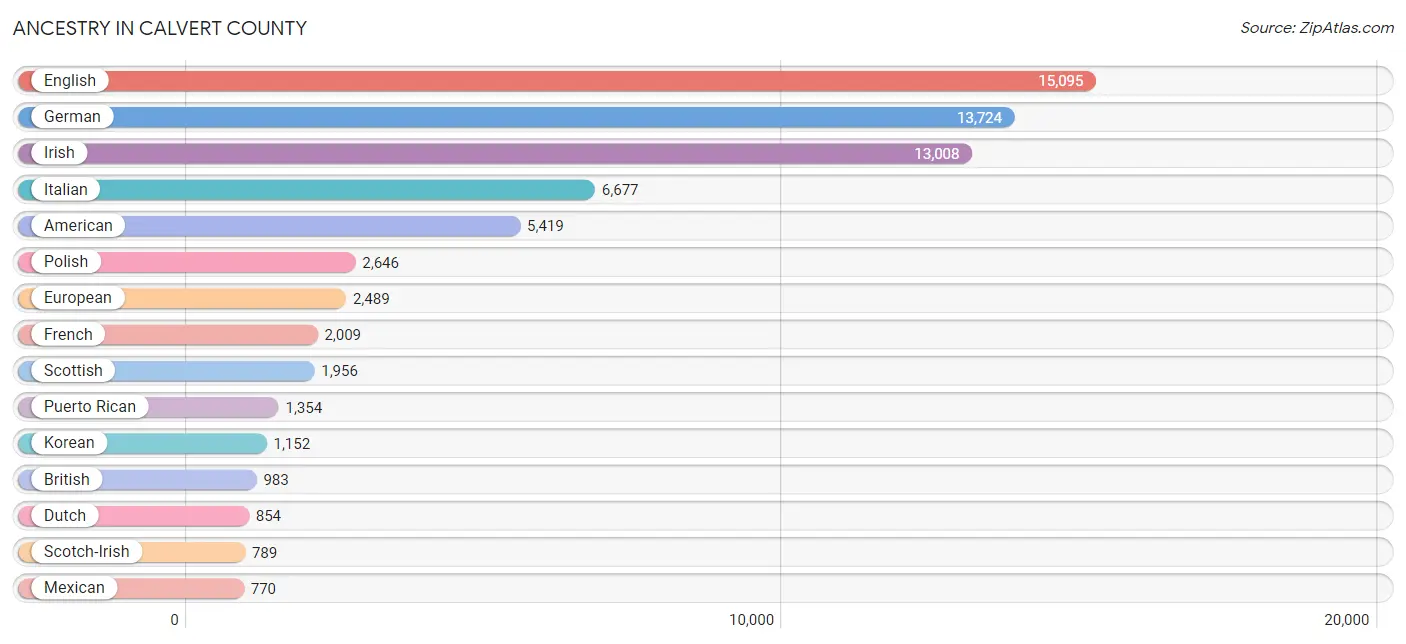
Ancestry in Calvert County
The most populous ancestries reported in Calvert County are English (15,095 | 16.2%), German (13,724 | 14.7%), Irish (13,008 | 14.0%), Italian (6,677 | 7.2%), and American (5,419 | 5.8%), together accounting for 57.8% of all Calvert County residents.
| Ancestry | # Population | % Population |
| Afghan | 16 | 0.0% |
| African | 209 | 0.2% |
| American | 5,419 | 5.8% |
| Apache | 6 | 0.0% |
| Arab | 167 | 0.2% |
| Argentinean | 36 | 0.0% |
| Armenian | 38 | 0.0% |
| Australian | 8 | 0.0% |
| Austrian | 168 | 0.2% |
| Belgian | 7 | 0.0% |
| Belizean | 1 | 0.0% |
| Bhutanese | 446 | 0.5% |
| Blackfeet | 74 | 0.1% |
| Brazilian | 9 | 0.0% |
| British | 983 | 1.1% |
| Bulgarian | 7 | 0.0% |
| Burmese | 144 | 0.2% |
| Canadian | 154 | 0.2% |
| Cape Verdean | 25 | 0.0% |
| Celtic | 31 | 0.0% |
| Central American | 690 | 0.7% |
| Central American Indian | 104 | 0.1% |
| Cherokee | 196 | 0.2% |
| Cheyenne | 19 | 0.0% |
| Chickasaw | 1 | 0.0% |
| Chilean | 15 | 0.0% |
| Choctaw | 39 | 0.0% |
| Colombian | 123 | 0.1% |
| Costa Rican | 63 | 0.1% |
| Creek | 19 | 0.0% |
| Cuban | 232 | 0.3% |
| Czech | 306 | 0.3% |
| Czechoslovakian | 118 | 0.1% |
| Danish | 171 | 0.2% |
| Dominican | 200 | 0.2% |
| Dutch | 854 | 0.9% |
| Eastern European | 219 | 0.2% |
| Ecuadorian | 78 | 0.1% |
| Egyptian | 9 | 0.0% |
| English | 15,095 | 16.2% |
| Estonian | 37 | 0.0% |
| Ethiopian | 1 | 0.0% |
| European | 2,489 | 2.7% |
| Finnish | 50 | 0.1% |
| French | 2,009 | 2.1% |
| French Canadian | 610 | 0.6% |
| German | 13,724 | 14.7% |
| German Russian | 12 | 0.0% |
| Ghanaian | 5 | 0.0% |
| Greek | 393 | 0.4% |
| Guamanian / Chamorro | 9 | 0.0% |
| Guatemalan | 252 | 0.3% |
| Guyanese | 23 | 0.0% |
| Honduran | 161 | 0.2% |
| Hungarian | 237 | 0.3% |
| Indian (Asian) | 344 | 0.4% |
| Iranian | 41 | 0.0% |
| Irish | 13,008 | 14.0% |
| Iroquois | 6 | 0.0% |
| Italian | 6,677 | 7.2% |
| Jamaican | 238 | 0.3% |
| Korean | 1,152 | 1.2% |
| Latvian | 96 | 0.1% |
| Lebanese | 80 | 0.1% |
| Lithuanian | 90 | 0.1% |
| Lumbee | 15 | 0.0% |
| Maltese | 28 | 0.0% |
| Mexican | 770 | 0.8% |
| Native Hawaiian | 108 | 0.1% |
| Navajo | 43 | 0.1% |
| Nigerian | 60 | 0.1% |
| Northern European | 306 | 0.3% |
| Norwegian | 502 | 0.5% |
| Pakistani | 61 | 0.1% |
| Panamanian | 37 | 0.0% |
| Pennsylvania German | 24 | 0.0% |
| Peruvian | 14 | 0.0% |
| Polish | 2,646 | 2.8% |
| Portuguese | 140 | 0.2% |
| Puerto Rican | 1,354 | 1.5% |
| Romanian | 101 | 0.1% |
| Russian | 441 | 0.5% |
| Salvadoran | 177 | 0.2% |
| Scandinavian | 438 | 0.5% |
| Scotch-Irish | 789 | 0.9% |
| Scottish | 1,956 | 2.1% |
| Serbian | 18 | 0.0% |
| Sioux | 14 | 0.0% |
| Slavic | 40 | 0.0% |
| Slovak | 341 | 0.4% |
| Slovene | 14 | 0.0% |
| South African | 10 | 0.0% |
| South American | 480 | 0.5% |
| Spaniard | 191 | 0.2% |
| Spanish | 187 | 0.2% |
| Sri Lankan | 93 | 0.1% |
| Subsaharan African | 320 | 0.3% |
| Swedish | 711 | 0.8% |
| Swiss | 91 | 0.1% |
| Thai | 659 | 0.7% |
| Trinidadian and Tobagonian | 9 | 0.0% |
| Ukrainian | 183 | 0.2% |
| Vietnamese | 6 | 0.0% |
| Welsh | 495 | 0.5% |
| West Indian | 76 | 0.1% |
| Yugoslavian | 40 | 0.0% | View All 106 Rows |
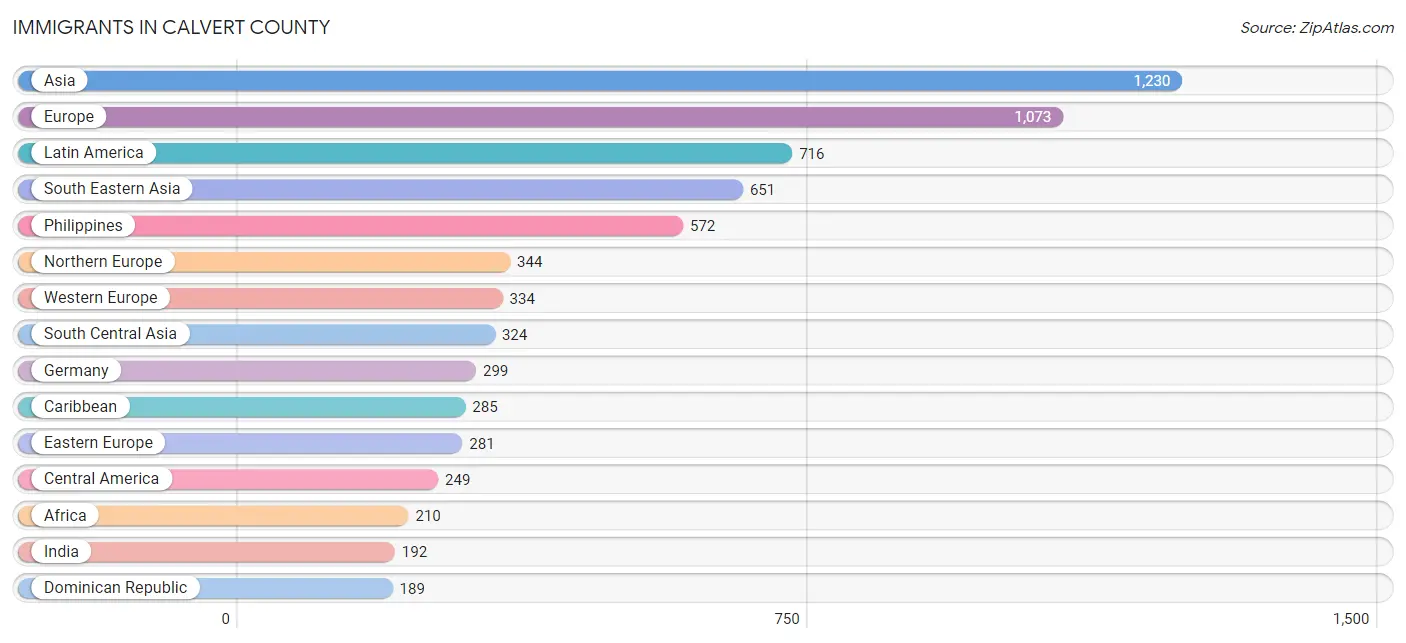
Immigrants in Calvert County
The most numerous immigrant groups reported in Calvert County came from Asia (1,230 | 1.3%), Europe (1,073 | 1.1%), Latin America (716 | 0.8%), South Eastern Asia (651 | 0.7%), and Philippines (572 | 0.6%), together accounting for 4.5% of all Calvert County residents.
| Immigration Origin | # Population | % Population |
| Afghanistan | 16 | 0.0% |
| Africa | 210 | 0.2% |
| Argentina | 58 | 0.1% |
| Armenia | 9 | 0.0% |
| Asia | 1,230 | 1.3% |
| Australia | 17 | 0.0% |
| Belize | 1 | 0.0% |
| Bosnia and Herzegovina | 15 | 0.0% |
| Brazil | 22 | 0.0% |
| Cameroon | 55 | 0.1% |
| Canada | 154 | 0.2% |
| Caribbean | 285 | 0.3% |
| Central America | 249 | 0.3% |
| Chile | 15 | 0.0% |
| China | 96 | 0.1% |
| Colombia | 21 | 0.0% |
| Cuba | 39 | 0.0% |
| Denmark | 8 | 0.0% |
| Dominican Republic | 189 | 0.2% |
| Eastern Africa | 64 | 0.1% |
| Eastern Asia | 145 | 0.2% |
| Eastern Europe | 281 | 0.3% |
| Ecuador | 59 | 0.1% |
| Egypt | 9 | 0.0% |
| El Salvador | 37 | 0.0% |
| England | 88 | 0.1% |
| Ethiopia | 1 | 0.0% |
| Europe | 1,073 | 1.1% |
| Germany | 299 | 0.3% |
| Ghana | 5 | 0.0% |
| Guatemala | 85 | 0.1% |
| Honduras | 75 | 0.1% |
| India | 192 | 0.2% |
| Iran | 31 | 0.0% |
| Iraq | 27 | 0.0% |
| Ireland | 119 | 0.1% |
| Italy | 99 | 0.1% |
| Jamaica | 49 | 0.1% |
| Japan | 11 | 0.0% |
| Korea | 38 | 0.0% |
| Latin America | 716 | 0.8% |
| Latvia | 26 | 0.0% |
| Mexico | 51 | 0.1% |
| Middle Africa | 55 | 0.1% |
| Nepal | 7 | 0.0% |
| Netherlands | 35 | 0.0% |
| Northern Africa | 31 | 0.0% |
| Northern Europe | 344 | 0.4% |
| Norway | 37 | 0.0% |
| Oceania | 29 | 0.0% |
| Pakistan | 78 | 0.1% |
| Peru | 7 | 0.0% |
| Philippines | 572 | 0.6% |
| Poland | 3 | 0.0% |
| Romania | 64 | 0.1% |
| Russia | 140 | 0.2% |
| Sierra Leone | 45 | 0.1% |
| Singapore | 6 | 0.0% |
| South Africa | 10 | 0.0% |
| South America | 182 | 0.2% |
| South Central Asia | 324 | 0.4% |
| South Eastern Asia | 651 | 0.7% |
| Southern Europe | 114 | 0.1% |
| Spain | 15 | 0.0% |
| Sweden | 38 | 0.0% |
| Syria | 21 | 0.0% |
| Taiwan | 8 | 0.0% |
| Thailand | 14 | 0.0% |
| Trinidad and Tobago | 8 | 0.0% |
| Turkey | 7 | 0.0% |
| Ukraine | 33 | 0.0% |
| Vietnam | 59 | 0.1% |
| Western Africa | 50 | 0.1% |
| Western Asia | 110 | 0.1% |
| Western Europe | 334 | 0.4% | View All 75 Rows |
Sex and Age in Calvert County
Sex and Age in Calvert County
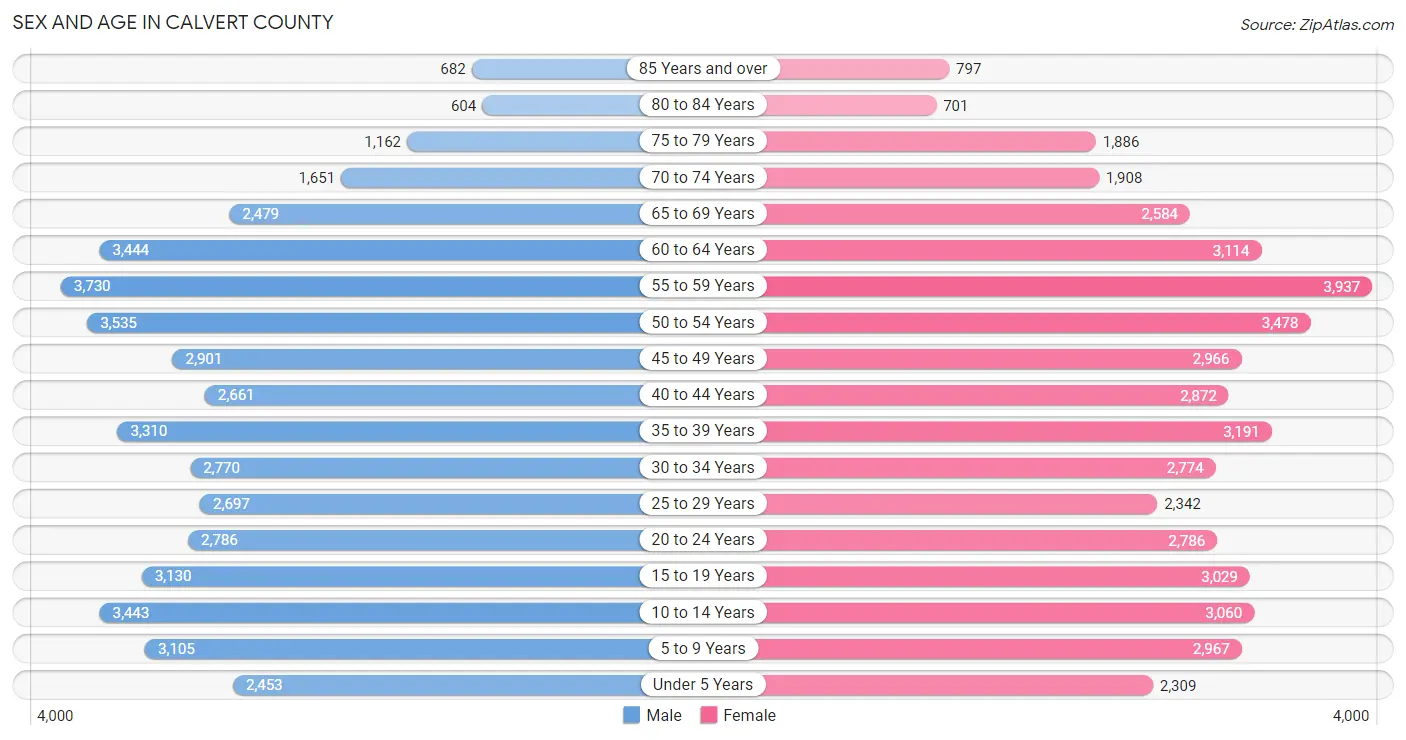
The most populous age groups in Calvert County are 55 to 59 Years (3,730 | 8.0%) for men and 55 to 59 Years (3,937 | 8.4%) for women.
| Age Bracket | Male | Female |
| Under 5 Years | 2,453 (5.3%) | 2,309 (4.9%) |
| 5 to 9 Years | 3,105 (6.7%) | 2,967 (6.4%) |
| 10 to 14 Years | 3,443 (7.4%) | 3,060 (6.6%) |
| 15 to 19 Years | 3,130 (6.7%) | 3,029 (6.5%) |
| 20 to 24 Years | 2,786 (6.0%) | 2,786 (6.0%) |
| 25 to 29 Years | 2,697 (5.8%) | 2,342 (5.0%) |
| 30 to 34 Years | 2,770 (5.9%) | 2,774 (5.9%) |
| 35 to 39 Years | 3,310 (7.1%) | 3,191 (6.8%) |
| 40 to 44 Years | 2,661 (5.7%) | 2,872 (6.1%) |
| 45 to 49 Years | 2,901 (6.2%) | 2,966 (6.4%) |
| 50 to 54 Years | 3,535 (7.6%) | 3,478 (7.4%) |
| 55 to 59 Years | 3,730 (8.0%) | 3,937 (8.4%) |
| 60 to 64 Years | 3,444 (7.4%) | 3,114 (6.7%) |
| 65 to 69 Years | 2,479 (5.3%) | 2,584 (5.5%) |
| 70 to 74 Years | 1,651 (3.5%) | 1,908 (4.1%) |
| 75 to 79 Years | 1,162 (2.5%) | 1,886 (4.0%) |
| 80 to 84 Years | 604 (1.3%) | 701 (1.5%) |
| 85 Years and over | 682 (1.5%) | 797 (1.7%) |
| Total | 46,543 (100.0%) | 46,701 (100.0%) |
Families and Households in Calvert County
Median Family Size in Calvert County
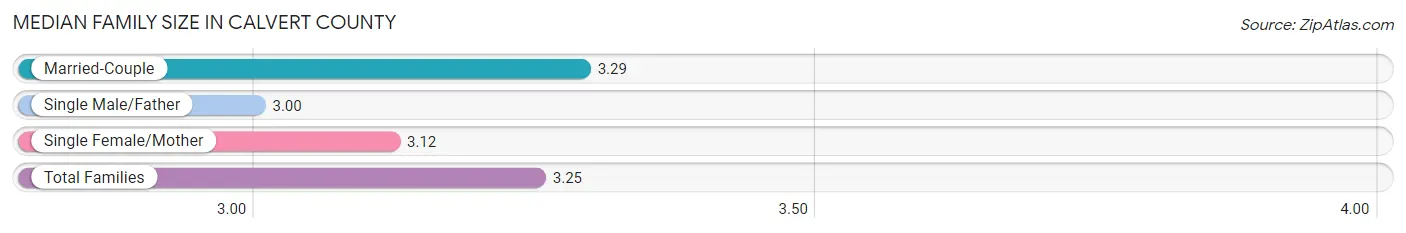
The median family size in Calvert County is 3.25 persons per family, with married-couple families (20,077 | 81.1%) accounting for the largest median family size of 3.29 persons per family. On the other hand, single male/father families (1,521 | 6.1%) represent the smallest median family size with 3.00 persons per family.
| Family Type | # Families | Family Size |
| Married-Couple | 20,077 (81.1%) | 3.29 |
| Single Male/Father | 1,521 (6.1%) | 3.00 |
| Single Female/Mother | 3,147 (12.7%) | 3.12 |
| Total Families | 24,745 (100.0%) | 3.25 |
Median Household Size in Calvert County
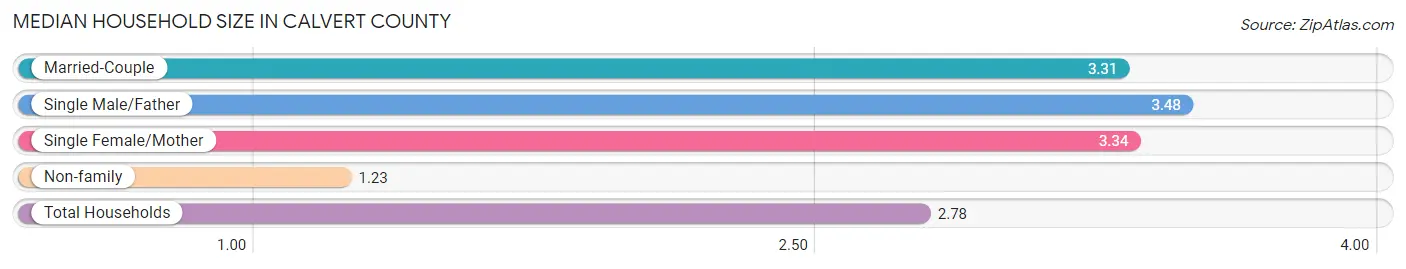
The median household size in Calvert County is 2.78 persons per household, with single male/father households (1,521 | 4.6%) accounting for the largest median household size of 3.48 persons per household. non-family households (8,539 | 25.7%) represent the smallest median household size with 1.23 persons per household.
| Household Type | # Households | Household Size |
| Married-Couple | 20,077 (60.3%) | 3.31 |
| Single Male/Father | 1,521 (4.6%) | 3.48 |
| Single Female/Mother | 3,147 (9.5%) | 3.34 |
| Non-family | 8,539 (25.7%) | 1.23 |
| Total Households | 33,284 (100.0%) | 2.78 |
Household Size by Marriage Status in Calvert County
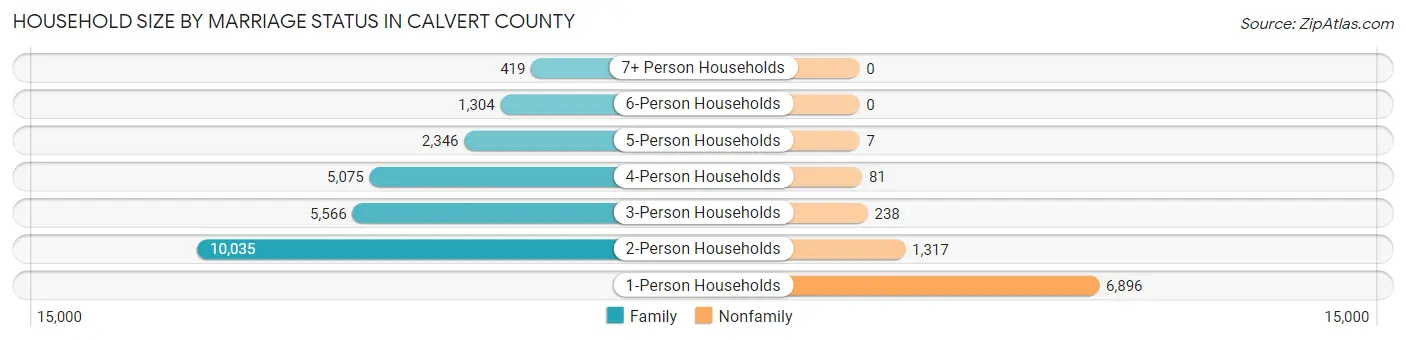
Out of a total of 33,284 households in Calvert County, 24,745 (74.4%) are family households, while 8,539 (25.7%) are nonfamily households. The most numerous type of family households are 2-person households, comprising 10,035, and the most common type of nonfamily households are 1-person households, comprising 6,896.
| Household Size | Family Households | Nonfamily Households |
| 1-Person Households | - | 6,896 (20.7%) |
| 2-Person Households | 10,035 (30.1%) | 1,317 (4.0%) |
| 3-Person Households | 5,566 (16.7%) | 238 (0.7%) |
| 4-Person Households | 5,075 (15.2%) | 81 (0.2%) |
| 5-Person Households | 2,346 (7.0%) | 7 (0.0%) |
| 6-Person Households | 1,304 (3.9%) | 0 (0.0%) |
| 7+ Person Households | 419 (1.3%) | 0 (0.0%) |
| Total | 24,745 (74.4%) | 8,539 (25.7%) |
Female Fertility in Calvert County
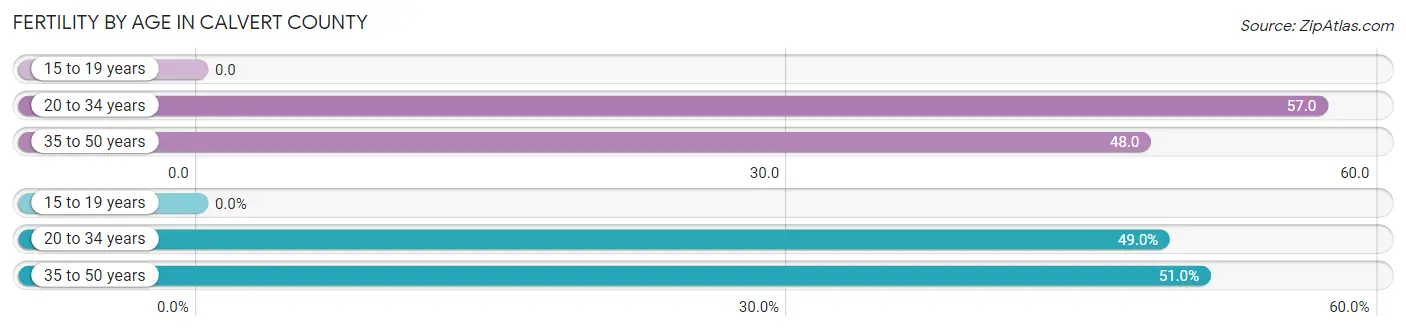
Fertility by Age in Calvert County
Average fertility rate in Calvert County is 44.0 births per 1,000 women. Women in the age bracket of 20 to 34 years have the highest fertility rate with 57.0 births per 1,000 women. Women in the age bracket of 35 to 50 years acount for 51.0% of all women with births.
| Age Bracket | Women with Births | Births / 1,000 Women |
| 15 to 19 years | 0 (0.0%) | 0.0 |
| 20 to 34 years | 448 (49.0%) | 57.0 |
| 35 to 50 years | 467 (51.0%) | 48.0 |
| Total | 915 (100.0%) | 44.0 |
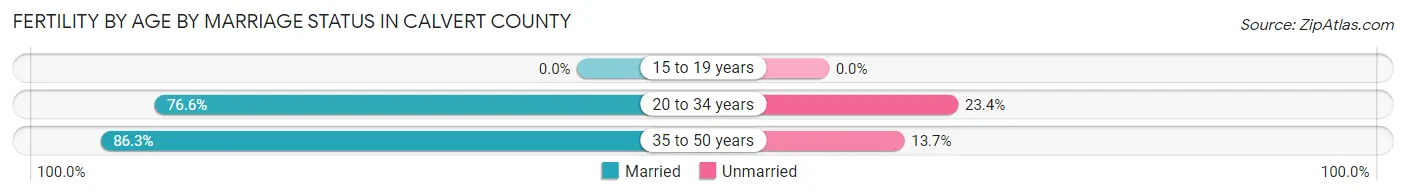
Fertility by Age by Marriage Status in Calvert County
81.5% of women with births (915) in Calvert County are married. The highest percentage of unmarried women with births falls into 20 to 34 years age bracket with 23.4% of them unmarried at the time of birth, while the lowest percentage of unmarried women with births belong to 35 to 50 years age bracket with 13.7% of them unmarried.
| Age Bracket | Married | Unmarried |
| 15 to 19 years | 0 (0.0%) | 0 (0.0%) |
| 20 to 34 years | 343 (76.6%) | 105 (23.4%) |
| 35 to 50 years | 403 (86.3%) | 64 (13.7%) |
| Total | 746 (81.5%) | 169 (18.5%) |
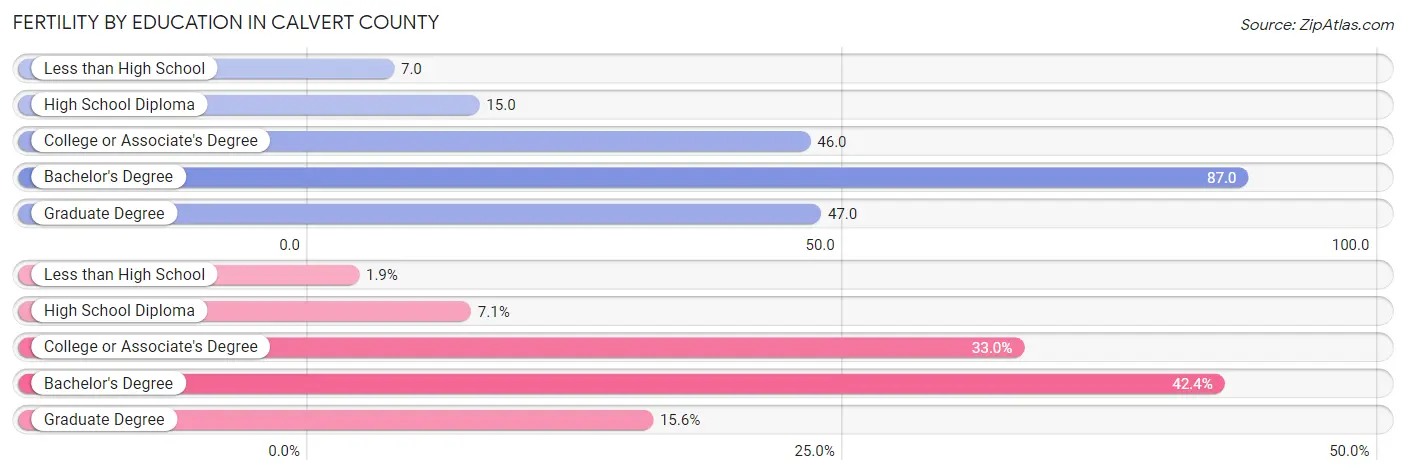
Fertility by Education in Calvert County
Average fertility rate in Calvert County is 44.0 births per 1,000 women. Women with the education attainment of bachelor's degree have the highest fertility rate of 87.0 births per 1,000 women, while women with the education attainment of less than high school have the lowest fertility at 7.0 births per 1,000 women. Women with the education attainment of bachelor's degree represent 42.4% of all women with births.
| Educational Attainment | Women with Births | Births / 1,000 Women |
| Less than High School | 17 (1.9%) | 7.0 |
| High School Diploma | 65 (7.1%) | 15.0 |
| College or Associate's Degree | 302 (33.0%) | 46.0 |
| Bachelor's Degree | 388 (42.4%) | 87.0 |
| Graduate Degree | 143 (15.6%) | 47.0 |
| Total | 915 (100.0%) | 44.0 |
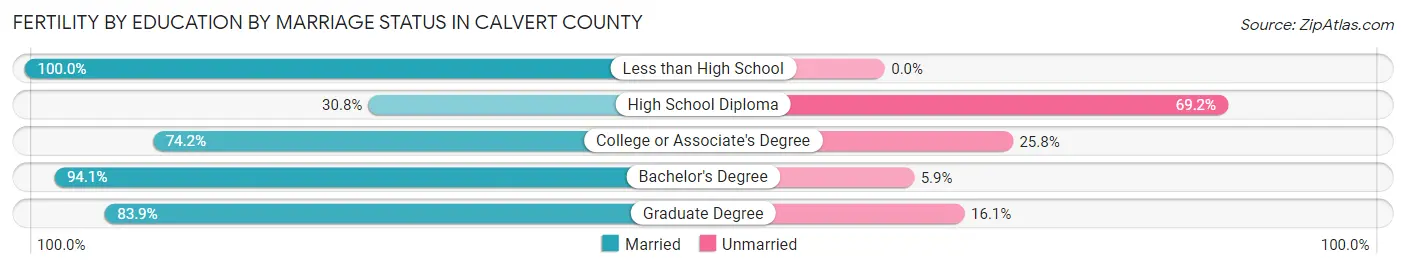
Fertility by Education by Marriage Status in Calvert County
18.5% of women with births in Calvert County are unmarried. Women with the educational attainment of less than high school are most likely to be married with 100.0% of them married at childbirth, while women with the educational attainment of high school diploma are least likely to be married with 69.2% of them unmarried at childbirth.
| Educational Attainment | Married | Unmarried |
| Less than High School | 17 (100.0%) | 0 (0.0%) |
| High School Diploma | 20 (30.8%) | 45 (69.2%) |
| College or Associate's Degree | 224 (74.2%) | 78 (25.8%) |
| Bachelor's Degree | 365 (94.1%) | 23 (5.9%) |
| Graduate Degree | 120 (83.9%) | 23 (16.1%) |
| Total | 746 (81.5%) | 169 (18.5%) |
Income in Calvert County
Income Overview in Calvert County
Per Capita Income in Calvert County is $54,038, while median incomes of families and households are $145,175 and $128,078 respectively.
| Characteristic | Number | Measure |
| Per Capita Income | 93,244 | $54,038 |
| Median Family Income | 24,745 | $145,175 |
| Mean Family Income | 24,745 | $165,260 |
| Median Household Income | 33,284 | $128,078 |
| Mean Household Income | 33,284 | $147,643 |
| Income Deficit | 24,745 | $12,448 |
| Wage / Income Gap (%) | 93,244 | 34.82% |
| Wage / Income Gap ($) | 93,244 | 65.18¢ per $1 |
| Gini / Inequality Index | 93,244 | 0.38 |
Earnings by Sex in Calvert County
Average Earnings in Calvert County are $64,025, $79,636 for men and $51,906 for women, a difference of 34.8%.
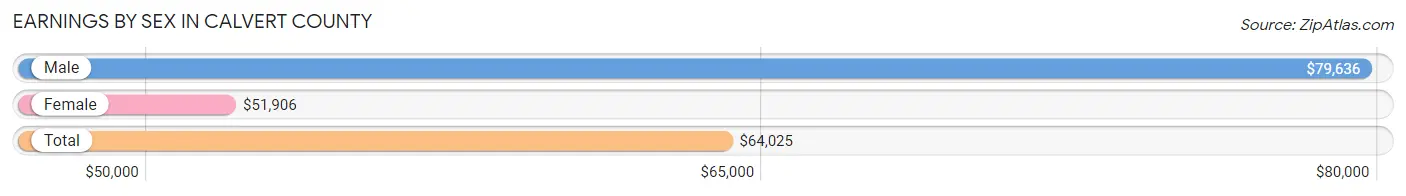
| Sex | Number | Average Earnings |
| Male | 28,178 (54.1%) | $79,636 |
| Female | 23,881 (45.9%) | $51,906 |
| Total | 52,059 (100.0%) | $64,025 |
Earnings by Sex by Income Bracket in Calvert County
The most common earnings brackets in Calvert County are $100,000+ for men (10,134 | 36.0%) and $100,000+ for women (4,311 | 18.0%).
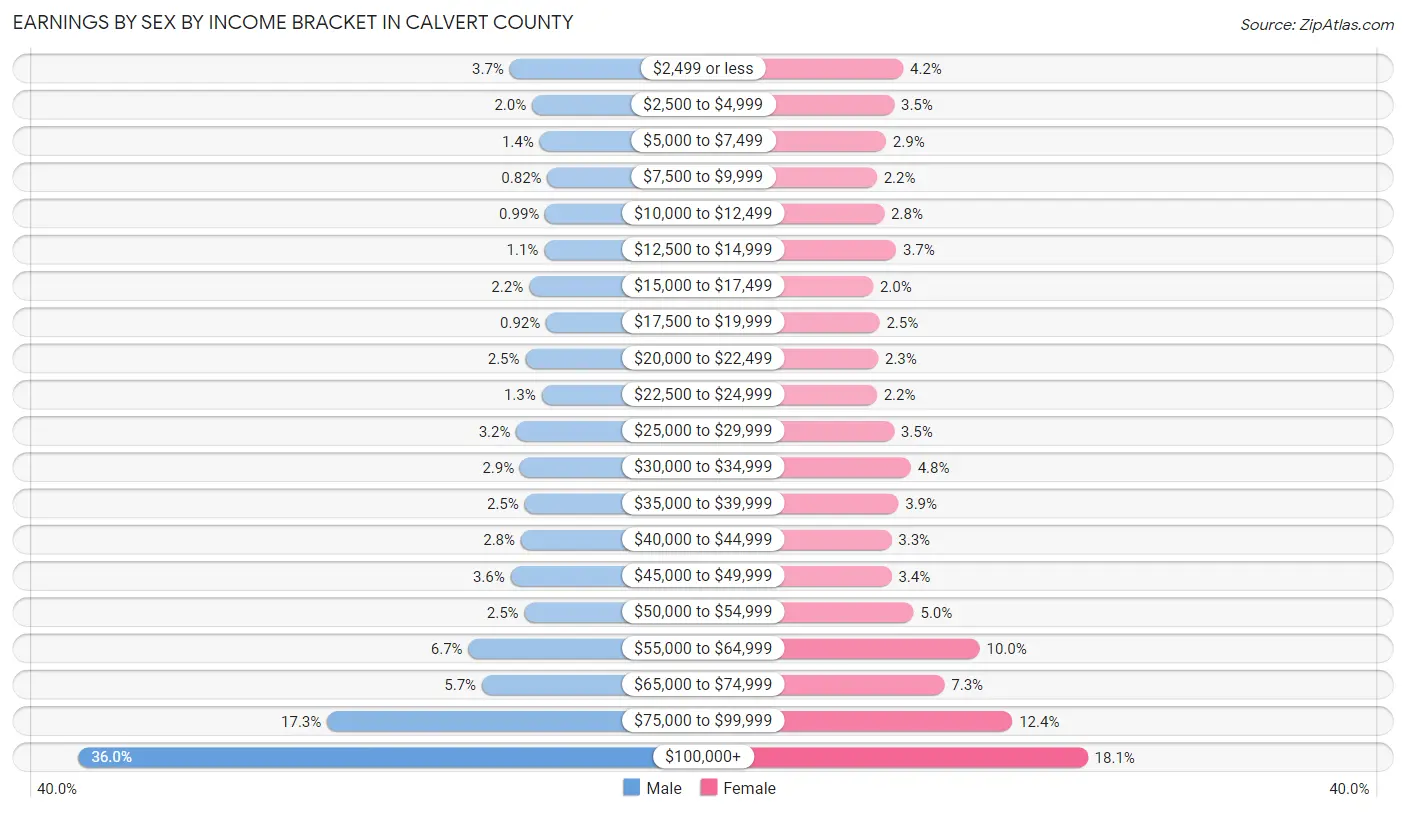
| Income | Male | Female |
| $2,499 or less | 1,029 (3.6%) | 1,008 (4.2%) |
| $2,500 to $4,999 | 554 (2.0%) | 845 (3.5%) |
| $5,000 to $7,499 | 397 (1.4%) | 700 (2.9%) |
| $7,500 to $9,999 | 232 (0.8%) | 535 (2.2%) |
| $10,000 to $12,499 | 278 (1.0%) | 668 (2.8%) |
| $12,500 to $14,999 | 300 (1.1%) | 882 (3.7%) |
| $15,000 to $17,499 | 620 (2.2%) | 468 (2.0%) |
| $17,500 to $19,999 | 258 (0.9%) | 585 (2.5%) |
| $20,000 to $22,499 | 697 (2.5%) | 560 (2.3%) |
| $22,500 to $24,999 | 355 (1.3%) | 535 (2.2%) |
| $25,000 to $29,999 | 888 (3.2%) | 842 (3.5%) |
| $30,000 to $34,999 | 808 (2.9%) | 1,144 (4.8%) |
| $35,000 to $39,999 | 713 (2.5%) | 922 (3.9%) |
| $40,000 to $44,999 | 793 (2.8%) | 798 (3.3%) |
| $45,000 to $49,999 | 1,008 (3.6%) | 799 (3.4%) |
| $50,000 to $54,999 | 715 (2.5%) | 1,195 (5.0%) |
| $55,000 to $64,999 | 1,899 (6.7%) | 2,377 (10.0%) |
| $65,000 to $74,999 | 1,616 (5.7%) | 1,745 (7.3%) |
| $75,000 to $99,999 | 4,884 (17.3%) | 2,962 (12.4%) |
| $100,000+ | 10,134 (36.0%) | 4,311 (18.0%) |
| Total | 28,178 (100.0%) | 23,881 (100.0%) |
Earnings by Sex by Educational Attainment in Calvert County
Average earnings in Calvert County are $86,326 for men and $59,869 for women, a difference of 30.6%. Men with an educational attainment of graduate degree enjoy the highest average annual earnings of $124,435, while those with less than high school education earn the least with $44,842. Women with an educational attainment of graduate degree earn the most with the average annual earnings of $84,865, while those with high school diploma education have the smallest earnings of $39,794.
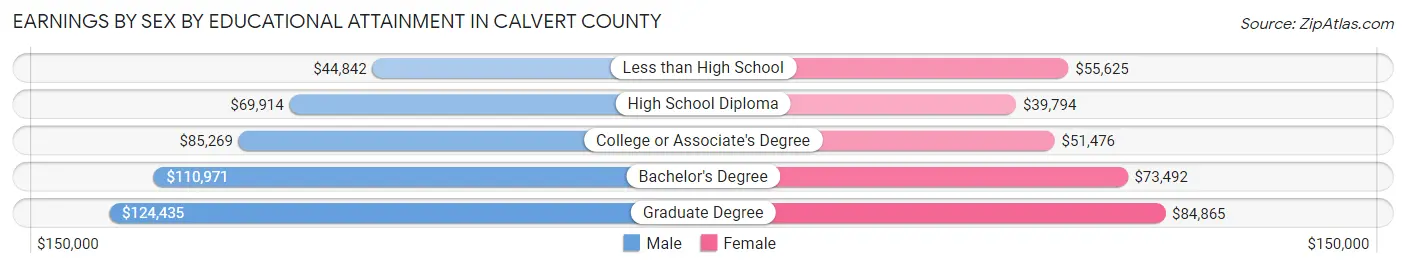
| Educational Attainment | Male Income | Female Income |
| Less than High School | $44,842 | $55,625 |
| High School Diploma | $69,914 | $39,794 |
| College or Associate's Degree | $85,269 | $51,476 |
| Bachelor's Degree | $110,971 | $73,492 |
| Graduate Degree | $124,435 | $84,865 |
| Total | $86,326 | $59,869 |
Family Income in Calvert County
Family Income Brackets in Calvert County
According to the Calvert County family income data, there are 7,052 families falling into the $200,000+ income range, which is the most common income bracket and makes up 28.5% of all families. Conversely, the less than $10,000 income bracket is the least frequent group with only 223 families (0.9%) belonging to this category.
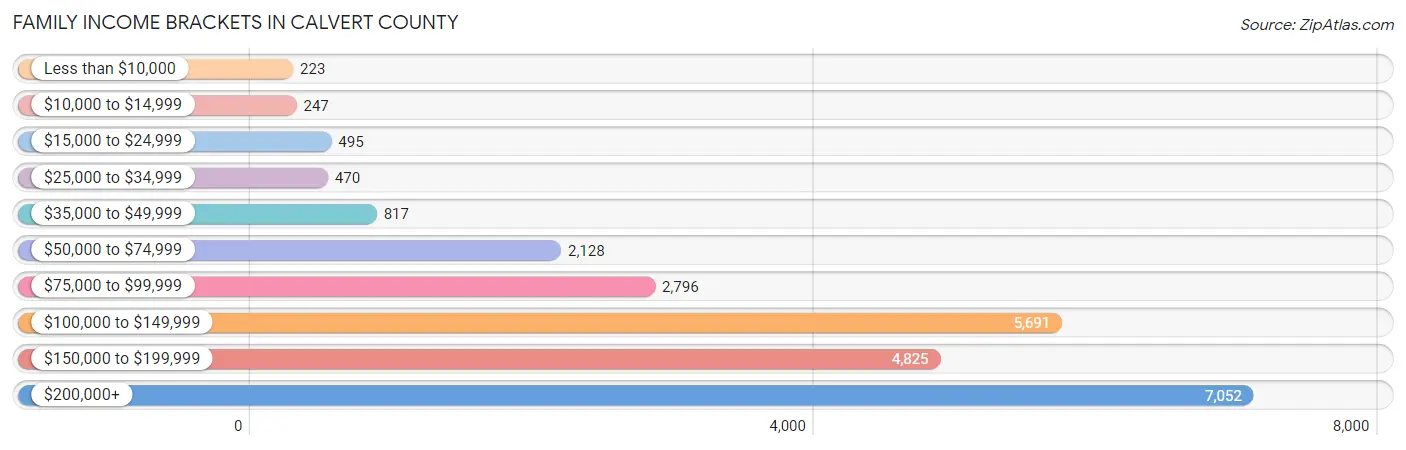
| Income Bracket | # Families | % Families |
| Less than $10,000 | 223 | 0.9% |
| $10,000 to $14,999 | 247 | 1.0% |
| $15,000 to $24,999 | 495 | 2.0% |
| $25,000 to $34,999 | 470 | 1.9% |
| $35,000 to $49,999 | 817 | 3.3% |
| $50,000 to $74,999 | 2,128 | 8.6% |
| $75,000 to $99,999 | 2,796 | 11.3% |
| $100,000 to $149,999 | 5,691 | 23.0% |
| $150,000 to $199,999 | 4,825 | 19.5% |
| $200,000+ | 7,052 | 28.5% |
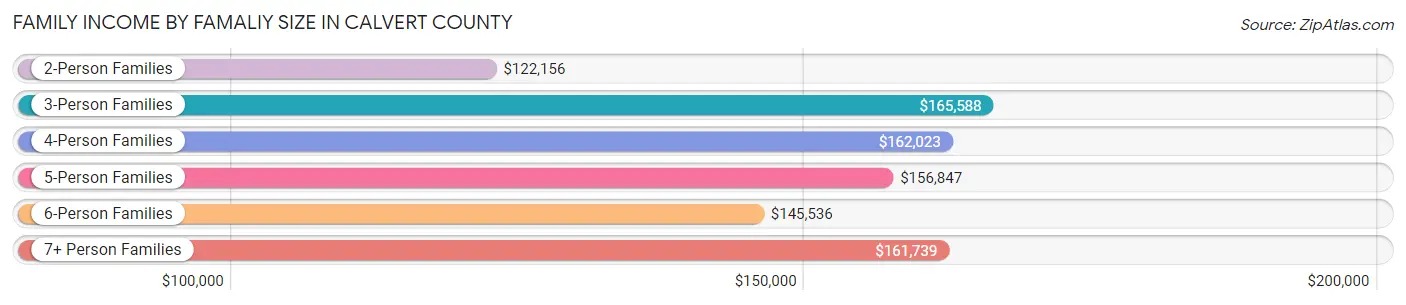
Family Income by Famaliy Size in Calvert County
3-person families (5,474 | 22.1%) account for the highest median family income in Calvert County with $165,588 per family, while 2-person families (10,586 | 42.8%) have the highest median income of $61,078 per family member.
| Income Bracket | # Families | Median Income |
| 2-Person Families | 10,586 (42.8%) | $122,156 |
| 3-Person Families | 5,474 (22.1%) | $165,588 |
| 4-Person Families | 4,829 (19.5%) | $162,023 |
| 5-Person Families | 2,384 (9.6%) | $156,847 |
| 6-Person Families | 1,156 (4.7%) | $145,536 |
| 7+ Person Families | 316 (1.3%) | $161,739 |
| Total | 24,745 (100.0%) | $145,175 |
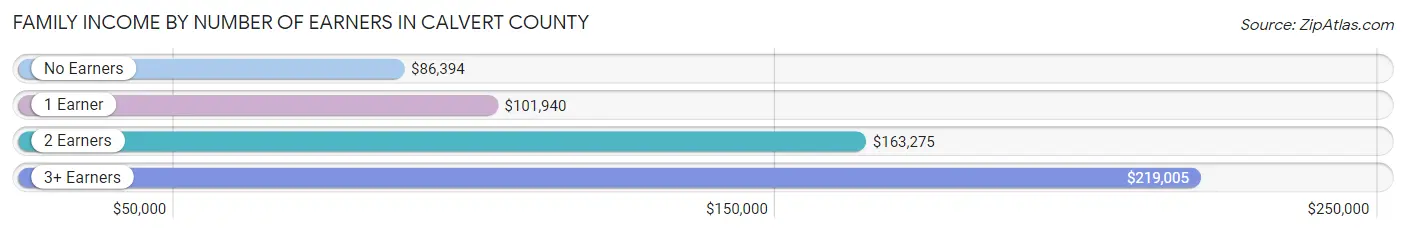
Family Income by Number of Earners in Calvert County
The median family income in Calvert County is $145,175, with families comprising 3+ earners (3,805) having the highest median family income of $219,005, while families with no earners (3,107) have the lowest median family income of $86,394, accounting for 15.4% and 12.6% of families, respectively.
| Number of Earners | # Families | Median Income |
| No Earners | 3,107 (12.6%) | $86,394 |
| 1 Earner | 6,500 (26.3%) | $101,940 |
| 2 Earners | 11,333 (45.8%) | $163,275 |
| 3+ Earners | 3,805 (15.4%) | $219,005 |
| Total | 24,745 (100.0%) | $145,175 |
Household Income in Calvert County
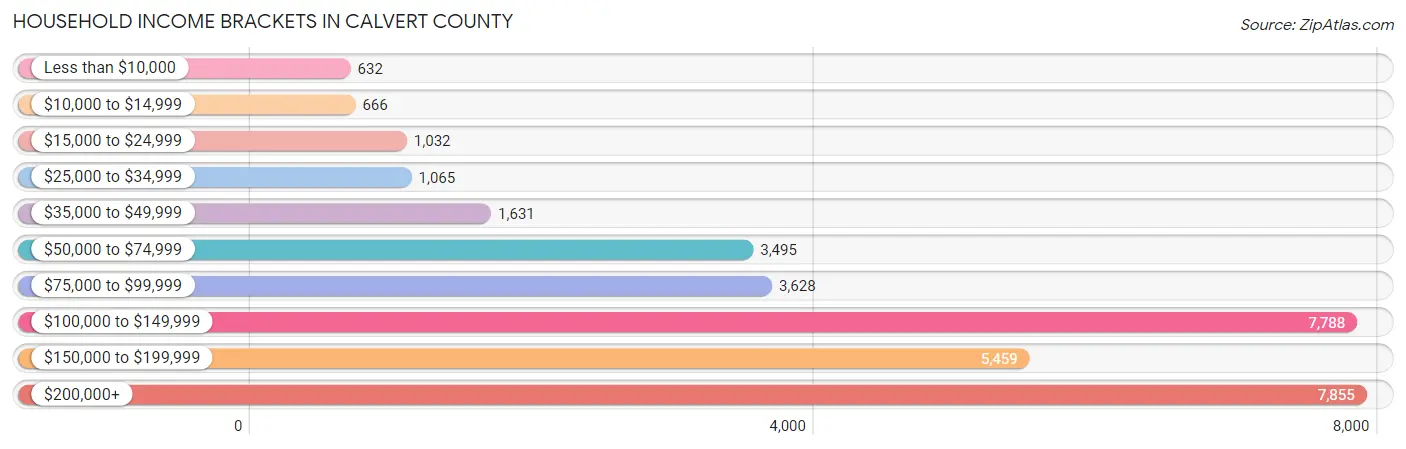
Household Income Brackets in Calvert County
With 7,855 households falling in the category, the $200,000+ income range is the most frequent in Calvert County, accounting for 23.6% of all households. In contrast, only 632 households (1.9%) fall into the less than $10,000 income bracket, making it the least populous group.
| Income Bracket | # Households | % Households |
| Less than $10,000 | 632 | 1.9% |
| $10,000 to $14,999 | 666 | 2.0% |
| $15,000 to $24,999 | 1,032 | 3.1% |
| $25,000 to $34,999 | 1,065 | 3.2% |
| $35,000 to $49,999 | 1,631 | 4.9% |
| $50,000 to $74,999 | 3,495 | 10.5% |
| $75,000 to $99,999 | 3,628 | 10.9% |
| $100,000 to $149,999 | 7,788 | 23.4% |
| $150,000 to $199,999 | 5,459 | 16.4% |
| $200,000+ | 7,855 | 23.6% |
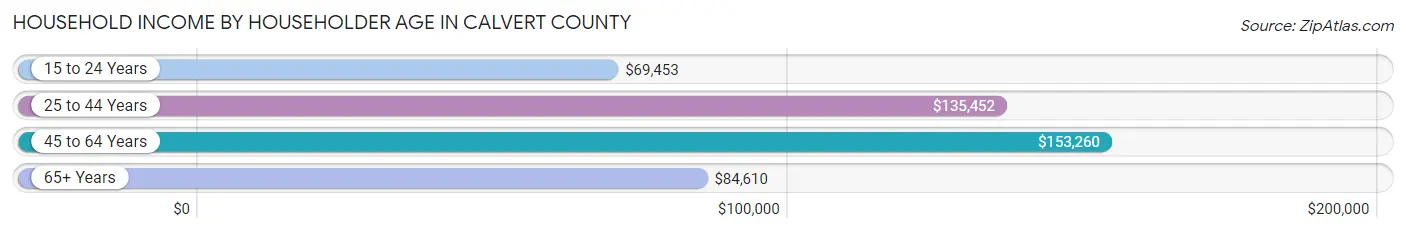
Household Income by Householder Age in Calvert County
The median household income in Calvert County is $128,078, with the highest median household income of $153,260 found in the 45 to 64 years age bracket for the primary householder. A total of 14,433 households (43.4%) fall into this category. Meanwhile, the 15 to 24 years age bracket for the primary householder has the lowest median household income of $69,453, with 557 households (1.7%) in this group.
| Income Bracket | # Households | Median Income |
| 15 to 24 Years | 557 (1.7%) | $69,453 |
| 25 to 44 Years | 9,944 (29.9%) | $135,452 |
| 45 to 64 Years | 14,433 (43.4%) | $153,260 |
| 65+ Years | 8,350 (25.1%) | $84,610 |
| Total | 33,284 (100.0%) | $128,078 |
Poverty in Calvert County
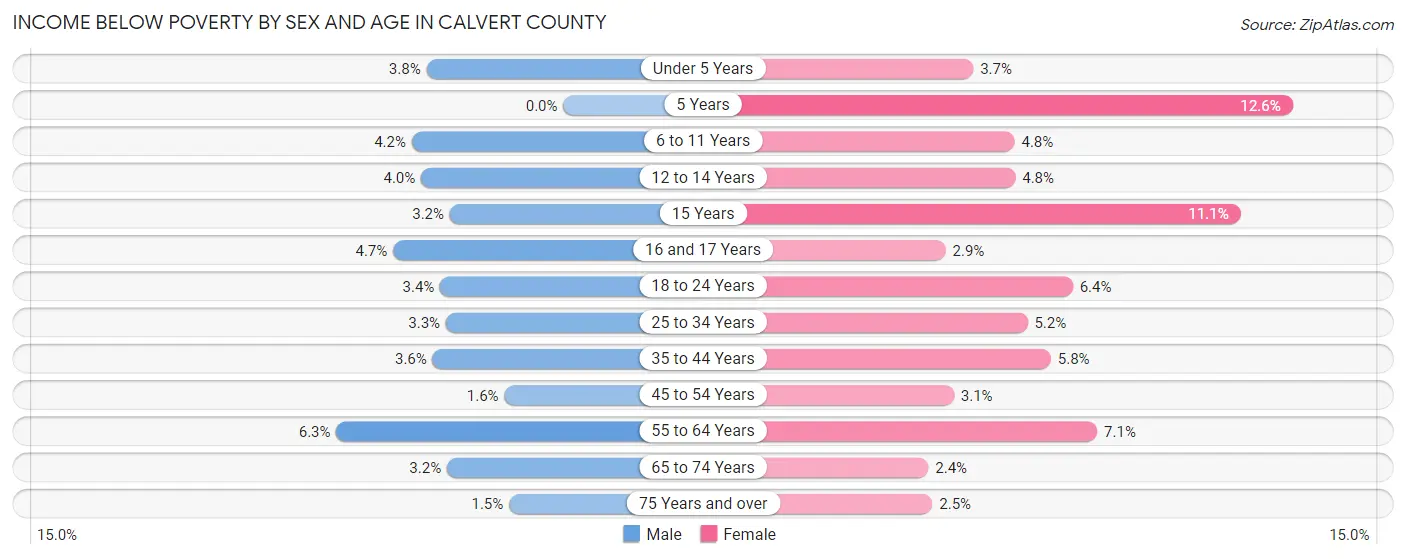
Income Below Poverty by Sex and Age in Calvert County
With 3.6% poverty level for males and 4.9% for females among the residents of Calvert County, 55 to 64 year old males and 5 year old females are the most vulnerable to poverty, with 452 males (6.3%) and 66 females (12.6%) in their respective age groups living below the poverty level.
| Age Bracket | Male | Female |
| Under 5 Years | 92 (3.8%) | 84 (3.7%) |
| 5 Years | 0 (0.0%) | 66 (12.6%) |
| 6 to 11 Years | 170 (4.2%) | 169 (4.8%) |
| 12 to 14 Years | 80 (4.0%) | 95 (4.8%) |
| 15 Years | 23 (3.2%) | 82 (11.1%) |
| 16 and 17 Years | 63 (4.7%) | 40 (2.9%) |
| 18 to 24 Years | 132 (3.4%) | 237 (6.4%) |
| 25 to 34 Years | 177 (3.3%) | 264 (5.2%) |
| 35 to 44 Years | 216 (3.6%) | 352 (5.8%) |
| 45 to 54 Years | 105 (1.6%) | 201 (3.1%) |
| 55 to 64 Years | 452 (6.3%) | 500 (7.1%) |
| 65 to 74 Years | 133 (3.2%) | 108 (2.4%) |
| 75 Years and over | 36 (1.5%) | 82 (2.5%) |
| Total | 1,679 (3.6%) | 2,280 (4.9%) |
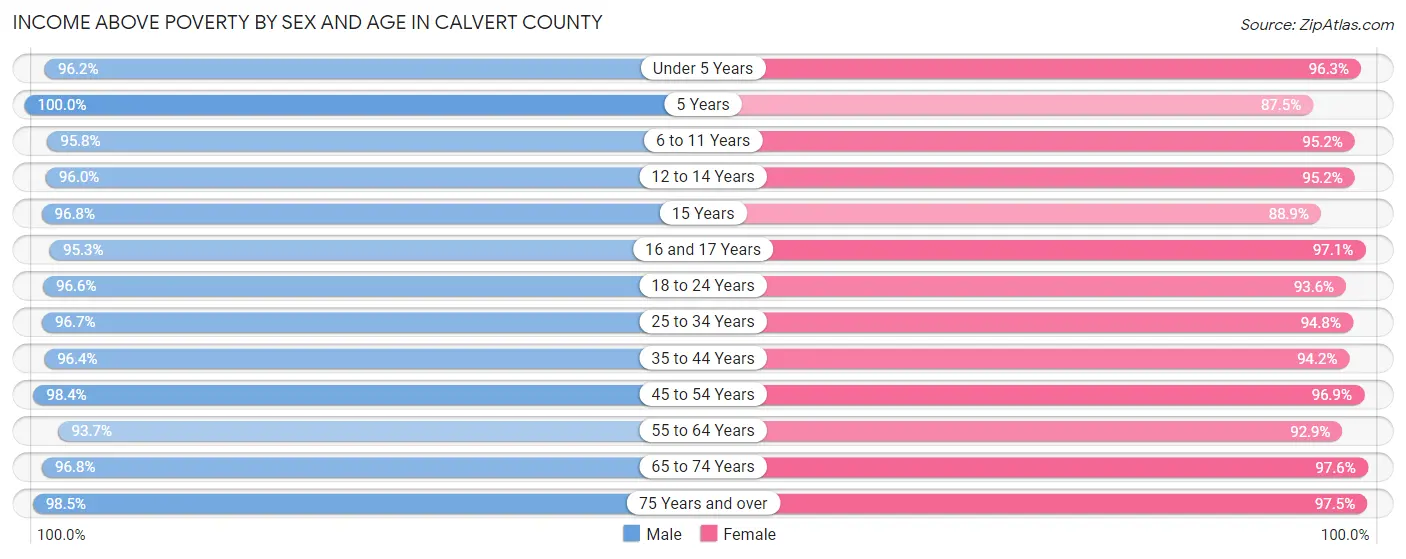
Income Above Poverty by Sex and Age in Calvert County
According to the poverty statistics in Calvert County, males aged 5 years and females aged 65 to 74 years are the age groups that are most secure financially, with 100.0% of males and 97.6% of females in these age groups living above the poverty line.
| Age Bracket | Male | Female |
| Under 5 Years | 2,325 (96.2%) | 2,210 (96.3%) |
| 5 Years | 477 (100.0%) | 460 (87.5%) |
| 6 to 11 Years | 3,855 (95.8%) | 3,344 (95.2%) |
| 12 to 14 Years | 1,938 (96.0%) | 1,871 (95.2%) |
| 15 Years | 704 (96.8%) | 657 (88.9%) |
| 16 and 17 Years | 1,266 (95.3%) | 1,346 (97.1%) |
| 18 to 24 Years | 3,717 (96.6%) | 3,448 (93.6%) |
| 25 to 34 Years | 5,239 (96.7%) | 4,847 (94.8%) |
| 35 to 44 Years | 5,725 (96.4%) | 5,696 (94.2%) |
| 45 to 54 Years | 6,313 (98.4%) | 6,242 (96.9%) |
| 55 to 64 Years | 6,696 (93.7%) | 6,536 (92.9%) |
| 65 to 74 Years | 3,975 (96.8%) | 4,376 (97.6%) |
| 75 Years and over | 2,343 (98.5%) | 3,175 (97.5%) |
| Total | 44,573 (96.4%) | 44,208 (95.1%) |
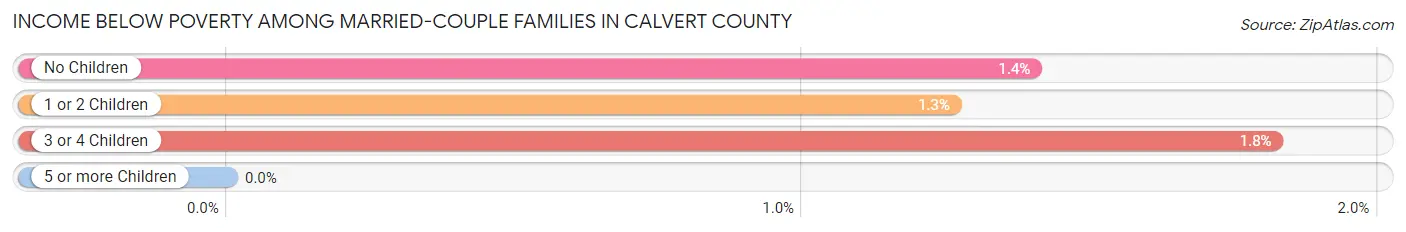
Income Below Poverty Among Married-Couple Families in Calvert County
The poverty statistics for married-couple families in Calvert County show that 1.4% or 278 of the total 20,077 families live below the poverty line. Families with 3 or 4 children have the highest poverty rate of 1.8%, comprising of 37 families. On the other hand, families with 5 or more children have the lowest poverty rate of 0.0%, which includes 0 families.
| Children | Above Poverty | Below Poverty |
| No Children | 11,104 (98.6%) | 158 (1.4%) |
| 1 or 2 Children | 6,514 (98.7%) | 83 (1.3%) |
| 3 or 4 Children | 2,001 (98.2%) | 37 (1.8%) |
| 5 or more Children | 180 (100.0%) | 0 (0.0%) |
| Total | 19,799 (98.6%) | 278 (1.4%) |
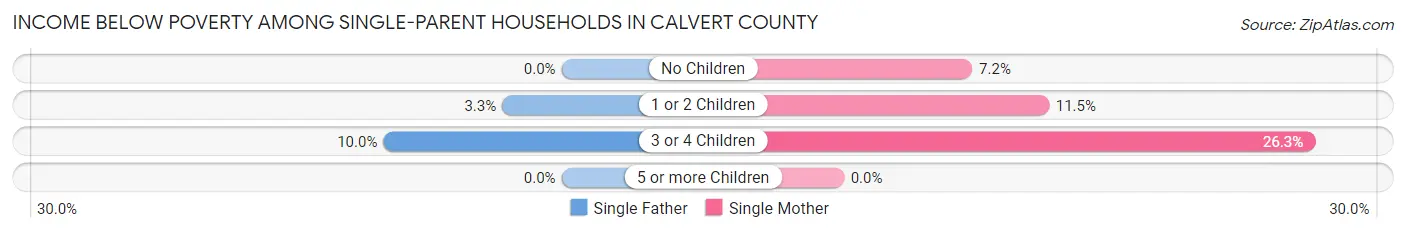
Income Below Poverty Among Single-Parent Households in Calvert County
According to the poverty data in Calvert County, 3.1% or 47 single-father households and 11.5% or 361 single-mother households are living below the poverty line. Among single-father households, those with 3 or 4 children have the highest poverty rate, with 28 households (10.0%) experiencing poverty. Likewise, among single-mother households, those with 3 or 4 children have the highest poverty rate, with 118 households (26.3%) falling below the poverty line.
| Children | Single Father | Single Mother |
| No Children | 0 (0.0%) | 111 (7.2%) |
| 1 or 2 Children | 19 (3.3%) | 132 (11.5%) |
| 3 or 4 Children | 28 (10.0%) | 118 (26.3%) |
| 5 or more Children | 0 (0.0%) | 0 (0.0%) |
| Total | 47 (3.1%) | 361 (11.5%) |
Income Below Poverty Among Married-Couple vs Single-Parent Households in Calvert County
The poverty data for Calvert County shows that 278 of the married-couple family households (1.4%) and 408 of the single-parent households (8.7%) are living below the poverty level. Within the married-couple family households, those with 3 or 4 children have the highest poverty rate, with 37 households (1.8%) falling below the poverty line. Among the single-parent households, those with 3 or 4 children have the highest poverty rate, with 146 household (20.0%) living below poverty.
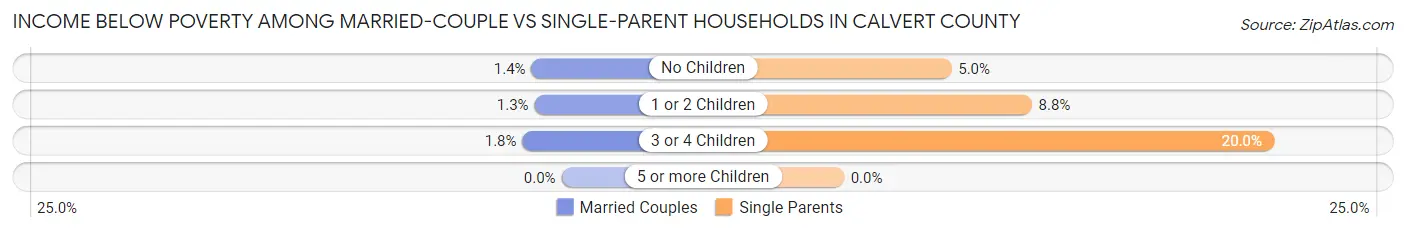
| Children | Married-Couple Families | Single-Parent Households |
| No Children | 158 (1.4%) | 111 (5.0%) |
| 1 or 2 Children | 83 (1.3%) | 151 (8.7%) |
| 3 or 4 Children | 37 (1.8%) | 146 (20.0%) |
| 5 or more Children | 0 (0.0%) | 0 (0.0%) |
| Total | 278 (1.4%) | 408 (8.7%) |
Employment Characteristics in Calvert County
Employment by Class of Employer in Calvert County
Among the 48,004 employed individuals in Calvert County, private company employees (26,748 | 55.7%), federal government employees (7,740 | 16.1%), and local government employees (5,152 | 10.7%) make up the most common classes of employment.
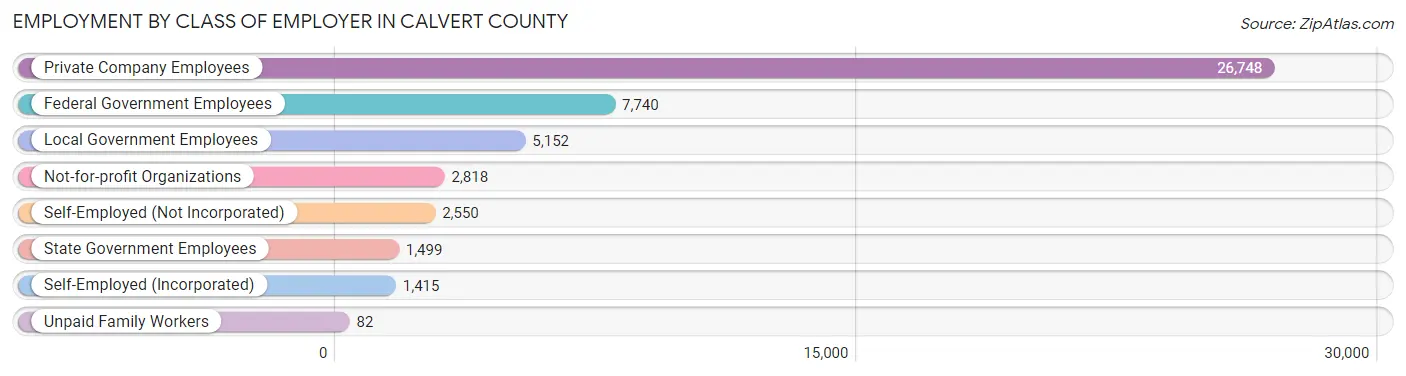
| Employer Class | # Employees | % Employees |
| Private Company Employees | 26,748 | 55.7% |
| Self-Employed (Incorporated) | 1,415 | 2.9% |
| Self-Employed (Not Incorporated) | 2,550 | 5.3% |
| Not-for-profit Organizations | 2,818 | 5.9% |
| Local Government Employees | 5,152 | 10.7% |
| State Government Employees | 1,499 | 3.1% |
| Federal Government Employees | 7,740 | 16.1% |
| Unpaid Family Workers | 82 | 0.2% |
| Total | 48,004 | 100.0% |
Employment Status by Age in Calvert County
According to the labor force statistics for Calvert County, out of the total population over 16 years of age (74,441), 67.2% or 50,024 individuals are in the labor force, with 3.2% or 1,601 of them unemployed. The age group with the highest labor force participation rate is 30 to 34 years, with 86.7% or 4,807 individuals in the labor force. Within the labor force, the 16 to 19 years age range has the highest percentage of unemployed individuals, with 18.7% or 371 of them being unemployed.
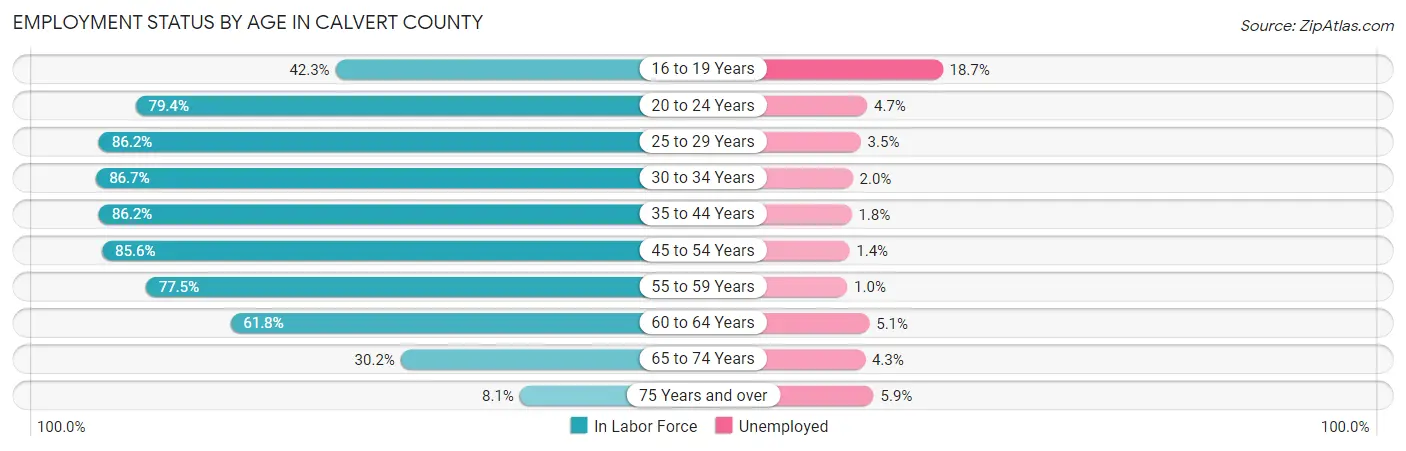
| Age Bracket | In Labor Force | Unemployed |
| 16 to 19 Years | 1,985 (42.3%) | 371 (18.7%) |
| 20 to 24 Years | 4,424 (79.4%) | 208 (4.7%) |
| 25 to 29 Years | 4,344 (86.2%) | 152 (3.5%) |
| 30 to 34 Years | 4,807 (86.7%) | 96 (2.0%) |
| 35 to 44 Years | 10,373 (86.2%) | 187 (1.8%) |
| 45 to 54 Years | 11,025 (85.6%) | 154 (1.4%) |
| 55 to 59 Years | 5,942 (77.5%) | 59 (1.0%) |
| 60 to 64 Years | 4,053 (61.8%) | 207 (5.1%) |
| 65 to 74 Years | 2,604 (30.2%) | 112 (4.3%) |
| 75 Years and over | 472 (8.1%) | 28 (5.9%) |
| Total | 50,024 (67.2%) | 1,601 (3.2%) |
Employment Status by Educational Attainment in Calvert County
According to labor force statistics for Calvert County, 81.5% of individuals (40,523) out of the total population between 25 and 64 years of age (49,722) are in the labor force, with 2.1% or 851 of them being unemployed. The group with the highest labor force participation rate are those with the educational attainment of bachelor's degree or higher, with 87.7% or 16,357 individuals in the labor force. Within the labor force, individuals with less than high school education have the highest percentage of unemployment, with 7.2% or 102 of them being unemployed.
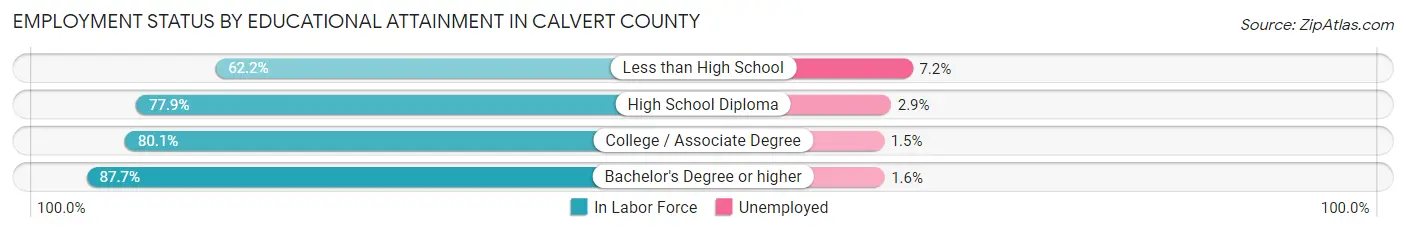
| Educational Attainment | In Labor Force | Unemployed |
| Less than High School | 1,423 (62.2%) | 165 (7.2%) |
| High School Diploma | 10,341 (77.9%) | 385 (2.9%) |
| College / Associate Degree | 12,422 (80.1%) | 233 (1.5%) |
| Bachelor's Degree or higher | 16,357 (87.7%) | 298 (1.6%) |
| Total | 40,523 (81.5%) | 1,044 (2.1%) |
Employment Occupations by Sex in Calvert County
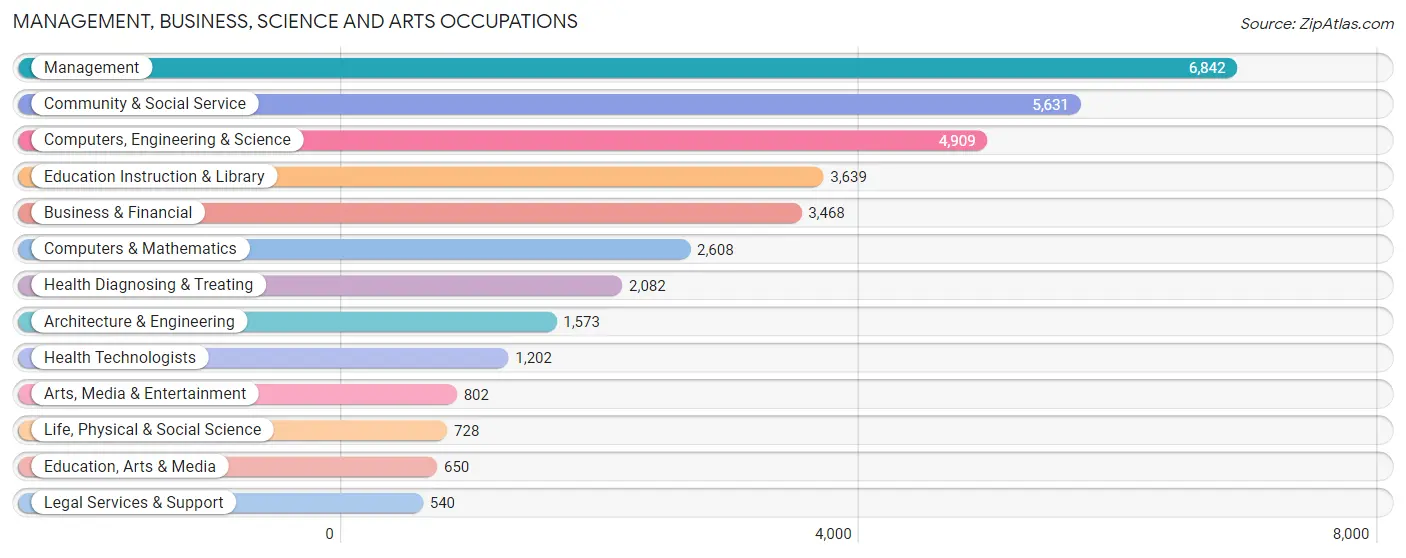
Management, Business, Science and Arts Occupations
The most common Management, Business, Science and Arts occupations in Calvert County are Management (6,842 | 14.5%), Community & Social Service (5,631 | 11.9%), Computers, Engineering & Science (4,909 | 10.4%), Education Instruction & Library (3,639 | 7.7%), and Business & Financial (3,468 | 7.3%).
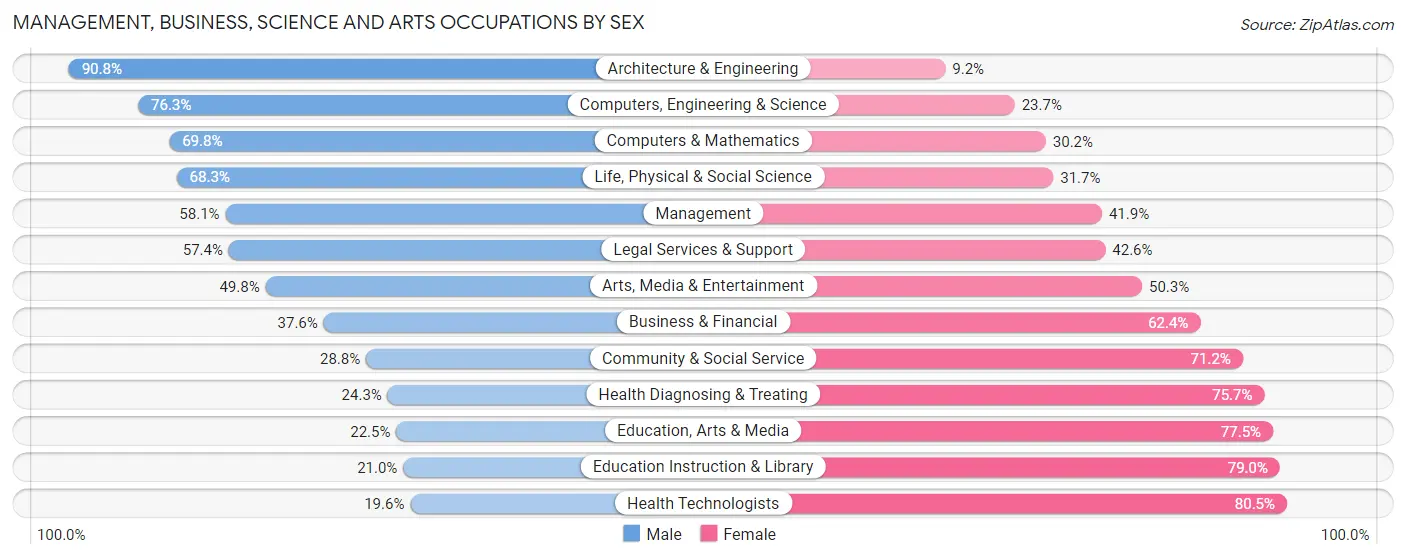
Management, Business, Science and Arts Occupations by Sex
Within the Management, Business, Science and Arts occupations in Calvert County, the most male-oriented occupations are Architecture & Engineering (90.8%), Computers, Engineering & Science (76.3%), and Computers & Mathematics (69.8%), while the most female-oriented occupations are Health Technologists (80.4%), Education Instruction & Library (79.0%), and Education, Arts & Media (77.5%).
| Occupation | Male | Female |
| Management | 3,976 (58.1%) | 2,866 (41.9%) |
| Business & Financial | 1,305 (37.6%) | 2,163 (62.4%) |
| Computers, Engineering & Science | 3,746 (76.3%) | 1,163 (23.7%) |
| Computers & Mathematics | 1,821 (69.8%) | 787 (30.2%) |
| Architecture & Engineering | 1,428 (90.8%) | 145 (9.2%) |
| Life, Physical & Social Science | 497 (68.3%) | 231 (31.7%) |
| Community & Social Service | 1,620 (28.8%) | 4,011 (71.2%) |
| Education, Arts & Media | 146 (22.5%) | 504 (77.5%) |
| Legal Services & Support | 310 (57.4%) | 230 (42.6%) |
| Education Instruction & Library | 765 (21.0%) | 2,874 (79.0%) |
| Arts, Media & Entertainment | 399 (49.7%) | 403 (50.2%) |
| Health Diagnosing & Treating | 505 (24.3%) | 1,577 (75.7%) |
| Health Technologists | 235 (19.6%) | 967 (80.4%) |
| Total (Category) | 11,152 (48.6%) | 11,780 (51.4%) |
| Total (Overall) | 25,615 (54.2%) | 21,660 (45.8%) |
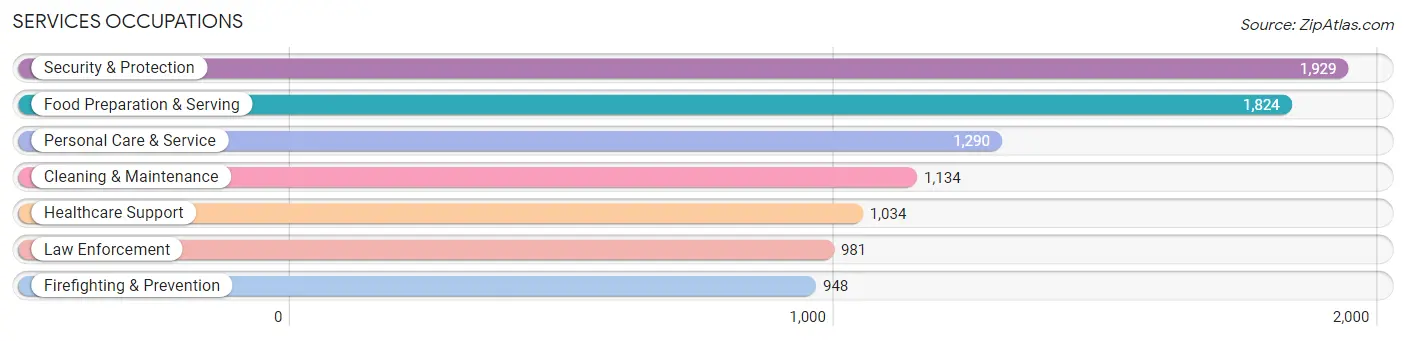
Services Occupations
The most common Services occupations in Calvert County are Security & Protection (1,929 | 4.1%), Food Preparation & Serving (1,824 | 3.9%), Personal Care & Service (1,290 | 2.7%), Cleaning & Maintenance (1,134 | 2.4%), and Healthcare Support (1,034 | 2.2%).
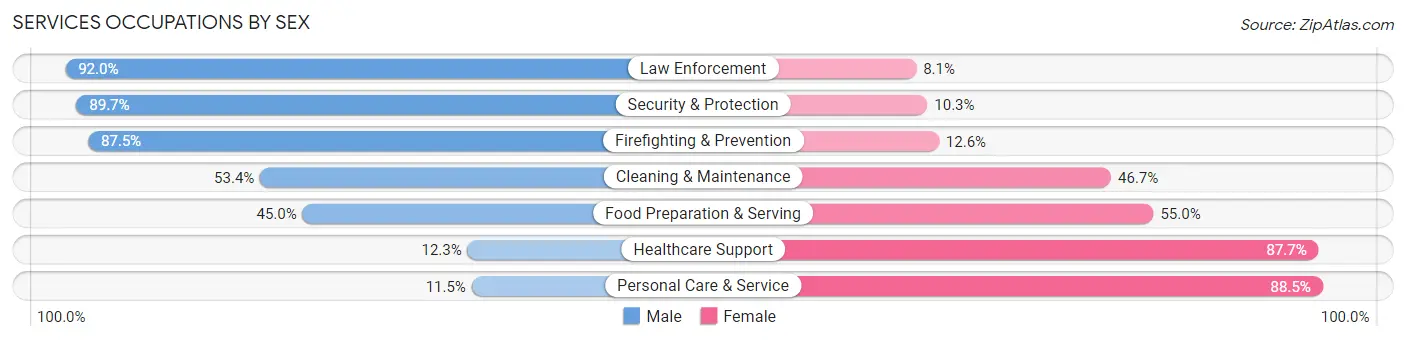
Services Occupations by Sex
Within the Services occupations in Calvert County, the most male-oriented occupations are Law Enforcement (91.9%), Security & Protection (89.7%), and Firefighting & Prevention (87.5%), while the most female-oriented occupations are Personal Care & Service (88.5%), Healthcare Support (87.7%), and Food Preparation & Serving (55.0%).
| Occupation | Male | Female |
| Healthcare Support | 127 (12.3%) | 907 (87.7%) |
| Security & Protection | 1,731 (89.7%) | 198 (10.3%) |
| Firefighting & Prevention | 829 (87.5%) | 119 (12.6%) |
| Law Enforcement | 902 (91.9%) | 79 (8.1%) |
| Food Preparation & Serving | 820 (45.0%) | 1,004 (55.0%) |
| Cleaning & Maintenance | 605 (53.3%) | 529 (46.7%) |
| Personal Care & Service | 148 (11.5%) | 1,142 (88.5%) |
| Total (Category) | 3,431 (47.6%) | 3,780 (52.4%) |
| Total (Overall) | 25,615 (54.2%) | 21,660 (45.8%) |
Sales and Office Occupations
The most common Sales and Office occupations in Calvert County are Office & Administration (4,696 | 9.9%), and Sales & Related (3,164 | 6.7%).

Sales and Office Occupations by Sex

| Occupation | Male | Female |
| Sales & Related | 1,856 (58.7%) | 1,308 (41.3%) |
| Office & Administration | 759 (16.2%) | 3,937 (83.8%) |
| Total (Category) | 2,615 (33.3%) | 5,245 (66.7%) |
| Total (Overall) | 25,615 (54.2%) | 21,660 (45.8%) |
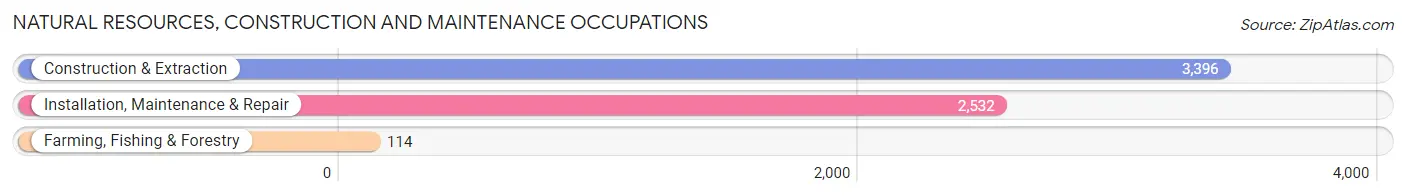
Natural Resources, Construction and Maintenance Occupations
The most common Natural Resources, Construction and Maintenance occupations in Calvert County are Construction & Extraction (3,396 | 7.2%), Installation, Maintenance & Repair (2,532 | 5.4%), and Farming, Fishing & Forestry (114 | 0.2%).
Natural Resources, Construction and Maintenance Occupations by Sex
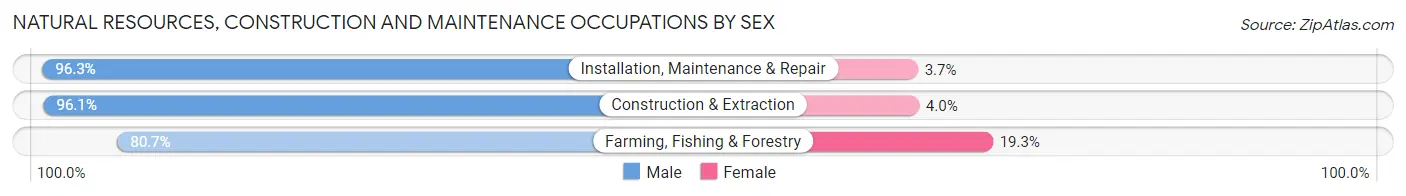
| Occupation | Male | Female |
| Farming, Fishing & Forestry | 92 (80.7%) | 22 (19.3%) |
| Construction & Extraction | 3,262 (96.1%) | 134 (4.0%) |
| Installation, Maintenance & Repair | 2,438 (96.3%) | 94 (3.7%) |
| Total (Category) | 5,792 (95.9%) | 250 (4.1%) |
| Total (Overall) | 25,615 (54.2%) | 21,660 (45.8%) |
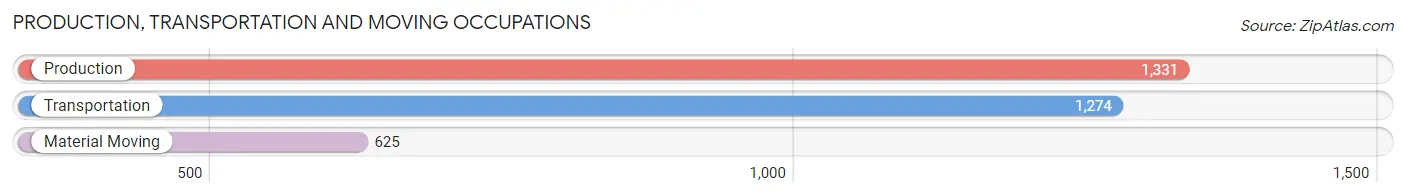
Production, Transportation and Moving Occupations
The most common Production, Transportation and Moving occupations in Calvert County are Production (1,331 | 2.8%), Transportation (1,274 | 2.7%), and Material Moving (625 | 1.3%).
Production, Transportation and Moving Occupations by Sex
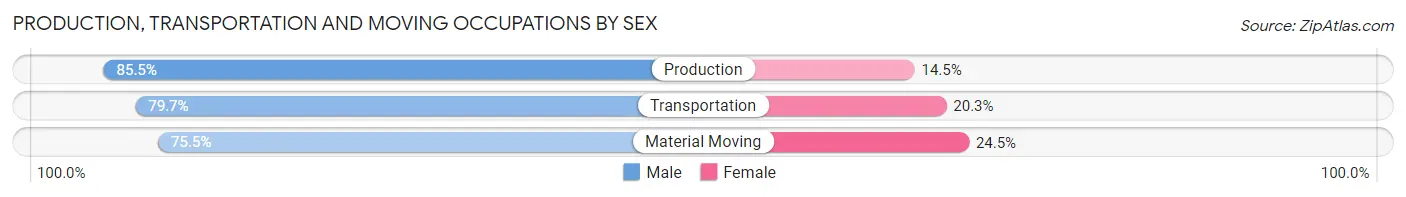
| Occupation | Male | Female |
| Production | 1,138 (85.5%) | 193 (14.5%) |
| Transportation | 1,015 (79.7%) | 259 (20.3%) |
| Material Moving | 472 (75.5%) | 153 (24.5%) |
| Total (Category) | 2,625 (81.3%) | 605 (18.7%) |
| Total (Overall) | 25,615 (54.2%) | 21,660 (45.8%) |
Employment Industries by Sex in Calvert County
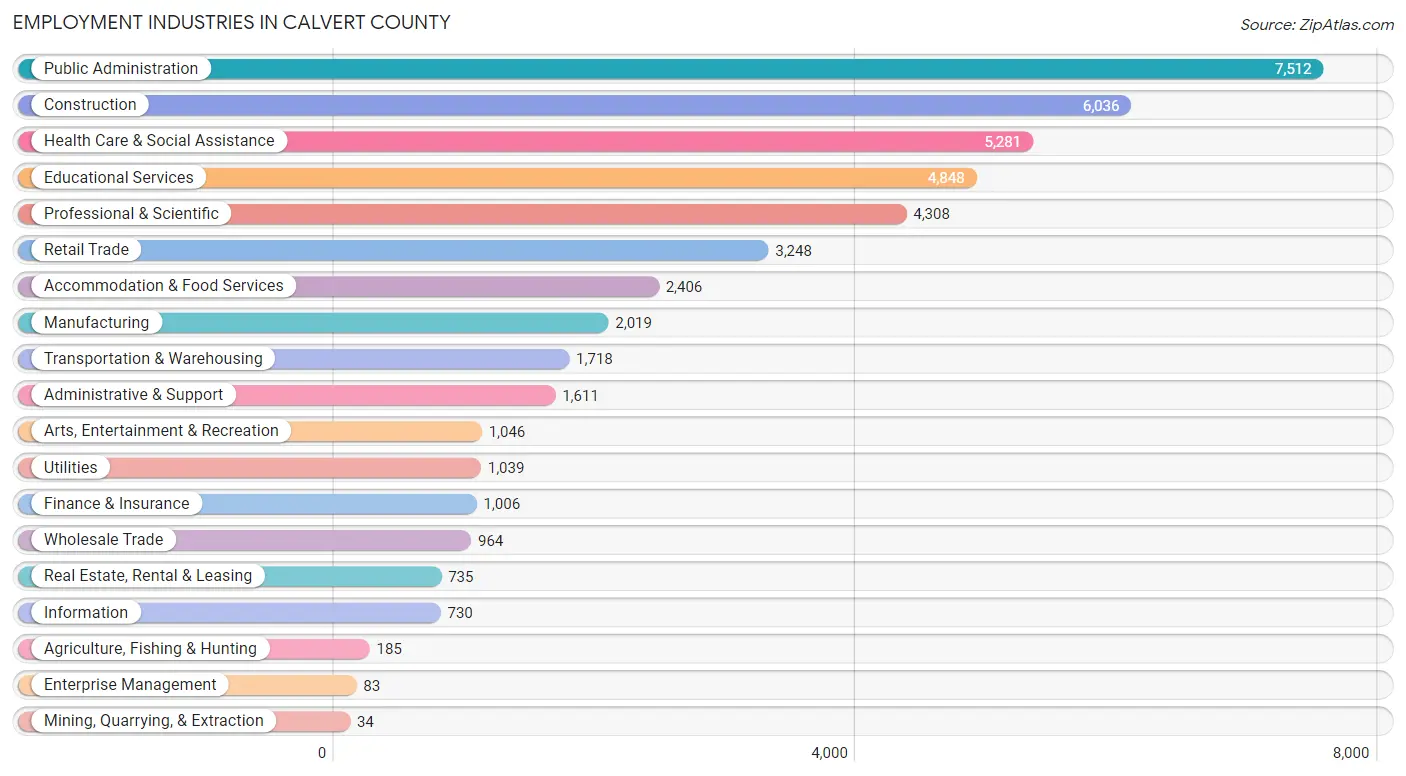
Employment Industries in Calvert County
The major employment industries in Calvert County include Public Administration (7,512 | 15.9%), Construction (6,036 | 12.8%), Health Care & Social Assistance (5,281 | 11.2%), Educational Services (4,848 | 10.2%), and Professional & Scientific (4,308 | 9.1%).
Employment Industries by Sex in Calvert County
The Calvert County industries that see more men than women are Mining, Quarrying, & Extraction (100.0%), Construction (82.2%), and Utilities (79.3%), whereas the industries that tend to have a higher number of women are Health Care & Social Assistance (82.4%), Enterprise Management (73.5%), and Educational Services (71.8%).

| Industry | Male | Female |
| Agriculture, Fishing & Hunting | 107 (57.8%) | 78 (42.2%) |
| Mining, Quarrying, & Extraction | 34 (100.0%) | 0 (0.0%) |
| Construction | 4,961 (82.2%) | 1,075 (17.8%) |
| Manufacturing | 1,600 (79.2%) | 419 (20.7%) |
| Wholesale Trade | 707 (73.3%) | 257 (26.7%) |
| Retail Trade | 1,873 (57.7%) | 1,375 (42.3%) |
| Transportation & Warehousing | 1,255 (73.1%) | 463 (27.0%) |
| Utilities | 824 (79.3%) | 215 (20.7%) |
| Information | 479 (65.6%) | 251 (34.4%) |
| Finance & Insurance | 363 (36.1%) | 643 (63.9%) |
| Real Estate, Rental & Leasing | 266 (36.2%) | 469 (63.8%) |
| Professional & Scientific | 2,343 (54.4%) | 1,965 (45.6%) |
| Enterprise Management | 22 (26.5%) | 61 (73.5%) |
| Administrative & Support | 1,131 (70.2%) | 480 (29.8%) |
| Educational Services | 1,369 (28.2%) | 3,479 (71.8%) |
| Health Care & Social Assistance | 929 (17.6%) | 4,352 (82.4%) |
| Arts, Entertainment & Recreation | 556 (53.1%) | 490 (46.9%) |
| Accommodation & Food Services | 1,149 (47.8%) | 1,257 (52.2%) |
| Public Administration | 4,489 (59.8%) | 3,023 (40.2%) |
| Total | 25,615 (54.2%) | 21,660 (45.8%) |
Education in Calvert County
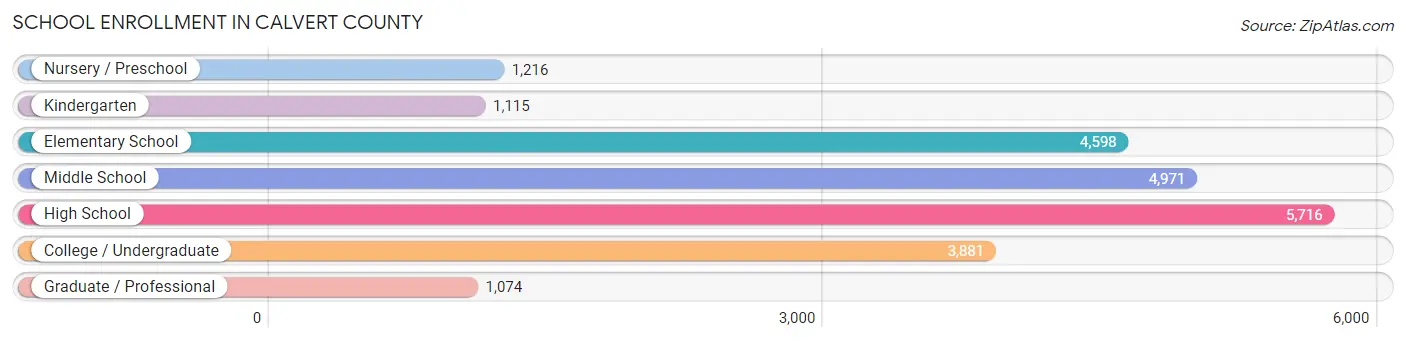
School Enrollment in Calvert County
The most common levels of schooling among the 22,571 students in Calvert County are high school (5,716 | 25.3%), middle school (4,971 | 22.0%), and elementary school (4,598 | 20.4%).
| School Level | # Students | % Students |
| Nursery / Preschool | 1,216 | 5.4% |
| Kindergarten | 1,115 | 4.9% |
| Elementary School | 4,598 | 20.4% |
| Middle School | 4,971 | 22.0% |
| High School | 5,716 | 25.3% |
| College / Undergraduate | 3,881 | 17.2% |
| Graduate / Professional | 1,074 | 4.8% |
| Total | 22,571 | 100.0% |
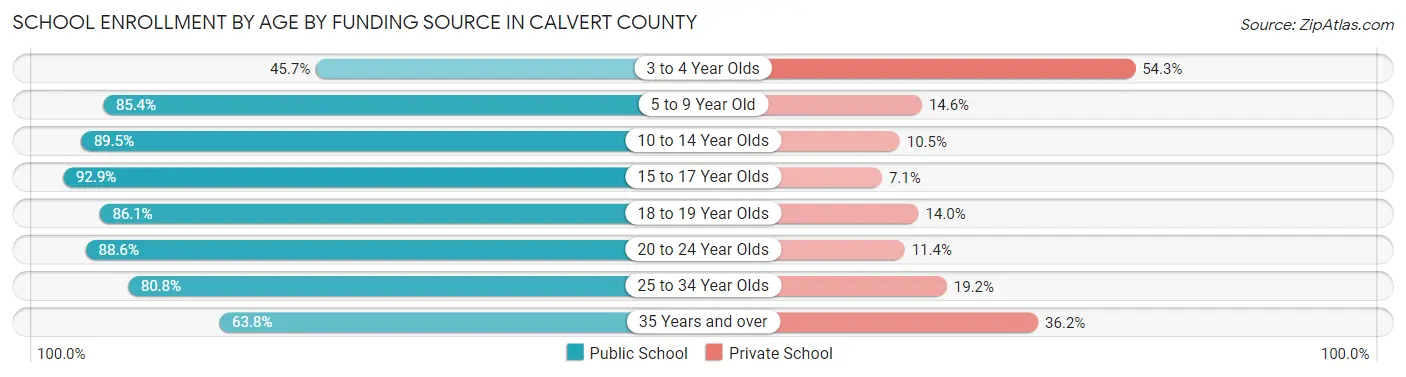
School Enrollment by Age by Funding Source in Calvert County
Out of a total of 22,571 students who are enrolled in schools in Calvert County, 3,363 (14.9%) attend a private institution, while the remaining 19,208 (85.1%) are enrolled in public schools. The age group of 3 to 4 year olds has the highest likelihood of being enrolled in private schools, with 448 (54.3% in the age bracket) enrolled. Conversely, the age group of 15 to 17 year olds has the lowest likelihood of being enrolled in a private school, with 3,839 (92.9% in the age bracket) attending a public institution.
| Age Bracket | Public School | Private School |
| 3 to 4 Year Olds | 377 (45.7%) | 448 (54.3%) |
| 5 to 9 Year Old | 4,762 (85.4%) | 813 (14.6%) |
| 10 to 14 Year Olds | 5,728 (89.5%) | 669 (10.5%) |
| 15 to 17 Year Olds | 3,839 (92.9%) | 295 (7.1%) |
| 18 to 19 Year Olds | 1,289 (86.1%) | 209 (14.0%) |
| 20 to 24 Year Olds | 1,318 (88.6%) | 169 (11.4%) |
| 25 to 34 Year Olds | 954 (80.8%) | 227 (19.2%) |
| 35 Years and over | 940 (63.8%) | 534 (36.2%) |
| Total | 19,208 (85.1%) | 3,363 (14.9%) |
Educational Attainment by Field of Study in Calvert County
Business (4,013 | 16.6%), education (2,658 | 11.0%), social sciences (2,554 | 10.5%), arts & humanities (2,184 | 9.0%), and engineering (2,036 | 8.4%) are the most common fields of study among 24,215 individuals in Calvert County who have obtained a bachelor's degree or higher.

| Field of Study | # Graduates | % Graduates |
| Computers & Mathematics | 1,526 | 6.3% |
| Bio, Nature & Agricultural | 1,430 | 5.9% |
| Physical & Health Sciences | 643 | 2.7% |
| Psychology | 1,108 | 4.6% |
| Social Sciences | 2,554 | 10.5% |
| Engineering | 2,036 | 8.4% |
| Multidisciplinary Studies | 178 | 0.7% |
| Science & Technology | 1,912 | 7.9% |
| Business | 4,013 | 16.6% |
| Education | 2,658 | 11.0% |
| Literature & Languages | 898 | 3.7% |
| Liberal Arts & History | 1,496 | 6.2% |
| Visual & Performing Arts | 884 | 3.6% |
| Communications | 695 | 2.9% |
| Arts & Humanities | 2,184 | 9.0% |
| Total | 24,215 | 100.0% |
Transportation & Commute in Calvert County
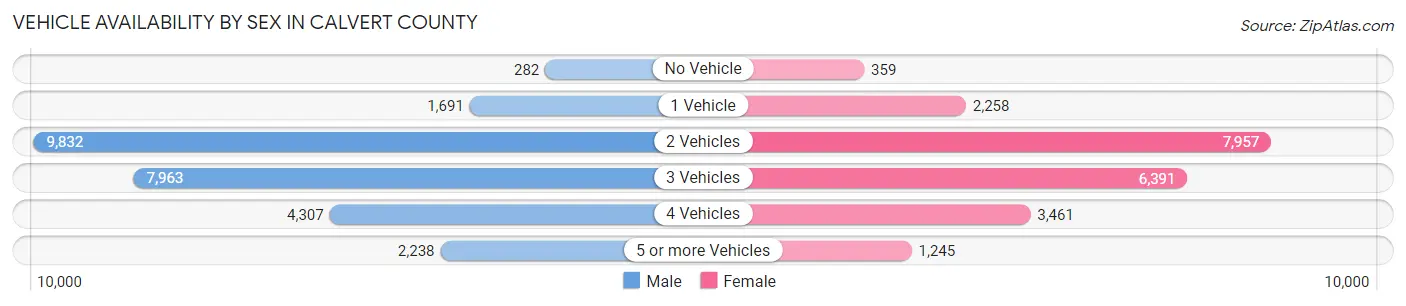
Vehicle Availability by Sex in Calvert County
The most prevalent vehicle ownership categories in Calvert County are males with 2 vehicles (9,832, accounting for 37.4%) and females with 2 vehicles (7,957, making up 45.4%).
| Vehicles Available | Male | Female |
| No Vehicle | 282 (1.1%) | 359 (1.7%) |
| 1 Vehicle | 1,691 (6.4%) | 2,258 (10.4%) |
| 2 Vehicles | 9,832 (37.4%) | 7,957 (36.7%) |
| 3 Vehicles | 7,963 (30.3%) | 6,391 (29.5%) |
| 4 Vehicles | 4,307 (16.4%) | 3,461 (16.0%) |
| 5 or more Vehicles | 2,238 (8.5%) | 1,245 (5.8%) |
| Total | 26,313 (100.0%) | 21,671 (100.0%) |
Commute Time in Calvert County
The most frequently occuring commute durations in Calvert County are 60 to 89 minutes (7,406 commuters, 17.7%), 45 to 59 minutes (6,582 commuters, 15.8%), and 10 to 14 minutes (4,282 commuters, 10.2%).
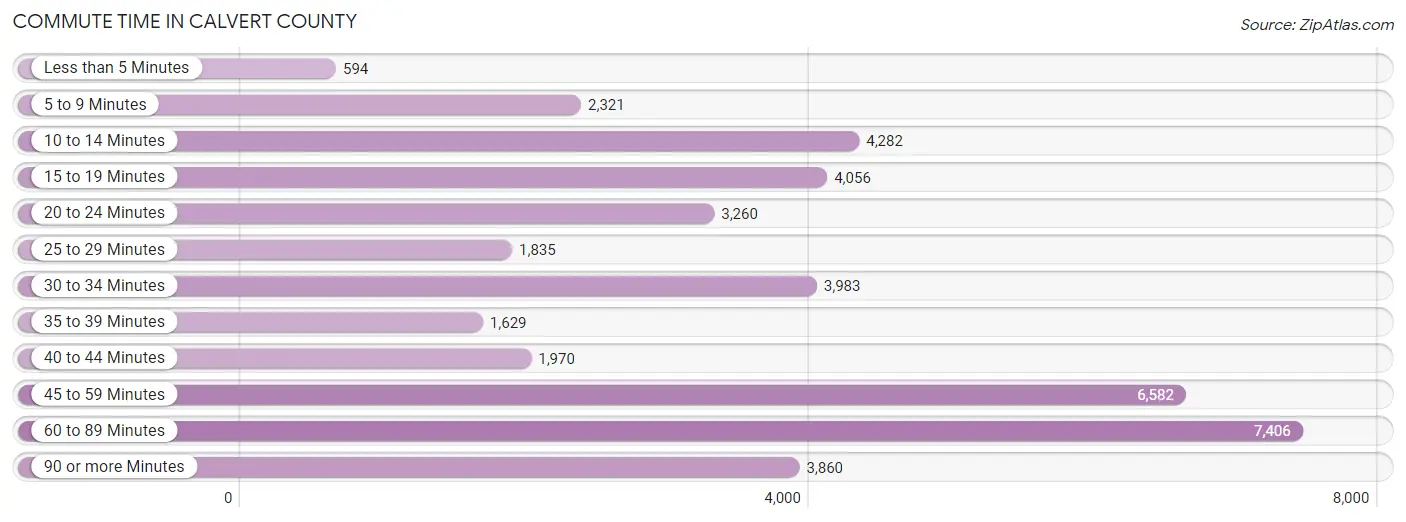
| Commute Time | # Commuters | % Commuters |
| Less than 5 Minutes | 594 | 1.4% |
| 5 to 9 Minutes | 2,321 | 5.6% |
| 10 to 14 Minutes | 4,282 | 10.2% |
| 15 to 19 Minutes | 4,056 | 9.7% |
| 20 to 24 Minutes | 3,260 | 7.8% |
| 25 to 29 Minutes | 1,835 | 4.4% |
| 30 to 34 Minutes | 3,983 | 9.5% |
| 35 to 39 Minutes | 1,629 | 3.9% |
| 40 to 44 Minutes | 1,970 | 4.7% |
| 45 to 59 Minutes | 6,582 | 15.8% |
| 60 to 89 Minutes | 7,406 | 17.7% |
| 90 or more Minutes | 3,860 | 9.2% |
Commute Time by Sex in Calvert County
The most common commute times in Calvert County are 60 to 89 minutes (4,730 commuters, 20.3%) for males and 60 to 89 minutes (2,676 commuters, 14.5%) for females.
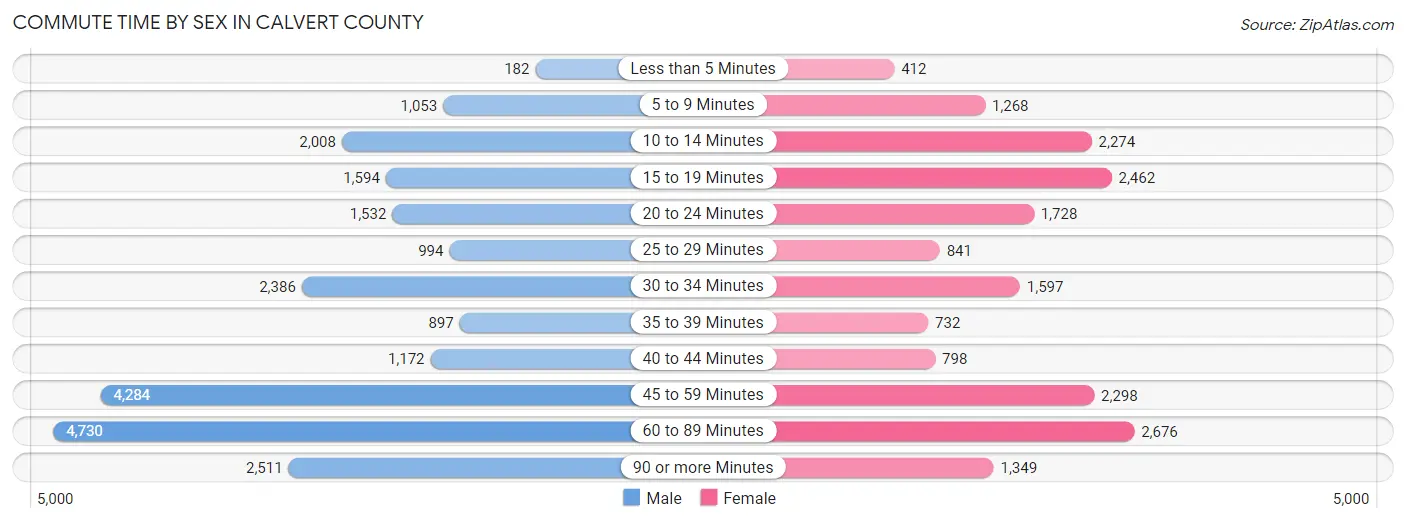
| Commute Time | Male | Female |
| Less than 5 Minutes | 182 (0.8%) | 412 (2.2%) |
| 5 to 9 Minutes | 1,053 (4.5%) | 1,268 (6.9%) |
| 10 to 14 Minutes | 2,008 (8.6%) | 2,274 (12.3%) |
| 15 to 19 Minutes | 1,594 (6.8%) | 2,462 (13.4%) |
| 20 to 24 Minutes | 1,532 (6.6%) | 1,728 (9.4%) |
| 25 to 29 Minutes | 994 (4.3%) | 841 (4.6%) |
| 30 to 34 Minutes | 2,386 (10.2%) | 1,597 (8.7%) |
| 35 to 39 Minutes | 897 (3.8%) | 732 (4.0%) |
| 40 to 44 Minutes | 1,172 (5.0%) | 798 (4.3%) |
| 45 to 59 Minutes | 4,284 (18.3%) | 2,298 (12.5%) |
| 60 to 89 Minutes | 4,730 (20.3%) | 2,676 (14.5%) |
| 90 or more Minutes | 2,511 (10.8%) | 1,349 (7.3%) |
Time of Departure to Work by Sex in Calvert County
The most frequent times of departure to work in Calvert County are 12:00 AM to 4:59 AM (3,725, 16.0%) for males and 7:00 AM to 7:29 AM (2,633, 14.3%) for females.
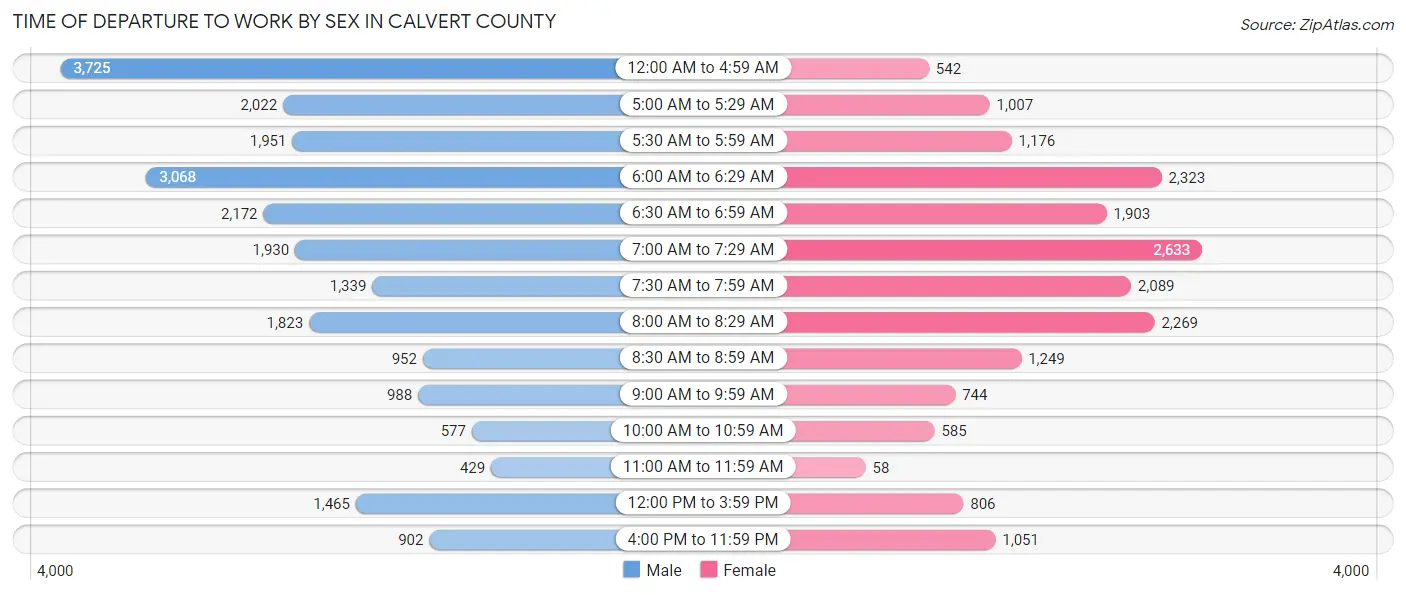
| Time of Departure | Male | Female |
| 12:00 AM to 4:59 AM | 3,725 (16.0%) | 542 (2.9%) |
| 5:00 AM to 5:29 AM | 2,022 (8.7%) | 1,007 (5.5%) |
| 5:30 AM to 5:59 AM | 1,951 (8.4%) | 1,176 (6.4%) |
| 6:00 AM to 6:29 AM | 3,068 (13.1%) | 2,323 (12.6%) |
| 6:30 AM to 6:59 AM | 2,172 (9.3%) | 1,903 (10.3%) |
| 7:00 AM to 7:29 AM | 1,930 (8.3%) | 2,633 (14.3%) |
| 7:30 AM to 7:59 AM | 1,339 (5.7%) | 2,089 (11.3%) |
| 8:00 AM to 8:29 AM | 1,823 (7.8%) | 2,269 (12.3%) |
| 8:30 AM to 8:59 AM | 952 (4.1%) | 1,249 (6.8%) |
| 9:00 AM to 9:59 AM | 988 (4.2%) | 744 (4.0%) |
| 10:00 AM to 10:59 AM | 577 (2.5%) | 585 (3.2%) |
| 11:00 AM to 11:59 AM | 429 (1.8%) | 58 (0.3%) |
| 12:00 PM to 3:59 PM | 1,465 (6.3%) | 806 (4.4%) |
| 4:00 PM to 11:59 PM | 902 (3.9%) | 1,051 (5.7%) |
| Total | 23,343 (100.0%) | 18,435 (100.0%) |
Housing Occupancy in Calvert County
Occupancy by Ownership in Calvert County
Of the total 33,284 dwellings in Calvert County, owner-occupied units account for 28,671 (86.1%), while renter-occupied units make up 4,613 (13.9%).
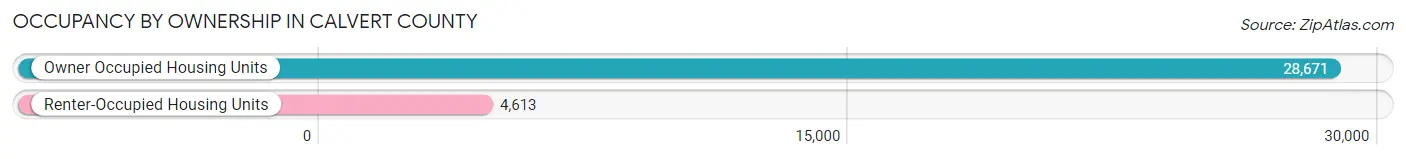
| Occupancy | # Housing Units | % Housing Units |
| Owner Occupied Housing Units | 28,671 | 86.1% |
| Renter-Occupied Housing Units | 4,613 | 13.9% |
| Total Occupied Housing Units | 33,284 | 100.0% |
Occupancy by Household Size in Calvert County
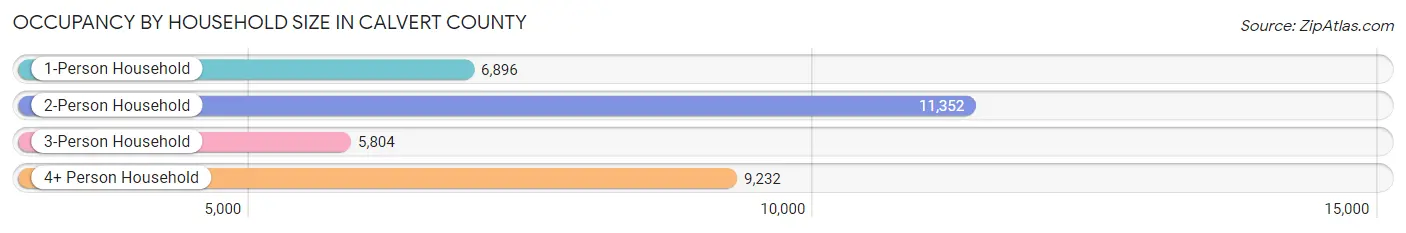
| Household Size | # Housing Units | % Housing Units |
| 1-Person Household | 6,896 | 20.7% |
| 2-Person Household | 11,352 | 34.1% |
| 3-Person Household | 5,804 | 17.4% |
| 4+ Person Household | 9,232 | 27.7% |
| Total Housing Units | 33,284 | 100.0% |
Occupancy by Ownership by Household Size in Calvert County
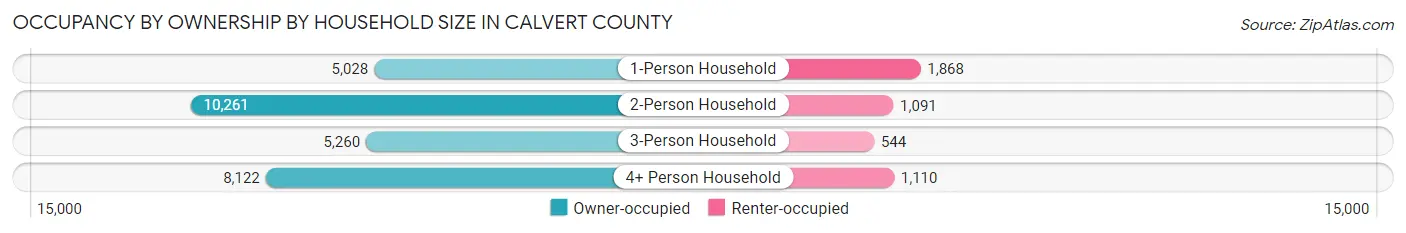
| Household Size | Owner-occupied | Renter-occupied |
| 1-Person Household | 5,028 (72.9%) | 1,868 (27.1%) |
| 2-Person Household | 10,261 (90.4%) | 1,091 (9.6%) |
| 3-Person Household | 5,260 (90.6%) | 544 (9.4%) |
| 4+ Person Household | 8,122 (88.0%) | 1,110 (12.0%) |
| Total Housing Units | 28,671 (86.1%) | 4,613 (13.9%) |
Occupancy by Educational Attainment in Calvert County
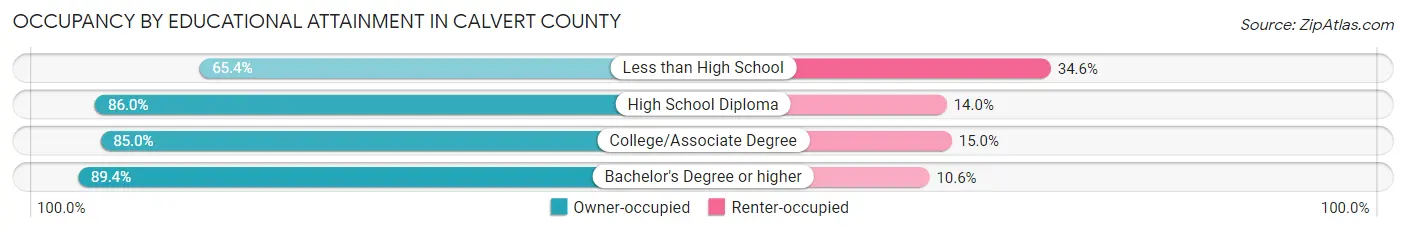
| Household Size | Owner-occupied | Renter-occupied |
| Less than High School | 989 (65.4%) | 524 (34.6%) |
| High School Diploma | 7,019 (86.0%) | 1,142 (14.0%) |
| College/Associate Degree | 8,698 (85.0%) | 1,534 (15.0%) |
| Bachelor's Degree or higher | 11,965 (89.4%) | 1,413 (10.6%) |
Occupancy by Age of Householder in Calvert County
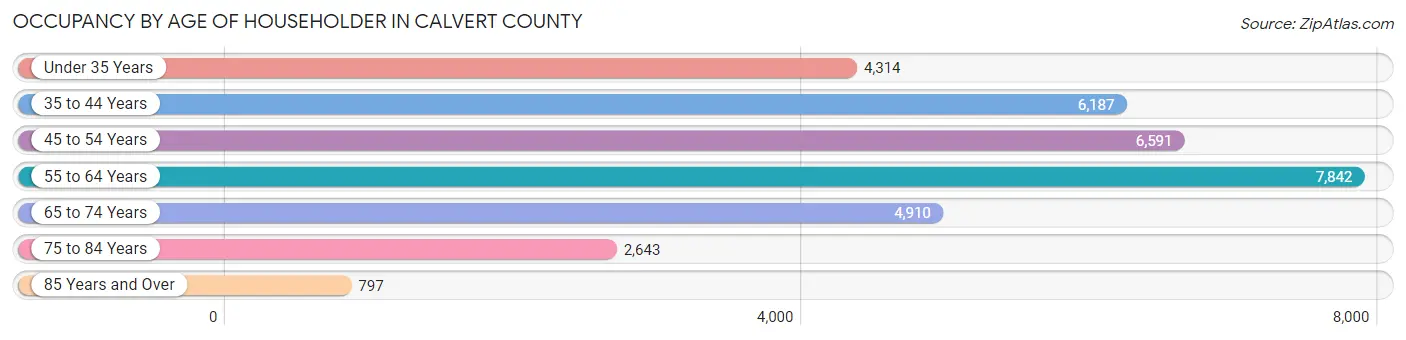
| Age Bracket | # Households | % Households |
| Under 35 Years | 4,314 | 13.0% |
| 35 to 44 Years | 6,187 | 18.6% |
| 45 to 54 Years | 6,591 | 19.8% |
| 55 to 64 Years | 7,842 | 23.6% |
| 65 to 74 Years | 4,910 | 14.7% |
| 75 to 84 Years | 2,643 | 7.9% |
| 85 Years and Over | 797 | 2.4% |
| Total | 33,284 | 100.0% |
Housing Finances in Calvert County
Median Income by Occupancy in Calvert County
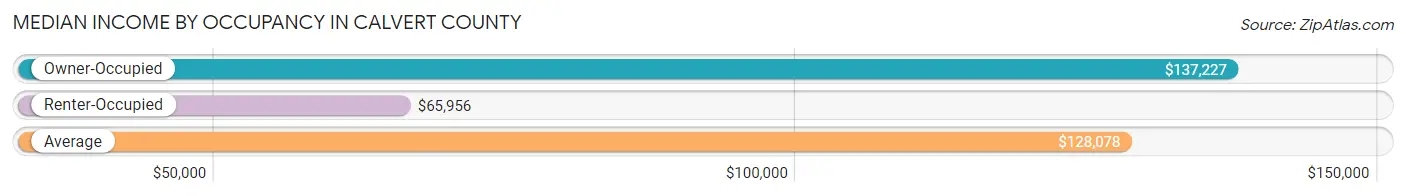
| Occupancy Type | # Households | Median Income |
| Owner-Occupied | 28,671 (86.1%) | $137,227 |
| Renter-Occupied | 4,613 (13.9%) | $65,956 |
| Average | 33,284 (100.0%) | $128,078 |
Occupancy by Householder Income Bracket in Calvert County
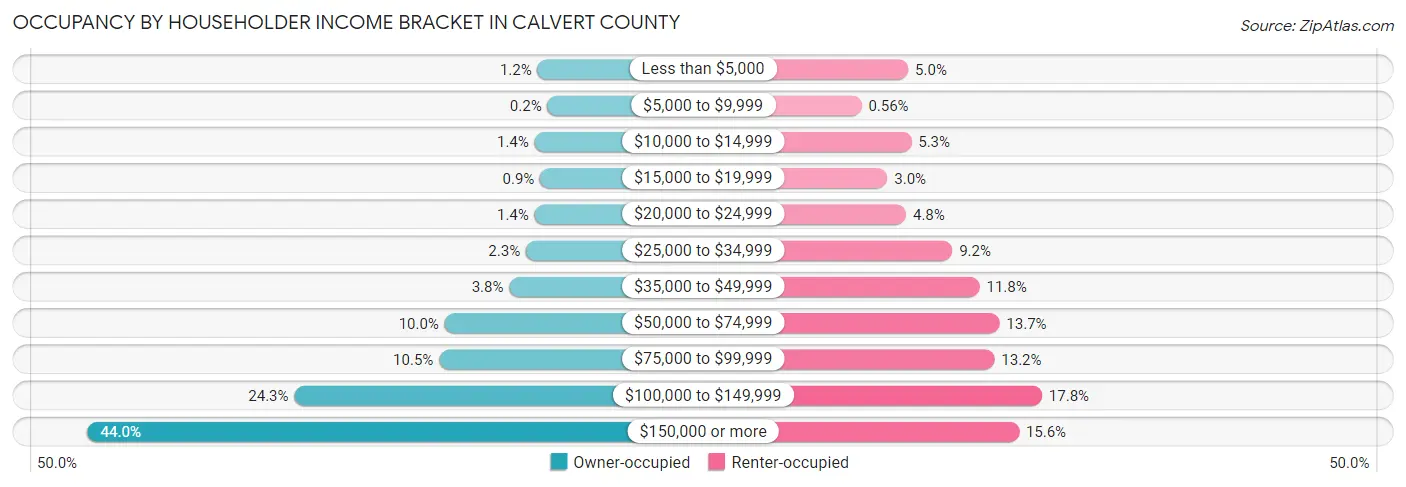
| Income Bracket | Owner-occupied | Renter-occupied |
| Less than $5,000 | 329 (1.1%) | 231 (5.0%) |
| $5,000 to $9,999 | 57 (0.2%) | 26 (0.6%) |
| $10,000 to $14,999 | 409 (1.4%) | 245 (5.3%) |
| $15,000 to $19,999 | 258 (0.9%) | 140 (3.0%) |
| $20,000 to $24,999 | 409 (1.4%) | 222 (4.8%) |
| $25,000 to $34,999 | 644 (2.2%) | 425 (9.2%) |
| $35,000 to $49,999 | 1,100 (3.8%) | 545 (11.8%) |
| $50,000 to $74,999 | 2,864 (10.0%) | 632 (13.7%) |
| $75,000 to $99,999 | 3,017 (10.5%) | 610 (13.2%) |
| $100,000 to $149,999 | 6,971 (24.3%) | 819 (17.7%) |
| $150,000 or more | 12,613 (44.0%) | 718 (15.6%) |
| Total | 28,671 (100.0%) | 4,613 (100.0%) |
Monthly Housing Cost Tiers in Calvert County
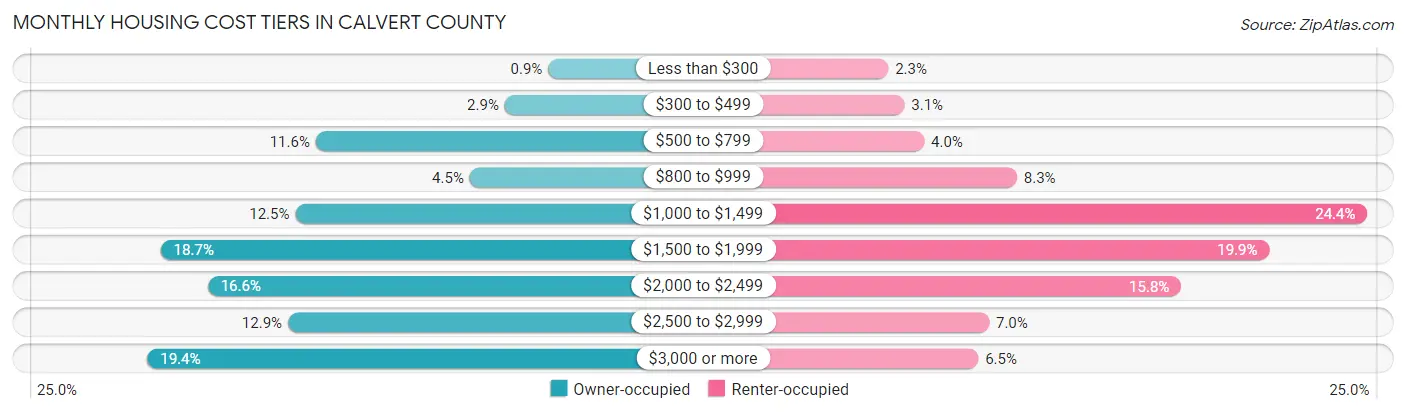
| Monthly Cost | Owner-occupied | Renter-occupied |
| Less than $300 | 258 (0.9%) | 108 (2.3%) |
| $300 to $499 | 832 (2.9%) | 142 (3.1%) |
| $500 to $799 | 3,327 (11.6%) | 184 (4.0%) |
| $800 to $999 | 1,293 (4.5%) | 381 (8.3%) |
| $1,000 to $1,499 | 3,594 (12.5%) | 1,125 (24.4%) |
| $1,500 to $1,999 | 5,374 (18.7%) | 917 (19.9%) |
| $2,000 to $2,499 | 4,751 (16.6%) | 730 (15.8%) |
| $2,500 to $2,999 | 3,693 (12.9%) | 322 (7.0%) |
| $3,000 or more | 5,549 (19.4%) | 299 (6.5%) |
| Total | 28,671 (100.0%) | 4,613 (100.0%) |
Physical Housing Characteristics in Calvert County
Housing Structures in Calvert County
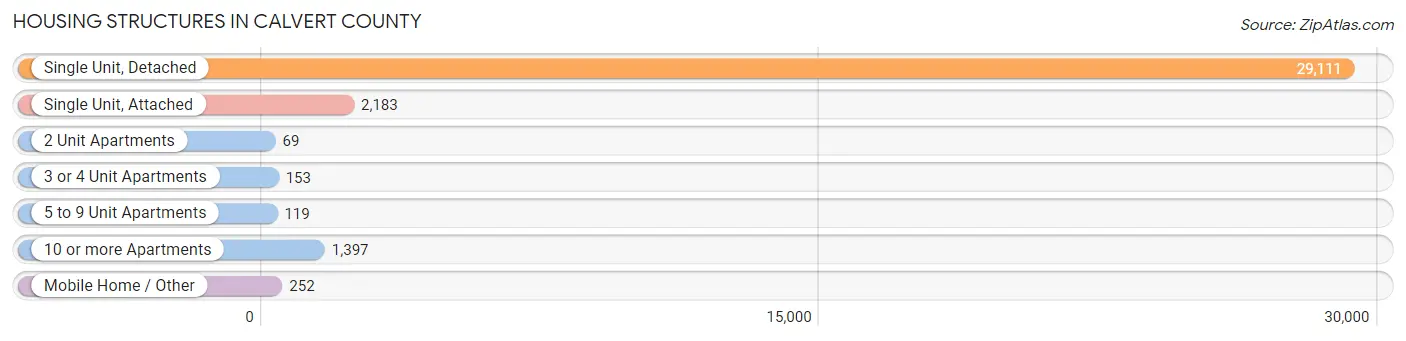
| Structure Type | # Housing Units | % Housing Units |
| Single Unit, Detached | 29,111 | 87.5% |
| Single Unit, Attached | 2,183 | 6.6% |
| 2 Unit Apartments | 69 | 0.2% |
| 3 or 4 Unit Apartments | 153 | 0.5% |
| 5 to 9 Unit Apartments | 119 | 0.4% |
| 10 or more Apartments | 1,397 | 4.2% |
| Mobile Home / Other | 252 | 0.8% |
| Total | 33,284 | 100.0% |
Housing Structures by Occupancy in Calvert County
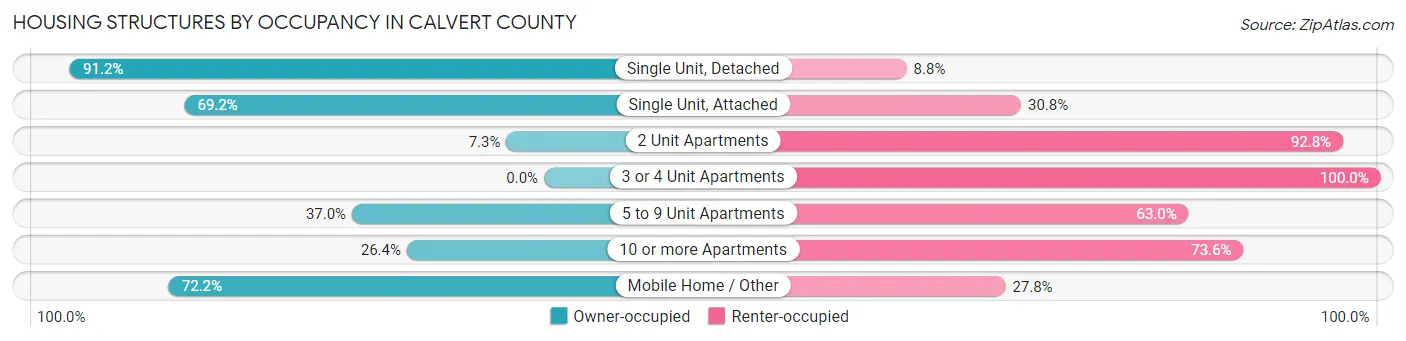
| Structure Type | Owner-occupied | Renter-occupied |
| Single Unit, Detached | 26,560 (91.2%) | 2,551 (8.8%) |
| Single Unit, Attached | 1,511 (69.2%) | 672 (30.8%) |
| 2 Unit Apartments | 5 (7.2%) | 64 (92.7%) |
| 3 or 4 Unit Apartments | 0 (0.0%) | 153 (100.0%) |
| 5 to 9 Unit Apartments | 44 (37.0%) | 75 (63.0%) |
| 10 or more Apartments | 369 (26.4%) | 1,028 (73.6%) |
| Mobile Home / Other | 182 (72.2%) | 70 (27.8%) |
| Total | 28,671 (86.1%) | 4,613 (13.9%) |
Housing Structures by Number of Rooms in Calvert County
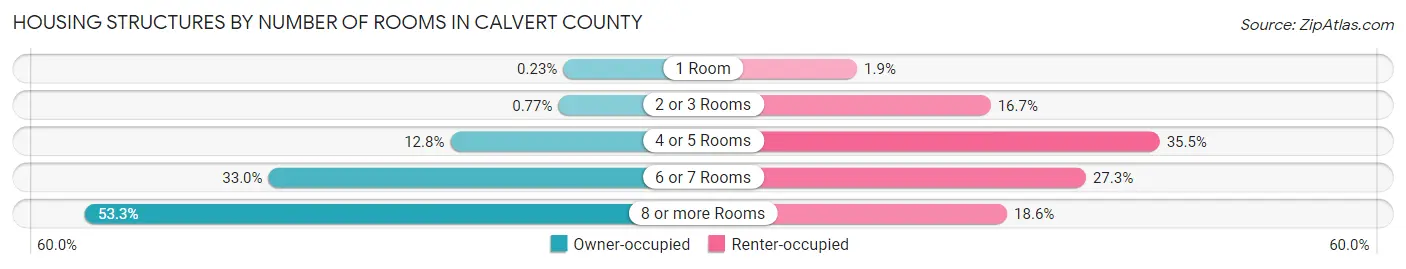
| Number of Rooms | Owner-occupied | Renter-occupied |
| 1 Room | 65 (0.2%) | 88 (1.9%) |
| 2 or 3 Rooms | 221 (0.8%) | 772 (16.7%) |
| 4 or 5 Rooms | 3,659 (12.8%) | 1,637 (35.5%) |
| 6 or 7 Rooms | 9,446 (33.0%) | 1,260 (27.3%) |
| 8 or more Rooms | 15,280 (53.3%) | 856 (18.6%) |
| Total | 28,671 (100.0%) | 4,613 (100.0%) |
Housing Structure by Heating Type in Calvert County
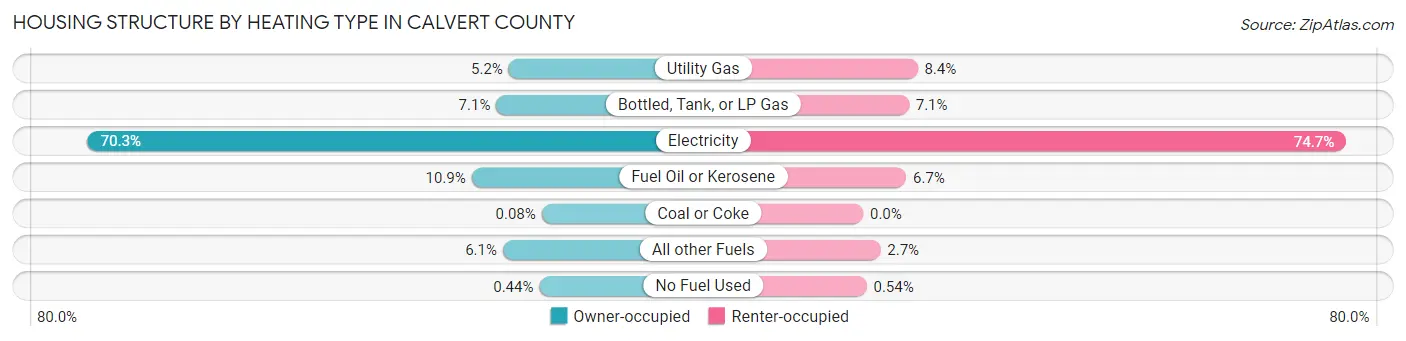
| Heating Type | Owner-occupied | Renter-occupied |
| Utility Gas | 1,481 (5.2%) | 388 (8.4%) |
| Bottled, Tank, or LP Gas | 2,033 (7.1%) | 326 (7.1%) |
| Electricity | 20,140 (70.3%) | 3,444 (74.7%) |
| Fuel Oil or Kerosene | 3,127 (10.9%) | 307 (6.7%) |
| Coal or Coke | 23 (0.1%) | 0 (0.0%) |
| All other Fuels | 1,742 (6.1%) | 123 (2.7%) |
| No Fuel Used | 125 (0.4%) | 25 (0.5%) |
| Total | 28,671 (100.0%) | 4,613 (100.0%) |
Household Vehicle Usage in Calvert County
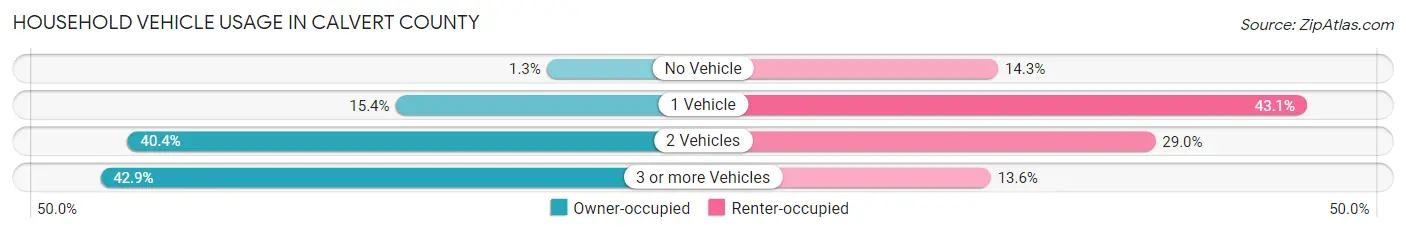
| Vehicles per Household | Owner-occupied | Renter-occupied |
| No Vehicle | 365 (1.3%) | 659 (14.3%) |
| 1 Vehicle | 4,413 (15.4%) | 1,989 (43.1%) |
| 2 Vehicles | 11,583 (40.4%) | 1,337 (29.0%) |
| 3 or more Vehicles | 12,310 (42.9%) | 628 (13.6%) |
| Total | 28,671 (100.0%) | 4,613 (100.0%) |
Real Estate & Mortgages in Calvert County
Real Estate and Mortgage Overview in Calvert County
| Characteristic | Without Mortgage | With Mortgage |
| Housing Units | 6,343 | 22,328 |
| Median Property Value | $414,400 | $420,200 |
| Median Household Income | $112,467 | $10,699 |
| Monthly Housing Costs | $697 | $5,540 |
| Real Estate Taxes | $3,863 | $426 |
Property Value by Mortgage Status in Calvert County
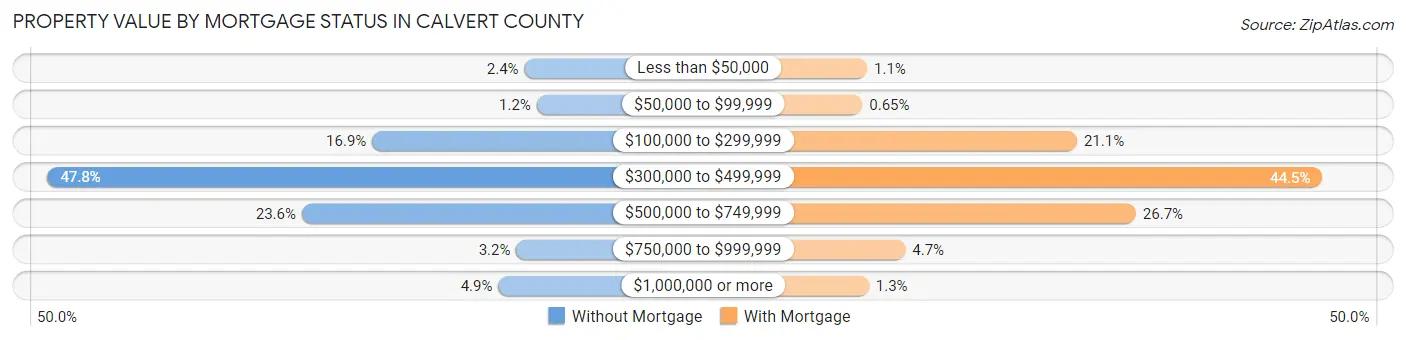
| Property Value | Without Mortgage | With Mortgage |
| Less than $50,000 | 152 (2.4%) | 246 (1.1%) |
| $50,000 to $99,999 | 78 (1.2%) | 145 (0.6%) |
| $100,000 to $299,999 | 1,072 (16.9%) | 4,710 (21.1%) |
| $300,000 to $499,999 | 3,033 (47.8%) | 9,924 (44.5%) |
| $500,000 to $749,999 | 1,497 (23.6%) | 5,962 (26.7%) |
| $750,000 to $999,999 | 201 (3.2%) | 1,058 (4.7%) |
| $1,000,000 or more | 310 (4.9%) | 283 (1.3%) |
| Total | 6,343 (100.0%) | 22,328 (100.0%) |
Household Income by Mortgage Status in Calvert County
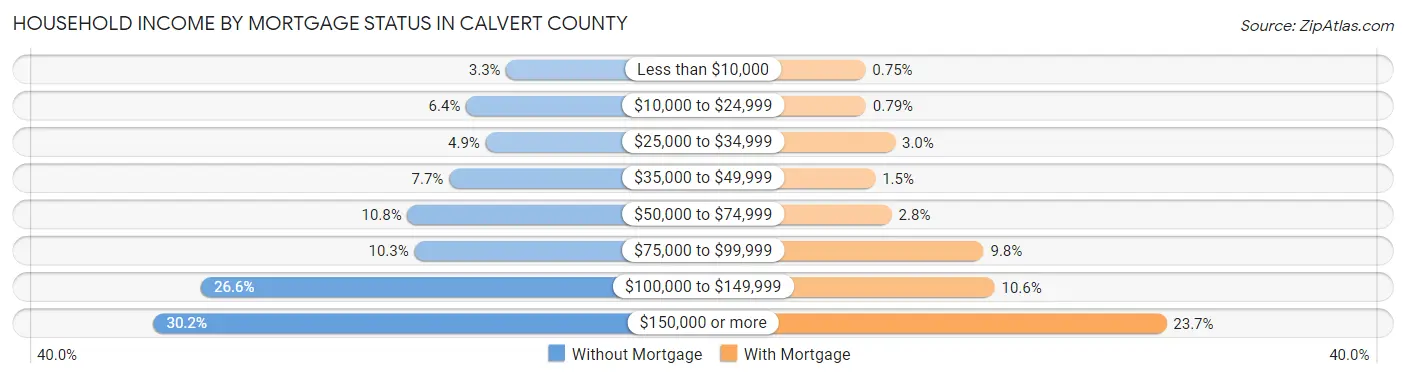
| Household Income | Without Mortgage | With Mortgage |
| Less than $10,000 | 209 (3.3%) | 168 (0.7%) |
| $10,000 to $24,999 | 403 (6.4%) | 177 (0.8%) |
| $25,000 to $34,999 | 309 (4.9%) | 673 (3.0%) |
| $35,000 to $49,999 | 485 (7.6%) | 335 (1.5%) |
| $50,000 to $74,999 | 686 (10.8%) | 615 (2.8%) |
| $75,000 to $99,999 | 653 (10.3%) | 2,178 (9.8%) |
| $100,000 to $149,999 | 1,684 (26.6%) | 2,364 (10.6%) |
| $150,000 or more | 1,914 (30.2%) | 5,287 (23.7%) |
| Total | 6,343 (100.0%) | 22,328 (100.0%) |
Property Value to Household Income Ratio in Calvert County
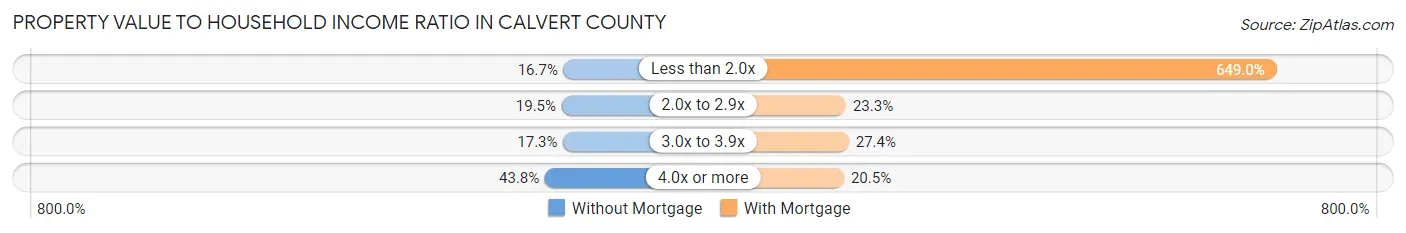
| Value-to-Income Ratio | Without Mortgage | With Mortgage |
| Less than 2.0x | 1,059 (16.7%) | 144,916 (649.0%) |
| 2.0x to 2.9x | 1,234 (19.5%) | 5,202 (23.3%) |
| 3.0x to 3.9x | 1,096 (17.3%) | 6,111 (27.4%) |
| 4.0x or more | 2,777 (43.8%) | 4,567 (20.4%) |
| Total | 6,343 (100.0%) | 22,328 (100.0%) |
Real Estate Taxes by Mortgage Status in Calvert County
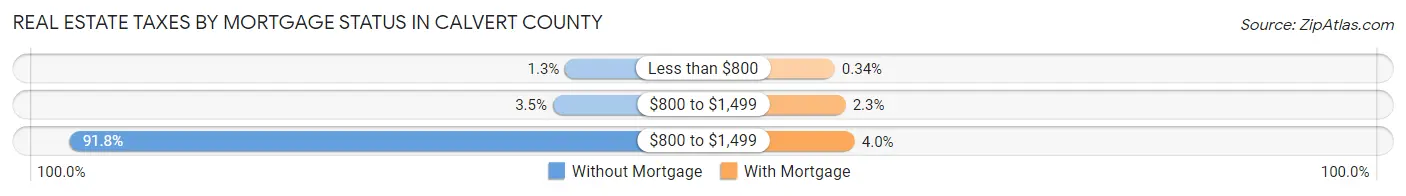
| Property Taxes | Without Mortgage | With Mortgage |
| Less than $800 | 80 (1.3%) | 76 (0.3%) |
| $800 to $1,499 | 224 (3.5%) | 518 (2.3%) |
| $800 to $1,499 | 5,820 (91.7%) | 888 (4.0%) |
| Total | 6,343 (100.0%) | 22,328 (100.0%) |
Health & Disability in Calvert County
Health Insurance Coverage by Age in Calvert County
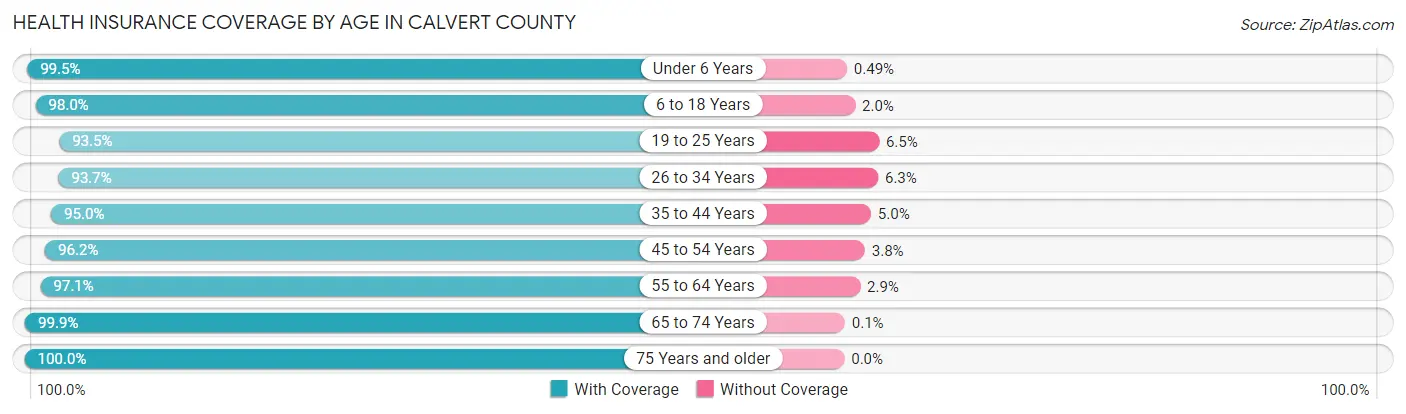
| Age Bracket | With Coverage | Without Coverage |
| Under 6 Years | 5,737 (99.5%) | 28 (0.5%) |
| 6 to 18 Years | 16,333 (98.0%) | 337 (2.0%) |
| 19 to 25 Years | 7,039 (93.5%) | 486 (6.5%) |
| 26 to 34 Years | 8,597 (93.7%) | 577 (6.3%) |
| 35 to 44 Years | 10,801 (95.0%) | 564 (5.0%) |
| 45 to 54 Years | 12,264 (96.2%) | 489 (3.8%) |
| 55 to 64 Years | 13,750 (97.1%) | 416 (2.9%) |
| 65 to 74 Years | 8,583 (99.9%) | 9 (0.1%) |
| 75 Years and older | 5,636 (100.0%) | 0 (0.0%) |
| Total | 88,740 (96.8%) | 2,906 (3.2%) |
Health Insurance Coverage by Citizenship Status in Calvert County
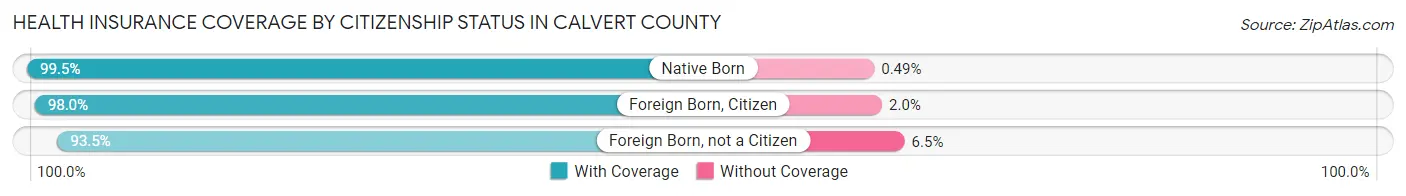
| Citizenship Status | With Coverage | Without Coverage |
| Native Born | 5,737 (99.5%) | 28 (0.5%) |
| Foreign Born, Citizen | 16,333 (98.0%) | 337 (2.0%) |
| Foreign Born, not a Citizen | 7,039 (93.5%) | 486 (6.5%) |
Health Insurance Coverage by Household Income in Calvert County
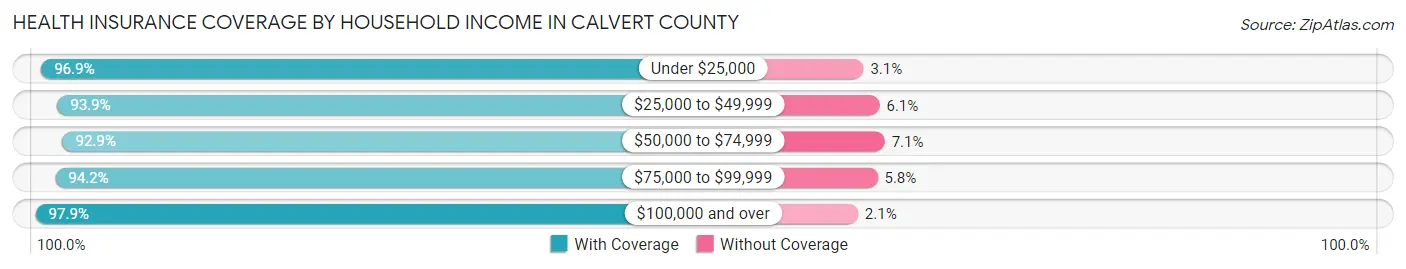
| Household Income | With Coverage | Without Coverage |
| Under $25,000 | 3,757 (96.9%) | 121 (3.1%) |
| $25,000 to $49,999 | 4,862 (93.9%) | 318 (6.1%) |
| $50,000 to $74,999 | 7,003 (92.9%) | 536 (7.1%) |
| $75,000 to $99,999 | 9,297 (94.2%) | 568 (5.8%) |
| $100,000 and over | 63,681 (97.9%) | 1,353 (2.1%) |
Public vs Private Health Insurance Coverage by Age in Calvert County
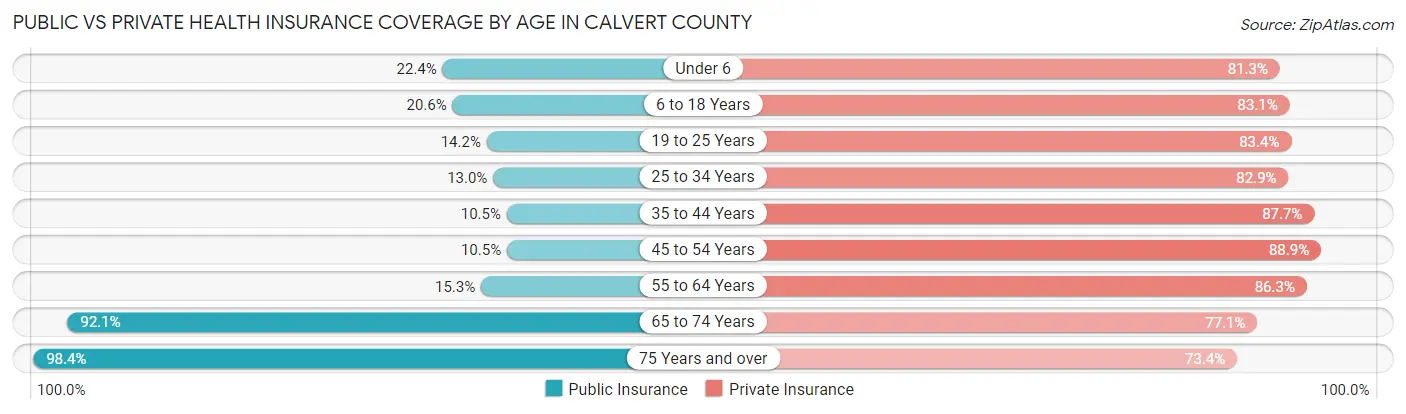
| Age Bracket | Public Insurance | Private Insurance |
| Under 6 | 1,292 (22.4%) | 4,687 (81.3%) |
| 6 to 18 Years | 3,428 (20.6%) | 13,854 (83.1%) |
| 19 to 25 Years | 1,070 (14.2%) | 6,277 (83.4%) |
| 25 to 34 Years | 1,194 (13.0%) | 7,604 (82.9%) |
| 35 to 44 Years | 1,193 (10.5%) | 9,965 (87.7%) |
| 45 to 54 Years | 1,334 (10.5%) | 11,343 (88.9%) |
| 55 to 64 Years | 2,163 (15.3%) | 12,224 (86.3%) |
| 65 to 74 Years | 7,911 (92.1%) | 6,627 (77.1%) |
| 75 Years and over | 5,546 (98.4%) | 4,135 (73.4%) |
| Total | 25,131 (27.4%) | 76,716 (83.7%) |
Disability Status by Sex by Age in Calvert County
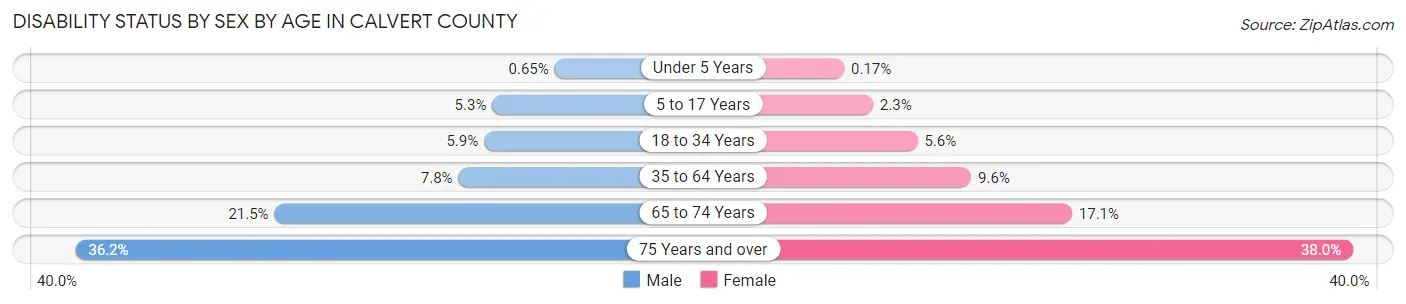
| Age Bracket | Male | Female |
| Under 5 Years | 16 (0.6%) | 4 (0.2%) |
| 5 to 17 Years | 454 (5.3%) | 188 (2.3%) |
| 18 to 34 Years | 527 (5.9%) | 488 (5.6%) |
| 35 to 64 Years | 1,473 (7.8%) | 1,860 (9.6%) |
| 65 to 74 Years | 881 (21.4%) | 766 (17.1%) |
| 75 Years and over | 862 (36.2%) | 1,236 (38.0%) |
Disability Class by Sex by Age in Calvert County
Disability Class: Hearing Difficulty
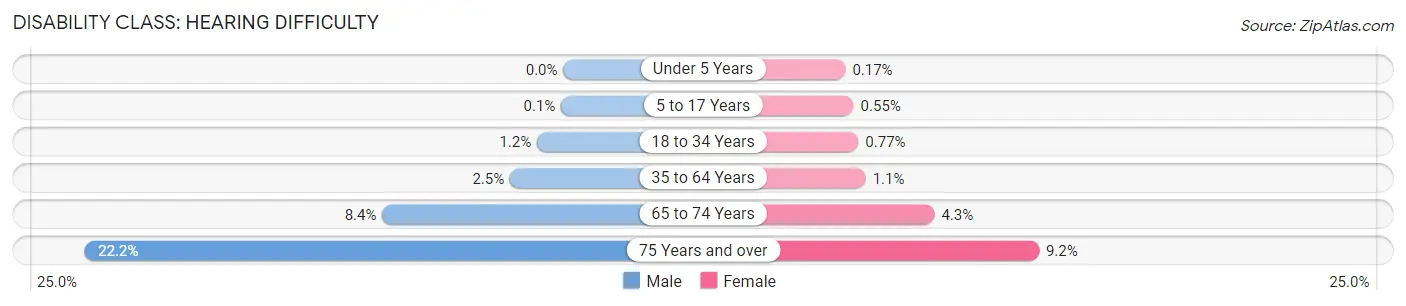
| Age Bracket | Male | Female |
| Under 5 Years | 0 (0.0%) | 4 (0.2%) |
| 5 to 17 Years | 9 (0.1%) | 45 (0.5%) |
| 18 to 34 Years | 109 (1.2%) | 67 (0.8%) |
| 35 to 64 Years | 467 (2.5%) | 216 (1.1%) |
| 65 to 74 Years | 345 (8.4%) | 193 (4.3%) |
| 75 Years and over | 528 (22.2%) | 298 (9.1%) |
Disability Class: Vision Difficulty
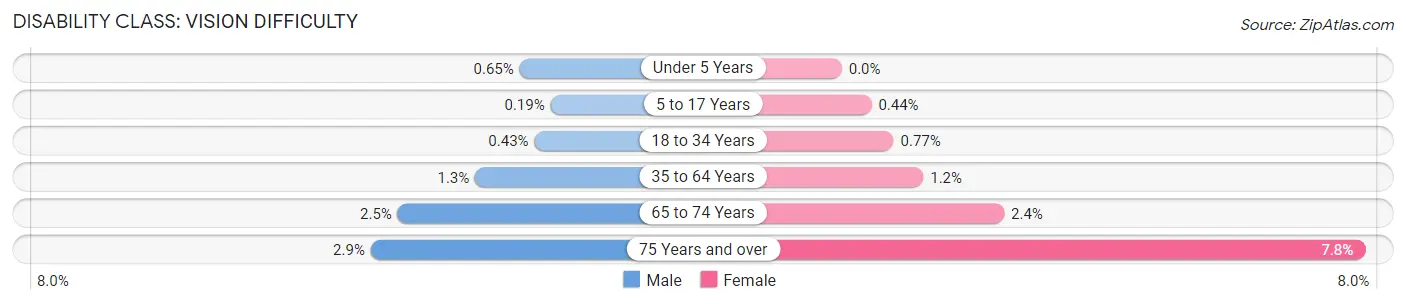
| Age Bracket | Male | Female |
| Under 5 Years | 16 (0.6%) | 0 (0.0%) |
| 5 to 17 Years | 16 (0.2%) | 36 (0.4%) |
| 18 to 34 Years | 38 (0.4%) | 67 (0.8%) |
| 35 to 64 Years | 247 (1.3%) | 235 (1.2%) |
| 65 to 74 Years | 101 (2.5%) | 108 (2.4%) |
| 75 Years and over | 68 (2.9%) | 253 (7.8%) |
Disability Class: Cognitive Difficulty
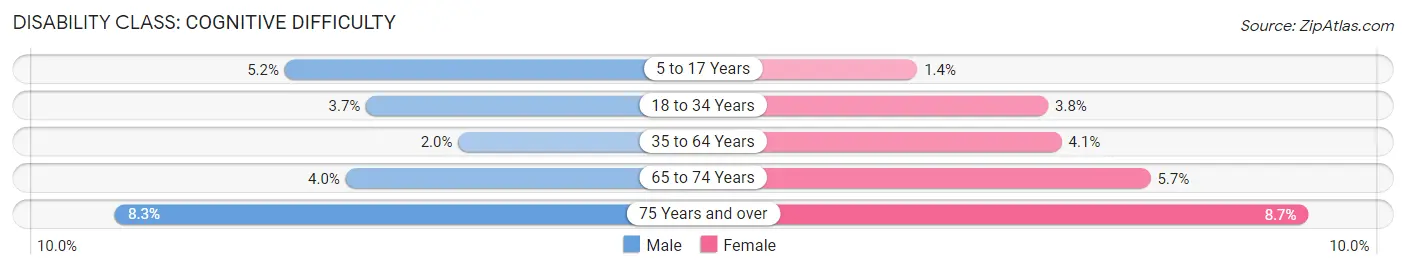
| Age Bracket | Male | Female |
| 5 to 17 Years | 445 (5.2%) | 114 (1.4%) |
| 18 to 34 Years | 327 (3.7%) | 332 (3.8%) |
| 35 to 64 Years | 368 (1.9%) | 791 (4.1%) |
| 65 to 74 Years | 166 (4.0%) | 257 (5.7%) |
| 75 Years and over | 198 (8.3%) | 282 (8.7%) |
Disability Class: Ambulatory Difficulty
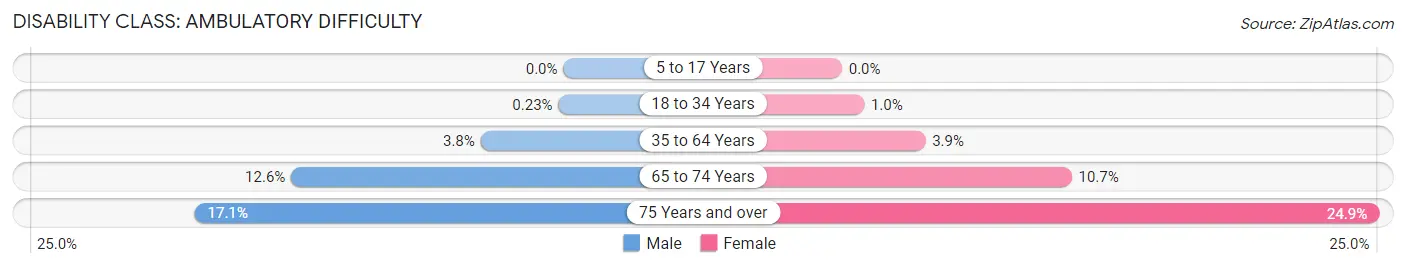
| Age Bracket | Male | Female |
| 5 to 17 Years | 0 (0.0%) | 0 (0.0%) |
| 18 to 34 Years | 21 (0.2%) | 89 (1.0%) |
| 35 to 64 Years | 726 (3.8%) | 749 (3.9%) |
| 65 to 74 Years | 519 (12.6%) | 478 (10.7%) |
| 75 Years and over | 407 (17.1%) | 812 (24.9%) |
Disability Class: Self-Care Difficulty
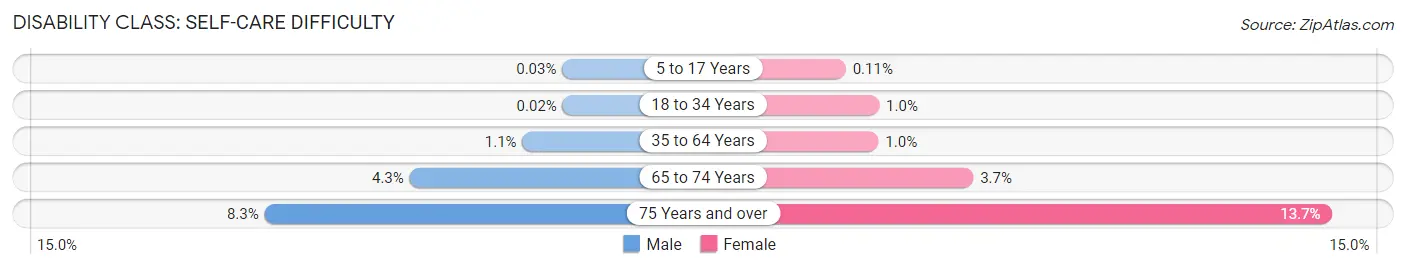
| Age Bracket | Male | Female |
| 5 to 17 Years | 3 (0.0%) | 9 (0.1%) |
| 18 to 34 Years | 2 (0.0%) | 90 (1.0%) |
| 35 to 64 Years | 216 (1.1%) | 198 (1.0%) |
| 65 to 74 Years | 176 (4.3%) | 164 (3.7%) |
| 75 Years and over | 198 (8.3%) | 445 (13.7%) |
Technology Access in Calvert County
Computing Device Access in Calvert County
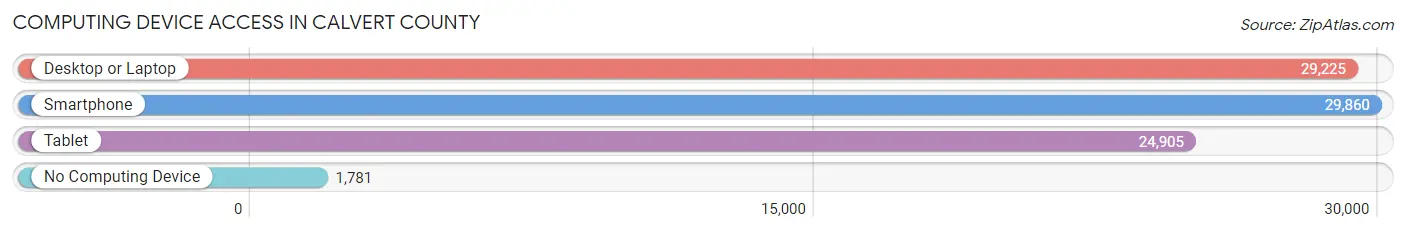
| Device Type | # Households | % Households |
| Desktop or Laptop | 29,225 | 87.8% |
| Smartphone | 29,860 | 89.7% |
| Tablet | 24,905 | 74.8% |
| No Computing Device | 1,781 | 5.3% |
| Total | 33,284 | 100.0% |
Internet Access in Calvert County
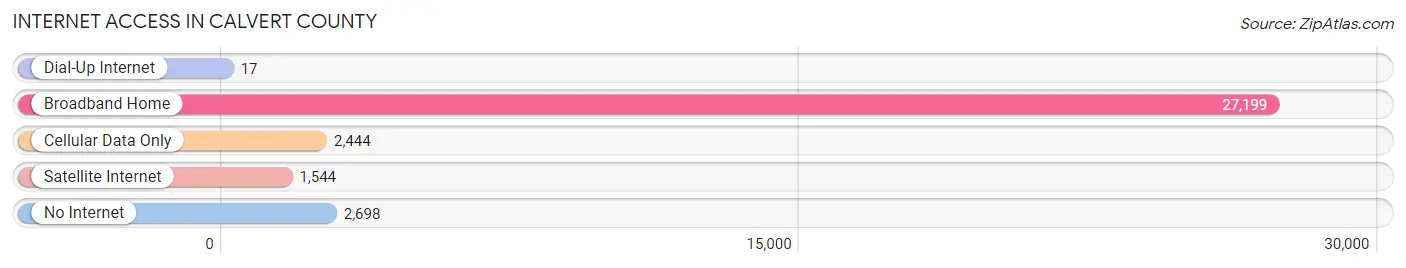
| Internet Type | # Households | % Households |
| Dial-Up Internet | 17 | 0.1% |
| Broadband Home | 27,199 | 81.7% |
| Cellular Data Only | 2,444 | 7.3% |
| Satellite Internet | 1,544 | 4.6% |
| No Internet | 2,698 | 8.1% |
| Total | 33,284 | 100.0% |
Calvert County Summary
Calvert County, Maryland is located in the southern part of the state, on the western shore of the Chesapeake Bay. It is bordered by Anne Arundel County to the north, Charles County to the east, and St. Mary's County to the south. The county seat is Prince Frederick, and the county is divided into five towns: Chesapeake Beach, Huntingtown, North Beach, Owings, and Solomons.
History
Calvert County was established in 1654, when the Maryland General Assembly divided the Province of Maryland into twelve counties. It was named for the Calvert family, who were the Lords Baltimore and the proprietors of the Province of Maryland. The county was originally part of Charles County, but was split off in 1658.
In the late 17th century, the county was home to a large population of tobacco planters, who grew the crop for export to England. The county was also home to a large population of African Americans, who were brought to the area as slaves to work on the tobacco plantations.
In the 19th century, the county was home to a large population of oystermen, who harvested oysters from the Chesapeake Bay. The oyster industry was a major source of income for the county until the early 20th century, when overfishing and pollution caused a decline in the oyster population.
Geography
Calvert County is located in the southern part of Maryland, on the western shore of the Chesapeake Bay. It is bordered by Anne Arundel County to the north, Charles County to the east, and St. Mary's County to the south. The county is divided into five towns: Chesapeake Beach, Huntingtown, North Beach, Owings, and Solomons.
The county is mostly flat, with some rolling hills in the northern part of the county. The highest point in the county is located in the town of Huntingtown, at an elevation of 85 feet. The county is home to several rivers and creeks, including the Patuxent River, the St. Leonard Creek, and the Hunting Creek.
Economy
Calvert County has a diverse economy, with a mix of agriculture, manufacturing, and services. The county is home to several large employers, including the Calvert Cliffs Nuclear Power Plant, the Patuxent River Naval Air Station, and the Calvert Marine Museum.
Agriculture is an important part of the county's economy, with crops such as corn, soybeans, wheat, and hay being grown in the area. The county is also home to several wineries, which produce a variety of wines.
Manufacturing is also an important part of the county's economy, with companies such as Lockheed Martin, Northrop Grumman, and General Dynamics having a presence in the area.
Demographics
As of the 2010 census, the population of Calvert County was 88,737. The population is predominantly white (83.3%), with African Americans making up 8.7% of the population, and Hispanics making up 5.2%.
The median household income in the county is $90,945, and the median home value is $346,400. The unemployment rate in the county is 4.2%.
The county is home to several colleges and universities, including the University of Maryland, College Park, and the University of Maryland, Baltimore County. The county is also home to several public and private schools, including Calvert High School, Northern High School, and Huntingtown High School.
Common Questions
What is the Total Population of Calvert County?
Total Population of Calvert County is 93,244.
What is the Total Male Population of Calvert County?
Total Male Population of Calvert County is 46,543.
What is the Total Female Population of Calvert County?
Total Female Population of Calvert County is 46,701.
What is the Ratio of Males per 100 Females in Calvert County?
There are 99.66 Males per 100 Females in Calvert County.
What is the Ratio of Females per 100 Males in Calvert County?
There are 100.34 Females per 100 Males in Calvert County.
What is the Median Population Age in Calvert County?
Median Population Age in Calvert County is 40.4 Years.
What is the Average Family Size in Calvert County
Average Family Size in Calvert County is 3.2 People.
What is the Average Household Size in Calvert County
Average Household Size in Calvert County is 2.8 People.
What is Per Capita Income in Calvert County?
Per Capita income in Calvert County is $54,038.
What is the Median Family Income in Calvert County?
Median Family Income in Calvert County is $145,175.
What is the Median Household income in Calvert County?
Median Household Income in Calvert County is $128,078.
What is Income or Wage Gap in Calvert County?
Income or Wage Gap in Calvert County is 34.8%.
Women in Calvert County earn 65.2 cents for every dollar earned by a man.
What is Family Income Deficit in Calvert County?
Family Income Deficit in Calvert County is $12,448.
Families that are below poverty line in Calvert County earn $12,448 less on average than the poverty threshold level.
What is Inequality or Gini Index in Calvert County?
Inequality or Gini Index in Calvert County is 0.38.
How Large is the Labor Force in Calvert County?
There are 50,024 People in the Labor Forcein in Calvert County.
What is the Percentage of People in the Labor Force in Calvert County?
67.2% of People are in the Labor Force in Calvert County.
What is the Unemployment Rate in Calvert County?
Unemployment Rate in Calvert County is 3.2%.