Baltimore County, MD
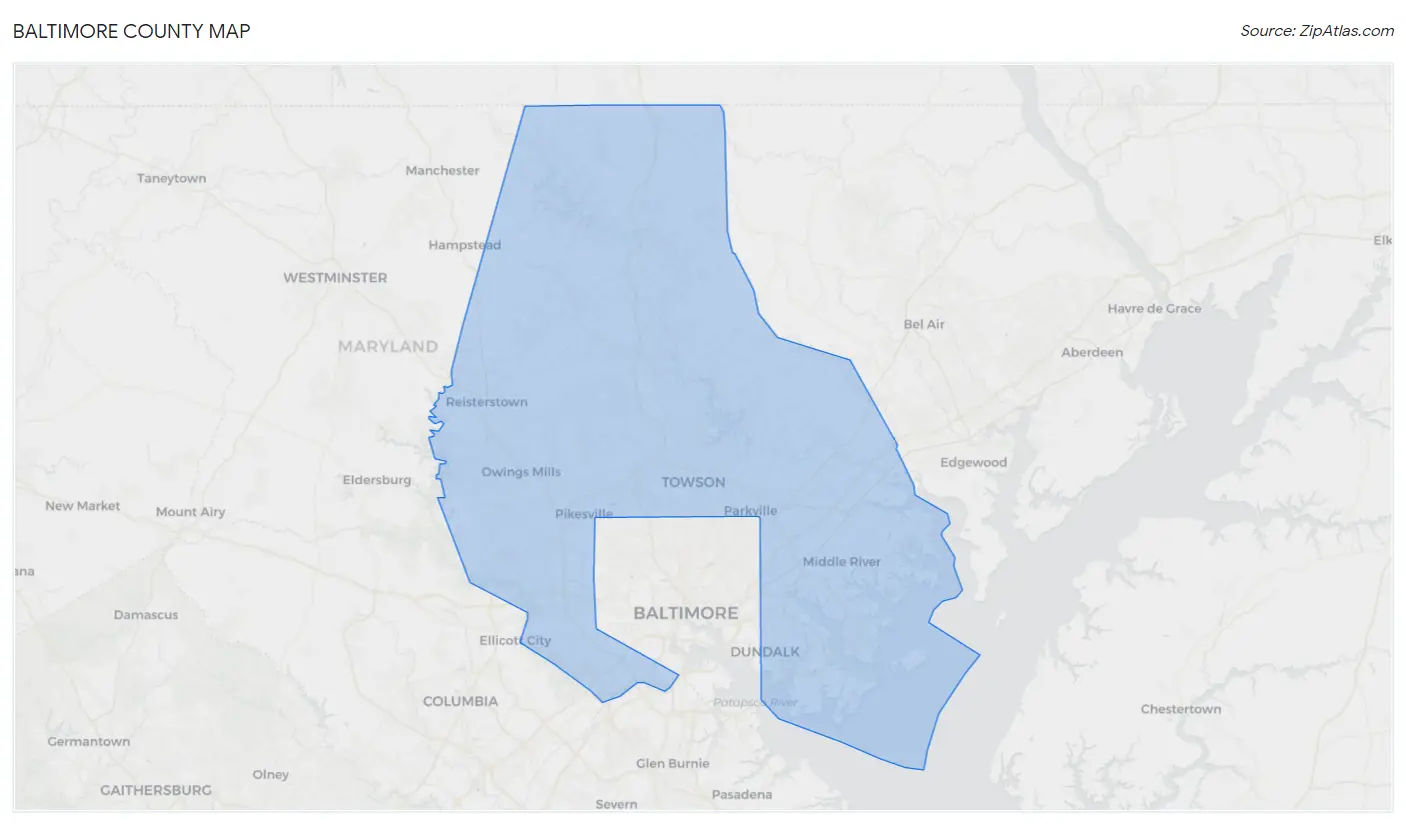
Baltimore County Map
Baltimore County Overview
850,737
TOTAL POPULATION
405,306
MALE POPULATION
445,431
FEMALE POPULATION
90.99
MALES / 100 FEMALES
109.90
FEMALES / 100 MALES
39.5
MEDIAN AGE
3.2
AVG FAMILY SIZE
2.5
AVG HOUSEHOLD SIZE
$46,603
PER CAPITA INCOME
$109,514
AVG FAMILY INCOME
$88,157
AVG HOUSEHOLD INCOME
21.9%
WAGE / INCOME GAP [ % ]
78.1¢/ $1
WAGE / INCOME GAP [ $ ]
$11,538
FAMILY INCOME DEFICIT
0.46
INEQUALITY / GINI INDEX
454,366
LABOR FORCE [ PEOPLE ]
66.0%
PERCENT IN LABOR FORCE
5.2%
UNEMPLOYMENT RATE
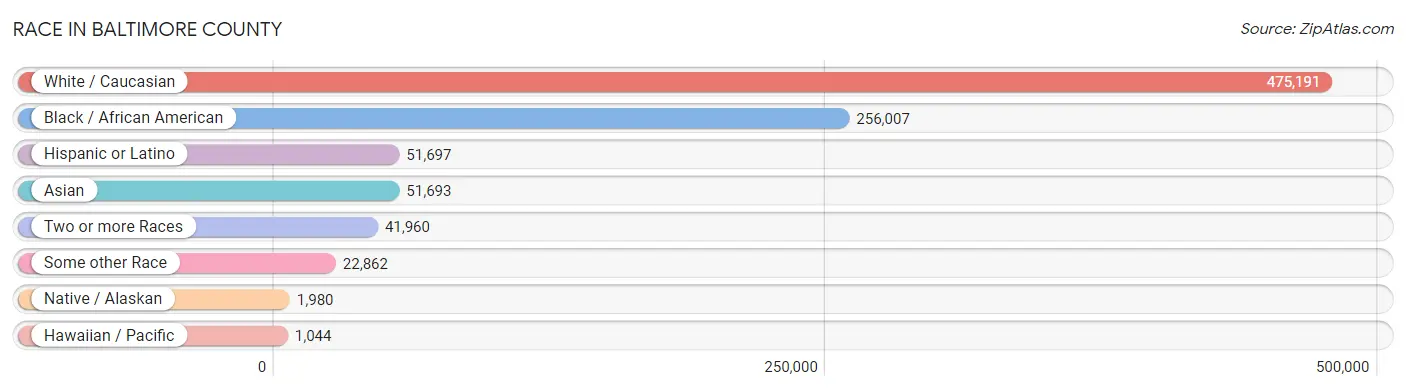
Race in Baltimore County
The most populous races in Baltimore County are White / Caucasian (475,191 | 55.9%), Black / African American (256,007 | 30.1%), and Hispanic or Latino (51,697 | 6.1%).
| Race | # Population | % Population |
| Asian | 51,693 | 6.1% |
| Black / African American | 256,007 | 30.1% |
| Hawaiian / Pacific | 1,044 | 0.1% |
| Hispanic or Latino | 51,697 | 6.1% |
| Native / Alaskan | 1,980 | 0.2% |
| White / Caucasian | 475,191 | 55.9% |
| Two or more Races | 41,960 | 4.9% |
| Some other Race | 22,862 | 2.7% |
| Total | 850,737 | 100.0% |
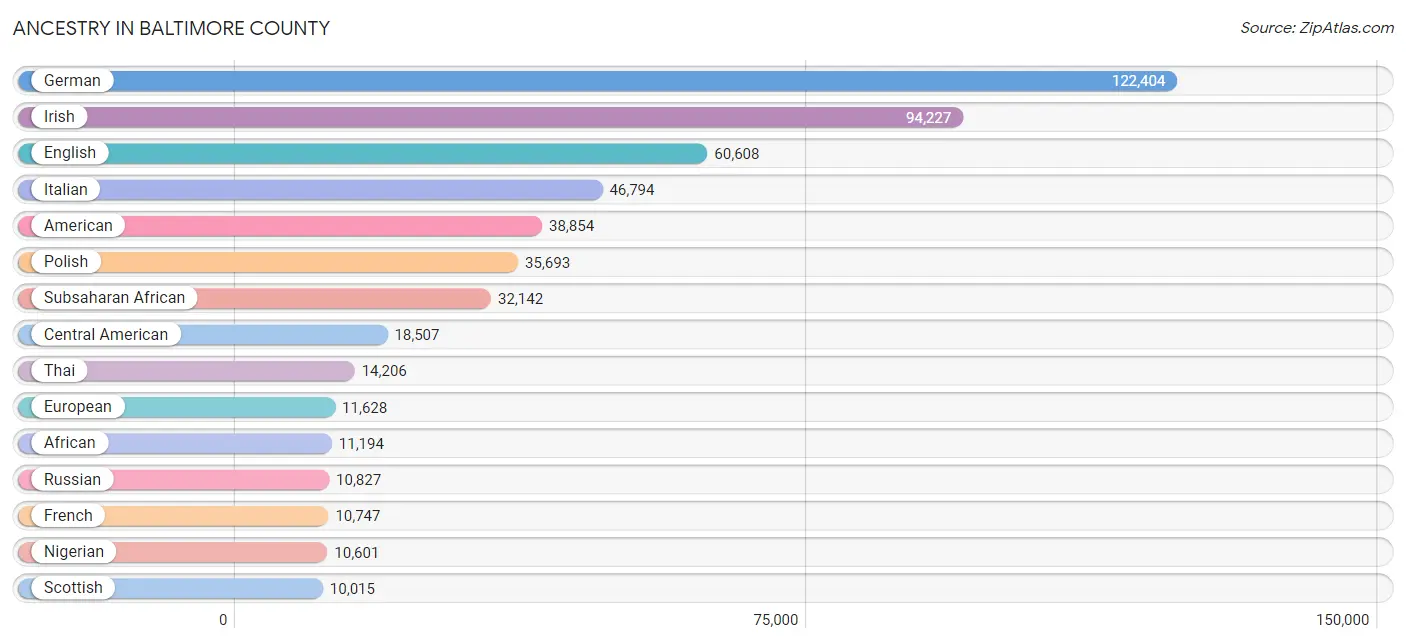
Ancestry in Baltimore County
The most populous ancestries reported in Baltimore County are German (122,404 | 14.4%), Irish (94,227 | 11.1%), English (60,608 | 7.1%), Italian (46,794 | 5.5%), and American (38,854 | 4.6%), together accounting for 42.7% of all Baltimore County residents.
| Ancestry | # Population | % Population |
| Afghan | 749 | 0.1% |
| African | 11,194 | 1.3% |
| Albanian | 304 | 0.0% |
| American | 38,854 | 4.6% |
| Apache | 58 | 0.0% |
| Arab | 5,538 | 0.6% |
| Arapaho | 36 | 0.0% |
| Argentinean | 375 | 0.0% |
| Armenian | 418 | 0.1% |
| Australian | 131 | 0.0% |
| Austrian | 1,957 | 0.2% |
| Bahamian | 22 | 0.0% |
| Barbadian | 469 | 0.1% |
| Belgian | 297 | 0.0% |
| Belizean | 14 | 0.0% |
| Bhutanese | 1,973 | 0.2% |
| Blackfeet | 307 | 0.0% |
| Bolivian | 385 | 0.1% |
| Brazilian | 601 | 0.1% |
| British | 4,154 | 0.5% |
| British West Indian | 497 | 0.1% |
| Bulgarian | 324 | 0.0% |
| Burmese | 4,752 | 0.6% |
| Cajun | 35 | 0.0% |
| Canadian | 710 | 0.1% |
| Carpatho Rusyn | 6 | 0.0% |
| Celtic | 35 | 0.0% |
| Central American | 18,507 | 2.2% |
| Central American Indian | 662 | 0.1% |
| Cherokee | 2,116 | 0.3% |
| Cheyenne | 6 | 0.0% |
| Chilean | 457 | 0.1% |
| Chinese | 13 | 0.0% |
| Chippewa | 5 | 0.0% |
| Choctaw | 143 | 0.0% |
| Colombian | 1,816 | 0.2% |
| Comanche | 9 | 0.0% |
| Costa Rican | 144 | 0.0% |
| Cree | 28 | 0.0% |
| Creek | 85 | 0.0% |
| Croatian | 284 | 0.0% |
| Cuban | 1,904 | 0.2% |
| Cypriot | 17 | 0.0% |
| Czech | 2,882 | 0.3% |
| Czechoslovakian | 764 | 0.1% |
| Danish | 1,093 | 0.1% |
| Delaware | 6 | 0.0% |
| Dominican | 3,449 | 0.4% |
| Dutch | 4,742 | 0.6% |
| Dutch West Indian | 6 | 0.0% |
| Eastern European | 5,180 | 0.6% |
| Ecuadorian | 1,019 | 0.1% |
| Egyptian | 1,494 | 0.2% |
| English | 60,608 | 7.1% |
| Estonian | 167 | 0.0% |
| Ethiopian | 2,910 | 0.3% |
| European | 11,628 | 1.4% |
| Filipino | 642 | 0.1% |
| Finnish | 815 | 0.1% |
| French | 10,747 | 1.3% |
| French American Indian | 114 | 0.0% |
| French Canadian | 1,317 | 0.2% |
| German | 122,404 | 14.4% |
| German Russian | 26 | 0.0% |
| Ghanaian | 1,215 | 0.1% |
| Greek | 5,289 | 0.6% |
| Guamanian / Chamorro | 199 | 0.0% |
| Guatemalan | 3,491 | 0.4% |
| Guyanese | 349 | 0.0% |
| Haitian | 1,062 | 0.1% |
| Hmong | 51 | 0.0% |
| Honduran | 3,556 | 0.4% |
| Hopi | 17 | 0.0% |
| Houma | 24 | 0.0% |
| Hungarian | 2,953 | 0.4% |
| Icelander | 80 | 0.0% |
| Indian (Asian) | 8,383 | 1.0% |
| Indonesian | 2,697 | 0.3% |
| Iranian | 1,700 | 0.2% |
| Iraqi | 165 | 0.0% |
| Irish | 94,227 | 11.1% |
| Iroquois | 277 | 0.0% |
| Israeli | 1,081 | 0.1% |
| Italian | 46,794 | 5.5% |
| Jamaican | 5,537 | 0.6% |
| Japanese | 387 | 0.1% |
| Jordanian | 110 | 0.0% |
| Kenyan | 2,325 | 0.3% |
| Korean | 9,630 | 1.1% |
| Laotian | 9 | 0.0% |
| Latvian | 349 | 0.0% |
| Lebanese | 553 | 0.1% |
| Liberian | 530 | 0.1% |
| Lithuanian | 3,037 | 0.4% |
| Lumbee | 821 | 0.1% |
| Luxembourger | 24 | 0.0% |
| Macedonian | 14 | 0.0% |
| Malaysian | 234 | 0.0% |
| Maltese | 27 | 0.0% |
| Menominee | 6 | 0.0% |
| Mexican | 8,903 | 1.1% |
| Mexican American Indian | 189 | 0.0% |
| Mongolian | 3 | 0.0% |
| Moroccan | 445 | 0.1% |
| Native Hawaiian | 1,015 | 0.1% |
| Navajo | 96 | 0.0% |
| New Zealander | 5 | 0.0% |
| Nicaraguan | 664 | 0.1% |
| Nigerian | 10,601 | 1.3% |
| Northern European | 627 | 0.1% |
| Norwegian | 3,032 | 0.4% |
| Okinawan | 12 | 0.0% |
| Paiute | 6 | 0.0% |
| Pakistani | 522 | 0.1% |
| Palestinian | 615 | 0.1% |
| Panamanian | 691 | 0.1% |
| Paraguayan | 146 | 0.0% |
| Pennsylvania German | 189 | 0.0% |
| Peruvian | 1,979 | 0.2% |
| Polish | 35,693 | 4.2% |
| Portuguese | 970 | 0.1% |
| Potawatomi | 11 | 0.0% |
| Puerto Rican | 8,004 | 0.9% |
| Puget Sound Salish | 22 | 0.0% |
| Romanian | 877 | 0.1% |
| Russian | 10,827 | 1.3% |
| Salvadoran | 9,902 | 1.2% |
| Samoan | 178 | 0.0% |
| Scandinavian | 1,139 | 0.1% |
| Scotch-Irish | 4,785 | 0.6% |
| Scottish | 10,015 | 1.2% |
| Seminole | 43 | 0.0% |
| Senegalese | 116 | 0.0% |
| Serbian | 174 | 0.0% |
| Shoshone | 25 | 0.0% |
| Sierra Leonean | 422 | 0.1% |
| Sioux | 172 | 0.0% |
| Slavic | 279 | 0.0% |
| Slovak | 1,625 | 0.2% |
| Slovene | 128 | 0.0% |
| Somali | 11 | 0.0% |
| South African | 150 | 0.0% |
| South American | 7,231 | 0.9% |
| South American Indian | 410 | 0.1% |
| Soviet Union | 53 | 0.0% |
| Spaniard | 1,007 | 0.1% |
| Spanish | 591 | 0.1% |
| Sri Lankan | 2,947 | 0.4% |
| Subsaharan African | 32,142 | 3.8% |
| Sudanese | 585 | 0.1% |
| Swedish | 3,676 | 0.4% |
| Swiss | 1,285 | 0.2% |
| Syrian | 603 | 0.1% |
| Taiwanese | 18 | 0.0% |
| Thai | 14,206 | 1.7% |
| Tongan | 5 | 0.0% |
| Trinidadian and Tobagonian | 2,259 | 0.3% |
| Turkish | 428 | 0.1% |
| U.S. Virgin Islander | 90 | 0.0% |
| Ugandan | 118 | 0.0% |
| Ukrainian | 4,692 | 0.5% |
| Uruguayan | 100 | 0.0% |
| Venezuelan | 731 | 0.1% |
| Vietnamese | 1,260 | 0.2% |
| Welsh | 4,331 | 0.5% |
| West Indian | 1,307 | 0.2% |
| Yaqui | 66 | 0.0% |
| Yugoslavian | 77 | 0.0% |
| Zimbabwean | 217 | 0.0% | View All 169 Rows |
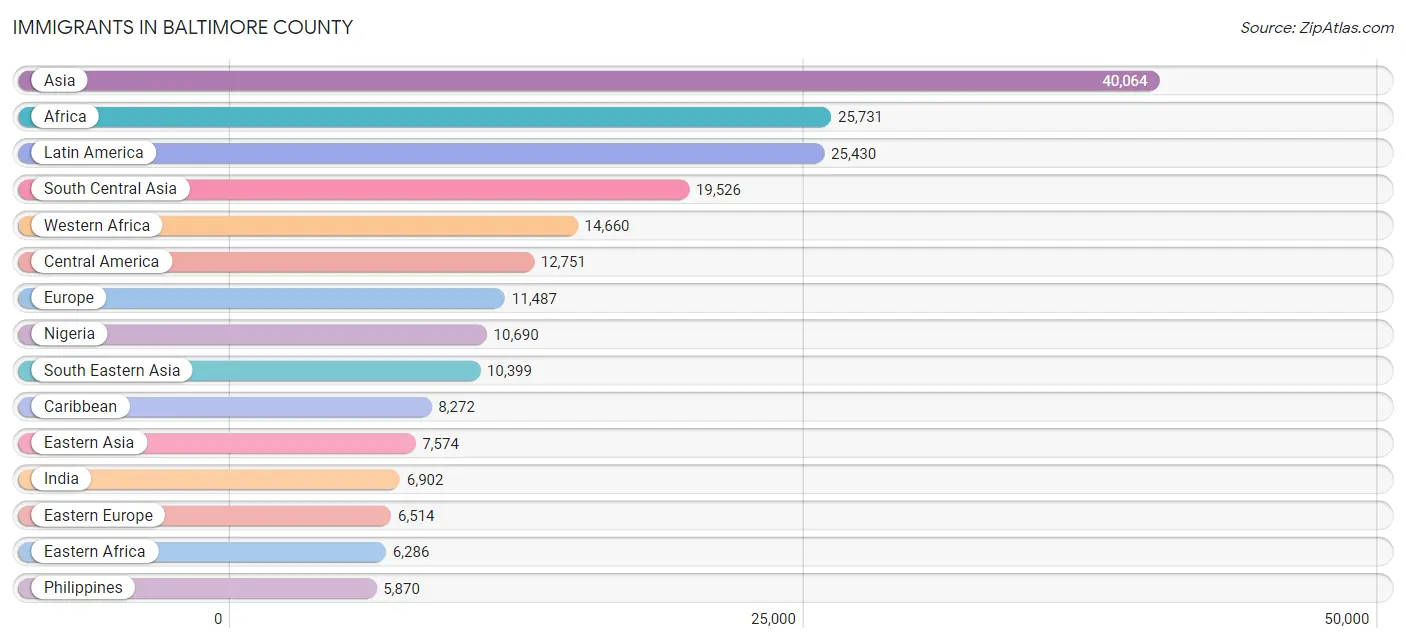
Immigrants in Baltimore County
The most numerous immigrant groups reported in Baltimore County came from Asia (40,064 | 4.7%), Africa (25,731 | 3.0%), Latin America (25,430 | 3.0%), South Central Asia (19,526 | 2.3%), and Western Africa (14,660 | 1.7%), together accounting for 14.7% of all Baltimore County residents.
| Immigration Origin | # Population | % Population |
| Afghanistan | 696 | 0.1% |
| Africa | 25,731 | 3.0% |
| Albania | 112 | 0.0% |
| Argentina | 307 | 0.0% |
| Armenia | 12 | 0.0% |
| Asia | 40,064 | 4.7% |
| Australia | 143 | 0.0% |
| Austria | 123 | 0.0% |
| Bahamas | 22 | 0.0% |
| Bangladesh | 1,170 | 0.1% |
| Barbados | 293 | 0.0% |
| Belarus | 338 | 0.0% |
| Belgium | 34 | 0.0% |
| Belize | 5 | 0.0% |
| Bolivia | 127 | 0.0% |
| Bosnia and Herzegovina | 19 | 0.0% |
| Brazil | 632 | 0.1% |
| Bulgaria | 288 | 0.0% |
| Cambodia | 125 | 0.0% |
| Cameroon | 1,880 | 0.2% |
| Canada | 1,161 | 0.1% |
| Caribbean | 8,272 | 1.0% |
| Central America | 12,751 | 1.5% |
| Chile | 154 | 0.0% |
| China | 4,464 | 0.5% |
| Colombia | 759 | 0.1% |
| Congo | 1 | 0.0% |
| Costa Rica | 82 | 0.0% |
| Croatia | 6 | 0.0% |
| Cuba | 336 | 0.0% |
| Czechoslovakia | 120 | 0.0% |
| Denmark | 24 | 0.0% |
| Dominica | 103 | 0.0% |
| Dominican Republic | 1,318 | 0.2% |
| Eastern Africa | 6,286 | 0.7% |
| Eastern Asia | 7,574 | 0.9% |
| Eastern Europe | 6,514 | 0.8% |
| Ecuador | 376 | 0.0% |
| Egypt | 843 | 0.1% |
| El Salvador | 5,759 | 0.7% |
| England | 654 | 0.1% |
| Eritrea | 270 | 0.0% |
| Ethiopia | 2,398 | 0.3% |
| Europe | 11,487 | 1.3% |
| Fiji | 20 | 0.0% |
| France | 144 | 0.0% |
| Germany | 947 | 0.1% |
| Ghana | 1,643 | 0.2% |
| Greece | 501 | 0.1% |
| Grenada | 94 | 0.0% |
| Guatemala | 1,877 | 0.2% |
| Guyana | 305 | 0.0% |
| Haiti | 344 | 0.0% |
| Honduras | 2,269 | 0.3% |
| Hong Kong | 203 | 0.0% |
| Hungary | 69 | 0.0% |
| India | 6,902 | 0.8% |
| Indonesia | 14 | 0.0% |
| Iran | 1,286 | 0.2% |
| Iraq | 292 | 0.0% |
| Ireland | 327 | 0.0% |
| Israel | 569 | 0.1% |
| Italy | 679 | 0.1% |
| Jamaica | 3,153 | 0.4% |
| Japan | 340 | 0.0% |
| Jordan | 88 | 0.0% |
| Kazakhstan | 184 | 0.0% |
| Kenya | 2,697 | 0.3% |
| Korea | 2,770 | 0.3% |
| Kuwait | 53 | 0.0% |
| Laos | 75 | 0.0% |
| Latin America | 25,430 | 3.0% |
| Latvia | 18 | 0.0% |
| Lebanon | 119 | 0.0% |
| Liberia | 1,083 | 0.1% |
| Lithuania | 15 | 0.0% |
| Malaysia | 173 | 0.0% |
| Mexico | 2,395 | 0.3% |
| Middle Africa | 2,187 | 0.3% |
| Moldova | 126 | 0.0% |
| Morocco | 508 | 0.1% |
| Nepal | 3,899 | 0.5% |
| Netherlands | 173 | 0.0% |
| Nicaragua | 207 | 0.0% |
| Nigeria | 10,690 | 1.3% |
| Northern Africa | 1,932 | 0.2% |
| Northern Europe | 2,054 | 0.2% |
| Norway | 64 | 0.0% |
| Oceania | 204 | 0.0% |
| Pakistan | 4,076 | 0.5% |
| Panama | 157 | 0.0% |
| Peru | 972 | 0.1% |
| Philippines | 5,870 | 0.7% |
| Poland | 693 | 0.1% |
| Portugal | 69 | 0.0% |
| Romania | 420 | 0.1% |
| Russia | 1,681 | 0.2% |
| Saudi Arabia | 158 | 0.0% |
| Scotland | 46 | 0.0% |
| Senegal | 182 | 0.0% |
| Serbia | 22 | 0.0% |
| Sierra Leone | 298 | 0.0% |
| Singapore | 205 | 0.0% |
| Somalia | 11 | 0.0% |
| South Africa | 214 | 0.0% |
| South America | 4,407 | 0.5% |
| South Central Asia | 19,526 | 2.3% |
| South Eastern Asia | 10,399 | 1.2% |
| Southern Europe | 1,470 | 0.2% |
| Spain | 201 | 0.0% |
| Sri Lanka | 311 | 0.0% |
| St. Vincent and the Grenadines | 103 | 0.0% |
| Sudan | 479 | 0.1% |
| Sweden | 103 | 0.0% |
| Switzerland | 28 | 0.0% |
| Syria | 400 | 0.1% |
| Taiwan | 636 | 0.1% |
| Thailand | 348 | 0.0% |
| Trinidad and Tobago | 1,911 | 0.2% |
| Turkey | 240 | 0.0% |
| Uganda | 322 | 0.0% |
| Ukraine | 1,948 | 0.2% |
| Uruguay | 100 | 0.0% |
| Uzbekistan | 636 | 0.1% |
| Venezuela | 589 | 0.1% |
| Vietnam | 1,666 | 0.2% |
| West Indies | 51 | 0.0% |
| Western Africa | 14,660 | 1.7% |
| Western Asia | 2,454 | 0.3% |
| Western Europe | 1,449 | 0.2% |
| Zaire | 272 | 0.0% |
| Zimbabwe | 207 | 0.0% | View All 132 Rows |
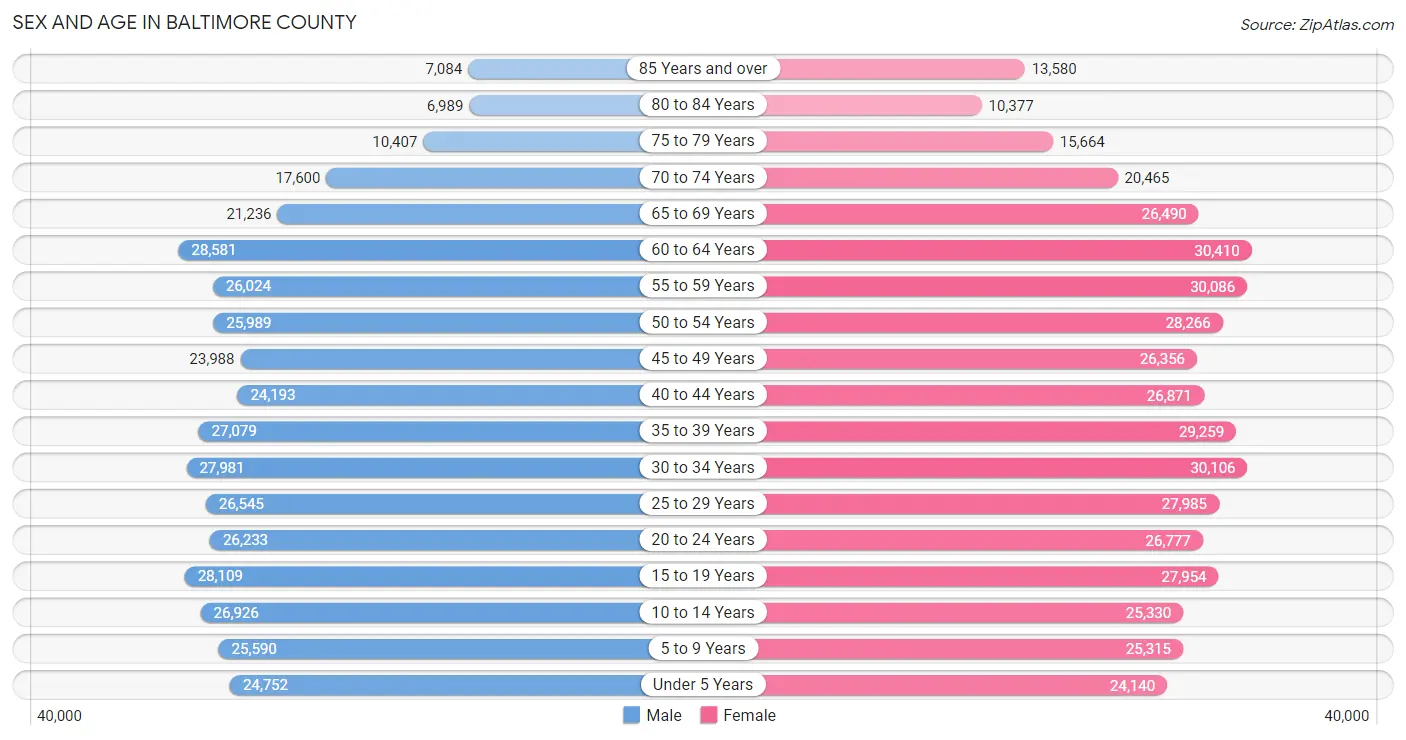
Sex and Age in Baltimore County
Sex and Age in Baltimore County
The most populous age groups in Baltimore County are 60 to 64 Years (28,581 | 7.0%) for men and 60 to 64 Years (30,410 | 6.8%) for women.
| Age Bracket | Male | Female |
| Under 5 Years | 24,752 (6.1%) | 24,140 (5.4%) |
| 5 to 9 Years | 25,590 (6.3%) | 25,315 (5.7%) |
| 10 to 14 Years | 26,926 (6.6%) | 25,330 (5.7%) |
| 15 to 19 Years | 28,109 (6.9%) | 27,954 (6.3%) |
| 20 to 24 Years | 26,233 (6.5%) | 26,777 (6.0%) |
| 25 to 29 Years | 26,545 (6.6%) | 27,985 (6.3%) |
| 30 to 34 Years | 27,981 (6.9%) | 30,106 (6.8%) |
| 35 to 39 Years | 27,079 (6.7%) | 29,259 (6.6%) |
| 40 to 44 Years | 24,193 (6.0%) | 26,871 (6.0%) |
| 45 to 49 Years | 23,988 (5.9%) | 26,356 (5.9%) |
| 50 to 54 Years | 25,989 (6.4%) | 28,266 (6.4%) |
| 55 to 59 Years | 26,024 (6.4%) | 30,086 (6.8%) |
| 60 to 64 Years | 28,581 (7.0%) | 30,410 (6.8%) |
| 65 to 69 Years | 21,236 (5.2%) | 26,490 (5.9%) |
| 70 to 74 Years | 17,600 (4.3%) | 20,465 (4.6%) |
| 75 to 79 Years | 10,407 (2.6%) | 15,664 (3.5%) |
| 80 to 84 Years | 6,989 (1.7%) | 10,377 (2.3%) |
| 85 Years and over | 7,084 (1.8%) | 13,580 (3.0%) |
| Total | 405,306 (100.0%) | 445,431 (100.0%) |
Families and Households in Baltimore County
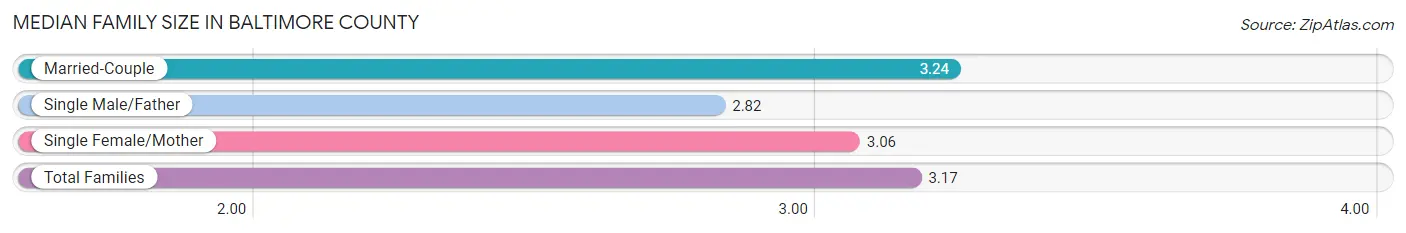
Median Family Size in Baltimore County
The median family size in Baltimore County is 3.17 persons per family, with married-couple families (145,524 | 69.3%) accounting for the largest median family size of 3.24 persons per family. On the other hand, single male/father families (16,776 | 8.0%) represent the smallest median family size with 2.82 persons per family.
| Family Type | # Families | Family Size |
| Married-Couple | 145,524 (69.3%) | 3.24 |
| Single Male/Father | 16,776 (8.0%) | 2.82 |
| Single Female/Mother | 47,831 (22.8%) | 3.06 |
| Total Families | 210,131 (100.0%) | 3.17 |
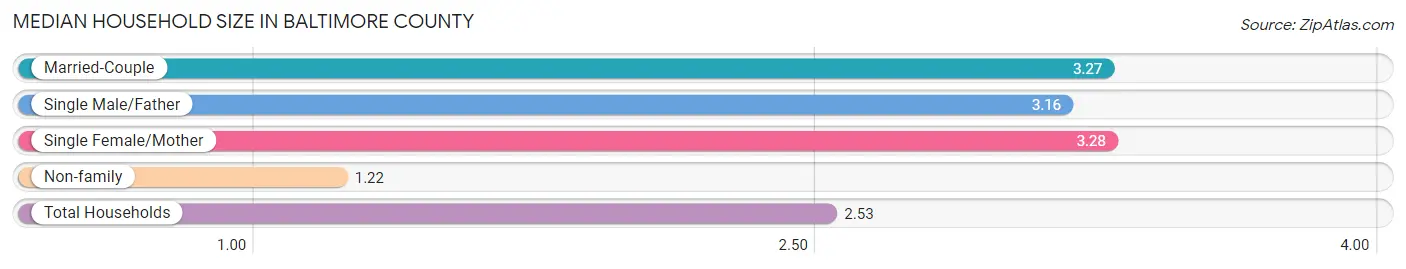
Median Household Size in Baltimore County
The median household size in Baltimore County is 2.53 persons per household, with single female/mother households (47,831 | 14.6%) accounting for the largest median household size of 3.28 persons per household. non-family households (118,480 | 36.0%) represent the smallest median household size with 1.22 persons per household.
| Household Type | # Households | Household Size |
| Married-Couple | 145,524 (44.3%) | 3.27 |
| Single Male/Father | 16,776 (5.1%) | 3.16 |
| Single Female/Mother | 47,831 (14.6%) | 3.28 |
| Non-family | 118,480 (36.0%) | 1.22 |
| Total Households | 328,611 (100.0%) | 2.53 |
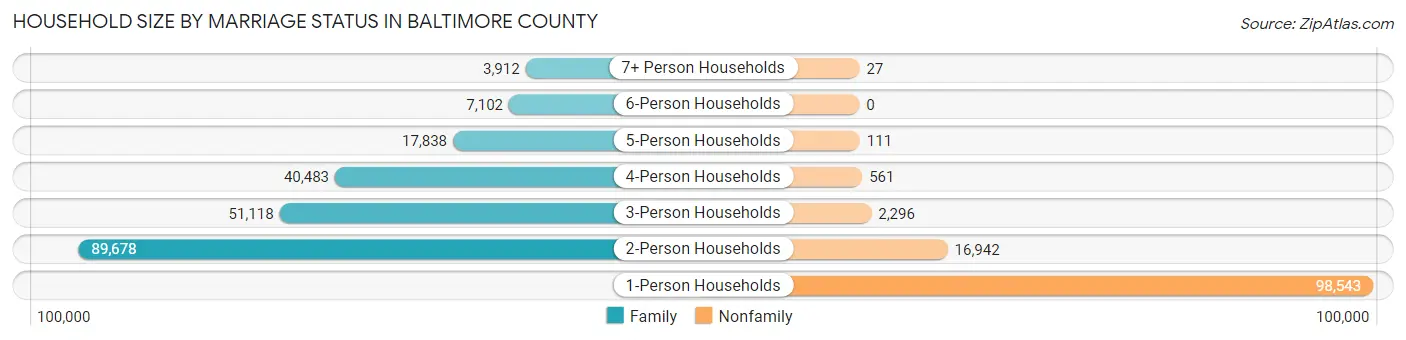
Household Size by Marriage Status in Baltimore County
Out of a total of 328,611 households in Baltimore County, 210,131 (63.9%) are family households, while 118,480 (36.0%) are nonfamily households. The most numerous type of family households are 2-person households, comprising 89,678, and the most common type of nonfamily households are 1-person households, comprising 98,543.
| Household Size | Family Households | Nonfamily Households |
| 1-Person Households | - | 98,543 (30.0%) |
| 2-Person Households | 89,678 (27.3%) | 16,942 (5.2%) |
| 3-Person Households | 51,118 (15.6%) | 2,296 (0.7%) |
| 4-Person Households | 40,483 (12.3%) | 561 (0.2%) |
| 5-Person Households | 17,838 (5.4%) | 111 (0.0%) |
| 6-Person Households | 7,102 (2.2%) | 0 (0.0%) |
| 7+ Person Households | 3,912 (1.2%) | 27 (0.0%) |
| Total | 210,131 (63.9%) | 118,480 (36.0%) |
Female Fertility in Baltimore County
Fertility by Age in Baltimore County
Average fertility rate in Baltimore County is 49.0 births per 1,000 women. Women in the age bracket of 20 to 34 years have the highest fertility rate with 74.0 births per 1,000 women. Women in the age bracket of 20 to 34 years acount for 63.9% of all women with births.
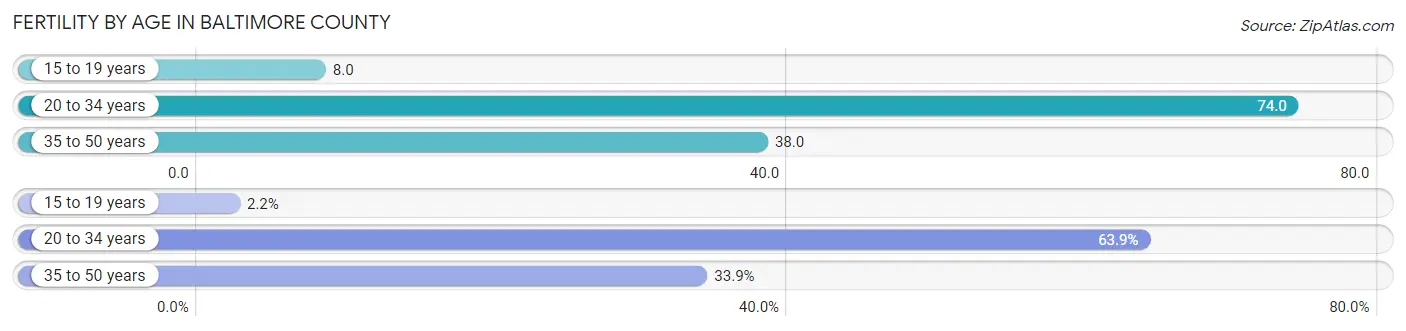
| Age Bracket | Women with Births | Births / 1,000 Women |
| 15 to 19 years | 213 (2.2%) | 8.0 |
| 20 to 34 years | 6,270 (63.9%) | 74.0 |
| 35 to 50 years | 3,323 (33.9%) | 38.0 |
| Total | 9,806 (100.0%) | 49.0 |
Fertility by Age by Marriage Status in Baltimore County
65.2% of women with births (9,806) in Baltimore County are married. The highest percentage of unmarried women with births falls into 15 to 19 years age bracket with 100.0% of them unmarried at the time of birth, while the lowest percentage of unmarried women with births belong to 35 to 50 years age bracket with 21.3% of them unmarried.
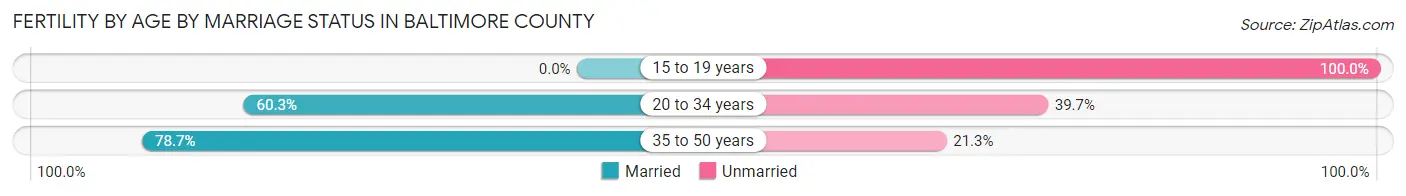
| Age Bracket | Married | Unmarried |
| 15 to 19 years | 0 (0.0%) | 213 (100.0%) |
| 20 to 34 years | 3,781 (60.3%) | 2,489 (39.7%) |
| 35 to 50 years | 2,615 (78.7%) | 708 (21.3%) |
| Total | 6,394 (65.2%) | 3,412 (34.8%) |
Fertility by Education in Baltimore County
Average fertility rate in Baltimore County is 49.0 births per 1,000 women. Women with the education attainment of graduate degree have the highest fertility rate of 63.0 births per 1,000 women, while women with the education attainment of less than high school have the lowest fertility at 26.0 births per 1,000 women. Women with the education attainment of college or associate's degree represent 26.8% of all women with births.
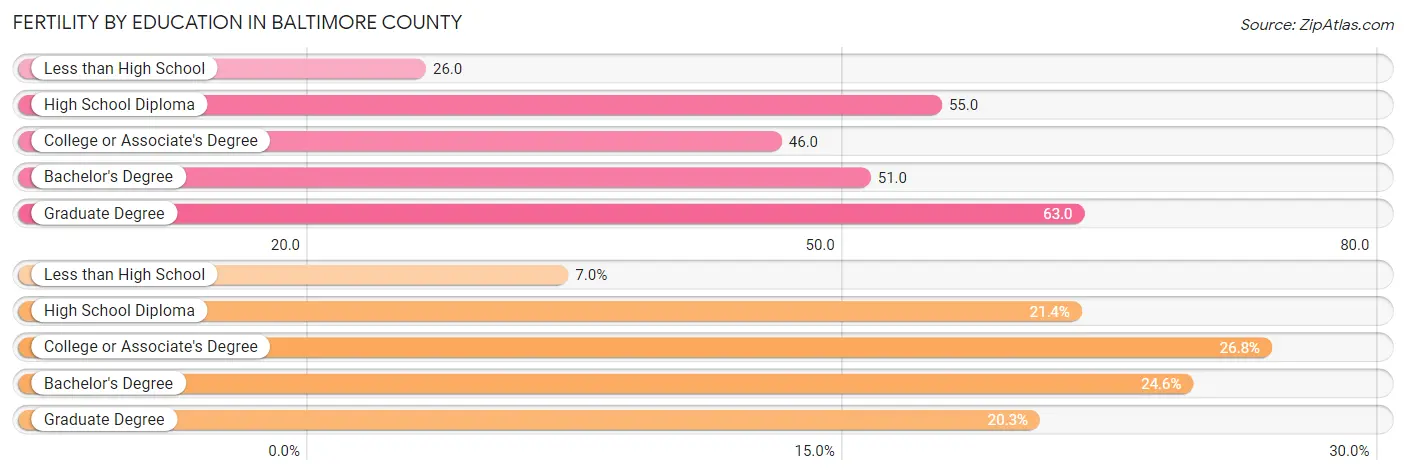
| Educational Attainment | Women with Births | Births / 1,000 Women |
| Less than High School | 686 (7.0%) | 26.0 |
| High School Diploma | 2,101 (21.4%) | 55.0 |
| College or Associate's Degree | 2,625 (26.8%) | 46.0 |
| Bachelor's Degree | 2,408 (24.6%) | 51.0 |
| Graduate Degree | 1,986 (20.3%) | 63.0 |
| Total | 9,806 (100.0%) | 49.0 |
Fertility by Education by Marriage Status in Baltimore County
34.8% of women with births in Baltimore County are unmarried. Women with the educational attainment of graduate degree are most likely to be married with 80.2% of them married at childbirth, while women with the educational attainment of high school diploma are least likely to be married with 52.2% of them unmarried at childbirth.
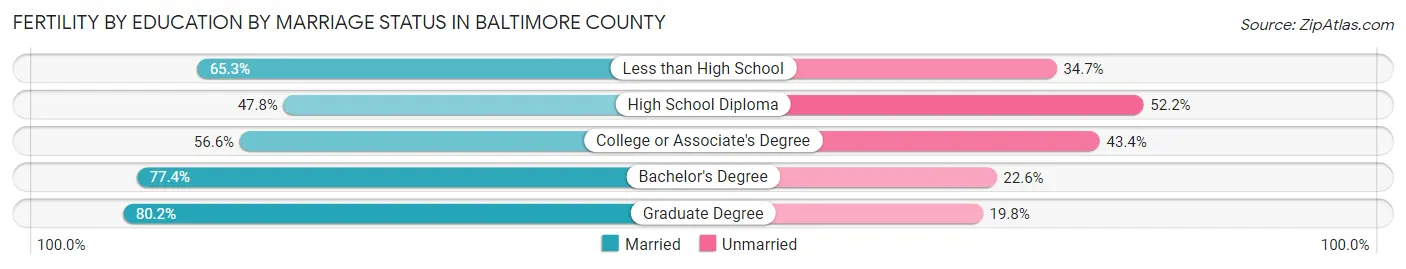
| Educational Attainment | Married | Unmarried |
| Less than High School | 448 (65.3%) | 238 (34.7%) |
| High School Diploma | 1,004 (47.8%) | 1,097 (52.2%) |
| College or Associate's Degree | 1,486 (56.6%) | 1,139 (43.4%) |
| Bachelor's Degree | 1,864 (77.4%) | 544 (22.6%) |
| Graduate Degree | 1,593 (80.2%) | 393 (19.8%) |
| Total | 6,394 (65.2%) | 3,412 (34.8%) |
Income in Baltimore County
Income Overview in Baltimore County
Per Capita Income in Baltimore County is $46,603, while median incomes of families and households are $109,514 and $88,157 respectively.
| Characteristic | Number | Measure |
| Per Capita Income | 850,737 | $46,603 |
| Median Family Income | 210,131 | $109,514 |
| Mean Family Income | 210,131 | $139,852 |
| Median Household Income | 328,611 | $88,157 |
| Mean Household Income | 328,611 | $117,444 |
| Income Deficit | 210,131 | $11,538 |
| Wage / Income Gap (%) | 850,737 | 21.87% |
| Wage / Income Gap ($) | 850,737 | 78.13¢ per $1 |
| Gini / Inequality Index | 850,737 | 0.46 |
Earnings by Sex in Baltimore County
Average Earnings in Baltimore County are $50,439, $57,625 for men and $45,020 for women, a difference of 21.9%.
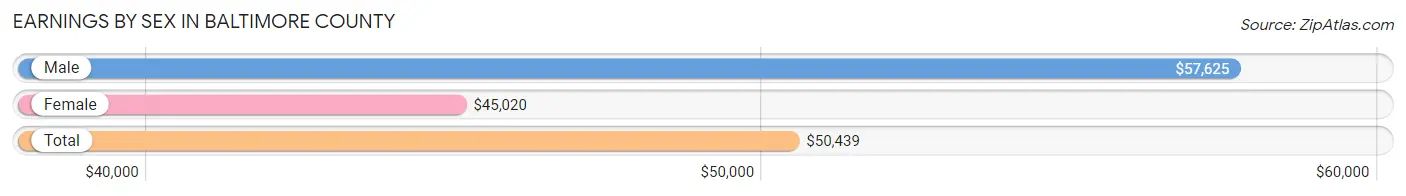
| Sex | Number | Average Earnings |
| Male | 233,008 (49.7%) | $57,625 |
| Female | 235,324 (50.2%) | $45,020 |
| Total | 468,332 (100.0%) | $50,439 |
Earnings by Sex by Income Bracket in Baltimore County
The most common earnings brackets in Baltimore County are $100,000+ for men (57,031 | 24.5%) and $100,000+ for women (32,495 | 13.8%).
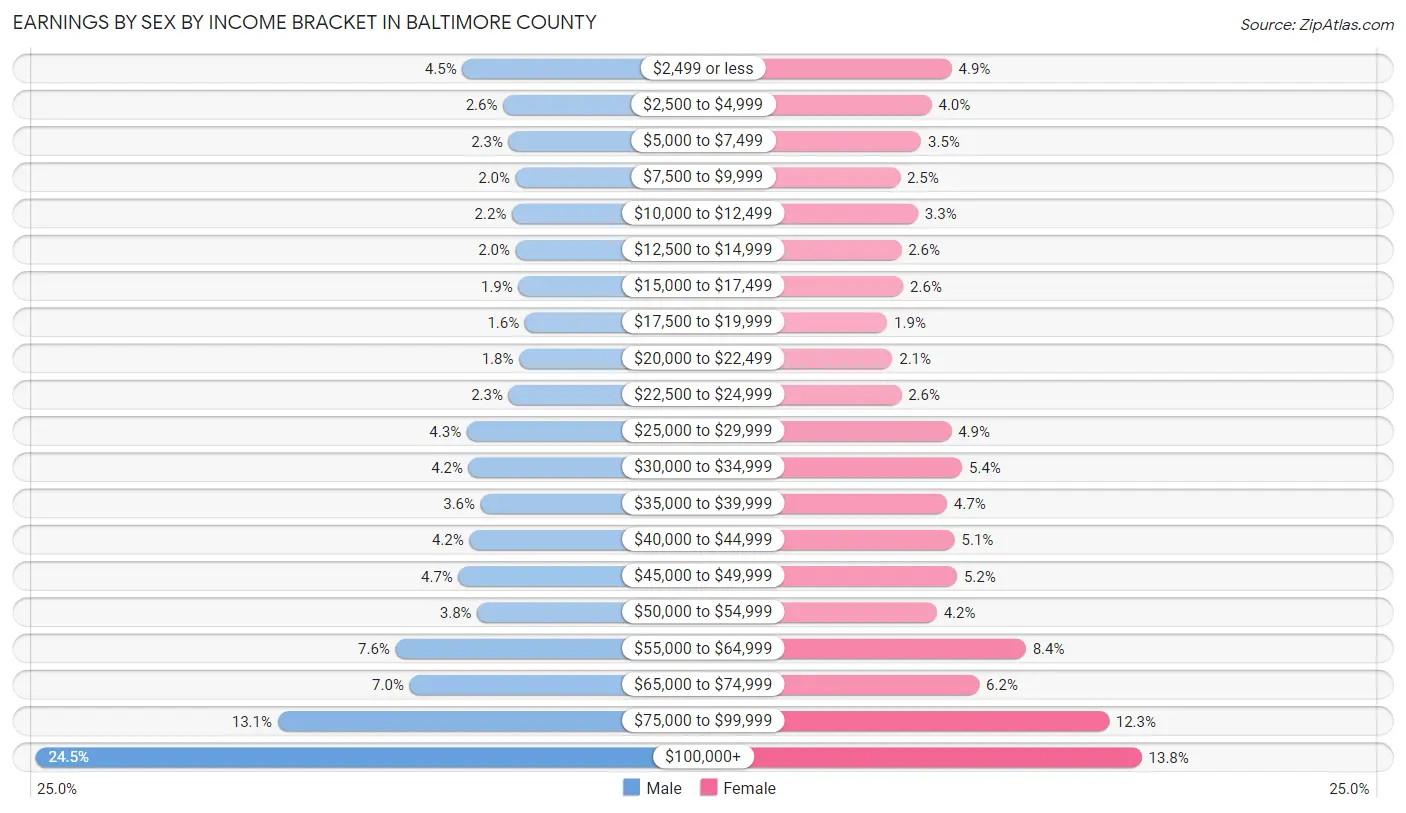
| Income | Male | Female |
| $2,499 or less | 10,452 (4.5%) | 11,564 (4.9%) |
| $2,500 to $4,999 | 6,015 (2.6%) | 9,339 (4.0%) |
| $5,000 to $7,499 | 5,401 (2.3%) | 8,192 (3.5%) |
| $7,500 to $9,999 | 4,638 (2.0%) | 5,860 (2.5%) |
| $10,000 to $12,499 | 5,022 (2.2%) | 7,844 (3.3%) |
| $12,500 to $14,999 | 4,636 (2.0%) | 6,005 (2.5%) |
| $15,000 to $17,499 | 4,326 (1.9%) | 6,220 (2.6%) |
| $17,500 to $19,999 | 3,640 (1.6%) | 4,437 (1.9%) |
| $20,000 to $22,499 | 4,269 (1.8%) | 5,007 (2.1%) |
| $22,500 to $24,999 | 5,395 (2.3%) | 6,005 (2.5%) |
| $25,000 to $29,999 | 9,976 (4.3%) | 11,517 (4.9%) |
| $30,000 to $34,999 | 9,760 (4.2%) | 12,704 (5.4%) |
| $35,000 to $39,999 | 8,449 (3.6%) | 11,028 (4.7%) |
| $40,000 to $44,999 | 9,698 (4.2%) | 11,882 (5.1%) |
| $45,000 to $49,999 | 10,880 (4.7%) | 12,139 (5.2%) |
| $50,000 to $54,999 | 8,842 (3.8%) | 9,896 (4.2%) |
| $55,000 to $64,999 | 17,746 (7.6%) | 19,728 (8.4%) |
| $65,000 to $74,999 | 16,216 (7.0%) | 14,584 (6.2%) |
| $75,000 to $99,999 | 30,616 (13.1%) | 28,878 (12.3%) |
| $100,000+ | 57,031 (24.5%) | 32,495 (13.8%) |
| Total | 233,008 (100.0%) | 235,324 (100.0%) |
Earnings by Sex by Educational Attainment in Baltimore County
Average earnings in Baltimore County are $66,039 for men and $51,541 for women, a difference of 22.0%. Men with an educational attainment of graduate degree enjoy the highest average annual earnings of $109,587, while those with less than high school education earn the least with $37,329. Women with an educational attainment of graduate degree earn the most with the average annual earnings of $82,286, while those with less than high school education have the smallest earnings of $24,552.
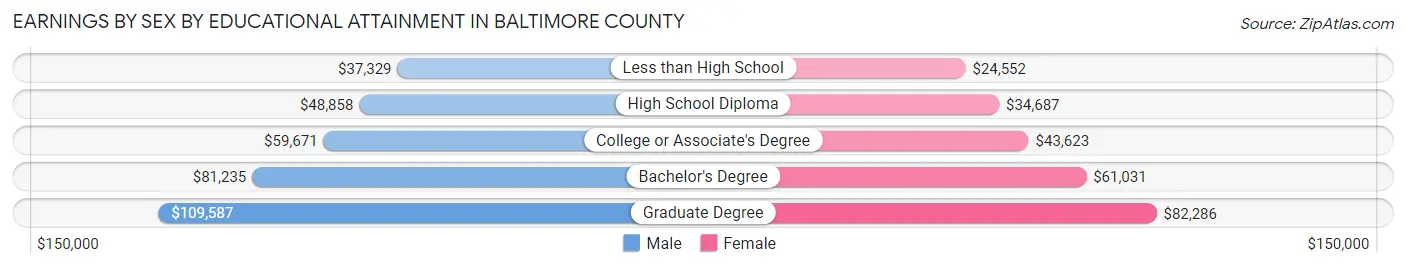
| Educational Attainment | Male Income | Female Income |
| Less than High School | $37,329 | $24,552 |
| High School Diploma | $48,858 | $34,687 |
| College or Associate's Degree | $59,671 | $43,623 |
| Bachelor's Degree | $81,235 | $61,031 |
| Graduate Degree | $109,587 | $82,286 |
| Total | $66,039 | $51,541 |
Family Income in Baltimore County
Family Income Brackets in Baltimore County
According to the Baltimore County family income data, there are 46,649 families falling into the $100,000 to $149,999 income range, which is the most common income bracket and makes up 22.2% of all families. Conversely, the $10,000 to $14,999 income bracket is the least frequent group with only 2,732 families (1.3%) belonging to this category.
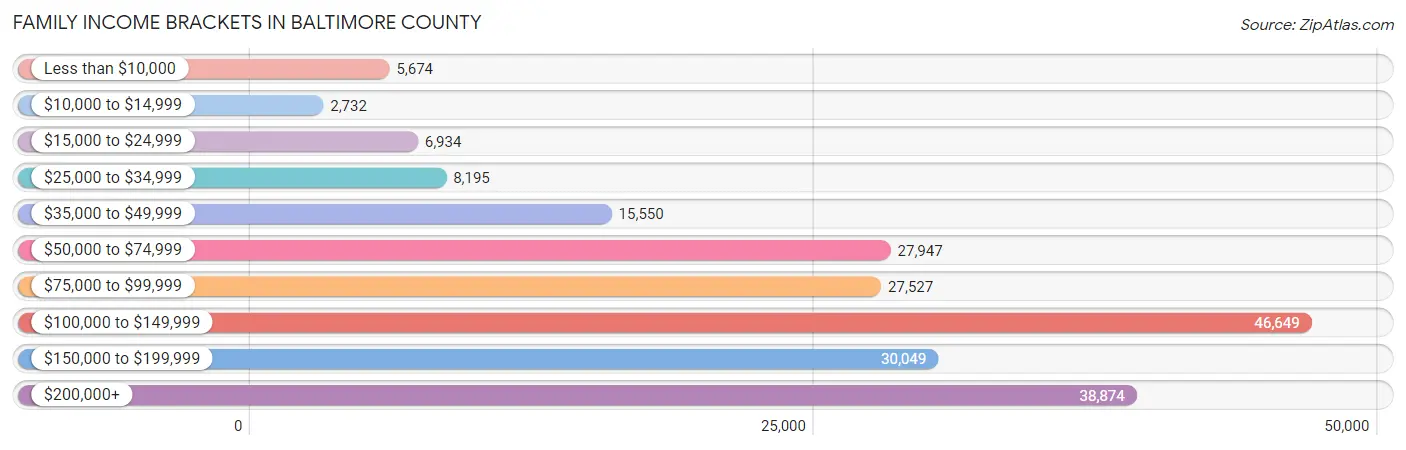
| Income Bracket | # Families | % Families |
| Less than $10,000 | 5,674 | 2.7% |
| $10,000 to $14,999 | 2,732 | 1.3% |
| $15,000 to $24,999 | 6,934 | 3.3% |
| $25,000 to $34,999 | 8,195 | 3.9% |
| $35,000 to $49,999 | 15,550 | 7.4% |
| $50,000 to $74,999 | 27,947 | 13.3% |
| $75,000 to $99,999 | 27,527 | 13.1% |
| $100,000 to $149,999 | 46,649 | 22.2% |
| $150,000 to $199,999 | 30,049 | 14.3% |
| $200,000+ | 38,874 | 18.5% |
Family Income by Famaliy Size in Baltimore County
4-person families (37,648 | 17.9%) account for the highest median family income in Baltimore County with $140,580 per family, while 2-person families (96,844 | 46.1%) have the highest median income of $47,486 per family member.
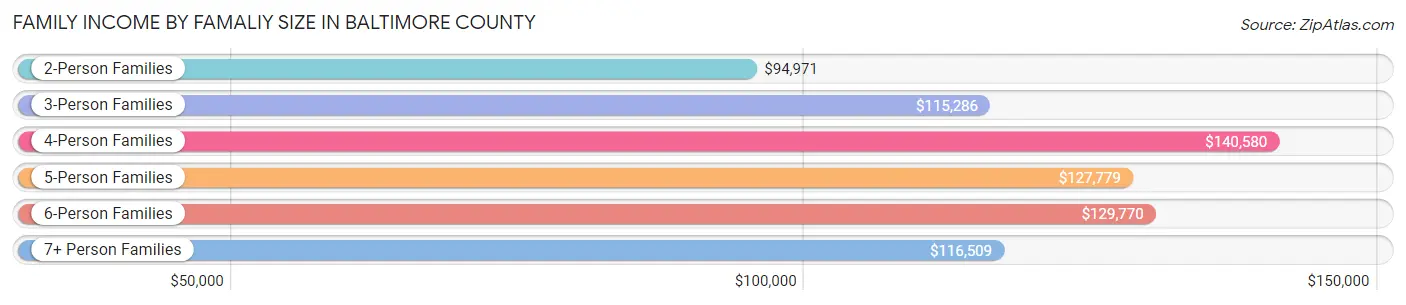
| Income Bracket | # Families | Median Income |
| 2-Person Families | 96,844 (46.1%) | $94,971 |
| 3-Person Families | 49,906 (23.7%) | $115,286 |
| 4-Person Families | 37,648 (17.9%) | $140,580 |
| 5-Person Families | 16,189 (7.7%) | $127,779 |
| 6-Person Families | 6,064 (2.9%) | $129,770 |
| 7+ Person Families | 3,480 (1.7%) | $116,509 |
| Total | 210,131 (100.0%) | $109,514 |
Family Income by Number of Earners in Baltimore County
The median family income in Baltimore County is $109,514, with families comprising 3+ earners (27,378) having the highest median family income of $165,994, while families with no earners (25,414) have the lowest median family income of $57,286, accounting for 13.0% and 12.1% of families, respectively.
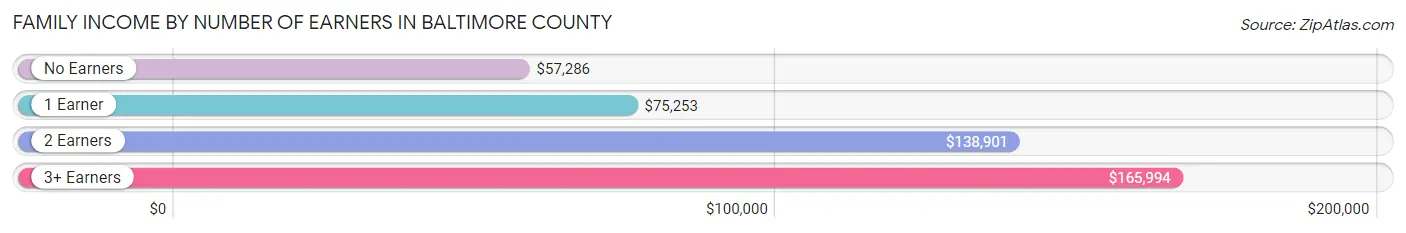
| Number of Earners | # Families | Median Income |
| No Earners | 25,414 (12.1%) | $57,286 |
| 1 Earner | 67,738 (32.2%) | $75,253 |
| 2 Earners | 89,601 (42.6%) | $138,901 |
| 3+ Earners | 27,378 (13.0%) | $165,994 |
| Total | 210,131 (100.0%) | $109,514 |
Household Income in Baltimore County
Household Income Brackets in Baltimore County
With 62,765 households falling in the category, the $100,000 to $149,999 income range is the most frequent in Baltimore County, accounting for 19.1% of all households. In contrast, only 8,215 households (2.5%) fall into the $10,000 to $14,999 income bracket, making it the least populous group.
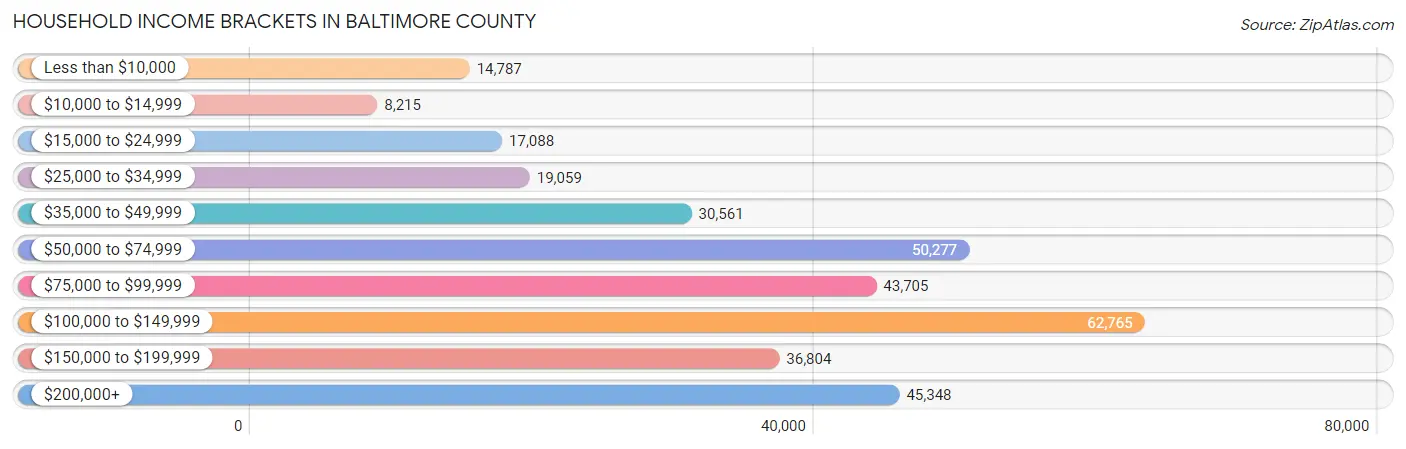
| Income Bracket | # Households | % Households |
| Less than $10,000 | 14,787 | 4.5% |
| $10,000 to $14,999 | 8,215 | 2.5% |
| $15,000 to $24,999 | 17,088 | 5.2% |
| $25,000 to $34,999 | 19,059 | 5.8% |
| $35,000 to $49,999 | 30,561 | 9.3% |
| $50,000 to $74,999 | 50,277 | 15.3% |
| $75,000 to $99,999 | 43,705 | 13.3% |
| $100,000 to $149,999 | 62,765 | 19.1% |
| $150,000 to $199,999 | 36,804 | 11.2% |
| $200,000+ | 45,348 | 13.8% |
Household Income by Householder Age in Baltimore County
The median household income in Baltimore County is $88,157, with the highest median household income of $107,410 found in the 45 to 64 years age bracket for the primary householder. A total of 126,678 households (38.6%) fall into this category. Meanwhile, the 15 to 24 years age bracket for the primary householder has the lowest median household income of $43,203, with 8,460 households (2.6%) in this group.
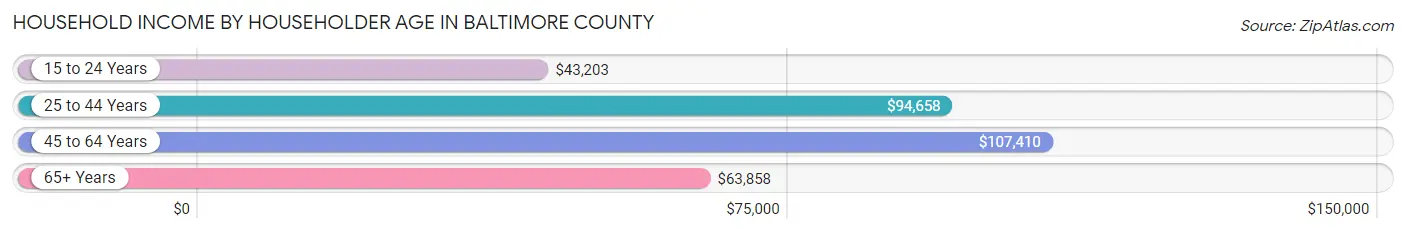
| Income Bracket | # Households | Median Income |
| 15 to 24 Years | 8,460 (2.6%) | $43,203 |
| 25 to 44 Years | 100,856 (30.7%) | $94,658 |
| 45 to 64 Years | 126,678 (38.6%) | $107,410 |
| 65+ Years | 92,617 (28.2%) | $63,858 |
| Total | 328,611 (100.0%) | $88,157 |
Poverty in Baltimore County
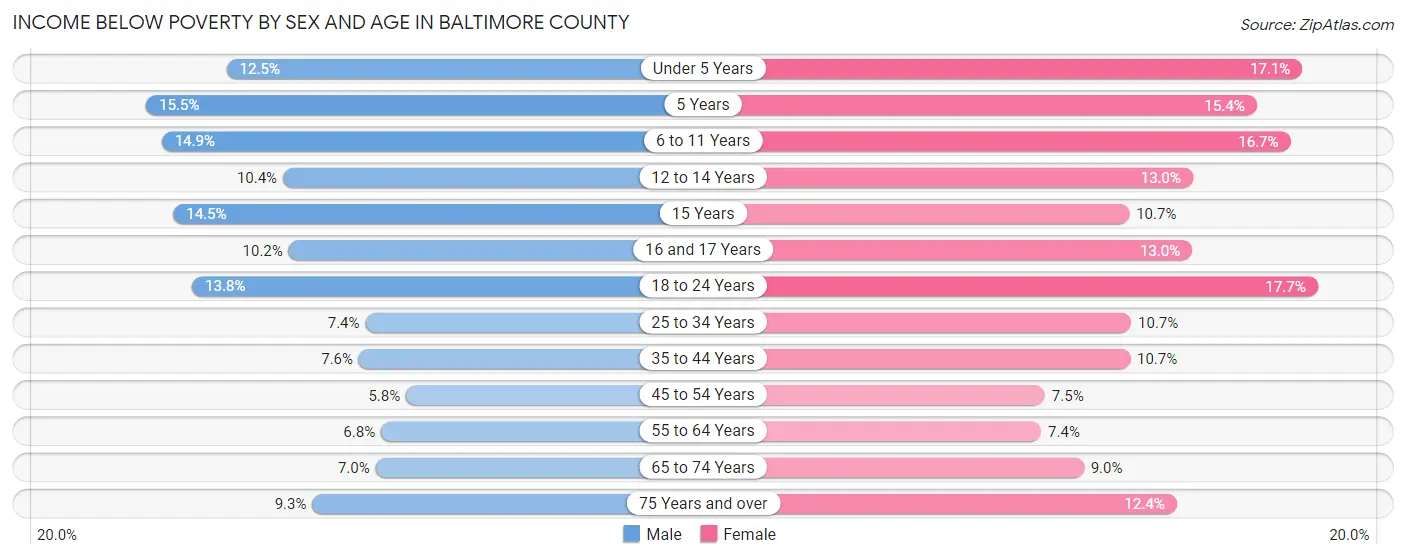
Income Below Poverty by Sex and Age in Baltimore County
With 9.0% poverty level for males and 11.3% for females among the residents of Baltimore County, 5 year old males and 18 to 24 year old females are the most vulnerable to poverty, with 709 males (15.5%) and 5,894 females (17.7%) in their respective age groups living below the poverty level.
| Age Bracket | Male | Female |
| Under 5 Years | 3,029 (12.5%) | 4,021 (17.1%) |
| 5 Years | 709 (15.5%) | 723 (15.4%) |
| 6 to 11 Years | 4,574 (14.9%) | 5,005 (16.7%) |
| 12 to 14 Years | 1,691 (10.4%) | 1,973 (13.0%) |
| 15 Years | 721 (14.5%) | 559 (10.7%) |
| 16 and 17 Years | 1,141 (10.2%) | 1,320 (13.0%) |
| 18 to 24 Years | 4,615 (13.8%) | 5,894 (17.7%) |
| 25 to 34 Years | 3,977 (7.3%) | 6,227 (10.7%) |
| 35 to 44 Years | 3,872 (7.6%) | 6,001 (10.7%) |
| 45 to 54 Years | 2,906 (5.8%) | 4,115 (7.5%) |
| 55 to 64 Years | 3,675 (6.8%) | 4,454 (7.4%) |
| 65 to 74 Years | 2,666 (7.0%) | 4,164 (9.0%) |
| 75 Years and over | 2,197 (9.3%) | 4,617 (12.4%) |
| Total | 35,773 (9.0%) | 49,073 (11.3%) |
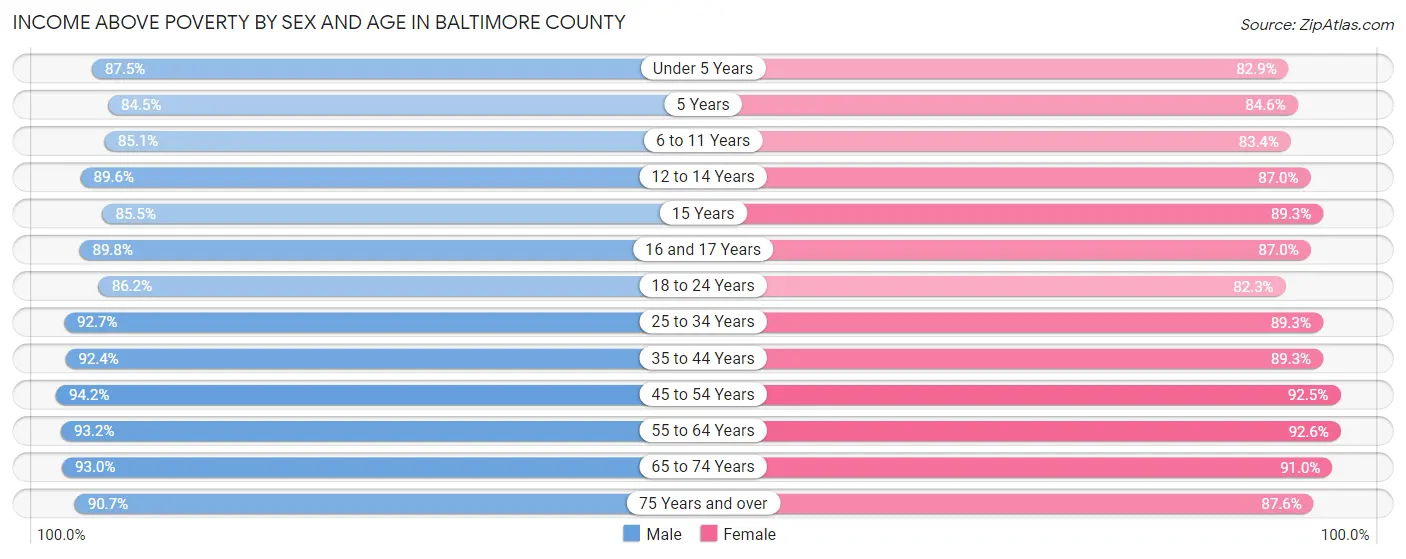
Income Above Poverty by Sex and Age in Baltimore County
According to the poverty statistics in Baltimore County, males aged 45 to 54 years and females aged 55 to 64 years are the age groups that are most secure financially, with 94.2% of males and 92.6% of females in these age groups living above the poverty line.
| Age Bracket | Male | Female |
| Under 5 Years | 21,198 (87.5%) | 19,513 (82.9%) |
| 5 Years | 3,869 (84.5%) | 3,972 (84.6%) |
| 6 to 11 Years | 26,106 (85.1%) | 25,062 (83.4%) |
| 12 to 14 Years | 14,550 (89.6%) | 13,169 (87.0%) |
| 15 Years | 4,257 (85.5%) | 4,679 (89.3%) |
| 16 and 17 Years | 10,048 (89.8%) | 8,835 (87.0%) |
| 18 to 24 Years | 28,887 (86.2%) | 27,474 (82.3%) |
| 25 to 34 Years | 50,121 (92.6%) | 51,777 (89.3%) |
| 35 to 44 Years | 47,169 (92.4%) | 50,105 (89.3%) |
| 45 to 54 Years | 46,832 (94.2%) | 50,432 (92.5%) |
| 55 to 64 Years | 50,592 (93.2%) | 55,770 (92.6%) |
| 65 to 74 Years | 35,573 (93.0%) | 42,191 (91.0%) |
| 75 Years and over | 21,370 (90.7%) | 32,524 (87.6%) |
| Total | 360,572 (91.0%) | 385,503 (88.7%) |
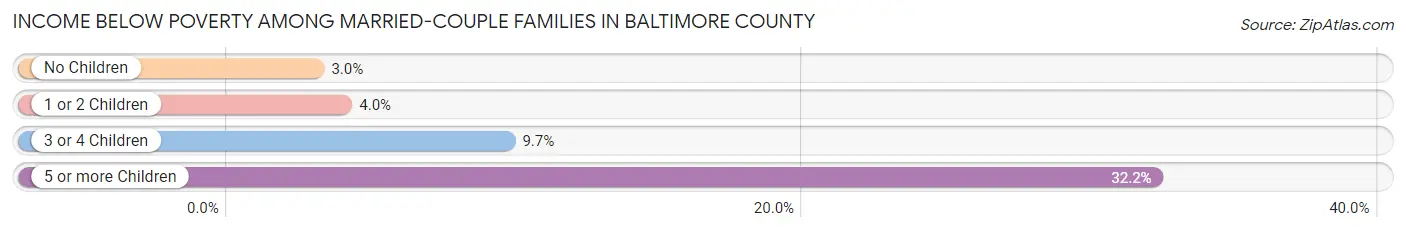
Income Below Poverty Among Married-Couple Families in Baltimore County
The poverty statistics for married-couple families in Baltimore County show that 4.1% or 5,917 of the total 145,524 families live below the poverty line. Families with 5 or more children have the highest poverty rate of 32.2%, comprising of 309 families. On the other hand, families with no children have the lowest poverty rate of 3.0%, which includes 2,599 families.
| Children | Above Poverty | Below Poverty |
| No Children | 83,654 (97.0%) | 2,599 (3.0%) |
| 1 or 2 Children | 44,372 (96.0%) | 1,840 (4.0%) |
| 3 or 4 Children | 10,931 (90.3%) | 1,169 (9.7%) |
| 5 or more Children | 650 (67.8%) | 309 (32.2%) |
| Total | 139,607 (95.9%) | 5,917 (4.1%) |
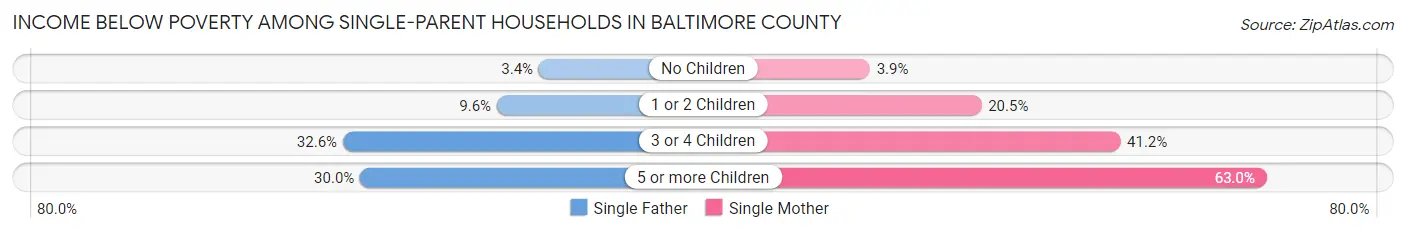
Income Below Poverty Among Single-Parent Households in Baltimore County
According to the poverty data in Baltimore County, 8.1% or 1,360 single-father households and 15.7% or 7,507 single-mother households are living below the poverty line. Among single-father households, those with 3 or 4 children have the highest poverty rate, with 327 households (32.6%) experiencing poverty. Likewise, among single-mother households, those with 5 or more children have the highest poverty rate, with 162 households (63.0%) falling below the poverty line.
| Children | Single Father | Single Mother |
| No Children | 268 (3.4%) | 756 (3.9%) |
| 1 or 2 Children | 741 (9.6%) | 4,928 (20.5%) |
| 3 or 4 Children | 327 (32.6%) | 1,661 (41.2%) |
| 5 or more Children | 24 (30.0%) | 162 (63.0%) |
| Total | 1,360 (8.1%) | 7,507 (15.7%) |
Income Below Poverty Among Married-Couple vs Single-Parent Households in Baltimore County
The poverty data for Baltimore County shows that 5,917 of the married-couple family households (4.1%) and 8,867 of the single-parent households (13.7%) are living below the poverty level. Within the married-couple family households, those with 5 or more children have the highest poverty rate, with 309 households (32.2%) falling below the poverty line. Among the single-parent households, those with 5 or more children have the highest poverty rate, with 186 household (55.2%) living below poverty.
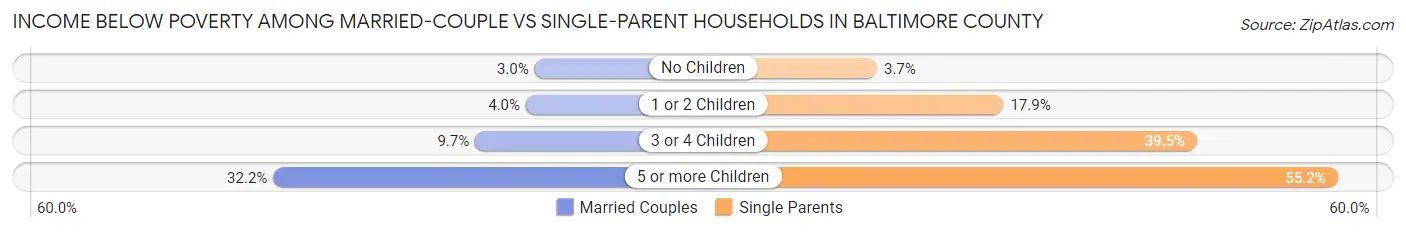
| Children | Married-Couple Families | Single-Parent Households |
| No Children | 2,599 (3.0%) | 1,024 (3.7%) |
| 1 or 2 Children | 1,840 (4.0%) | 5,669 (17.9%) |
| 3 or 4 Children | 1,169 (9.7%) | 1,988 (39.5%) |
| 5 or more Children | 309 (32.2%) | 186 (55.2%) |
| Total | 5,917 (4.1%) | 8,867 (13.7%) |
Employment Characteristics in Baltimore County
Employment by Class of Employer in Baltimore County
Among the 422,546 employed individuals in Baltimore County, private company employees (260,457 | 61.6%), not-for-profit organizations (48,215 | 11.4%), and local government employees (29,659 | 7.0%) make up the most common classes of employment.
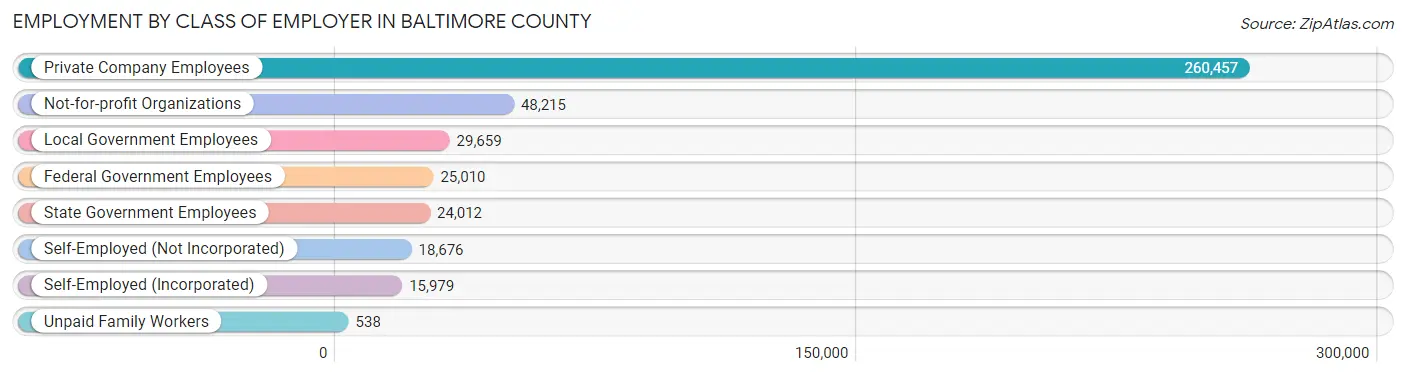
| Employer Class | # Employees | % Employees |
| Private Company Employees | 260,457 | 61.6% |
| Self-Employed (Incorporated) | 15,979 | 3.8% |
| Self-Employed (Not Incorporated) | 18,676 | 4.4% |
| Not-for-profit Organizations | 48,215 | 11.4% |
| Local Government Employees | 29,659 | 7.0% |
| State Government Employees | 24,012 | 5.7% |
| Federal Government Employees | 25,010 | 5.9% |
| Unpaid Family Workers | 538 | 0.1% |
| Total | 422,546 | 100.0% |
Employment Status by Age in Baltimore County
According to the labor force statistics for Baltimore County, out of the total population over 16 years of age (688,433), 66.0% or 454,366 individuals are in the labor force, with 5.2% or 23,627 of them unemployed. The age group with the highest labor force participation rate is 30 to 34 years, with 87.3% or 50,710 individuals in the labor force. Within the labor force, the 16 to 19 years age range has the highest percentage of unemployed individuals, with 15.8% or 2,874 of them being unemployed.
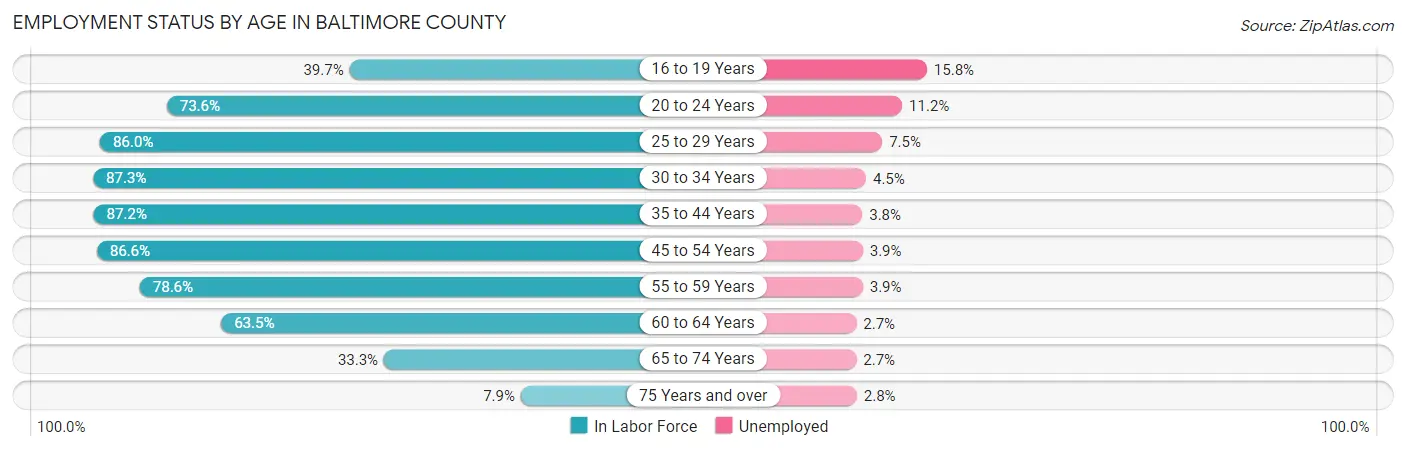
| Age Bracket | In Labor Force | Unemployed |
| 16 to 19 Years | 18,187 (39.7%) | 2,874 (15.8%) |
| 20 to 24 Years | 39,015 (73.6%) | 4,370 (11.2%) |
| 25 to 29 Years | 46,896 (86.0%) | 3,517 (7.5%) |
| 30 to 34 Years | 50,710 (87.3%) | 2,282 (4.5%) |
| 35 to 44 Years | 93,655 (87.2%) | 3,559 (3.8%) |
| 45 to 54 Years | 90,583 (86.6%) | 3,533 (3.9%) |
| 55 to 59 Years | 44,102 (78.6%) | 1,720 (3.9%) |
| 60 to 64 Years | 37,459 (63.5%) | 1,011 (2.7%) |
| 65 to 74 Years | 28,568 (33.3%) | 771 (2.7%) |
| 75 Years and over | 5,064 (7.9%) | 142 (2.8%) |
| Total | 454,366 (66.0%) | 23,627 (5.2%) |
Employment Status by Educational Attainment in Baltimore County
According to labor force statistics for Baltimore County, 82.6% of individuals (363,208) out of the total population between 25 and 64 years of age (439,719) are in the labor force, with 4.3% or 15,618 of them being unemployed. The group with the highest labor force participation rate are those with the educational attainment of bachelor's degree or higher, with 89.4% or 168,686 individuals in the labor force. Within the labor force, individuals with high school diploma education have the highest percentage of unemployment, with 6.5% or 5,129 of them being unemployed.
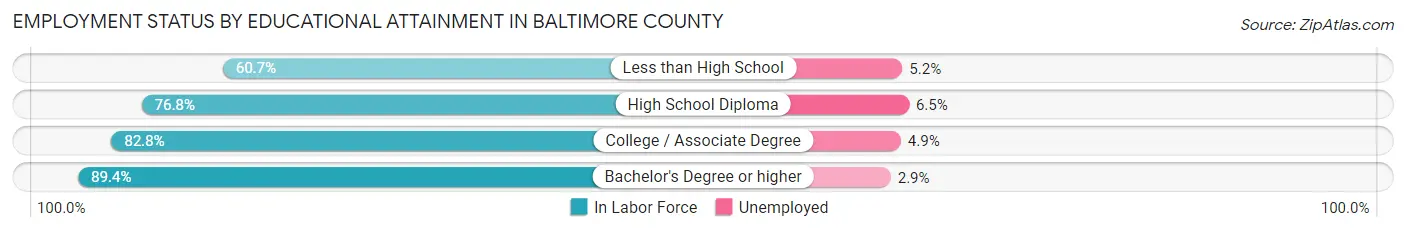
| Educational Attainment | In Labor Force | Unemployed |
| Less than High School | 19,248 (60.7%) | 1,649 (5.2%) |
| High School Diploma | 78,907 (76.8%) | 6,678 (6.5%) |
| College / Associate Degree | 96,527 (82.8%) | 5,712 (4.9%) |
| Bachelor's Degree or higher | 168,686 (89.4%) | 5,472 (2.9%) |
| Total | 363,208 (82.6%) | 18,908 (4.3%) |
Employment Occupations by Sex in Baltimore County
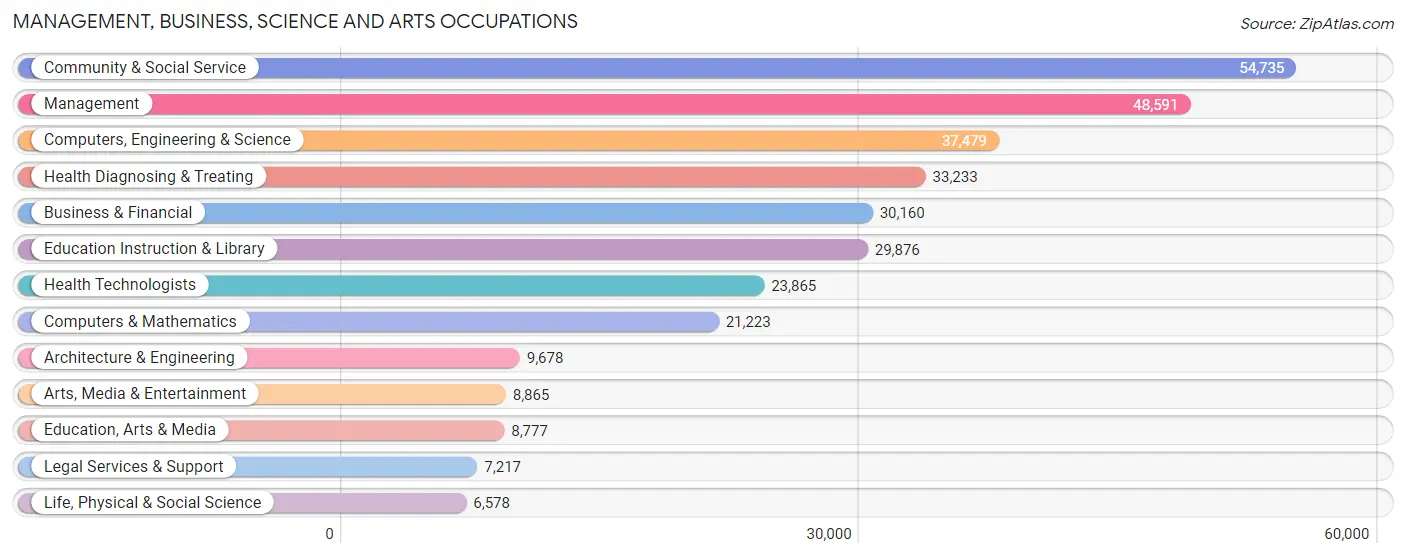
Management, Business, Science and Arts Occupations
The most common Management, Business, Science and Arts occupations in Baltimore County are Community & Social Service (54,735 | 12.7%), Management (48,591 | 11.3%), Computers, Engineering & Science (37,479 | 8.7%), Health Diagnosing & Treating (33,233 | 7.7%), and Business & Financial (30,160 | 7.0%).
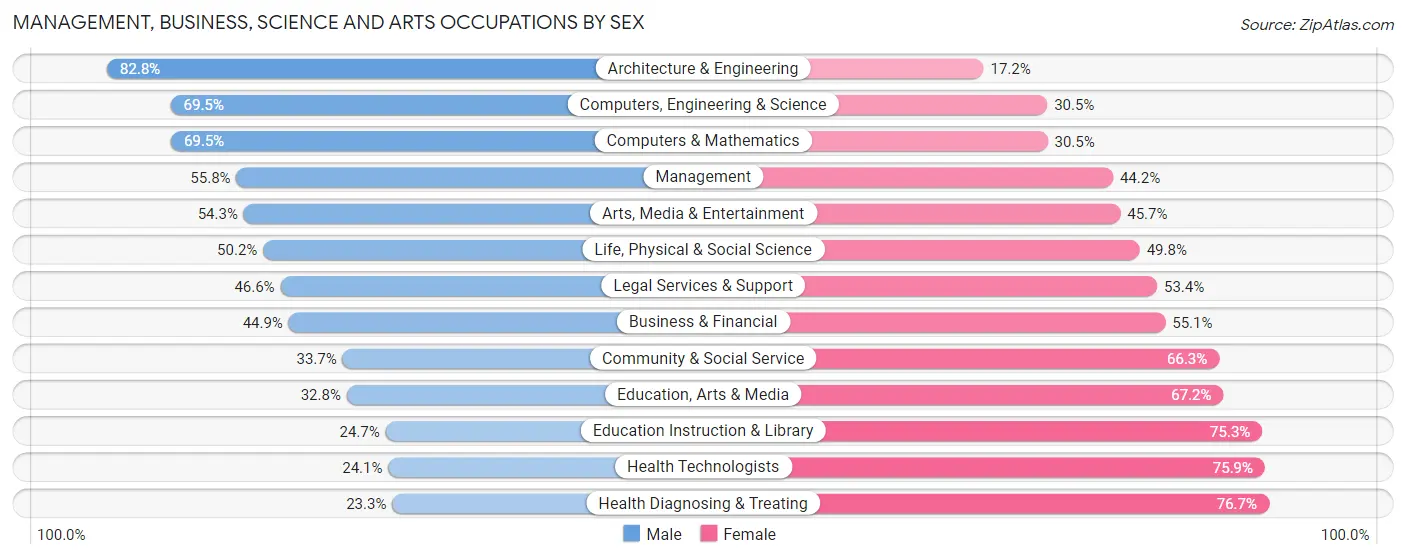
Management, Business, Science and Arts Occupations by Sex
Within the Management, Business, Science and Arts occupations in Baltimore County, the most male-oriented occupations are Architecture & Engineering (82.8%), Computers, Engineering & Science (69.5%), and Computers & Mathematics (69.5%), while the most female-oriented occupations are Health Diagnosing & Treating (76.7%), Health Technologists (75.9%), and Education Instruction & Library (75.3%).
| Occupation | Male | Female |
| Management | 27,120 (55.8%) | 21,471 (44.2%) |
| Business & Financial | 13,546 (44.9%) | 16,614 (55.1%) |
| Computers, Engineering & Science | 26,062 (69.5%) | 11,417 (30.5%) |
| Computers & Mathematics | 14,742 (69.5%) | 6,481 (30.5%) |
| Architecture & Engineering | 8,015 (82.8%) | 1,663 (17.2%) |
| Life, Physical & Social Science | 3,305 (50.2%) | 3,273 (49.8%) |
| Community & Social Service | 18,437 (33.7%) | 36,298 (66.3%) |
| Education, Arts & Media | 2,879 (32.8%) | 5,898 (67.2%) |
| Legal Services & Support | 3,365 (46.6%) | 3,852 (53.4%) |
| Education Instruction & Library | 7,380 (24.7%) | 22,496 (75.3%) |
| Arts, Media & Entertainment | 4,813 (54.3%) | 4,052 (45.7%) |
| Health Diagnosing & Treating | 7,747 (23.3%) | 25,486 (76.7%) |
| Health Technologists | 5,762 (24.1%) | 18,103 (75.9%) |
| Total (Category) | 92,912 (45.5%) | 111,286 (54.5%) |
| Total (Overall) | 214,396 (49.9%) | 215,234 (50.1%) |
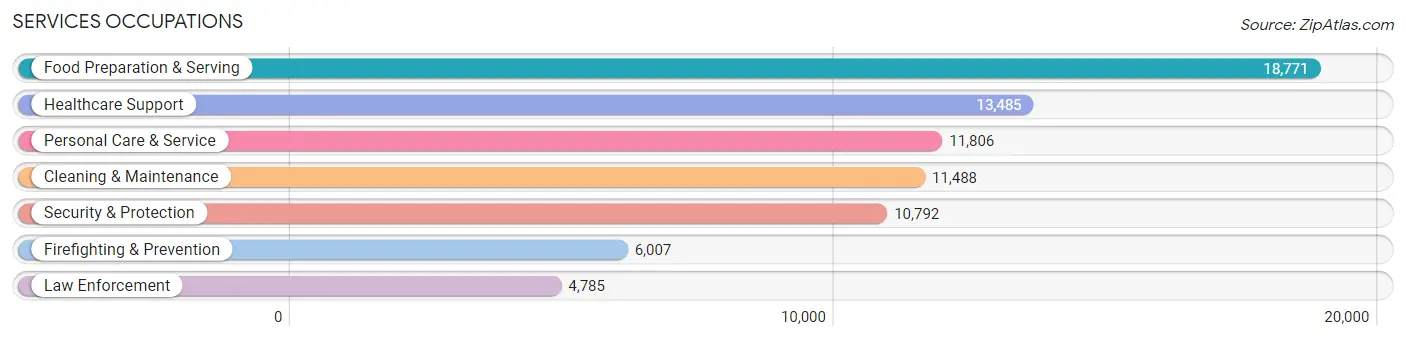
Services Occupations
The most common Services occupations in Baltimore County are Food Preparation & Serving (18,771 | 4.4%), Healthcare Support (13,485 | 3.1%), Personal Care & Service (11,806 | 2.8%), Cleaning & Maintenance (11,488 | 2.7%), and Security & Protection (10,792 | 2.5%).
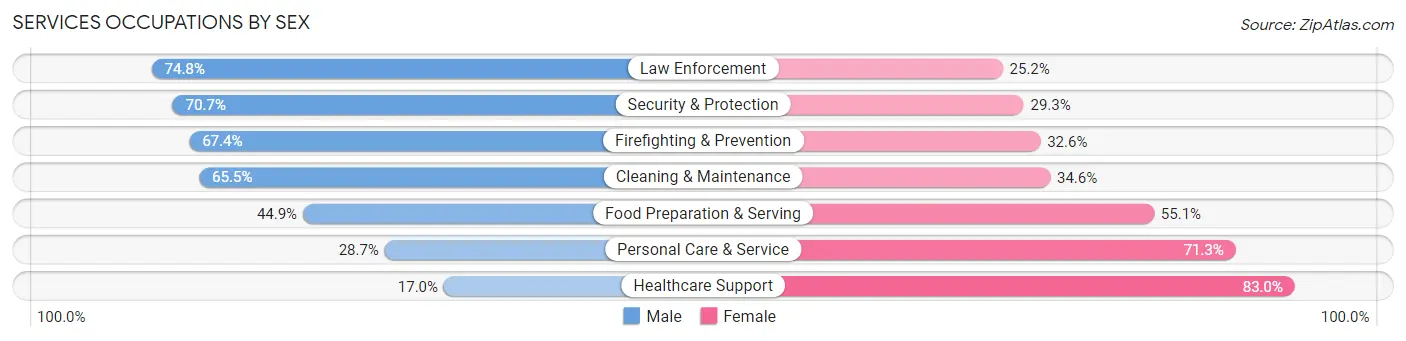
Services Occupations by Sex
Within the Services occupations in Baltimore County, the most male-oriented occupations are Law Enforcement (74.8%), Security & Protection (70.7%), and Firefighting & Prevention (67.4%), while the most female-oriented occupations are Healthcare Support (83.0%), Personal Care & Service (71.3%), and Food Preparation & Serving (55.1%).
| Occupation | Male | Female |
| Healthcare Support | 2,290 (17.0%) | 11,195 (83.0%) |
| Security & Protection | 7,629 (70.7%) | 3,163 (29.3%) |
| Firefighting & Prevention | 4,048 (67.4%) | 1,959 (32.6%) |
| Law Enforcement | 3,581 (74.8%) | 1,204 (25.2%) |
| Food Preparation & Serving | 8,425 (44.9%) | 10,346 (55.1%) |
| Cleaning & Maintenance | 7,519 (65.4%) | 3,969 (34.5%) |
| Personal Care & Service | 3,387 (28.7%) | 8,419 (71.3%) |
| Total (Category) | 29,250 (44.1%) | 37,092 (55.9%) |
| Total (Overall) | 214,396 (49.9%) | 215,234 (50.1%) |
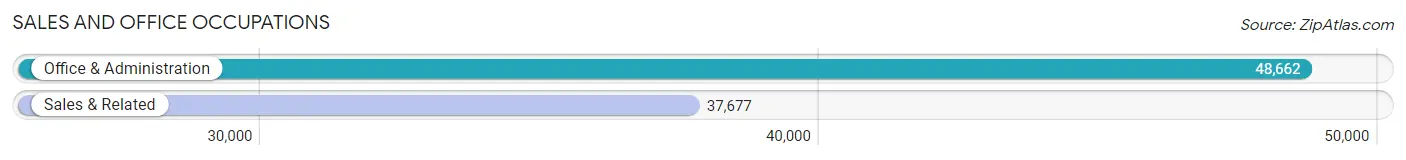
Sales and Office Occupations
The most common Sales and Office occupations in Baltimore County are Office & Administration (48,662 | 11.3%), and Sales & Related (37,677 | 8.8%).
Sales and Office Occupations by Sex
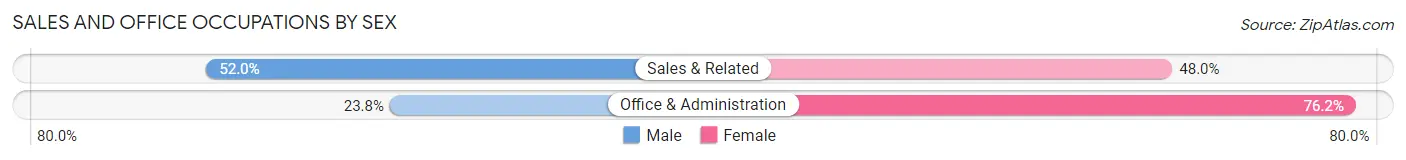
| Occupation | Male | Female |
| Sales & Related | 19,604 (52.0%) | 18,073 (48.0%) |
| Office & Administration | 11,590 (23.8%) | 37,072 (76.2%) |
| Total (Category) | 31,194 (36.1%) | 55,145 (63.9%) |
| Total (Overall) | 214,396 (49.9%) | 215,234 (50.1%) |
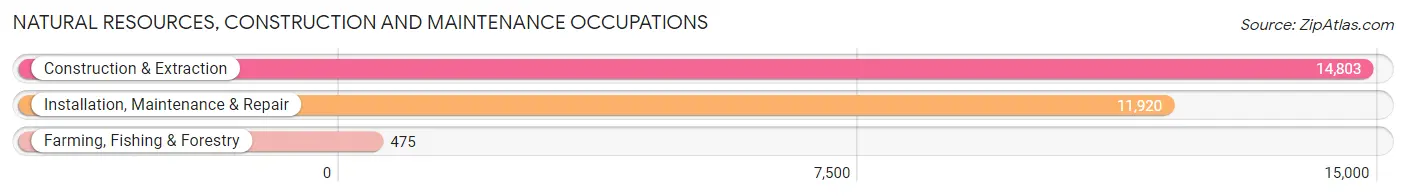
Natural Resources, Construction and Maintenance Occupations
The most common Natural Resources, Construction and Maintenance occupations in Baltimore County are Construction & Extraction (14,803 | 3.5%), Installation, Maintenance & Repair (11,920 | 2.8%), and Farming, Fishing & Forestry (475 | 0.1%).
Natural Resources, Construction and Maintenance Occupations by Sex
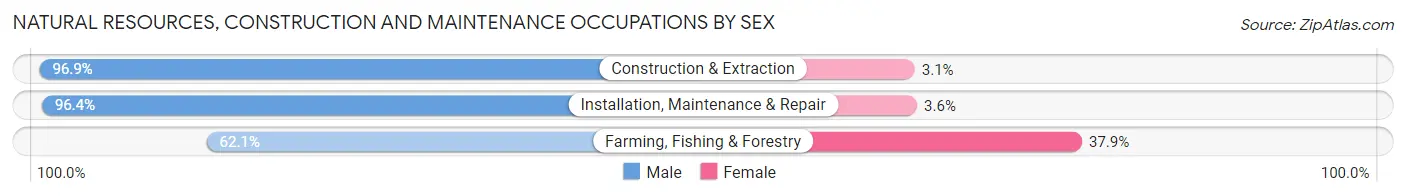
| Occupation | Male | Female |
| Farming, Fishing & Forestry | 295 (62.1%) | 180 (37.9%) |
| Construction & Extraction | 14,344 (96.9%) | 459 (3.1%) |
| Installation, Maintenance & Repair | 11,492 (96.4%) | 428 (3.6%) |
| Total (Category) | 26,131 (96.1%) | 1,067 (3.9%) |
| Total (Overall) | 214,396 (49.9%) | 215,234 (50.1%) |
Production, Transportation and Moving Occupations
The most common Production, Transportation and Moving occupations in Baltimore County are Material Moving (16,634 | 3.9%), Transportation (16,033 | 3.7%), and Production (12,886 | 3.0%).
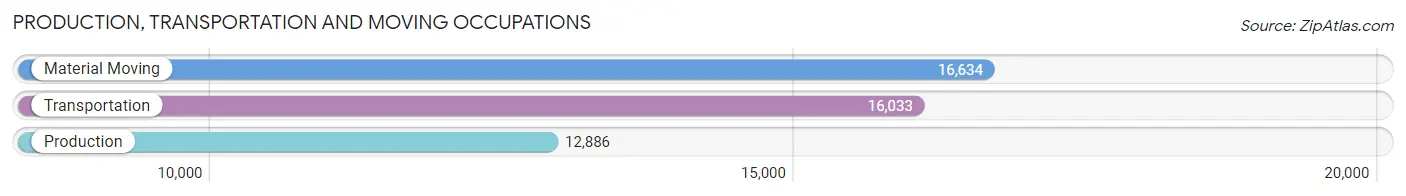
Production, Transportation and Moving Occupations by Sex
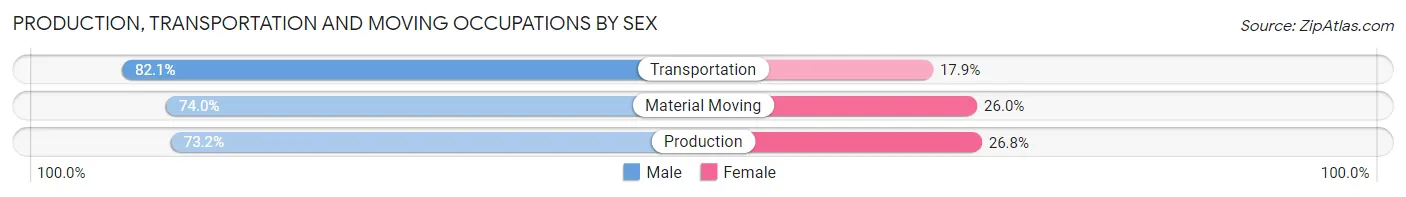
| Occupation | Male | Female |
| Production | 9,429 (73.2%) | 3,457 (26.8%) |
| Transportation | 13,167 (82.1%) | 2,866 (17.9%) |
| Material Moving | 12,313 (74.0%) | 4,321 (26.0%) |
| Total (Category) | 34,909 (76.6%) | 10,644 (23.4%) |
| Total (Overall) | 214,396 (49.9%) | 215,234 (50.1%) |
Employment Industries by Sex in Baltimore County
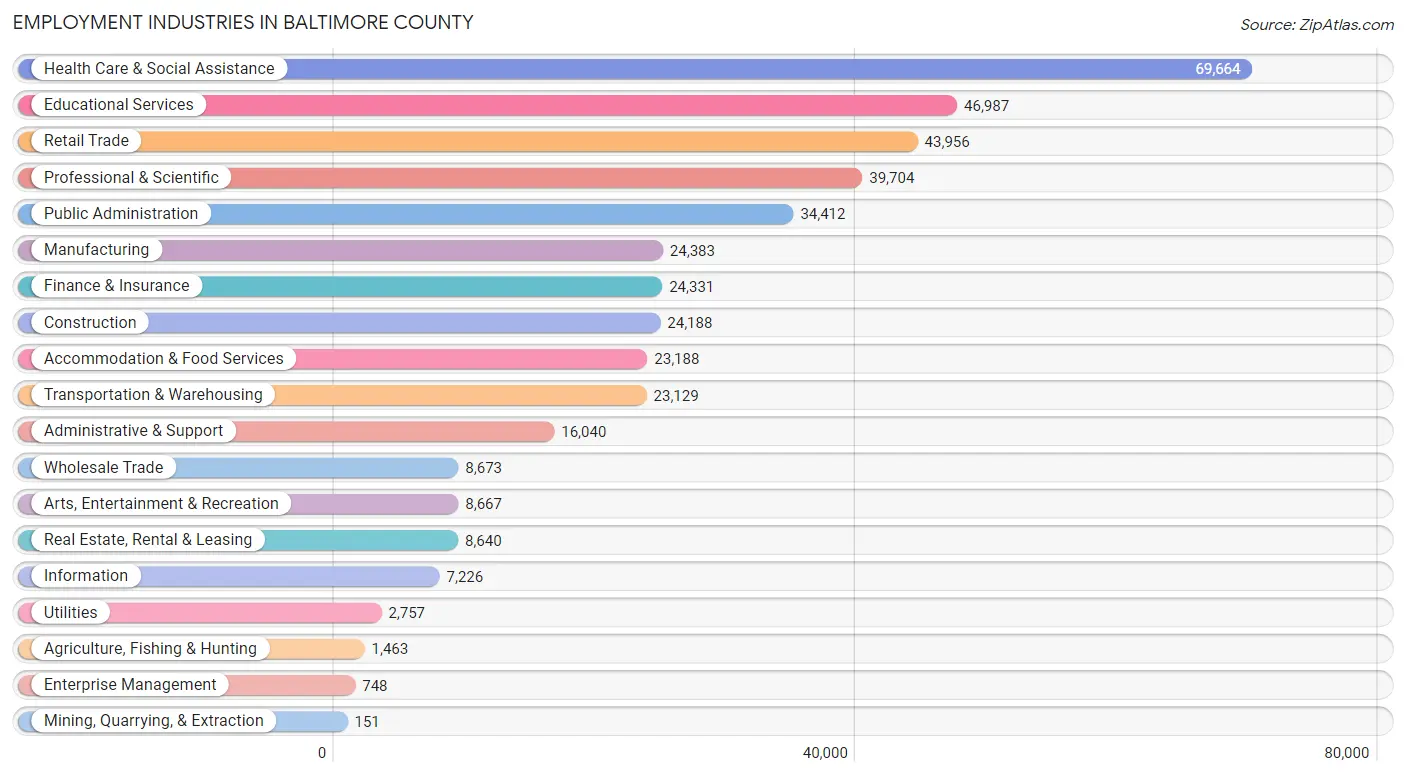
Employment Industries in Baltimore County
The major employment industries in Baltimore County include Health Care & Social Assistance (69,664 | 16.2%), Educational Services (46,987 | 10.9%), Retail Trade (43,956 | 10.2%), Professional & Scientific (39,704 | 9.2%), and Public Administration (34,412 | 8.0%).
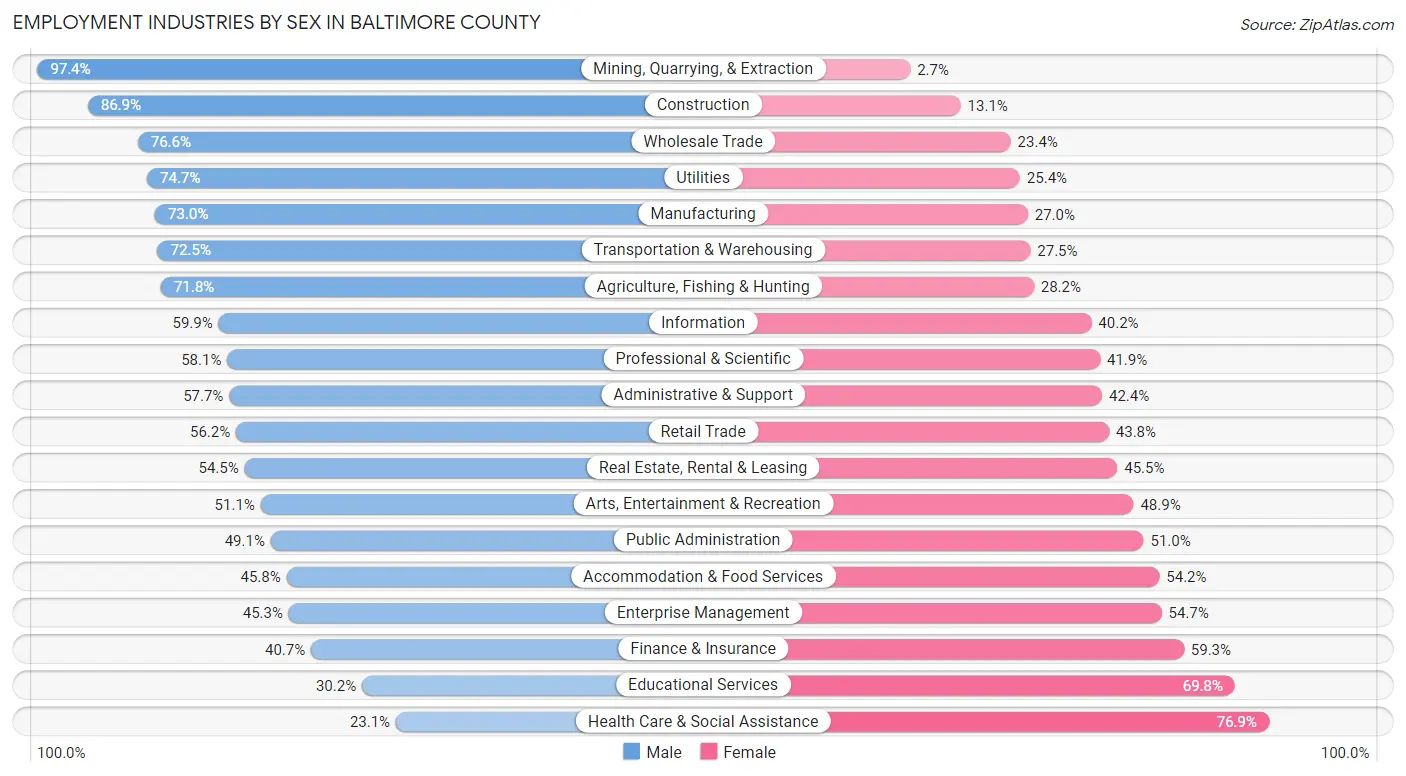
Employment Industries by Sex in Baltimore County
The Baltimore County industries that see more men than women are Mining, Quarrying, & Extraction (97.4%), Construction (86.9%), and Wholesale Trade (76.6%), whereas the industries that tend to have a higher number of women are Health Care & Social Assistance (76.9%), Educational Services (69.8%), and Finance & Insurance (59.3%).
| Industry | Male | Female |
| Agriculture, Fishing & Hunting | 1,050 (71.8%) | 413 (28.2%) |
| Mining, Quarrying, & Extraction | 147 (97.4%) | 4 (2.6%) |
| Construction | 21,023 (86.9%) | 3,165 (13.1%) |
| Manufacturing | 17,803 (73.0%) | 6,580 (27.0%) |
| Wholesale Trade | 6,640 (76.6%) | 2,033 (23.4%) |
| Retail Trade | 24,719 (56.2%) | 19,237 (43.8%) |
| Transportation & Warehousing | 16,763 (72.5%) | 6,366 (27.5%) |
| Utilities | 2,058 (74.7%) | 699 (25.4%) |
| Information | 4,325 (59.9%) | 2,901 (40.2%) |
| Finance & Insurance | 9,904 (40.7%) | 14,427 (59.3%) |
| Real Estate, Rental & Leasing | 4,707 (54.5%) | 3,933 (45.5%) |
| Professional & Scientific | 23,053 (58.1%) | 16,651 (41.9%) |
| Enterprise Management | 339 (45.3%) | 409 (54.7%) |
| Administrative & Support | 9,247 (57.7%) | 6,793 (42.3%) |
| Educational Services | 14,178 (30.2%) | 32,809 (69.8%) |
| Health Care & Social Assistance | 16,118 (23.1%) | 53,546 (76.9%) |
| Arts, Entertainment & Recreation | 4,432 (51.1%) | 4,235 (48.9%) |
| Accommodation & Food Services | 10,615 (45.8%) | 12,573 (54.2%) |
| Public Administration | 16,879 (49.0%) | 17,533 (50.9%) |
| Total | 214,396 (49.9%) | 215,234 (50.1%) |
Education in Baltimore County
School Enrollment in Baltimore County
The most common levels of schooling among the 213,805 students in Baltimore County are college / undergraduate (52,341 | 24.5%), high school (42,411 | 19.8%), and middle school (40,635 | 19.0%).
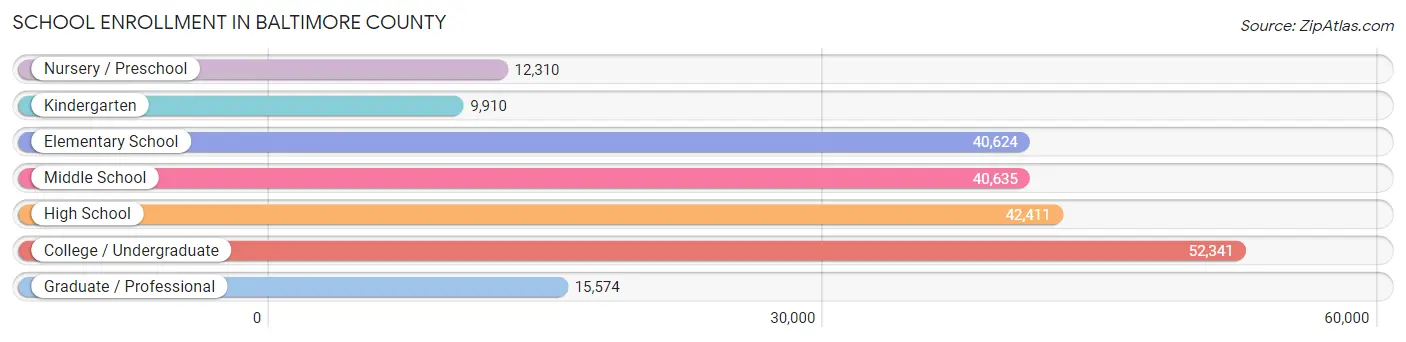
| School Level | # Students | % Students |
| Nursery / Preschool | 12,310 | 5.8% |
| Kindergarten | 9,910 | 4.6% |
| Elementary School | 40,624 | 19.0% |
| Middle School | 40,635 | 19.0% |
| High School | 42,411 | 19.8% |
| College / Undergraduate | 52,341 | 24.5% |
| Graduate / Professional | 15,574 | 7.3% |
| Total | 213,805 | 100.0% |
School Enrollment by Age by Funding Source in Baltimore County
Out of a total of 213,805 students who are enrolled in schools in Baltimore County, 48,961 (22.9%) attend a private institution, while the remaining 164,844 (77.1%) are enrolled in public schools. The age group of 3 to 4 year olds has the highest likelihood of being enrolled in private schools, with 5,236 (54.3% in the age bracket) enrolled. Conversely, the age group of 5 to 9 year old has the lowest likelihood of being enrolled in a private school, with 39,285 (81.9% in the age bracket) attending a public institution.
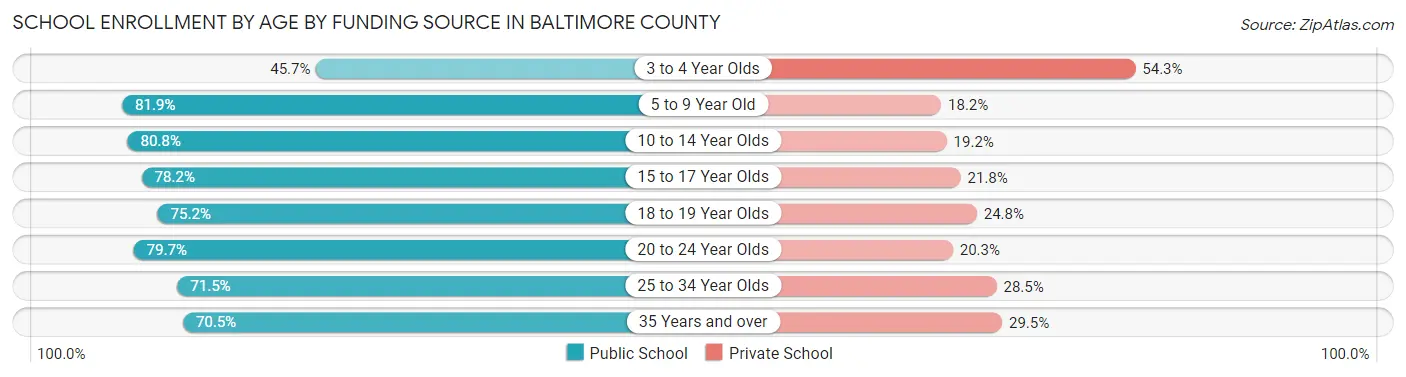
| Age Bracket | Public School | Private School |
| 3 to 4 Year Olds | 4,401 (45.7%) | 5,236 (54.3%) |
| 5 to 9 Year Old | 39,285 (81.9%) | 8,714 (18.1%) |
| 10 to 14 Year Olds | 41,090 (80.8%) | 9,752 (19.2%) |
| 15 to 17 Year Olds | 23,645 (78.2%) | 6,584 (21.8%) |
| 18 to 19 Year Olds | 14,290 (75.2%) | 4,710 (24.8%) |
| 20 to 24 Year Olds | 20,786 (79.7%) | 5,302 (20.3%) |
| 25 to 34 Year Olds | 11,231 (71.5%) | 4,470 (28.5%) |
| 35 Years and over | 10,088 (70.5%) | 4,221 (29.5%) |
| Total | 164,844 (77.1%) | 48,961 (22.9%) |
Educational Attainment by Field of Study in Baltimore County
Business (48,969 | 18.7%), education (26,565 | 10.2%), science & technology (26,083 | 10.0%), social sciences (22,900 | 8.8%), and engineering (16,924 | 6.5%) are the most common fields of study among 261,270 individuals in Baltimore County who have obtained a bachelor's degree or higher.
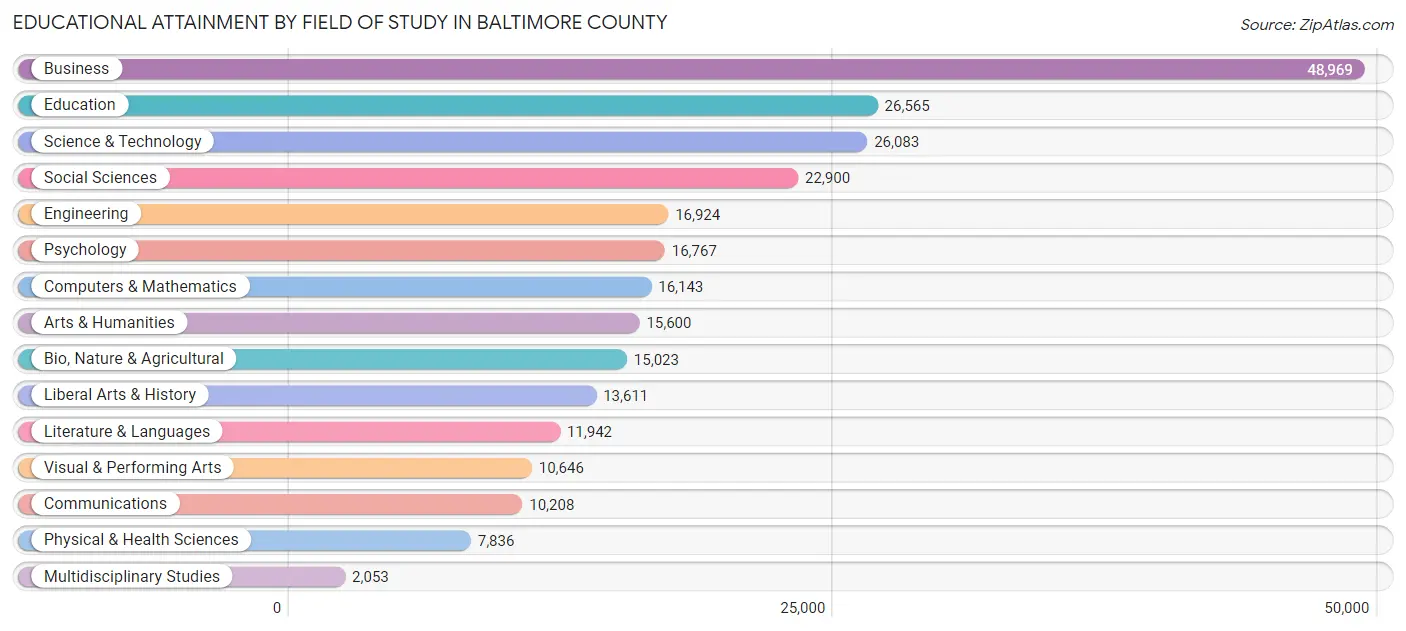
| Field of Study | # Graduates | % Graduates |
| Computers & Mathematics | 16,143 | 6.2% |
| Bio, Nature & Agricultural | 15,023 | 5.8% |
| Physical & Health Sciences | 7,836 | 3.0% |
| Psychology | 16,767 | 6.4% |
| Social Sciences | 22,900 | 8.8% |
| Engineering | 16,924 | 6.5% |
| Multidisciplinary Studies | 2,053 | 0.8% |
| Science & Technology | 26,083 | 10.0% |
| Business | 48,969 | 18.7% |
| Education | 26,565 | 10.2% |
| Literature & Languages | 11,942 | 4.6% |
| Liberal Arts & History | 13,611 | 5.2% |
| Visual & Performing Arts | 10,646 | 4.1% |
| Communications | 10,208 | 3.9% |
| Arts & Humanities | 15,600 | 6.0% |
| Total | 261,270 | 100.0% |
Transportation & Commute in Baltimore County
Vehicle Availability by Sex in Baltimore County
The most prevalent vehicle ownership categories in Baltimore County are males with 2 vehicles (91,462, accounting for 43.5%) and females with 2 vehicles (83,220, making up 44.0%).
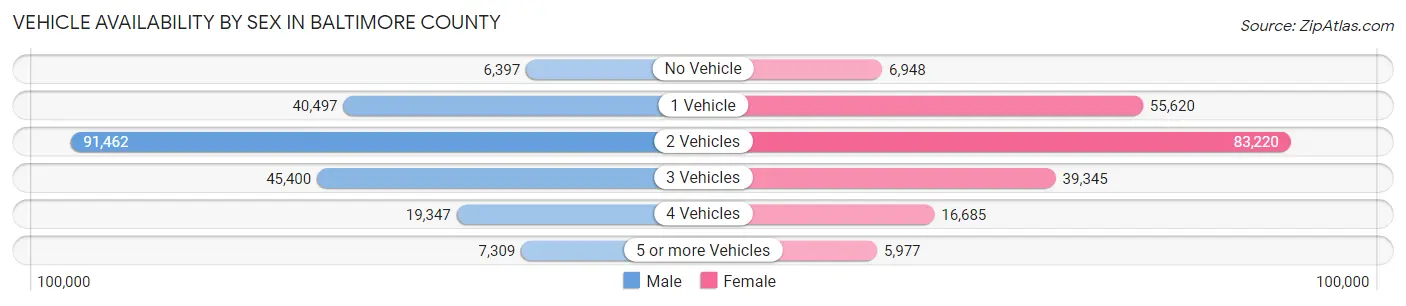
| Vehicles Available | Male | Female |
| No Vehicle | 6,397 (3.0%) | 6,948 (3.3%) |
| 1 Vehicle | 40,497 (19.3%) | 55,620 (26.8%) |
| 2 Vehicles | 91,462 (43.5%) | 83,220 (40.1%) |
| 3 Vehicles | 45,400 (21.6%) | 39,345 (18.9%) |
| 4 Vehicles | 19,347 (9.2%) | 16,685 (8.0%) |
| 5 or more Vehicles | 7,309 (3.5%) | 5,977 (2.9%) |
| Total | 210,412 (100.0%) | 207,795 (100.0%) |
Commute Time in Baltimore County
The most frequently occuring commute durations in Baltimore County are 30 to 34 minutes (64,067 commuters, 17.2%), 20 to 24 minutes (56,252 commuters, 15.1%), and 15 to 19 minutes (51,537 commuters, 13.8%).
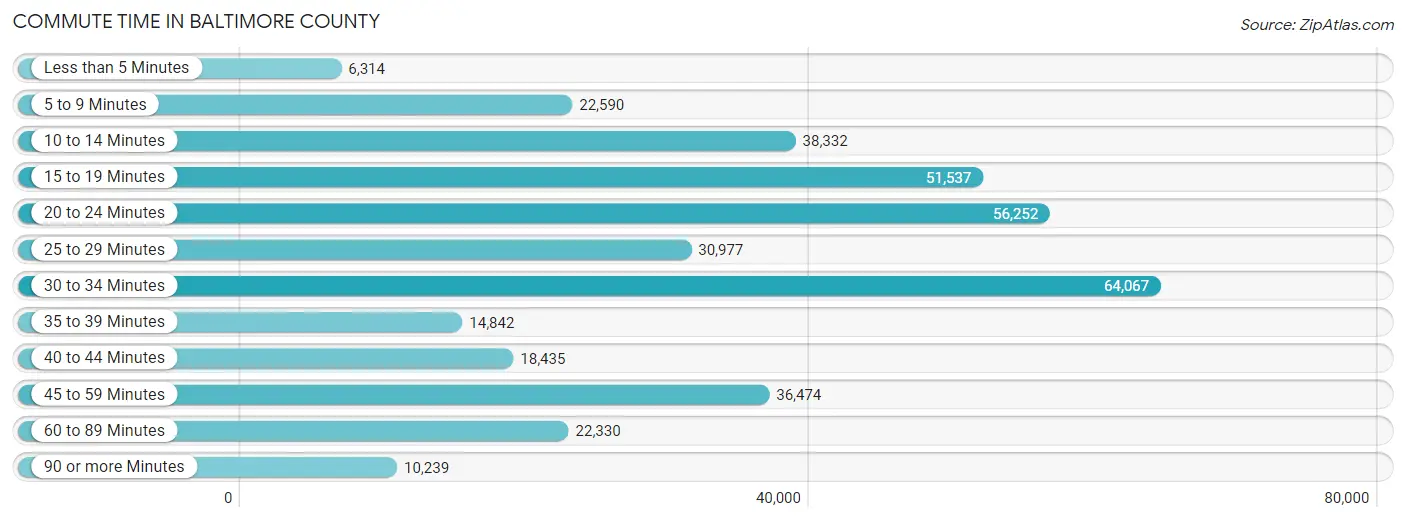
| Commute Time | # Commuters | % Commuters |
| Less than 5 Minutes | 6,314 | 1.7% |
| 5 to 9 Minutes | 22,590 | 6.1% |
| 10 to 14 Minutes | 38,332 | 10.3% |
| 15 to 19 Minutes | 51,537 | 13.8% |
| 20 to 24 Minutes | 56,252 | 15.1% |
| 25 to 29 Minutes | 30,977 | 8.3% |
| 30 to 34 Minutes | 64,067 | 17.2% |
| 35 to 39 Minutes | 14,842 | 4.0% |
| 40 to 44 Minutes | 18,435 | 5.0% |
| 45 to 59 Minutes | 36,474 | 9.8% |
| 60 to 89 Minutes | 22,330 | 6.0% |
| 90 or more Minutes | 10,239 | 2.8% |
Commute Time by Sex in Baltimore County
The most common commute times in Baltimore County are 30 to 34 minutes (33,027 commuters, 17.6%) for males and 30 to 34 minutes (31,040 commuters, 16.8%) for females.
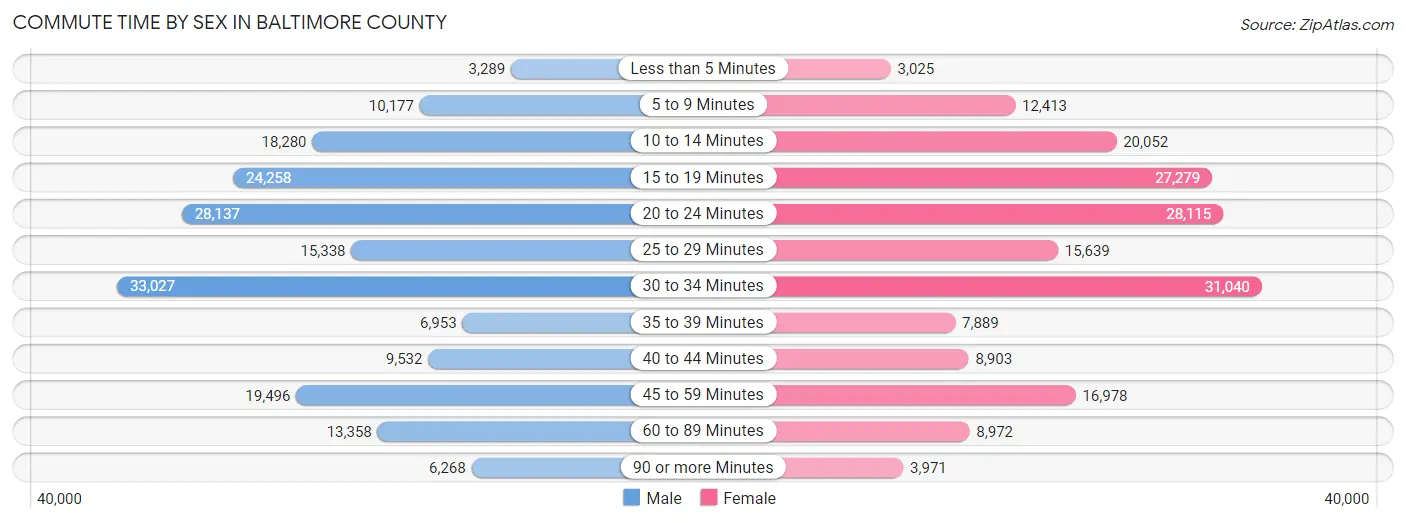
| Commute Time | Male | Female |
| Less than 5 Minutes | 3,289 (1.8%) | 3,025 (1.6%) |
| 5 to 9 Minutes | 10,177 (5.4%) | 12,413 (6.7%) |
| 10 to 14 Minutes | 18,280 (9.7%) | 20,052 (10.9%) |
| 15 to 19 Minutes | 24,258 (12.9%) | 27,279 (14.8%) |
| 20 to 24 Minutes | 28,137 (15.0%) | 28,115 (15.3%) |
| 25 to 29 Minutes | 15,338 (8.2%) | 15,639 (8.5%) |
| 30 to 34 Minutes | 33,027 (17.6%) | 31,040 (16.8%) |
| 35 to 39 Minutes | 6,953 (3.7%) | 7,889 (4.3%) |
| 40 to 44 Minutes | 9,532 (5.1%) | 8,903 (4.8%) |
| 45 to 59 Minutes | 19,496 (10.4%) | 16,978 (9.2%) |
| 60 to 89 Minutes | 13,358 (7.1%) | 8,972 (4.9%) |
| 90 or more Minutes | 6,268 (3.3%) | 3,971 (2.1%) |
Time of Departure to Work by Sex in Baltimore County
The most frequent times of departure to work in Baltimore County are 7:00 AM to 7:29 AM (23,967, 12.7%) for males and 7:00 AM to 7:29 AM (26,648, 14.5%) for females.
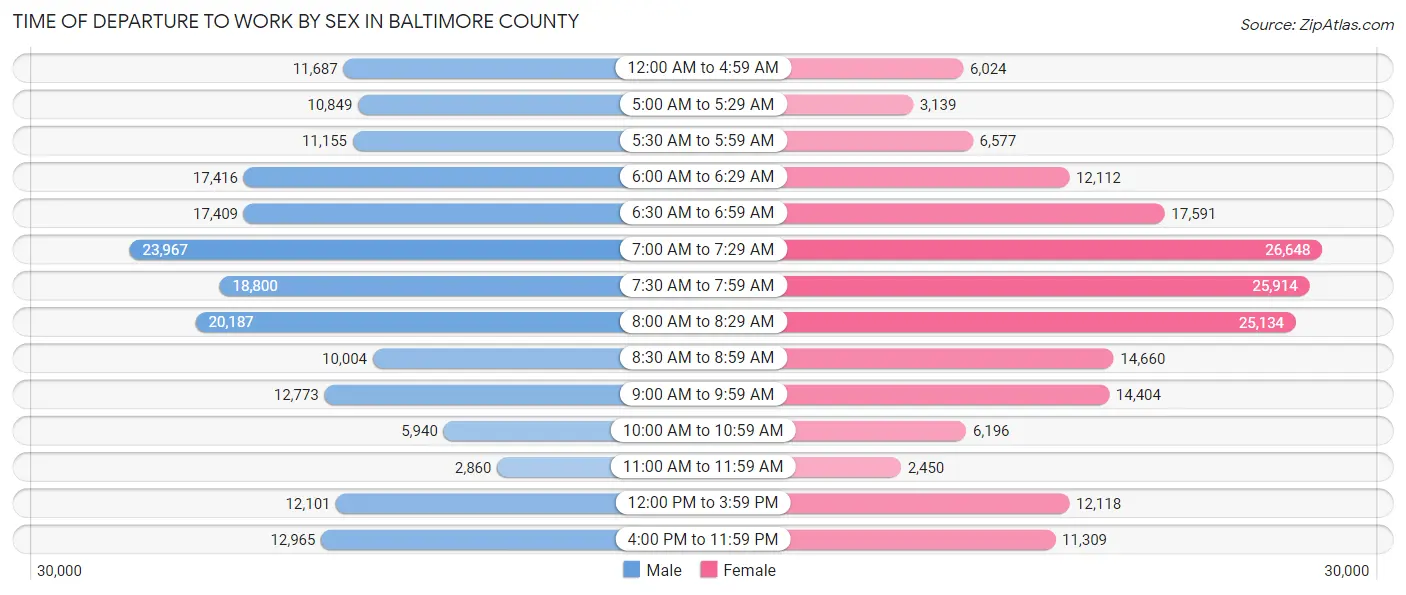
| Time of Departure | Male | Female |
| 12:00 AM to 4:59 AM | 11,687 (6.2%) | 6,024 (3.3%) |
| 5:00 AM to 5:29 AM | 10,849 (5.8%) | 3,139 (1.7%) |
| 5:30 AM to 5:59 AM | 11,155 (5.9%) | 6,577 (3.6%) |
| 6:00 AM to 6:29 AM | 17,416 (9.3%) | 12,112 (6.6%) |
| 6:30 AM to 6:59 AM | 17,409 (9.2%) | 17,591 (9.6%) |
| 7:00 AM to 7:29 AM | 23,967 (12.7%) | 26,648 (14.5%) |
| 7:30 AM to 7:59 AM | 18,800 (10.0%) | 25,914 (14.1%) |
| 8:00 AM to 8:29 AM | 20,187 (10.7%) | 25,134 (13.6%) |
| 8:30 AM to 8:59 AM | 10,004 (5.3%) | 14,660 (8.0%) |
| 9:00 AM to 9:59 AM | 12,773 (6.8%) | 14,404 (7.8%) |
| 10:00 AM to 10:59 AM | 5,940 (3.2%) | 6,196 (3.4%) |
| 11:00 AM to 11:59 AM | 2,860 (1.5%) | 2,450 (1.3%) |
| 12:00 PM to 3:59 PM | 12,101 (6.4%) | 12,118 (6.6%) |
| 4:00 PM to 11:59 PM | 12,965 (6.9%) | 11,309 (6.1%) |
| Total | 188,113 (100.0%) | 184,276 (100.0%) |
Housing Occupancy in Baltimore County
Occupancy by Ownership in Baltimore County
Of the total 328,611 dwellings in Baltimore County, owner-occupied units account for 218,610 (66.5%), while renter-occupied units make up 110,001 (33.5%).
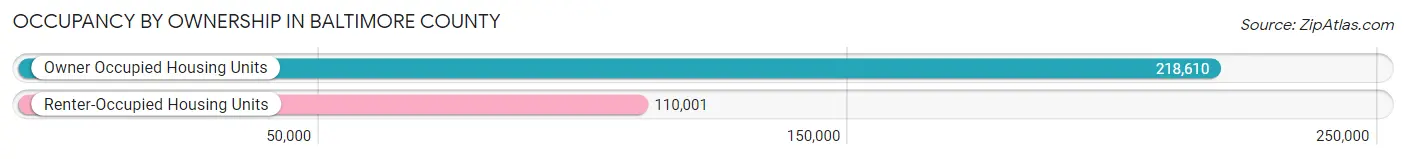
| Occupancy | # Housing Units | % Housing Units |
| Owner Occupied Housing Units | 218,610 | 66.5% |
| Renter-Occupied Housing Units | 110,001 | 33.5% |
| Total Occupied Housing Units | 328,611 | 100.0% |
Occupancy by Household Size in Baltimore County
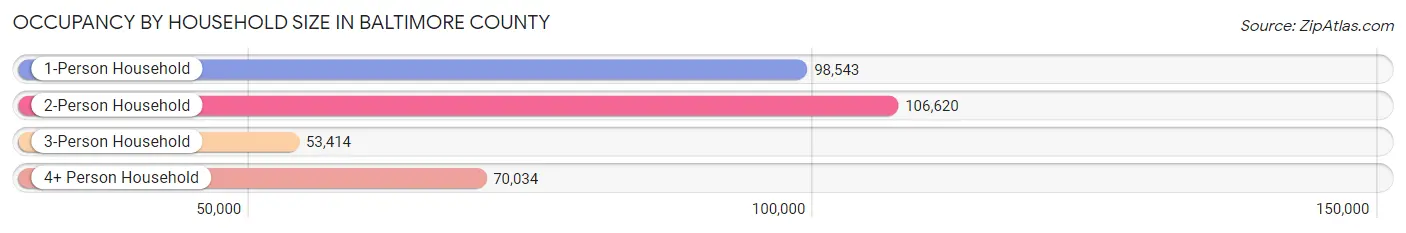
| Household Size | # Housing Units | % Housing Units |
| 1-Person Household | 98,543 | 30.0% |
| 2-Person Household | 106,620 | 32.5% |
| 3-Person Household | 53,414 | 16.3% |
| 4+ Person Household | 70,034 | 21.3% |
| Total Housing Units | 328,611 | 100.0% |
Occupancy by Ownership by Household Size in Baltimore County
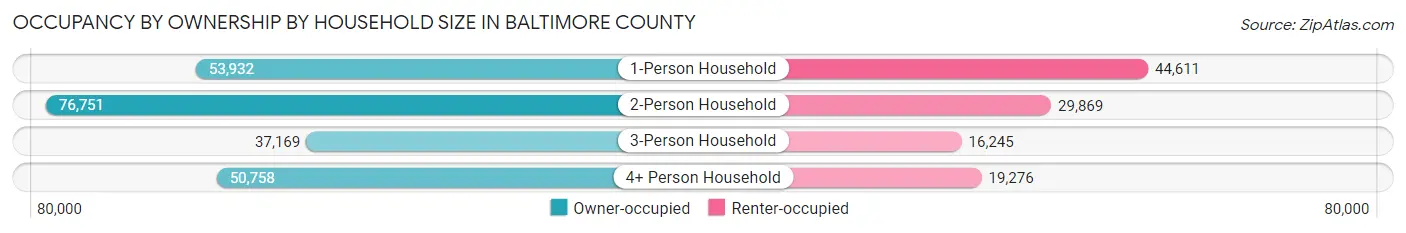
| Household Size | Owner-occupied | Renter-occupied |
| 1-Person Household | 53,932 (54.7%) | 44,611 (45.3%) |
| 2-Person Household | 76,751 (72.0%) | 29,869 (28.0%) |
| 3-Person Household | 37,169 (69.6%) | 16,245 (30.4%) |
| 4+ Person Household | 50,758 (72.5%) | 19,276 (27.5%) |
| Total Housing Units | 218,610 (66.5%) | 110,001 (33.5%) |
Occupancy by Educational Attainment in Baltimore County
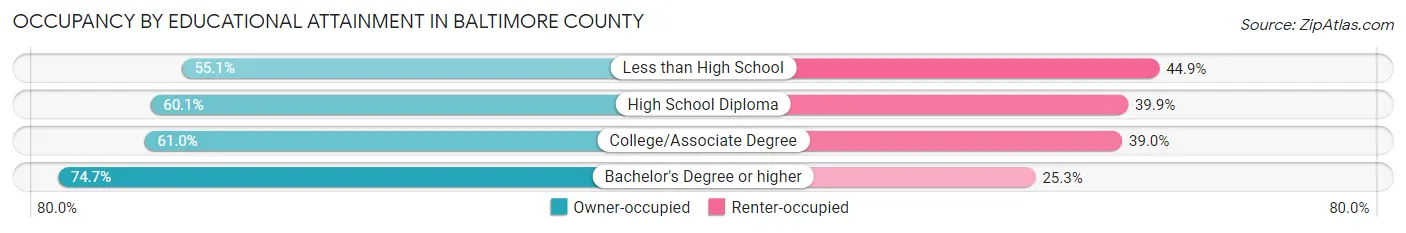
| Household Size | Owner-occupied | Renter-occupied |
| Less than High School | 11,379 (55.1%) | 9,269 (44.9%) |
| High School Diploma | 41,219 (60.1%) | 27,412 (39.9%) |
| College/Associate Degree | 56,975 (61.0%) | 36,445 (39.0%) |
| Bachelor's Degree or higher | 109,037 (74.7%) | 36,875 (25.3%) |
Occupancy by Age of Householder in Baltimore County
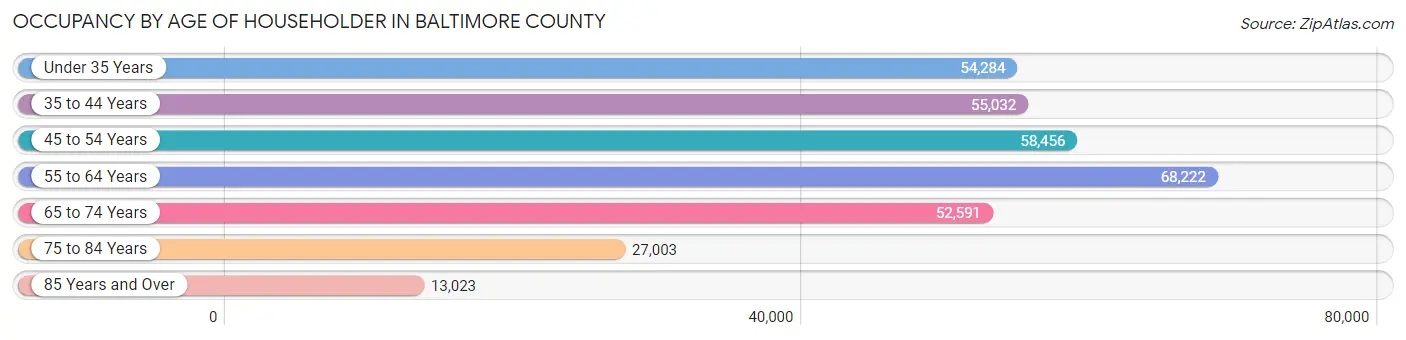
| Age Bracket | # Households | % Households |
| Under 35 Years | 54,284 | 16.5% |
| 35 to 44 Years | 55,032 | 16.8% |
| 45 to 54 Years | 58,456 | 17.8% |
| 55 to 64 Years | 68,222 | 20.8% |
| 65 to 74 Years | 52,591 | 16.0% |
| 75 to 84 Years | 27,003 | 8.2% |
| 85 Years and Over | 13,023 | 4.0% |
| Total | 328,611 | 100.0% |
Housing Finances in Baltimore County
Median Income by Occupancy in Baltimore County
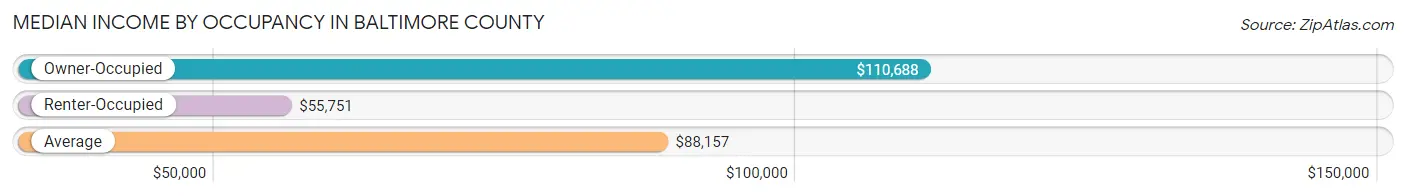
| Occupancy Type | # Households | Median Income |
| Owner-Occupied | 218,610 (66.5%) | $110,688 |
| Renter-Occupied | 110,001 (33.5%) | $55,751 |
| Average | 328,611 (100.0%) | $88,157 |
Occupancy by Householder Income Bracket in Baltimore County
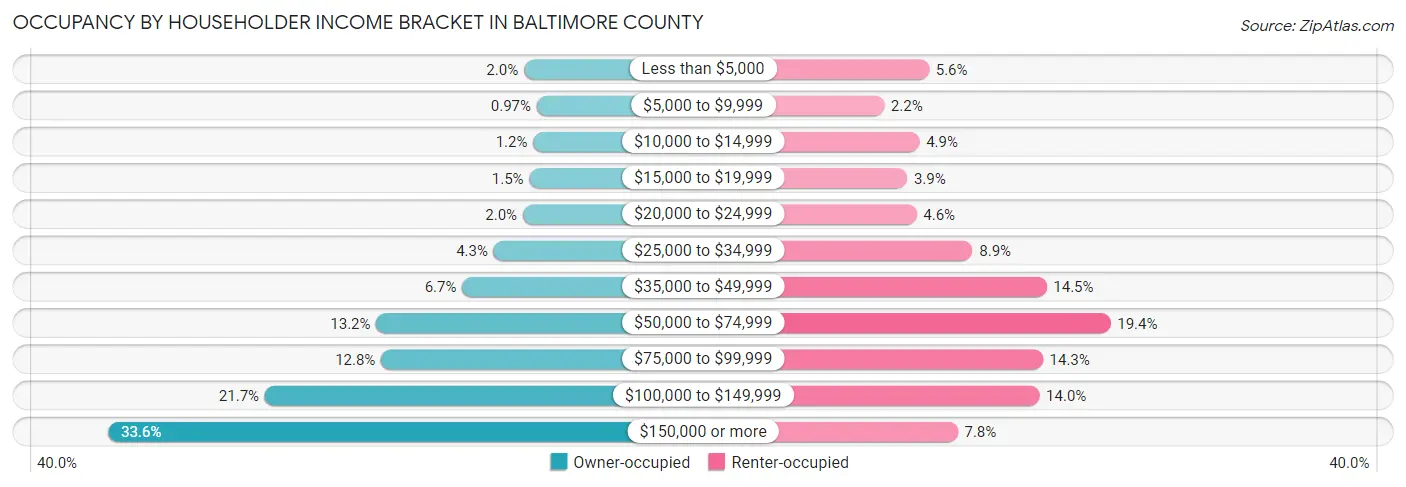
| Income Bracket | Owner-occupied | Renter-occupied |
| Less than $5,000 | 4,264 (1.9%) | 6,143 (5.6%) |
| $5,000 to $9,999 | 2,118 (1.0%) | 2,372 (2.2%) |
| $10,000 to $14,999 | 2,720 (1.2%) | 5,334 (4.9%) |
| $15,000 to $19,999 | 3,374 (1.5%) | 4,313 (3.9%) |
| $20,000 to $24,999 | 4,446 (2.0%) | 5,096 (4.6%) |
| $25,000 to $34,999 | 9,284 (4.3%) | 9,795 (8.9%) |
| $35,000 to $49,999 | 14,539 (6.7%) | 15,992 (14.5%) |
| $50,000 to $74,999 | 28,859 (13.2%) | 21,349 (19.4%) |
| $75,000 to $99,999 | 28,056 (12.8%) | 15,673 (14.2%) |
| $100,000 to $149,999 | 47,407 (21.7%) | 15,392 (14.0%) |
| $150,000 or more | 73,543 (33.6%) | 8,542 (7.8%) |
| Total | 218,610 (100.0%) | 110,001 (100.0%) |
Monthly Housing Cost Tiers in Baltimore County
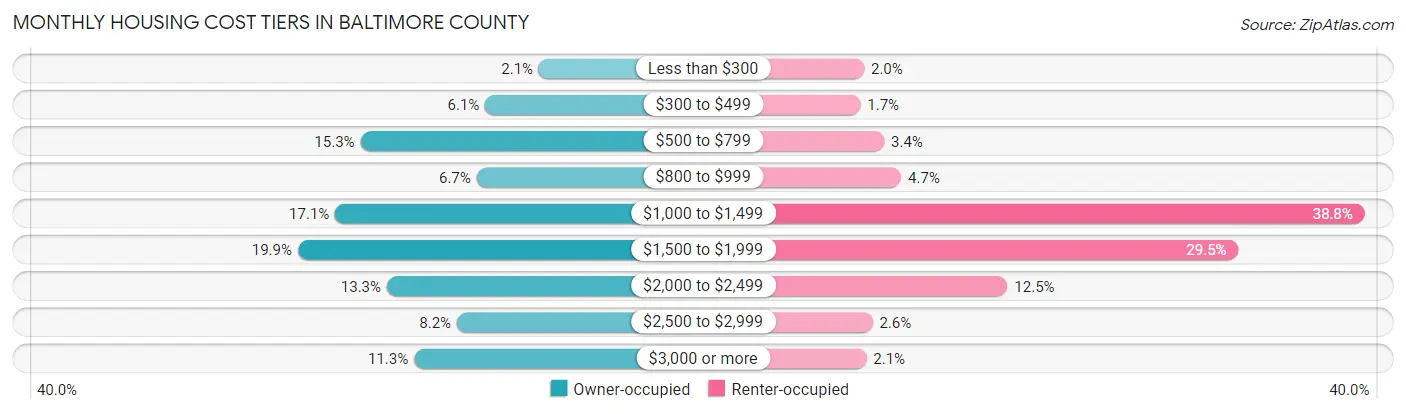
| Monthly Cost | Owner-occupied | Renter-occupied |
| Less than $300 | 4,624 (2.1%) | 2,159 (2.0%) |
| $300 to $499 | 13,301 (6.1%) | 1,862 (1.7%) |
| $500 to $799 | 33,387 (15.3%) | 3,786 (3.4%) |
| $800 to $999 | 14,676 (6.7%) | 5,159 (4.7%) |
| $1,000 to $1,499 | 37,456 (17.1%) | 42,719 (38.8%) |
| $1,500 to $1,999 | 43,467 (19.9%) | 32,481 (29.5%) |
| $2,000 to $2,499 | 29,113 (13.3%) | 13,769 (12.5%) |
| $2,500 to $2,999 | 17,846 (8.2%) | 2,837 (2.6%) |
| $3,000 or more | 24,740 (11.3%) | 2,343 (2.1%) |
| Total | 218,610 (100.0%) | 110,001 (100.0%) |
Physical Housing Characteristics in Baltimore County
Housing Structures in Baltimore County
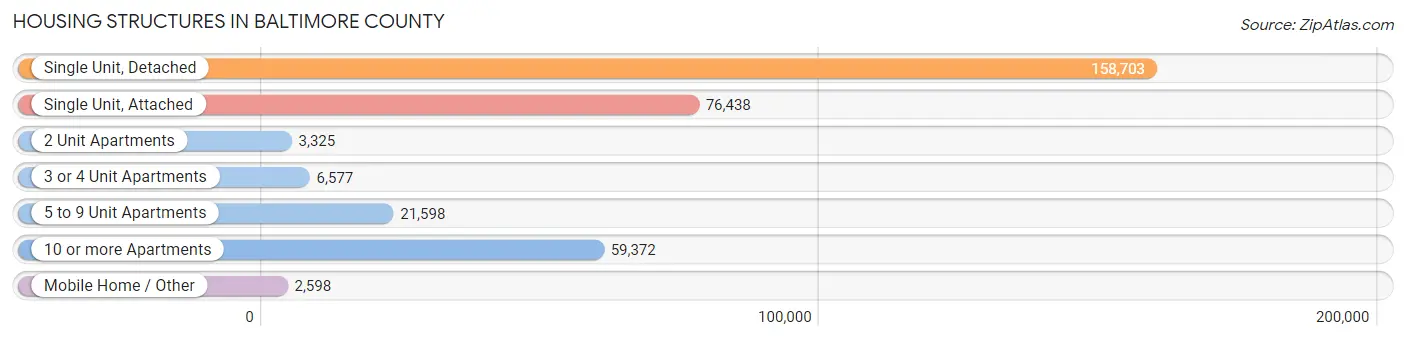
| Structure Type | # Housing Units | % Housing Units |
| Single Unit, Detached | 158,703 | 48.3% |
| Single Unit, Attached | 76,438 | 23.3% |
| 2 Unit Apartments | 3,325 | 1.0% |
| 3 or 4 Unit Apartments | 6,577 | 2.0% |
| 5 to 9 Unit Apartments | 21,598 | 6.6% |
| 10 or more Apartments | 59,372 | 18.1% |
| Mobile Home / Other | 2,598 | 0.8% |
| Total | 328,611 | 100.0% |
Housing Structures by Occupancy in Baltimore County
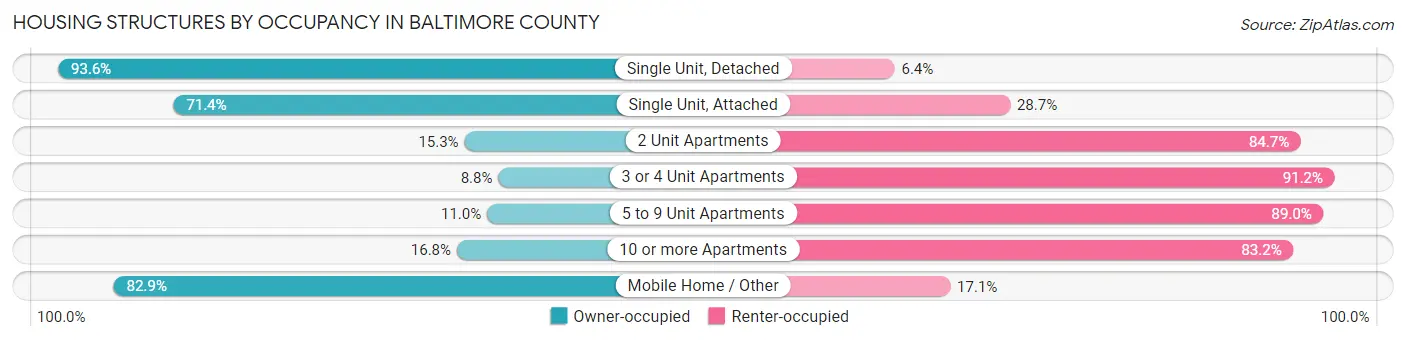
| Structure Type | Owner-occupied | Renter-occupied |
| Single Unit, Detached | 148,509 (93.6%) | 10,194 (6.4%) |
| Single Unit, Attached | 54,536 (71.4%) | 21,902 (28.6%) |
| 2 Unit Apartments | 509 (15.3%) | 2,816 (84.7%) |
| 3 or 4 Unit Apartments | 579 (8.8%) | 5,998 (91.2%) |
| 5 to 9 Unit Apartments | 2,367 (11.0%) | 19,231 (89.0%) |
| 10 or more Apartments | 9,957 (16.8%) | 49,415 (83.2%) |
| Mobile Home / Other | 2,153 (82.9%) | 445 (17.1%) |
| Total | 218,610 (66.5%) | 110,001 (33.5%) |
Housing Structures by Number of Rooms in Baltimore County
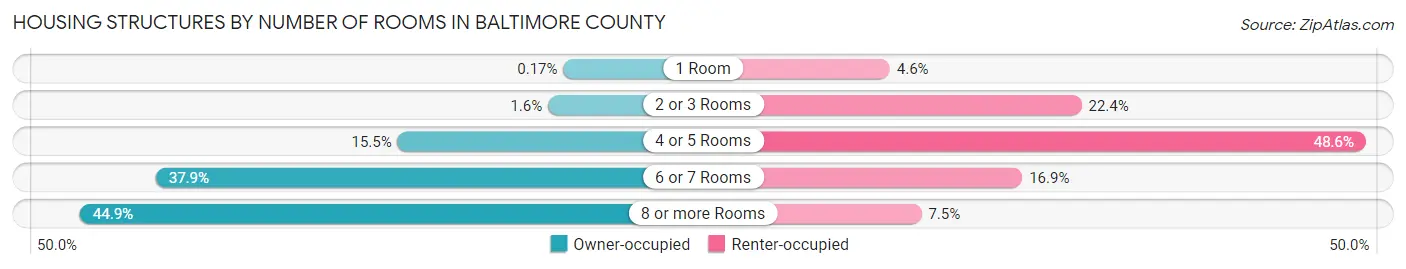
| Number of Rooms | Owner-occupied | Renter-occupied |
| 1 Room | 370 (0.2%) | 5,081 (4.6%) |
| 2 or 3 Rooms | 3,469 (1.6%) | 24,588 (22.4%) |
| 4 or 5 Rooms | 33,896 (15.5%) | 53,491 (48.6%) |
| 6 or 7 Rooms | 82,763 (37.9%) | 18,545 (16.9%) |
| 8 or more Rooms | 98,112 (44.9%) | 8,296 (7.5%) |
| Total | 218,610 (100.0%) | 110,001 (100.0%) |
Housing Structure by Heating Type in Baltimore County
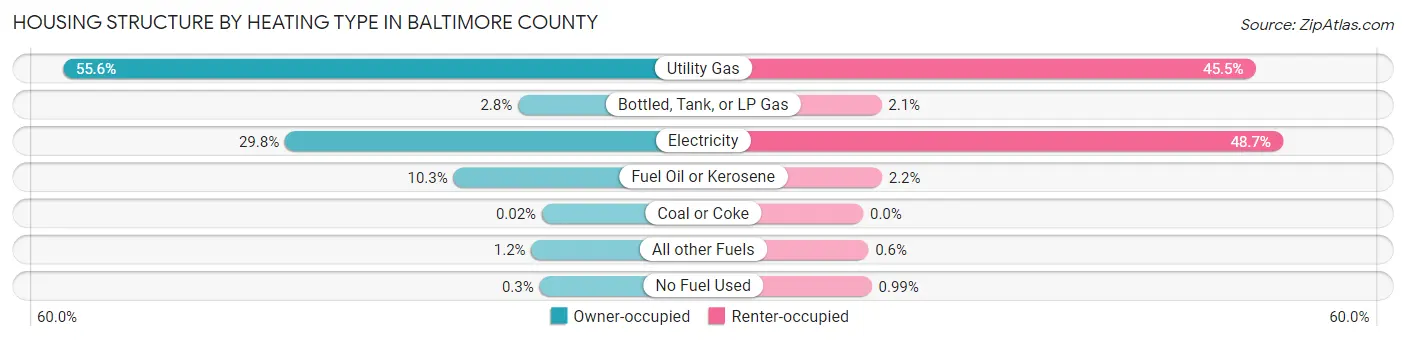
| Heating Type | Owner-occupied | Renter-occupied |
| Utility Gas | 121,479 (55.6%) | 50,014 (45.5%) |
| Bottled, Tank, or LP Gas | 6,100 (2.8%) | 2,331 (2.1%) |
| Electricity | 65,163 (29.8%) | 53,515 (48.6%) |
| Fuel Oil or Kerosene | 22,460 (10.3%) | 2,387 (2.2%) |
| Coal or Coke | 36 (0.0%) | 0 (0.0%) |
| All other Fuels | 2,721 (1.2%) | 663 (0.6%) |
| No Fuel Used | 651 (0.3%) | 1,091 (1.0%) |
| Total | 218,610 (100.0%) | 110,001 (100.0%) |
Household Vehicle Usage in Baltimore County
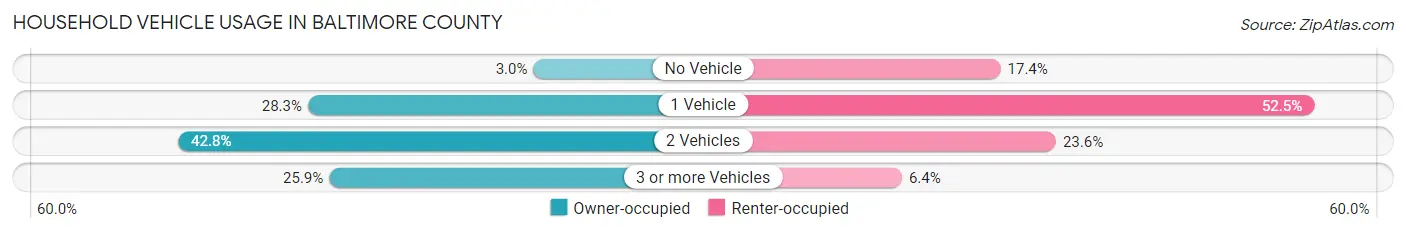
| Vehicles per Household | Owner-occupied | Renter-occupied |
| No Vehicle | 6,592 (3.0%) | 19,182 (17.4%) |
| 1 Vehicle | 61,831 (28.3%) | 57,791 (52.5%) |
| 2 Vehicles | 93,588 (42.8%) | 26,003 (23.6%) |
| 3 or more Vehicles | 56,599 (25.9%) | 7,025 (6.4%) |
| Total | 218,610 (100.0%) | 110,001 (100.0%) |
Real Estate & Mortgages in Baltimore County
Real Estate and Mortgage Overview in Baltimore County
| Characteristic | Without Mortgage | With Mortgage |
| Housing Units | 69,252 | 149,358 |
| Median Property Value | $299,700 | $315,700 |
| Median Household Income | $80,722 | $57,356 |
| Monthly Housing Costs | $670 | $24,294 |
| Real Estate Taxes | $3,569 | $4,179 |
Property Value by Mortgage Status in Baltimore County
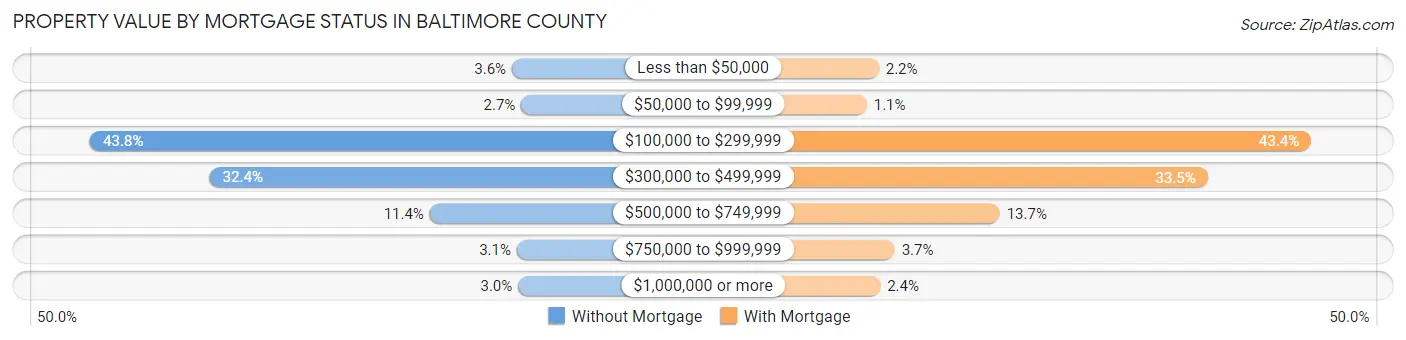
| Property Value | Without Mortgage | With Mortgage |
| Less than $50,000 | 2,489 (3.6%) | 3,308 (2.2%) |
| $50,000 to $99,999 | 1,877 (2.7%) | 1,597 (1.1%) |
| $100,000 to $299,999 | 30,315 (43.8%) | 64,806 (43.4%) |
| $300,000 to $499,999 | 22,419 (32.4%) | 50,062 (33.5%) |
| $500,000 to $749,999 | 7,910 (11.4%) | 20,514 (13.7%) |
| $750,000 to $999,999 | 2,164 (3.1%) | 5,565 (3.7%) |
| $1,000,000 or more | 2,078 (3.0%) | 3,506 (2.4%) |
| Total | 69,252 (100.0%) | 149,358 (100.0%) |
Household Income by Mortgage Status in Baltimore County
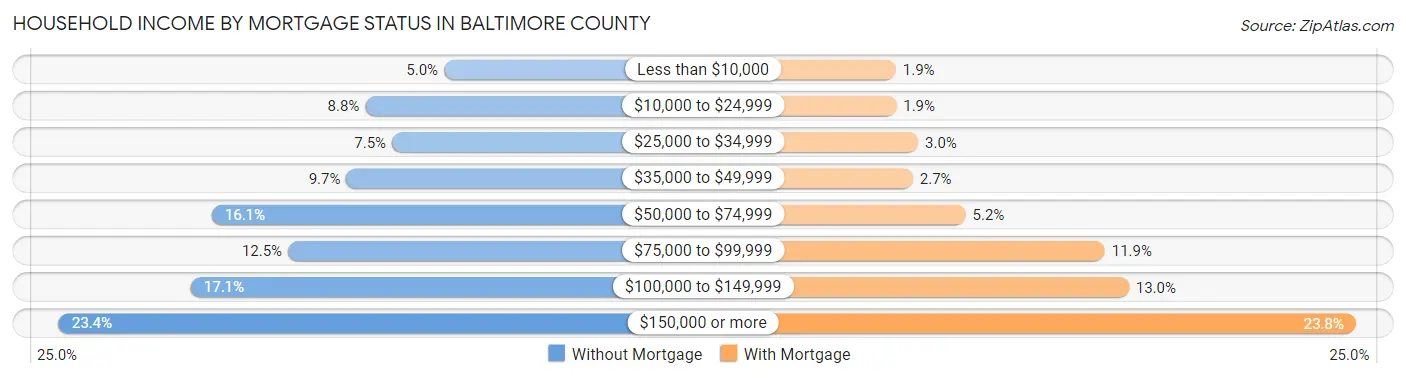
| Household Income | Without Mortgage | With Mortgage |
| Less than $10,000 | 3,485 (5.0%) | 2,871 (1.9%) |
| $10,000 to $24,999 | 6,082 (8.8%) | 2,897 (1.9%) |
| $25,000 to $34,999 | 5,201 (7.5%) | 4,458 (3.0%) |
| $35,000 to $49,999 | 6,707 (9.7%) | 4,083 (2.7%) |
| $50,000 to $74,999 | 11,137 (16.1%) | 7,832 (5.2%) |
| $75,000 to $99,999 | 8,627 (12.5%) | 17,722 (11.9%) |
| $100,000 to $149,999 | 11,826 (17.1%) | 19,429 (13.0%) |
| $150,000 or more | 16,187 (23.4%) | 35,581 (23.8%) |
| Total | 69,252 (100.0%) | 149,358 (100.0%) |
Property Value to Household Income Ratio in Baltimore County
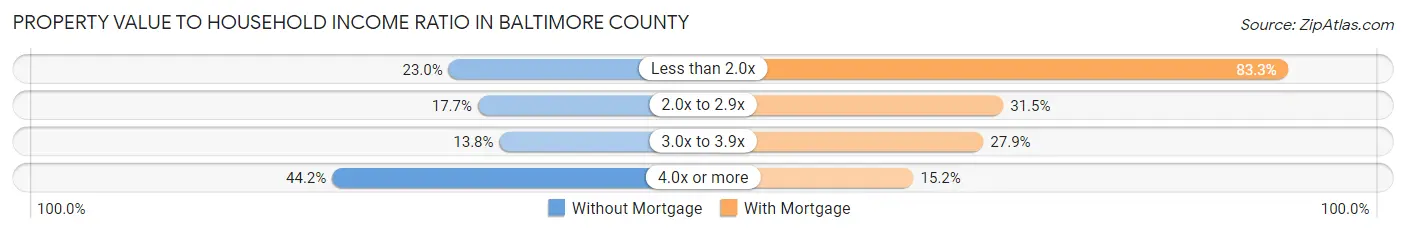
| Value-to-Income Ratio | Without Mortgage | With Mortgage |
| Less than 2.0x | 15,929 (23.0%) | 124,401 (83.3%) |
| 2.0x to 2.9x | 12,253 (17.7%) | 47,039 (31.5%) |
| 3.0x to 3.9x | 9,546 (13.8%) | 41,644 (27.9%) |
| 4.0x or more | 30,575 (44.2%) | 22,706 (15.2%) |
| Total | 69,252 (100.0%) | 149,358 (100.0%) |
Real Estate Taxes by Mortgage Status in Baltimore County
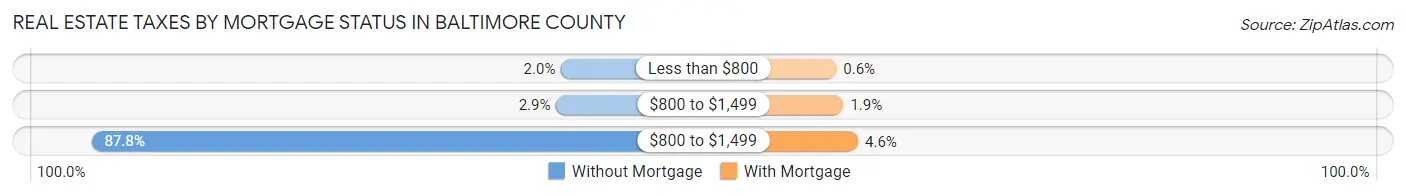
| Property Taxes | Without Mortgage | With Mortgage |
| Less than $800 | 1,374 (2.0%) | 901 (0.6%) |
| $800 to $1,499 | 1,999 (2.9%) | 2,839 (1.9%) |
| $800 to $1,499 | 60,789 (87.8%) | 6,827 (4.6%) |
| Total | 69,252 (100.0%) | 149,358 (100.0%) |
Health & Disability in Baltimore County
Health Insurance Coverage by Age in Baltimore County
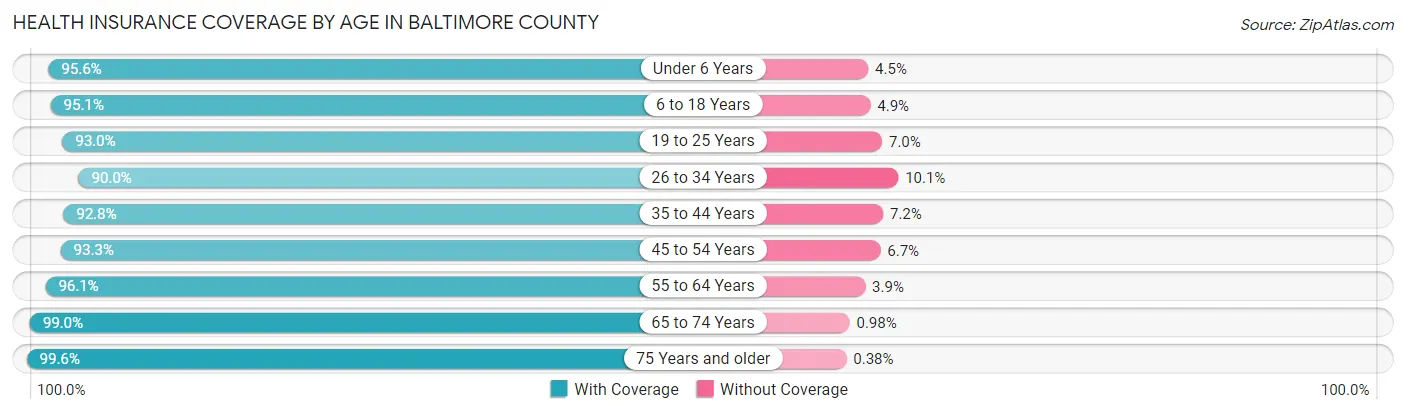
| Age Bracket | With Coverage | Without Coverage |
| Under 6 Years | 55,726 (95.6%) | 2,598 (4.4%) |
| 6 to 18 Years | 131,956 (95.1%) | 6,739 (4.9%) |
| 19 to 25 Years | 69,248 (93.0%) | 5,241 (7.0%) |
| 26 to 34 Years | 90,823 (89.9%) | 10,147 (10.1%) |
| 35 to 44 Years | 99,164 (92.8%) | 7,714 (7.2%) |
| 45 to 54 Years | 97,219 (93.3%) | 7,006 (6.7%) |
| 55 to 64 Years | 110,043 (96.1%) | 4,448 (3.9%) |
| 65 to 74 Years | 83,763 (99.0%) | 831 (1.0%) |
| 75 Years and older | 60,479 (99.6%) | 229 (0.4%) |
| Total | 798,421 (94.7%) | 44,953 (5.3%) |
Health Insurance Coverage by Citizenship Status in Baltimore County
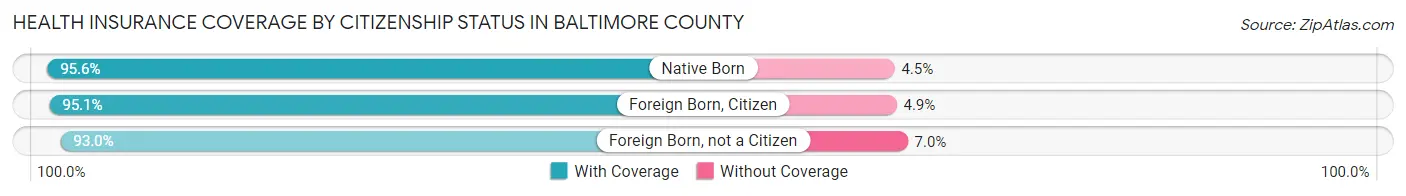
| Citizenship Status | With Coverage | Without Coverage |
| Native Born | 55,726 (95.6%) | 2,598 (4.4%) |
| Foreign Born, Citizen | 131,956 (95.1%) | 6,739 (4.9%) |
| Foreign Born, not a Citizen | 69,248 (93.0%) | 5,241 (7.0%) |
Health Insurance Coverage by Household Income in Baltimore County
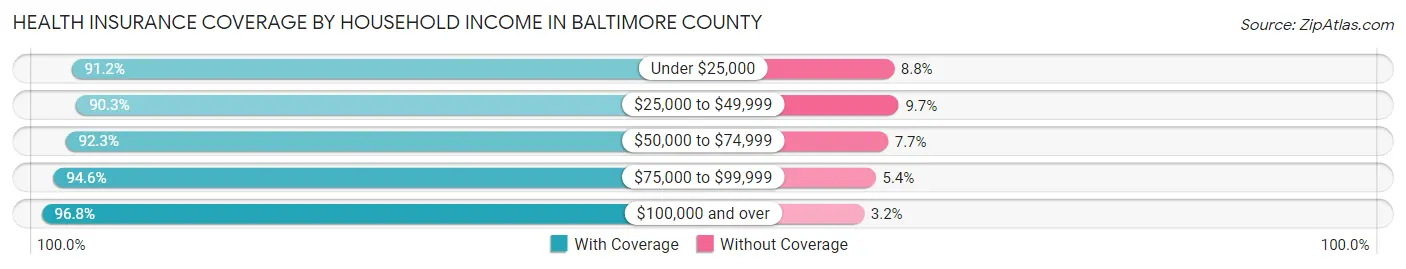
| Household Income | With Coverage | Without Coverage |
| Under $25,000 | 64,370 (91.2%) | 6,217 (8.8%) |
| $25,000 to $49,999 | 91,356 (90.3%) | 9,794 (9.7%) |
| $50,000 to $74,999 | 102,229 (92.3%) | 8,501 (7.7%) |
| $75,000 to $99,999 | 101,270 (94.6%) | 5,772 (5.4%) |
| $100,000 and over | 426,502 (96.8%) | 14,064 (3.2%) |
Public vs Private Health Insurance Coverage by Age in Baltimore County
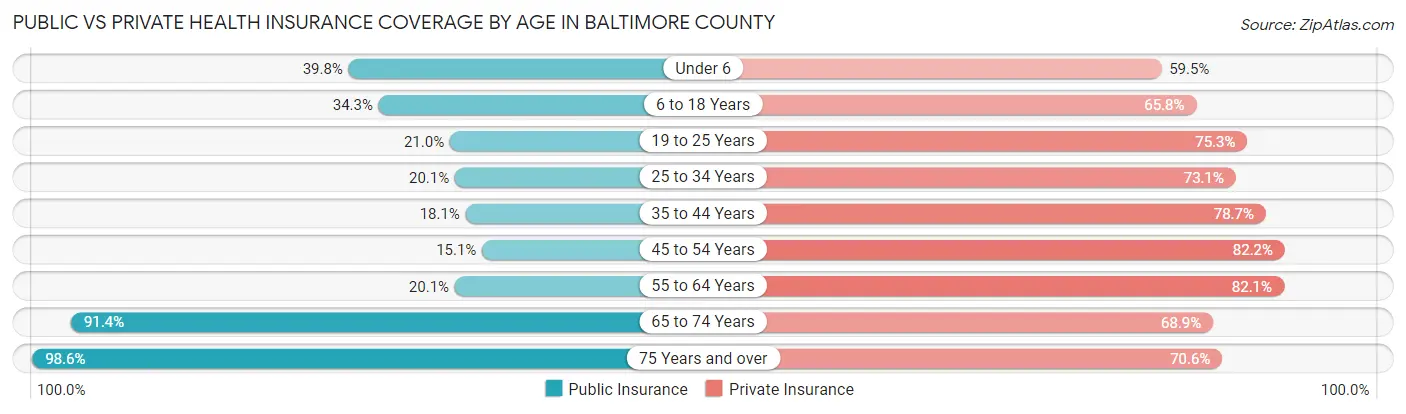
| Age Bracket | Public Insurance | Private Insurance |
| Under 6 | 23,239 (39.8%) | 34,683 (59.5%) |
| 6 to 18 Years | 47,507 (34.3%) | 91,245 (65.8%) |
| 19 to 25 Years | 15,675 (21.0%) | 56,064 (75.3%) |
| 25 to 34 Years | 20,290 (20.1%) | 73,825 (73.1%) |
| 35 to 44 Years | 19,378 (18.1%) | 84,113 (78.7%) |
| 45 to 54 Years | 15,693 (15.1%) | 85,706 (82.2%) |
| 55 to 64 Years | 23,042 (20.1%) | 93,935 (82.1%) |
| 65 to 74 Years | 77,331 (91.4%) | 58,303 (68.9%) |
| 75 Years and over | 59,847 (98.6%) | 42,862 (70.6%) |
| Total | 302,002 (35.8%) | 620,736 (73.6%) |
Disability Status by Sex by Age in Baltimore County
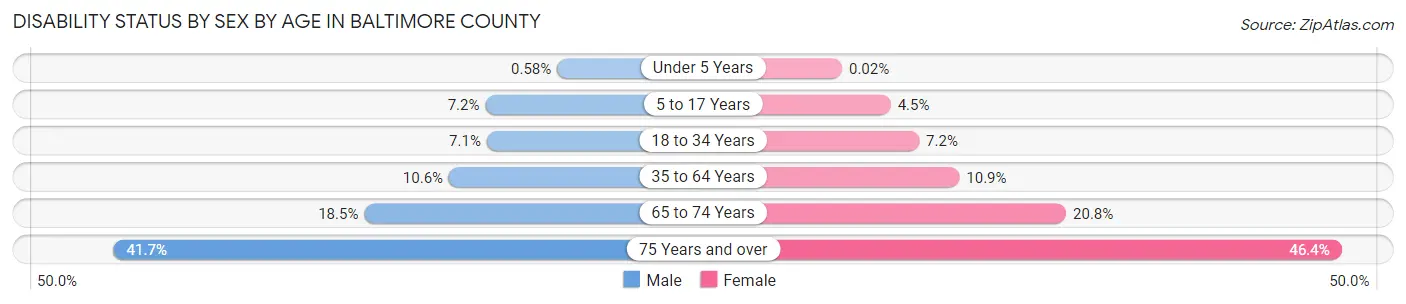
| Age Bracket | Male | Female |
| Under 5 Years | 143 (0.6%) | 4 (0.0%) |
| 5 to 17 Years | 4,971 (7.2%) | 3,002 (4.5%) |
| 18 to 34 Years | 6,521 (7.1%) | 6,974 (7.2%) |
| 35 to 64 Years | 16,433 (10.6%) | 18,634 (10.9%) |
| 65 to 74 Years | 7,065 (18.5%) | 9,653 (20.8%) |
| 75 Years and over | 9,834 (41.7%) | 17,227 (46.4%) |
Disability Class by Sex by Age in Baltimore County
Disability Class: Hearing Difficulty
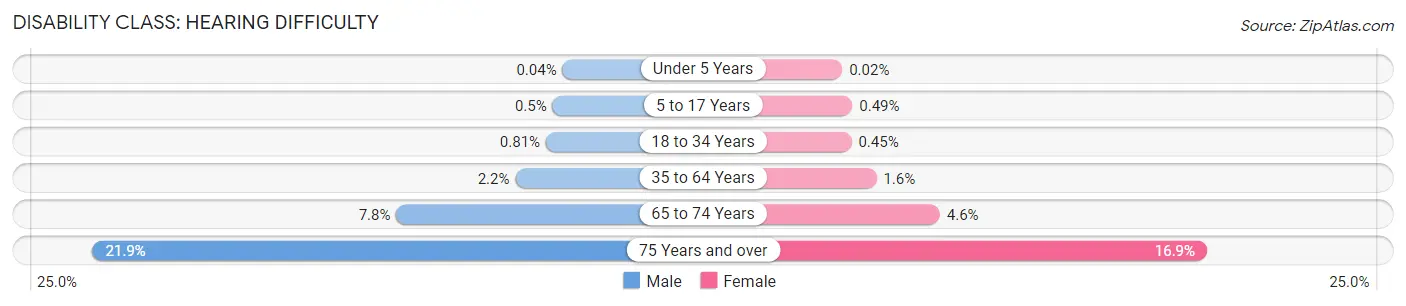
| Age Bracket | Male | Female |
| Under 5 Years | 11 (0.0%) | 4 (0.0%) |
| 5 to 17 Years | 341 (0.5%) | 325 (0.5%) |
| 18 to 34 Years | 742 (0.8%) | 436 (0.4%) |
| 35 to 64 Years | 3,456 (2.2%) | 2,754 (1.6%) |
| 65 to 74 Years | 2,964 (7.7%) | 2,108 (4.5%) |
| 75 Years and over | 5,150 (21.8%) | 6,293 (16.9%) |
Disability Class: Vision Difficulty
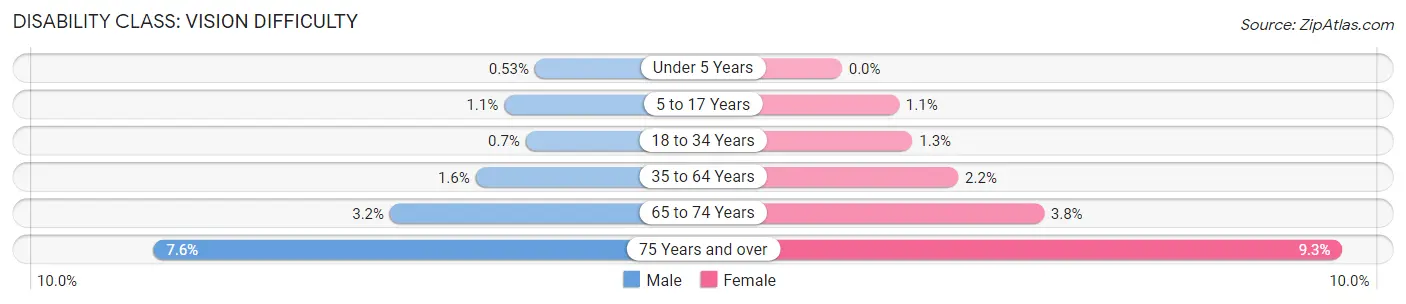
| Age Bracket | Male | Female |
| Under 5 Years | 132 (0.5%) | 0 (0.0%) |
| 5 to 17 Years | 754 (1.1%) | 703 (1.1%) |
| 18 to 34 Years | 647 (0.7%) | 1,273 (1.3%) |
| 35 to 64 Years | 2,527 (1.6%) | 3,681 (2.2%) |
| 65 to 74 Years | 1,232 (3.2%) | 1,738 (3.7%) |
| 75 Years and over | 1,794 (7.6%) | 3,451 (9.3%) |
Disability Class: Cognitive Difficulty
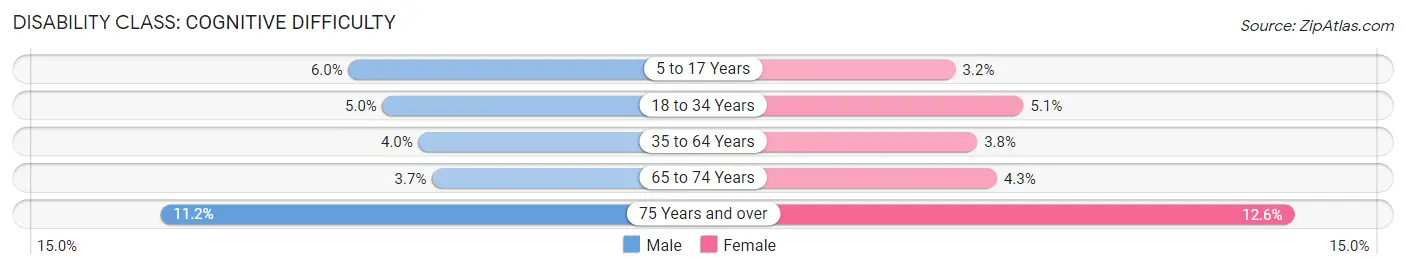
| Age Bracket | Male | Female |
| 5 to 17 Years | 4,106 (6.0%) | 2,096 (3.2%) |
| 18 to 34 Years | 4,617 (5.0%) | 4,912 (5.1%) |
| 35 to 64 Years | 6,233 (4.0%) | 6,434 (3.8%) |
| 65 to 74 Years | 1,396 (3.6%) | 2,002 (4.3%) |
| 75 Years and over | 2,645 (11.2%) | 4,680 (12.6%) |
Disability Class: Ambulatory Difficulty
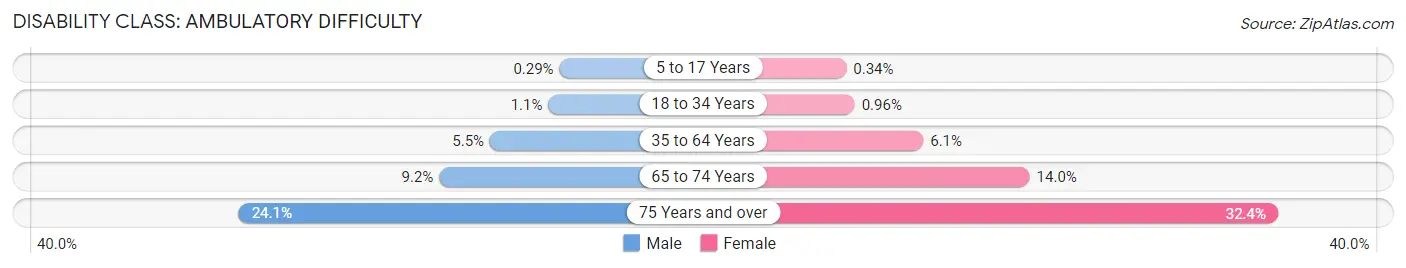
| Age Bracket | Male | Female |
| 5 to 17 Years | 201 (0.3%) | 223 (0.3%) |
| 18 to 34 Years | 1,026 (1.1%) | 932 (1.0%) |
| 35 to 64 Years | 8,438 (5.4%) | 10,331 (6.0%) |
| 65 to 74 Years | 3,525 (9.2%) | 6,468 (14.0%) |
| 75 Years and over | 5,679 (24.1%) | 12,021 (32.4%) |
Disability Class: Self-Care Difficulty
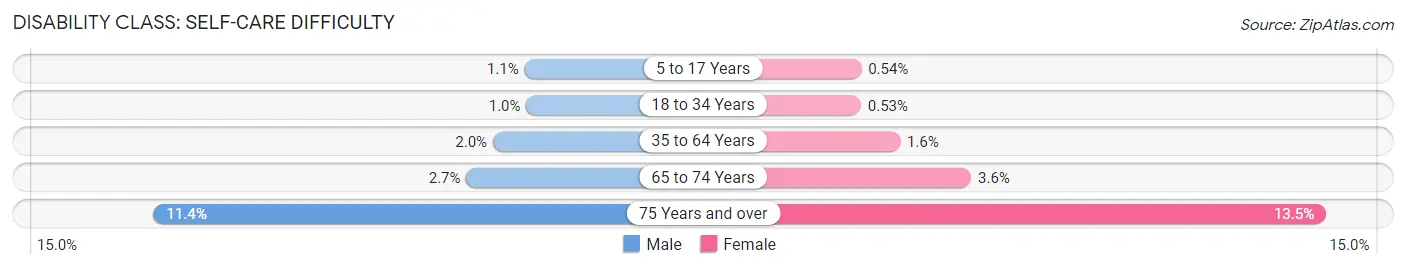
| Age Bracket | Male | Female |
| 5 to 17 Years | 743 (1.1%) | 357 (0.5%) |
| 18 to 34 Years | 949 (1.0%) | 514 (0.5%) |
| 35 to 64 Years | 3,030 (2.0%) | 2,772 (1.6%) |
| 65 to 74 Years | 1,031 (2.7%) | 1,671 (3.6%) |
| 75 Years and over | 2,690 (11.4%) | 5,005 (13.5%) |
Technology Access in Baltimore County
Computing Device Access in Baltimore County
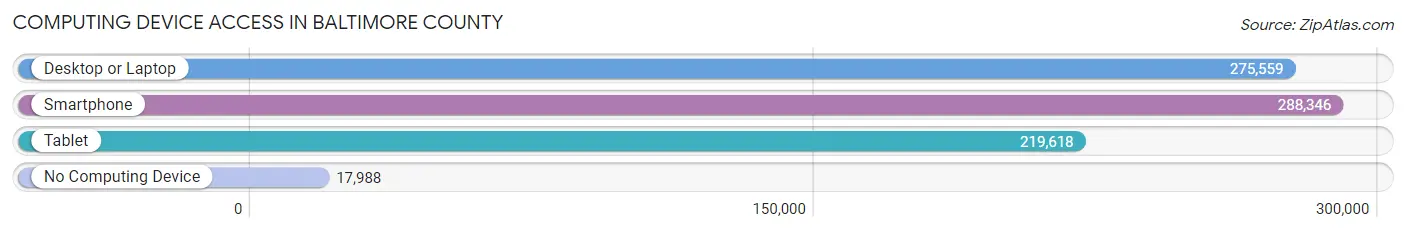
| Device Type | # Households | % Households |
| Desktop or Laptop | 275,559 | 83.9% |
| Smartphone | 288,346 | 87.7% |
| Tablet | 219,618 | 66.8% |
| No Computing Device | 17,988 | 5.5% |
| Total | 328,611 | 100.0% |
Internet Access in Baltimore County
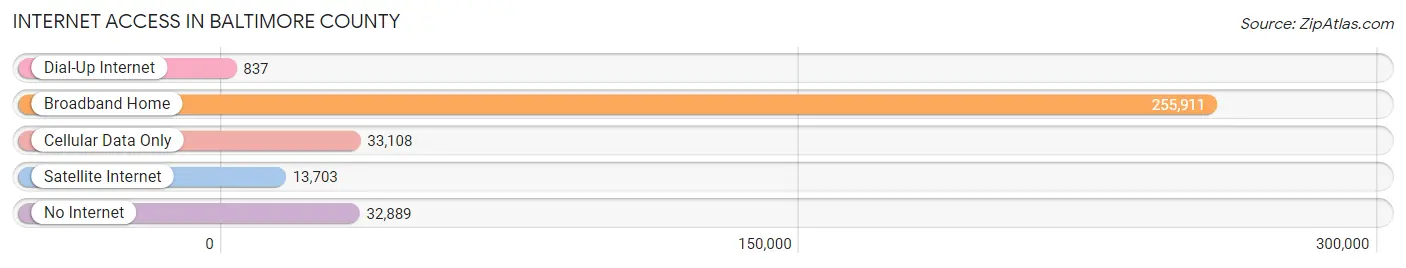
| Internet Type | # Households | % Households |
| Dial-Up Internet | 837 | 0.3% |
| Broadband Home | 255,911 | 77.9% |
| Cellular Data Only | 33,108 | 10.1% |
| Satellite Internet | 13,703 | 4.2% |
| No Internet | 32,889 | 10.0% |
| Total | 328,611 | 100.0% |
Baltimore County Summary
Baltimore County, Maryland is located in the northern part of the state and is part of the Baltimore metropolitan area. It is the third most populous county in Maryland, with a population of 831,128 as of the 2019 U.S. Census. The county is bordered by Carroll County to the north, Harford County to the northeast, Cecil County to the east, and Anne Arundel County to the south. The county seat is Towson, which is also the county’s largest municipality.
History
Baltimore County was established in 1659, when it was carved out of the larger Baltimore County. The county was named after Cecil Calvert, 2nd Baron Baltimore, who was the first Proprietary Governor of the Province of Maryland. The county was originally part of the Province of Maryland, which was established in 1632 as a proprietary colony of the Kingdom of England.
The county was divided into six districts in 1773, and the county seat was moved to Towson in 1854. The county was divided into seven districts in 1867, and the county seat was moved to Towson in 1874.
The county was the site of several battles during the American Civil War, including the Battle of North Point in 1814 and the Battle of Baltimore in 1814. The county was also the site of the Battle of Monocacy in 1864.
Geography
Baltimore County is located in the northern part of Maryland, and is bordered by Carroll County to the north, Harford County to the northeast, Cecil County to the east, and Anne Arundel County to the south. The county is located in the Piedmont region of Maryland, and is part of the Baltimore metropolitan area.
The county has a total area of 682 square miles, of which 676 square miles is land and 6 square miles is water. The county is divided into two distinct regions: the Piedmont Plateau and the Coastal Plain. The Piedmont Plateau is located in the northern part of the county, and is characterized by rolling hills and valleys. The Coastal Plain is located in the southern part of the county, and is characterized by flat terrain and marshlands.
The county is home to several rivers, including the Patapsco River, the Gunpowder River, and the Susquehanna River. The county is also home to several lakes, including Prettyboy Reservoir, Loch Raven Reservoir, and Liberty Reservoir.
Economy
The economy of Baltimore County is largely based on the service industry, with the largest employers being Johns Hopkins University, the University of Maryland Medical System, and the Social Security Administration. The county is also home to several major corporations, including Under Armour, McCormick & Company, and T. Rowe Price.
The county is home to several major shopping centers, including Towson Town Center, White Marsh Mall, and The Avenue at White Marsh. The county is also home to several major attractions, including the National Aquarium, the Maryland Zoo, and the Baltimore Museum of Art.
Demographics
As of the 2019 U.S. Census, Baltimore County had a population of 831,128, making it the third most populous county in Maryland. The population was spread out, with 24.3% under the age of 18, 10.2% from 18 to 24, 32.2% from 25 to 44, 22.2% from 45 to 64, and 11.1% who were 65 years of age or older. The median age was 36.3 years.
The racial makeup of the county was 63.2% White, 28.2% African American, 0.3% Native American, 3.7% Asian, 0.1% Pacific Islander, 1.7% from other races, and 2.0% from two or more races. Hispanic or Latino of any race were 5.2% of the population.
The median income for a household in the county was $71,919, and the median income for a family was $86,945. The per capita income for the county was $35,945. About 6.2% of families and 8.7% of the population were below the poverty line, including 11.2% of those under age 18 and 6.2% of those age 65 or over.
Common Questions
What is the Total Population of Baltimore County?
Total Population of Baltimore County is 850,737.
What is the Total Male Population of Baltimore County?
Total Male Population of Baltimore County is 405,306.
What is the Total Female Population of Baltimore County?
Total Female Population of Baltimore County is 445,431.
What is the Ratio of Males per 100 Females in Baltimore County?
There are 90.99 Males per 100 Females in Baltimore County.
What is the Ratio of Females per 100 Males in Baltimore County?
There are 109.90 Females per 100 Males in Baltimore County.
What is the Median Population Age in Baltimore County?
Median Population Age in Baltimore County is 39.5 Years.
What is the Average Family Size in Baltimore County
Average Family Size in Baltimore County is 3.2 People.
What is the Average Household Size in Baltimore County
Average Household Size in Baltimore County is 2.5 People.
What is Per Capita Income in Baltimore County?
Per Capita income in Baltimore County is $46,603.
What is the Median Family Income in Baltimore County?
Median Family Income in Baltimore County is $109,514.
What is the Median Household income in Baltimore County?
Median Household Income in Baltimore County is $88,157.
What is Income or Wage Gap in Baltimore County?
Income or Wage Gap in Baltimore County is 21.9%.
Women in Baltimore County earn 78.1 cents for every dollar earned by a man.
What is Family Income Deficit in Baltimore County?
Family Income Deficit in Baltimore County is $11,538.
Families that are below poverty line in Baltimore County earn $11,538 less on average than the poverty threshold level.
What is Inequality or Gini Index in Baltimore County?
Inequality or Gini Index in Baltimore County is 0.46.
How Large is the Labor Force in Baltimore County?
There are 454,366 People in the Labor Forcein in Baltimore County.
What is the Percentage of People in the Labor Force in Baltimore County?
66.0% of People are in the Labor Force in Baltimore County.
What is the Unemployment Rate in Baltimore County?
Unemployment Rate in Baltimore County is 5.2%.